Article

Zonal Distribution Characteristics of Microplastics in the Southern Indian Ocean and the Influence of Ocean Current

1
Key Laboratory of Marine Eco-Environmental Science and Technology, First Institute of Oceanography, Ministry of Natural Resources, Qingdao 266061, China
2
College of Safety and Environmental Engineering, Shandong University of Science and Technology, Qingdao 266590, China
3
Key Laboratory of Marine Chemistry Theory and Technology, Ministry of Education, Ocean University of China, Qingdao 266100, China
4
Key Laboratory of Marine Science and Numerical Modeling, First Institute of Oceanography, Ministry of Natural Resources, Qingdao 266061, China
*
Authors to whom correspondence should be addressed.
J. Mar. Sci. Eng. 2022, 10(2), 290; https://doi.org/10.3390/jmse10020290
Submission received: 29 November 2021 / Revised: 23 January 2022 / Accepted: 26 January 2022 / Published: 19 February 2022
(This article belongs to the Special Issue Marine Microplastic)

Abstract

:
As a new type of pollutant, microplastics widely exist in the marine environment and have attracted a lot of attention from the international community. In order to study the distribution of microplastics and the influence of ocean current, microplastic samples in seawater of the southern Indian Ocean were collected using a peristaltic pump equipped on-board and concentrated on site. Qualitative and quantitative analyses of microplastics were performed using a stereo-microscope and a micro-Fourier transform infrared spectroscope attenuated total reflection. The results showed that the average abundance of microplastics in seawater of the southern Indian Ocean was 2.3 ± 2.1 items/m3, which was consistent with that in other oceans. Polyethylene terephthalate (PET), polyethylene (PE), Rayon, polyamide (PA), and polyvinylidene chloride (PVDC) were the main polymers of microplastics in the southern Indian Ocean. The size range of all detected microplastics was 108.2–4703.0 µm. All microplastics had different colors, such as black, red, yellow, gray, blue, green, purple, and transparent. Fiber was the dominant shape of microplastics. The abundance distribution of microplastics fluctuated in the latitudinal direction. The abundance of microplastics from the present study area was higher in the coastal region of the South Africa continent and the Indian Ocean garbage patch, with an average abundance of 4.0 items/m3. The average abundance of microplastics was relatively high in the convergence area of the circulation, which revealed that the ocean current facilitated the agglomeration and transportation of microplastics.

1. Introduction

At present, increasing attention has been paid to marine microplastic pollution and its environmental effects, especially to the discovery of plastic garbage patches in the oceans. About 4.8 million to 12.7 million tons of plastic waste are transferred to the oceans each year [1]. Plastic debris is widely distributed and has been found in the deep sea, polar regions, and oceans [2,3,4,5]. Some plastics will be degraded and miniaturized by physical, chemical, and biological processes to form microplastics (particle size less than 5 mm) [6,7]. Microplastics have a relatively large surface area and can adsorb persistent organic pollutants [8] and heavy metals [9], and they are easily ingested by organisms [10]. Now, marine microplastics pollution has become a global environmental problem and has been listed in parallel with global climate change, ozone depletion, and ocean acidification. In addition, the environmental problem of marine microplastics has gradually extended from scientific research to substantial pollution control and global governance. Microplastic pollution is evolving into a complex international problem of environmental, economic, and political issues [11,12,13]. In 2017, the G20 summit adopted the G20 Marine Litter Action Plan, raising the issue of marine plastic pollution and microplastics to the level of global governance. In 2019, the G20 summit placed marine plastic garbage and microplastic governance and traditional financial, trade, and other economic issues as the focus of this summit. We can see that marine plastic garbage and microplastic issues have attracted a lot of attention of many countries.
Domestic and foreign research on microplastics mainly focuses on the separation and detection technology of microplastics, distribution characteristics, toxicity effect, ecological risk assessment system, and standards of microplastics in different marine environmental media [14,15,16]. Many reports are available on the distribution of microplastics in the marine environment. Collignon et al. [17] found significant amounts of microplastics (0–9.0 × 10⁵ items/km2) in semi-enclosed Mediterranean waters. The abundance of microplastics in the Persian Gulf’s surface water ranged from 4.38 × 10⁴ items/km2 to 1.46 × 10⁶ items/km2 [18]. Studies have investigated the distribution characteristics of microplastics in the Yellow Sea and Bohai Sea [19,20,21], Yangtze River Basin [22,23,24], east China Sea, and South China Sea [25,26,27,28]. Overall, most of the studies focus on the distribution characteristics of microplastics in continental margins, coastal waters, etc. Monitoring of microplastics in the open ocean, Antarctic, and Arctic has been carried out in recent years. Surface water around Svalbard (Norway) in the Arctic Ocean had a microplastic content of 0–1.13 items/m3, and the abundance of microplastics in the water below the surface layer was higher than that in the surface layer, at 0–11.5 items/m3 [29]. The abundance of microplastics in the surface waters of the western and central Pacific was 34,039 ± 25,101 pieces/km2, and the highest abundance of microplastics was found in the sea area adjacent to seamounts in the western Pacific [30]. At present, although some research work on microplastics in the north Pacific Ocean, the southwest Indian Ocean, and the Atlantic Ocean has been carried out, it is necessary to strengthen the research on the accumulation of microplastic monitoring data in order to study their environmental behavior. In addition, the study on the transport process of microplastics in the ocean is still in its infancy. In the future, the study on the transport and diffusion of microplastics in the marine environment needs to be strengthened, and the key processes affecting the transport of microplastics need to be identified. The effects of physical properties of microplastics, marine dynamic conditions, and sediment characteristics on the transport flux of microplastics will be investigated.
The Spanish National Research Council team found that the five garbage patches in the world’s oceans coincided with the locations of the five major circulation currents at the ocean’s surface [6]. For example, the maximum abundance and mass of plastics were 3276 items/m3 and 250 mg/m3, respectively, in the subtropical circulation area of the North Pacific [16]. Among the world’s oceans, the Indian Ocean Gyre is an important part of the global ocean circulation, which has unique dynamic characteristics and a complex and variable circulation structure [31]. The induced heat and volume transport variability have important effects on regional material balance and global climate change [32]. The Indian Ocean Gyre is mainly composed of the equatorial circulation, marginal sea circulation, and vortex. Its dynamic adjustment process driven by the Indian monsoon and the Indian Ocean Dipole (IOD) has complex multi-scale variation characteristics [33,34]. In addition, the Indian Ocean is surrounded by India, Pakistan, Iran, Arabian Peninsula, Africa, Australia, Indonesia, Malay Peninsula, and Antarctica. There are many ports around the Indian Ocean, so the unique geographical position and human activities (fishing and shipping) bring some environmental pollution to the sea area [35,36].
A large garbage patch exists in the southern Indian Ocean (62.6° E–81.4° E, 23.8° S–32.9° S), which may have a certain influence on the distribution and ecological effect of microplastics in the ocean [35]. Therefore, we traversed the southern Indian Ocean in a latitudinal direction to collected microplastics using a peristaltic pump equipped on-board. The characteristics and distribution patterns of microplastics in the southern Indian Ocean were analyzed. We also explored the effect of the Indian Ocean’s current on the agglomeration distribution of microplastics. Our findings can provide more microplastic monitoring data for a comprehensive and systematic evaluation of the environmental behavior of microplastics in the ocean.

2. Materials and Methods

2.1. Sample Collection and Pretreatment of Microplastics

The study area is mainly located in the southern Indian Ocean (Latitude: 5.84° S–34.16° S, Longitude: 25.83° E–105.46° E). Seawater was collected by using a peristaltic pump at 46 stations. Firstly, we continuously collected 500 L of seawater at each station by using the pump, and the volume of seawater was accurately recorded by a flowmeter. Then, the seawater was concentrated on-site using a 20 µm pore size sieve. The obtained concentrated seawater sample containing microplastics was filtrated onto the 0.45 µm pore size nitrocellulose membrane. The nitrocellulose membrane was sealed with aluminum foil and stored at −4 °C.

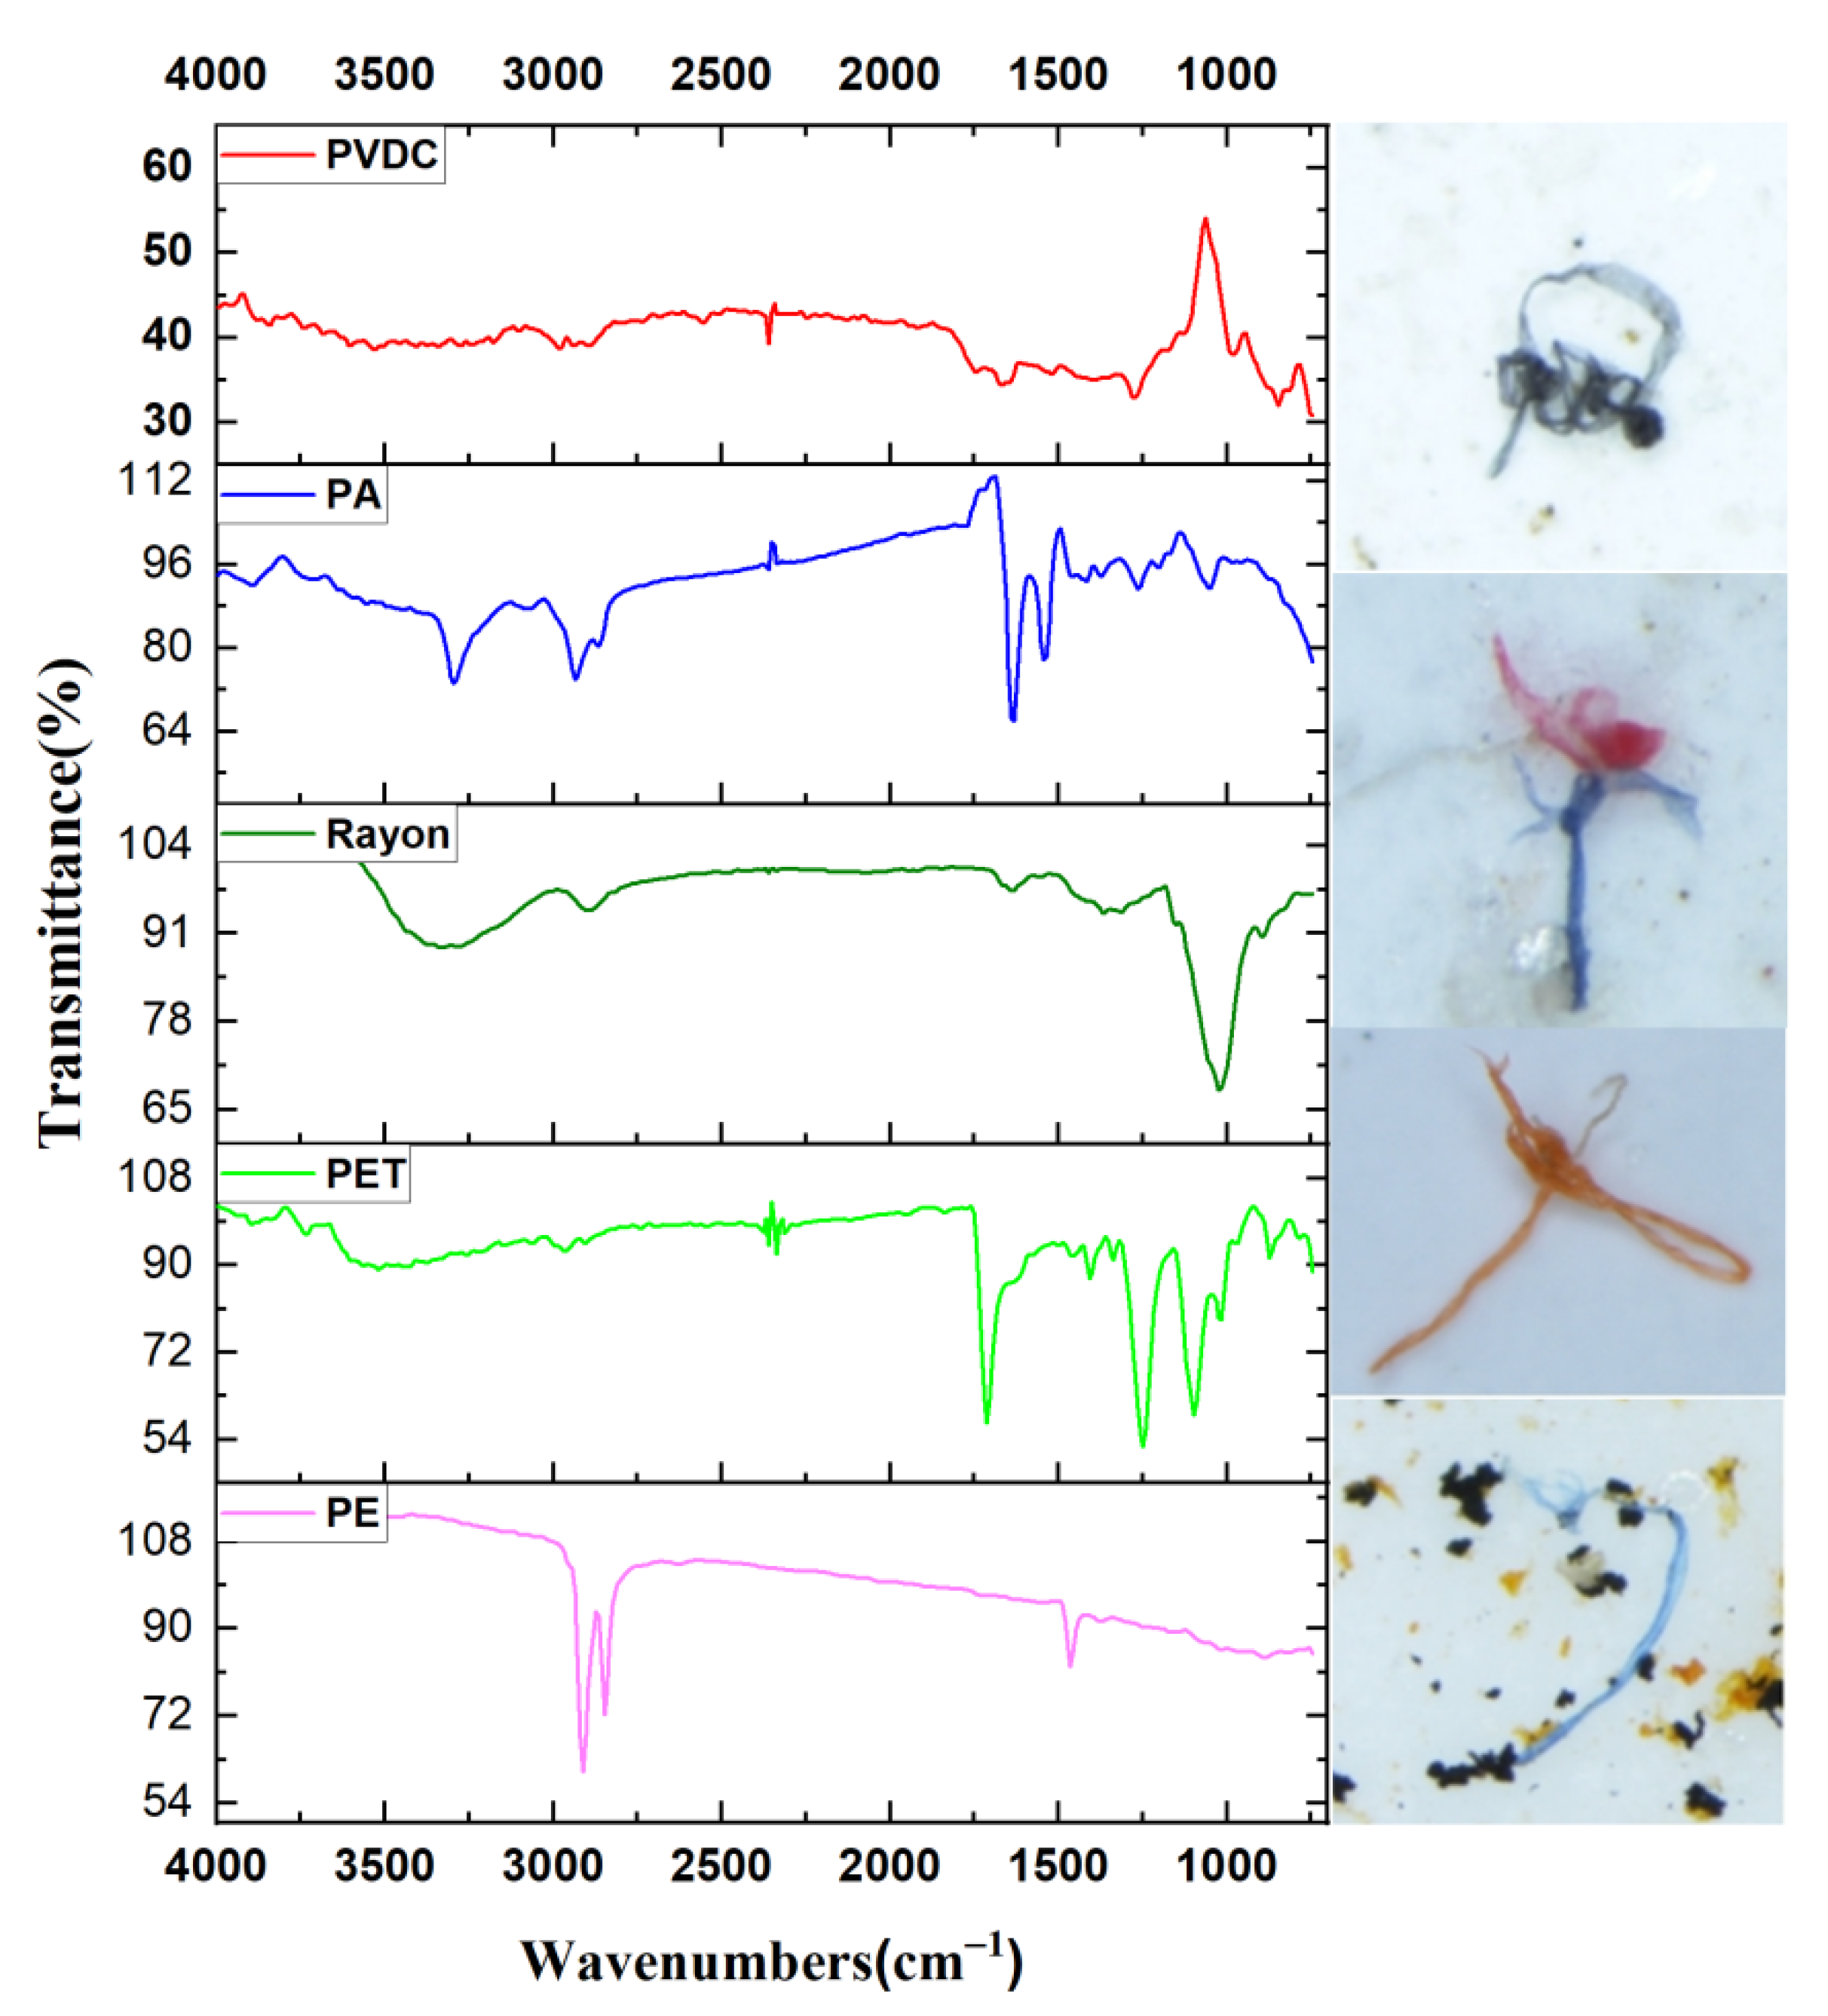
2.2. Qualitative and Quantitative Methods for Microplastics

The suspected microplastic particles or fragments were observed by Stereo Microscope (Nikon SMZ1270) (magnification: 20–80). The characteristic information of microplastics was recorded in detail, such as shape, and size [37]. The microplastic shape was cataloged as fiber, fragment, granule, or foam. The size of microplastics was divided into four fractions of <0.5 mm, 0.5–1.0 mm, 1.0–3.0 mm, and 3.0–5.0 mm, respectively. Photos of assumed microplastics were taken by the DS RI2 camera system (Figure 1). The compositions of the suspected microplastics were identified by a Fourier Transform Infrared Spectroscope (micro-FTIR, PerkinElmer Spotlight 400, Llantrisant, UK) to determine the types of the polymers. The spectra were acquired from a spectral resolution of 8 cm−1 with co-scan 16 times, and the spectral range was set from 4000 cm−1 to 675 cm−1. The collection time was 3 s with transmission mode. The size of the diaphragm depended on the size of the microplastics in the sample. The obtained spectra of microplastics were compared with the standard spectra in the spectra library of OMNIC PICTA software to determine the composition of polymers. In this study, the matching degree between the spectra of microplastic samples and the standard spectra from the Saddler database in OMNIC PICTA software was higher than 80%. The minimum particle size of microplastics that we could detect by this method was 20 µm.

2.3. Data Analysis Method and Quality Control

The unit of microplastic abundance in seawater is items/m3. In the here-presented study, Ocean Data View 4, Microsoft Excel 2013, Origin 9.0 and Surfer 14 were used to calculate, process, and draw data maps.
During the collection of microplastic samples, we added a field blank sample between every 10 microplastic samples. Because the sampling pipeline on board was mainly stainless steel and welded on the ship, the interference monitoring of the pipeline was limited. We monitored the possible interference caused by the connected rubber peristaltic tube. Thus, the field blank samples (n = 5) obtained by filtering ultrapure water (filtered through a nitrocellulose membrane) were set for quality control to investigate the interference of the filtration process and environmental conditions of the laboratory on the scientific research ship. During on-site filtration, the mouth of the filter cup was covered with aluminum foil. During the identification and analysis in the laboratory, the laboratory personnel wore cotton laboratory clothes, all instruments were cleaned with ultrapure water, and the instruments and equipment were wiped with delicate task wipers (Kimwipes) dipped in ultrapure water and alcohol. A blank filter membrane was placed near the sample to correct the error caused by potential pollution in the detection process. Because we did not find microplastics in blanks, the final results in our study did not subtract the blank value but were taken into consideration for interpretation.

3. Results and Discussion

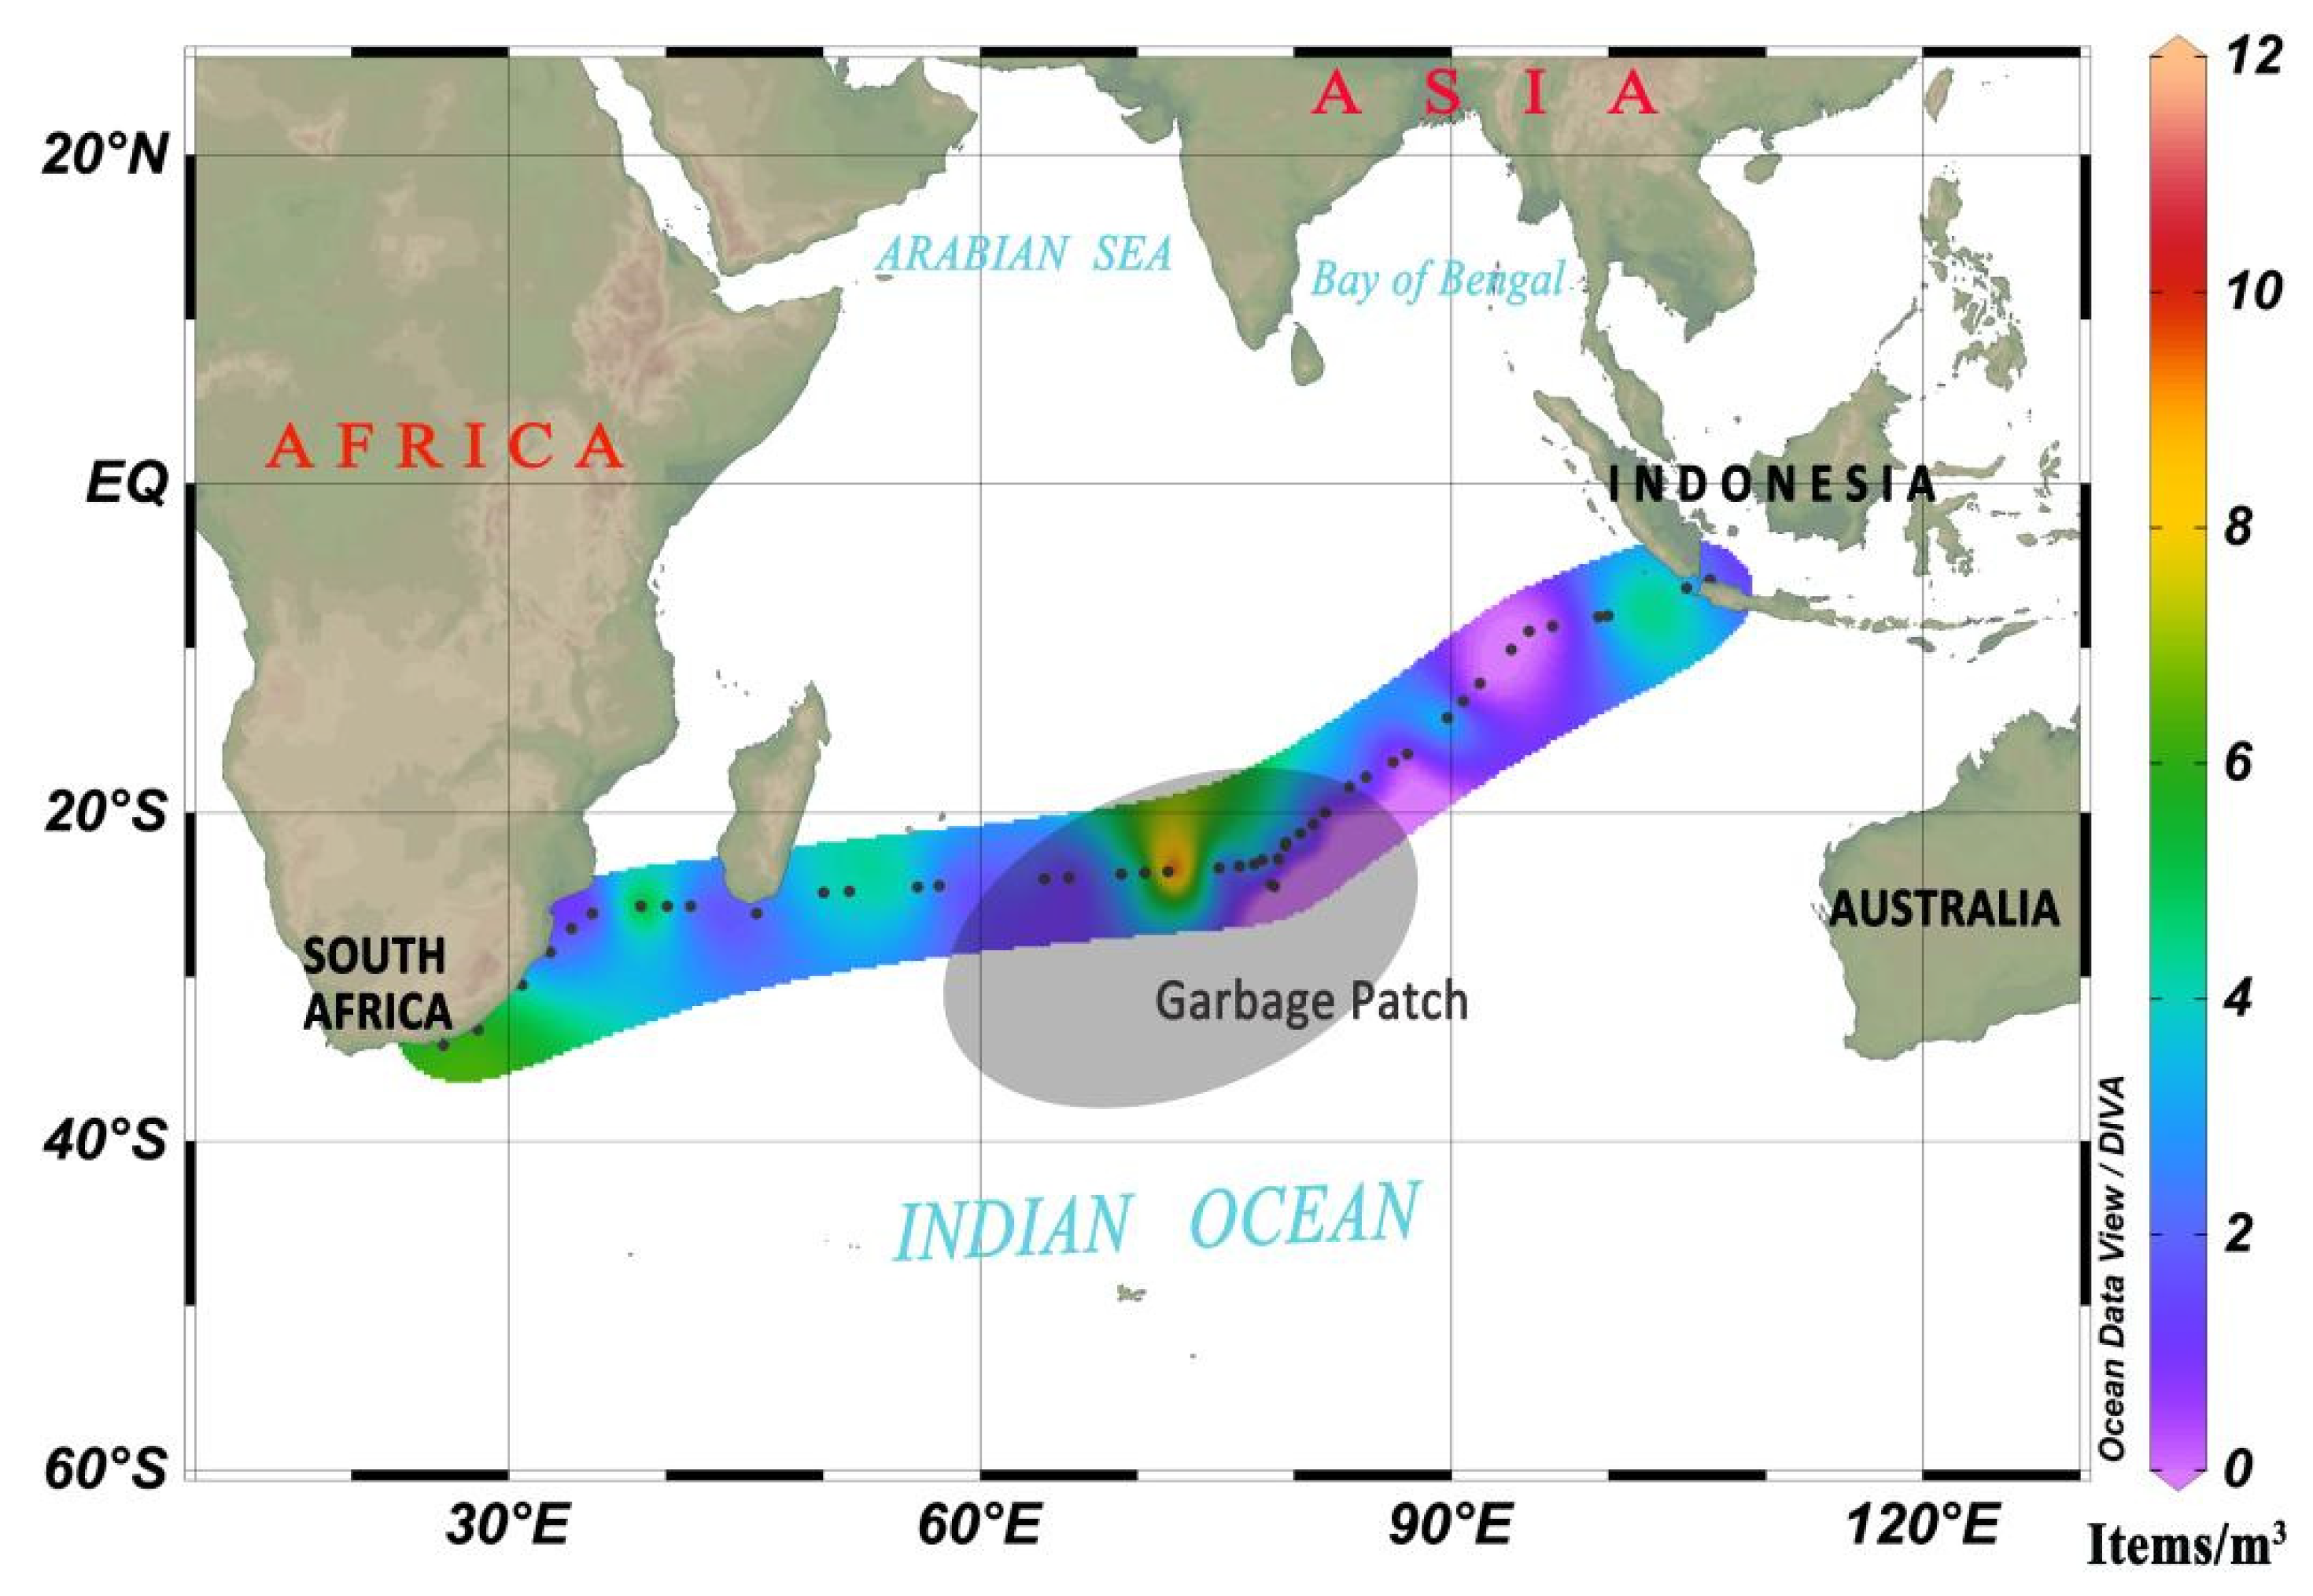
3.1. Analysis of Zonal Distribution Characteristics of Microplastics in the Southern Indian Ocean

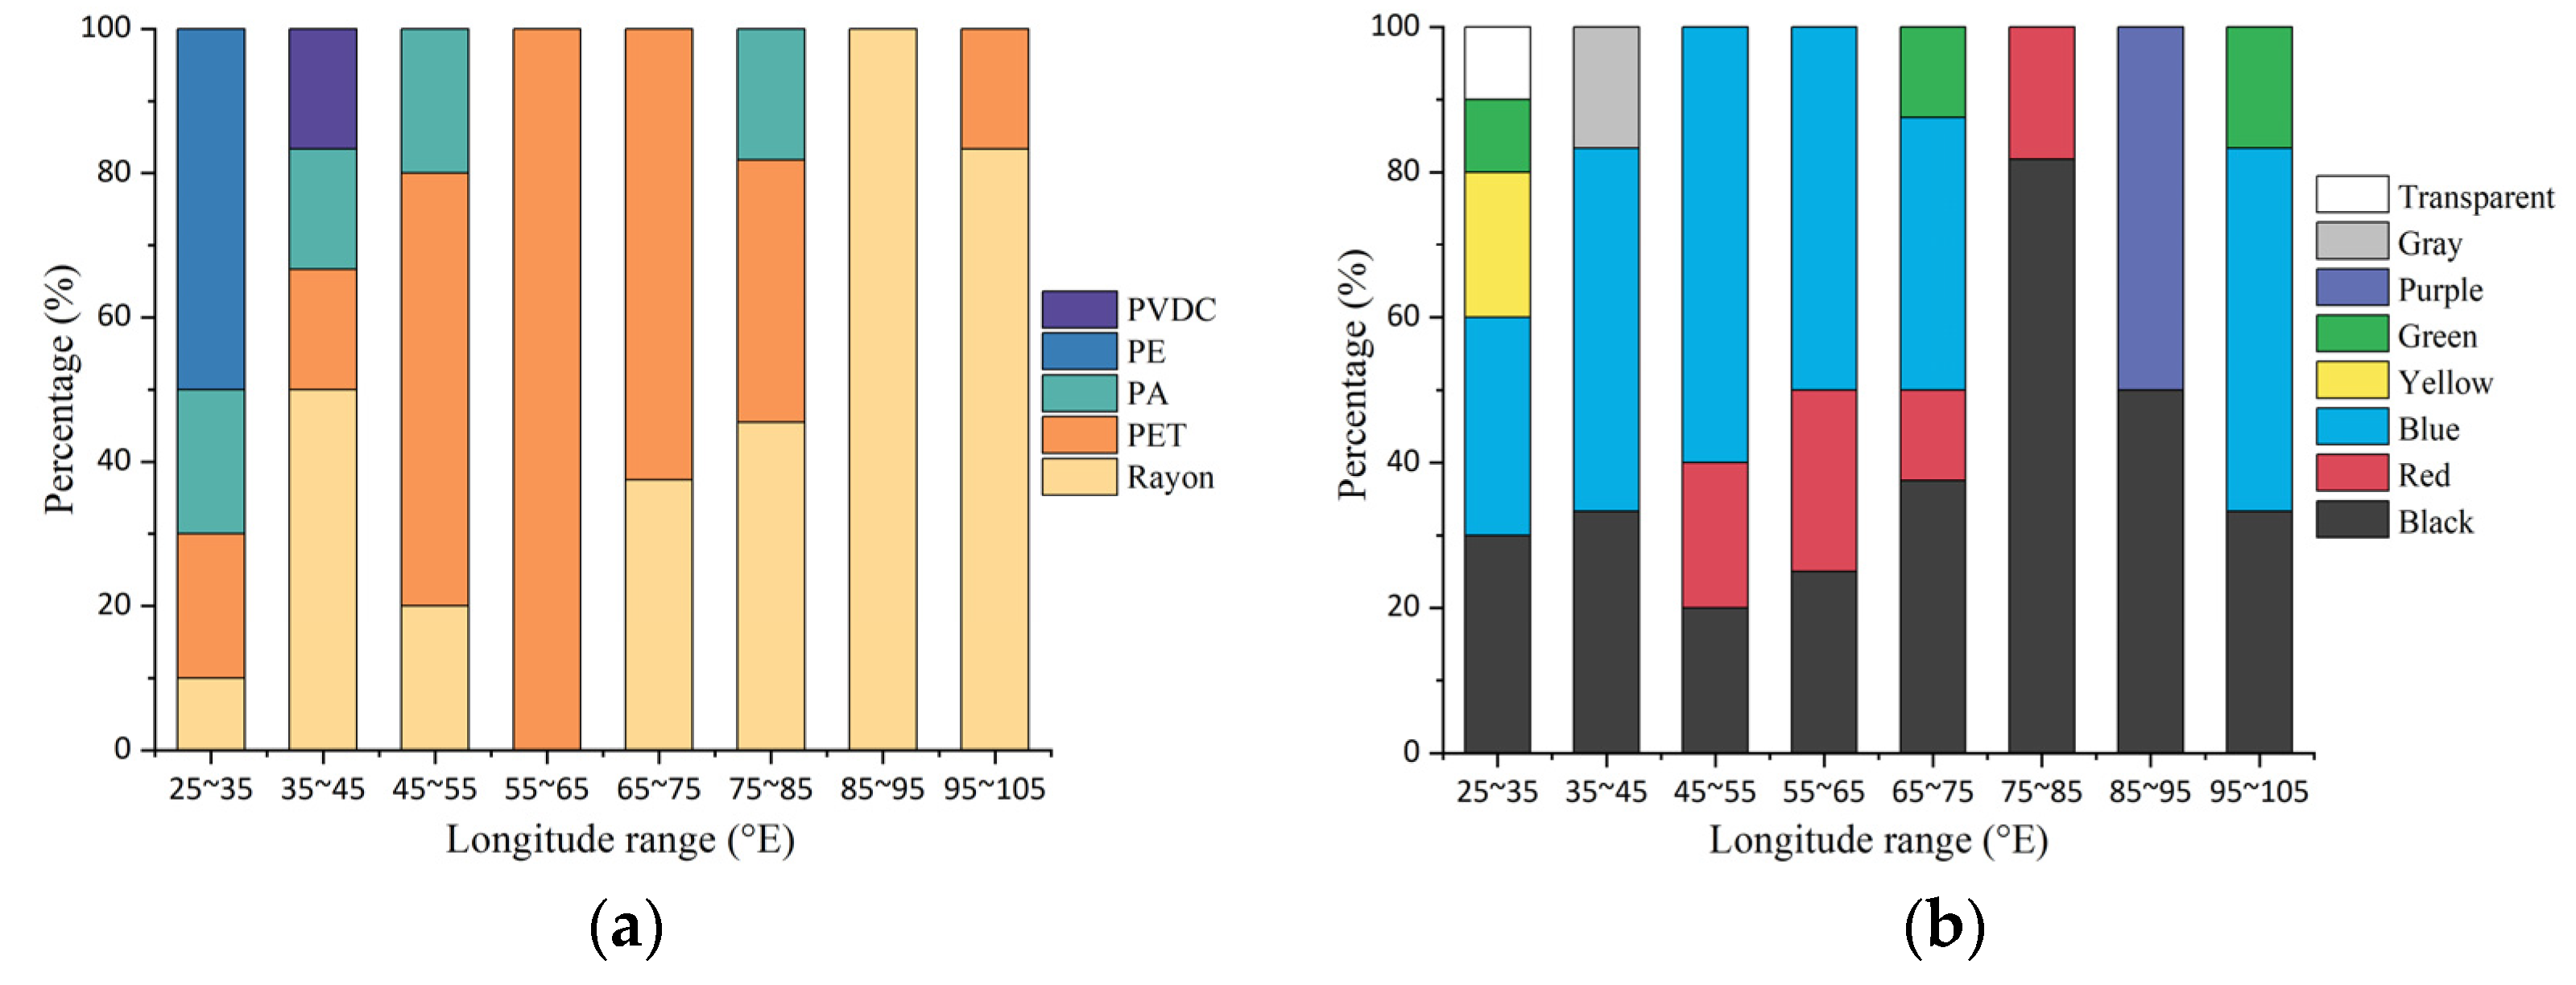
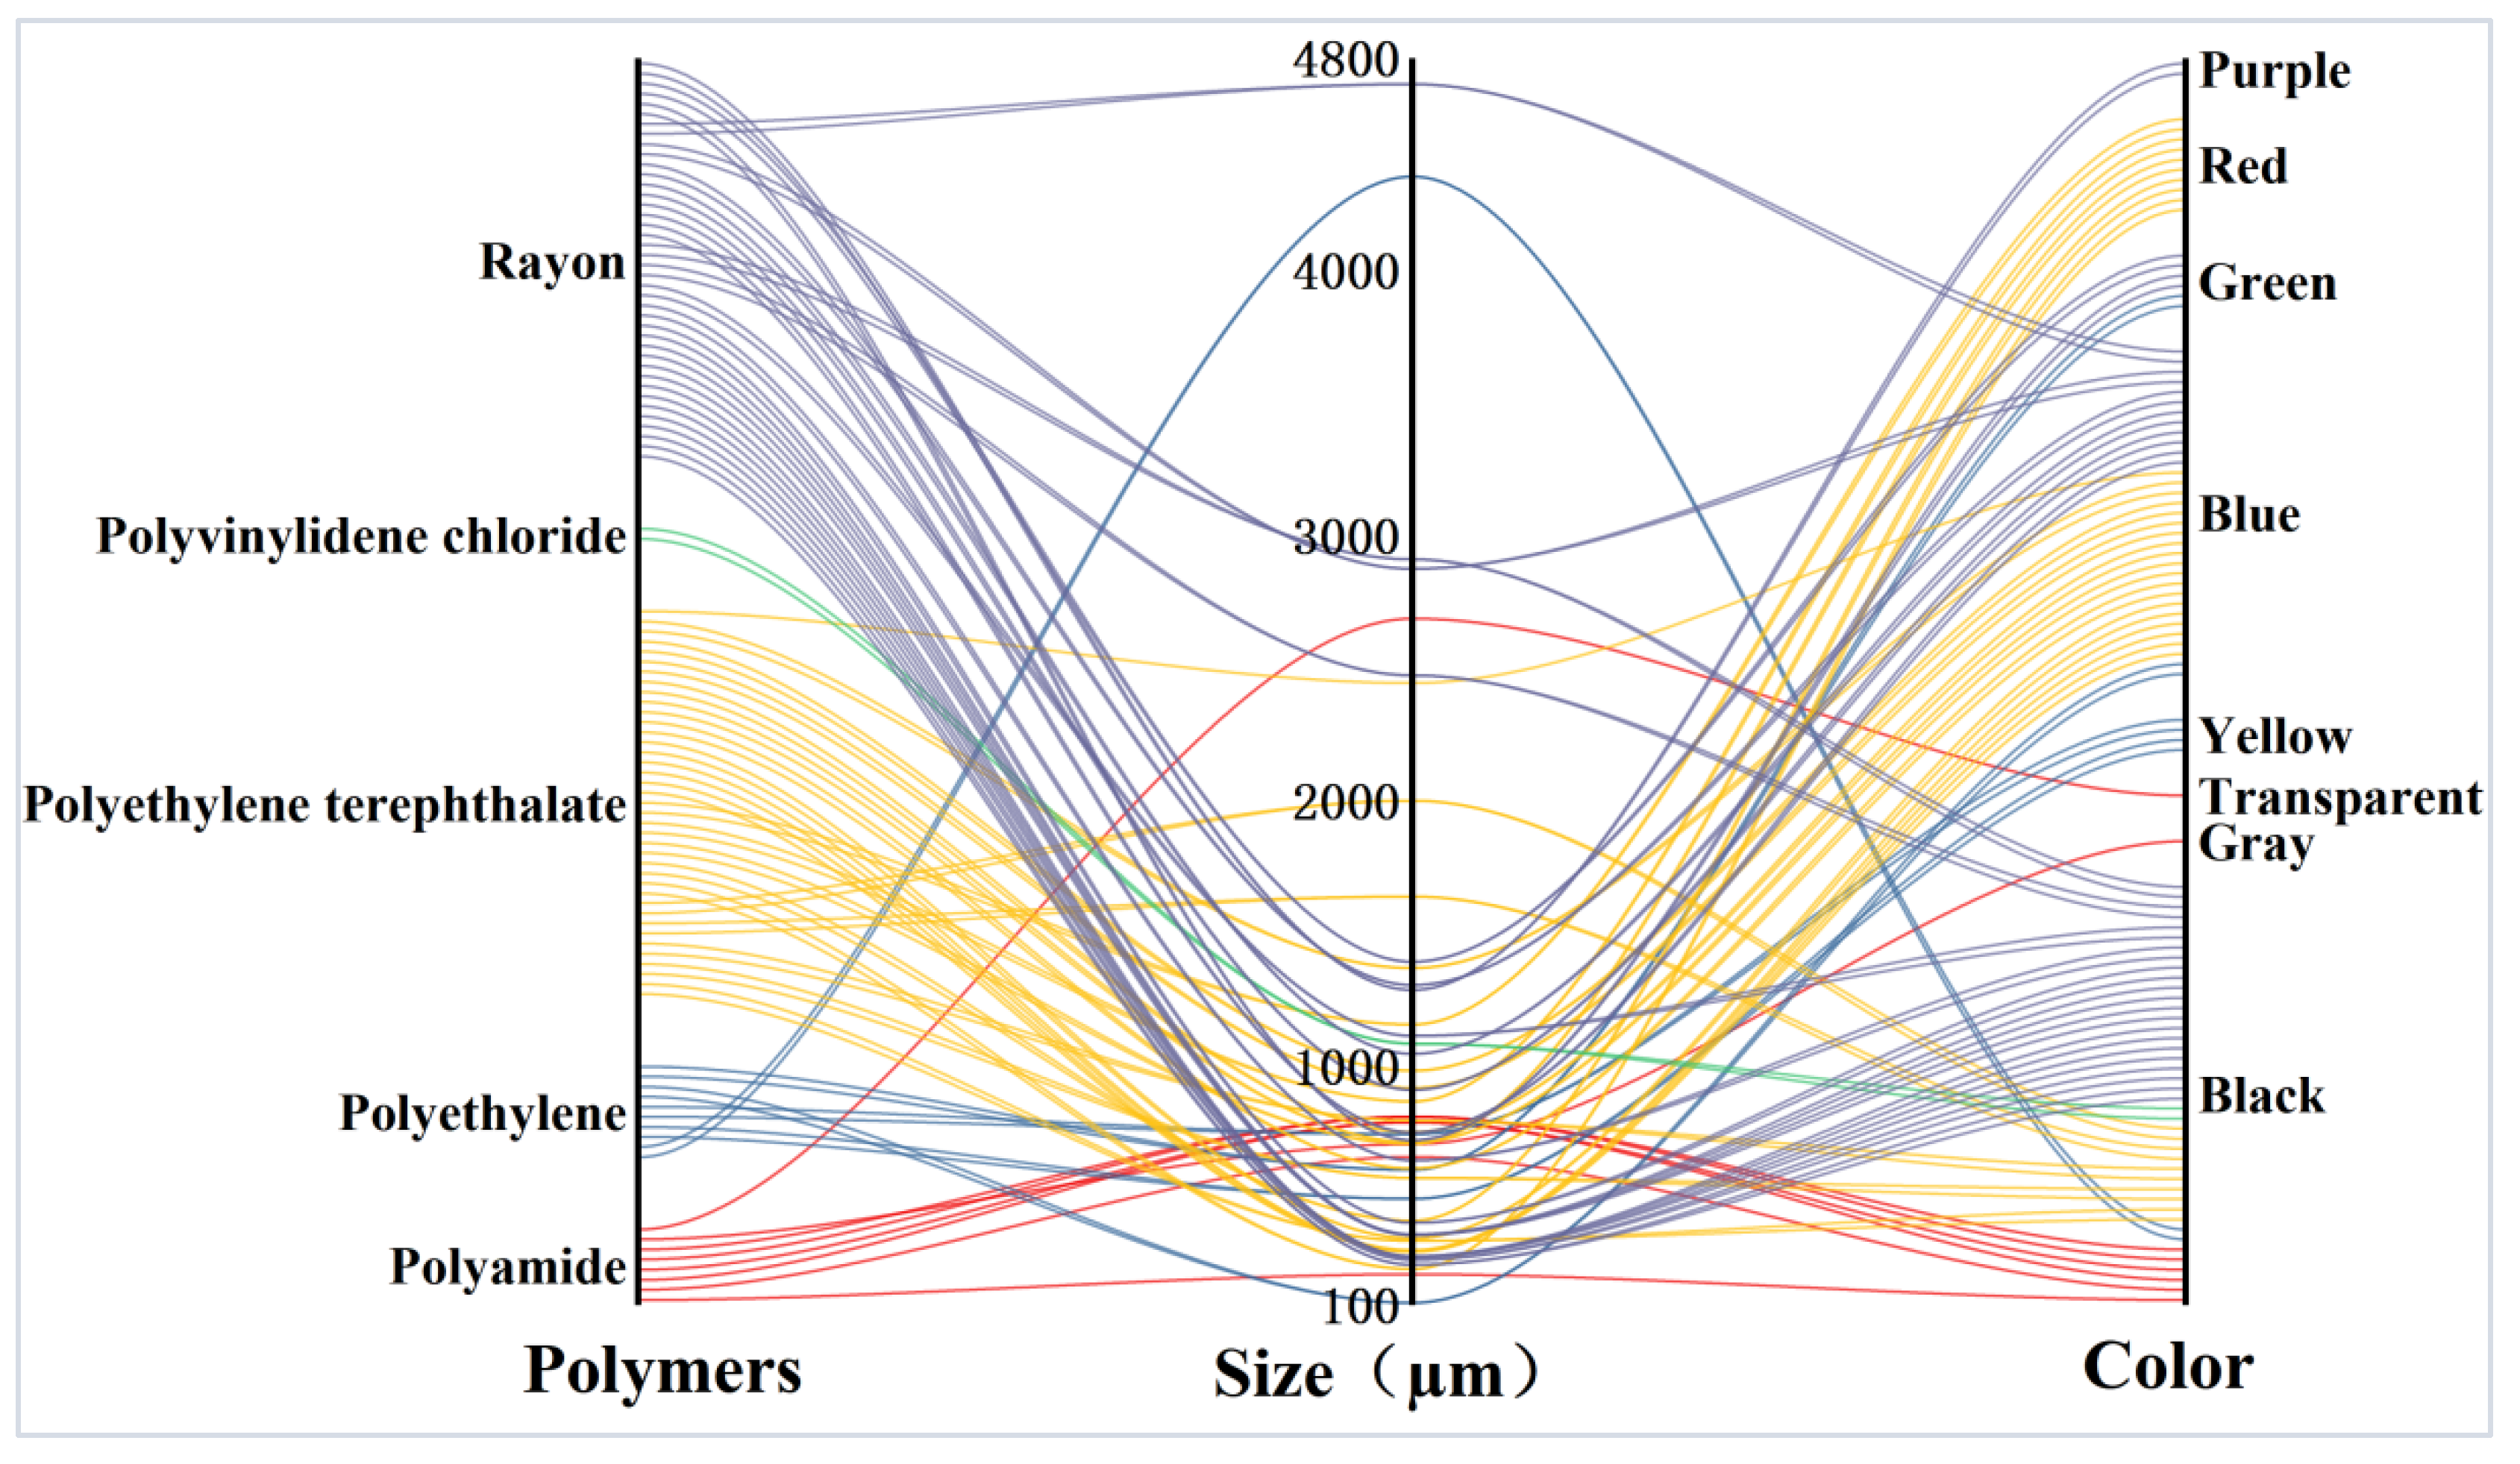
3.1.1. Abundance and Characteristics of Microplastics

In this study, fiber was the main shape of microplastics detected in seawater. Fiber microplastics mainly come from synthetic clothing and other manufactured products [38,39]. Liu et al. [40] investigated microplastics in the atmosphere and found that 67% of the microplastics were fibers, which could be transferred to the surface of the sea by the action of the wind and eventually settled into the marine environment [41]. A total of 7% of the amount of microplastics in the marine environment was due to the propagation of wind alone [42]. Hence, the deposition of microplastics in the atmosphere may be one of the main sources of microplastics in the ocean. Five types of polymers, including Rayon, polyethylene terephthalate (PET), polyethylene (PE), polyamide (PA) and polyvinylidene chloride (PVDC), were detected in our study. Rayon and PET polymers accounted for 38.5% of all detected polymers. Rayon is a kind of silk synthetic fiber, which is counted in the category of microplastics by many reports [3,6,38]. PET is a highly crystalline polymer that is widely used in the electronic and electrical industry. Eight colors of microplastics were found as follows: black, red, yellow, gray, blue, green, purple, and transparent. Black and blue microplastics had high proportions of 42.31% and 32.69%, respectively.
The abundance range of microplastics was 0–12 items/m3, and the average abundance was 2.3 ± 2.1 items/m3. The distribution trend of microplastics is shown in Figure 2. The highest abundance of microplastics appeared in the middle of the study area, followed by the coastal region of South Africa. The area with the highest abundance of microplastics in the middle of the study area was consistent with the vortex garbage patch area of the Indian Ocean (62.6° E–81.4° E, 23.8° S–32.9° S), which verified that the ocean vortex had agglomeration effect on microplastics. The detected microplastic particle size ranged from 108.2 µm to 4703.0 µm, with an average particle size of 1060.3 ± 990.9 µm. The particle size of microplastic with the highest percentage ranged from 500 µm to 1000 µm (38.5%), followed by 100 µm to 500 µm (28.85%).
The characteristic information of all identified single microplastic is shown in Figure 3. The color of PA was mainly black, and 85% of PA particle size was less than 1 mm. The colors of PE were mainly black (20.0%), yellow (20.0%), blue (20.0%), and green (40.0%). The size of PE less than 1 mm accounted for 80.0%. A large amount of PET was detected, and the colors of PET were mainly black (25.64%), red (25.64%), and blue (48.72%). The particle size range of PET was large, with 30.77% less than 500 µm, 46.15% between 500–1000 µm, and 23.08% between 1000–3000 µm. Rayon also had a large number of colors, mainly black (55.0%), blue (30.0%), green (10.0%), and purple (5.0%). The size of Rayon less than 500 µm accounted for 35.0%, 500–1000 µm accounted for 20.0%, 1000–3000 µm accounted for 40.0%, and 3000–5000 µm accounted for 5.0%. Two black PVDC microplastics with a particle size of about 1000 µm were found.

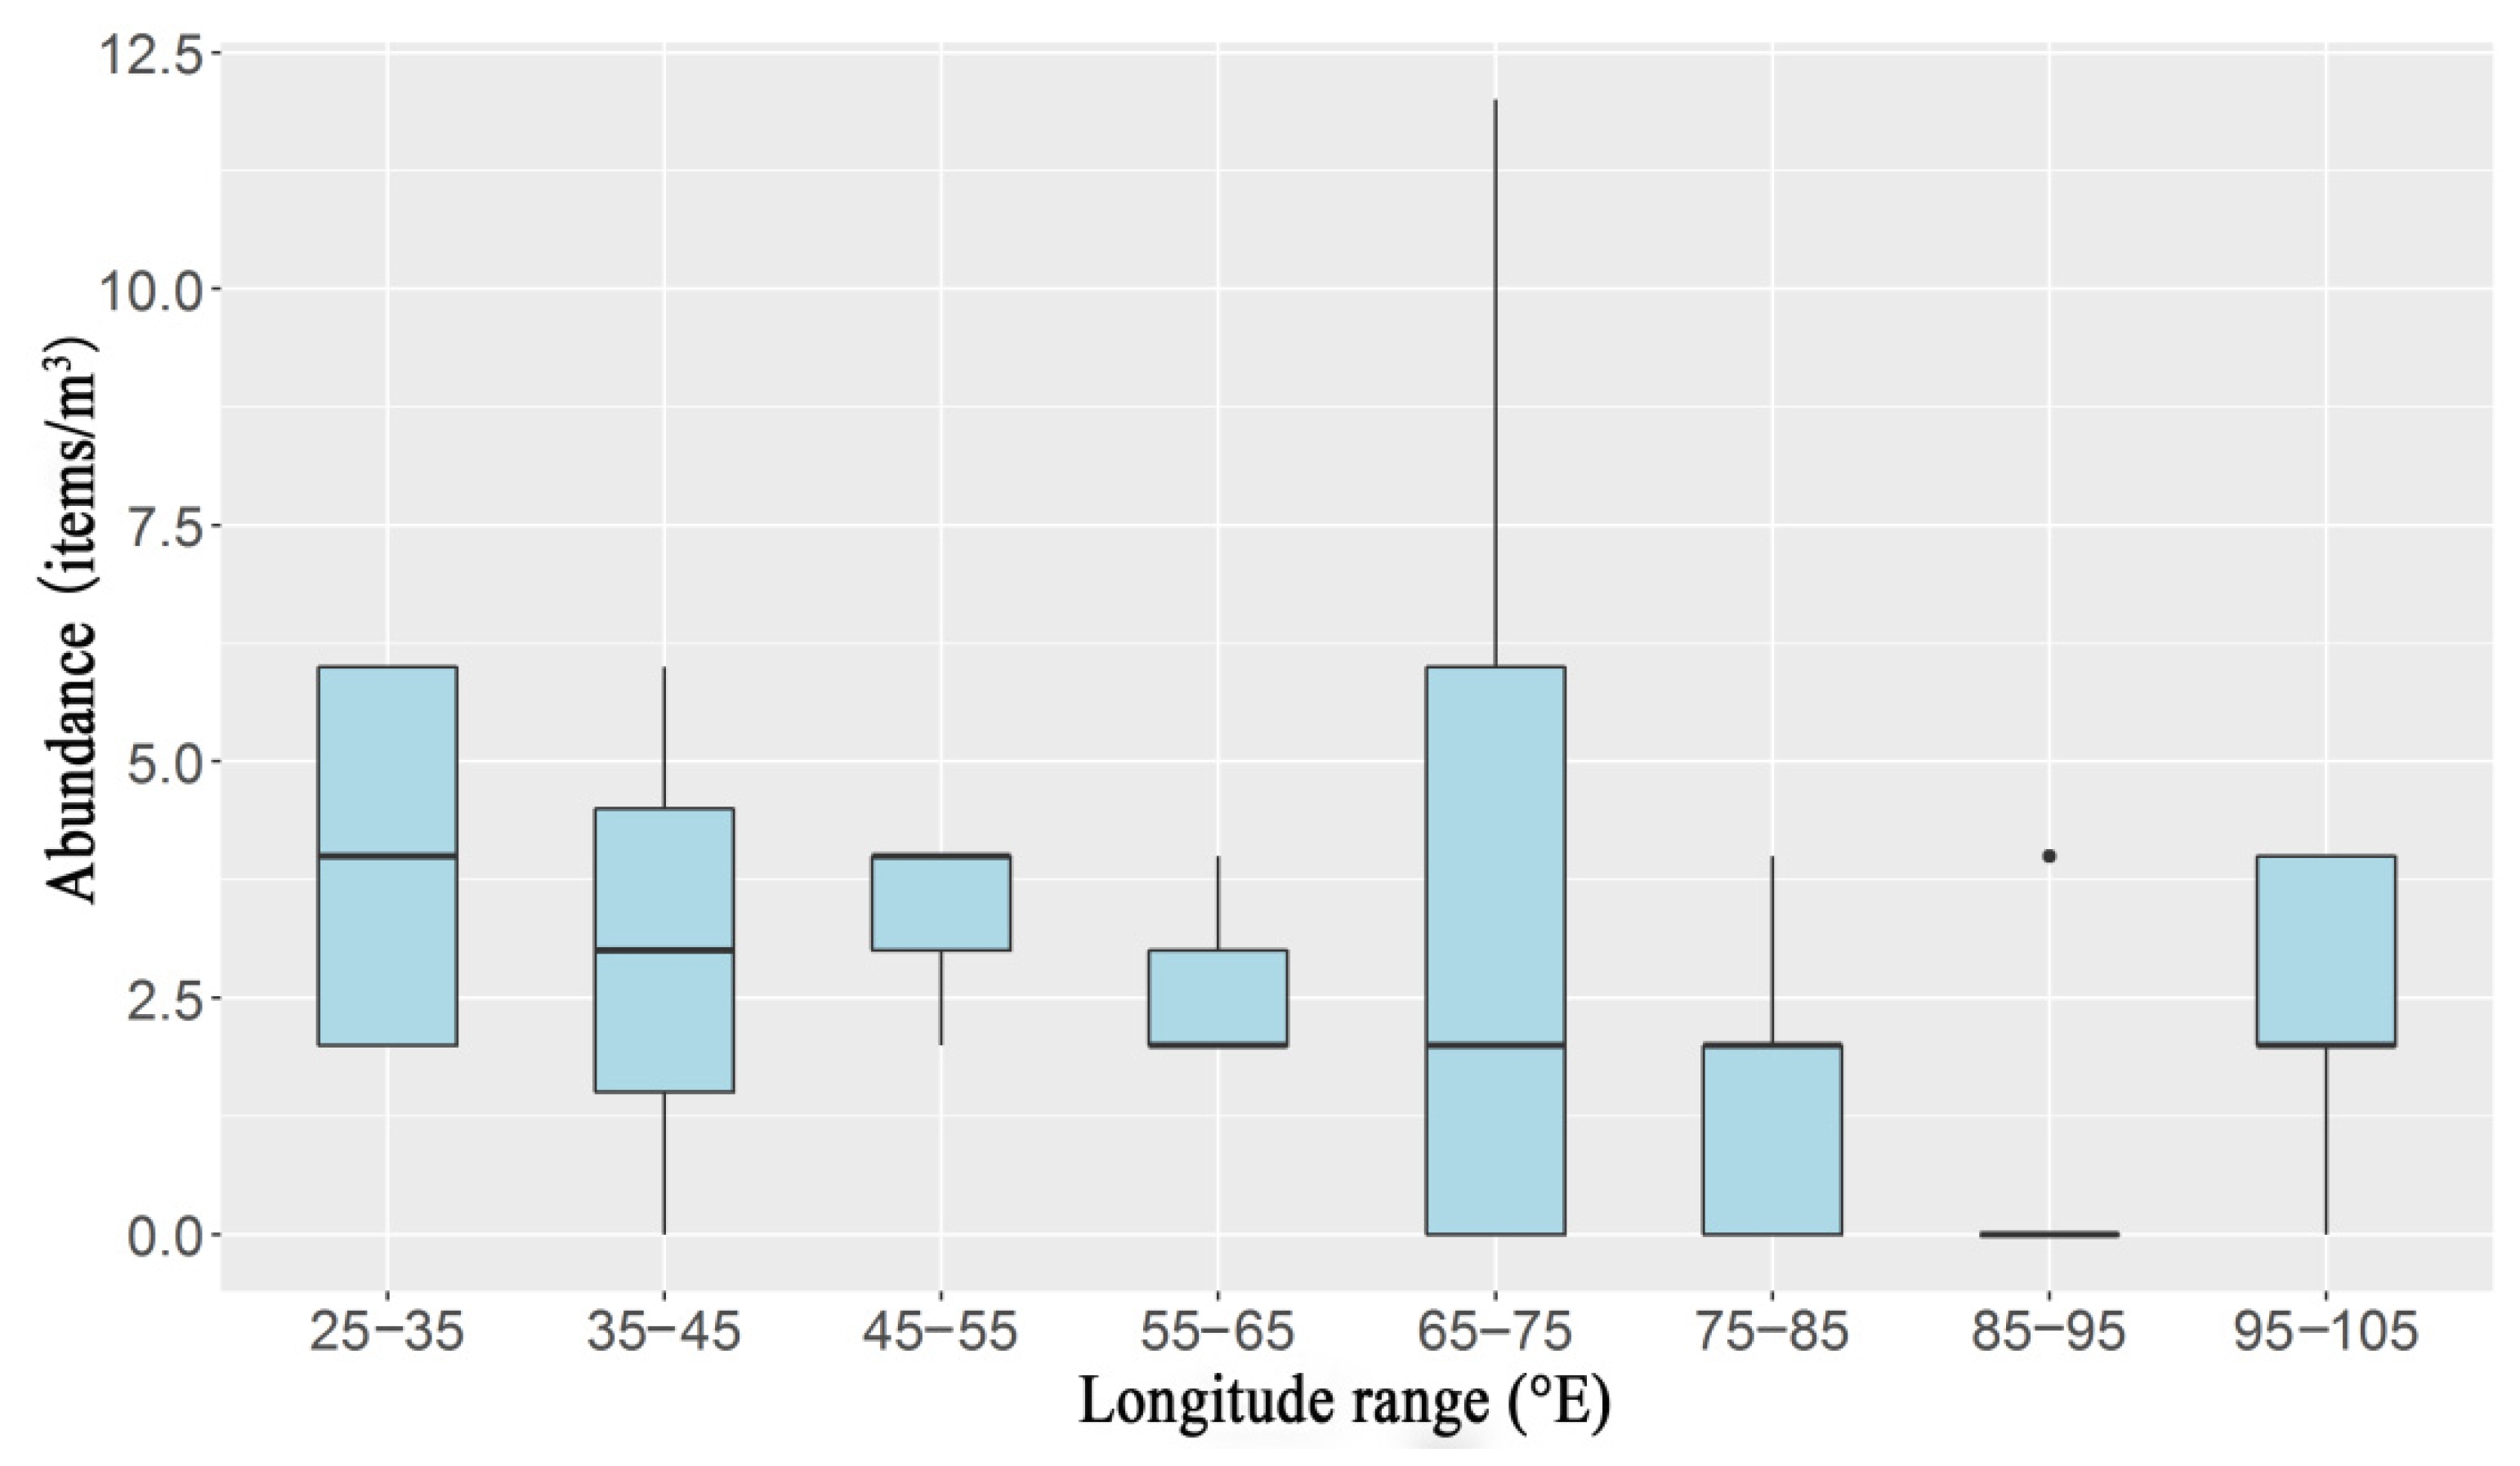
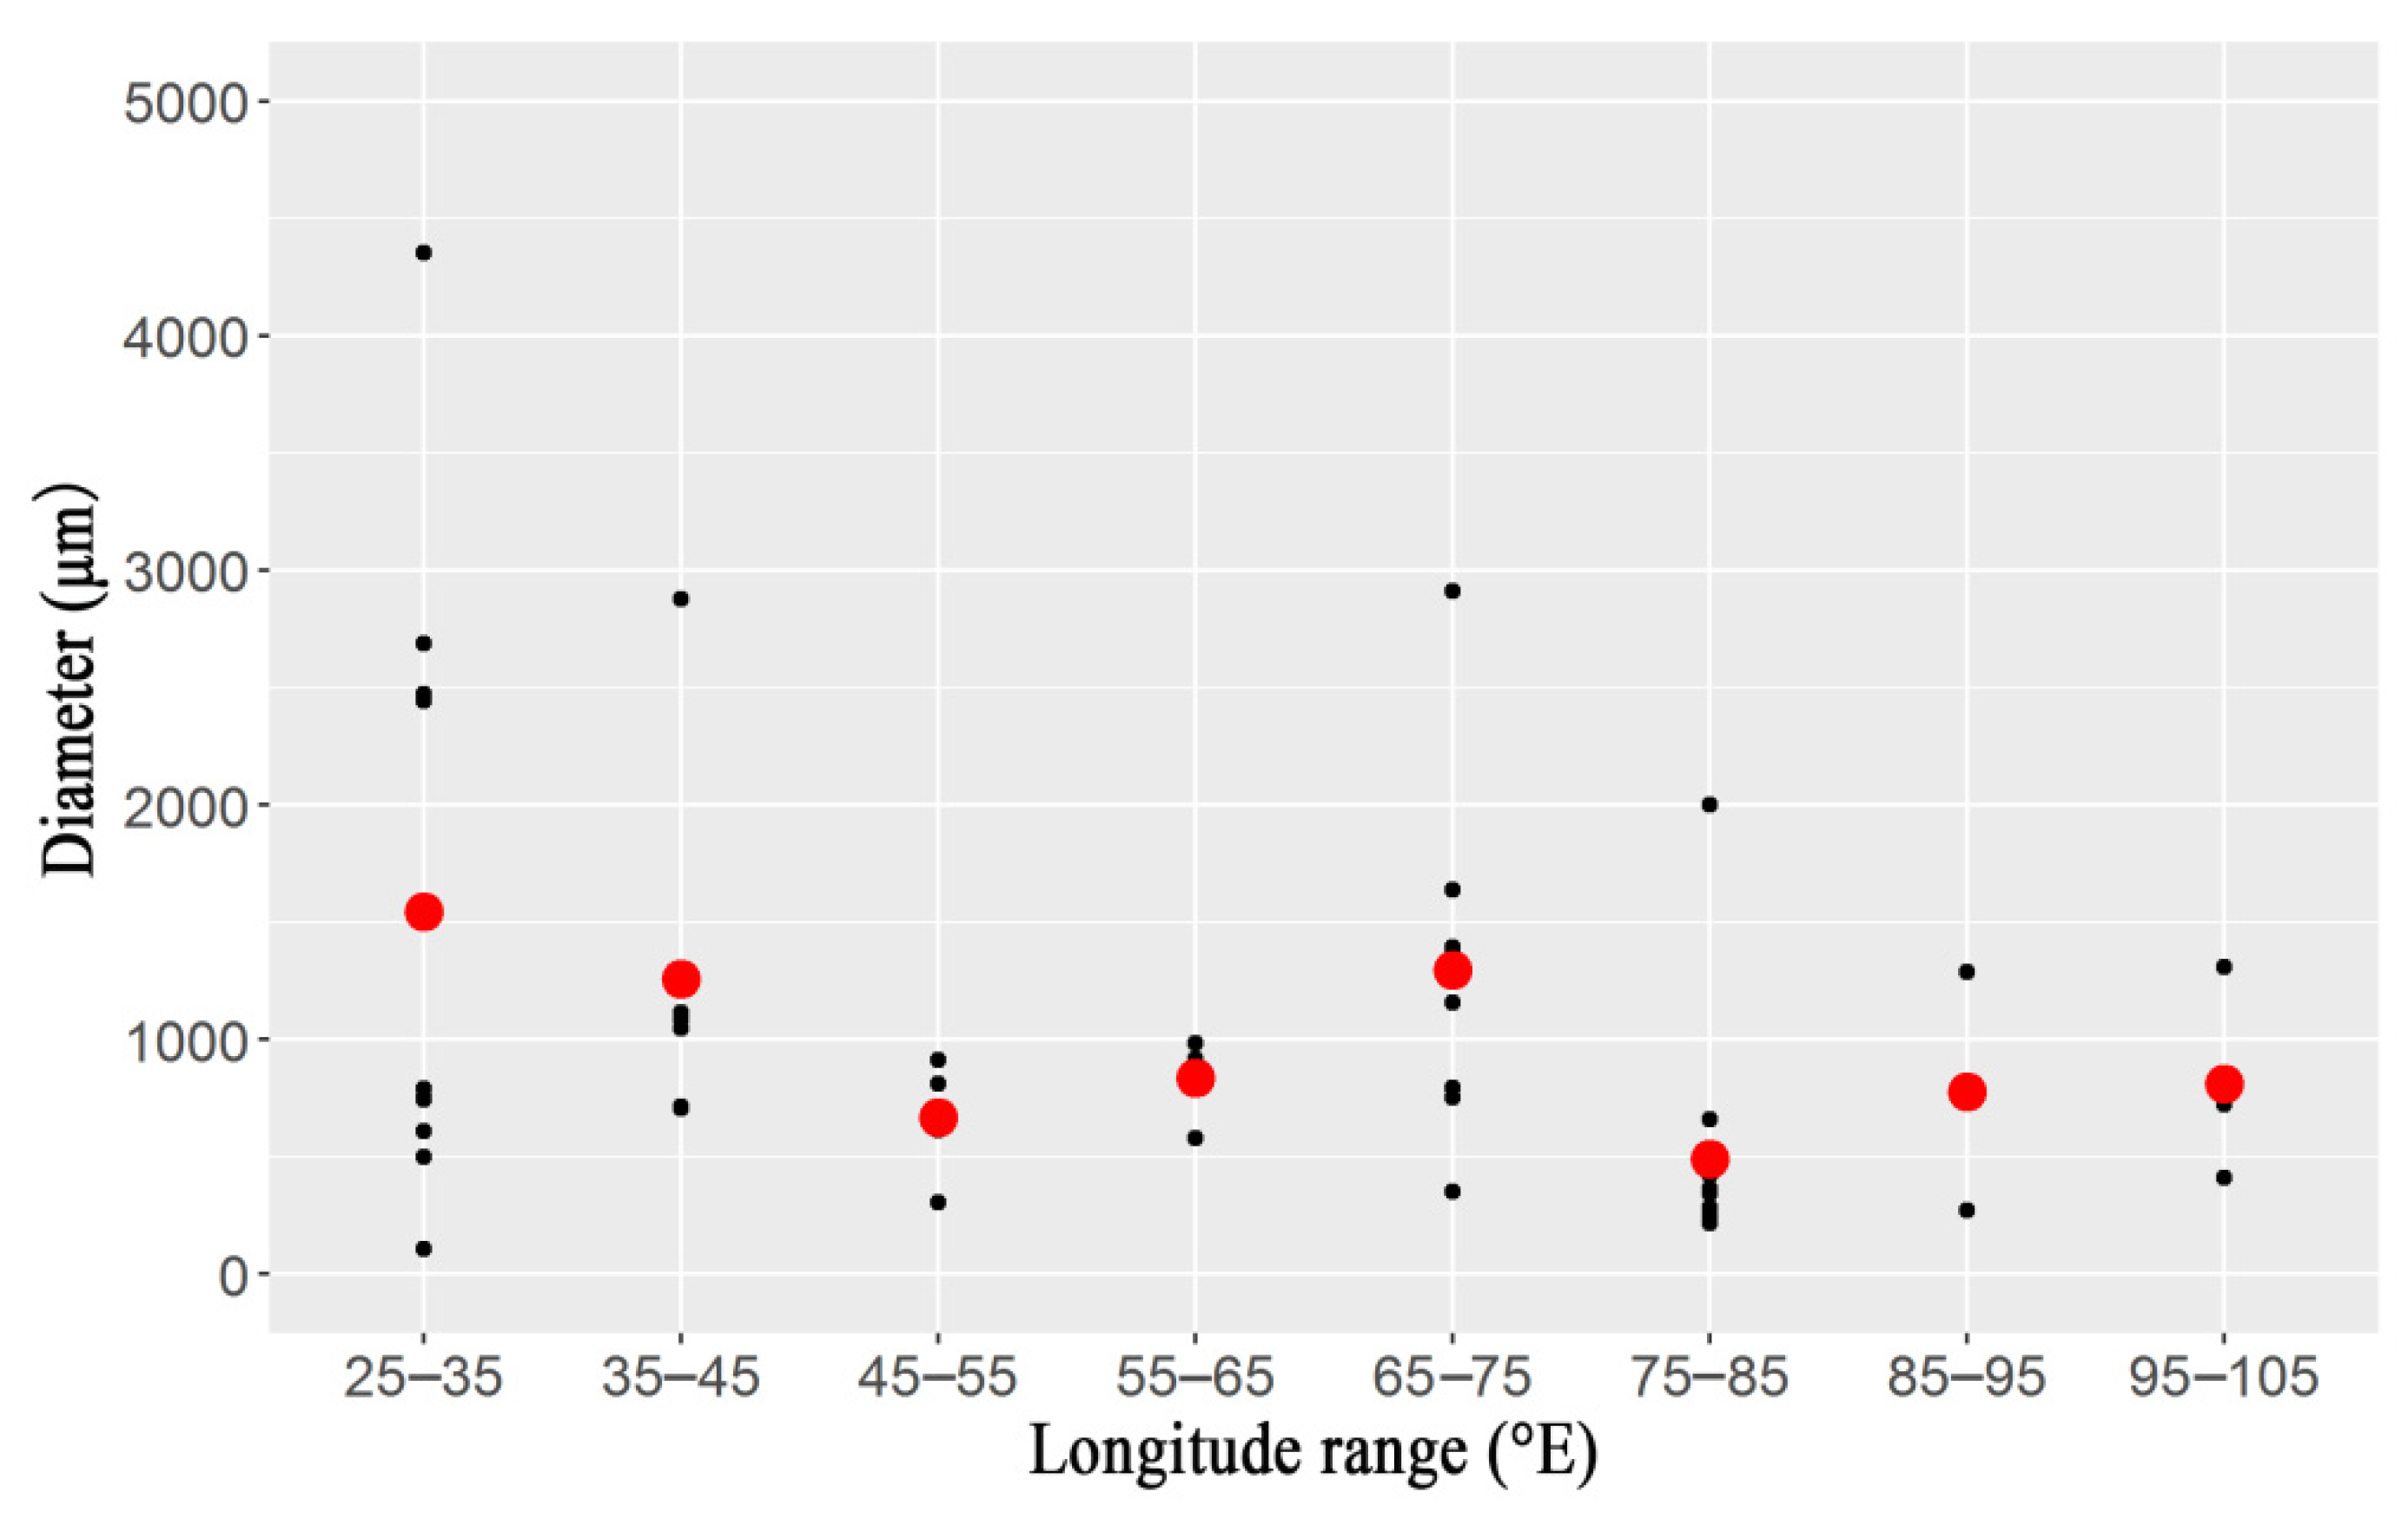
3.1.2. Spatial Distribution Analysis of Microplastics

The study area is surrounded by typical ocean currents, including the western Australian cold current in the East, the South Equatorial warm current in the North, the Agulhas warm current in the West, and the westerly drift in the South. There is typical upper circulation in the study area [43,44]. Therefore, the interval distribution characteristics of microplastics in the Indian Ocean would be driven by ocean currents. In this study, the interval spatial distribution pattern of microplastics was systematically analyzed with every 10° (longitude) as a regional gradient from 25.0° E to 105.0° E, which was based on the abundance of microplastics. The results (Figure 4) showed that the average abundance of microplastics fluctuated from low longitude area to high longitude area. The average abundance of microplastics was relatively high in the areas of 25.0° E–35.0° E and 65.0° E–75.0° E, with an average abundance of 4.0 items/m3. The detection rate of microplastic stations in the area of 25.0° E–35.0° E was 100%. The high abundance of microplastics in the area of 25.0° E–35.0° E, close to the south African continent, may be affected by the land source input because the discharge of domestic sewage had a certain contribution to the abundance and distribution of microplastics in the marine environment [45] and aggravated the pollution of microplastics in the marine environment on the land edge. The most common shapes of microplastics in domestic sewage were fiber and fragment [46]. The high abundance of microplastics in the area of 65.0° E–75.0° E may be mainly due to the existence of the Indian Ocean circulation garbage patch and vortex agglomeration in this area.
Figure 5 shows the polymer and color characteristics of microplastics in this study area. In the area of 25.0° E–35.0° E, the polymers and colors of microplastics were diversified. The polymers of microplastics detected were PA, PE, PET, and Rayon. The main colors were black, yellow, blue, green, and transparent. The proportion of PE and PET was relatively high. PE is mostly used to manufacture plastic bags, plastic bottles, and packaging materials. PET is mostly used to manufacture electronic devices and polyester. The garbage generated by human coastal activities includes plastic bottles, fast food boxes, beverage cans, and plastic bags. Shipping/fishing activities would produce waste fishing nets, fishing lines, and floating garbage. Thus, human coastal activities would lead to PE or PET garbage pollution in the marine environment [47,48]. We found more PE, PET, and Rayon in the seawater, which could indicate that land source input may be one of the main reasons for the diversity of microplastic types and the high average abundance in the area of 25.0° E–35.0° E. South Africa, adjacent to the sea, is the second-largest economy in Africa, integrating industries, tourism, fisheries, and other developed areas [35]. The development of industry may be one of the main factors leading to environmental pollution. Nel et al. [49] studied the distribution of microplastics in beach sediments and water along the southeast coast of South Africa. In the aforementioned study, anatomical microscopic was used for detection and analysis. The results showed that the abundance of microplastics in water was 257.9 ± 53.36–1215 ± 276.7 items/m3, which was higher than that in this study. The particle size range of microplastics was 0.08–5 mm. The shape of microplastics was mainly black and blue fibrous, similar to the color and shape of the microplastics in our study. Li et al. [50] investigated microplastic content in subsurface water by using a pump-underway ship intake system along the cross-oceanic transect from the Pearl River Estuary to the Indian Ocean. Their results showed that microplastic abundance ranged between 0 and 4.97 items/m3. These collections identified PE, PP, and PET as the major polymers represented. The presence of microplastics in coastal regions was significantly higher than that in the open ocean, revealing the contribution of land-based sources to marine microplastics and the ocean dynamics. Some results of microplastic distribution in the aforementioned study were consistent with our research results.
The particle size range of microplastics in different longitude and latitude areas was slightly different. The results (Figure 6) showed that the particle size range of microplastics was 1546.5 ± 1364.5 µm in the areas of 25.0° E–35.0° E and 1248.7 ± 738.7 µm in the area of 65.0° E–75.0° E. In addition, the particle size range of microplastics in the area of 25.0° E–35.0° E was the largest, ranging from 108.2 µm to 4354.8 µm. The particle size of microplastics presented similar diversified distribution characteristics with its types and colors. The particle size range and color types of microplastics in our study were close to the research results of Nel et al. [49].

3.1.3. Comparison of Microplastics in Different Ocean Waters

At present, the collection methods and units of microplastics differ. The common units of microplastic abundance in seawater are “pieces/km2 or items/km2” and “pieces/m3 or items/m3”. The abundance of microplastics is not comparable due to lacking standardization in sampling and analysis techniques [51,52]. Most of the microplastic samples in surface seawater were mainly collected using horizontal trawl. In this study, the peristaltic pump and 20 µm pore size sieve were used to collect and concentrate seawater. A comparison with the microplastic results in other sea areas could provide more microplastic date support for expanding the monitoring of microplastics in the open ocean. Typical waters adjacent to the Indian Ocean, Atlantic, and Arctic were selected in this study. The unit of microplastic abundance is items/m3, then the differences of microplastics in different sea areas were analyzed (Table 1). The results showed that the abundance of microplastics in Arctic seawater was relatively low [26], and the abundance of microplastics in the Atlantic and the Indian Ocean was similar and in the same order of magnitude [53]. The shape of microplastics in different areas was mainly fibrous, and the proportion of fibrous microplastics in most areas was more than 90%. Some differences in the polymer and particle size range of microplastics exist, which may be affected by different sampling and identification methods and regional pollution differences [53,54,55,56]. However, the technology of collecting microplastic samples with the peristaltic pump onboard has a certain application value, which can obtain microplastic samples with spatial continuity in sea areas along the ocean scientific investigation route.

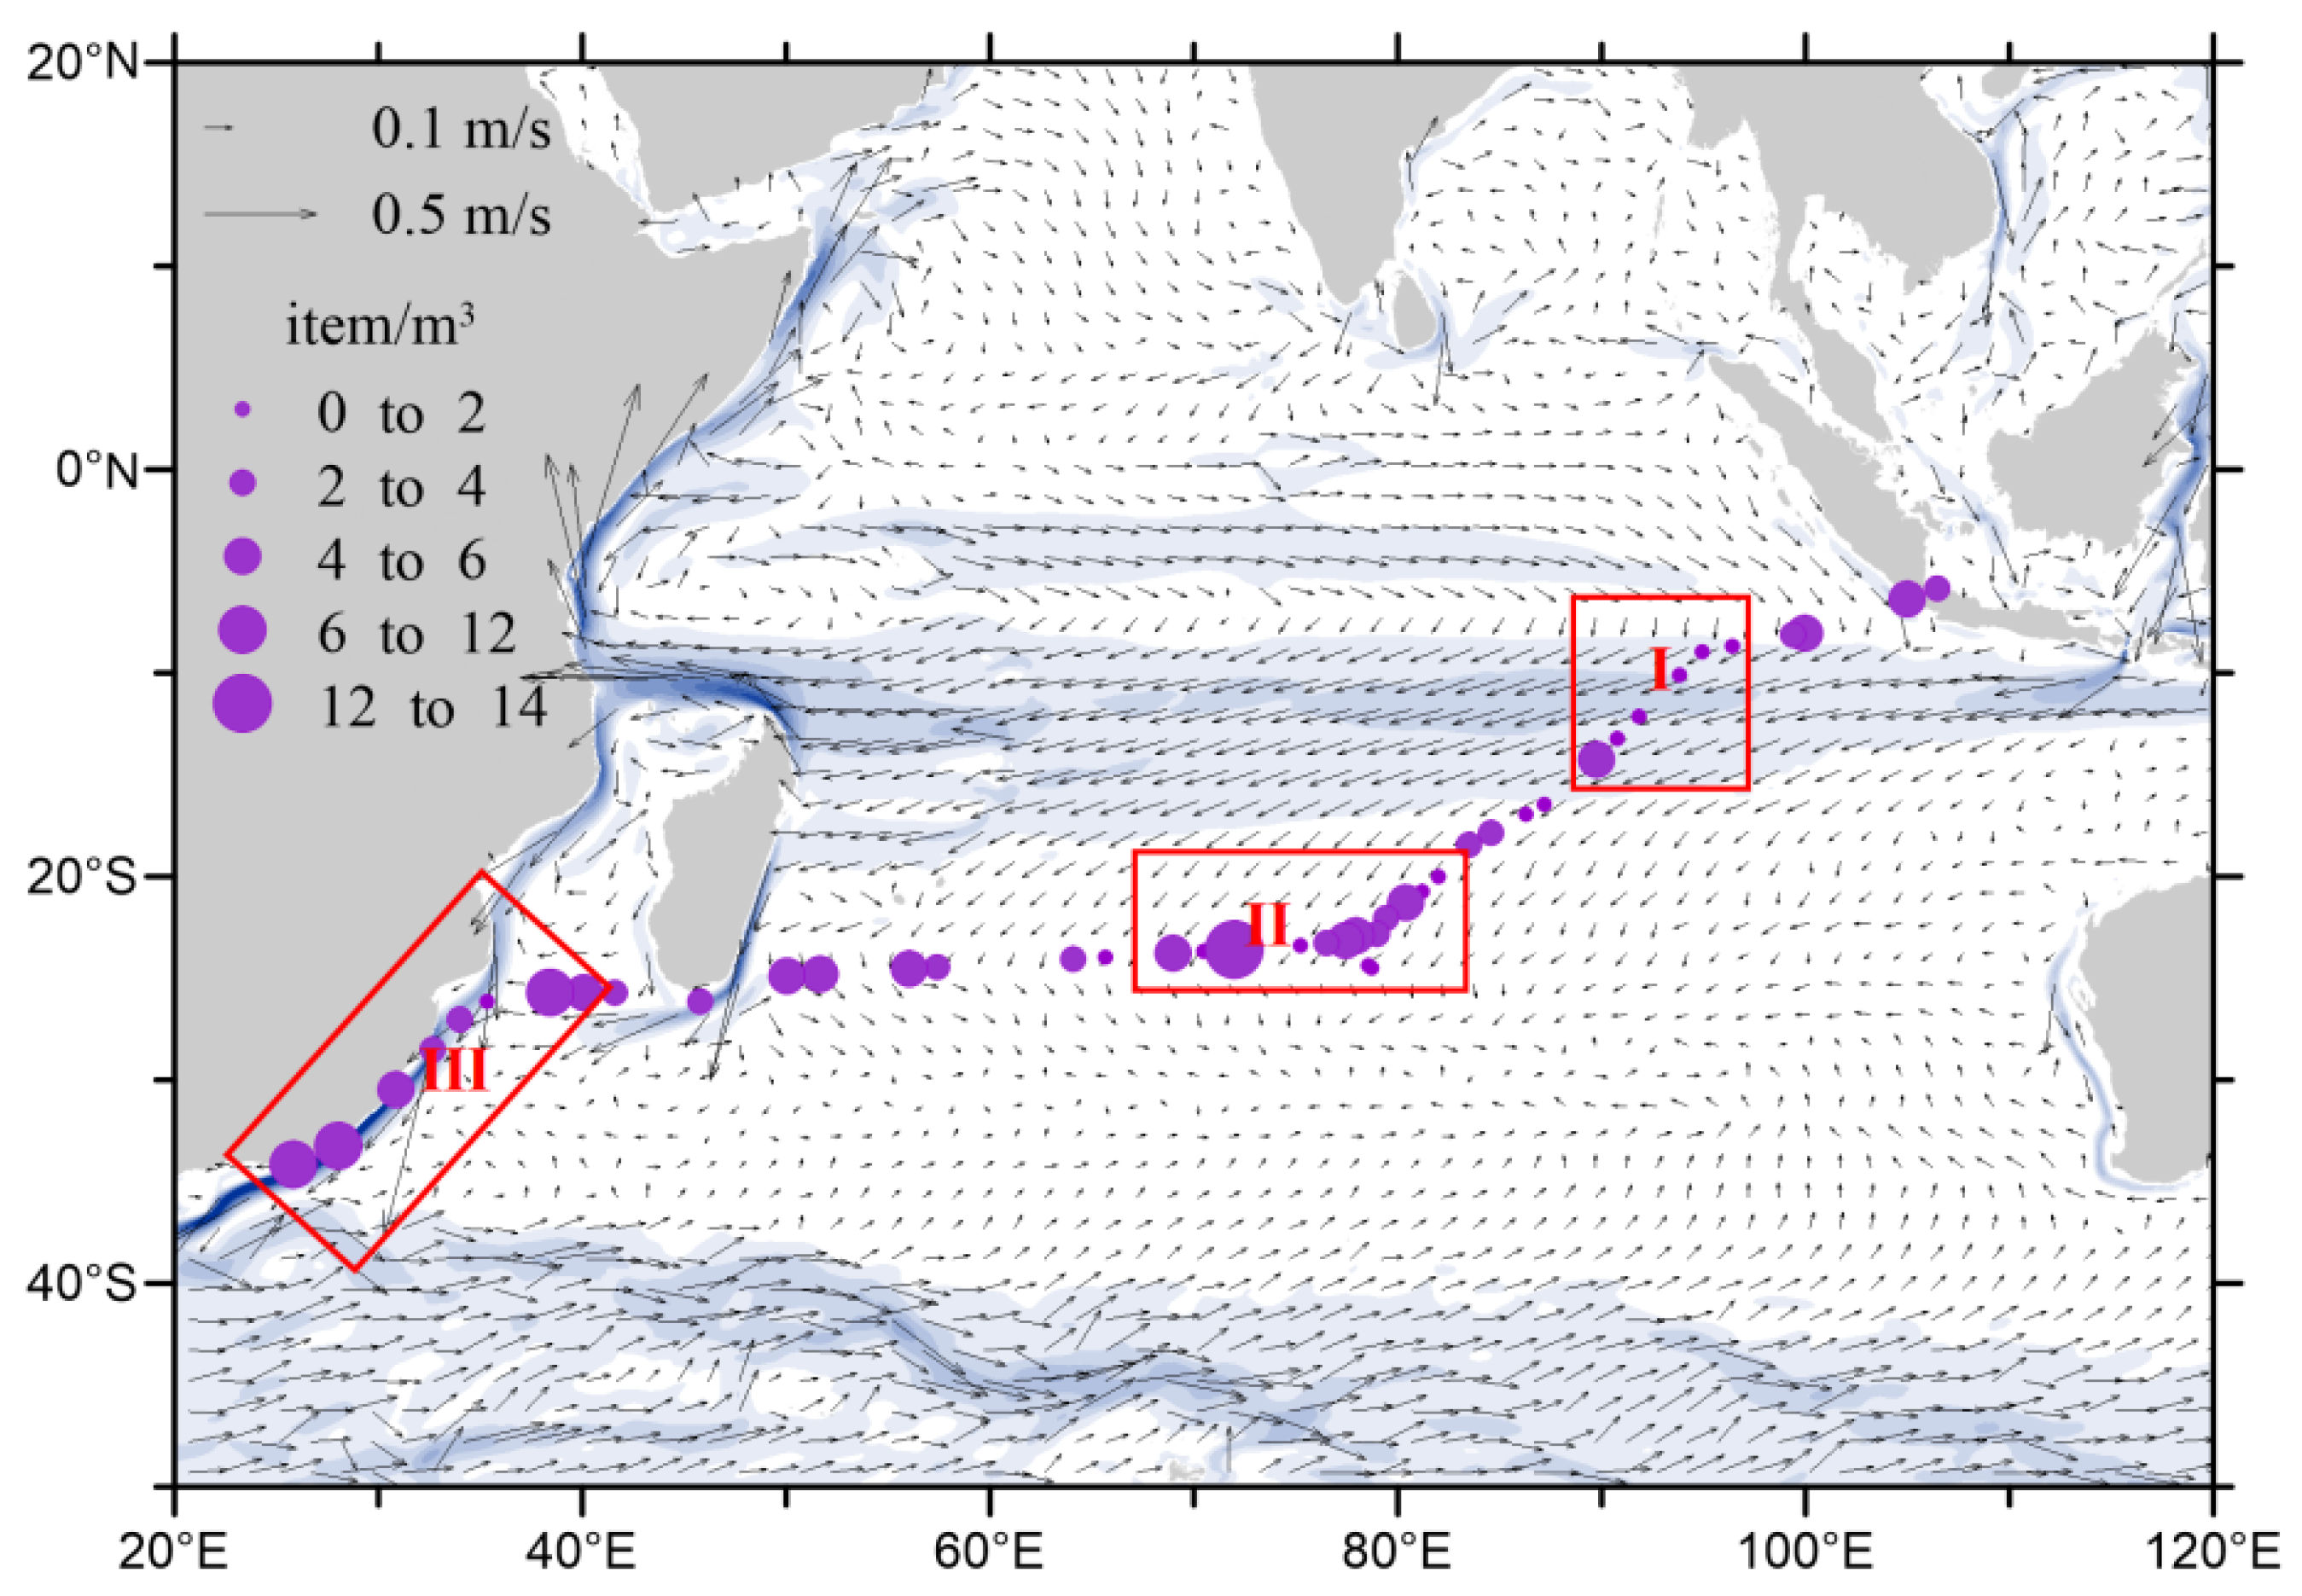
3.2. Effects of Ocean Currents on the Distribution of Microplastics in the Indian Ocean

An in-depth study of the transfer process and influencing factors of microplastics in the marine environment is conducive to accurately judging the convergence and fate of microplastics in the ocean. Microplastics have floatability and move with ocean currents. The transfer or diffusion of microplastics in the ocean is greatly affected by the flow direction of ocean currents. Previous studies showed that ocean currents could affect the spatial distribution of microplastics in seawater [57]. The sea surface rotation at low latitudes may have an effect on the abundance distribution of microplastics in the southern Indian Ocean [58]. In the study of the distribution of microplastics in the north Atlantic subtropical circulation region, Brach et al. [59] found that the mesoscale eddies had agglomeration and transport effects on microplastics, and the abundance of microplastics in the anticyclonic vortex region was 9.4 times higher than that in the cyclonic vortex region. Both currents were relatively strong in this studied area, with south Equatorial Current to the north and westerly drift to the south(blue in Figure 7). Weak upper circulation and convergence were found in the central area of the studied area. Figure 7 shows the correlation between the abundance distribution of microplastics and the upper layer ocean circulation. We found that the Indian Ocean layer ocean circulation had an obvious effect on the spatial distribution of microplastics, as follows:
Area I had a strong equatorial warm ocean current, and the abundance of microplastics in the area was low, with an average abundance of about 0.9 items/m3. We found that microplastics were not easy to agglomerate in the high ocean current water due to the impact of strong ocean currents.
In Area II, the ocean circulation intensity was relatively weak, and the ocean circulation direction was turning and gyrating. Thus, a convergence area existed here. Thus, microplastics in the area tended to agglomerate, and the abundance of microplastics tended to increase, with an average abundance of microplastics of 2.1 items/m3.
Area III is close to the African continent. The distribution of microplastics showed relatively high abundance in the coastal region of South Africa and an increasing trend with the direction of the ocean current. A convergence area of the ocean current existed in the edge of westerly drift near the South African continent, and the abundance of microplastics in this region was also relatively high, with an average abundance of microplastics of 3.5 items/m3. The distribution characteristics of microplastics in Areas II and III revealed that ocean current convergence had an effect on microplastic agglomeration.

4. Conclusions

Continuous fragmentation of plastic waste in the ocean garbage patch and the impact of human activities would lead to the threat of microplastics to the marine ecological environment. We found that the distribution characteristics of microplastics in the southern Indian Ocean showed zonal fluctuation and uneven regional abundance distribution pattern. The abundance of microplastics was relatively high in regions adjacent to the African continent and in the Indian Ocean garbage patch, which showed that the distribution of microplastics in the Indian Ocean may be affected by the continent-sourced input, and the oceanic garbage patch may also contribute to the current abundance of microplastics. The results showed that the average abundance of microplastics in the Indian Ocean gyre region was relatively high, which confirmed that ocean currents had agglomeration and transport effects on microplastics. However, the abundance data of microplastics in the open ocean remain insufficient. More studies and surveys should be comprehensively and systematically carried out to study the ecological harm caused by the presence of microplastics in the ocean and their transfer law in the environment. In the future, the accumulation of monitoring data of microplastics in the ocean needs to be strengthened, but the methods of sample collection and detection of microplastics are also required to reach standardization. In this study, the peristalsis pump sampling method can realize the continuous collection of microplastics in the vast open ocean, which can increase a large number of microplastic samples during the voyage. In addition, the effects of cracking, polymerization, and adhesion on the transport of microplastics based on simulation experiments should be investigated. New physical models for microplastics should be constructed to accurately predict the transfer of microplastics in the ocean, such as a hydrodynamic module and a environmental process module for microplastics.

Author Contributions

Conceptualization, J.L.; methodology, J.L.; software, J.L. and C.Z.; validation, J.L., F.G. and D.Z.; formal analysis, J.L., D.Z. and F.G.; investigation, D.Z. and W.C.; data curation, J.L. and F.G.; writing—original draft preparation, J.L.; writing—review and editing, J.L. and F.G.; visualization, D.Z. and W.C.; supervision, J.L.; project administration, J.L.; funding acquisition, J.L. All authors have read and agreed to the published version of the manuscript.

Funding

This work was supported by the Basic Scientific Fund for National Public Research Institutes of China (No. 2020Q10); the Natural Science Foundation of Shandong Province, China(No. ZR2021MD079); Investigation and Evaluation of Microplastics in Seawater (No. ZY0721004); The Global Change and Air–sea Interaction Program (GASI-01-WIND-STwin).

Institutional Review Board Statement

Not applicable.

Informed Consent Statement

Not applicable.

Data Availability Statement

The data that support the findings of this study are available within the article.

Conflicts of Interest

The authors declare no conflict of interest.

References

  1. Jambeck, J.R.; Geyer, R.; Wilcox, C.; Siegler, T.R.; Perryman, M.; Andrady, A.; Narayan, R.; Law, K.L. Plastic waste inputs from land into the ocean. Science 2015, 347, 768–771. [Google Scholar] [CrossRef]
  2. Moore, C.J.; Moore, S.L.; Leecaster, M.K.; Weisberg, S.B. A comparison of plastic and plankton in the north Pacific central gyre. Mar. Pollut. Bull. 2001, 42, 1297–1300. [Google Scholar] [CrossRef]
  3. Law, K.L.; Morét-Ferguson, S.E.; Goodwin, D.S.; Zettler, E.R.; Deforce, E.; Kukulka, T.; Proskurowski, G. Distribution of surface plastic debris in the eastern Pacific Ocean from an 11-year data set. Environ. Sci. Technol. 2014, 48, 4732–4738. [Google Scholar] [CrossRef]
  4. Barnes, D.K. A Natural and plastic flotsam stranding in the Indian ocean. J. R. Ir. Acad. 2004, 3, 193–205. [Google Scholar]
  5. Law, K.L.; Morétferguson, S.; Maximenko, N.A.; Proskurowski, G.; Peacock, E.E.; Hafner, J.; Reddy, C.M. Plastic accumulation in the North Atlantic subtropical gyre. Science 2010, 329, 1185–1188. [Google Scholar] [CrossRef] [Green Version]
  6. Cózar, A.; Echevarría, F.; González-Gordillo, J.I.; Irigoien, X.; Duarte, C.M. Plastic debris in the open ocean. Proc. Natl. Acad. Sci. USA 2014, 111, 10239–10244. [Google Scholar] [CrossRef] [Green Version]
  7. Thompson, R.C.; Olsen, Y.; Mitchell, R.P.; Mitchell, R.P.; Davis, A.; Rowland, S.J.; John, A.W.G.; Mcgonigle, d.; Russell, A.E. Lost at Sea: Where Is All the Plastic? Science 2004, 304, 838. [Google Scholar] [CrossRef]
  8. Gouin, T.; Roche, N.; Lohmann, R.; Hodges, G. A thermodynamic approach for assessing the environmental exposure of chemicals absorbed to microplastic. Environ. Sci. Technol. 2011, 45, 1466–1472. [Google Scholar] [CrossRef]
  9. Brennecke, D.; Duarte, B.; Paiva, F.; Caçador, I.; Canning-Clode, J. Microplastics as vector for heavy metal contamination from the marine environment. Estuar. Coast. Shelf Sci. 2016, 178, 189–195. [Google Scholar] [CrossRef]
  10. Teuten, E.L.; Saquing, J.M.; Knappe, D.R.U.; Barlaz, M.A.; Jonsson, S.; Bjorn, A.; Rowland, S.J.; Thompson, R.C.; Galloway, T.S.; Yamashita, R. Transport and release of chemicals from plastics to the environment and to wildlife. Philos. Trans. R. Soc. B Biol. Sci. 2009, 364, 2027–2045. [Google Scholar] [CrossRef] [Green Version]
  11. Wang, J.Y.; Lin, X.Z. Global ocean governance in addressing plastic and microplastic pollution. Pac. J. 2018, 4, 79–87. [Google Scholar]
  12. Li, D.J.; Zhu, L.X.; Chang, S.Y.; Zhang, F.; Wang, L. State of marine microplastic pollution research and the limitations. J. East China Norm. Univ. 2019, 3, 174–185. [Google Scholar]
  13. Sun, C.J.; Jiang, F.H.; Li, J.X.; Zheng, L. The Research Progress in Source, Distribution, Ecological and Environmental Effects of Marine Microplastics. Adv. Mar. Sci. 2016, 34, 449–461. [Google Scholar]
  14. Zhao, Z.K.; Zhao, L.R.; Chen, C.L.; Sheng, K.E.; Zhang, J.B.; Liang, Y.Q. Research status and problems of marine microplastics. J. Guangdong Ocean Univ. 2018, 38, 99–106. [Google Scholar]
  15. Auta, H.S.; Emenike, C.U.; Fauziah, S.H. Distribution and importance of microplastics in the marine environment: A review of the sources, fate, effects, and potential solutions. Environ. Int. 2017, 102, 165–176. [Google Scholar] [CrossRef]
  16. Goldstein, M.C.; Rosenberg, M.; Cheng, L. Increased oceanic microplastic debris enhances oviposition in an endemic pelagic insect. Biol. Lett. 2012, 8, 817–820. [Google Scholar] [CrossRef] [Green Version]
  17. Collignon, A.; Hecq, J.H.; Glagani, F.; Voisin, P.; Goffart, A. Neustonic microplastic and zooplankton in the North Western Mediterranean Sea. Mar. Pollut. Bull. 2012, 64, 861–864. [Google Scholar] [CrossRef] [Green Version]
  18. Abayomi, O.A.; Range, P.; Al-Ghouti, M.A.; Obbard, J.P.; Almmer, S.H.; Ben-Hamadou, R. Microplastics in coastal environments of the Arabian Gulf. Mar. Pollut. Bull. 2017, 124, 181–188. [Google Scholar] [CrossRef]
  19. Zhang, W.W.; Zhang, S.F.; Wang, J.Y.; Wang, Y.; Mu, J.L. Microplastic pollution in the surface waters of the Bohai Sea, China. Environ. Pollut. 2017, 231, 541–548. [Google Scholar] [CrossRef]
  20. Dai, Z.F.; Zhang, H.B.; Zhou, Q.; Tian, Y.; Chen, T.; Tu, C.; Fu, C.C.; Luo, Y.M. Occurrence of microplastics in the water column and sediment in an inland sea affected by intensive anthropogenic activities. Environ. Pollut. 2018, 242, 1557–1565. [Google Scholar] [CrossRef]
  21. Zhu, L.; Bai, H.Y.; Chen, B.J.; Sun, X.M.; Qu, K.M.; Xia, B. Microplastic pollution in North Yellow Sea, China: Observations on occurrence, distribution and identification. Sci. Total Environ. 2018, 636, 20–29. [Google Scholar] [CrossRef]
  22. Zhao, S.Y.; Zhu, L.X.; Wang, T.; Li, D.J. Suspended microplastics in the surface water of the Yangtze Estuary System, China: First observations on occurrence, distribution. Mar. Pollut. Bull. 2014, 86, 562–568. [Google Scholar] [CrossRef]
  23. Peng, G.Y.; Zhu, B.S.; Yang, D.Q.; Su, L.; Shi, H.H.; Li, D.J. Microplastics in sediments of the Changjiang Estuary, China. Environ. Pollut. 2017, 225, 283–290. [Google Scholar] [CrossRef]
  24. Zhang, K.; Xiong, X.; Hu, H.J.; Wu, C.X.; Bi, Y.H.; Wu, Y.H.; Zhou, B.S.; Kwan-Sing, P.; Lam, J.T.; Wu, Y.H.; et al. Occurrence and characteristics of microplastic pollution in Xiangxi Bay of Three Gorges Reservoir, China. Environ. Sci. Technol. 2017, 51, 3794–3801. [Google Scholar] [CrossRef]
  25. Sun, X.X.; Liu, T.; Zhu, M.L.; Liang, J.H.; Zhao, Y.F.; Zhang, B. Retention and characteristics of microplastics in natural zooplankton taxa from the East China Sea. Sci. Total Environ. 2018, 640, 232–242. [Google Scholar] [CrossRef]
  26. Zhou, P.; Huang, C.G.; Fang, H.D.; Cai, W.X.; Li, D.M.; Li, X.M.; Yu, H.S. The abundance, composition and sources of marine debris in coastal seawaters or beaches around the northern South China Sea (China). Mar. Pollut. Bull. 2011, 62, 1998–2007. [Google Scholar] [CrossRef]
  27. Sun, X.X.; Li, Q.J.; Zhu, M.L.; Liang, J.H.; Zheng, S.; Zhao, Y.F. Ingestion of microplastics by natural zooplankton groups in the northern South China Sea. Mar. Pollut. Bull. 2017, 115, 217–224. [Google Scholar] [CrossRef]
  28. Cai, M.G.; He, H.X.; Liu, M.Y.; Li, S.W.; Tang, G.W.; Wang, W.M.; Huang, P.; Wei, G.; Lin, Y.; Chen, B.; et al. Lost but can’t be neglected: Huge quantities of small microplastics hide in the South China Sea. Sci. Total Environ. 2018, 633, 1206–1216. [Google Scholar] [CrossRef]
  29. Lusher, A.L.; Tirelli, V.; O’connor, I.; Officer, R. Microplastics in Arctic polar waters: The first reported values of particles in surface and sub-surface samples. Sci. Rep. 2015, 5, 14947. [Google Scholar] [CrossRef] [Green Version]
  30. Wang, S.M.; Chen, H.Z.; Zhou, X.W.; Tian, Y.Q.; Lin, C.; Wang, W.L.; Zhou, K.W.; Zhang, Y.B.; Lin, H. Microplastic abundance, distribution and composition in the mid-west Pacific Ocean. Environ. Pollut. 2020, 264, 114125. [Google Scholar] [CrossRef]
  31. Schott, F.A.; McCreary, J.P. The monsoon circulation of the Indian Ocean. Prog. Oceanogr. 2001, 51, 1–123. [Google Scholar] [CrossRef]
  32. Garternicht, U.; Schott, F. Heat fluxes of the Indian Ocean from a global eddy-resolving model. J. Geophys. Res. 1994, 21, 147–159. [Google Scholar] [CrossRef] [Green Version]
  33. Wang, Y.; Cui, F.J. The structure and seasonal variation of upper-lakyer currents at central equatorial Indian ocean. Oceanol. Limnol. Sin. 2015, 46, 241–247. [Google Scholar]
  34. Jia, X.L.; Li, C.Y. Dipole oscillation in the Southern Indian Ocean and its impacts on climate. Chin. J. Geophys. 2005, 48, 1238–1249. [Google Scholar] [CrossRef]
  35. Connan, M.; Perold, V.; Dilley, B.J.; Barbraud, C.; Ryan, P.G. The Indian Ocean ‘garbage patch’: Empirical evidence from floating macro-litter. Mar. Pollut. Bull. 2021, 169, 112559. [Google Scholar] [CrossRef]
  36. Miraji, H.; Ripanda, A.; Moto, E. A review on the occurrences of persistent organic pollutants in corals, sediments, fish and waters of the Western Indian Ocean. Egypt J. Aquat. Res. 2021, 47, 373–379. [Google Scholar] [CrossRef]
  37. Hidalgo-Ruz, V.; Gutow, L.; Thompson, R.C.; Thiel, M. Microplastics in the marine environment: A review of the methods used for identification and quantification. Environ. Sci. Technol. 2012, 46, 3060–3075. [Google Scholar] [CrossRef]
  38. Browne, M.A.; Crump, P.; Niven, S.J.; Teuten, E.; Tonkin, A.; Galloway, T.; Thompson, R.C. Accumulation of microplastic on shorelines woldwide: Sources and sinks. Environ. Sci. Technol. 2011, 45, 9175–9179. [Google Scholar] [CrossRef]
  39. Gies, E.A.; LeNoble, J.L.; Noël, M.; Etemadifar, A.; Bishay, F.; Hall, E.R.; Ross, P.S. Retention of microplastics in a major secondary wastewater treatment plant in Vancouver, Canada. Mar. Pollut. Bull. 2018, 133, 553–561. [Google Scholar] [CrossRef]
  40. Liu, K.; Wang, X.H.; Fang, T.; Xu, P.; Zhu, L.X. Source and potential risk assessment of suspended atmospheric microplastics in Shanghai. Sci. Total Environ. 2019, 675, 462–471. [Google Scholar] [CrossRef]
  41. Dris, R.; Gasperi, J.; Saad, M.; Mirande-Bret, C.; Tassin, B. Synthetic fibers in atmospheric fallout: A source of microplastics in the environment? Mar. Pollut. Bull. 2016, 104, 290–293. [Google Scholar] [CrossRef]
  42. Boucher, J.; Friot, D. Primary Microplastics in the Oceans: A Global Evaluation of Sources; IUCN: Gland, Switzerland, 2017. [Google Scholar]
  43. Chen, G.X.; Han, W.Q.; Li, Y.L.; McPhaden, M.J.; Chen, J.; Wang, W.Q.; Wang, D.X. Strong intraseasonal variability of meridional currents near 5° N in the eastern Indian Ocean: Characteristics and causes. J. Phys. Oceanogr. 2017, 47, 979–998. [Google Scholar] [CrossRef]
  44. Xuan, L.L.; Qiu, Y.; Xu, J.D.; Zeng, M.Z. Seasonal variation of surface-layer circulation in the eastern tropical Indian Ocean. J. Trop. Oceanogr. 2014, 33, 26–35. [Google Scholar]
  45. Mason, S.A.; Garneau, D.; Sutton, R.; Chu, Y.; Ehmann, K.; Barnes, J.; Fink, P.; Papazissimos, D.; Rogers, D.L. Microplastic pollution is widely detected in US municipal wastewater treatment plant effluent. Environ. Pollut. 2016, 218, 1045–1054. [Google Scholar] [CrossRef]
  46. Sun, J.; Dai, X.H.; Wang, Q.L.; Mark, C.M.; Loosdrecht, V.; Ni, B.J. Microplastics in wastewater treatment plants: Detection, occurrence and removal. Water Res. 2019, 152, 21–37. [Google Scholar] [CrossRef]
  47. Cole, M.; Lindeque, P.; Halsband, C.; Galloway, T.S. Microplastics as contaminants in the marine environment: A review. Mar. Pollut. Bull. 2011, 62, 2588–2597. [Google Scholar] [CrossRef]
  48. Browne, M.A. Sources and Pathways of Microplastics to Habitats. In Marine Anthropogenic Litter; Springer: Berlin/Heidelberg, Germany, 2015. [Google Scholar]
  49. Nel, H.A.; Froneman, P.W. A quantitative analysis of microplastic pollution along the south-eastern coastline of South Africa. Mar. Pollut. Bull. 2015, 101, 274–279. [Google Scholar] [CrossRef]
  50. Li, C.J.; Zhu, L.X.; Wang, X.H.; Liu, L.; Li, D.J. Cross-oceanic distribution and origin of microplastics in the subsurface water of the South China Sea and Eastern Indian Ocean. Sci. Total Environ. 2022, 805, 150243. [Google Scholar] [CrossRef]
  51. Catarino, A.I.; Thompson, R.; Sanderson, W.; Henry, T.B. Development and optimization of a standard method for extraction of microplastics in mussels by enzyme digestion of soft tissues. Environ. Toxicol. Chem. 2017, 36, 947–951. [Google Scholar] [CrossRef]
  52. Ding, J.F.; Li, J.X.; Sun, C.J.; Jiang, F.H.; Ju, P.; Qu, L.Y.; Zheng, Y.F.; He, C.F. Detection of microplastics in local marine organisms using a multi-technology system. Anal. Methods. 2018, 11, 78–87. [Google Scholar] [CrossRef]
  53. Lusher, A.L.; Burke, A.; O’Connor, I.; Officer, R. Microplastic pollution in the Northeast Atlantic Ocean: Validated and opportunistic sampling. Mar. Pollut. Bull. 2014, 88, 325–333. [Google Scholar] [CrossRef]
  54. Kanhai, L.D.K.; Officer, R.; Lyashevska, O.; Thompson, R.C.; O’Connor, I. Microplastic abundance, distribution and composition along a latitudinal gradient in the Atlantic Ocean. Mar. Pollut. Bull. 2016, 115, 307–314. [Google Scholar] [CrossRef]
  55. Cincinelli, A.; Scopetani, C.; Chelazzi, D.; Lombardini, E.; Martellini, T.; Katsoyiannis, A.; Fossi, M.C.; Corsolini, S. Microplastic in the surface waters of the Ross Sea (Antarctica): Occurrence, distribution and characterization by FTIR. Chemosphere 2017, 175, 391–400. [Google Scholar] [CrossRef]
  56. Koongolla, J.B.; Andrady, A.L.; Kumara, P.T.; Gangabadage, C.S. Evidence of microplastics pollution in coastal beaches and waters in southern Sri Lanka. Mar. Pollut. Bull. 2018, 137, 277–284. [Google Scholar] [CrossRef]
  57. Pan, Z.; Guo, H.G.; Chen, H.Z.; Wang, S.M.; Sun, X.W.; Zou, Q.P.; Zhang, Y.B.; Lin, H.; Cai, S.Z.; Huang, J. Microplastics in the Northwestern Pacific: Abundance, distribution, and characteristics. Sci. Total Environ. 2019, 650, 1913–1922. [Google Scholar] [CrossRef]
  58. Waller, C.L.; Griffiths, H.J.; Waluda, C.M.; Thorpe, S.E.; Loaiza, I.; Moreno, B.; Pacherres, C.O.; Hughes, K.A. Microplastics in the Antarctic marine system: An emerging area of research. Sci. Total Environ. 2017, 598, 220–227. [Google Scholar] [CrossRef] [PubMed] [Green Version]
  59. Brach, L.; Deixonne, P.; Bernard, M.F.; Durand, E.; Desjean, M.C.; Perez, E.; Sebille, E.V.; Halle, A. Anticyclonic eddies increase accumulation of microplastic in the North Atlantic subtropical gyre. Mar. Pollut. Bull. 2018, 126, 191–196. [Google Scholar] [CrossRef] [Green Version]
Figure 1. Morphology of microplastics and infrared spectra of microplastics.
Jmse 10 00290 g001
Figure 2. Sampling sites and abundance distribution of microplastics (“·” sampling stations).
Jmse 10 00290 g002
Figure 3. Characteristic information of polymers, particle size, and color of all microplastics.
Jmse 10 00290 g003
Figure 4. Longitudinal interval abundance of microplastics. Black dot “·” is the maximum value of the data set.
Jmse 10 00290 g004
Figure 5. Polymer (a) and color (b) characteristics of microplastics.
Jmse 10 00290 g005
Figure 6. Particle size distribution characteristics of microplastics. (Red dot “·” is the average size of all microplastics. Black dot “·” is the size of each microplastics).
Jmse 10 00290 g006
Figure 7. Upper-layer ocean circulation and microplastic distribution in the Indian Ocean. (I, II and III are the different specific area).
Jmse 10 00290 g007
Table 1. Abundance of microplastics in different sea areas.
Study AreaSampling
Aperture
(μm)
Average
Abundance
(items/m3)
Main PolymerParticle Size
(mm)
Shape
Northeast Atlantic [54]2502.46Polyester, Nylon, Rayon0.2–43.2Fiber, Fragment,
Pellet, Foam
Atlantic [53]2501.15Polyester, polyamide, Rayon/Fiber, others
Arctic [29]3330.34Polyester, Polyamide, Polyethylene, Acrylic, Polyvinyl chloride, cellulose2.50–7.71Fiber, Fragment, Film
Ross sea [55]10.17Polyester, Polytetrafluoroethylene, Polymethyl methacrylate, Polyamide/Fiber, Fragment,
others
Southern waters of
Sri Lanka [56]
806.8Polyethylene, Polypropylene, polystyrene1.5–2.5Fragment, Fiber,
Pellet, Film
This study202.3Rayon, Polyethylene, Polyethylene terephthalate, Polyamide, Polyvinylidene Chloride0.11–4.70Fiber
Publisher’s Note: MDPI stays neutral with regard to jurisdictional claims in published maps and institutional affiliations.

