Review

Towards Risk Assessments of Microplastics in Bivalve Mollusks Globally

1
Institute of Coastal Environmental Pollution Control, Ministry of Education Key Laboratory of Marine Environment and Ecology, and College of Environmental Science and Engineering, Ocean University of China, Qingdao 266100, China
2
Key Laboratory of Marine Eco-Environmental Science and Technology, Marine Bioresource and Environment Research Center, First Institute of Oceanography, Ministry of Natural Resources (MNR), Qingdao 266061, China
3
Institute of Marine Science and Technology, Shandong University, Qingdao 266200, China
*
Authors to whom correspondence should be addressed.
J. Mar. Sci. Eng. 2022, 10(2), 288; https://doi.org/10.3390/jmse10020288
Submission received: 30 November 2021 / Revised: 27 December 2021 / Accepted: 1 February 2022 / Published: 19 February 2022
(This article belongs to the Special Issue Marine Microplastic)

Abstract

:
The ubiquitous presence of microplastics in bivalve mollusks and related risks have raised particular concerns. In this study, the available data on the abundance and polymer type of microplastics in bivalves from twenty-two countries were extracted to comprehensively understand the risks of microplastics in bivalves. Following the data from 52 peer-reviewed papers, the abundance, chemical composition, and human exposure risks of microplastics of bivalves among countries were initially assessed. Abundance risk results indicated that bivalves from 22 countries presented a low pollution load index, showing a lower risk level (level I). The polymer risk index (H) of bivalves from Portugal (Hcountry = 1335, level IV) and India (Hcountry = 1187, level IV) were higher than the other countries due to the occurrence of hazardous microplastics, such as polyvinyl chloride. For the human exposure risks, the global mean value of microplastic exposure to humans via mollusk consumption is estimated to be 751 microplastics/capita/year, with the maximum intake by the Chinese. This study suggests that abundance risk may be a fundamental indicator for assessing the potential hazard to humans until the chemical composition risks are confirmed. This study is the first attempt to assess the potential risks of microplastics in bivalves using three evaluation models based on microplastic abundances and polymer types, which will contribute to establishing future human health risk assessment frameworks. These findings will also assist efforts in policy-making to minimize microplastic risks in seafood.

1. Introduction

Microplastics (diameter < 5 mm) have emerged as a global concern due to their ubiquitous presence and interaction with biota. Microplastics are potentially bioavailable for marine organisms because of their similar size range to plankton [1]. Ingestion of microplastics by numerous species has been recorded across all levels of the marine food chain, ranging from tiny planktonic organisms to large mammals [2,3,4]. Microplastic ingestion by marine organisms may also provide a route for microplastic exposure to humans [5]. Therefore, all life, from ecosystems to humans, is growingly exposed to plastic waste with little knowledge of its full effects [6].
Among these marine organisms, bivalves belong to mollusks, such as scallops, oysters, clams, and mussels, which are abundant in the marine environment and of significance in the ecosystem functioning [7,8]. Bivalve mollusks feed by filtering seawater to make them direct exposure to microplastics in the water column [9]. Moreover, bivalves are essential prey for multiple marine organisms, including fish, birds, and mammals [8,10]. More importantly, bivalves are popular seafood for humans and are consumed whole without removing the digestive system. However, field investigations show that microplastics are commonly detected in bivalves from more than twenty countries [11]. One study focusing on the microplastic exposure risk evaluated the number of microplastics consumption by humans and estimated an annual microplastic consumption varying from 39,000 to 52,000 items [12]. Although the impact of consuming microplastics on human health is largely unknown, the potential harm has been suggested. Once microplastics enter the human digestive, they can release additives and adsorbed toxins, resulting in both physical and chemical stressors to the human system [12]. The microplastics on the scale of a few microns or less can further be taken up by cells [13]. Considering the ubiquity of microplastics in bivalves and the hazard to human health caused by microplastics, it thus is pivotal to put efforts toward a comprehensive risk assessment of microplastics in bivalves to obtain knowledge of the threat they might pose to the marine ecosystem and humans.
Presently, numerous studies focus on the environmental risk of microplastics [14,15,16,17,18,19,20]. For example, Everaert et al. [16] evaluated the ecological risks of microplastics in the marine environment. Xu et al. [18] estimated the microplastic pollution risk in the surface water of Changjiang Estuary based on the pollution load index and polymer risk index. However, there is a paucity of information about the risk assessment of microplastics in marine organisms [9,21]. These two studies assessed the human health risks posed by microplastics via seafood consumption using the polymer risk index. Overall, such microplastic risk assessments are composed of a pollution load risk, a chemical composition risk, an ecological risk, and an exposure risk, which aims to quantify the potential hazard caused by microplastics on human health and the environment. Herein the abundance and chemical composition of microplastics in bivalve mollusks globally is reviewed. This study aims to fully assess the abundance, polymer, and exposure risk of microplastics in bivalves globally to allow comparison between different countries. Our study will be expected to provide the baseline data for human sub-health early warning and human pathology research.

2. Methods

2.1. Literature Retrieval and Data Collection

We systematically reviewed studies on microplastic ingestion by bivalve mollusks between 2014 and 15 November 2021. Combinations of the following terms were used for literature retrieval on microplastics in bivalves in Google Scholar, Web of Science, and Science Direct: marine organism, mollusk, shellfish, bivalve mollusk, mussel, clam, oyster, scallop, microplastic, nano-plastic, and plastic ingestion.
The quality of the original searched studies was assessed with the use of the following criteria. (1) Only primary, peer-reviewed studies on microplastic pollution in bivalves were included for a more in-depth review. (2) Eligible studies that used one or more of the following four validated techniques for the identification of polymer composition of microplastics: Fourier-transform infrared spectroscopy (FT-IR) or μ-FT-IR, Raman spectroscopy, pyrolysis gas chromatography-mass spectrometry (pyrolysis-GC-MS), and scanning electron microscopy-energy dispersive spectroscopy (SEM-EDS), were included. (3) The use of quality assurance and quality check (QA/QC) procedures was also considered imperative for the literature screening. Studies that failed to use the procedural blank samples to quantify the external microplastic contamination were excluded. Additionally, articles that were not published in English were also excluded.
After screening, we extracted the quantitative (Supplementary Table S1; Figure 1) and qualitative (Figure 2) data from the studies that met the eligibility criteria set for this review. The microplastic abundances in bivalves expressed in the mass-based unit (items/g, wet weight) were considered. For studies that did not provide the microplastic abundance by tissue mass, these were converted using the number of microplastics and the wet weight of the soft tissue of bivalves. Papers were mentioned in this study but were not included for further analysis if they did not provide data to enable conversion to particles/g or if abundance data were only expressed as microplastics per gram of dry tissue. The abundance of microplastics in bivalves was used for the calculation of microplastic pollution load and human exposure risk. Considering the inclusion of cellulose-based polymers in some papers, combined with the absence of an explicit categorization framework of microplastics, we also involved cellulose-based polymers in this study, such as cellophane and rayon. The proportions of the following ten polymers were extracted: polyethylene terephthalate (PET), polyethylene (PE), rayon, polypropylene (PP), cellophane, polyester, polyamide (PA), polyvinyl chloride (PVC), polystyrene (PS), acrylic, or others. The percentages of microplastic polymers were used for the assessment of chemical composition risk.

2.2. Estimation of Microplastic Pollution Load Index

To compare the spatial difference of microplastic pollution in bivalves, the pollution load index (PLI), which was used by Xu et al. [18] to assess microplastic abundance in Changjiang Estuary, was also applied in our study. PLI is regarded as a standardized rule for monitoring the degree of pollution between different areas [22]. The PLI can be obtained from the following equation:
CFi = Ci/C0
P L I = C F i
P L I c o u n t r y = P L I 1 P L I 2 P L I n n
PLI is in relation to the microplastic abundance factor (CFi), which is the quotient of microplastic abundance in bivalve mollusks (Ci) to the minimal value (C0). The ideal C0 (0.040 items/g) is defined as the minimum average abundance of microplastics according to the screened literature [23]. Ci is the value of microplastic abundance (items/g) extracted from the “Mean number of microplastics per gram (items/g)” column in Table S1. The PLI in each country (PLIcountry) was calculated by the n root of the multiplication of all PLI. Since there are no grading criteria for microplastic abundance risk in bivalves, the degree of microplastic risk proposed by Xu et al. [18] was adopted in our study (Supplementary Table S2).

2.3. Assessment of Chemical Composition Risk

For the chemical risk assessment, the hazard scores of polymers from Lithner et al. [24] and the microplastic polymers are utilized as indexes for calculation. The model for the evaluation of chemical risk used by previous studies [9,18,21] is expressed as:
H c o u n t r y = P n ¯ × S n
where Hcountry corresponds to the chemical risk index of bivalve mollusks in each country, P ¯ n is the average value of the percentages of microplastic polymer types detected in bivalve mollusks from each country, and Sn is the hazard score from Lithner et al. [24] for the polymer compound that comprised microplastics (Supplementary Table S3). According to the risk level defined by Lithner et al. [24], the rank partition of chemical composition risk of microplastics presents in Supplementary Table S4.

2.4. Approach for the Estimation of Annual Dietary Intake of Microplastics via Shellfish Consumption

Based on the calculation method proposed by Cho et al. [5], the microplastic exposure risk via shellfish consumption by humans among global countries is estimated in our study. In brief, the estimation is carried out according to the abundance of microplastics in bivalve mollusks and shellfish consumption data. The abundances of microplastics in bivalves from different countries are derived from the “Mean number of microplastics per gram (items/g) in each country” column in Supplementary Table S1. Shellfish supply data from the Food and Agriculture Organization Corporate Statistical Database (FAOSTAT, http://www.fao.org/faostat/en/#data/FBS, accessed on 24 December 2021) are used for this estimation. The mean values of shellfish supply data (g/capita/year) from the year 2014 to 2018 in each country except South Korea (from Cho et al. [5]) are calculated based on the Food Balance Sheets from FAOSTAT and shown in Table 1. Eventually, by multiplying the average shellfish supply data with the average microplastic abundances in bivalve mollusks in each country, the annual dietary intake of microplastics via shellfish consumption is estimated among countries globally.

2.5. Statistical Analysis

Data analysis was implemented using SPSS 24.0 software and Microsoft Excel 2016. Risk data were analyzed to confirm whether they were normally distributed by fitting the Shapiro-Wilk’s test. To analyze the correlation between microplastic pollution load index and chemical composition index, the Spearman correlation analysis was applied in this study.

3. Results and Discussion

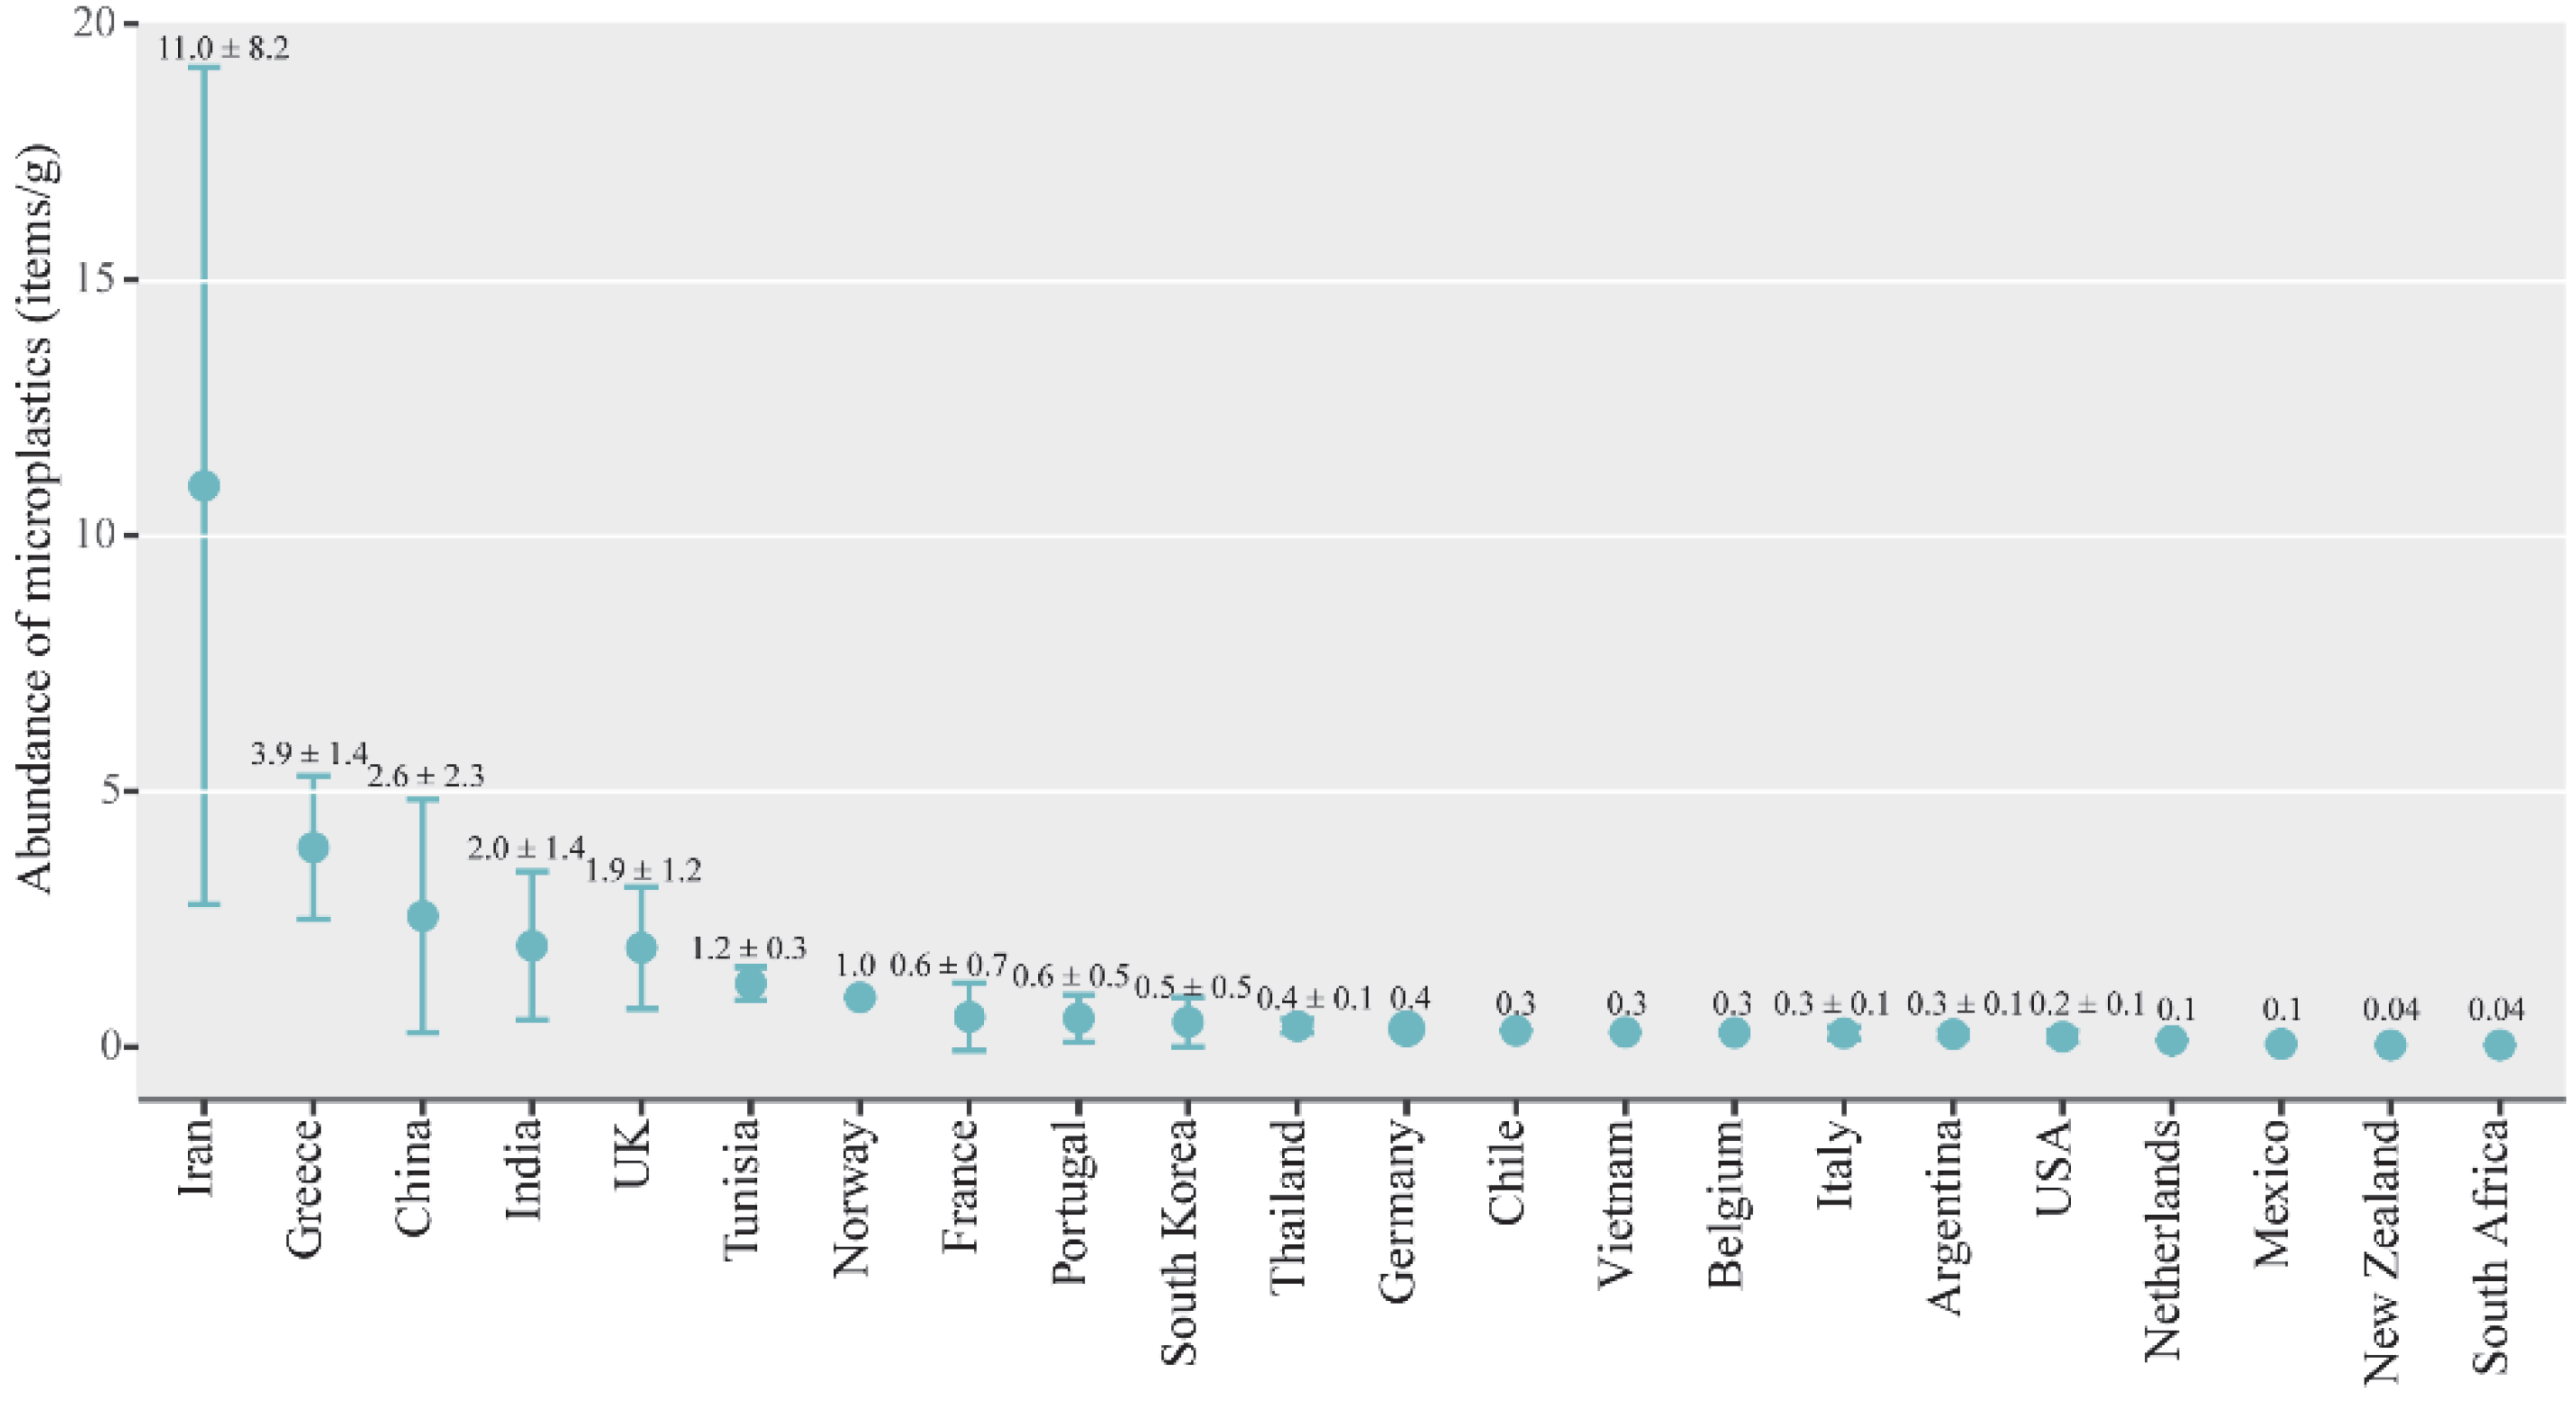
3.1. An Overview of the Occurrence of Microplastics in Bivalve Mollusks Globally

The first study on the extraction technique of microplastics from bivalves was published in 2013 [25]. However, the first data on microplastic ingestion by bivalve mollusks was obtained in 2014 by Van Cauwenberghe and Janssen [26]. The tendency during the last seven years reveals an increasing concern about microplastic contamination in bivalves worldwide, with particular attention from 2018. By the middle of November 2021, 72 studies regarding microplastics in bivalves globally had been published. Among these studies, a total of 61 studies that met the eligibility criteria set for studies were screened using for this study, but data from 52 studies concerning microplastic abundances in bivalves were included in the further analysis. The remaining five studies were excluded mainly because the authors did not provide gram-based abundance data (items/g, wet weight) [27,28,29,30,31]. In addition, one study published by Murphy [32], which calculated the abundance using microplastic numbers per gram unit, was also excluded in the subsequent analysis since the data deviated from the distribution range of abundance data. This study reported average values of microplastic abundance in wild bivalve mollusks between 39.2 and 138.0 items/g and farmed bivalves between 89.4 and 259.4 items/g [32]. Hence, the abundance of microplastics in bivalve mollusks reported in 52 studies was in the range of 0.04–20.0 items/g. Regarding the geographical origin of bivalves, the average microplastic abundance in bivalves was highest detected in Iran (11.0 ± 8.2 items/g), followed by Greece (3.9 ± 1.4 items/g). The microplastic abundances in bivalves from 22 countries are shown in Figure 1.
Available data concerning the polymeric composition of microplastics in bivalves stemmed from 33 studies. The distribution of microplastic polymers in bivalves from 14 countries is presented in Figure 2. Pooled prevalence data confirmed that PET was the most abundant polymer type in bivalves globally, with an average proportion of 20.4% ± 21.2%. The second most dominant polymer was PE (13.0% ± 19.2%), followed by rayon (9.0% ± 15.6%), PP (8.9% ± 13.3%), cellophane (8.0% ± 17.7%), polyester (7.0% ± 12.4%), and PA (5.3% ± 14.8%). It is not surprising the prevalence of PET, PE, and PP microplastics in bivalves since these traditional polymers are the most produced and used in the last decades [33,34,35]. The prevalence of these three polymers in bivalves is relatively consistent with the polymer types typically detected in the water and sediment [36,37,38,39]. Worthing notice is that 12 out of 33 studies reported a certain percentage of rayon, a modified natural polymer. Rayon also has been commonly detected as the predominant polymer in the sediments [40,41], indicating rayon observed in bivalves comes from the surrounding environments. The question, however, still exists whether materials derived from cellulose quantify as plastics. Since the cellulose-based polymer is heavily modified, it can be considered and included in the definition of the plastic polymer [42].

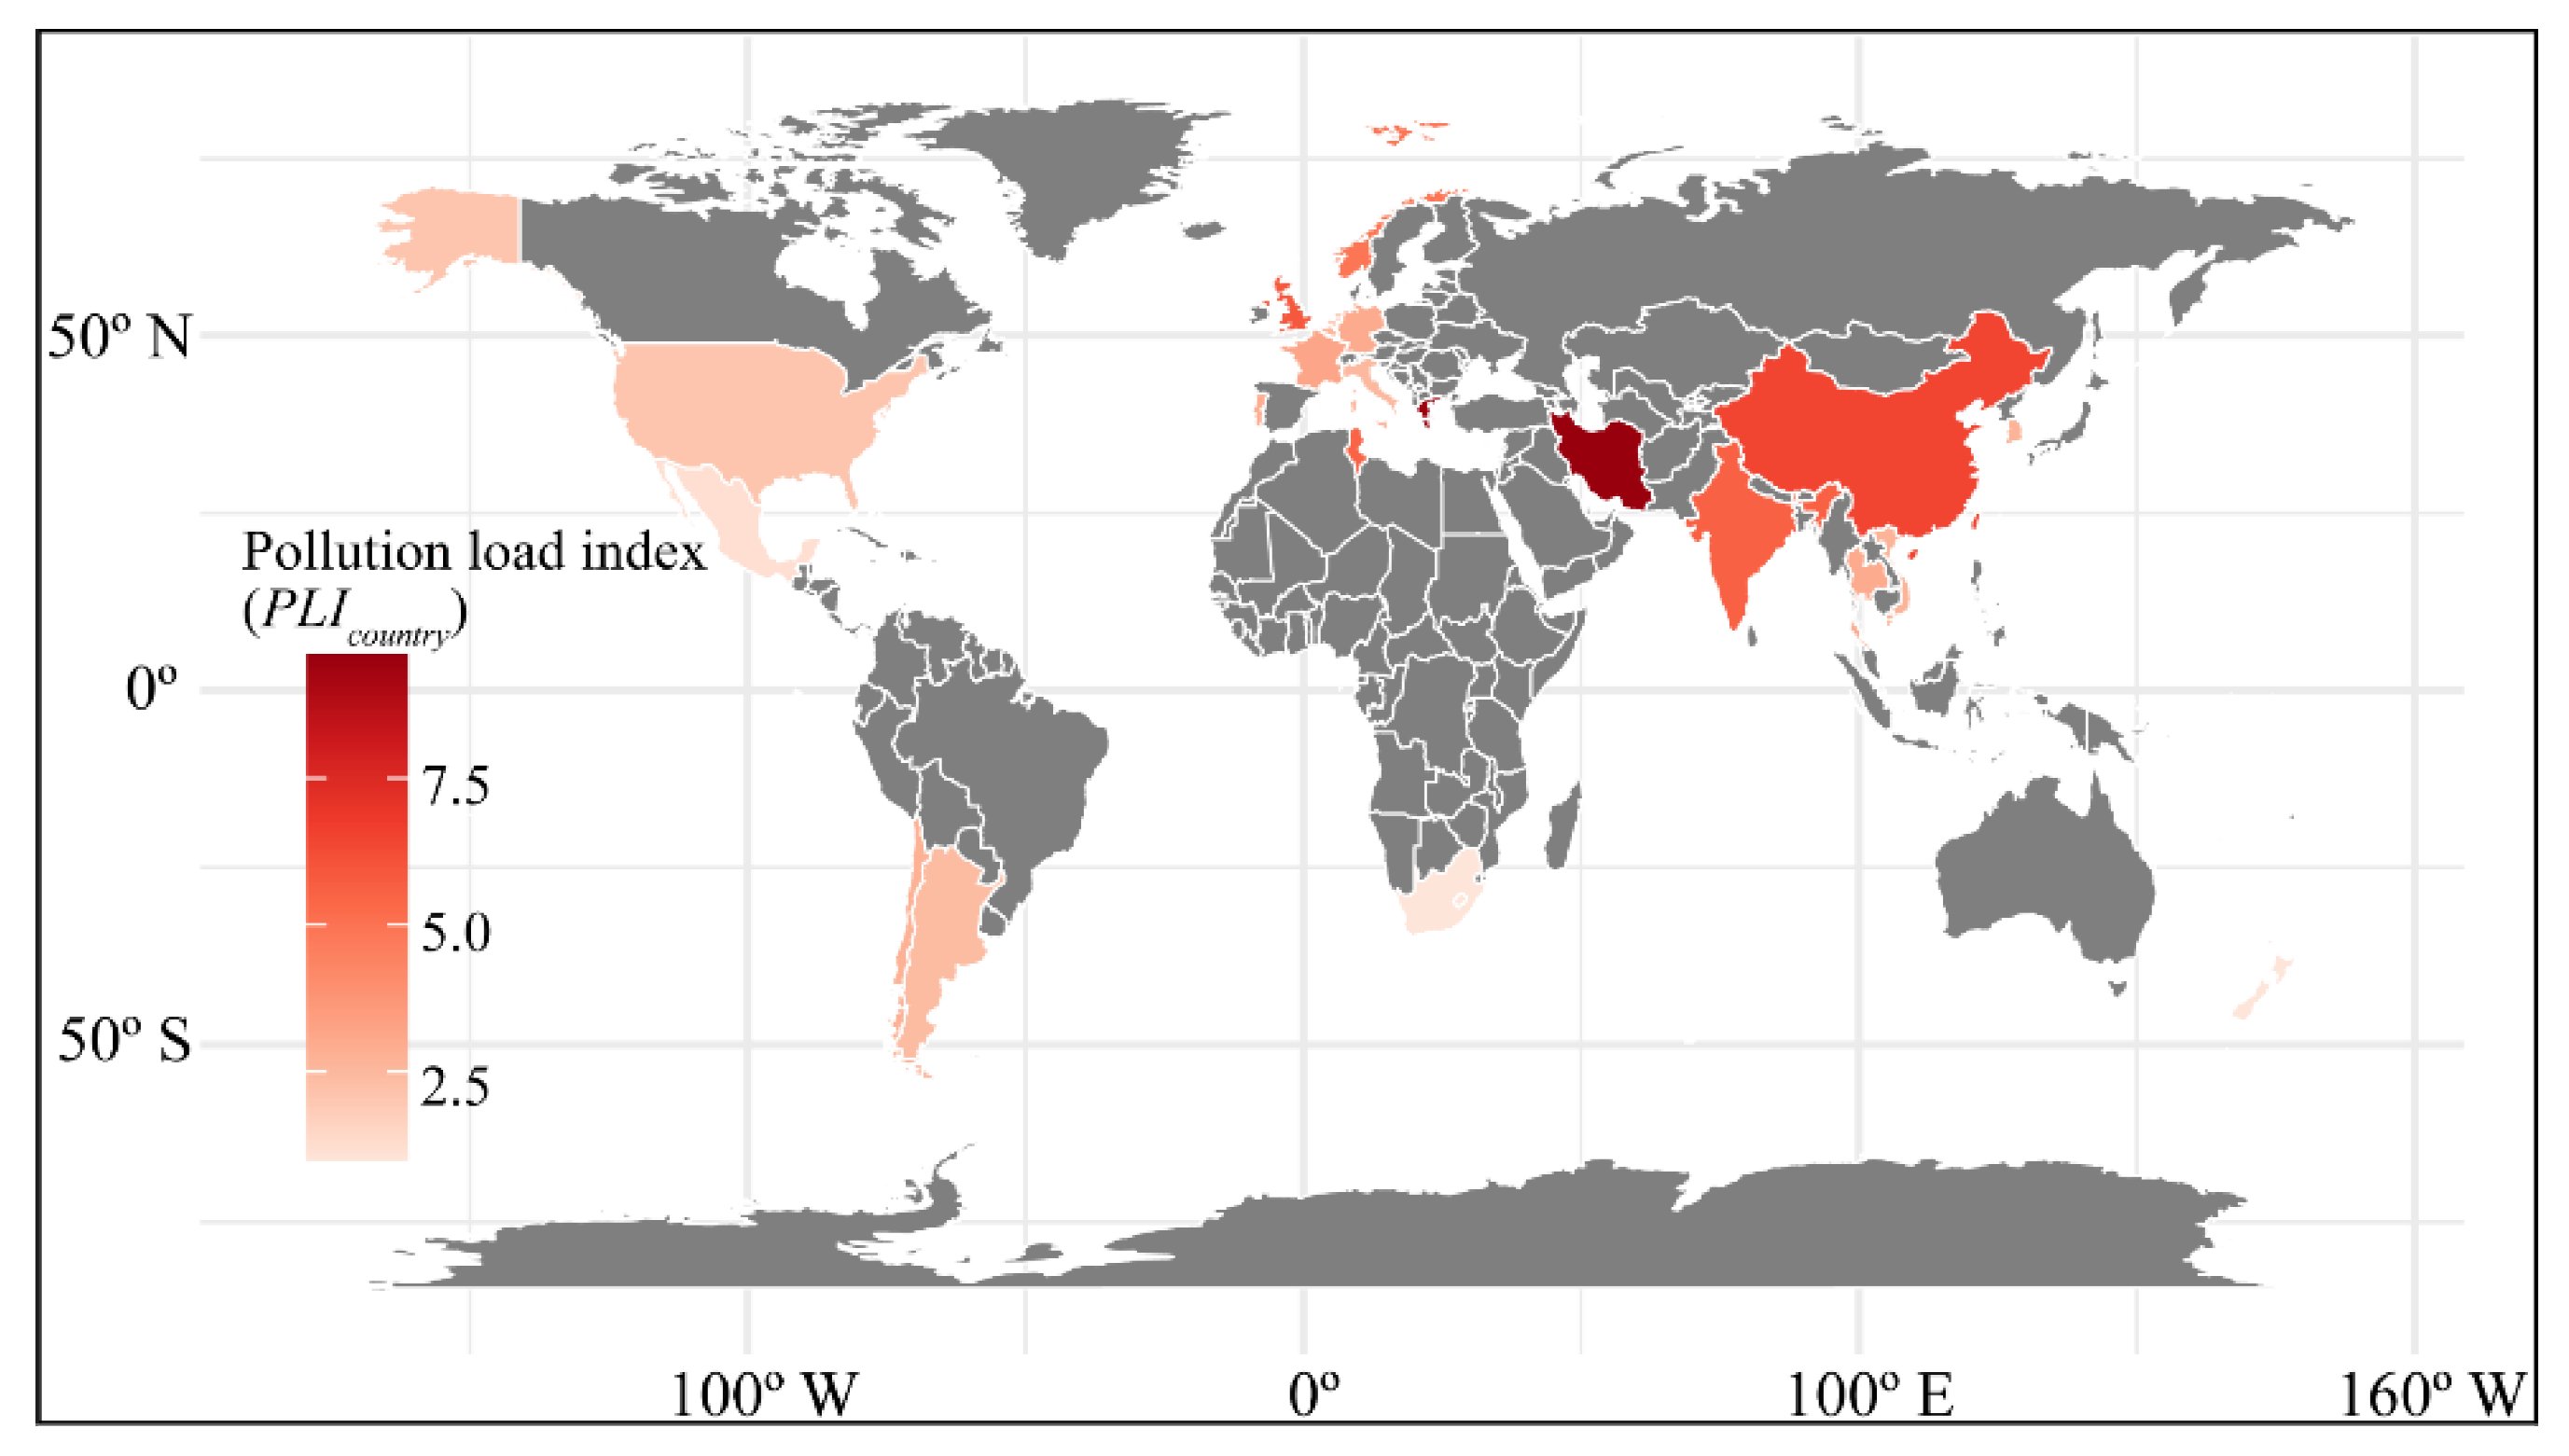
3.2. Comparison of Pollution Load Index of Microplastics in Bivalve Mollusks between Countries

Based on the results of PLI, the microplastic pollution loads in bivalves from 22 countries are presented in Figure 3. Bivalve mollusks from Iran contained the highest amount of microplastics (PLIcountry = 9.6), followed by Greece (9.5), China (6.5), the UK (5.9), India (5.6), Tunisia (5.5), Norway (4.9), France (3.2), Thailand (3.0), and Germany (3.0). The microplastic pollution loads in bivalves from the other 12 countries were smaller than 3, with PLIcountry results as follows: Portugal (2.9), Chile (2.8), South Korea (2.7), Vietnam (2.7), Belgium (2.6), Italy (2.5), Argentina (2.4), the USA (2.1), Netherlands (1.8), Mexico (1.2), New Zealand (1.0), and South Africa (1.0). According to the risk level criteria reported by Xu et al. [18], non-negligible microplastic abundance risks were found in bivalves from 22 countries, which were all assigned as level I. In total, the abundance risks of microplastics in bivalves globally showed spatial differences, but all represented minor risk levels.
Factors affecting this regional difference in microplastic pollution loads may come from different sources. First, the differences can be connected with the different pollution conditions of the environment where bivalves live [5]. Second, the methods discrepancy may affect the microplastic pollution loads in bivalves. Multiple methods are used for the extraction and identification of microplastics from bivalves. Third, the type of tissue to digest [43] and the digestion method of pooled or individually [44] can also contribute to the difference in microplastic pollution in bivalves. Since the data used to calculate the microplastic pollution load in bivalves represented a very limited spatial coverage of these countries due to limited studies available, the comparison of microplastic pollution in bivalves among global countries might be biased to some extent. Hence, more efforts toward harmonized methods for microplastic separation and identification are needed to obtain more comparable data on microplastic pollution in bivalves to cover more areas or countries.

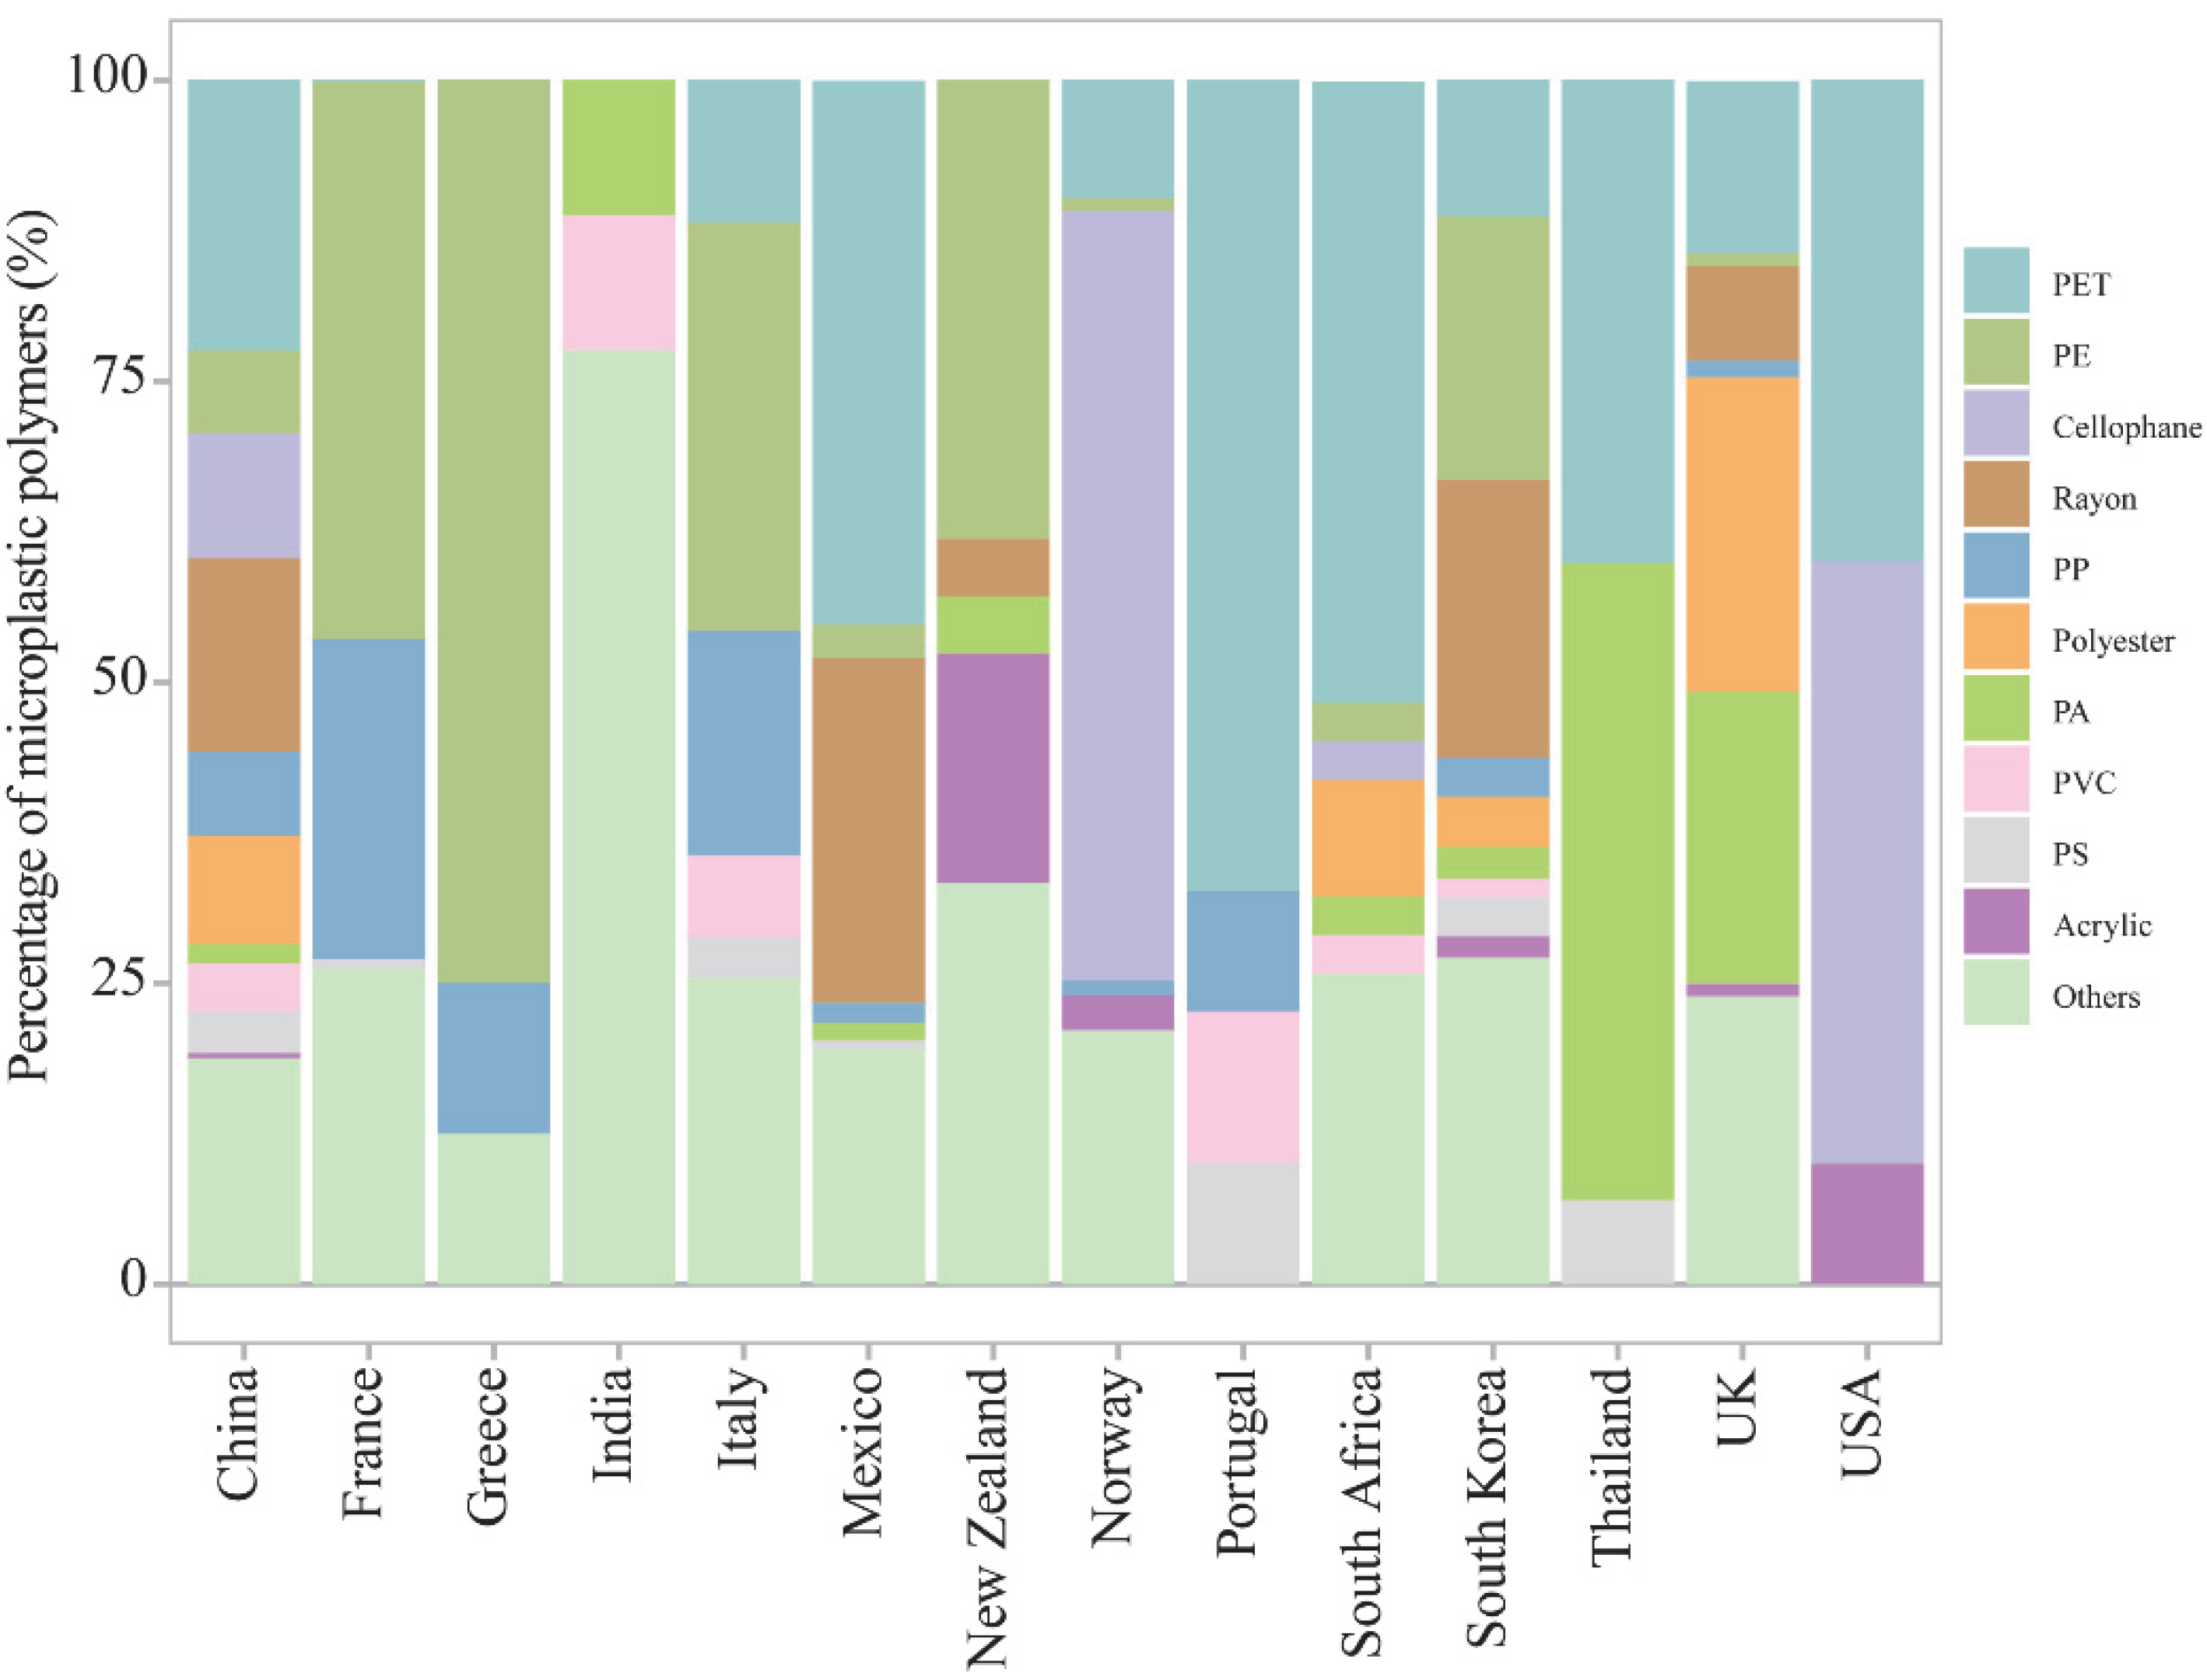
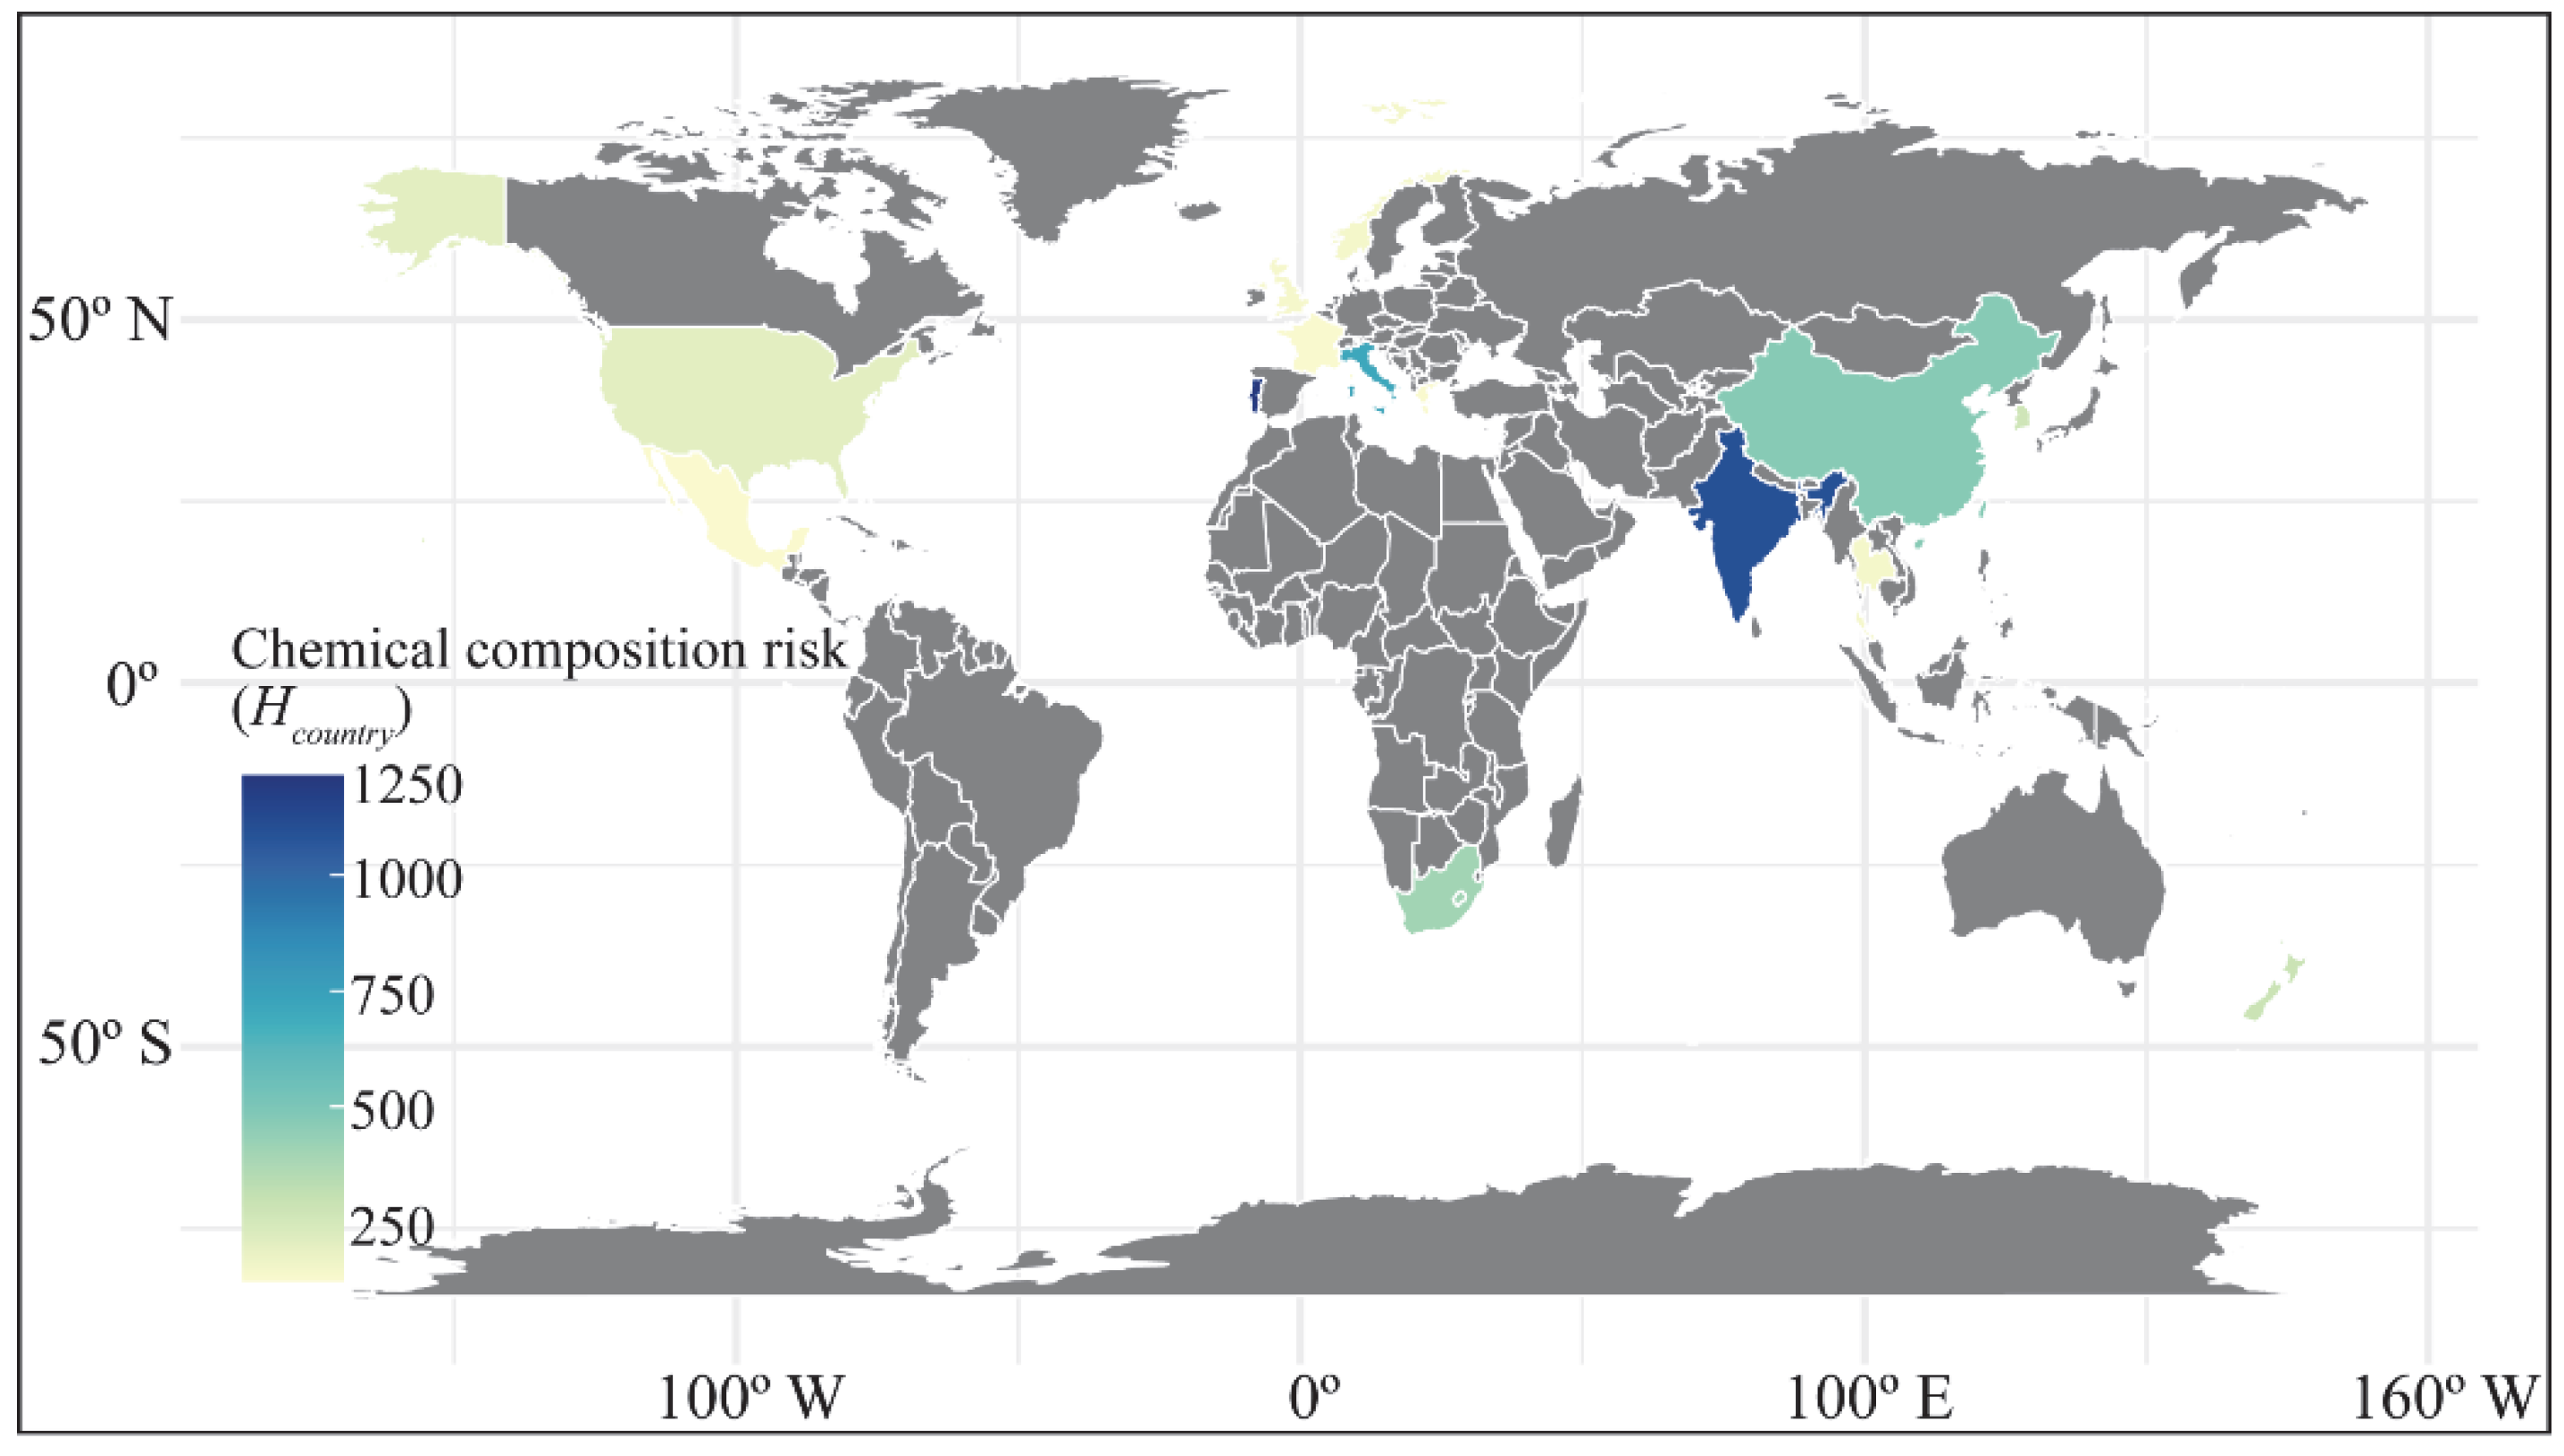
3.3. Comparison of Chemical Composition Risks of Microplastics in Bivalves among Countries

The chemical risk index of bivalves from 14 countries was calculated based on the available hazard score of seven plastic polymers [24]. As shown in Figure 4, the chemical composition risks of bivalves from 14 countries were as follows: two countries (Portugal and India) were highly polluted, which was ranked as level IV; six countries (Italy, China, South Africa, New Zealand, South Korea, and the USA) were found as moderate pollution (level III); three countries (Norway, Thailand, and the UK) had polymer hazards slightly (level II); and three countries (Greece, France, and Mexico) were ranked as level I, which was considered as negligible polymer contamination. Countries with a relatively high polymer risk were due to the occurrence of polymers with high hazard scores, such as PVC (S = 10,551). PVC, categorized as a “very high hazard” polymer, might release carcinogenic monomers and intrinsic plastic additives when entering the marine environment [24,45]. Some pollutants, such as persistent organic pollutants (POPs), were easily absorbed onto the surface of PVC, resulting in compound ecological effects [46]. Additionally, PVC, as a negatively buoyant plastic (density: 1.16–1.58 g/cm3), commonly accumulated in the deeper layers of the water or the benthic zone. PVC had more opportunities to encounter the infaunal bivalves, such as clams (sediments) and scallops (bellow 15 m) [5]. Therefore, PVC microplastics ingested by bivalves might pose a hazardous threat to the marine ecosystem and human health.
To further reveal the relationship between microplastic pollution load index and chemical composition index, Spearman correlation analysis was used to analyze the data of 14 countries. Our analysis showed that there was no significant correlation between the microplastic abundance risks and the chemical composition risks (R = −0.123, p = 0.675). It revealed that bivalves with high pollution loads contained a high abundance of microplastics but not a variety of hazardous polymers. Therefore, we suggest that when assessing the risks of microplastics ingested by bivalve mollusks, both the abundance and polymer risk should be considered comprehensively.
Worth noticing is that the hazard scores are calculated based on the hazard of monomers, in combination with a very limited score of the finite polymers is provided; thereby, the microplastic chemical risk model might be biased [9]. Therefore, the high chemical composition risk of bivalves in some countries did not indicate it is hazardous but revealed that microplastic polymers ingested by bivalves could cause potential hazards via the release of hazardous materials. More data on the polymer hazard scores are urgently needed for a better risk assessment of the chemical composition posed by microplastics in the bivalves.

3.4. Human Exposure to Microplastics via Shellfish Consumption

One of the most common pathways for microplastics to enter the human body is ingestion. The first evidence of microplastics detected in human faeces suggests that humans involuntarily ingest them [47]. PP (63%) and PET (17%) were predominantly identified in human faeces [47], coinciding with the dominant polymers detected in bivalves. Bivalve mollusks are an essential component of the human diet; thereby, the contaminated bivalves containing microplastics are non-negligible sources of human exposure.
Based on the supply data from the FAOSTAT, the mollusk consumption by humans in 2018 from 173 countries/regions worldwide ranged from 0 to 14.0 kg/capita/year, with a global mean value of 1.1 kg/capita/year [48]. It would be reasonable to obtain the mollusk supply data among countries from the FAOSTAT since data from all regions were derived using the same survey method [5]. Additionally, it should be noted that the consumption rate was calculated based on the total body weight with the inclusion of shell and soft tissue, whereas the abundance of microplastics in bivalves was commonly expressed as items per gram of soft tissue. Considering the ratio (value: 3) of the whole-body weight to the soft tissue weight reported by Cho et al. [5], the global mean human consumption for mollusks is calculated to be 367 g per person per year.
Combining the global mean value of human consumption with the outcomes of microplastic abundance in this review, the global mean annual intake was 751 microplastics per person (range: 15–7333) via mollusk consumption. Owing to the differences in geography and culture, mollusk consumption between countries varied greatly, leading to the large differences in human exposure to microplastics. The estimated annual dietary intake of microplastics via mollusk consumption in 22 countries was in the range of 0–8369 microplastics/capita/year, with the highest exposure level in China (8369 microplastics/capita/year), followed by South Korea (1703 microplastics/capita/year), Greece (1370 microplastics/capita/year) and France (1070 microplastics/capita/year). The variations of projected annual microplastic uptake from the consumption of bivalves in 22 countries are shown in Table 1. The mollusk supply and microplastic abundance are essential factors influencing the human exposure risks via mollusk consumption. For example, although bivalves from Iran had a relatively higher microplastic pollution level (11.0 items/g) (Figure 1), this country had no human exposure to microplastics via mollusks because of no consumption. Worth noticing is that the comparison of the data might be biased due to the limitations as follows: (1) Limited data regarding the microplastic abundance in bivalve mollusks in some countries is available. (2) The global human consumption of bivalves cannot be obtained currently. Additionally, owing to the limited data, the countries with high bivalve consumption also need extra attention, such as Spain (mollusk consumption: 2950 g/capita/year), Antigua and Barbuda (2405 g/capita/year), Japan (1909 g/capita/year), Luxembourg (1469 g/capita/year), French Polynesia (1391 g/capita/year), Saint Lucia (1340 g/capita/year), etc. [48].
From the perspective of human health, bivalves can act as the transporter to carry microplastics into humans. And the previous study reiterates that potentially hazardous contaminants, such as microplastic polymers, are entering and producing potential hazards to our bodies [6]. One research confirmed that PVC could disrupt the function of the endocrine system, and PS could induce neurotoxic and genotoxic effects [6]. Since there is still a knowledge gap in the exact impact of microplastics on the human body before excreting, this study will not discuss the exposure risks caused by the chemical composition of microplastic. Although there are conflicting claims about the toxic effects of microplastics on the human body, no evidence exists that microplastic exposures to humans are safe [49,50]. Consequently, more efforts need to be focused on the microplastic pollution in bivalves.
Strategies for reducing the microplastic pollution in bivalves may go a long way in cutting back the health risks posed to humans. There are a couple of measures suggested: (i) Since maricultural works use loads of plastic equipment that subsequently result in microplastic pollution, bio-based or biodegradable materials are good replacement options for synthetic plastics. Additionally, the abandoned plastic farming equipment should be recycled promptly. (ii) Policies are formulated to enforce the importance of bivalve farming in a pollution-free and safe environment. And the relevant organizations need to take steps for handling, storing, and preparing seafood products to minimize microplastic exposure to humans.

4. Conclusions

Our findings showed that both the abundance and chemical composition risks should be considered to obtain comprehensive data. Moreover, it highlights the microplastic risks to humans, indicating bivalve consumption is a non-negligible pathway for human exposure to microplastics. Considering the high consumption of bivalves by humans, the relevant organizations need to take steps to reduce the microplastic risks in seafood. This study recommends that more efforts in the construction of human health risk frameworks should be conducted as early as possible to understand the actual microplastic risks to humans.
With the consideration of the limitations existing in the risk assessment model, specific suggestions for future research include the following aspects: (1) There is a need for standardization of the methods that are used in the sample sampling, microplastic extraction, and identification. Additionally, we suggested performing a harmonization for the definition of microplastic polymers, specifically for the non-synthesis (e.g., cellulose and wood) or semi-synthesis (e.g., rayon and cellophane) particles. (2) The hazard of plastic additives should be researched and included in the assessment of the microplastic polymer risk. Given the complexity and heterogeneity of the microplastics in the environment, the interactions of microplastics and other contaminants, such as POPs or heavy metals, also should be considered. (3) More microplastic characteristics, such as size and shape, should be considered in the assessment model. And more evaluation indicators of microplastic risks should be established to fully understand the exact risks.

Supplementary Materials

The following are available online at https://www.mdpi.com/article/10.3390/jmse10020288/s1, Table S1: Abundance of microplastics in bivalves from 22 countries reviewed from the fifty-two studies. Table S2: Risk level criteria for microplastic pollution load index. Table S3: The hazard score for the dominant microplastic polymers in bivalves globally. Table S4: Risk level criteria for microplastic polymer risk index.

Author Contributions

Conceptualization, J.D.; software, J.D., Y.S. and C.H.; data curation, J.D. and C.H.; writing—original draft preparation, J.D.; writing—review and editing, J.L. and F.L.; visualization, J.D. and C.H.; project administration, J.L. and F.L.; funding acquisition, J.L. and F.L. All authors have read and agreed to the published version of the manuscript.

Funding

This research was funded by the Natural Science Foundation of Shandong Province, China (No. ZR2021MD079), and the National Key Research and Development Program of China (No. 2018YFC0406304).

Institutional Review Board Statement

Not applicable.

Informed Consent Statement

Not applicable.

Data Availability Statement

Not applicable.

Conflicts of Interest

The authors declare no conflict of interest.

References

  1. Wright, S.L.; Rowe, D.; Thompson, R.; Galloway, T.S. Microplastic ingestion decreases energy reserves in marine worms. Curr. Biol. 2013, 23, R1031–R1033. [Google Scholar] [CrossRef] [PubMed] [Green Version]
  2. Desforges, J.-P.; Galbraith, M.; Ross, P.S. Ingestion of Microplastics by Zooplankton in the Northeast Pacific Ocean. Arch. Environ. Contam. Toxicol. 2015, 69, 320–330. [Google Scholar] [CrossRef] [PubMed]
  3. Ding, J.; Jiang, F.; Li, J.; Wang, Z.; Sun, C.; Wang, Z.; Fu, L.; Ding, N.X.; He, C. Microplastics in the Coral Reef Systems from Xisha Islands of South China Sea. Environ. Sci. Technol. 2019, 53, 8036–8046. [Google Scholar] [CrossRef] [PubMed]
  4. Fossi, M.C.; Marsili, L.; Baini, M.; Giannetti, M.; Coppola, D.; Guerranti, C.; Caliani, I.; Minutoli, R.; Lauriano, G.; Finoia, M.G.; et al. Fin whales and microplastics: The Mediterranean Sea and the Sea of Cortez scenarios. Environ. Pollut. 2016, 209, 68–78. [Google Scholar] [CrossRef]
  5. Cho, Y.; Shim, W.J.; Jang, M.; Han, G.M.; Hong, S.H. Abundance and characteristics of microplastics in market bivalves from South Korea. Environ. Pollut. 2019, 245, 1107–1116. [Google Scholar] [CrossRef]
  6. Senathirajah, K.; Attwood, S.; Bhagwat, G.; Carbery, M.; Wilson, S.; Palanisami, T. Estimation of the mass of microplastics ingested—A pivotal first step towards human health risk assessment. J. Hazard. Mater. 2021, 404, 124004. [Google Scholar] [CrossRef]
  7. Vaughn, C.C. Ecosystem services provided by freshwater mussels. Hydrobiol. 2018, 810, 15–27. [Google Scholar] [CrossRef]
  8. Zhang, F.; Man, Y.B.; Mo, W.Y.; Man, K.Y.; Wong, M.H. Direct and indirect effects of microplastics on bivalves, with a focus on edible species: A mini-review. Crit. Rev. Environ. Sci. Technol. 2020, 50, 2109–2143. [Google Scholar] [CrossRef]
  9. Ding, J.; Li, J.; Sun, C.; Jiang, F.; He, C.; Zhang, M.; Ju, P.; Ding, N.X. An examination of the occurrence and potential risks of microplastics across various shellfish. Sci. Total Environ. 2020, 739, 139887. [Google Scholar] [CrossRef]
  10. Waser, A.M.; Deuzeman, S.; Kangeri, A.K.W.; van Winden, E.; Postma, J.; de Boer, P.; van der Meer, J.; Ens, B.J. Impact on bird fauna of a non-native oyster expanding into blue mussel beds in the Dutch Wadden Sea. Biol. Conserv. 2016, 202, 39–49. [Google Scholar] [CrossRef] [Green Version]
  11. Li, J.; Wang, Z.; Rotchell, J.M.; Shen, X.; Li, Q.; Zhu, J. Where are we? Towards an understanding of the selective accumulation of microplastics in mussels. Environ. Pollut. 2021, 286, 117543. [Google Scholar] [CrossRef]
  12. Cox, K.D.; Covernton, G.A.; Davies, H.L.; Dower, J.F.; Juanes, F.; Dudas, S.E. Human Consumption of Microplastics. Environ. Sci. Technol. 2019, 53, 7068–7074. [Google Scholar] [CrossRef] [Green Version]
  13. Wright, S.L.; Kelly, F.J. Plastic and Human Health: A Micro Issue? Environ. Sci. Technol. 2017, 51, 6634–6647. [Google Scholar] [CrossRef] [PubMed]
  14. Adam, V.; Yang, T.; Nowack, B. Toward an ecotoxicological risk assessment of microplastics: Comparison of available hazard and exposure data in freshwaters. Environ. Toxicol. Chem. 2019, 38, 436–447. [Google Scholar] [CrossRef] [Green Version]
  15. Burns, E.E.; Boxall, A.B. Microplastics in the aquatic environment: Evidence for or against adverse impacts and major knowledge gaps. Environ. Toxicol. Chem. 2018, 37, 2776–2796. [Google Scholar] [CrossRef] [PubMed] [Green Version]
  16. Everaert, G.; Van Cauwenberghe, L.; De Rijcke, M.; Koelmans, A.A.; Mees, J.; Vandegehuchte, M.; Janssen, C.R. Risk assessment of microplastics in the ocean: Modelling approach and first conclusions. Environ. Pollut. 2018, 242, 1930–1938. [Google Scholar] [CrossRef]
  17. Liu, K.; Wang, X.; Fang, T.; Xu, P.; Zhu, L.; Li, D. Source and potential risk assessment of suspended atmospheric microplastics in Shanghai. Sci. Total Environ. 2019, 675, 462–471. [Google Scholar] [CrossRef]
  18. Xu, P.; Peng, G.; Su, L.; Gao, Y.; Gao, L.; Li, D. Microplastic risk assessment in surface waters: A case study in the Changjiang Estuary, China. Mar. Pollut. Bull. 2018, 133, 647–654. [Google Scholar] [CrossRef]
  19. Zhang, X.; Leng, Y.; Liu, X.; Huang, K.; Wang, J. Microplastics’ Pollution and Risk Assessment in an Urban River: A Case Study in the Yongjiang River, Nanning City, South China. Expo. Health 2020, 12, 141–151. [Google Scholar] [CrossRef]
  20. Zhang, M.; Li, J.; Ding, H.; Ding, J.; Jiang, F.; Ding, N.X.; Sun, C. Distribution Characteristics and Influencing Factors of Microplastics in Urban Tap Water and Water Sources in Qingdao, China. Anal. Lett. 2019, 53, 1312–1327. [Google Scholar] [CrossRef]
  21. Fang, C.; Zheng, R.; Chen, H.; Hong, F.; Lin, L.; Lin, H.; Guo, H.; Bailey, C.; Segner, H.; Mu, J.; et al. Comparison of microplastic contamination in fish and bivalves from two major cities in Fujian province, China and the implications for human health. Aquac. 2019, 512, 734322. [Google Scholar] [CrossRef]
  22. Angulo, E. The Tomlinson Pollution Load Index applied to heavy metal, ‘Mussel-Watch’ data: A useful index to assess coastal pollution. Sci. Total Environ. 1996, 187, 19–56. [Google Scholar] [CrossRef]
  23. Sparks, C.; Awe, A.; Maneveld, J. Abundance and characteristics of microplastics in retail mussels from Cape Town, South Africa. Mar. Pollut. Bull. 2021, 166, 112186. [Google Scholar] [CrossRef] [PubMed]
  24. Lithner, D.; Larsson, Å.; Dave, G. Environmental and health hazard ranking and assessment of plastic polymers based on chemical composition. Sci. Total Environ. 2011, 409, 3309–3324. [Google Scholar] [CrossRef] [PubMed]
  25. Claessens, M.; Van Cauwenberghe, L.; Vandegehuchte, M.B.; Janssen, C.R. New techniques for the detection of microplastics in sediments and field collected organisms. Mar. Pollut. Bull. 2013, 70, 227–233. [Google Scholar] [CrossRef] [PubMed]
  26. Van Cauwenberghe, L.; Janssen, C. Microplastics in bivalves cultured for human consumption. Environ. Pollut. 2014, 193, 65–70. [Google Scholar] [CrossRef]
  27. Bour, A.; Avio, C.G.; Gorbi, S.; Regoli, F.; Hylland, K. Presence of microplastics in benthic and epibenthic organisms: Influence of habitat, feeding mode and trophic level. Environ. Pollut. 2018, 243, 1217–1225. [Google Scholar] [CrossRef]
  28. Klasios, N.; De Frond, H.; Miller, E.; Sedlak, M.; Rochman, C.M. Microplastics and other anthropogenic particles are prevalent in mussels from San Francisco Bay, and show no correlation with PAHs. Environ. Pollut. 2021, 271, 116260. [Google Scholar] [CrossRef]
  29. Leslie, H.; Brandsma, S.; Van Velzen, M.; Vethaak, A. Microplastics en route: Field measurements in the Dutch river delta and Amsterdam canals, wastewater treatment plants, North Sea sediments and biota. Environ. Int. 2017, 101, 133–142. [Google Scholar] [CrossRef]
  30. Teichert, S.; Löder, M.G.J.; Pyko, I.; Mordek, M.; Schulbert, C.; Wisshak, M.; Laforsch, C. Microplastic contamination of the drilling bivalve Hiatella arctica in Arctic rhodolith beds. Sci. Rep. 2021, 11, 1–12. [Google Scholar] [CrossRef]
  31. Pastorino, P.; Prearo, M.; Anselmi, S.; Menconi, V.; Bertoli, M.; Dondo, A.; Pizzul, E.; Renzi, M. Use of the Zebra Mussel Dreissena polymorpha (Mollusca, Bivalvia) as a Bioindicator of Microplastics Pollution in Freshwater Ecosystems: A Case Study from Lake Iseo (North Italy). Water 2021, 13, 434. [Google Scholar] [CrossRef]
  32. Murphy, C.L. A comparison of microplastics in farmed and wild shellfish. Master’s Thesis, Royal Roads University, Victoria, Canada, 2018. [Google Scholar]
  33. Kuczenski, B.; Geyer, R. Material flow analysis of polyethylene terephthalate in the US, 1996–2007. Resour. Conserv. Recycl. 2010, 54, 1161–1169. [Google Scholar] [CrossRef]
  34. Suaria, G.; Perold, V.; Lee, J.; Lebouard, F.; Aliani, S.; Ryan, P.G. Floating macro- and microplastics around the Southern Ocean: Results from the Antarctic Circumnavigation Expedition. Environ. Int. 2020, 136, 105494. [Google Scholar] [CrossRef]
  35. PlasticsEurope. Plastic-the Facts 2020: An Analysis of European Plastics Production, Demand and Waste Data (Brussels, Belgium). Available online: https://plasticseurope.org/wp-content/uploads/2021/09/Plastics_the_facts-WEB-2020_versionJun21_final.pdf (accessed on 28 November 2021).
  36. Cho, Y.; Shim, W.J.; Jang, M.; Han, G.M.; Hong, S.H. Nationwide monitoring of microplastics in bivalves from the coastal environment of Korea. Environ. Pollut. 2021, 270, 116175. [Google Scholar] [CrossRef]
  37. Zhang, Z.; Deng, C.; Dong, L.; Liu, L.; Li, H.; Wu, J.; Ye, C. Microplastic pollution in the Yangtze River Basin: Heterogeneity of abundances and characteristics in different environments. Environ. Pollut. 2021, 287, 117580. [Google Scholar] [CrossRef] [PubMed]
  38. Li, R.; Zhang, L.; Xue, B.; Wang, Y. Abundance and characteristics of microplastics in the mangrove sediment of the semi-enclosed Maowei Sea of the south China sea: New implications for location, rhizosphere, and sediment compositions. Environ. Pollut. 2019, 244, 685–692. [Google Scholar] [CrossRef] [PubMed]
  39. Xue, B.; Zhang, L.; Li, R.; Wang, Y.; Guo, J.; Yu, K.; Wang, S. Underestimated Microplastic Pollution Derived from Fishery Activities and “Hidden” in Deep Sediment. Environ. Sci. Technol. 2020, 54, 2210–2217. [Google Scholar] [CrossRef]
  40. Peng, G.; Zhu, B.; Yang, D.; Su, L.; Shi, H.; Li, D. Microplastics in sediments of the Changjiang Estuary, China. Environ. Pollut. 2017, 225, 283–290. [Google Scholar] [CrossRef]
  41. Zhang, B.; Wu, D.; Yang, X.; Teng, J.; Liu, Y.; Zhang, C.; Zhao, J.; Yin, X.; You, L.; Liu, Y.; et al. Microplastic pollution in the surface sediments collected from Sishili Bay, North Yellow Sea, China. Mar. Pollut. Bull. 2019, 141, 9–15. [Google Scholar] [CrossRef]
  42. Hartmann, N.B.; Hüffer, T.; Thompson, R.C.; Hassellöv, M.; Verschoor, A.; Daugaard, A.E.; Rist, S.; Karlsson, T.M.; Brennholt, N.; Cole, M.; et al. Are We Speaking the Same Language? Recommendations for a Definition and Categorization Framework for Plastic Debris. Environ. Sci. Technol. 2019, 53, 1039–1047. [Google Scholar] [CrossRef] [Green Version]
  43. Lusher, A.L.; Welden, N.A.; Sobral, P.; Cole, M. Sampling, Isolating and Identifying Microplastics Ingested by Fish and Invertebrates. Anal. Methods-U.K. 2017, 9, 1346–1360. [Google Scholar] [CrossRef] [Green Version]
  44. Birnstiel, S.; Soares-Gomes, A.; da Gama, B.A. Depuration reduces microplastic content in wild and farmed mussels. Mar. Pollut. Bull. 2019, 140, 241–247. [Google Scholar] [CrossRef] [PubMed]
  45. Green, D.S.; Boots, B.; Sigwart, J.; Jiang, S.; Rocha, C. Effects of conventional and biodegradable microplastics on a marine ecosystem engineer (Arenicola marina) and sediment nutrient cycling. Environ. Pollut. 2016, 208, 426–434. [Google Scholar] [CrossRef] [PubMed]
  46. Pedà, C.; Caccamo, L.; Fossi, M.C.; Gai, F.; Andaloro, F.; Genovese, L.; Perdichizzi, A.; Romeo, T.; Maricchiolo, G. Intestinal alterations in European sea bass Dicentrarchus labrax (Linnaeus, 1758) exposed to microplastics: Preliminary results. Environ. Pollut. 2016, 212, 251–256. [Google Scholar] [CrossRef]
  47. Schwabl, P.; Köppel, S.; Königshofer, P.; Bucsics, T.; Trauner, M.; Reiberger, T.; Liebmann, B. Detection of Various Microplastics in Human Stool. Ann. Intern. Med. 2019, 171, 453–457. [Google Scholar] [CrossRef]
  48. FAOSTAT. Food and Agriculture Organization of the United Nations. 2020. Available online: http://www.fao.org/faostat/en/#data/QC (accessed on 11 June 2021).
  49. Danopoulos, E.; Jenner, L.C.; Twiddy, M.; Rotchell, J.M. Microplastic Contamination of Seafood Intended for Human Consumption: A Systematic Review and Meta-Analysis. Environ. Health Perspect. 2020, 128, 126002. [Google Scholar] [CrossRef]
  50. Leslie, H.A.; Depledge, M.H. Where is the evidence that human exposure to microplastics is safe? Environ. Int. 2020, 142, 105807. [Google Scholar] [CrossRef]
Figure 1. Microplastic abundance in bivalve mollusks from 22 countries. Points represent mean abundance values and whiskers denote the corresponding standard deviations (SDs). Values above each whisker represent mean abundance ± SD.
Jmse 10 00288 g001
Figure 2. The polymer type distribution of microplastics in bivalves from 14 countries. Abbreviations: PET, polyethylene terephthalate; PE, polyethylene; PP, polypropylene; PA, polyamide; PVC, polyvinyl chloride; PS, polystyrene.
Jmse 10 00288 g002
Figure 3. Spatial distribution of microplastic pollution load index (PLIcountry) of bivalves from 22 countries. Countries without valid data were not included and shaded dark gray.
Jmse 10 00288 g003
Figure 4. Spatial distribution of microplastic polymer risk index (Hcountry) of bivalves from 14 countries. The dark gray areas illustrate countries for which data on microplastics in bivalves are not available.
Jmse 10 00288 g004
Table 1. Estimated annual microplastic uptake from the consumption of mollusk.
CountryMollusk Supply
(g/Capita/Year)
Yearly Uptake
(Microplastics/Capita/Year)
Argentina236 59
Belgium1039 291
Chile222 71
China3269 8369
France1814 1070
Germany158 57
Greece351 1370
India25 49
Iran0 0
Italy2077 561
Mexico296 18
Netherlands653 85
New Zealand328 13
Norway287 279
Portugal1462 819
South Africa36 1
South Korea3475 1 1703
Thailand575 233
Tunisia52 64
UK305 591
USA994 199
Vietnam844 245
1 Data was referenced from Cho et al. [5].
Publisher’s Note: MDPI stays neutral with regard to jurisdictional claims in published maps and institutional affiliations.

