3. Analytical Models
One of the earliest grounding models was presented by Macduff [
12]. The author created a geometric model for vessel grounding in order to find the grounding probability. According to this model, the real probability of grounding (
PRG) results is calculated from the geometric probability (
PG) and causation probability (
PC). The geometric probability of a vessel’s grounding by hitting the edge of the canal was calculated by using the Buffon’s needle problem:
In [
12], the author states that the model applies to random grounding as a result of random navigation. It is also pointed out that other relevant factors such as fog, snow, engine breakdown, steering mechanism failure, panic, inattention, carelessness, ignorance and the like may be applied in the model, taking the causation probability into account. An essential aspect of this model lies in the fact that the author did not directly consider the traffic density. However, as the causation probability was calculated by using statistical data, it may be assumed that the traffic density effect was incorporated into the causation probability.
Along with the Macduff model, the Fuji model [
13] was one of the first geometric models ever designed to assess the risk of grounding, and most of the research that followed in this field relied on these early works.
It has already been explained that this research defines grounding as any type of grounding, with the exception of intentional grounding. The study [
13] provides the expression stating that the approximate number of ships running aground in a waterway would be
where
V is the average speed of the traffic flow,
ρ is the average density of the traffic flow,
D is the linear cross-section of the obstacle shallower than the draught,
B is the ship width (probably the average width of the ships),
D +
B is the effective width of the obstacle or shoal and
P is the probability of poorly maneuvering. It is assumed that the number of grounding events fits into the Poisson distribution [
42]. However, the results show that the Fujii model overrates the geometric probability, even more than the Macduff model does [
43].
Amrozowicz [
14] applied Fault Tree Analysis (FTA) to the grounding of tankers, analyzing a variety of scenarios. Fault Trees are used to present the task analysis results. The tasks consist of essential events. Each type of grounding is placed in the Fault Tree as the main event and is broken down into essential events. By using the systemic analysis approach, Amrozowicz used expert knowledge for developing the Fault Tree. Within the Fault Tree, errors are grouped in two categories. The first includes passage planning and pilotage: a vessel is able to follow a safe course but proceeds along an unsafe course due to failures in passage planning or piloting. The other category involves the equipment, assistance and environment: a vessel is not able to follow a safe route due to mechanical faults, assistance failure and/or adverse environment conditions.
The study defines two grounding events: grounding due to errors in navigation while using power and making way, and grounding due to leeway; i.e., the drifting of the vessel off course. The categorization is in line with the research conducted by Det Norske Veritas (DNV) [
44]. DNV defines two categories, as follows:
Grounding due to errors in navigation: a type of event when a tanker collides with the shoreline while making way due to navigational errors and lack of crew vigilance;
Grounding due to leeway/drift: a type of event when a tanker loses its maneuverability, through loss of steering or propulsion, and drifts towards the shoreline before it is taken in tow or repaired.
In the case of grounding due to drift, Amrozowicz considered two rescue options: towing assistance and emergency anchoring, but the possibility of the self-repair was neglected.
The causation achieved through the Fault Tree corresponds to the grounding definitions developed by DNV. The grounding probability is calculated with the aid of the Boolean algebra, which works from the bottom to the top. In addition to the professional evaluation, the probability assessment uses historical data. When analyzing human errors and evaluating their probability, the author applies the Human Error Rate Prediction (THERP) method that has been recommended by the International Maritime Organization (IMO, 2002) to make Formal Safety Assessments (FSA).
The THERP method is commonly used in Human Reliability Analysis (HRA) and for predicting the individual error rates [
45]. The approach is similar to the traditional system reliability analysis, with the necessary modifications allowing us to consider possible individual errors; instead of generating the state of the equipment system, this approach creates possible human activities and the corresponding possibilities of errors [
46]. It enables an analyst to assess the degradation of the human–machine system due to individual errors, functional failures, practical procedures in effect or other characteristics of the system or people which may affect the behavior of the system [
47]. The approach combines the modeling method with a set of empirical tables containing basic Human Error Probabilities (HEP) that are modified by a number of Performance Shaping Factors (PSF).
Fowler and Sørgård are the only researchers who have divided the grounding models into the power grounding resulting from errors in navigation and the drift grounding due to the leeway or drift of the vessel towards the coastline, caused by external factors [
1]. Basically, their models present the frequency or the rate of groundings. This is the expression for powered grounding; i.e., the grounding of a vessel using its own propulsion:
where
fpg represents the frequency of powered grounding (number of powered grounding events per year);
npg is the critical situation when a vessel using its own propulsion sails towards a waypoint and runs aground within 20 min unless a critical alteration of the course is performed;
Pc is the probability of clear visibility (more than 4 km);
Pf is the probability of reduced visibility (less than 4 km);
ppg,c represents the corresponding probability of the powered grounding given a critical situation in clear visibility (causation factor);
ppg,f is the corresponding probability of powered grounding given a critical situation in reduced visibility (causation factor).
where
fdg represents the frequency of drift grounding (number of drift grounding events per year);
fp,l is the frequency of propulsion breakdown (number of ships experiencing propulsion breakdowns per year related to all lanes {l} within 50 nm from the grounding location);
pd is the probability of leeway/drift tracks leading to the location of grounding (drifts towards the shoreline);
pw is the probability of the wind speed category;
psr,w is the probability of saving the vessel through self-repairing, depending on wind speeds;
pt,w is the probability of saving the vessel through towing assistance, depending on wind speeds;
pa,w is the probability of saving the vessel by anchoring, depending on wind speeds.
Fowler and Sørgård used Fault Tree Analysis (FTA) to calculate the collision and grounding probabilities in given critical situations. In their grounding model, they assume that the current and wind remain constant over the entire drifting period, which may reduce the model’s accuracy in case of prolonged drifting. What makes this drift grounding model particularly interesting is the fact that it takes into consideration the overall time needed to repair the vessel’s propulsion or for towing assistance in emergency [
1]. They rightfully assume that the grounding probability will be lower if the crew manage to repair the propulsion over a given period of time and at a given distance from the shallow waters, or if the tow assistance is provided before the vessel reaches shallow waters. In addition, the drift grounding probability may be reduced by anchoring. However, the outcome depends on various situations and factors such as the seabed nature.
Chen and Zhang [
15] modified Amrozowicz’s study [
14] by adding the Fuzzy Fault Tree concept to the FTA for the grounding occurring due to error in navigation [
48]. Consequently, their model contains uncertainty regarding the assessment of accident probability, which will also be felt when making decisions on the basis of the model’s outcomes.
The geometric grounding model designed by Kristiansen can be considered as a simple combination of the Fujii and Macduff models [
16]. Kristiansen first tried to find the probability that a vessel hits an obstacle in a fairway; then, he calculated the grounding probability in a fairway by multiplying the achieved probability and the causability. He assumes that a vessel resumes voyage along the unchanged course at a critical stage. The critical stage can be defined as loss of control due to human error, technical fault or both and as the reduction in the width of the fairway due to obstacles. It is assumed that the lateral and longitudinal positions of the vessel are accidental in the critical stage. Hence, the probability that the vessel hits the obstacle given the vessel’s breadth and the width of the fairway can be calculated. Kristiansen assumes that, in case of loss of control, a vessel may take any course. Therefore, the conditional grounding probability would be the ratio between the critical angle and the total angle for one lateral side. Kristiansen confirmed the statement of Fowler and Sørgård [
1] that the average time for regaining control, and consequently the selection of the length of the journey’s leg (or the channel’s length), makes an essential impact on the assessed probability. However, Kristiansen’s models [
17] are too simple to be used in real-life scenarios. He suggested the use of these models as an alternative, asserting that the probabilities calculated by the models cannot be used in real scenarios as correct figures.
Eide and associates designed a model intended for the deep coastal waters of the Norwegian Sea [
17]. The procedure is identical to the one used by Fowler and Sørgård for their grounding model [
1]. However, the advantage of this model over the model produced by Fowler and Sørgård is the inclusion of meteorological data (winds, waves, currents) and the ship’s dynamic data (position, speed). The combined data affect the frequency (F) and the consequence (C) of the grounding due to drifting of the vessel towards the shore [
42]. The study describes the modeled consequence of the drift grounding of a tanker, defining the amount of crude oil spilt as dependent on the ship size, amount of load and the ship structure (single hull or double hull). There is a simulation of the effect of one ton of spilt oil on the environment, depending on the environment configuration and the oil type. However, this remains a relatively simple model based on the statistical data referring to oil spill accidents.
Kristiansen developed another model inspired by the approaches to traffic problems in the aviation industry [
18,
49]. This model determines the causal state in the system’s behavior, with reference to the vessel’s grounding as the event. The author analyzed grounding accidents using the accident reports and transferred the gathered information into the Bayesian Belief Network (BBN). The study defines three main grounding causes: human error, unsafe acting at a given moment and external factors. The BBN structure used the algorithm of Greedy Thick Thinning, as well as the Bayes search algorithm that enabled the implementation of the inputs of human experts and accident data [
42,
50].
In the paper by author Jiang et al. [
19], an analytical model was developed that estimates the grounding probability using the Bayesian Network. Factors affecting grounding have been identified from historical data and previous studies based on systematic hazard analysis. In order to develop accident scenarios, the distribution of various factors affecting grounding has been additionally analyzed, such as current month of the year, water level, gross tonnage of ships and the changing of the navigation officer shift on guard.
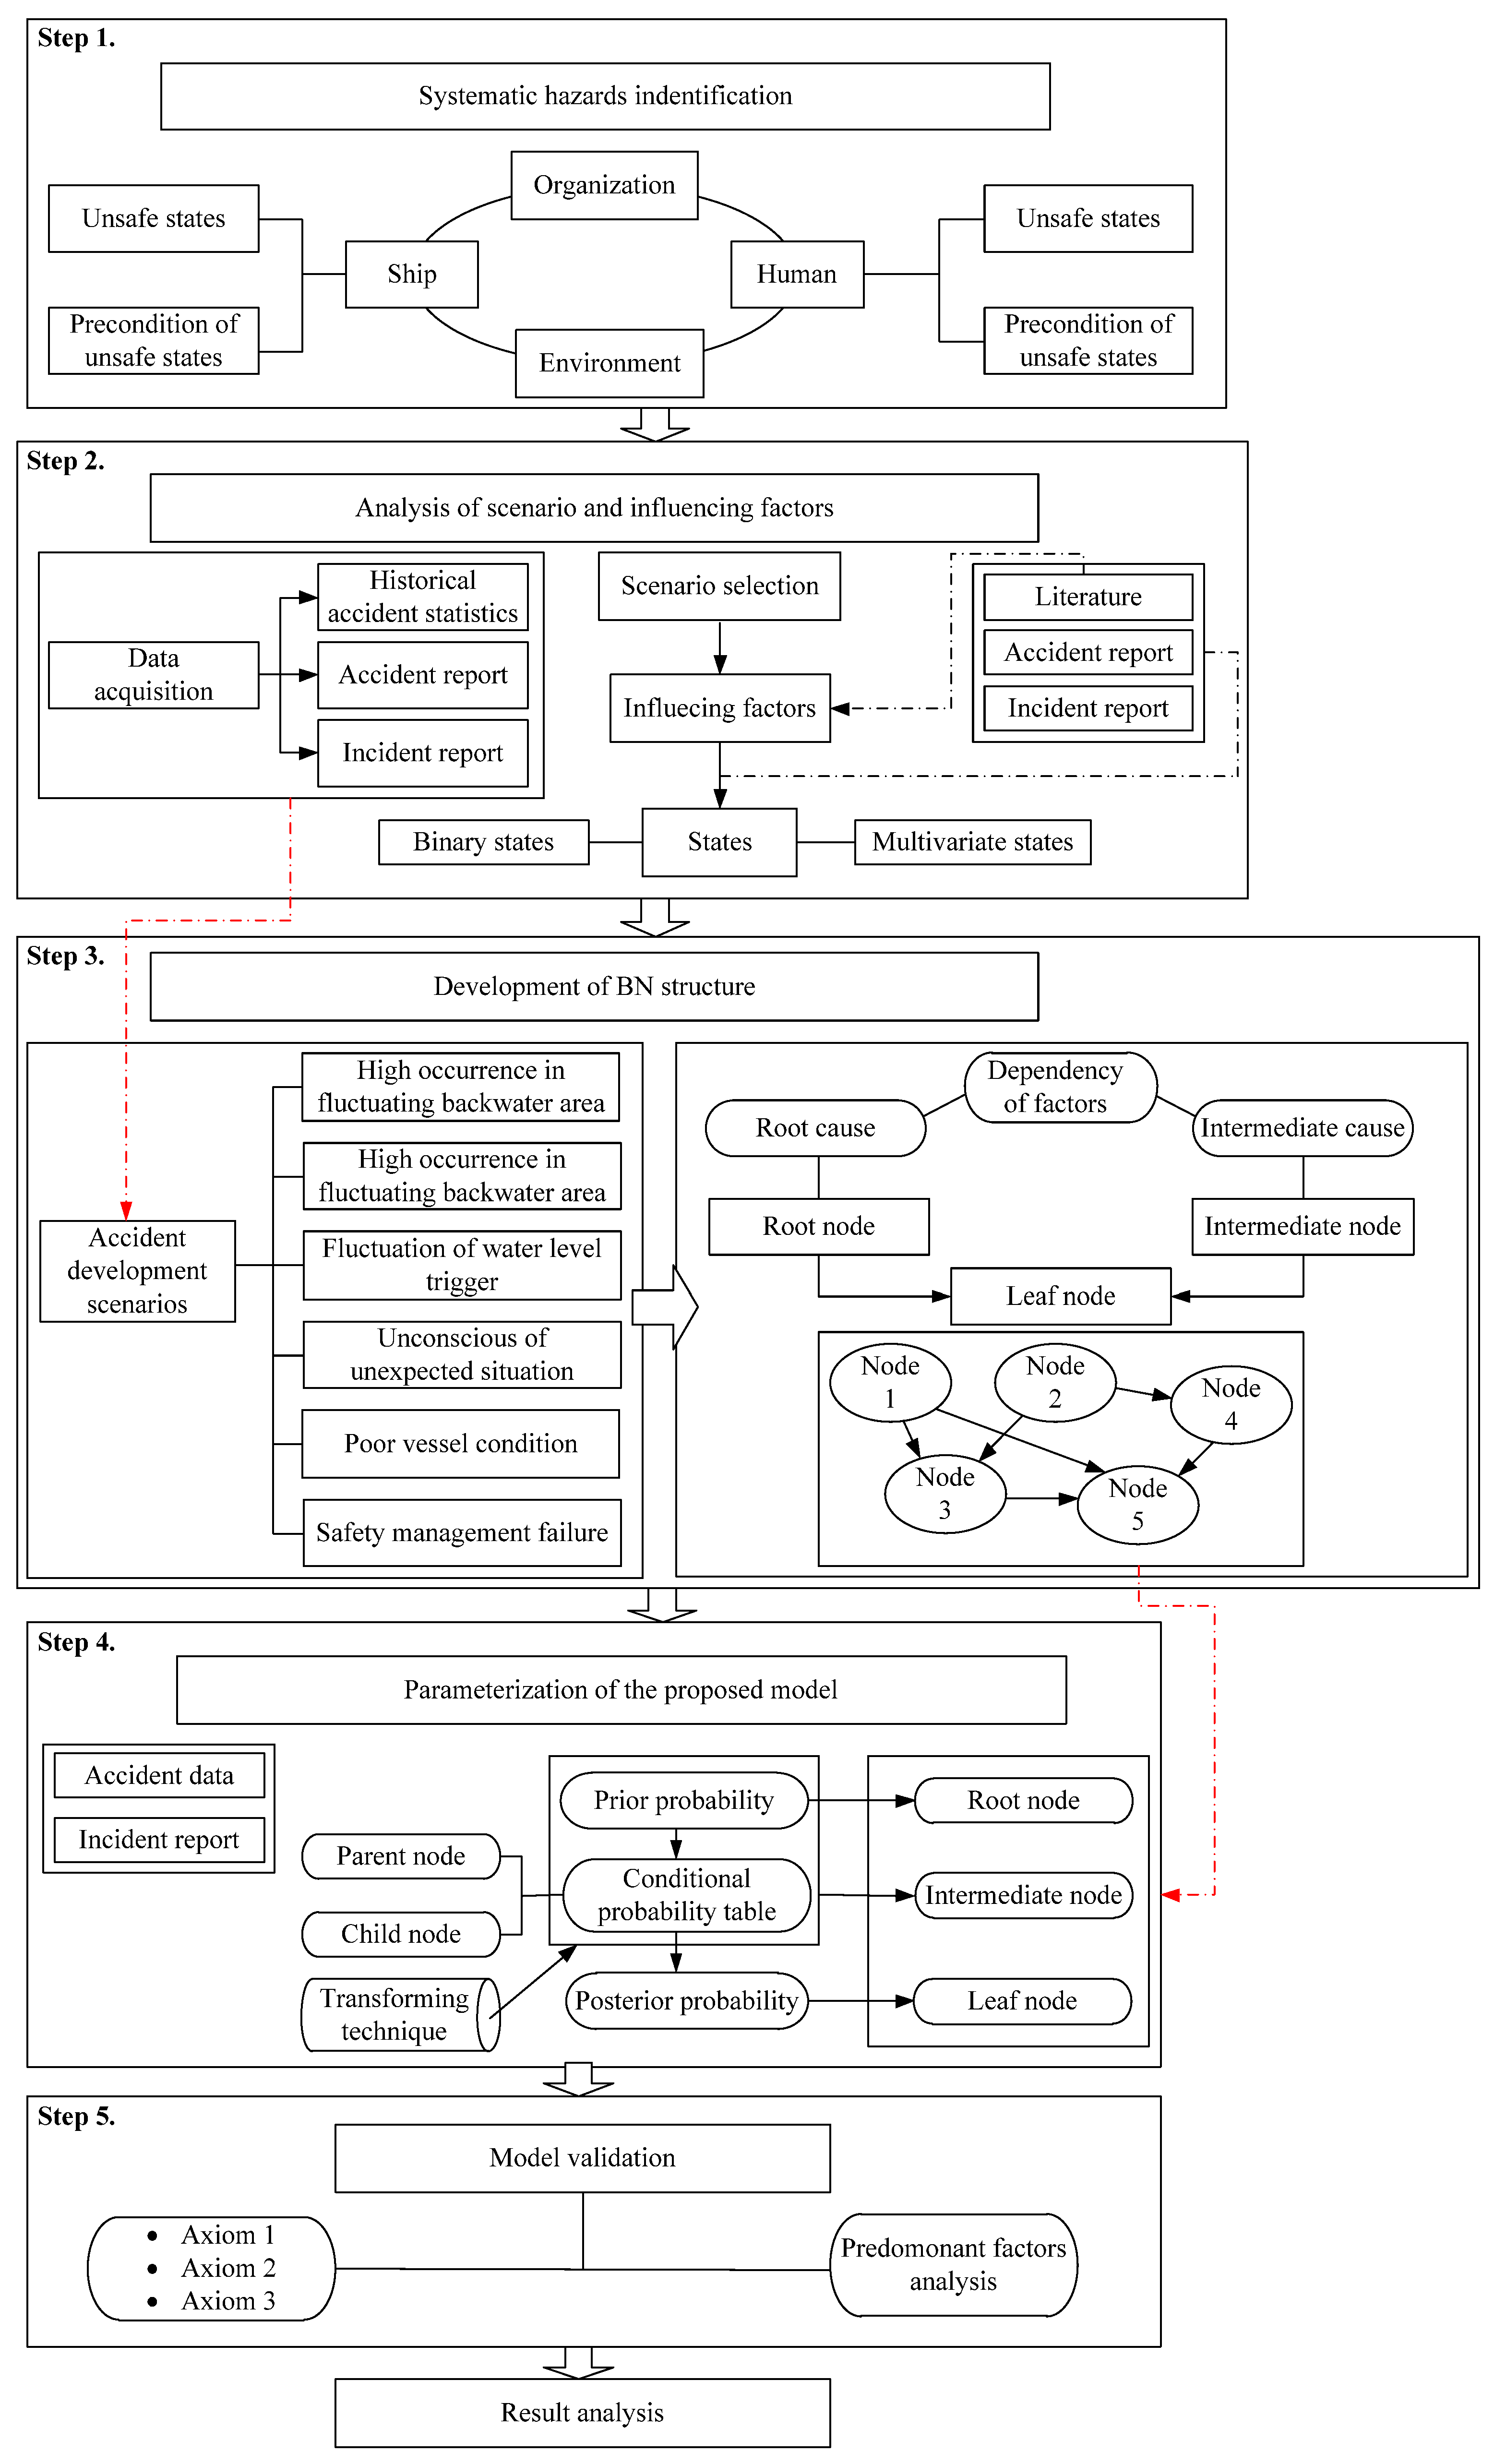
The modeling process itself can be summarized in five steps (
Figure 2):
Step 1. Identify hazards from the elements of organization, man, ship and environment to define impact factors;
Step 2: Grounding accident statistics are used to identify scenarios and influencing factors;
Step 3: Define variables (nodes) and dependencies (arrows) to construct the structure of the BN model;
Step 4: Conditional Probability Tables (CPT). Factors are derived from the history database. In addition, vessel condition and waterway complexity were introduced to facilitate the modeling process;
Step 5: Validate the model. Three axioms were introduced to verify that the BN model works properly as intended.
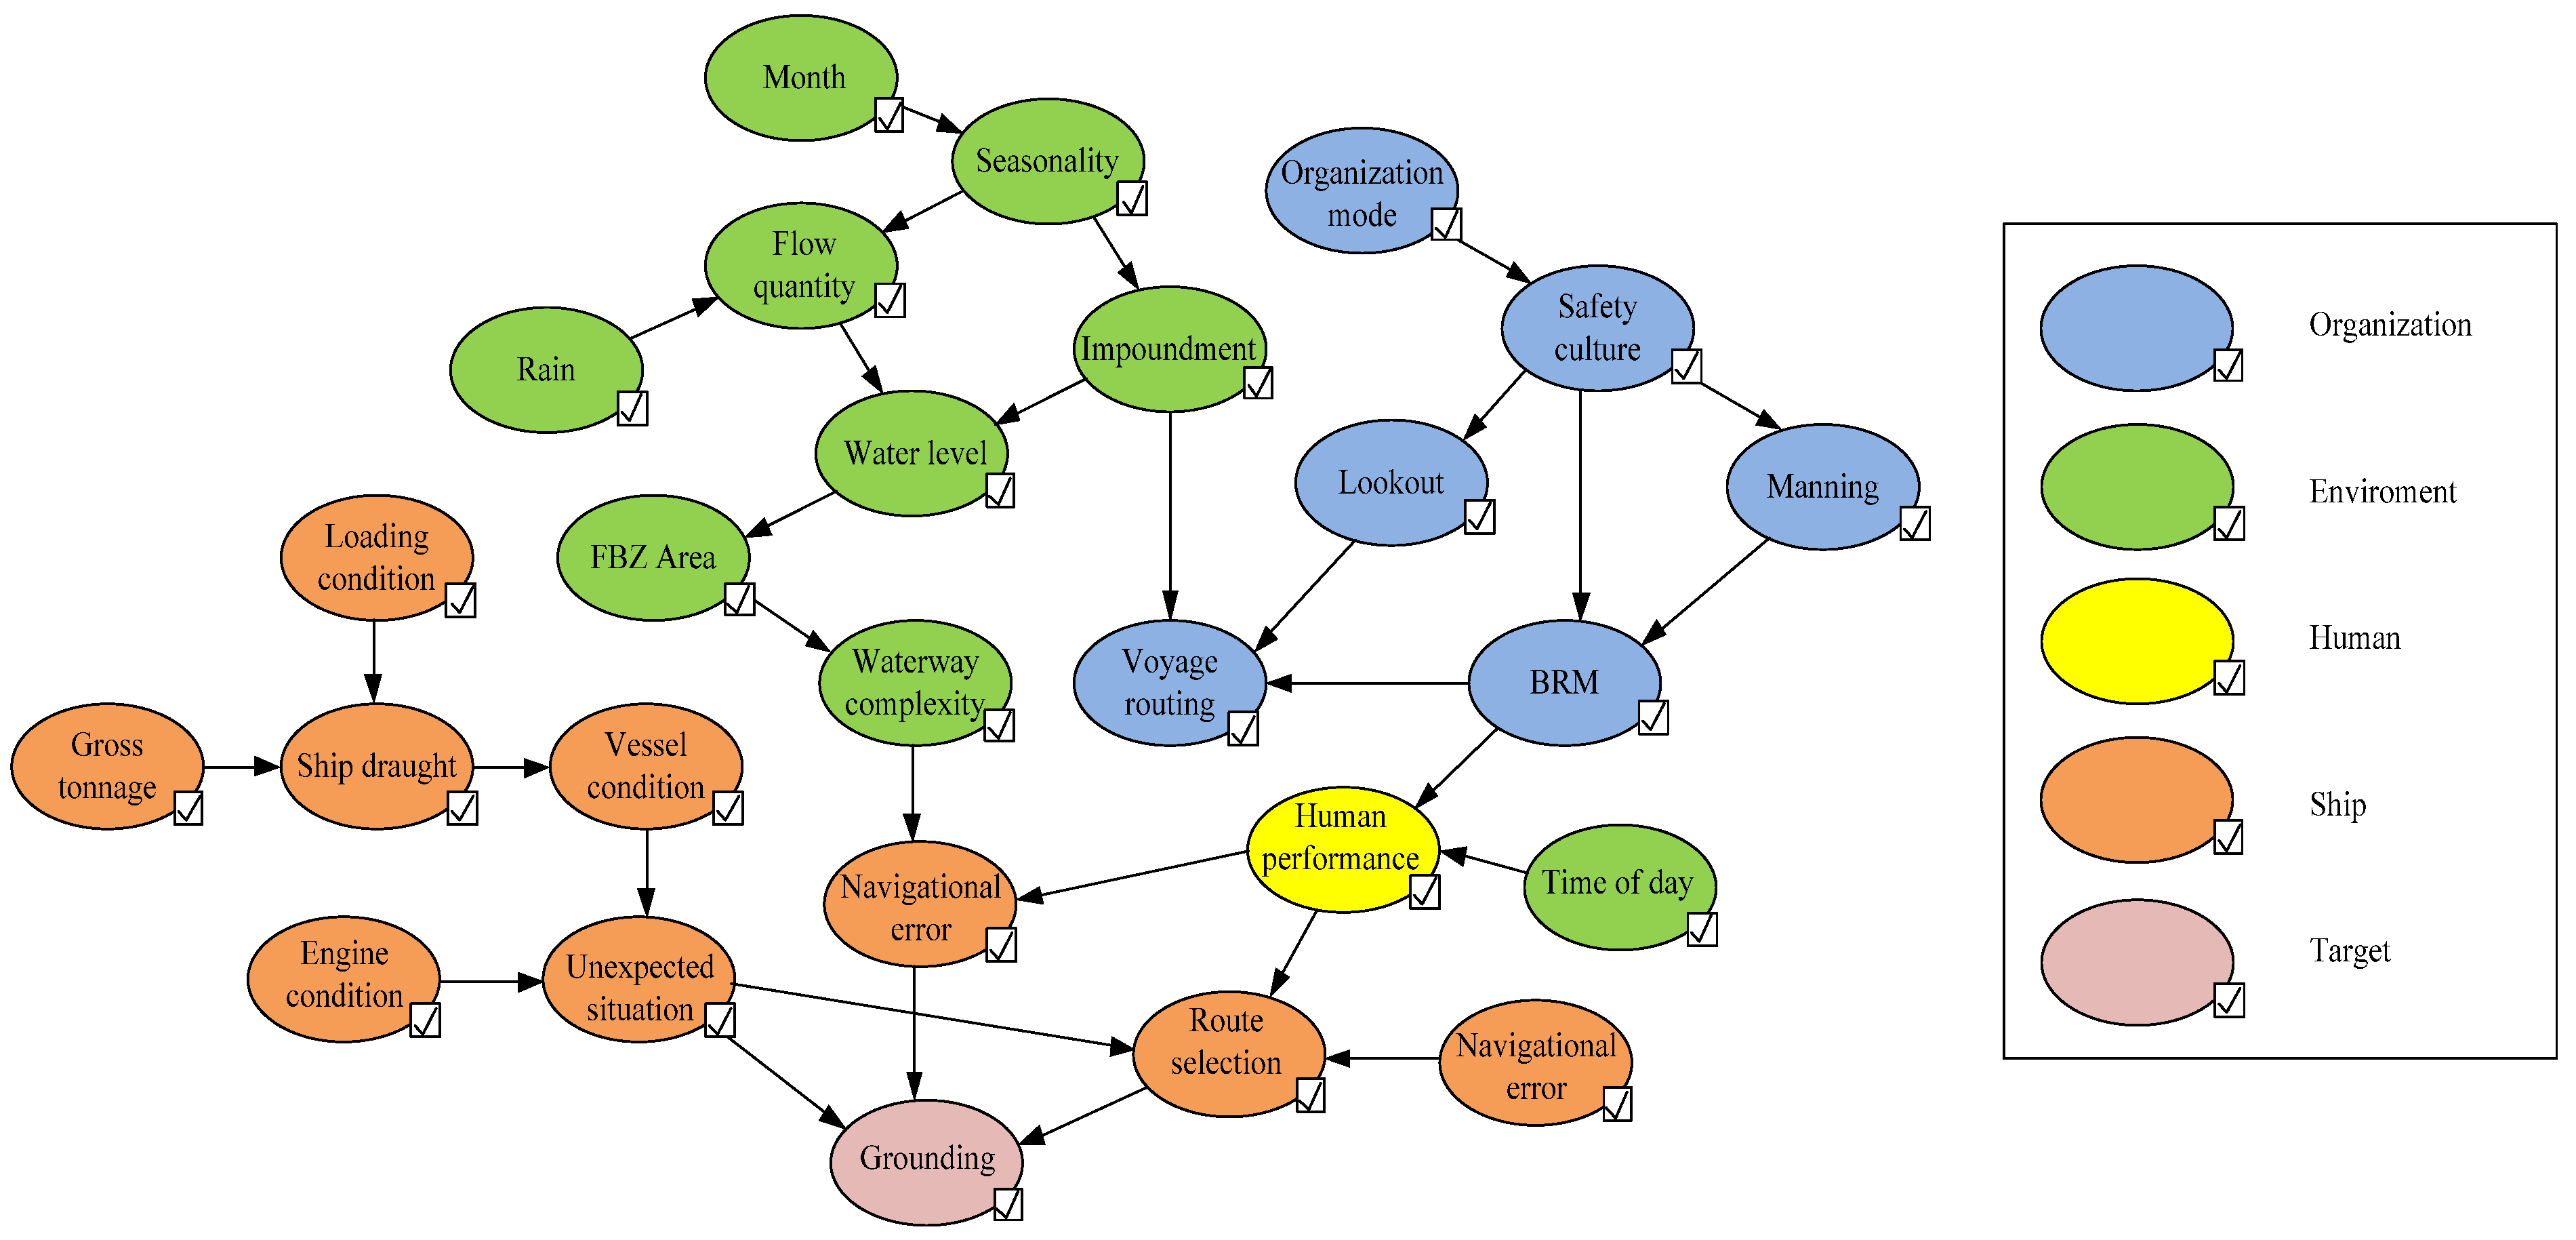
The Modified Human Factors Analysis and Classification System (HFACS) is introduced to identify the hazards of the maritime transportation system, and various influencing factors are defined. Factors such as safety culture and bridge resource management (BRM) are derived from previous studies.
In this modeling process, the organization–human–environment–ship (OHES) taxonomy was introduced to derive the structure of the four components. After obtaining the previous information and CPTs for the BN model, the results of modeling the assessment of the grounding probability in the test area are shown in
Figure 3. After building the model and conducting the simulation, it was concluded that out of 26 factors, the area of the fluctuating backwater zone, the month of the year and the water level are the main factors behind the occurrence of grounding accidents in the Three Gorges Reservoir area [
19].
However, this model has its drawbacks and limitations, which are that the proposed model is mainly developed based on statistics data and there is a possibility that the misdirection of accidents may increase the uncertainty of the model and affect the accuracy of the estimated result. In addition, the problem is that not all accidents are investigated. The BN structure is built based on the chain of accident evolution within the Human Factors Analysis and Classification System (HFACS). However, the chain of successive events leading to a grounding accident may be different; for example, the ships, crew, external and internal conditions and situations can be different.
4. Statistical Models
The model designed by Pederson [
20] and the Simonsen model [
21] are some of the best-known grounding models. They are based in the integration of the functions of the probable density of the traffic flow over the obstacles’ boundaries. The models have been used in many software tools for grounding risk assessment [
51,
52].
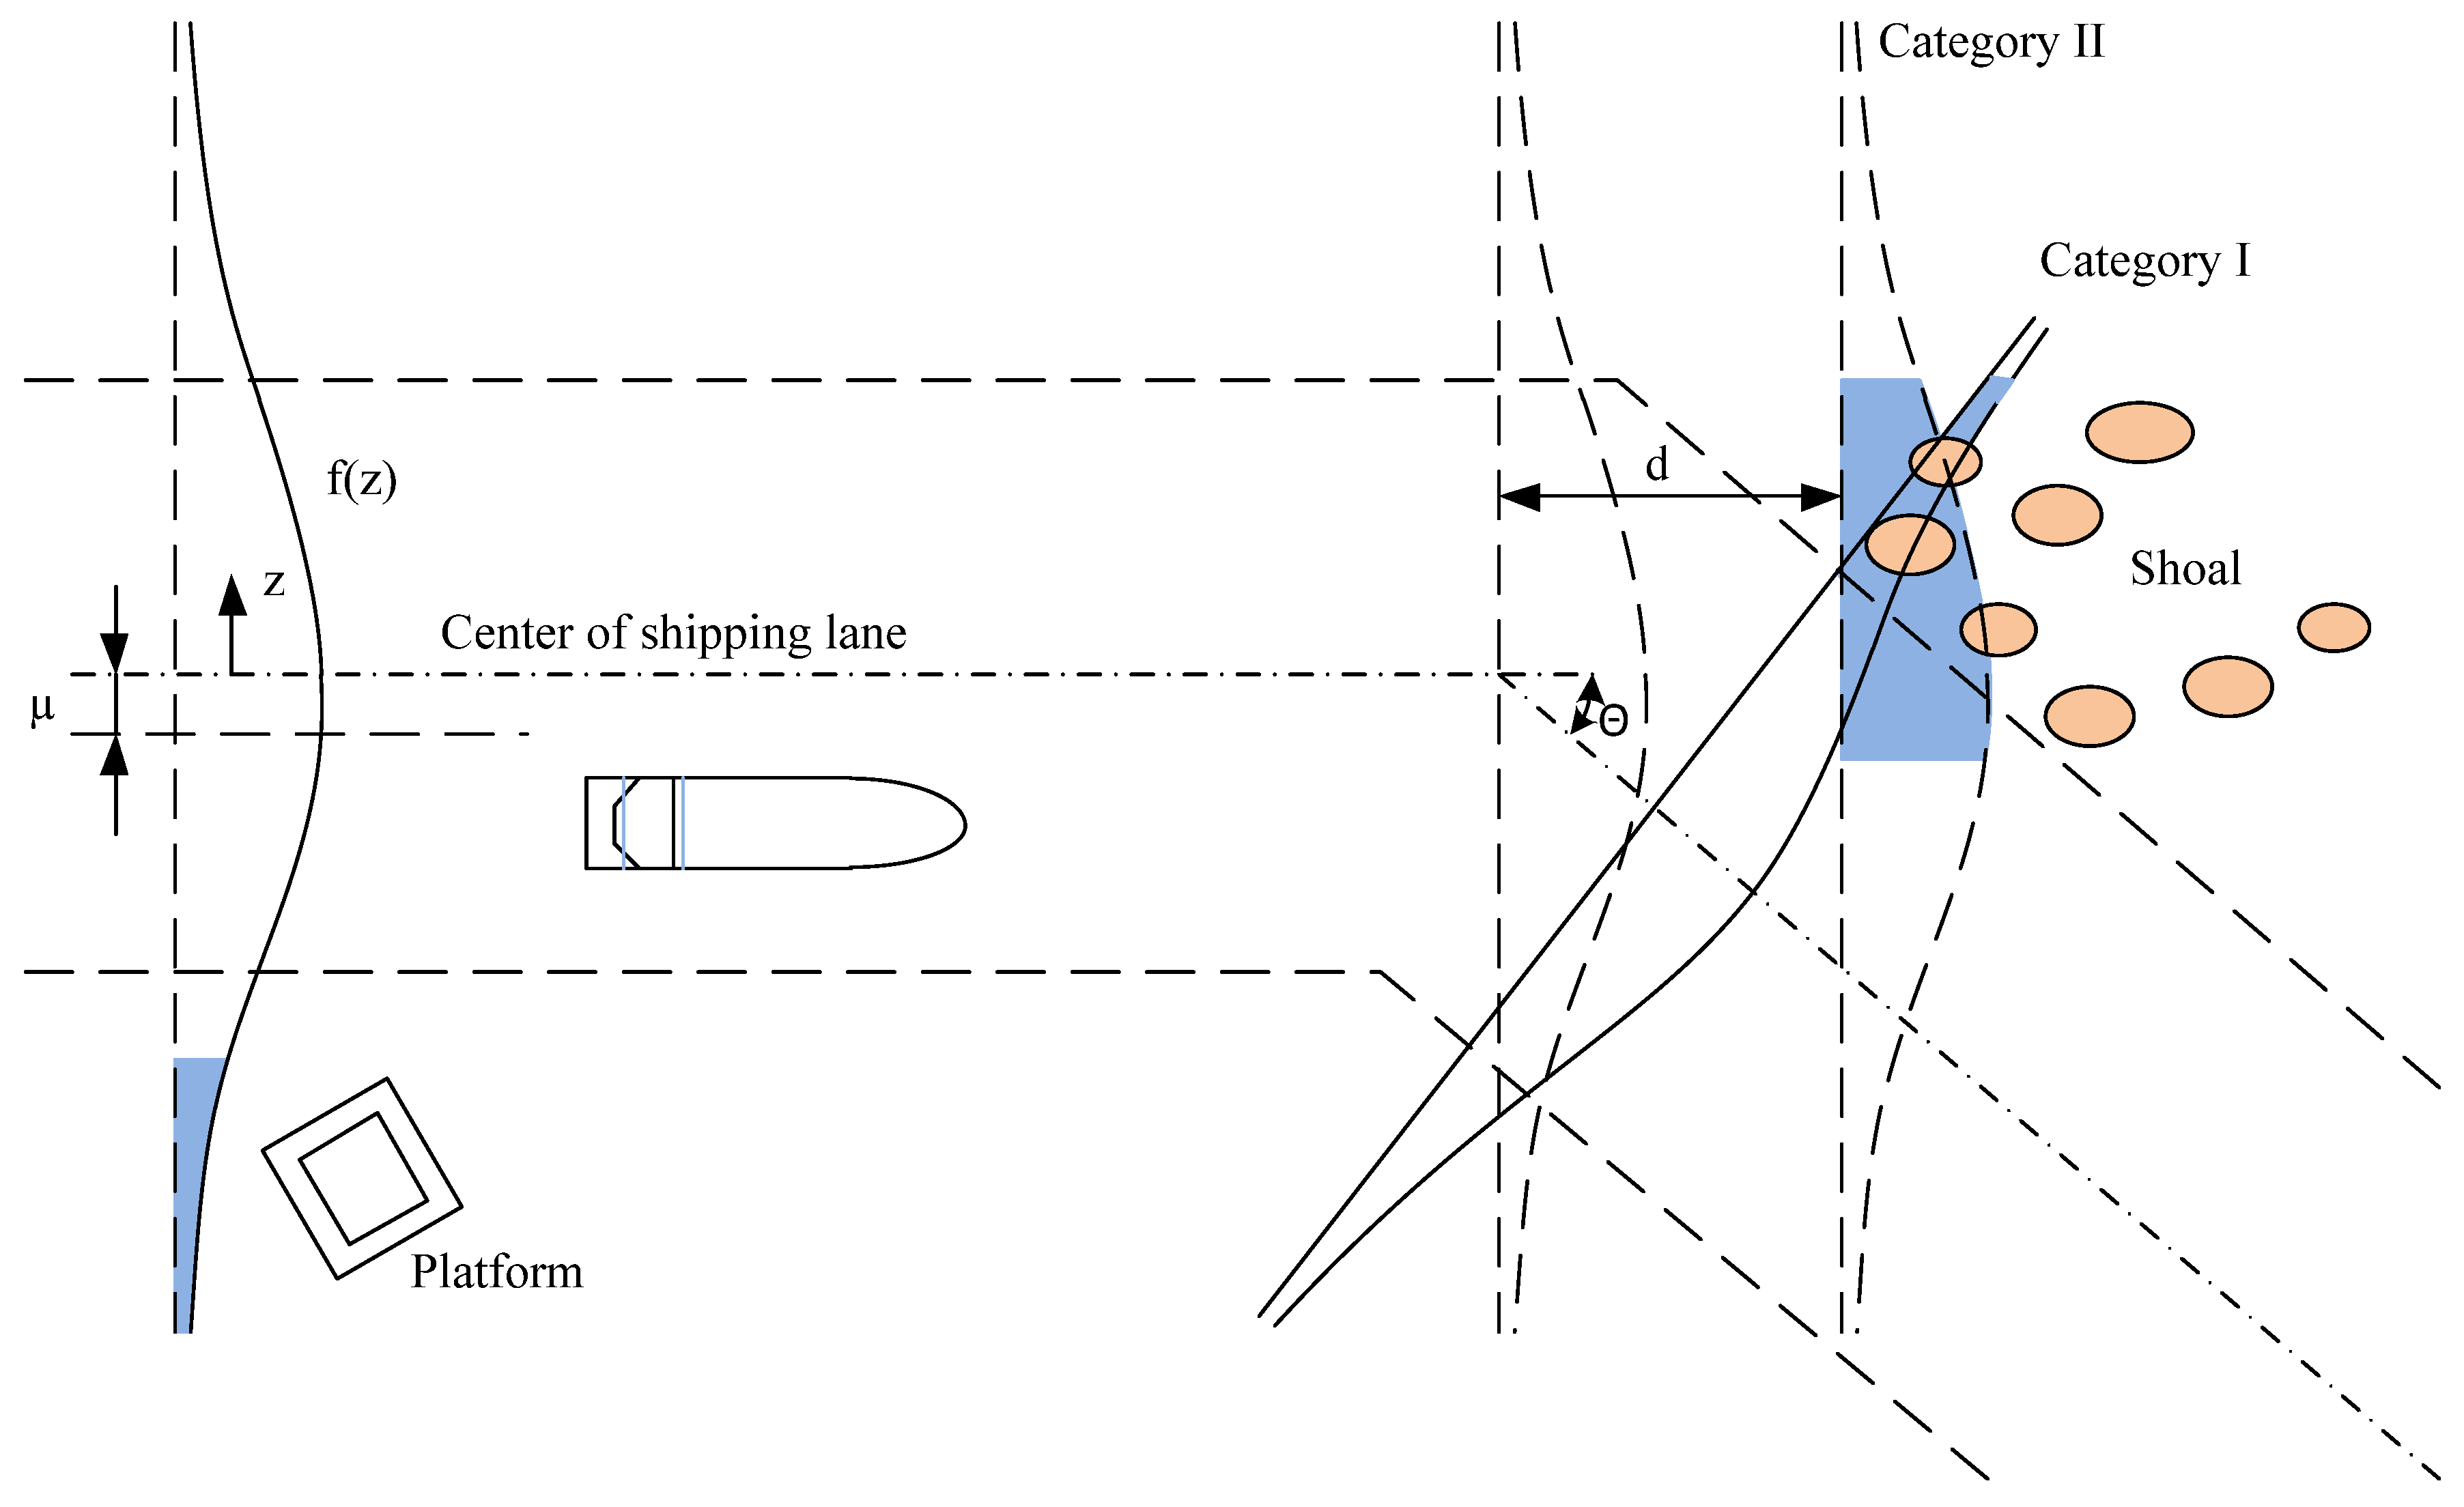
The author of [
20] defined an imaginary route with a turning point on a navigation route around the shoal where vessels with a draught over a defined level may run aground (
Figure 4).
The grounding/collision scenarios may fall into four different categories:
Category 1. In this scenario, the vessels proceed along the ordinary, direct route at normal speed. The accidents occur mainly due to human error, but may also involve vessels coping with unexpected propulsion or steering problems arising in the vicinity of the stationary underwater structure or the shoal;
Category 2. This scenario includes the vessels failing to alter their course at a given turning point near the obstacle;
Category 3. In this category, the vessels take an avoiding action at sea, in the vicinity of the obstacle and, as a result, collide with the stationary marine structure or strand on the shoal;
Category 4. All other vessels steering with all other navigation patterns that are not included in Categories 1, 2 or 3; e.g., off-course and drifting vessels.
The assessment of grounding rates in shallow waters can be achieved as the sum of all four categories of accidents.
When developing the grounding model, Pedersen [
20] took into consideration the time factor; hence, his model is able to assess the expected rate of groundings over a year or, generally speaking, the frequency of grounding.
Simonsen [
21] modified the Pedersen model. While Pederson divided the grounding scenarios into four different categories, Simonsen defined the expected number of grounding events for the first two categories as
where
ai is the average distance between position checks by the navigator (assumed to be 75% of the ship’s length while it is in the channel and set to one ship length while it is between the channel and the harbor);
d is the distance from the obstacle to the bend in the navigation route, varying with the lateral position, s, of the ship;
I is the index for the ship class, categorized according to the vessel type and its deadweight (DWT) or length;
fi(
z) is the probability density function for the ship traffic;
NI is the expected number of grounding events per year in Category I;
NII is the expected number of grounding events per year in Category II;
PC,i is the causation probability—i.e., the ratio between the ships aground and the ships on a grounding course;
Qi is the number of ships in class
i passing a cross section of the route per year;
FCat is the expected number of collisions or groundings per year;
z is the coordinate in the direction perpendicular to the route; (
Zmin,
Zmax) are the transverse coordinates for an obstacle.;
e−d/a is the factor representing the probability of the navigator to fail to check the ship’s position from the bend in the channel to the obstacle, assuming that the position check event can be described as the Poisson procedure.
The Simonsen model could be used even for collision rate calculation, with the integration boundaries allowing only the ships in the meeting or grounding course to be taken into account [
5]. The theoretical result achieved through the model is highly sensitive to the cause probability (P
C) and the distance between each position check, ai.
Karlsson and other authors [
22] defined the model for grounding at the Oresund bridge connecting Malmö in Sweden to Copenhagen in Denmark. This model’s authors suggest that the distribution of the vessel traffic in a navigation channel can be assumed as the combination of the uniform and normal distributions; i.e., 2% of the uniform and 98% of the Gauss distribution. It is assumed that this conclusion arises from the traffic distribution database [
5].
In this model, the probability of grounding for the vessels using a pilotage service is similar to that referring to other vessels without pilot assistance, which is opposite to what is generally believed regarding the presence of pilots on board. The model defined by Karlsson and other authors relates the grounding probability to human error [
22].
Kite-Powell and other authors [
1] presented a mathematical model that stems from the Bayes formula of the theory of probability. Given the fact that the definition of the model was not supported by any specific situation or scenario, their mathematical model could be applied to grounding events as well. The study shows that the probability of grounding during a transit depends on a number of risk factors that are presented as explanatory variables. If G designates the event where a transit results in grounding, S denotes the event where a transit is completed safely and
X = (
X1,
X2,
X3,…,
Xp) represents the vector of explanatory variables, the conditional probability of G given a specific value
x of
X would be
Although this model does not present any grounding candidates, its procedure is quite useful for determining causability. The procedure has been rated as correct by many authors who recommend the use of Bayesian Belief Network (BBN) for assessing causability [
5,
43].
Otto and other authors presented a study featuring the grounding risk calculation. Their model is a simplified version of the Pederson model [
23], which makes it suitable for various grounding scenarios. It also allows the calculation of the annual grounding rates.
The study performed by Det Norske Veritas (DNV) uses Bayes networks for the analysis of groundings and collisions [
53]. This study also features the Formal Safety Assessment (FSA) and involves large passenger ships, proving that the Electronic Chart Display and Information System (ECDIS) is the most cost-effective option for risk control for this type of ships [
54]. Statistical data were added after creating the model’s structure. The conditional probability tables (CPT) were assessed with the aid of expert evaluations and the available historical data on maritime accidents. Moreover, the model discusses the uncertainties regarding the system’s behavior although it does not describe how the uncertainties affect the model’s outputs. The geometric part of the model defines five different scenarios where a vessel becomes a grounding candidate:
When a vessel sails towards a shoal and its course should be altered;
When a vessel’s course follows the coastline and must not be changed, but the vessel turns towards the coastline;
When a vessel sails along the coastline and deviates from its course; the vessel should alter the course but it fails to do so;
When a vessel’s position is incorrect with regard to an obstacle; the vessel should alter the course but it fails to do so;
In a meeting situation, a vessel gives way but the new course leads towards the shoal.
These scenarios have been defined based on the expert knowledge about the system. In addition to human and environment factors, the model includes the causability of technical, organizational and managerial factors.
The grounding risk model presented by Rambøll Danmark provides the rate of grounding, similar to the Pedersen model [
20,
24]. The authors divide an event into two scenarios, according to the nature of the navigation route. In the first scenario, a vessel sails towards an obstacle; i.e., grounding. If the vessel fails to take an avoiding action, it becomes a grounding candidate. In the second scenario, the vessel is in a bended part of the channel; i.e., it is in a bend or its route turns before meeting an obstacle. If the vessel fails to alter its course before the turning point, it becomes a grounding candidate. The authors asserted that a collision with a fixed obstacle could be described as a grounding at zero depth of water. Hence, they used the same model both for groundings and for collisions with fixed obstacles. Parameters referring to the traffic distribution can be achieved by analyzing the data provided by the Automatic Identification System (AIS). The number of grounding candidates can be achieved through the vessel traffic distribution, where it is assumed that certain position corresponds to the combination of uniform and normal distributions. According to the authors, the factors affecting the probability of not taking the avoiding maneuver due to human error or technical fault include the distribution of the vessels’ speeds, the pilot on board, the number of vessels at a location, the distribution of the vessels’ types for each direction, the distribution of the vessels’ draughts, the position of the shoal or obstacle, the distance from the turning point (bend) to the shallow water or location and the depth of the seabed or the obstacle. Clearly, there are a number of factors affecting the probability of non-taking the avoiding maneuver, which requires the analysis of huge amounts of data. For this reason, the authors used the Bayes Network model in data analysis. The principle of the Bayes Network is to define the probability of various states of the system (vessel’s location, distribution of vessel types, probability of human failure, etc.) in various interconnected nodes.
Gucma presented a model that is able to provide the probability of grounding [
25], based on the results produced by the simulation in real time. The model features three separate methods: simulation of maneuvers in real time, Monte Carlo method and the analytical model of the accident consequences. The navigator’s behavior is included through several statistical distributions. There are two approaches: the first is based on the Fourier transformation [
26], while the other relies on the probability approach used by Gucma [
25].
The first stage of real-time simulation determines the function of the traffic density probability and the vessel’s positions over the analyzed passage, along with the distributions of the vessels’ speeds and courses. The second stage of the simulation applies the Monte Carlo method in predicting the results during the passage, including possible weather conditions.
The study presented by Quy and associates features a method for assessing the effects of the environment on a vessel’s maneuvering through the classification of the external forces affecting the vessel, based on the simulation approach [
26]. The model is able to provide the grounding probability. Gucma gives a graphic explanation [
25] that helps the authors to define the model. One of the essential elements for assessing the risk related to the designed width of the fairway is the probability of an accident for the vessel during each section of the fairway. This method represents a combination of the Monte Carlo simulation and probability approaches. The method involves the following categories: maneuvering of the vessel, setting the safety of navigation criteria, environment conditions (winds, waves and currents), and forces and moments affecting the vessel, where the risk is assessed for the passage of each vessel, depending on the generated environment conditions and the size and speed of the vessel. The most important characteristic of this model is the design of scenarios by using various combinations of conditions instead of causability. Various scenarios that a vessel may experience at sea have been taken into consideration.
The COWI model [
27] categorizes the possible scenarios. This model divides the grounding types into three categories:
Category 1. Grounding due to inaccurate navigation. This type of grounding occurs in areas the crew are not familiar with. The inexperienced crew is therefore unaware of the situation. For this type of grounding, the study recommends an analysis of the number of geometric collisions P, several nautical miles prior to grounding unless the course is altered. This type of grounding depends on the distance between the point of observation of the traffic flow distribution over the fairway and the potential grounding position. The shorter the distance, the larger number of vessels that have already altered the course to avoid the physical contact with the seabed. Due to avoiding maneuvers, the number of the observed grounding candidates decreases as the potential grounding position gets closer.
Category 2. Grounding due to failure to alter the course in the bend of the fairway. This type of grounding may occur if the crew do not watch the route carefully. If the obstacle lies ahead of the vessel, and the vessel does not take a new course, deviated from the originally plotted course, it is likely to run aground.
Category 3. Grounding due to drifting. This category is not included in the model analysis.
The studies performed by Uluscu and associates [
28] and by von Dorp and Merrick [
55] are studies using computers to solve time-dependent factors through stochastic scenario modeling based on the available historical data, with the aim of assessing the grounding rate [
28,
55,
56]. Computer models or the navigation bridge simulator are used for this purpose [
25,
57]. The benefit of the computer-aided simulation models lies in the number of scenarios that can be generated and analyzed within a reasonable period of time. In this way, the models generate various traffic flow scenarios based on the distribution of inputs, using the methods such as Monte Carlo. After that, by applying various algorithms, the models analyze the probability of various events for each scenario. The models assess the frequency of events that result in grounding accidents and provide insights into the traffic flow scenario, thus enabling the transfer of the results into the consequence models for additional analysis after the event takes place [
42]. Furthermore, the computer-aided models are able to spread the uncertainty of the input variables onto the outputs, to be further analyzed by the decision-makers, which has been accepted as the way to solve the issue of uncertainty [
55,
58].
In both studies, the grounding probability scenario has been designed on the basis of expert knowledge, so that the model is able to draw the risk chart based on the grounding rate over the time of simulation. The particular feature of these models is their ability to include details and develop outputs, depending on a specific location. Simpler models—e.g., for tanker grounding simulation—use the ship’s details, such as its dimensions and mass, to forecast the extent of the damage to its holds and the scope of the oil spill after the grounding [
59,
60,
61].
The program tool IWRAP developed by the International Association of Marine Aids to Navigation and Lighthouse Authorities (IALA) is a software tool for modeling. It is useful in maritime risk assessment as it can assess the frequency of collisions and groundings along the fairway, based on the information about traffic density, route geometry and bathymetry. This tool uses models similar to Pedersen’s collision and grounding models. Vessel categories from I to IV are considered as arising from the Pedersen model [
29].
IWRAP program assesses the frequency of grounding for vessels in categories I and II by using expressions provided by Pedersen and Simonsen [
20]. The number of grounding candidates is calculated as in the equation featured in the Pedersen model. Simonsen model’s equation is used for the vessels in category II. The program also recognizes two different types of groundings: due to external factor effects and due to the leeway of the drifting vessel. The user can define the probability distribution by choosing any direction of the wind; in the case of drift grounding, it is assumed that the vessels drift downwind, which results in defining the locations where the vessel will run aground. The drifting process can be stopped by repairing the propulsion, anchoring or towing assistance. Engine breakdown is the Poisson process [
62].
The results produced by statistical analyses of accidents in various areas have to be transferred into the observed area, as the navigating conditions vary with locations, which results in inaccuracy. Besides, the assessment of the cause–effect factors based on the accident statistics does not make it easier to understand what is really happening on a vessel that fails to avoid an accident [
63]. Another approach to the assessment of the values of the cause–effect relation is the consideration of the entire chain of events resulting in the failure to take the necessary avoiding actions. Quite often, a combination of small details causes an accident, and this can be considered by using the Fault Tree Analysis or the Bayes Network [
63]. The fault tree is a logic diagram that determines the probability of an undesired event. Boolean algebra is used to combine a series of faults and lower-level events, such as a storm, a sleepy navigator or technical fault. The Fault Tree shows which combinations of lower-level faults may lead to undesired events [
21,
51,
64].
Montewaka and associates presented the risk analysis model for two common sea accidents: collision and grounding [
30]. Special attention was paid to oil tankers as they represent the greatest threat to the marine environment. There are case studies in the selected areas of the Gulf of Finland, in ice-free conditions. The model defines a function that comprises a set of variables such as the vessels’ characteristics, traffic flow and environment, with the purpose of observing the maneuvers of an individual ship at various locations. In order to make a grounding probability assessment, the study suggests a model approach where the vessel and navigation obstacles are seen as interactive objects. The observed situation involves the movement of oil tankers in the access channel to the oil terminal near Helsinki. By using the generic methodology suggested by the IMO, the authors assessed the consequence of the accident expressed as the amount of oil spilt into the sea.
The probability of a grounding event
PG was calculated for the whole length of the sea lane, and expressed as the one-dimensional probability matrix:
Upon calculating the probability matrix, a corresponding element of maximum probability value was selected and added as the grounding event probability in the observed fairway and is thereby considered as the input value for further risk analysis. The study used a physical description of the grounding accident to assist in achieving the goal; i.e., the selection of the safest route for an individual vessel. The model, however, lacks an approach based on evidence, which hampers the model’s validation in terms of knowledge-based risk management [
42].
The study conducted by Lušić and Kos discusses the issue of selecting navigation routes in a coastal area with regard to the grounding probability [
31]. The safety degree assessment is one of the key elements in passage planning and selecting the future route in a fairway. Their model supplements the existing models for the calculation of the potential frequency of grounding by introducing the calculation of the effects of a shoreline that is parallel to the vessel’s course. This allows the navigation routes to be ranked according to the spatial hazard distribution. The model takes into consideration the hazards related to the width of the shipping route, the distance from the turning point to the obstacle lying along the route, the length of the coastal voyage and the distance from the coastline. However, the model does not consider the oceanographic or meteorological conditions, or other external factors that may affect the selection of the navigation route. Furthermore, the model does not refer to maneuvering. The model can be applied to ranking the navigation routes, as it is able to connect the risks arising from the length of the coastal voyage (line of hazard) and the risks arising when the distance from the coastline is changed.
Mohammad Ehsan Khaled and associates presented a study where collision and grounding risk scenarios were modeled in order to facilitate the making of decisions on the enhancement of the safety standards [
32].
Collision risk analysis involves the Vessel Traffic and Management Information System (VTMIS) implemented by the Chittagong Port Authority (CPA). IWRAP MK2 software forecasts the frequency of collision in the port. The analysis of the most probable situation provides a groundwork for suggesting the Risk Control Options (RCO).
Such analyses can be performed in various ports, channels and other confined waters across the world in order to calculate the risk of grounding.
In this specific study, referring to the Port of Chittagong, the probability of grounding causes is assessed by using the localized Bayesian Belief Network (BBN) in HUGIN Researcher software.
5. Discussion
There is no doubt that ship grounding is a type of maritime accident that is dangerous to people, ships and the environment. The causes of grounding are mainly human factors [
1,
14], sea currents [
58], changes between tides [
65], visibility [
1], wind [
1], depths on the waterway [
1], waterway geometry [
58,
65], the age of the vessel [
66], vessel size [
1,
66], vessel type [
1] and speed through the navigational area [
67].
Considering historical statistics, the human factor is mostly the cause of most ship grounding accidents and usually occurs when a ship is moving on its own propulsion means. Insufficient information about the port and navigational area and errors in correcting nautical charts are the main causes of ship grounding accidents. From all the above, it is very important to gain an insight into the grounding frequency or the grounding probability for an area of interest, and to have as accurate a model as possible that can calculate that problem. Many scientists have dealt with this issue and tried to contribute to greater safety in maritime transport.
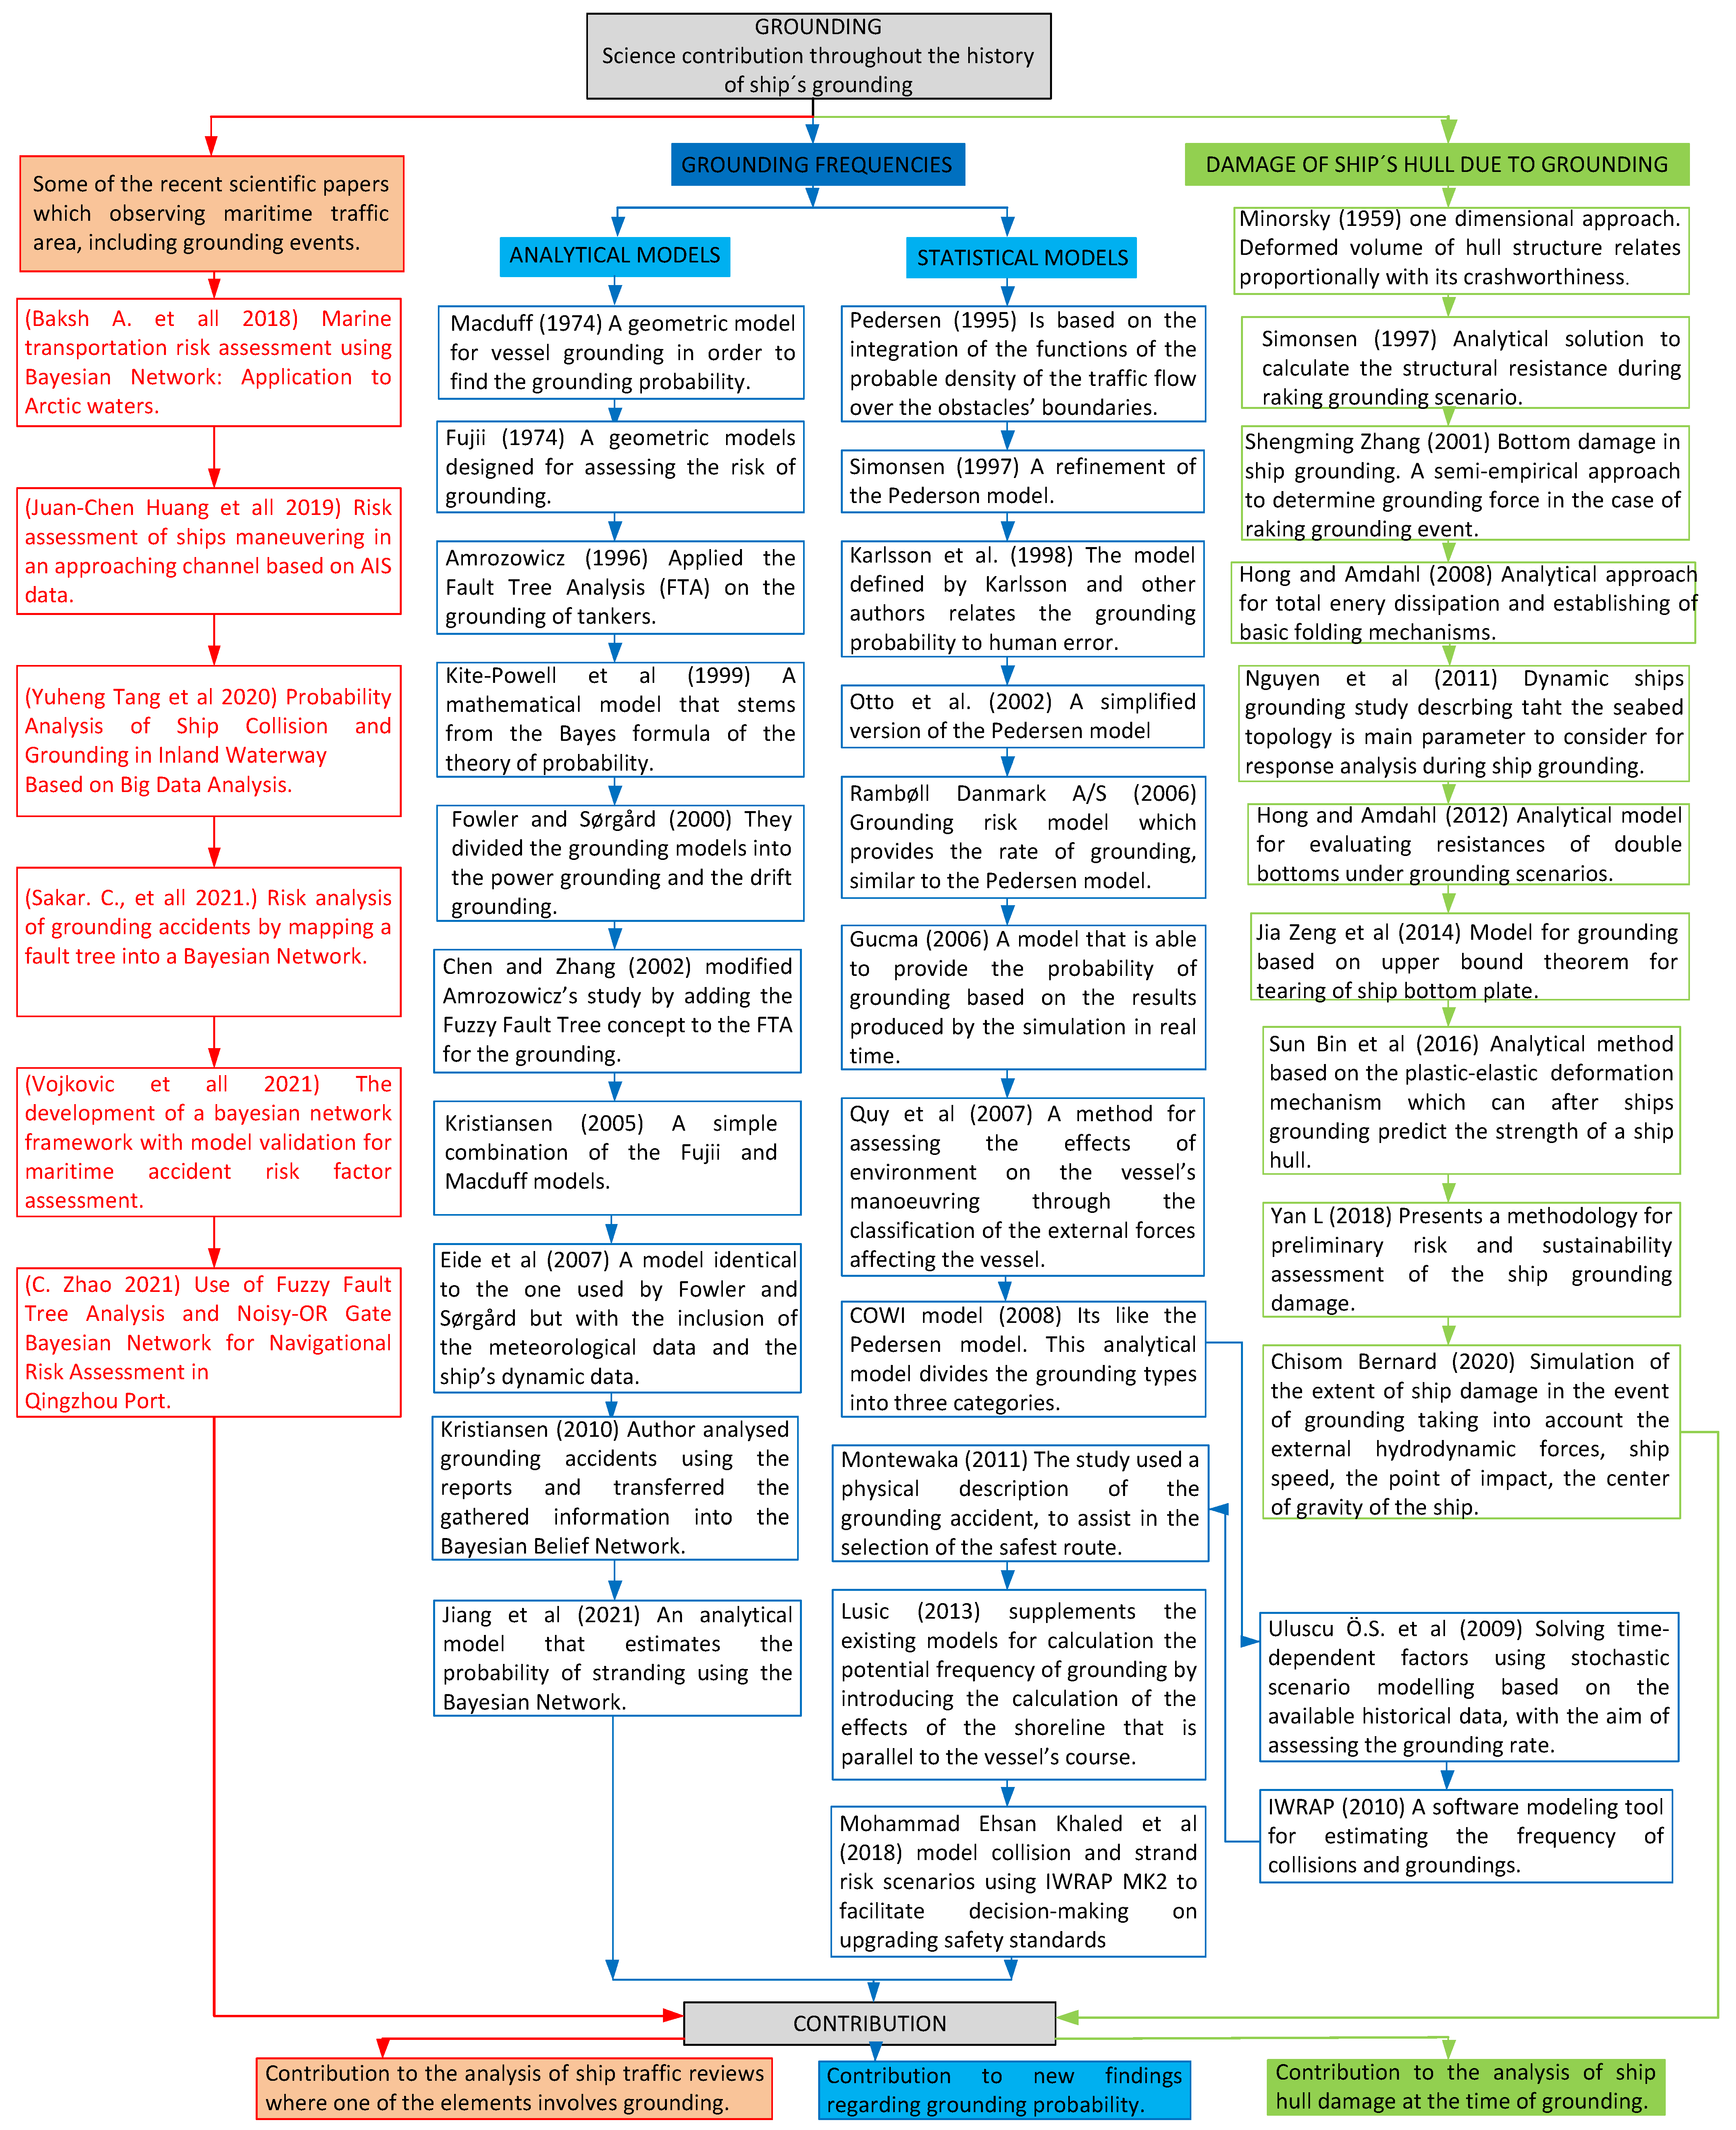
Looking chronologically through history, some of the first grounding models were presented by Mcduff (1974), whose model calculates the grounding probability, and Fuji (1974), whose model is used to calculate the number of groundings (
Table 1).
After their contributions, Pedersen (1995) presented a statistical model in which he divided groundings into categories. Like the Fuji model, the Pedersen model gives the number of groundings, but it does not give the grounding probability like the McDuff model.
However, Pederson introduces a time factor in his model, so his model can estimate the expected number of groundings on an annual basis or the grounding frequency. Shortly afterwards, Simonsen (1997) modified the Pederson model, and with his modified model, he defined the expected number of grounding events. Models from Pedersen/Simonsen are becoming the fundamental basis of upcoming simulation grounding computer models such as COWI, IWRAP MK2, etc.
A simulation model like COWI is based on the Pedersen (1995) model, in which the grounding occurs for two reasons: inaccurate navigation and missed turns on the route. The COWI program uses accident statistics and thus improves the accuracy of the model with the causing probability.
The basic goal of the IWRAP Mk2 program is to provide the user with a tool that helps to quantify the risks associated with ship traffic in a particular area. The mathematical model used in IWRAP was modified by Pedersen and Friis-Hansen. The method used in IWARP depends on statistics. The disadvantage of such a program is that it uses traffic distribution, and the program needs an AIS traffic database to be accurate, because if there is no complete database of ship distribution through some area, on which the model is based, then the result will not be accurate. All today’s models have one factor in common, and that is statistical data, because they can give a more accurate causing probability.
It is very important in today’s models to conduct as much statistical research as possible to identify the most significant factors that affect the expected grounding frequency when modeling types of accident such as grounding.
The advantage of computer-based simulation models is in the number of scenarios they can generate and analyze in a relatively reasonable amount of time. Therefore, such models can generate different traffic scenarios based on the distribution of input elements. They have possibilities for inserting details and outputs that depend on the area of interest, meaning that many small parameters in combination with each other can cause a stranding accident.
Depending on the needs of the observed area, the required geometric model can differ. If the environment of the observed area is not dynamic and does not have many variable parameters, then the model should be one that could be used for all locations and preferably generally known scenarios—i.e., situations—but then such a model should have as few parameters as possible.
If the environment of the selected location is dynamic and changeable, then the model must be adapted to the selected location and contain the number of variable parameters that most affect groundings in such a dynamic environment; i.e., those parameters that are very important for that selected location.
A factor whose value changes if the scenario of that observed area changes belongs to the causing probability. In a particular scenario, if there are multiple factors affecting ship grounding, then the causing probability is calculated for each of the factors, so the total causing probability can be the sum of all these probabilities for a particular scenario.
However, no matter which model is chosen, to obtain the causing probability for a particular scenario, all the different probabilities need to be known for the situations that can take place at the observed location. Once the cause probability is obtained, it is then multiplied by the geometric probability and the grounding probability for the observed area is obtained.
The appropriate model will be selected by looking at the factors that affect the grounding probability in the observed area, and then the total grounding probability for the current traffic situation can be calculated. After that, the result obtained using the model should be compared with the available statistical data, and then the total grounding probability can be predicted and calculated.
6. Conclusions
Considering a chronological review of the most important scientific papers that have contributed to the frequency of grounding throughout history, it can be concluded that most papers on grounding risk assessment are based on the original ideas of Macduff and Fuji. In their models, the term “grounding candidates” appeared for the first time. Candidates for grounding are those ships that are sailing in the grounding course and do not take any action to avoid such a situation. The model from the author Mcduff gives the grounding probability, and the model from the author Fuji gives the approximate number of ships that will be grounded; i.e., the number of groundings in different given conditions, known as the causing probability. A probability of ship grounding is generally obtained by multiplying the geometric probability and the causing probability. Geometric probability represents the probability of a ship that is a candidate for grounding; i.e., it is a ship sailing in the grounding course.
The causing probability tells us how likely it is that the ship will fail to take an avoidance maneuver to avoid grounding with the impact of internal or external factors on the ship in different situations. The ship is a grounding candidate during its passage through the observed area. Ships passing through the observed area are grounding candidates, and if this number of grounding candidates is multiplied by the causing probability, the number of groundings will be obtained. In order to find the grounding probability in today’s models, for a certain observed area of interest, there should be a number of grounding candidates for that area, but also a causing probability. Following the Macduff and Fuji models, the authors Pedersen and Simonsen presented their own grounding models.
The most important advantage of the Pedersen/Simonsen models is that instead of traffic volume and traffic density, they used traffic distribution. The traffic distribution is more accurate than the traffic volume for estimating grounding candidates because the traffic distribution also shows the position of ships within the waterway. However, the problem with distribution is that, in practice, a complete AIS traffic database is needed to be accurate, because if there is no complete database of ship distribution through an area of interest, then the method will not be accurate, but it will be mostly an estimation for an area.
There are various factors that affect the probability of grounding. These factors can be internal, which occur in the ship, or external—these factors are related to the environment that surrounds the ship. For example, some factors need to be statistically processed to see their impact on a ship sailing in the observed area. For example, these can be meteorological and oceanographic factors, a factor of a situation in which a ship is found in an environment, a factor caused by man, etc. Such factors need to be statistically processed in order to get a clearer picture of the impact of the causing probability.
Ship traffic for an area is a factor which is present in almost all existing grounding probability models and is considered to be one of the main factors to have an impact on the expected ship grounding frequency. The sustainability of maritime safety and grounding frequency for a traffic area need to be rationally assessed for the sake of safe and sustainable maritime transport. It is necessary to analyze the problem of ship grounding for a particular area of interest, considering the consequences of the damage that may occur.
In recent scientific articles by various authors that describe grounding frequency models, it can be observed that simulation models, such as Bayesian Networks, are becoming increasingly popular because they have the ability to show complex uncertain relationships for modeling grounding probability. If data are insufficient for the area of interest, then the advantage of such models is the ability to combine existing data with expertise and update the model after gaining more evidence, which further improves the feasibility of the simulation. However, as the complexity of the model increases, so does the number of probability parameters to be determined, which can be challenging.
After all the above, it can be concluded that the review of the literature in this paper deals with the most important models regarding the frequency of grounding; in addition, previous models are systematized, all for the purpose of further guidance for future research on the frequency of grounding and development of future models that will contribute to greater safety at sea.


