Article

The SHAPE Project: An Innovative Approach to Understanding Seasonal and Diel Dissolved Oxygen Dynamics in the Marano and Grado Lagoon (Adriatic Sea) under the WFD/2000/60/CE

Agenzia Regionale per la Protezione dell’Ambiente (Arpa FVG), Via Cairoli 14, Palmanova, 33057 Udine, Italy
*
Author to whom correspondence should be addressed.
J. Mar. Sci. Eng. 2022, 10(2), 208; https://doi.org/10.3390/jmse10020208
Submission received: 12 October 2021 / Revised: 17 January 2022 / Accepted: 1 February 2022 / Published: 4 February 2022

Abstract

:
Dissolved oxygen (DO) is a key element for the survival of marine organisms and is a supporting element in the current Water Framework Directive (WFD). DO deficiency is a common event that occurs in coastal environments such as estuaries and lagoons, but a long-term DO database that helps detect daily and seasonal oscillations is difficult to obtain with commonly used sampling and analytical procedures. In this work, a network of multi-parametric probes was deployed in the Marano and Grado Lagoon (northern Adriatic Sea, Italy) in order to obtain a dataset from the continuous monitoring of DO and complementary parameters. DO showed a high degree of variability both in terms of spatial and seasonal distribution and was dependent on solar radiation and water temperature. During the summer and in areas characterised by scarce water renewal, DO was below the threshold set as the minimum requirement for aquatic life, thus some water bodies (WBs) were classified as moderate sensu WFD. The inputs of freshwater discharge from inland and marine waters during tides are, however, able to well oxygenate most of the lagoon. These results will be useful in supporting the management and protection of this vulnerable environment.

1. Introduction

Lagoons are ecotones between marine and terrestrial environments and are globally widespread, covering variable surfaces ranging from 0.01 to more than 10,000 km2. They represent approximately 5.3% of the European coastline [1] and the Mediterranean Sea basin comprises approximately 600 lagoons. Due to increasing anthropic pressures, coastal lagoons are particularly vulnerable and, as a consequence, they are subjected to numerous scientific studies regarding the management of their conservation, sustainable use and assessment of their ecosystem services [2,3]. Lagoons are currently managed at an international level within the framework of the Convention on Wetlands (https://www.ramsar.org/, accessed on 10 October 2021) and through their classification as priority habitats in the more recent Birds Directive (79/409/EEC), European Union Habitats Directive (92/43/EEC) and in the last European Water Framework Directive (WFD) (2000/60/EEC) under the category “transitional waters”. In particular, the goal of the WFD was to reach “good ecological status” for all European surface water bodies by 2015 (this deadline can be postponed by 2027 if certain exemptions are invoked), by taking into account biological, chemical and morphological conditions. In detail, the physico-chemical parameters such as transparency, temperature, salinity, dissolved oxygen and nutrient concentration are used to support the classification of biological elements (composition and abundance of phytoplankton, other aquatic flora, benthic invertebrates and fish fauna) [4].
Among the physico-chemical parameters, dissolved oxygen (hereafter referred to as DO) plays a pivotal role in determining the adverse impact on feeding, growth, reproduction, respiration, survival, species diversity, biological interactions and community structure of benthic and pelagic species when its concentration drops below a critical level [5,6,7]. Dynamic patterns of DO are controlled by biological, chemical and physical processes. It is produced in situ via photosynthesis (by aquatic plants, algae and photosynthetic eubacteria), and consumed through respiration of aerobic organisms (plants, animals and bacteria), nitrification (mainly Nitrosomonas and Nitrobacter), oxidation and biological and sediment oxygen demand degradation process. In addition, DO is actively exchanged at the water–air interface depending on its saturation level and on numerous physical parameters and processes (e.g., temperature, wind intensity, mixing, waterfalls, tides etc.) [8].
A global decline in the DO content both in the open ocean and in coastal areas has been acknowledged [9,10]) and the number of sites involved in this phenomena have dramatically increased over the last 50 years [11]. Several drivers are responsible for coastal hypoxia, which is defined as a condition where the DO is depleted to a well-defined level (<30% saturation or <2 mg L−1), but it is necessary to emphasise that the conventional threshold for biological stress is set to 5 mg L−1, which is the minimum required for aquatic life in seawater, and that DO should never be below 80% saturation to sustain a healthy biotic community [12,13,14]. As reported by Caballero-Alfonso et al. [15], in open waters hypoxia is caused by anthropogenic enrichment of nitrogen and phosphorus that stimulate the increase of phytoplankton biomass and the degradation of organic matter (OM). These processes require oxygen as an electronic acceptor in both water and sediment, thus reducing its concentration. In addition, natural drivers such as hydrology (reduced horizontal advection enhancing bottom-water residence time, stratification reducing vertical mixing), changes in temperature and in wind patterns, rainfall and runoff affecting the hydrological processes cause the occurrence of DO depletion.
The earliest records of coastal hypoxia reported in literature from Europe and North America in terms of episodic and/or seasonal events date back to 1910–1920, when it was recognised that coastal hypoxia represents a major threat for coastal environments [16]. In Mediterranean coastal lagoons hypoxia and anoxia are common phenomena [17,18,19,20,21,22], thus several regulations are in force to set limits and to periodically monitor the levels of DO (Bathing Water Directive, Shellfish Water Directive, Urban Waste Water Treatment Directive and Water Framework Directive). In addition, oxygen depletion is used to determine the impact of nutrient enrichment within the OSPAR Commission [23].
In spite of its importance, it should be noted that there is little published data regarding the DO concentrations within the Marano and Grado Lagoon (northern Adriatic Sea, Italy) which is one of the most important transitional area of the Mediterranean Sea. In this environment, previous studies were focused on diffusive and benthic fluxes of potentially toxic elements and nutrients at the sediment-water interface; in this case the DO level was investigated only to detect the oxic-anoxic transitions during in situ and mesocosm experiments [24,25,26,27]. These works showed some limitations, such as poor spatial coverage and were limited in time. A more comprehensive study was conducted in the period between August 2013 and July 2014 with the aim of assessing the lagoon’s trophic state [28]. The DO concentrations were lower in summer/autumn than in winter/spring periods and ranged from 7.0 to up to 10.0 mg L−1. The authors highlighted that the DO levels indicated generally good conditions with a mean value of 7.04 mg L−1 (10th percentile) [29], except for most of the confined areas where values below 5 mg L−1 were detected. The major issue is that measurements were always conducted from 9:00 to 14:00 as discrete sampling and, as a consequence, the good level of oxygenation found did not take into account the respiration activity that occurs in the absence of solar radiation [27], and this creates a biased estimate of DO condition, since episodic hypoxia is more likely to occur at night [14].
To fulfil the objectives set by the WFD/2000/60/CE, it is necessary to have a long-term series of DO concentrations available, which is difficult to obtain by means of common in situ sampling procedures combined with chemical and electrochemical techniques in the laboratory [30,31]. In addition, field work also disturbs natural ecosystems such as the Marano and Grado Lagoon. The use of permanent sampling equipment (i.e., anchored stations, surface floating modules or buoys) is a helpful approach to investigate DO level oscillations with low sampling time interval (from minutes to hours) and to cover the natural day/night cycles [31,32,33,34,35].
The implementation of the WFD/2000/60/CE was put into law via Italian Legislative Decree no 152/2006, and by decrees for typing (DM 131/2008), monitoring (DM 56/2009) and classification (DM 260/2010). On the basis of geographic, geomorphological and salinity descriptors and of drivers and pressures, the Marano and Grado Lagoon was subdivided into 17 water bodies (WBs) which are the areas subjected to final classification. The Marano and Grado Lagoon was the selected site where the SHAPE Project (Shaping a Holistic Approach to Protect the Adriatic Environment) took place. This project was focused on integrated coastal management and maritime spatial planning and, in this context, the Environmental Protection Agency of Friuli Venezia Region (ARPA FVG) had the opportunity to set up a real-time monitoring system for DO from 2013 to 2020 at 18 sites. The results of the aforementioned monitoring are presented in this work, which was focused on the detection of the degree of occurrence of hypoxic and anoxic conditions that, in turn, influence the WBs classification (Annex V, WFD/2000/60/EC) by also taking into account the spatial heterogeneity of the system. In addition, the global dataset provided much needed daily, seasonal and inter-annual DO variability to determine the influence of complementary parameters on DO dynamics.

2. Materials and Methods

2.1. Environmental Settings

The Marano and Grado Lagoon is one of the best preserved wetlands in the whole Mediterranean Sea and since 1971 it has been protected by the Ramsar Convention and, following the implementation of the Habitats Directive (92/43/EC), it is also identified in the state-sponsored “Natura 2000” survey as a Site of Community Importance (SCIs–IT3320037) (Figure 1).
It belongs to the northern Adriatic lagoon network (Venice Lagoon, Pialassa della Baiona, Caorle Lagoon and less important areas) and extends for approximately 32 km reaching a width up to 5 km (A = 160 km2) between the Tagliamento and Isonzo River deltas. As reported in Brambati [36], the lagoon can be divided into six sub-basins (Lignano, S. Andrea, Buso, Morgo, Grado and Primero) which were also confirmed recently from the hydrodynamic point of view [37]. The morphology and hydrology of the system are quite complex. De Vittor et al. [27] described the western sector (Marano) as an environment with few areas above sea level and with several channels linking the plain spring rivers flowing into its internal edge towards the sea, whereas the eastern sector (Grado) is a shallower (<1 m on average) complex hydrographic network including tidal flats, tidal channels and subtidal zones. The more recent bathymetric chart well represents the complexity of the Marano and Grado Lagoon [38]. The freshwater inputs are higher in the Marano sector due to discharge from the Stella and Cormor Rivers (36.1 and 10.7 m3 s−1, respectively), whereas the Turgnano, Zellina, Aussa-Corno, Natissa and Tiel Rivers are less important; in addition, numerous drainage pumps located in the low Friulian plain also contribute. Despite the freshwater inputs, the innermost part of the lagoon suffers from scarce water renewal [37,39]. The exchange with the open sea (Gulf of Trieste) takes place via several inlets. The most important are Grado (390 m wide/10 m deep, 22% of the total water exchange), Porto Buso (430 m, 30%) and Lignano (310 m/11 m, 35%) [40]. Tides are semidiurnal with a mean range of 0.65 m and spring and neap ranges of 1.05 and 0.22 m, respectively [41], and, coupled with wind, act as forcing factors for water circulation and renewal. Tides generate daily salinity gradients of more than 10 PSU, especially in the western part of the lagoon and close to the mouths of the Aussa-Corno and Natissa Rivers, where an average water exchange rate in the order of 5000 m3 s−1 occurs. The water circulation radically changes in case of wind action (especially of the strong winter ENE Bora) and the tides exert a minor role [37]. Due to these active exchanges, salinity strongly varied moving from the tidal inlets (from 30 to 33) to the river mouths (<1), and is regulated by the variability of river inputs: for example, a range from 27.2 to 1.29 was observed in a WB in November and October 2013. Evaporation processes are present only in strongly confined areas over summer [28]. Particulate matter inputs are primarily derived from the deltas of the Tagliamento and Isonzo Rivers (silty and clayey particles, respectively) and the inputs from the other rivers are of secondary importance, however, an estimate of sediment loads is still lacking [42]. Sediment texture showed coarser fractions (sand) in proximity of the tidal inlets and channels, while mud characterised the inner sectors of the lagoon, with the highest percentage of sand, silt and clay being, respectively, 53, 81.3 and 10.4%, whereas the organic carbon content (Corg) was on average 1.23 ± 0.52% [43]. The trophic state (in terms of nutrients) was characterised by Acquavita et al. [28] in a 1-year cycle of physico-chemical measurements. A considerable amount of spatial and temporal variability with the consequent broad range of classes was found (from oligotrophic to hypertrophic depending on water bodies, index applied and period of the year).
There are several important economic activities which take place there, benefiting local inhabitants and the region as a whole: the most important being tourism, fishing and aquaculture [44]. On the other hand, mercury contamination and other persistent pollutants pose some environmental concerns [43,45,46,47] and in the past part of the lagoon was declared to be a polluted site of national interest (SIN; Ministerial Decree 468/01): currently the area of the SIN has been reduced and is not part of the lagoon but involves only some areas located inland. Some areas are also impacted by the presence of nitrates which are derived from agricultural practices (mainly in the Marano sector), manure, urban wastewaters, in situ nitrification and atmospheric deposition [48]. The sediment of the lagoon is periodically subjected to dredging in order to maintain the navigability of major and minor waterways (for industrial, fishing and touristic purposes, (see [49]) and the entire area is influenced by global climate changes that can alter water temperature, rainfall and wind forces [50,51]. All these factors and the presence of areas with a scarce water exchange [37] can affect the DO concentrations [14].

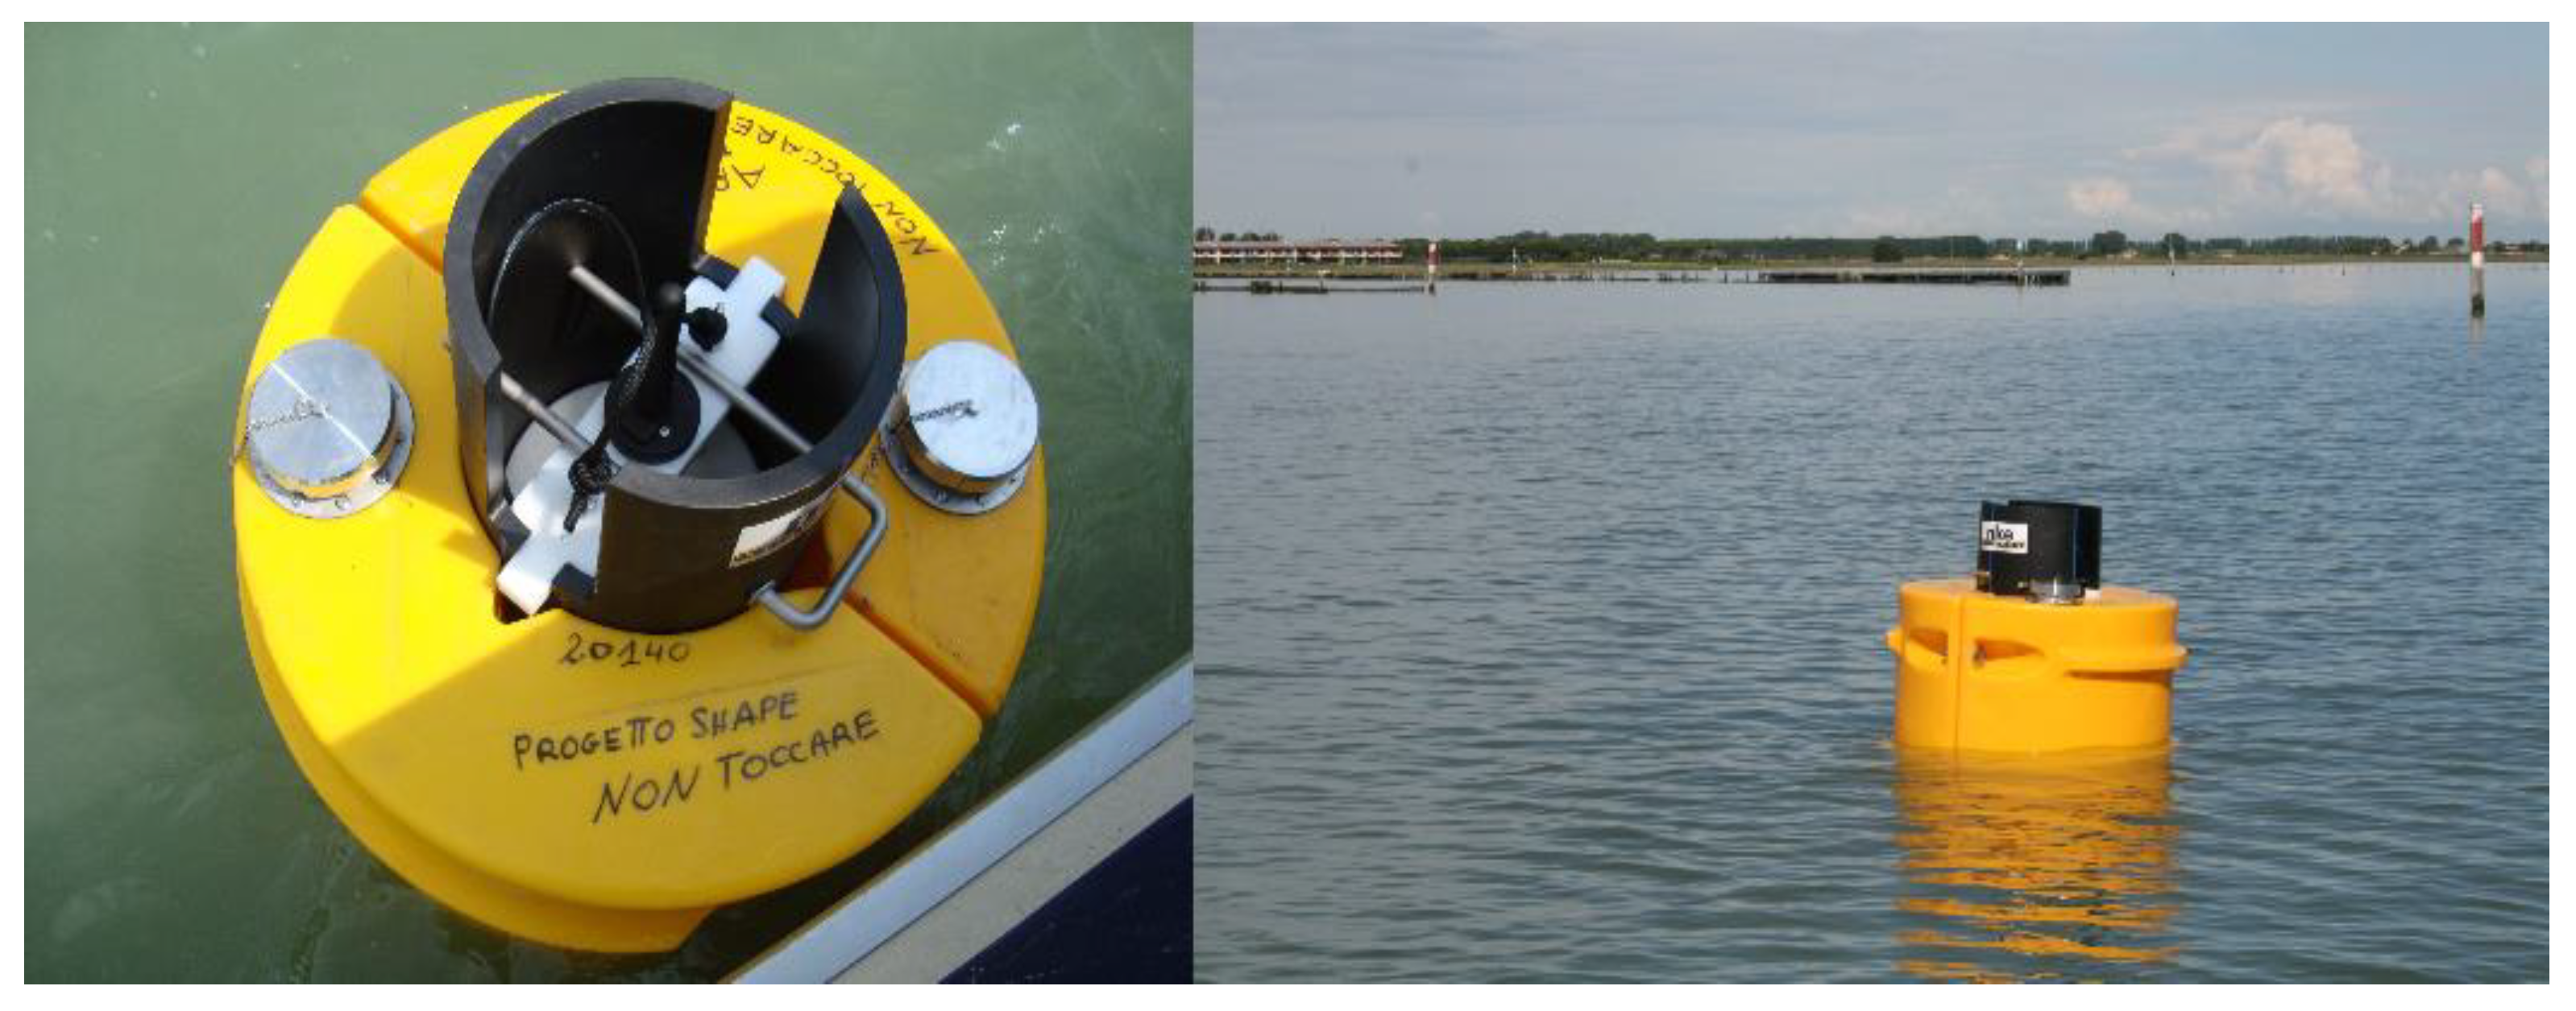
2.2. Multiparameter Probe Characteristics

The dataset was acquired using a network of 5 multi-parametric probe units (SMATCH “Autonomous multi-parameter probe for the measurement of Pressure, Temperature, Salinity, Dissolved Oxygen and pH” Probe, NKE Instrumentation, Lorient, France). This setup was developed by customers in collaboration with the Ifremer (Institut français de recherche pour l’exploitation de la mer, Brest, France) for water quality control, environmental monitoring, monitoring in oyster culture areas, and salinity and turbidity measurements for the adjustment of hydrodynamic models. The probes are equipped with an integrated GPS-GPRS modem with a submersible antenna (1.1 m cable length) to be mounted on a specially built float that allows one to transmit the measured parameters via email. The float eliminates the problem of the probe sinking into the sediment of the lagoon, which could result in resuspension, perturbation and acquisition of unreliable data. The probes were placed inside anchored buoys in order to protect them from breakage and keep them on the seafloor during low tide. One of the main advantages of these probes is their potential to operate for several months without human intervention. This is due to the automatic protection system to counter biofouling by means of local chlorination (©Ifremer, Brest, France) based on the electrolysis of seawater. Chlorine is periodically produced on the chlorination grid and spread close to the sensor. In order not to influence the measurement, chlorination is automatically deactivated 30 s before the new measurement cycle.
The Aanderaa Optode optical sensor 4835, based on the effect of dynamic luminescence quenching by molecular oxygen, was used as a DO sensor. The fluorescent indicator is a special platinum porphyrin complex embedded in a gas permeable foil exposed to the surrounding water. This sensing foil is attached to a glass window providing optical access to the measuring system from inside watertight housing. The sensing foil is excited by modulated blue light; the sensor measures the phase of the returned red light. For improved stability, the optode also performs a reference phase reading by use of a red LED that does not produce fluorescence in the foil.
In this study, the probes were used to collect continuous measurements of depth (m), water temperature (°C), conductivity (mS/cm), pH and DO (saturation percentage %). The range, accuracy and resolution of the sensors are reported in Table S1 in Supplementary Materials. The autonomy of the setup depends on the transmission, number of measurements and frequency of chlorination: on average it is 12 months with standard chlorination and daily data transmission. Data up to 4 Mb can be stored. An example of the deployment is reported in Figure 2.

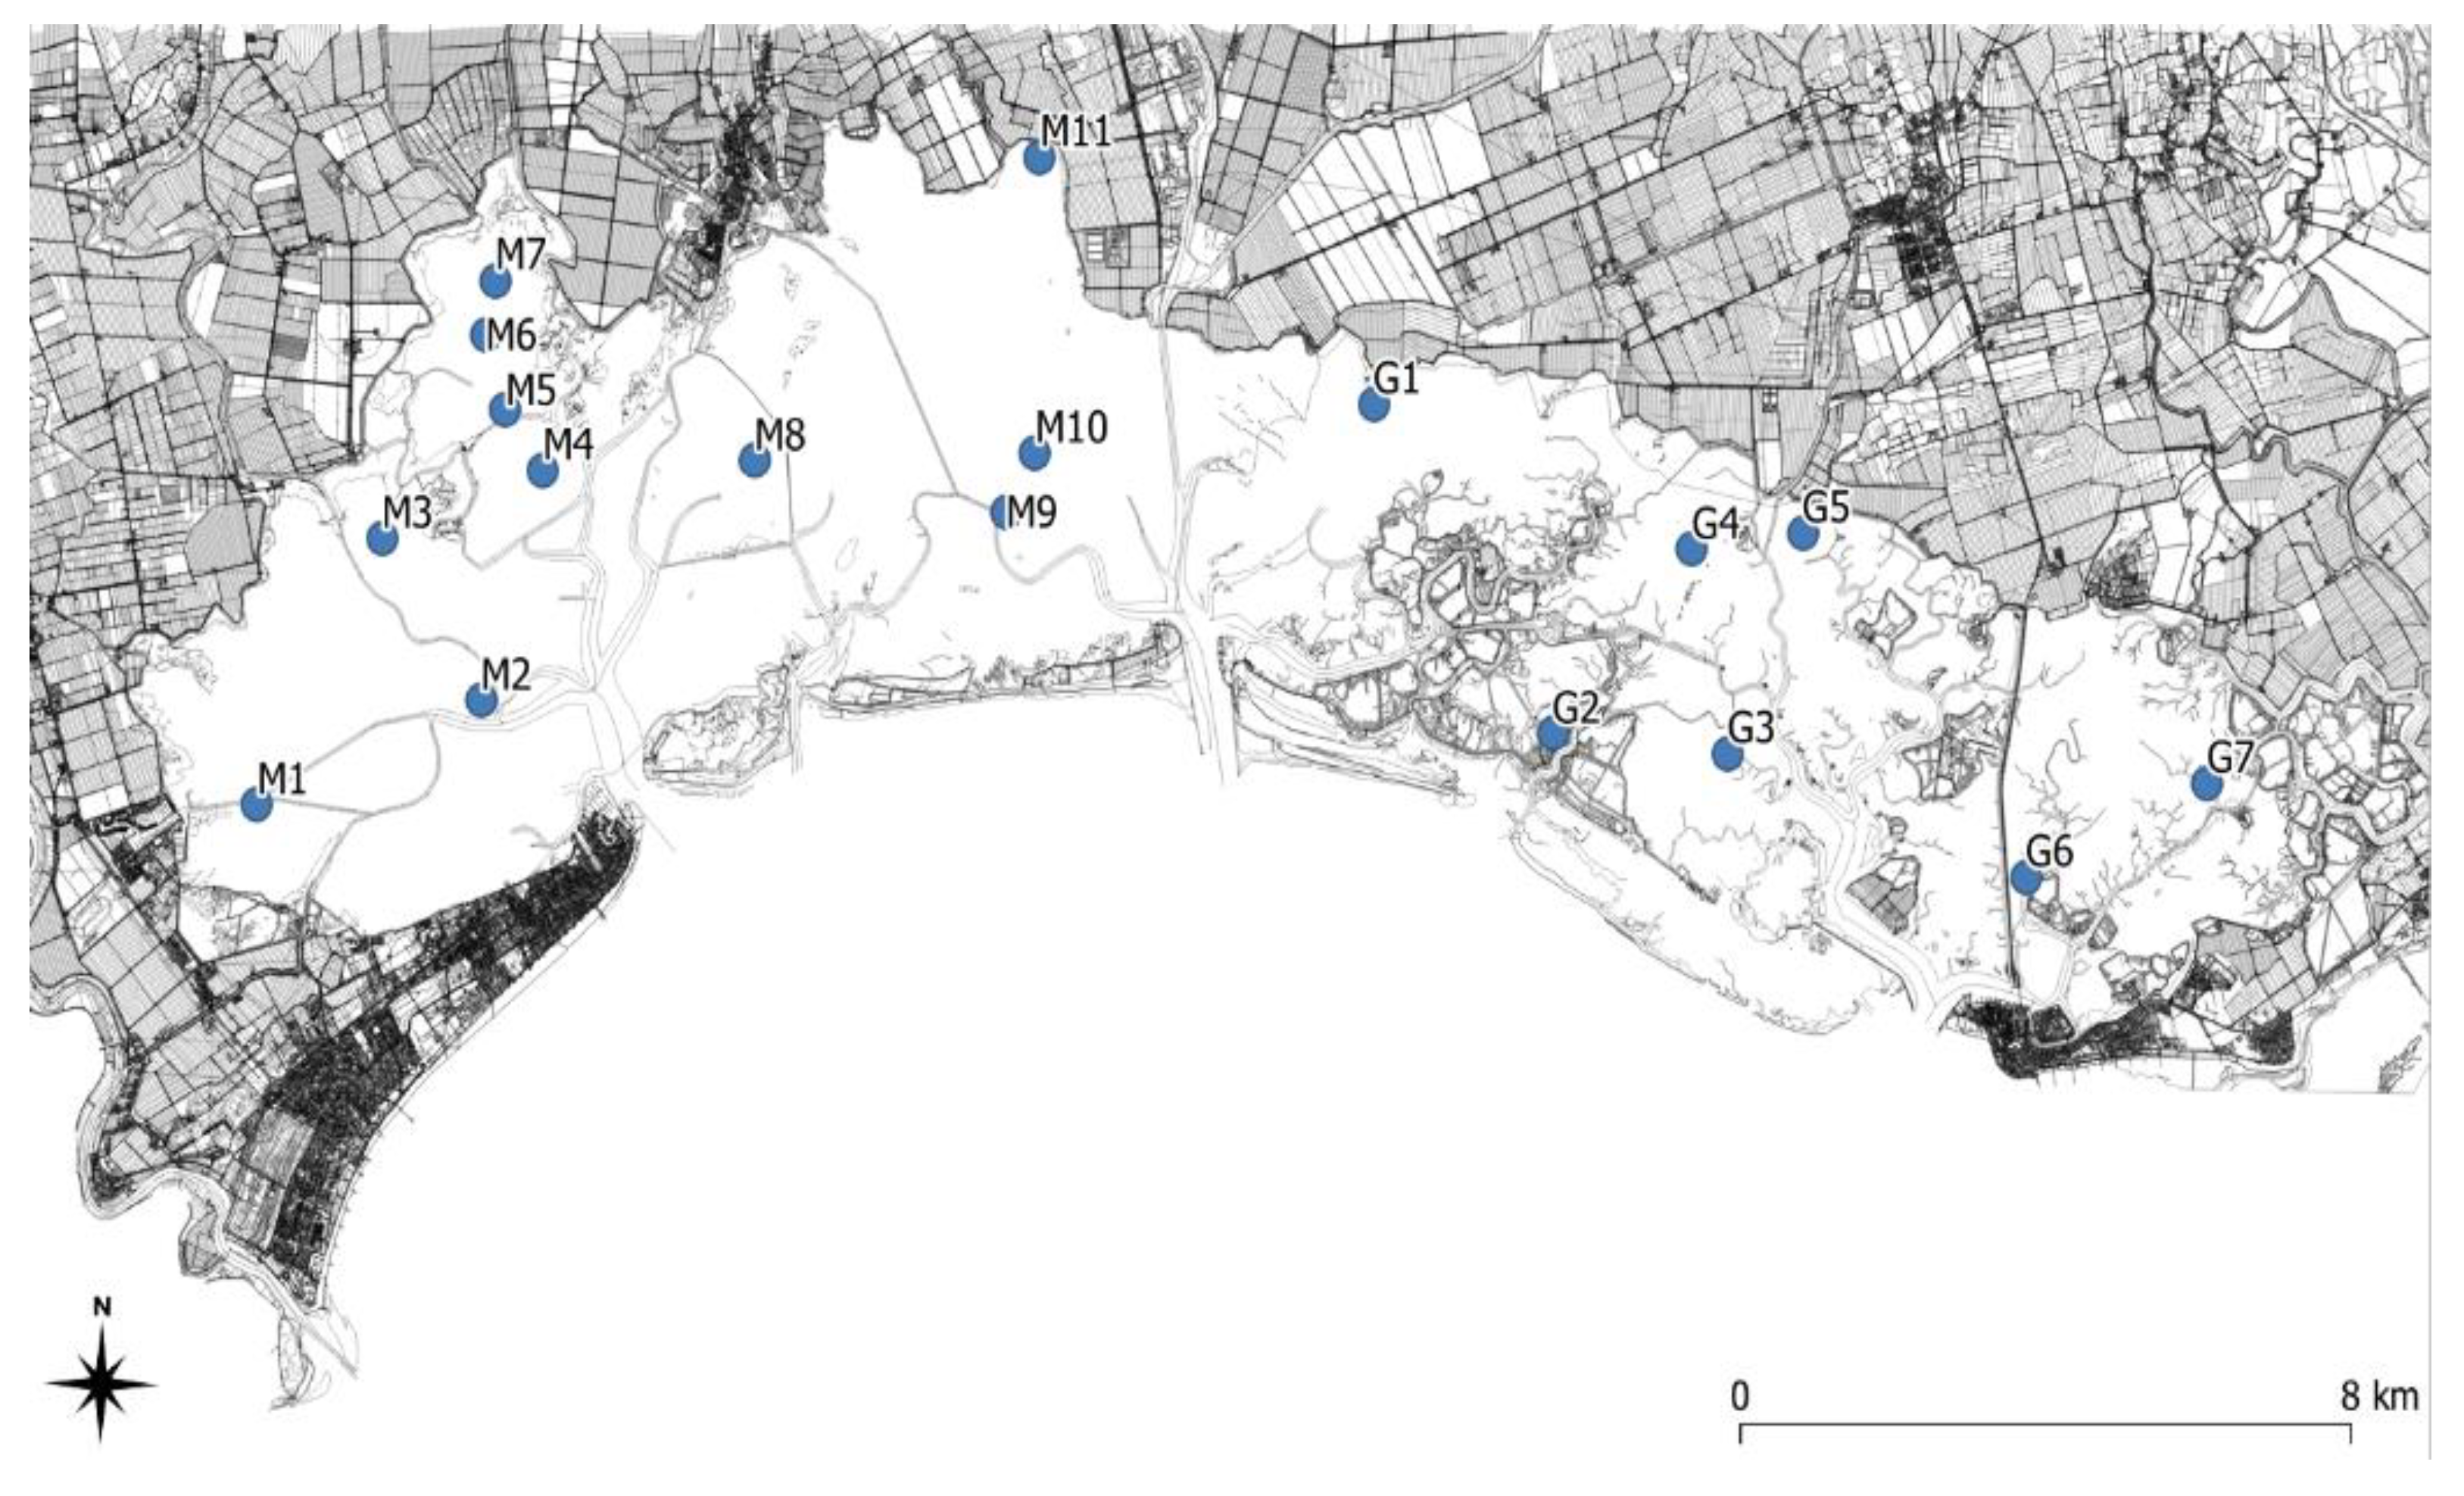
2.3. Sampling Design

The probes were deployed from 2013 to 2020 at 18 sites (belonging to 12 WBs) where critical DO conditions were found in previous monitoring conducted from 2008 to 2009 in the whole lagoon (unpublished data) (Figure 3).
The full schedule of the deployment together with supplementary information is reported in Table S2 in Supplementary Materials. No data were acquired from January to April due to adverse meteorological conditions (water temperature can drop below 5 °C and a layer of ice is sometimes present). This period was used to conduct routine maintenance of the probes. It should be noted that data were not continuously monitored at the same time at all the 18 sites for numerous reasons (i.e., high surface of lagoon system, number of probes available, costs of supply and maintenance). During deployment, the probes were checked monthly to assure the correct position of the buoys and the effective operation of the chlorination process, and the calibration was compared with an Idronaut Ocean Seven 316 probe. In order to extend the deployment time without the need to change the battery pack over a long period, the acquisition time was set to 30 min and the data were transmitted once per day.

2.4. Statistical Assessment and Mapping

The dataset was statistically treated using EXCEL™ and the PAST (Paleontological STatistics) statistical program version 2.17 [52]. The Shapiro–Wilk test was used to test the normal distribution [53] and the non-parametric Kruskal–Wallis H test (K–W) to determine whether there were statistically significant differences between two or more groups of an independent variable after testing the normality [54]. The dataset was represented by means of a box and whisker plot: the median is represented by the horizontal bold line within the box, and 25th and 75th percentiles are at the top and bottom respectively. In this representation, the presence of outliers is shown as circles if values are 1.5 times out of the box and as stars for values which are 3 times out of the box. It should be noted that after a preliminary treatment of the data, the DO measurements which were found to be out of the covered saturation range (0–150 ± 5%), with a pH out of the 7–9 range, with a conductivity out of the 2.00–60.00 mS/cm, measurements resulting from a depth = 0 m, and errors in data acquisition, were not considered in further analysis or discussion.
The distribution maps (IDW, Inverse Distance Weighted) were realised using the QGIS Version 3.16.3 “Hannover” program.

3. Results and Discussion

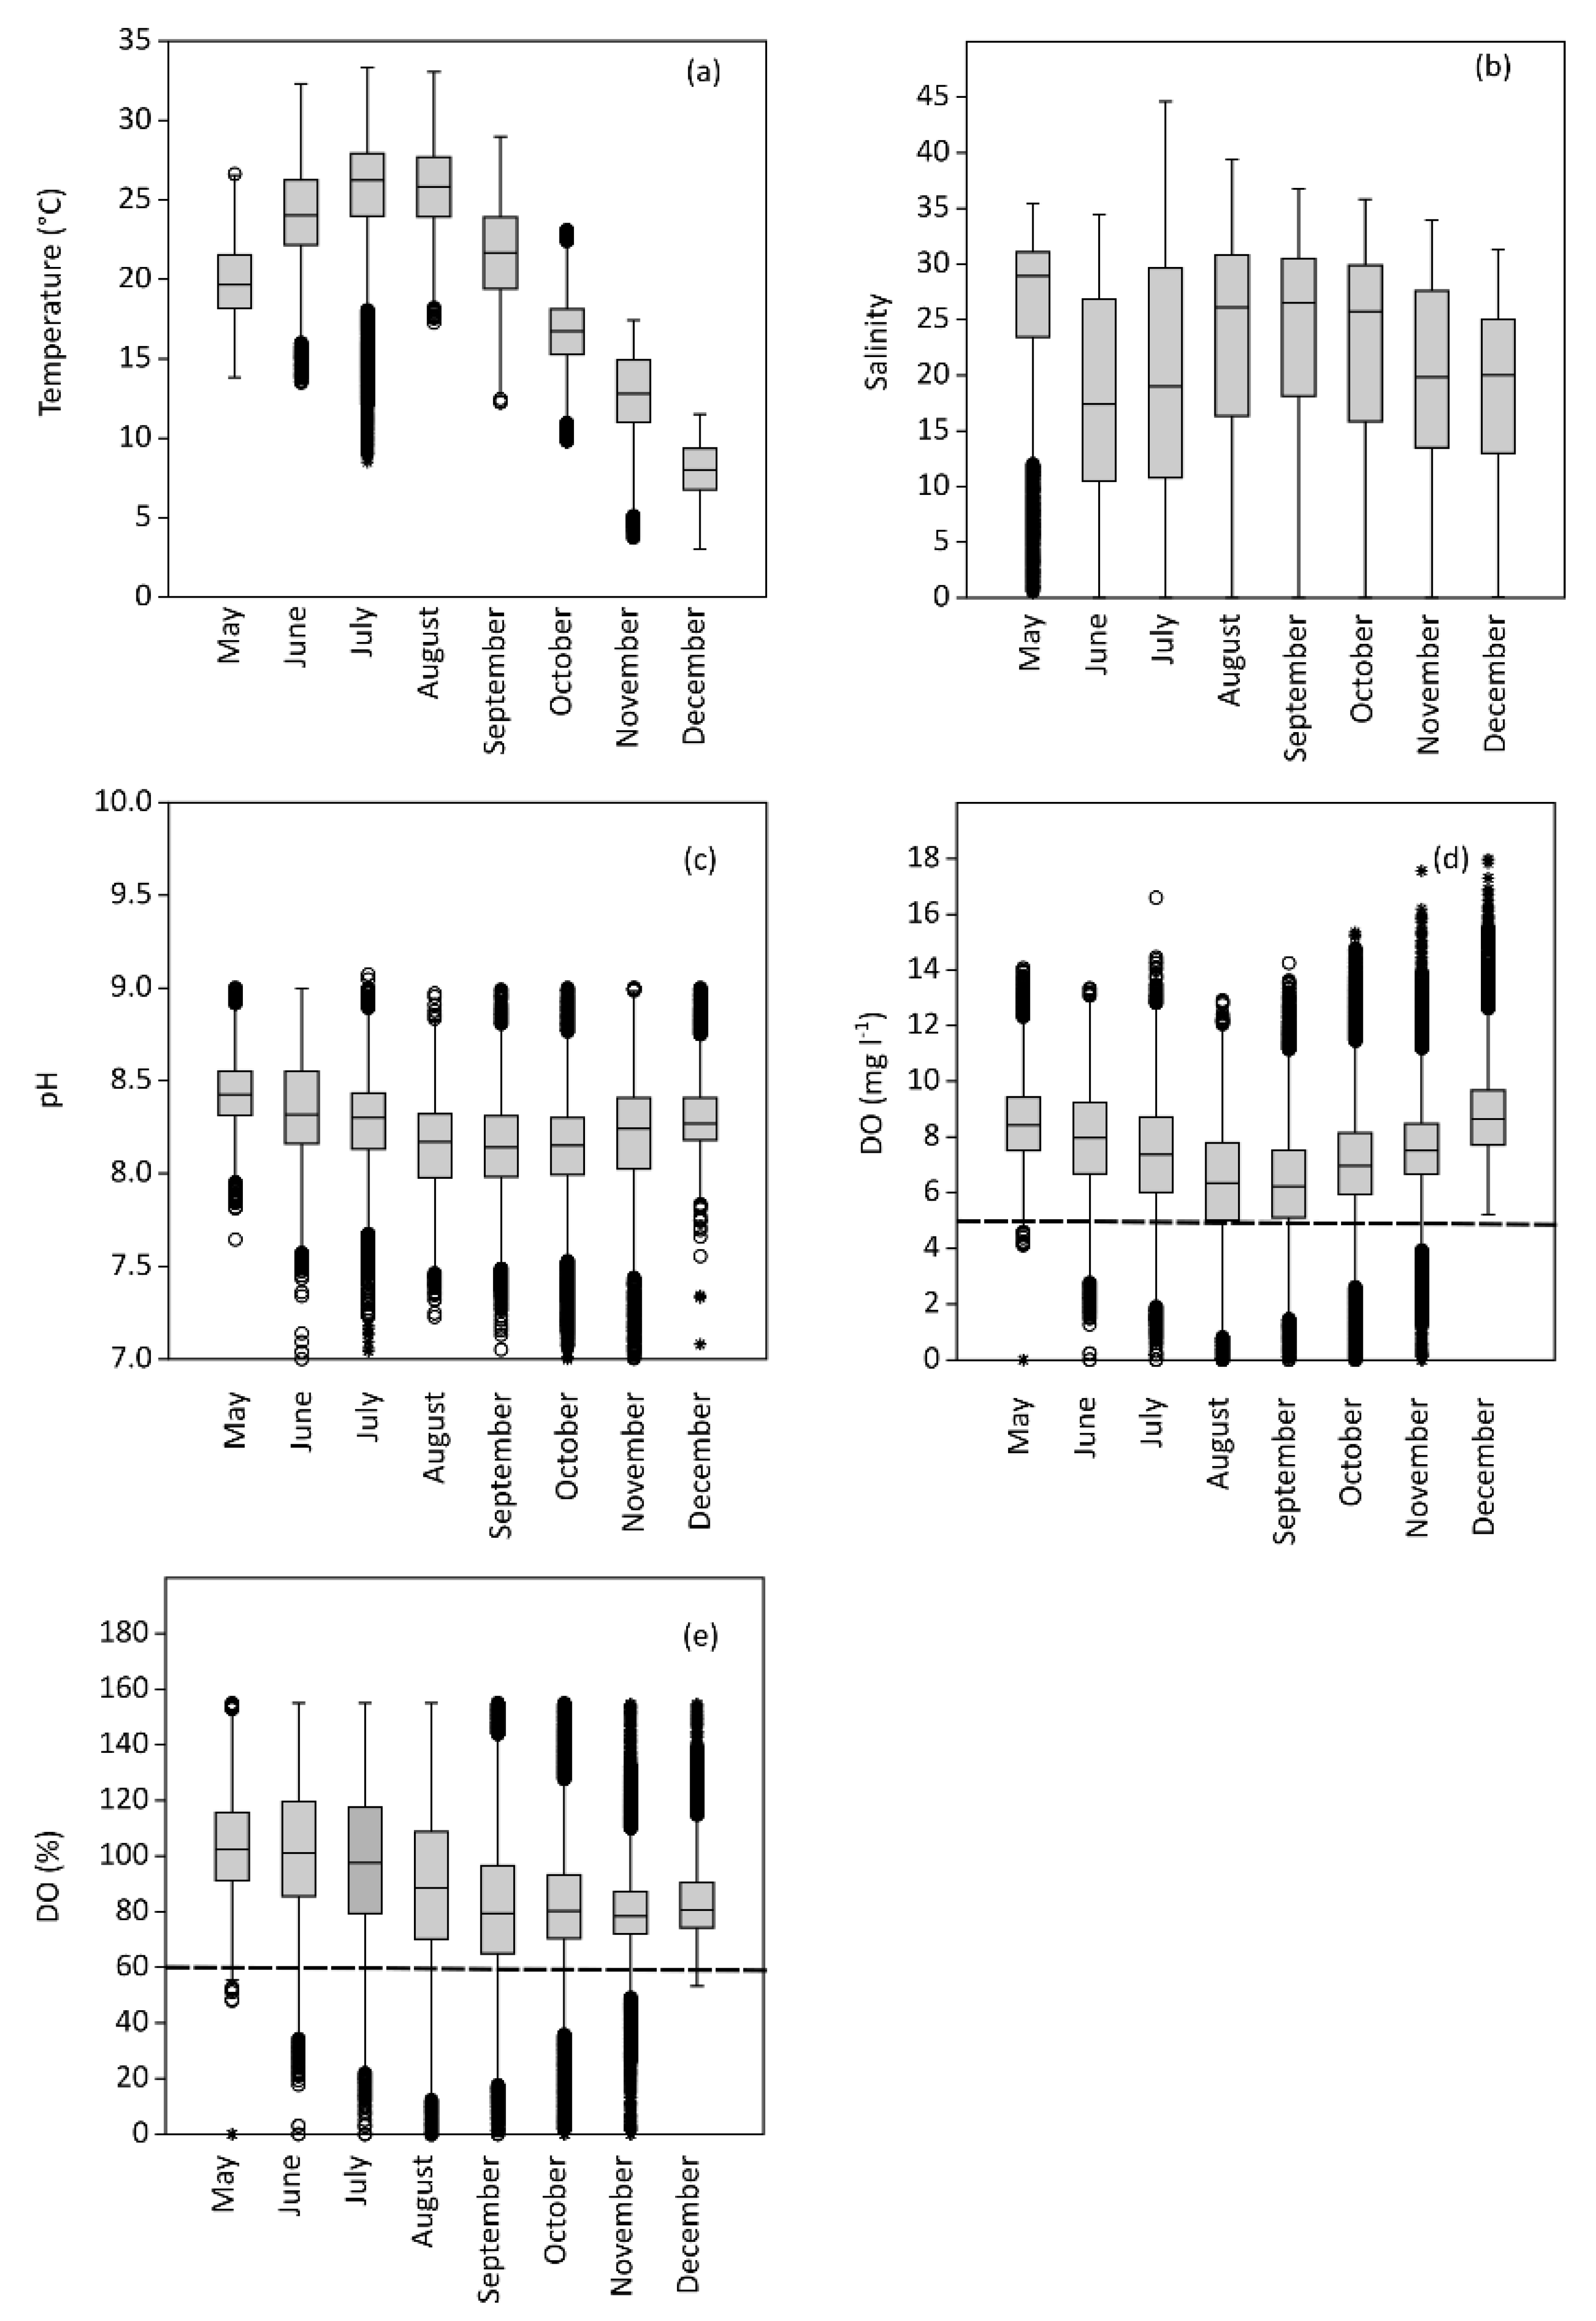
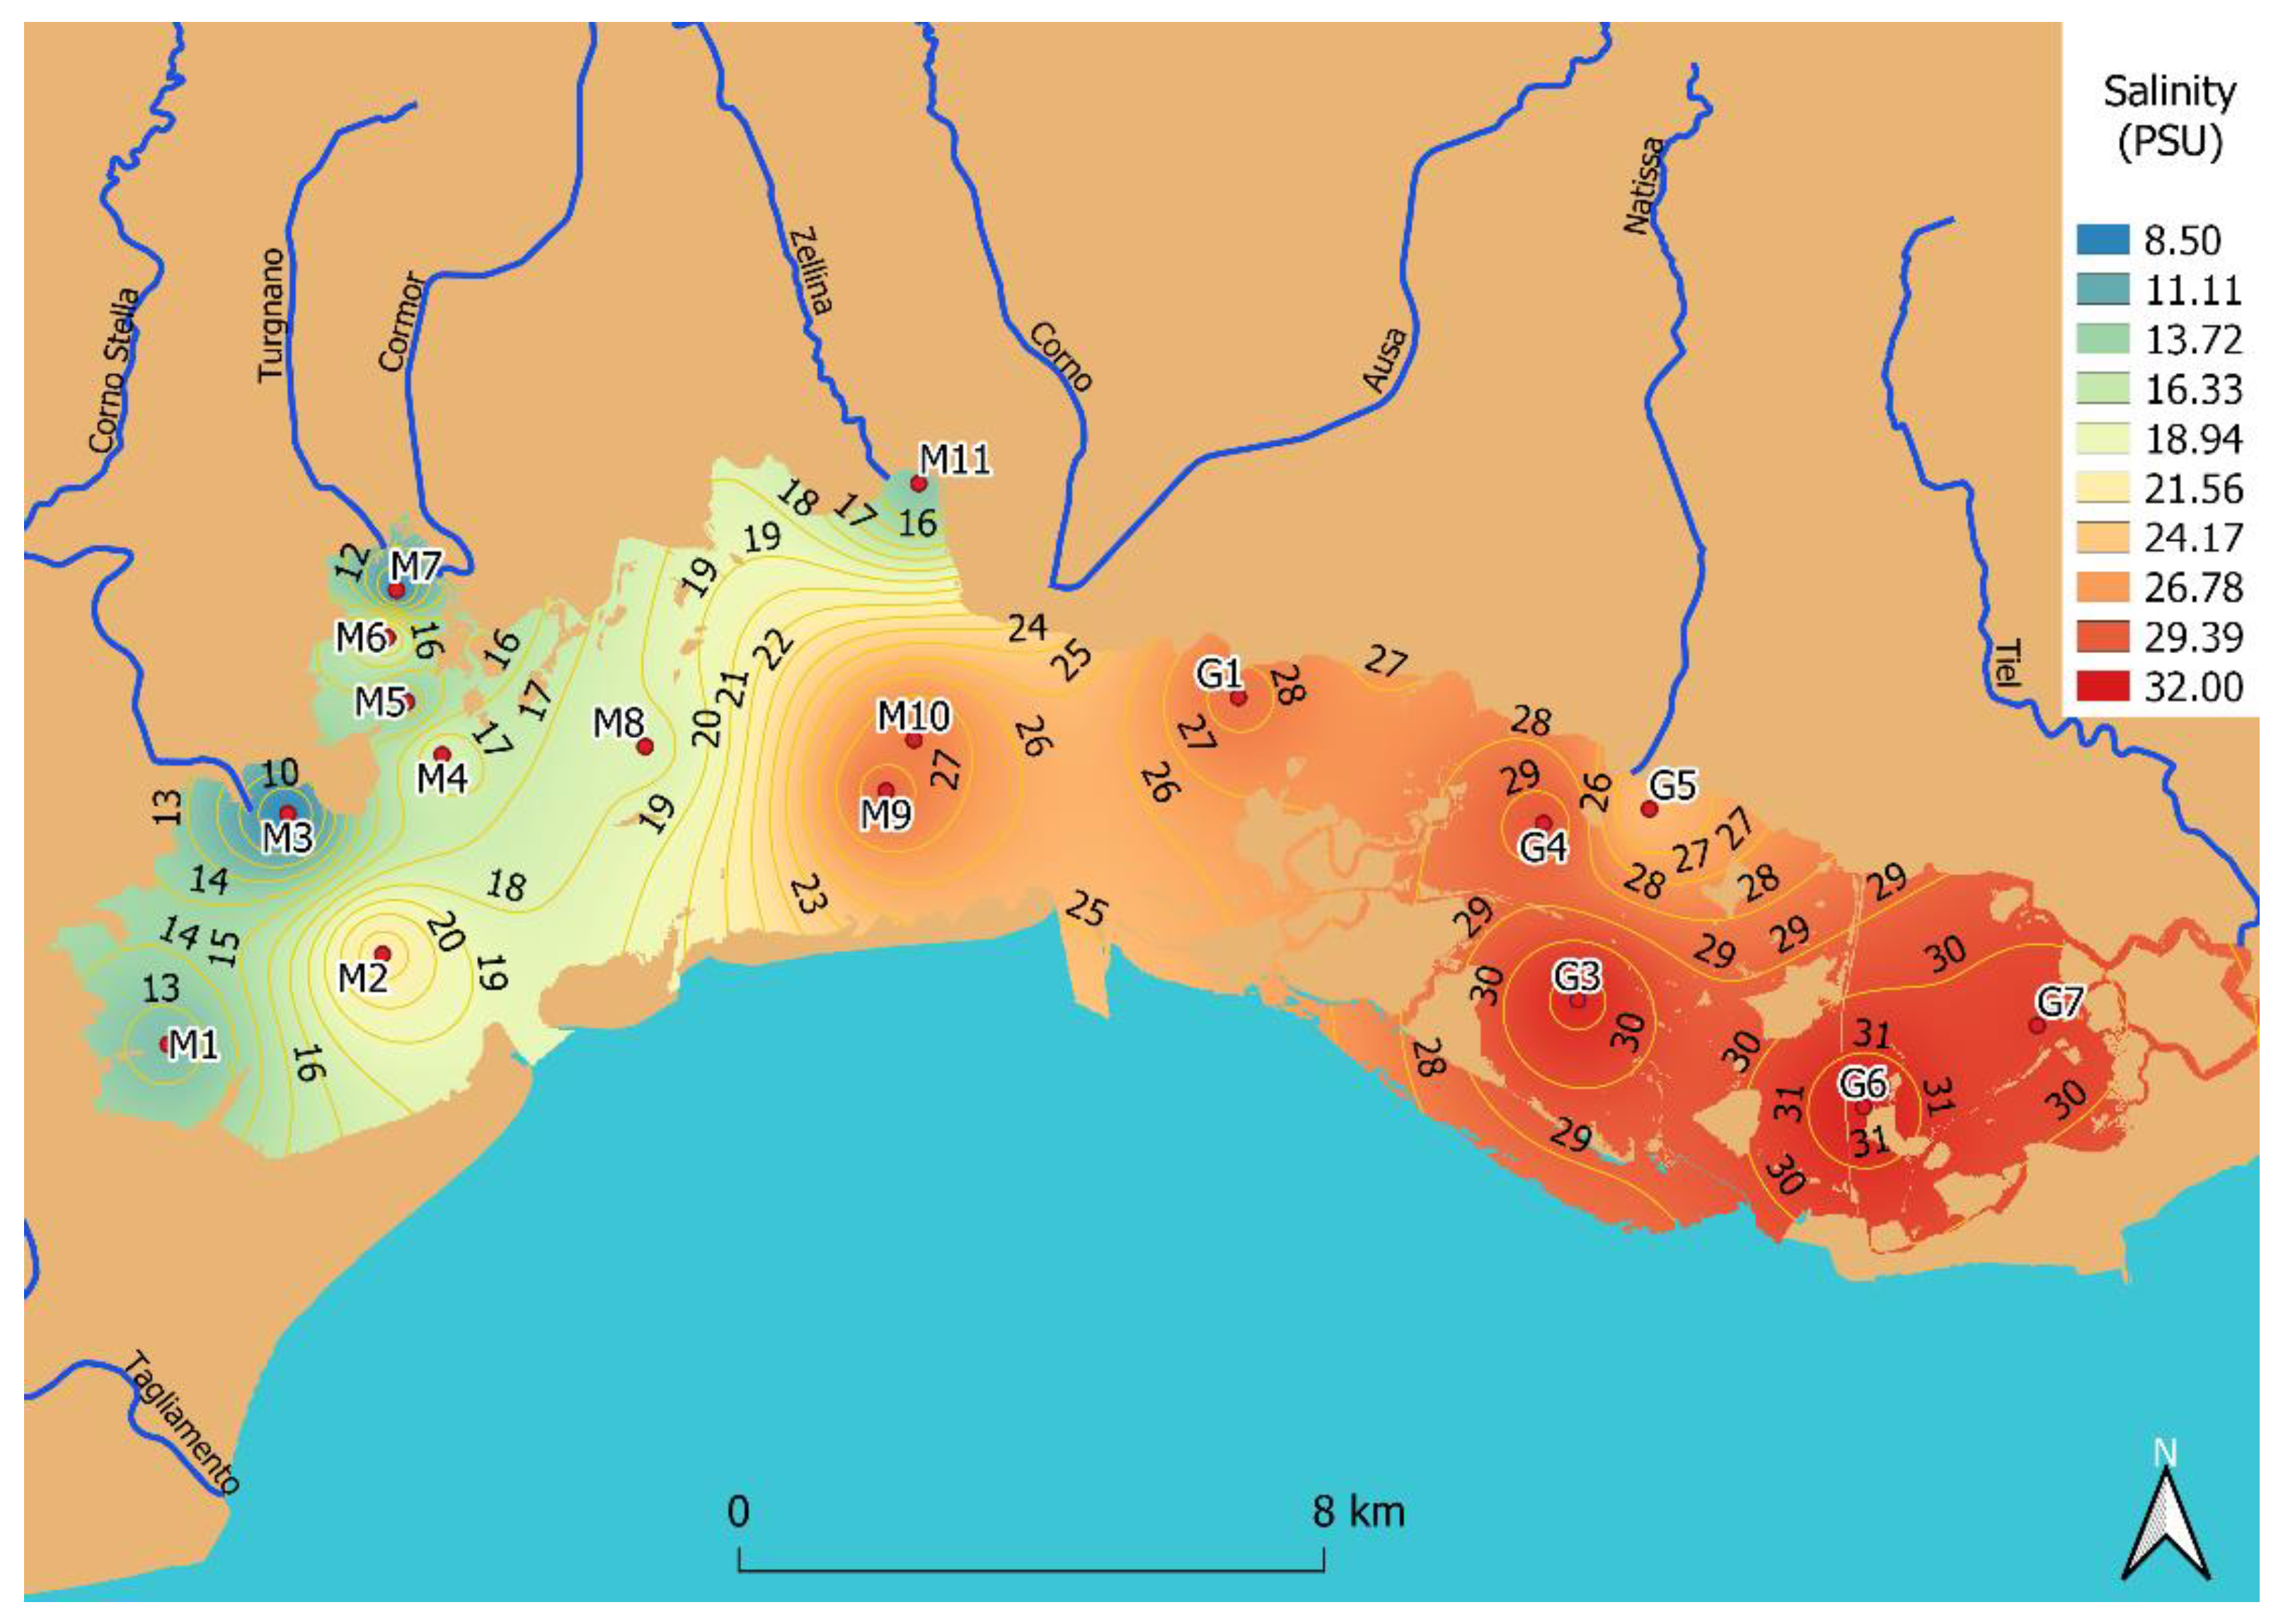
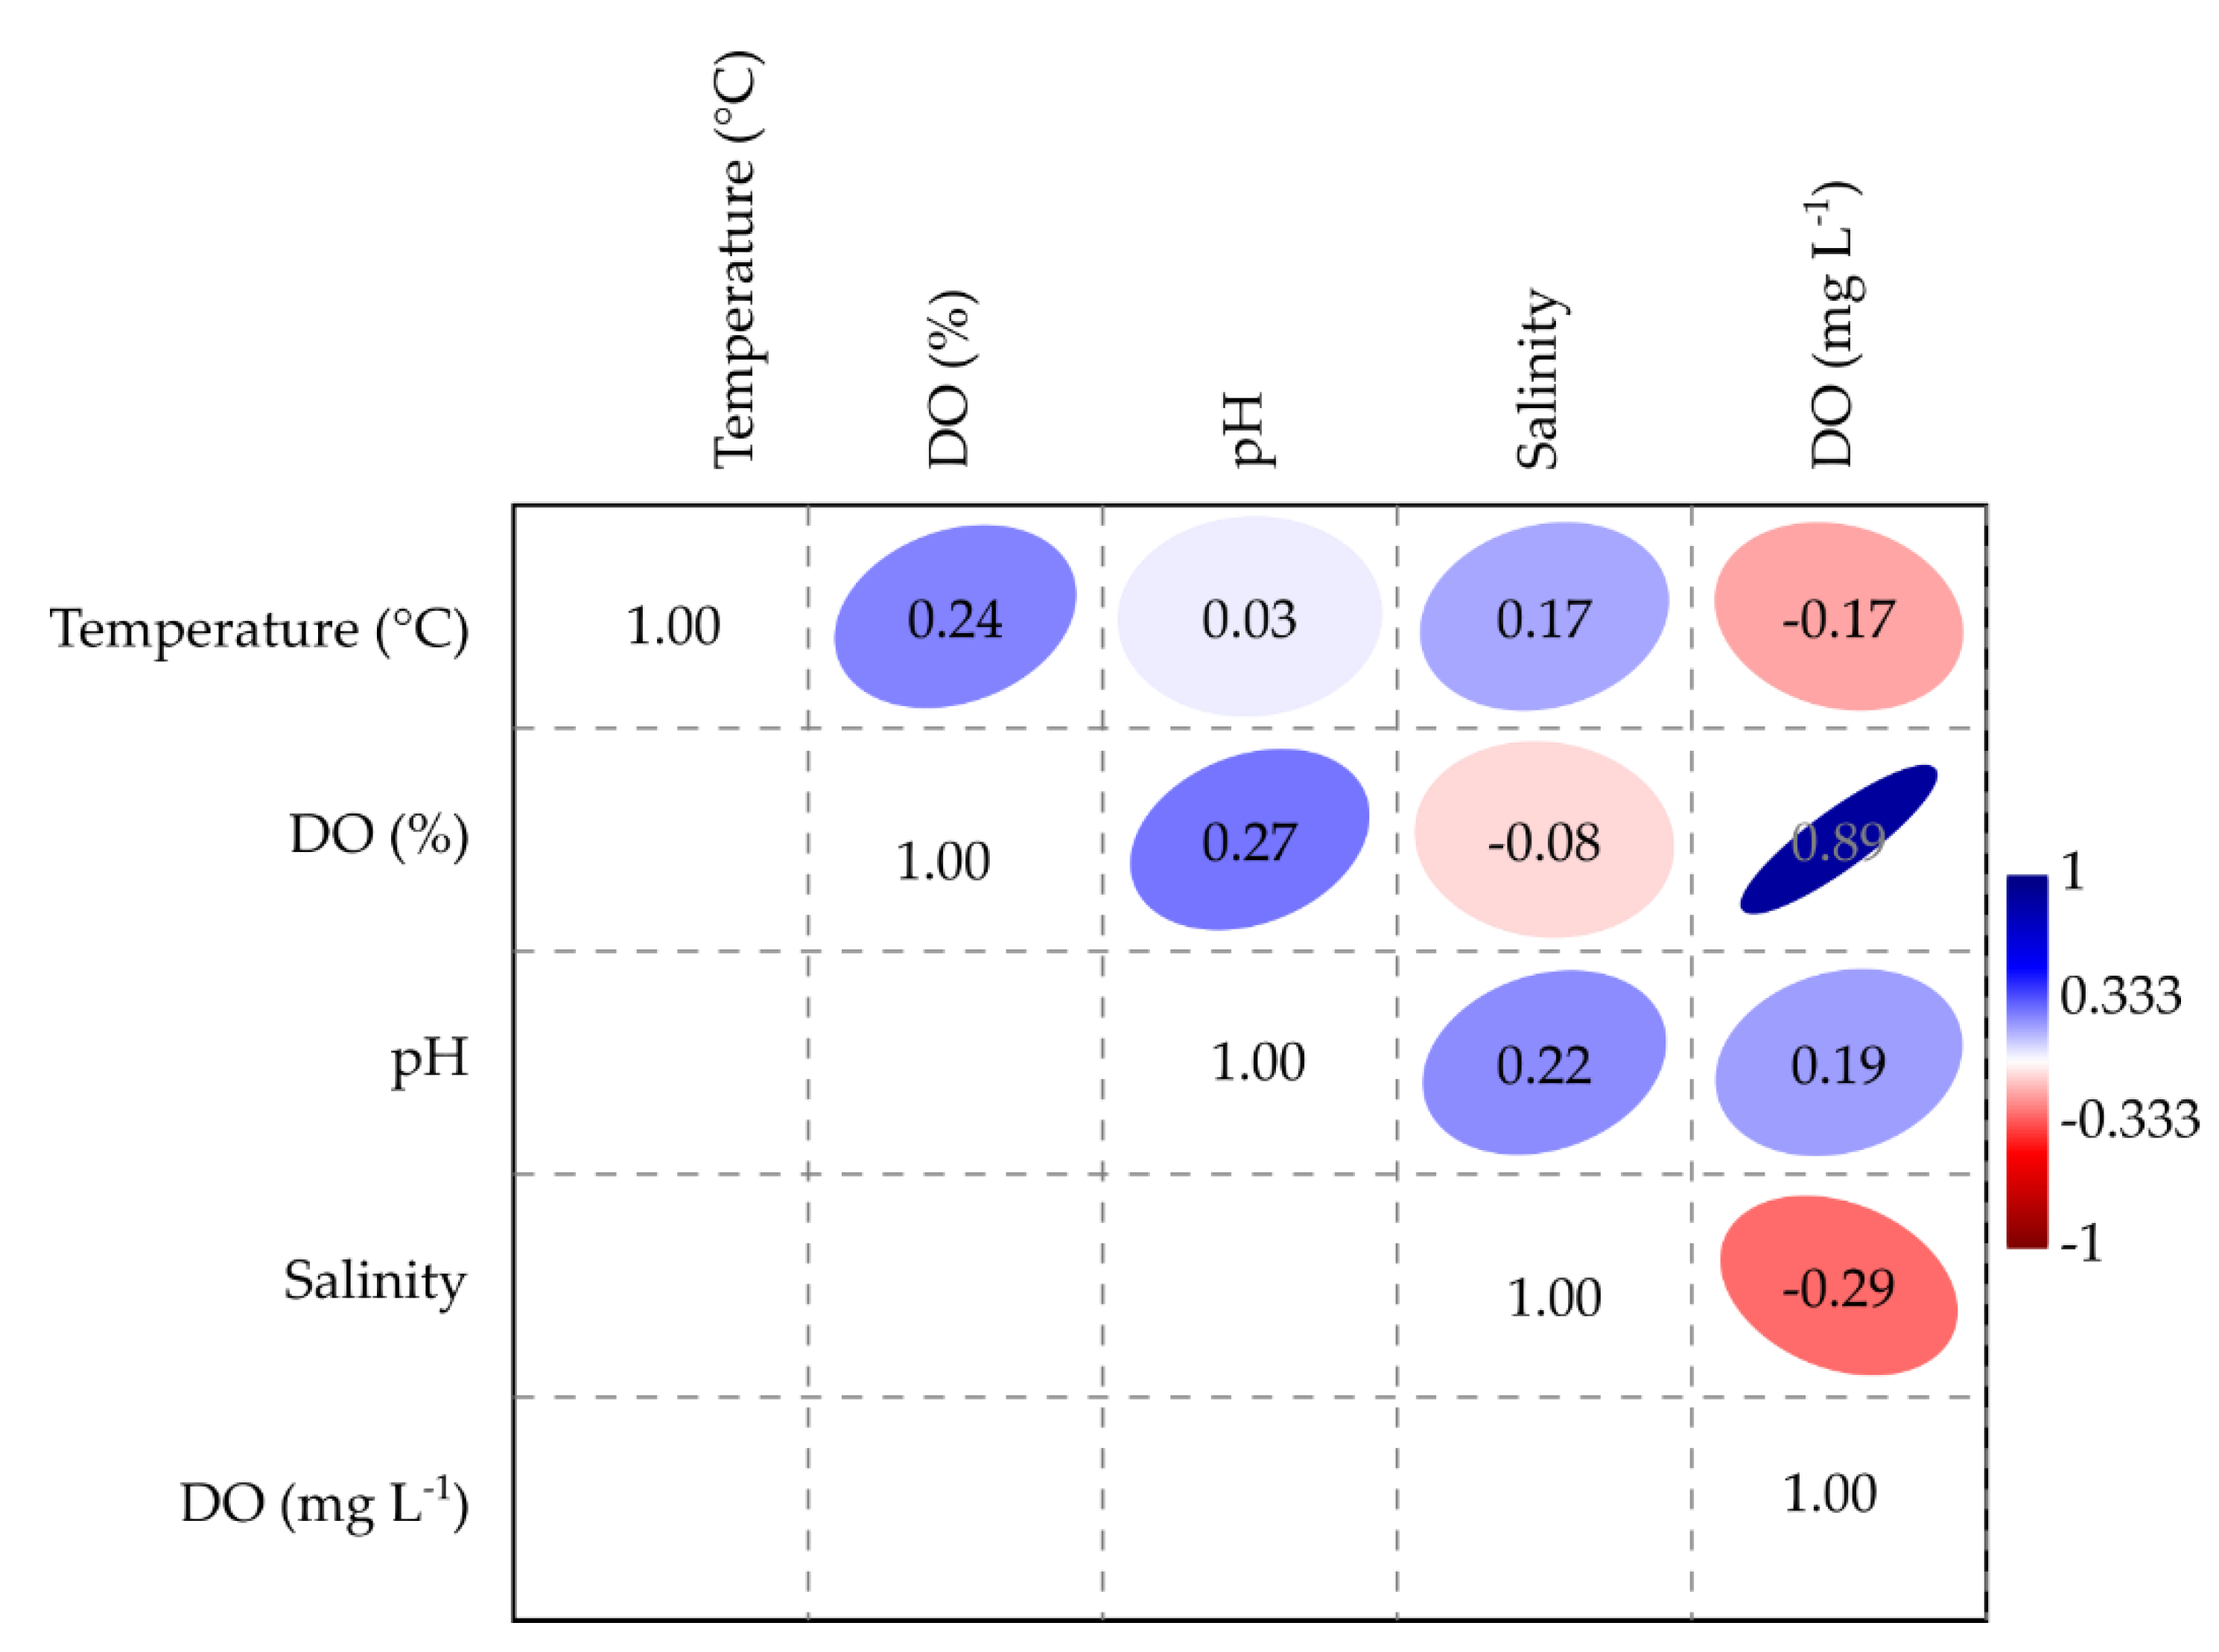
3.1. Complementary Parameters

The final dataset consists of about 200,000 measurements (for each parameter) and, as a preliminary statistical assessment, every parameter was checked for normal distribution at each monitoring site (see Table S3 in Supplementary Materials).
Surface water temperature showed a high degree of variability ranging from the minimum of 3.0 °C measured in December 2013 (M1) to the maximum of 33.5 °C in June 2019 (G7). On average, temperature was 20.4 ± 6.0 °C (median = 21.0 °C, n = 205,533), and no significant difference was found among the investigated sites (K-W = (chi2) = −3.8 × e7, p(same) = 1).
On the contrary, the seasonal variability was significant (K-W = (chi2) = 3.6 × e−7, p(same) = 0), which is typical of several lagoons found in the Mediterranean basin [55,56,57,58] (Figure 4).
Salinity ranged from 1.1 to 39.9 (21.8 ± 9.3; median = 24.1; N observations = 205,533) and is strongly influenced by the amount of freshwater inputs that, in the westernmost part of the lagoon, is related to the degree of precipitation occurring inland, and to a lesser extent, to the active water evaporation that occurs in the shallower part of the basin during summer (easternmost part).Generally, the sites that belong to the Marano basin showed lower values than those at Grado (17.0 ± 8.54 and 29.3 ± 4.63, respectively), thus a significant difference was found in salinity distribution considering the whole basin (K-W: H(chi2) = −1.39 × e7; p(same) = 0) (Figure 5).
In detail, at M1, M3, M5, M6, M7 and M11, salinity showed several values close to 1, and at M2 and M4, the lowest values recorded were slightly higher (2.09 and 1.56, respectively). Due to the effect of freshwater discharge, the salinity was more variable at Marano than Grado. In this latter, only site G5, which receives discharge from the Natissa River, showed comparable minimum values (1.62), but was on average 25.1 ± 6.3. The entire basin is not subject to the intense evaporation that strongly influences the salinity of other Mediterranean lagoons such as the Mar Menor (Spain) and Korissia lagoons (Greece) where average values of 39–45 and > 50 are reported [60,61]. This is likely due to the good water exchange and circulation which is mostly influenced by the tides [37] and is also evidenced by the short water residence time and frequent water renewal found in the investigation of the nutrient dynamic [28]. Taking into account the annual trend in the whole Marano and Grado Lagoon (from May to December), a high variability was observed: late spring and autumn showed the lowest values (18.3 ± 8.9 and 19.7 ± 7.8 in June and November, respectively), whereas in September, the salinity reached an average of 24.3 ± 7.7 (Figure 4). However, there was no significant difference between sample medians calculated for each individual month (K-W: H(chi2) =−1.16 × e7; p(same) = 1).
The pH was on average 8.21 ± 0.28 (median = 8.23) which is typical of marine waters with values close or lower than 8.00 recorded in sites subjected to freshwater inputs (M6, M7, M3 and M4) and also at G2, but generally, the Grado sector exhibited values slightly higher than Marano (8.26 ± 0.29 and 8.17 ± 0.27, respectively) and there was a significant difference between medians (K-W: (chi2) = 2.20 × e7; p(same) = 0). Taking into account the annual variability, there was no significant difference (K-W: (chi2) = −1.15 × e7; p(same) = 1) in spite of the highest values recorded in May and the lowest in September and October (Figure 4).

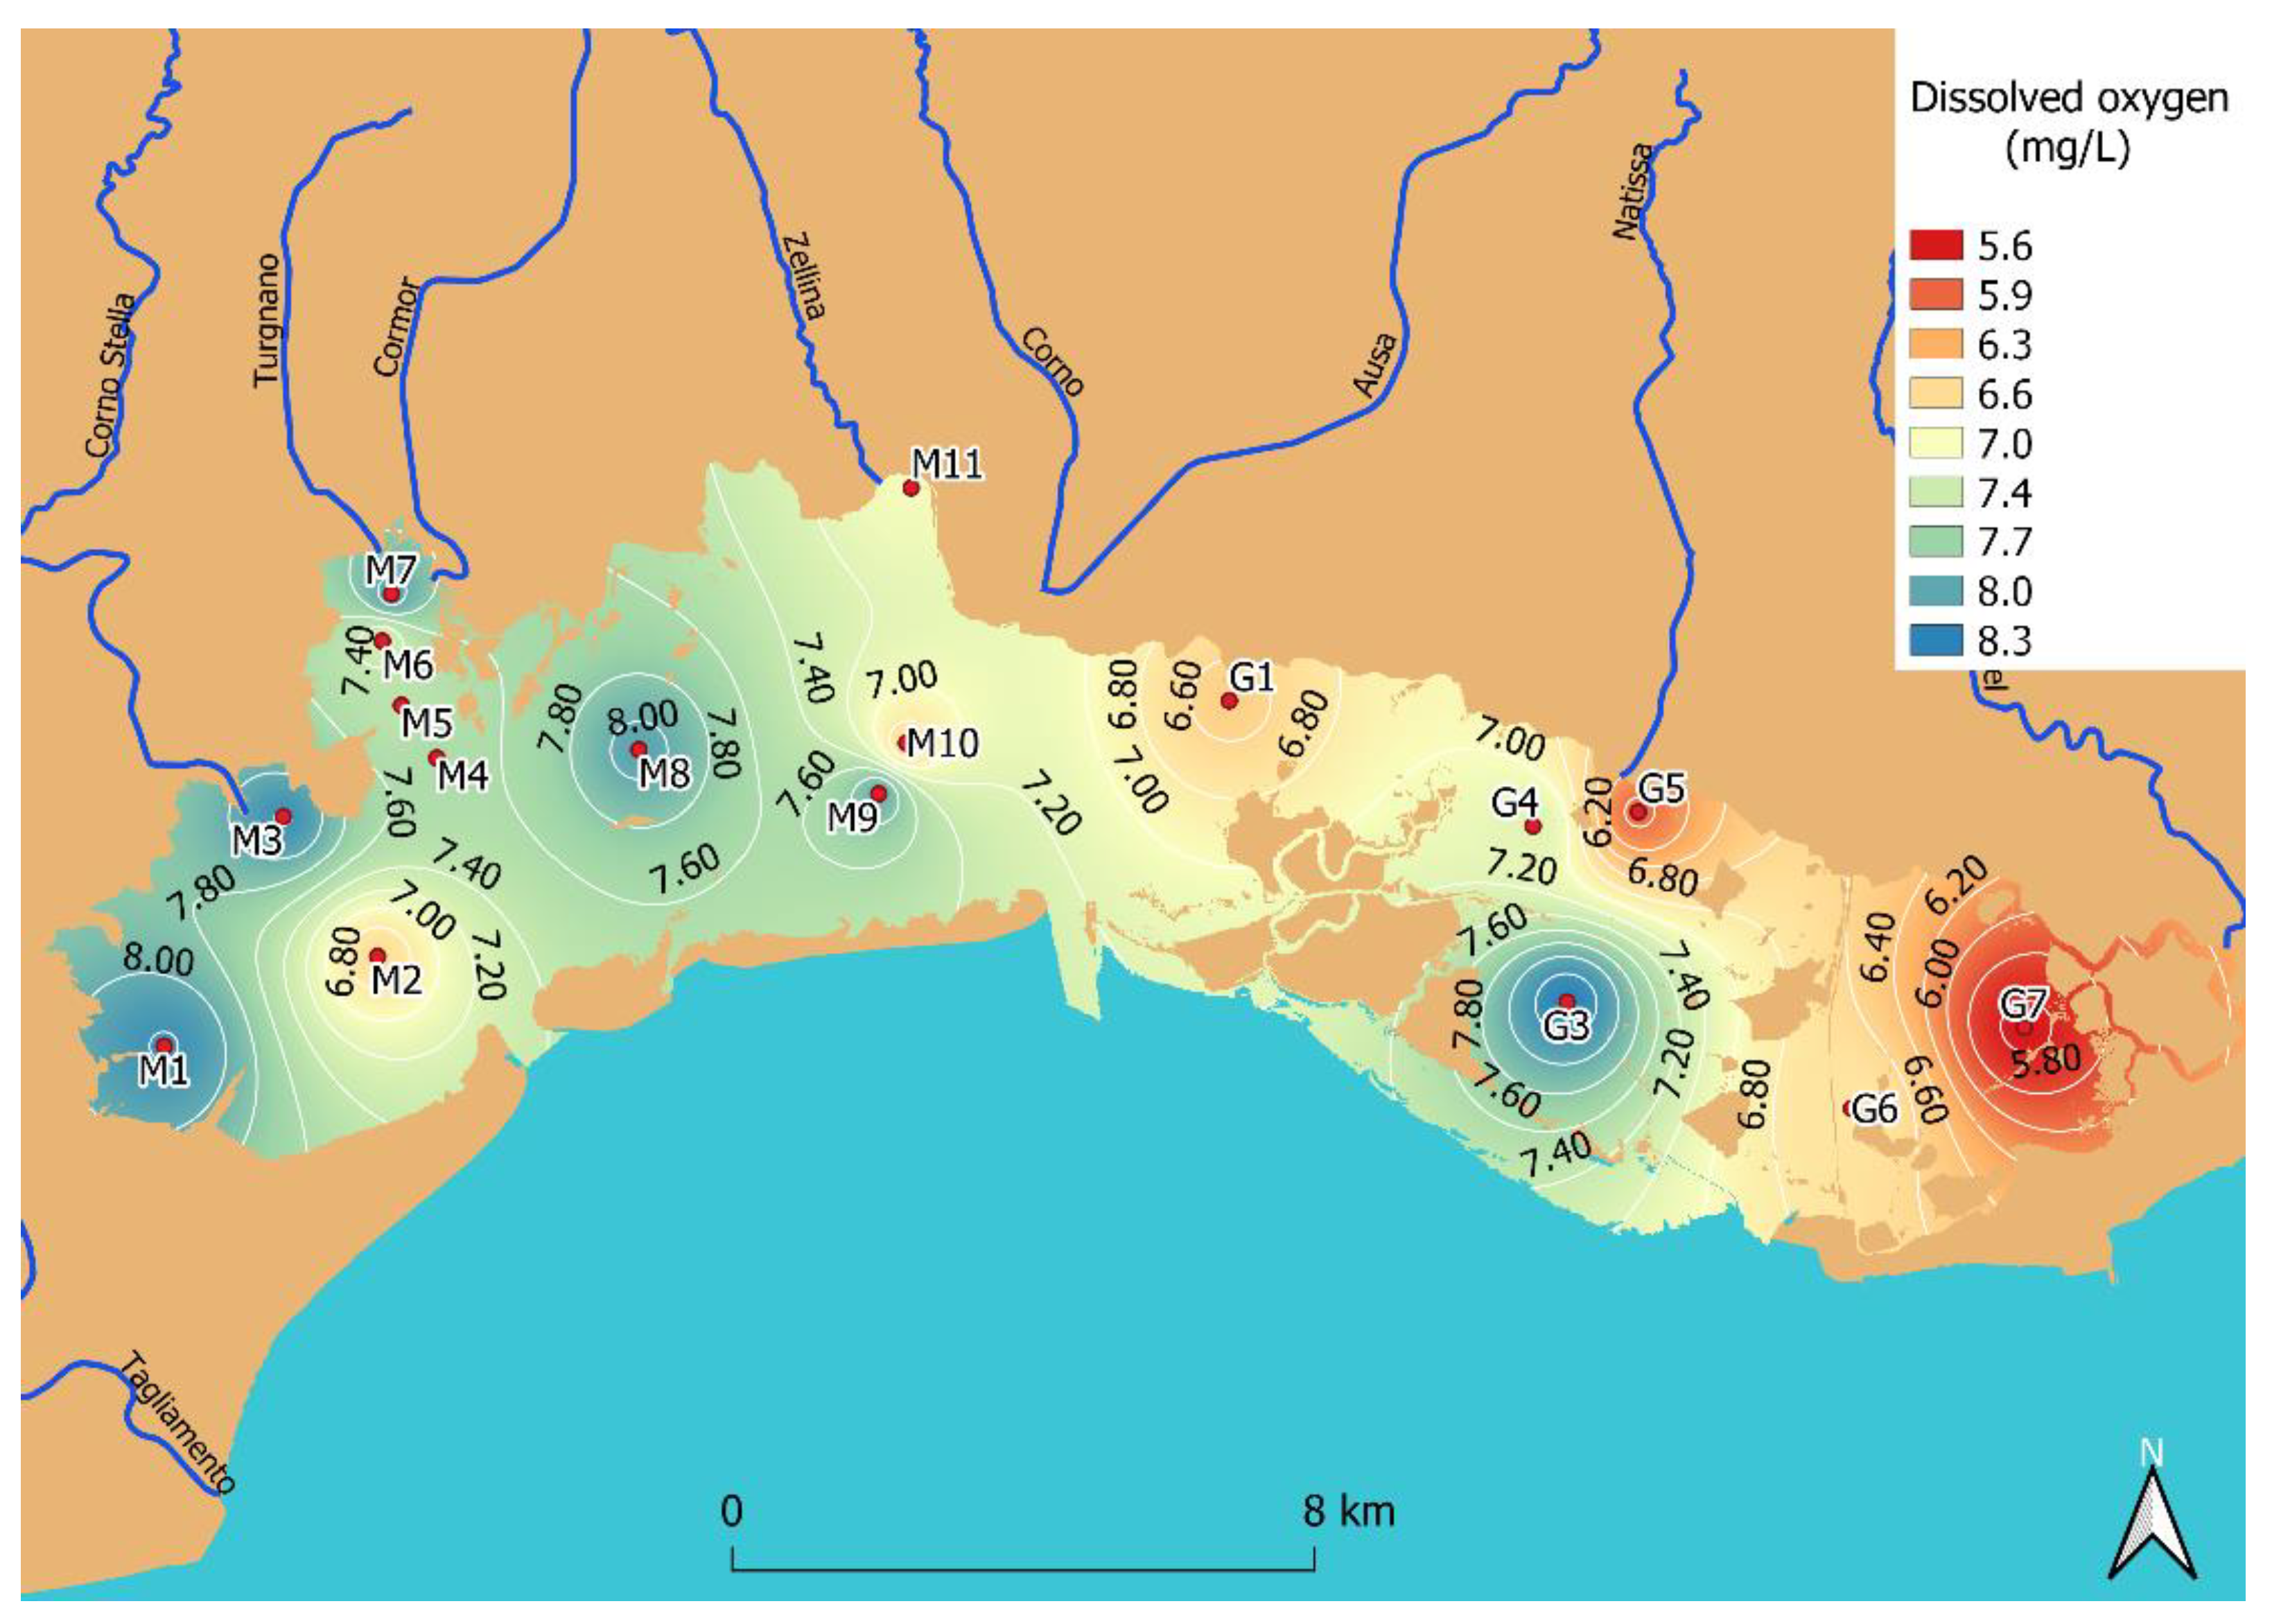
3.2. Dissolved Oxygen

DO content was expressed in terms of concentration (mg L−1) and derived percentage of saturation (%). In the first case, a wide range of concentrations was observed (<1.0–18.1 mg L−1, mean ± dev. std = 7.1 ± 2.13 mg L−1; median = 7.1 mg L−1; N observation = 199,439) and there was a significant difference among the monitored sites (K-W: H(chi2) =2.22 × e7; p(same) = 0) (Figure 6).
On average, the highest value was recorded at G3 (8.3 ± 2.1 mg L−1), which is located in an open part of the Grado Lagoon, whereas the lowest was recorded at G2 (3.6 ± 2.8 mg L−1), which is a confined area within the commercially active Valle Noghera fish farm. Here, the presence of several man-made embankments has heavily altered the pristine morphology and the hydrodynamics of the area, with water exchange limited and regulated by the periodic opening of the sluice gates [62]. As a consequence, the turnover of nutrients and OM is also altered: in fact, D’Aietti et al. [63] drew attention to the high levels of ammonium in the water column as a product of the respiration that, in the event of low DO levels, uses NO3- as a final electron acceptor.
One of the main characteristics of lagoon systems is the high morphological and physico-chemical variability that can be detected even in a small-scale basin, and this is also true for the Marano and Grado Lagoon [27]. Taking into consideration the whole dataset, the oxygenation in the Marano basin was higher than at Grado (7.59 ± 1.86 and 6.40 ± 2.32 mg L−1, respectively), whereas, at the whole basin scale, DO decreased from late spring to late summer (8.5 ± 1.6 and 6.4 ± 1.8 mg L−1 in May and September, respectively) followed by an increase until reaching the maximum in December (8.9 ± 1.6 mg L−1) (Figure 3), thus there is a significant difference throughout the year (K-W: H(chi2) =−1.56 × e7; p(same) = 0). In the 1-year cycle of physico-chemical measurements conducted in the Marano and Grado Lagoon over 2013 by means of discrete sampling, Acquavita et al. [28] reported that DO values were lower in summer/autumn (from 7.0 to 8.6 mg L−1) than in winter and spring (up to 10.0 mg L−1), whereas the highest values were recorded in early spring (10.8 ± 1.55 mg L−1). However, sampling was always conducted from 9:00 to 14:00 and thus did not account for processes occurring in the absence of solar radiation and was, on average, higher (8.75 mg L−1). Overall, the results in this work are comparable to those reported for other Mediterranean lagoons (Table 1).
The condition of hypoxia (DO < 2 mg L−1) was recorded in approximately 1.8% of the 199,439 observations and up to 85% were ascribed to the measurements conducted at sites G2 and G7. As previously mentioned, G2 is an active fish farm, whereas G7 is located in a confined area (easternmost part of the Grado basin) characterised by a strong modification of the hydrological regime which occurred as a consequence of a bridge built in 1936 that connects the urban area of Grado to the inland [49]. If the measurements conducted in the fish farm (G2) are not included, hypoxia occurred mostly during summer, especially in August (N = 329, 1.16% of total measures) and is absent in both May and December. Values below the threshold of 5 mg L−1, which represent a potential threat for sensitive species of fish and invertebrates, were recorded in 14.3% of the measurements (n = 28,438).
It is well known that prolonged periods characterised by such low values are detrimental to fish resulting in a substantial effect on growth, physiological and immune responses [71,72], but which also alter the biogeochemical cycle [73]. In this context, low levels of DO influence the mobility of nutrients, with the shift from oxidised forms (NO3) to a reduced one (NH4+) [74] and the release of PO43−, from the conversion of insoluble FePO4 to the more soluble Fe3(PO4)2, and H2S [75], and of potentially toxic elements [76,77,78,79,80]. This is the case of the Marano and Grado Lagoon where some contaminants such as Hg [43] and polycyclic aromatic hydrocarbons (this latter in a very limited area [46], and in the case of Hg, diffusive and benthic fluxes at the sediment-water interface, and production during sub-oxic/anoxic condition of the most toxic organic form mono-methylmercury, MeHg) have previously been observed [24,25,81].
Best et al. [59] attempted to set the thresholds for the WFD dissolved oxygen (5%ile) on the basis that the DO content should reflect the reducing solubility when the salinity increases [82,83] by suggesting five classes: high, good, moderate, poor and bad. As reported in Table 2, G2 and G7 are classified as bad, whilst 10 sites are classified as moderate and six as good.
DO expressed as % of saturation ranged from 0 to 155% (mean = 87.3 ± 26.0%; median = 84.6%). Overall, the results are lower than those reported by [45] (30-40%, median/mean value close to 100% saturation, 93%/92%) and a significant difference was found among the investigated sites (K-W: H(chi2) = 2.16 × e7; p(same) = 0) with the highest average found at M9 (104.1 ± 25.6%) and the lowest at G2 (46.0 ± 37.4%). Taking monthly variability into consideration, there is a general decrease from May to November (from 104.5 to 78.7% on average) and a slight increase until December, thus there was a significant seasonal difference (K-W: H(chi2) = 1.55 × e7; p(same) = 0) (Figure 4). The Shellfish Water Directive, which deals with the quality of waters suitable for the development of shellfish (bivalve and gastropod molluscs), sets the minimum mandatory standard at 60%, with 70% as the 50%ile (mandatory) and 80% as the 95%ile (guideline value) [59]. Site G2 showed an average DO% lower than the minimum mandatory standard, whereas all the other sites showed on average values suitable for shellfish growth.
The relationships of DO with the other parameters are reported in Figure 7. A significant positive correlation was found between temperature and salinity (r = 0.1715; p(uncorr) = 0). Regarding DO, an inverse relationship was found with temperature (r = −0.1745; p(uncorr) = 0) and salinity (r = −0.2887; p(uncorr) = 0) and this is in accordance with the literature which states that an increase in water temperature and salinity decreases DO solubility [35,59,84], whereas a positive correlation was found with pH (y = 1.4673 × −4.8995; r = 0.1897; p(uncorr) = 0), likely due to the decrease in CO2 during photosynthetic processes that increase both DO and pH. Finally, it was found a significant inverse relationship with mean depth (r = −0.5242; p(uncorr) = 0.0020), whereas the distance from the main channel did not show a significant influence (r = 0.19363; p(uncorr) = 0.2899).

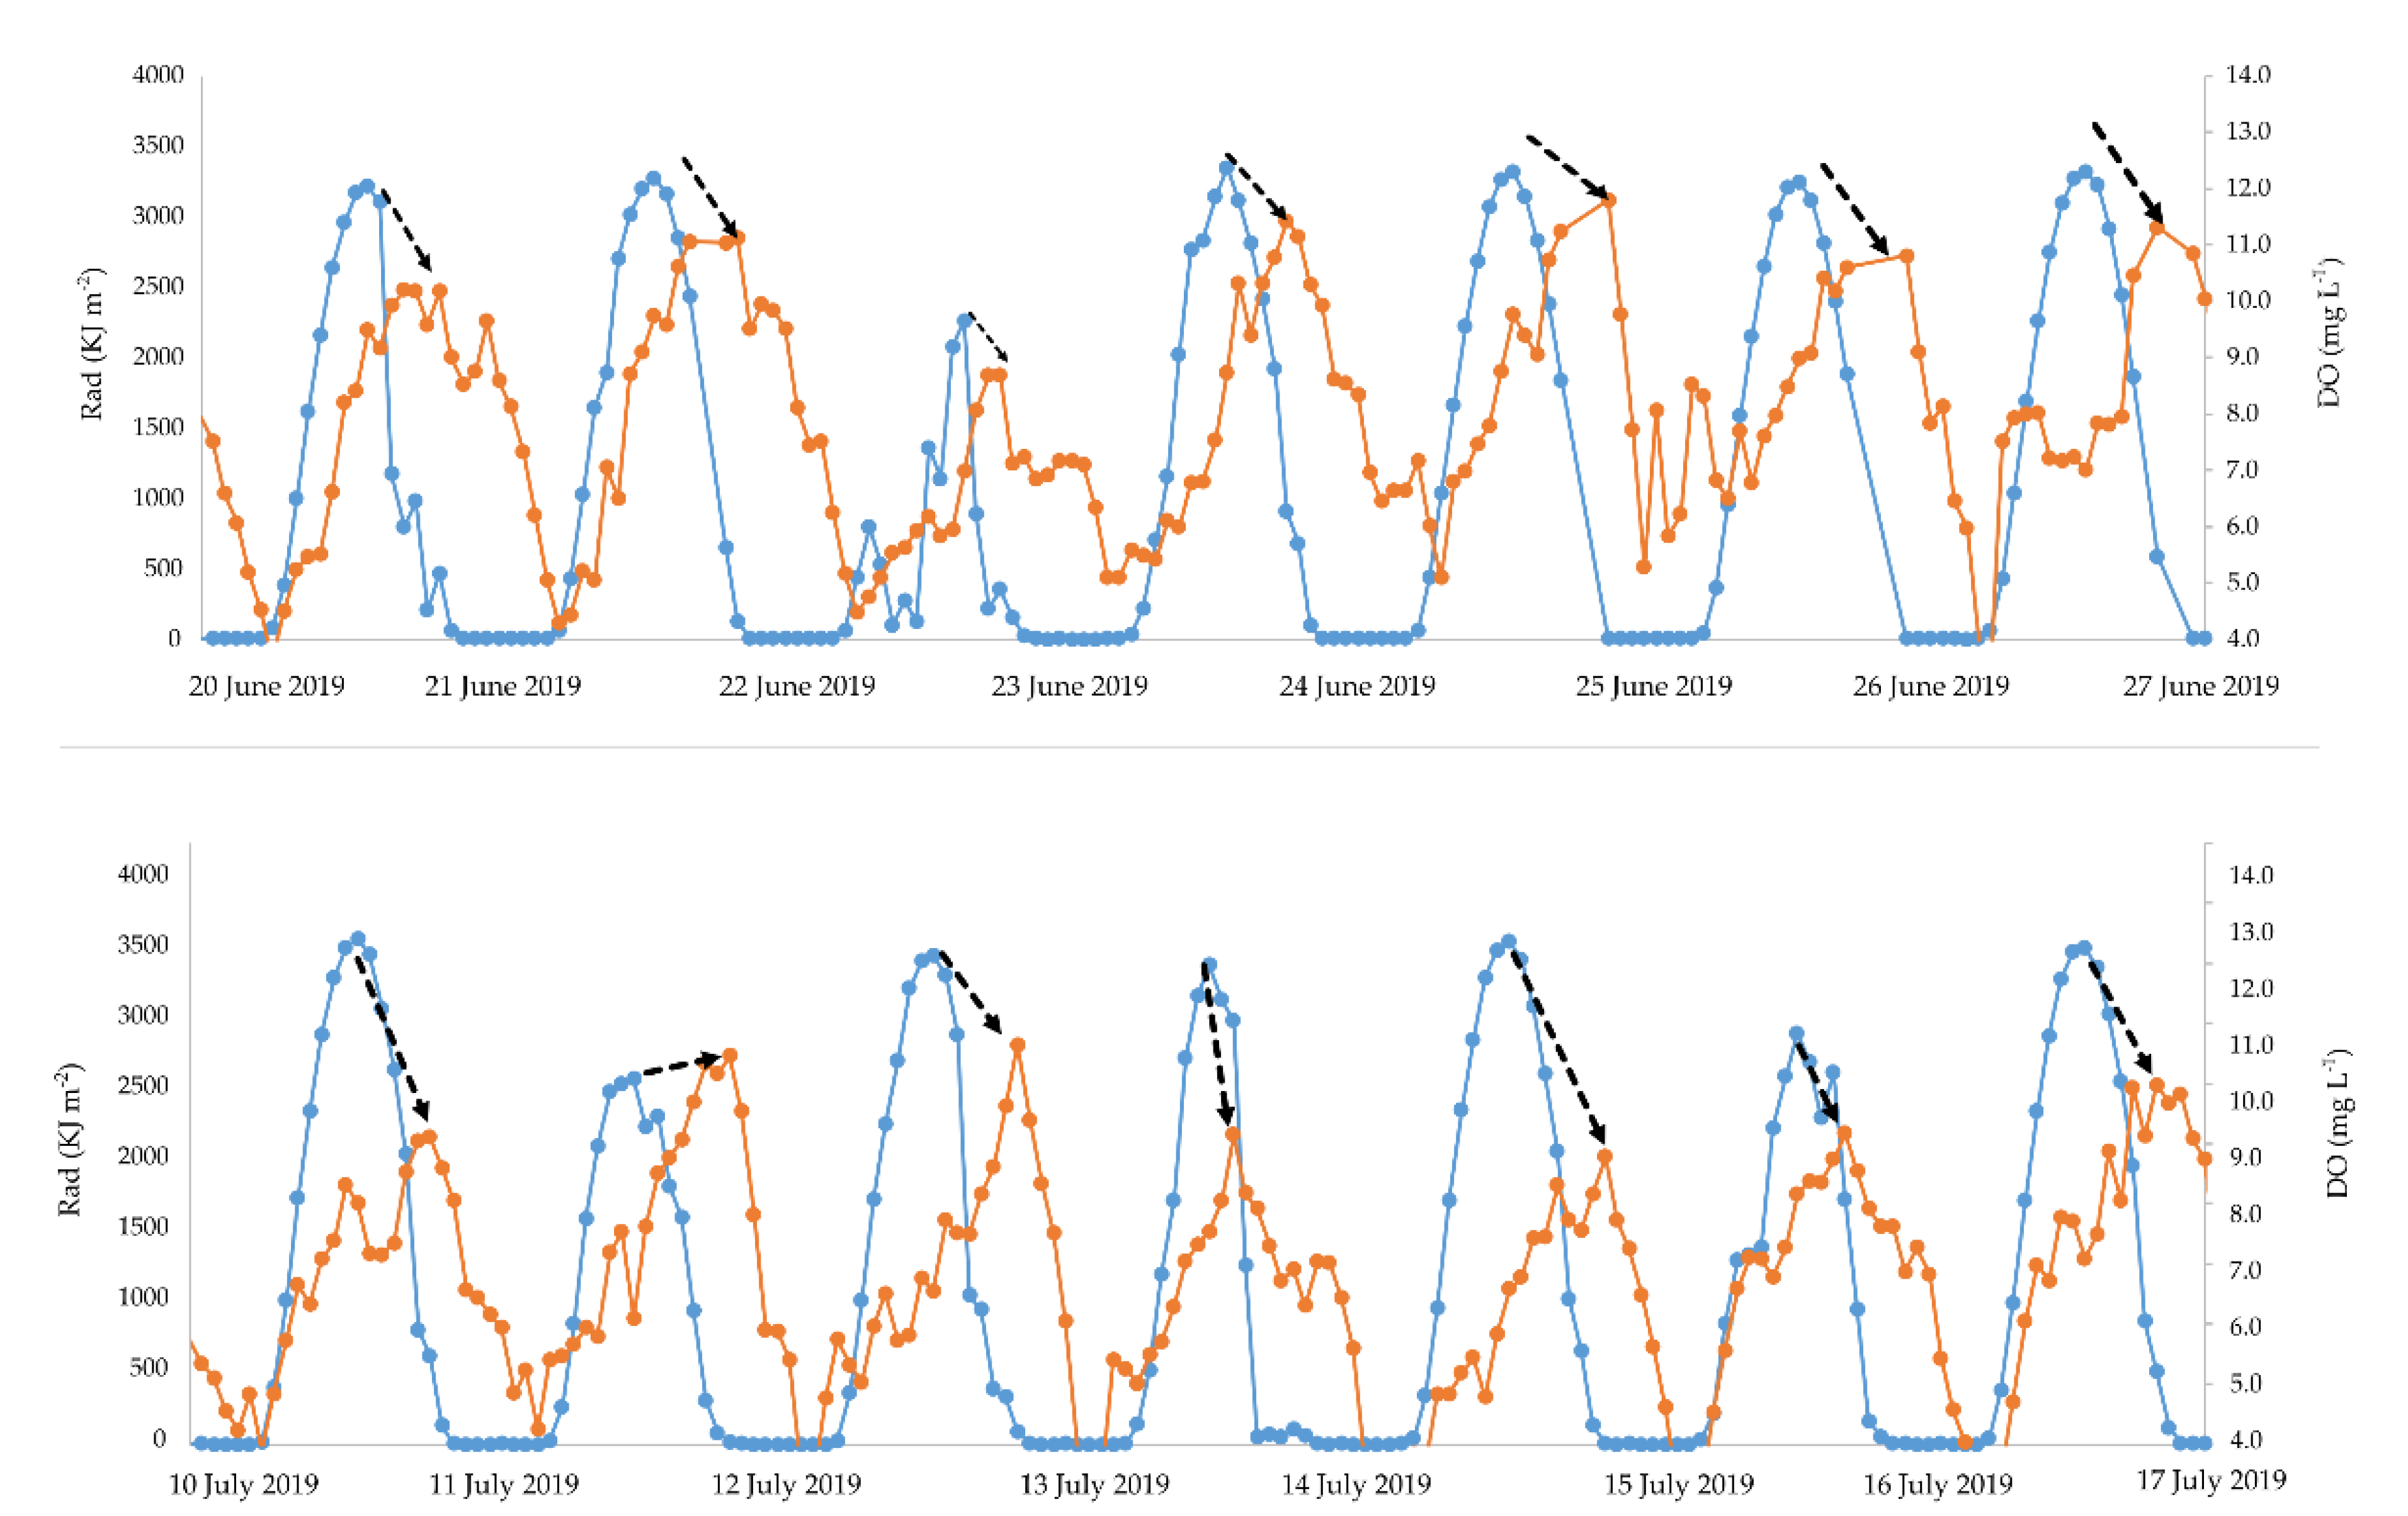
3.3. Influence of Solar Radiation and Tides on DO Content

The influence of solar radiation on DO content was checked over 2019 and 2020 in three sites (M5, M9 and G7) for the selected time intervals reported in Table S4 in Supplementary Materials. It is well known that biological activity occurring during the alternate photosynthesis/respiration cycles is affected by solar radiation, thus a clear relationship between the intensity of solar radiation and DO produced during photosynthesis could be expected. This behaviour is clearly demonstrated by the single plot reported in Figure 8, where it is clear that the peak of DO is subject to a relative delay with respect to the expected metabolic activation of photosynthesis, which is set from 6 to 8 h from the maximum incident radiation (the remaining plots that confirm the aforementioned trends are reported in Supplementary Materials S1).
Diurnal patterns of DO in the Marano and Grado Lagoon were previously investigated by means of deployed benthic chambers, where the discrete collection of water was performed every 2 or 3 h [24,27]. In both cases, a peak in DO was reached with a significant delay from peak solar radiation (i.e., 18:00 in June) and this could be ascribed to the fact that DO production can be balanced and sometimes surpassed by respiration, especially in the early morning hours [27]. In addition, the heterotrophic prokaryotes, which remove the labile DOM released by phytoplankton when the radiation is at its maximum, could also be responsible for oxygen consumption [85,86]. However, in all cases under consideration, there was a significant positive correlation between the intensity of solar radiation and DO levels (see Table S5 in Supplementary Materials) with the exception of the data collected at M5 over 2020.
The frequent presence of several peaks on a sub-daily scale is notable. These natural oscillations have been described by D’Autilia et al. [32], where differences of 1.5 mg L−1 were observed in less than 20 min, and also by Facchini et al. [65], thus are a common behaviour observed in oxygen dynamics. This behaviour could be influenced by physical factors (wind and tides) and also by biological ones such as photorespiration, the light-dependent uptake of oxygen and release of carbon dioxide in the photosynthetic tissues which act as photoprotection [87], which in particular takes place during strong irradiation and at high DO concentrations in the aqueous media [88].
As previously mentioned, tides act as a forcing factor for DO content because they strongly influence the hydrodynamics and this is also true for this lagoon where the water transport time scale is in the order of one or two days [37]. In this work, DO peaks (both maximum and minimum) followed the tidal cycle (Supplementary Material S2). This is evidenced by the significant correlation found at M5 and M9 during 2019, but it is also notable that at G7 there is a considerable delay of DO rising with respect to the tide, the resulting correlation being insignificant. This is likely related to the scarce water exchange of the area which does not allow for the prompt renewal of the DO pool. Surprisingly, this situation was also found at M9 in 2020 where a significant negative correlation occurred (see Table S6 in Supplementary Materials). It could be hypothesised that the significant abundance of phanerogams (i.e., Ruppia cirrhosa, Rupia marittima, Zostera marina and Cymodocea nodosa) in these areas is responsible for the constant DO oversaturation and that the inflow of marine waters can dilute the DO content rather than cause its enrichment. Overall, the coastal water entering in the Marano and Grado Lagoon from the Gulf of Trieste is capable of adding an important pool of oxygenated water masses.

3.4. Dissolved Oxygen Content and Management in the Context of WFD

As previously mentioned, DO level is critical for the life of marine organisms, thus it has been identified by the WFD/2000/60/CE among the five chemico-physical elements supporting biological elements. However, the threshold set to confirm a good ecological status is not uniform in the European jurisdiction. In Italy, it is set as follows: in the case of good status, the water body quality is downgraded to sufficient if the condition of anoxia persists for 1 or more days during the year or if the condition of anoxia persists for less than 1 day but is repeated for consecutive days and/or hypoxia is present for 1 or more days a year.
The high frequency of monitoring conducted in the Marano and Grado Lagoon highlighted the occurrence of hypoxic events during summer and these could impact the aquatic fauna and fishery resources [71] of the area described in Bettoso et al. [89]. The classification of the three-year period from 2017 to 2019 took into account the continuous monitoring of seven different deploying sites in the following WBs: FM3 (G6 and G7), TEU4 (M9), TME3 (M5 and M6), TPO2 (G1 and G4), TPO3 (M8 and M10), TPO4 (M3 and M4) and TPO5 (M1 and M2), which were selected as the most critical areas according to historical data (for the complete list of correspondent stations see Table S2 in Supplementary Materials).
The results showed that the highest content of DO occurs in the early afternoon when the photosynthetic process has enriched the water with produced oxygen, whereas the breathing process prevails during the night and the DO is mostly consumed, thus reaching the lowest values in the early hours of the day. During 2017, the WBs TPO3 and FM3 showed conditions of both hypoxia and anoxia. In detail, at TPO3, anoxia occurred for four consecutive days (from 3 to 6 August) and was followed by periods of hypoxia. The situation was very critical on the 4 and 5 of August when, on average, DO was 0.14 ± 0.29 and 1.64 ± 1.64 mg L−1, respectively. At FM3, anoxia was recorded for several consecutive days (from 26 August to 7 September and from 9 September to 15 September), however it was never present for an entire day.
In 2018, the occurrence of some episodic events at FM3 and TPO2 always occurred with a maximum duration of a few hours. Finally, FM3 and TME3 showed critical levels in 2019. At FM3, DO dropped until anoxia/hypoxia conditions occurred from 24 July to 15 August and from 18 August to 5 September, which is a situation similar to that observed in 2017. Overall, during this period, the DO content was, on average, very low (3.07 ± 1.93 mg L−1). The water quality was slightly better at TME3 with anoxia/hypoxia occurring in the first half of July and overall the degree of oxygenation was on average 6.09 ± 2.32 mg L−1. Thus, the WBs TPO3, FM3 and TME3 were classified from good to moderate on the basis of DO content.
However, the final classification under the WFD/2000/60/CE follows the rule “one out–all out” [89], and the aforementioned WBs suffered from other ecological problems such as the abundance and composition of macrophytes and fish fauna, nutrient contents and chemical status. For example, one previous study showed that the macroalgae and angiosperms tend to colonise the central area of the lagoon, whereas in other areas they were poor both in biomass and species richness, especially at FM3 WB [90] and also the macrozoobenthic communities were in moderate/scarce status on the basis of the M-AMBI index [49,91,92]. In our work, there is a disagreement between the classification and the state of the DO levels in the WBs investigated. In fact, even in WBs where the DO was found to be at good levels, the final classification (ecological status) was moderate or poor, and taking into consideration the chemical status, the final classification was even worse (Table 3).

4. Conclusions

The Marano and Grado Lagoon displays numerous characteristics common to other Mediterranean lagoons such as a significant temporal variability in temperature and salinity, which are driven by season, river discharge and amplitude of tides. In addition, this system is characterised by a very heterogeneous spatial distribution of physico-chemical parameters that is a reflection of the morphology [28,37]. Due to the importance of DO for aquatic life and its relationship with the well-known occurrence of nutrient inputs, recycling processes at the sediment–water interface [25,27,28,48,62] and to the European application of the WFD/2000/60/CE [4], the implementation of the SHAPE Project answered the need for classification tools capable of highlighting the natural variability of the system and with regard to the management of the area, it is very important from the environmental and socio-economic points of view.
The deployment of the SMATCH multiparameter probes from 2013 to 2020 covered the entire lagoon surface (it is notable that this was not simultaneously) and the continuous data acquisition allowed for the description of the DO dynamics and the relationships with complementary parameters, however no data are available for the coldest period of the year (from January to April) due to logistical problems. Temperature showed significant variability throughout the year, comparable to that found in other similar Mediterranean environments, but was nearly the same at the scale of the entire basin. On the contrary, salinity is strongly influenced by riverine discharges and tidal inputs, thus significant differences were found among the investigated sites. Finally, pH showed both spatial and temporal variability.
Overall, the lagoon is well oxygenated with values that, on average, surpass the thresholds set by the Shellfish Water Directive (in terms of DO expressed in %) and the aquatic life of sensitive species (in terms of DO expressed in mg L−1) and that are inversely related to temperature and salinity. However, the occurrence of conditions of both anoxia and hypoxia for one or more consecutive days cannot be neglected and should carefully be taken into account. These events, which occur mostly during late summer, in the absence of solar radiation and are typical of the more confined areas, are counterbalanced by the increase of DO during the day, when the intensity of solar radiation increases, and are also buffered by the ingression of well-oxygenated marine waters during the tidal cycle and by riverine freshwater discharge. In addition, the presence of a daily marine breeze and a strong wind (mainly the Bora from ENE) could also favour oxygenation, but this aspect has not been considered in this work and further investigation should be planned. The classification of the lagoon’s water bodies benefits from the results obtained through continuous monitoring. In fact, the DO oscillations were well detected and permitted one to distinguish the hypoxia/anoxia conditions that occurred for prolonged periods of time. With this approach, 3 out of 17 WBs were classified as moderate, but it should be noted that the DO content is not the only parameter involved in the worsening of the WB classification.
Based on the results obtained in this study, the deployment of these probes also appears to be promising for the management of areas of commercial importance subjected to periodic oxygen crisis. This is the case of fish farms that cover about 14% of the Marano and Grado Lagoon area, where the water exchange is regulated through sluice gates, of shellfish/mussel farming and of some protected confined areas (i.e., the mouth of the Stella River, Valle Cavanata).

Supplementary Materials

The following are available online at https://www.mdpi.com/article/10.3390/jmse10020208/s1, File S1: Radiation and DO, File S2: Dissolved oxygen and tides, Table S1: Overview of the characteristics of the sensors as reported by the NKE Instrumentation, Table S2: Identification and deployment of the 5 multiprobes from 2013 to 2020 in the Marano and Grado Lagoon, Table S3: Application of the test for normality Shapiro-Wilk, Table S4: Sites and periods considered for DO and solar radiation/tide relationship, Table S5: Relationships between DO and solar radiation intensity, Table S6: Relationships between DO and tide.

Author Contributions

Conceptualization, F.P., M.C., and A.A.; methodology, F.P. and M.C.; software, F.P., M.C. and A.A.; validation, F.P., M.C. and A.Z.; investigation F.P., F.C., A.C., D.G. and L.F.; data curation, F.P., M.C., and D.G.; writing—original draft preparation, F.P., and A.A.; writing—review and editing, F.P., A.A., N.B., I.F.A., M.C., N.B., and O.B.; supervision, A.Z., and C.O. All authors have read and agreed to the published version of the manuscript.

Funding

This research was funded by FINANCIAL PROGRAM 2007–2013 Adriatic IPA CBC (IT-SI-EL-HR- BA-ME-AL-RS).

Data Availability Statement

The data presented in this study are openly available at the following website: http://www.arpaweb.fvg.it/bs/gmapsbs.asp.

Acknowledgments

The Authors acknowledged all staff of the Environmental Protection Agency of Friuli Venezia Giulia (Arpa FVG) involved in sampling operation, the administrative staff involved in the management of the financial program, and Giorgio Mattassi and Isabella Scroccaro for the research of funding and kickoff of the project. The authors warmly thank Karry Close for her careful English proofreading of the manuscript.

Conflicts of Interest

The authors declare no conflict of interest.

References

  1. Razinkovas, A.; Gasiūnaitė, Z.; Viaroli, P.; Zaldívar, J.M. European lagoons—Need for further comparison across spatial and temporal scales. Hydrobiologia 2008, 611, 1–4. [Google Scholar] [CrossRef]
  2. Gaertner-Mazuoni, N.; De Wit, R. Exploring new issues for coastal lagoons monitoring and management. Estuar. Coast. Shelf Sci. 2012, 114, 1–6. [Google Scholar] [CrossRef]
  3. Newton, A.; Brito, A.C.; Icely, J.D.; Derolez, V.; Clara, I.; Angus, S.; Schernewski, G.; Inácio, M.; Lillebø, A.I.; Béjaoui, B.; et al. Assessing, quantifying and valuing the ecosystem services of coastal lagoons. J. Nat. Conserv. 2018, 44, 50–65. [Google Scholar] [CrossRef]
  4. WFD. European Commission Directive 2000/60/EC of the European Parliament and of the Council of 23 October 2000 establishing a framework for Community action in the field of water policy. Off. J. Eur. Comm. 2000, L 327, 1–72. [Google Scholar]
  5. Wu, R.S.S. Hypoxia: From molecular responses to ecosystem responses. Mar. Pollut. Bull. 2002, 45, 35–45. [Google Scholar] [CrossRef]
  6. Yoann, T.; Flye-Sainte-Marie, J.; Chabot, D.; Aguirre-Velarde, A.; Marques Gonçalo, M.; Pecquerie, L. Effects of hypoxia on metabolic functions in marine organisms: Observed patterns and modelling assumptions within the context of Dynamic Energy Budget (DEB) theory. J. Coast Res. 2019, 143, 231–242. [Google Scholar]
  7. Riedel, B.; Diaz, R.; Rosenberg, R.; Stachowitsch, M. The ecological consequences of marine hypoxia: From behavioural to ecosystem responses. In Stressors in the Marine Environment: Physiological and Ecological Responses; Societal Implications; Solan, M., Whiteley, N., Eds.; Oxford University Press: Oxford, UK, 2016; Published to Oxford Scholarship Online: May 2016. [Google Scholar] [CrossRef]
  8. Fortes-Lopes, J.; Silva, C. Temporal and spatial distribution of dissolved oxygen in the Ria de Aveiro lagoon. Ecol. Model 2006, 197, 67–88. [Google Scholar] [CrossRef]
  9. Diaz, R.J. Overview of hypoxia around the world. J. Environ. Qual. 2001, 30, 275–281. [Google Scholar] [CrossRef] [PubMed]
  10. Rabalais, N.N.; Gilbert, D. Distribution and consequences of hypoxia. In Watersheds, Bays and Bounded Seas; Urban, E., Sundby, B., Malanotte-Rizzoli, P., Melillo, J.M., Eds.; Island Press: Washington, DC, USA, 2009; pp. 209–226. [Google Scholar]
  11. Diaz, R.J.; Rosenberg, R. Spreading dead zones and consequences for marine ecosystems. Science 2008, 321, 926–929. [Google Scholar] [CrossRef]
  12. Diaz, R.J.; Rosenberg, R. Marine benthic hypoxia: A review of its ecological effects and the behavioural responses of benthic macrofauna. Oceanogr. Mar. Biol. 1995, 33, 245–303. [Google Scholar]
  13. EPA. Ambient Aquatic Life Water Quality Criteria for Dissolved Oxygen (Saltwater): Cape Cod to Cape Hatteras; EPA: Washington, DC, USA, 2000; 140p. [Google Scholar]
  14. Newton, A.; Oliveira, P.S.; Icely, J.D.; Foster, P.A. Monitoring of oxygen condition in the Ria Formosa coastal lagoon, Portugal. J. Environ. Monit. 2010, 12, 355–360. [Google Scholar] [CrossRef] [PubMed]
  15. Caballero-Alfonso, A.M.; Carstensen, J.; Conley, D.J. Biogeochemical and environmental drivers of coastal hypoxia. J. Mar. Sys. 2015, 141, 190–199. [Google Scholar] [CrossRef] [Green Version]
  16. Zhang, J.; Gilbert, D.; Gooday, A.J.; Levin, L.A.; Naqvi, W.A.; Middelburg, J.J.; Scranton, M.; Ekau, W.; Peña, A.; Dewitte, B.; et al. Natural and human-induced hypoxia and consequences for coastal areas: Synthesis and future development. Biogeoscience 2010, 7, 1443–1467. [Google Scholar] [CrossRef] [Green Version]
  17. Chapelle, A.; Ménesguen, A.; Deslous-Paoli, J.M.; Souchu, P.; Mazouni, N.; Vaquer, A.; Millet, B. Modelling nitrogen, primary production and oxygen in a Mediterranean lagoon. Impact of oysters farming and inputs from the watershed. Ecol. Model. 2000, 127, 161–181. [Google Scholar] [CrossRef] [Green Version]
  18. Como, S.; Magni, P. Temporal changes of a macrobenthic assemblage in harsh lagoon sediments. Estuar. Coast Shelf. Sci. 2009, 83, 638–646. [Google Scholar] [CrossRef]
  19. Viaroli, P.; Azzoni, R.; Bartoli, M.; Giordani, G.; Naldi, M.; Nizzoli, D. Primary productivity, biogeochemical buffers and factors controlling trophic status and ecosystem processes in Mediterranean coastal lagoons: A synthesis. Adv. Oceanogr. Limnol. 2010, 1, 271–293. [Google Scholar] [CrossRef]
  20. Avramidis, P.; Bekiari, V.; Christodoulou, D.; Papatheodorou, G. Sedimentology and water column stratification in a permanent anoxic Mediterranean lagoon environment, Aetoliko Lagoon, western Greece. Environ. Earth Sci. 2015, 73, 5687–5701. [Google Scholar] [CrossRef]
  21. Zilius, M.; Giordani, G.; Petkuviene, J.; Lubiene, I.; Ruginis, T.; Bartoli, M. Phosphorus mobility under short-term anoxic conditions in two shallow eutrophic coastal systems (Curonian and Sacca di Goro lagoons). Estuar. Coast Shelf Sci. 2015, 164, 134–146. [Google Scholar] [CrossRef]
  22. Brigolin, D.; Rabouille, C.; Demasy, C.; Bombled, B.; Monvoisin, G.; Pastres, R. Early diagenesis in sediments of the Venice Lagoon (Italy) and its relationship to hypoxia. Front. Mar. Sci. 2021, 7, 575547. [Google Scholar] [CrossRef]
  23. OSPAR. Common Procedure for the Identification of the Eutrophication Status of the OSPAR Maritime Area; Agreement 2005-3; OSPAR Commission: London, UK, 2008. [Google Scholar]
  24. Covelli, S.; Faganeli, J.; De Vittor, C.; Predonzani, S.; Acquavita, A.; Horvat, M. Benthic fluxes of mercury species in a lagoon environment (Grado lagoon, Northern Adriatic Sea, Italy). Appl. Geochem. 2008, 23, 529–546. [Google Scholar] [CrossRef]
  25. Covelli, S.; Emili, A.; Acquavita, A.; Koron, N.; Faganeli, J. Benthic biogeochemical cycling of mercury in two contaminated northern Adriatic coastal lagoons. Cont. Shelf Res. 2011, 31, 1777–1789. [Google Scholar] [CrossRef]
  26. Acquavita, A.; Emili, A.; Covelli, S.; Faganeli, J.; Predonzani, S.; Koron, N.; Carrasco, L. The effects of resuspension on the fate of Hg in contaminated sediments (Marano and Grado Lagoon, Italy): Short-term simulation experiments. Estuar. Coast Shelf Sci. 2012, 13, 32–40. [Google Scholar] [CrossRef]
  27. De Vittor, C.; Faganeli, J.; Emili, A.; Covelli, S.; Predonzani, S.; Acquavita, A. Benthic fluxes of oxygen, carbon and nutrients in the Marano and Grado Lagoon (northern Adriatic Sea, Italy). Estuar. Coast Shelf Sci. 2012, 113, 57–70. [Google Scholar] [CrossRef]
  28. Acquavita, A.; Aleffi, I.F.; Benci, C.; Bettoso, N.; Crevatin, E.; Milani, L.; Tamberlich, F.; Toniatti, L.; Barbieri, P.; Licen, S.; et al. Annual characterization of nutrients pattern and trophic state in a Mediterranean coastal lagoon: The Marano and Grado Lagoon, northern Adriatic Sea. Reg. Stud. Mar. Sci. 2015, 2, 132–144. [Google Scholar] [CrossRef] [Green Version]
  29. Bricker, S.B.; Ferreira, J.G.; Simas, T. An integrated methodology for assessment of estuarine trophic status. Ecol. Model. 2003, 169, 39–60. [Google Scholar] [CrossRef] [Green Version]
  30. Winkler, L.W. Die Bestimmung des im Wasser gelösten Sauerstoffen. Ber. Dtsche. Chem. Ges. 1888, 21, 2842–2855. [Google Scholar] [CrossRef] [Green Version]
  31. Garel, E.; Ferreira, O. Monitoring estuaries using non-permanent stations: Practical aspects and data examples. Ocean Dyn. 2011, 61, 891–902. [Google Scholar] [CrossRef]
  32. D’Autilia, R.; Falcucci, M.; Hull, V.; Parrella, L. Short time dissolved oxygen dynamics in shallow water ecosystems. Ecol. Model. 2004, 179, 297–306. [Google Scholar] [CrossRef]
  33. Nezlin, N.P.; Kamer, K.; Hyde, J.; Stein, E.D. Dissolved oxygen dynamics in a eutrophic estuary, Upper Newport Bay, California. Estuar. Coast Shelf Sci. 2009, 82, 139–151. [Google Scholar] [CrossRef]
  34. Friedrich, J.; Janssen, F.; Aleynik, D.; Bange, H.W.; Boltacheva, N.; Çagatay, M.N.; Dale, A.W.; Etiope, G.; Erdem, Z.; Geraga, M.; et al. Investigating hypoxia in aquatic environments: Diverse approaches to addressing a complex phenomenon. Biogeosciences 2014, 11, 1215–1259. [Google Scholar] [CrossRef] [Green Version]
  35. Cravo, A.; Rosa, A.; Jacob, J.; Correia, C. Dissolved oxygen dynamics in Ria Formosa Lagoon (South Portugal)—A real time monitoring observatory. Mar. Chem. 2020, 223, 10386. [Google Scholar] [CrossRef]
  36. Brambati, A. Metalli Pesanti Nelle Lagune di Marano e Grado: Piano di Studi Finalizzato All’accertamento della Presenza di Eventuali Sostanze Tossiche Persistenti nel Bacino Lagunare di Marano e Grado ed al Suo Risanamento; Regione Autonoma Friuli-Venezia Giulia, Servizio Idraulica: Trieste, Italy, 1996; 174p. [Google Scholar]
  37. Ferrarin, C.; Umgiesser, G.; Bajo, M.; Bellafiore, D.; De Pascalis, F.; Ghezzo, M.; Mattassi, G.; Scroccaro, I. Hydraulic zonation of the lagoons of Marano and Grado, Italy. A modeling approach. Estuar. Coast Shelf Sci. 2010, 87, 561–572. [Google Scholar] [CrossRef] [Green Version]
  38. Triches, A.; Pillon, S.; Bezzi, A.; Lipizer, M.; Gordini, E. Carta Batimetrica della Laguna di Marano e Grado; Regione Autonoma Friuli Venezia Giulia—A Cura di: Autorità di Bacino Regionale del Friuli Venezia Giulia, Commissario Delegato per l’emergenza socio-economico ambientale determinatasi nella Laguna di Marano Lagunare e Grado, Dipartimento di Geoscienze dell’Università di Trieste: Trieste, Italy; OGS—Istituto Nazionale di Oceanografia e di Geofisica Sperimentale: Sgonico, Italy; Arti Grafiche Friulane, Imoco spa (Ud): Fagagna, Italy, 2011. [Google Scholar]
  39. Ret, M. Bilancio Idrologico e Circolazione Idrica della Laguna di Marano e Grado. Master’s Thesis, Faculty of Engineering, University of Udine, Udine, Italy, 2006; p. 442. (In Italian). [Google Scholar]
  40. Mancero-Mosquera, I. Water flow in the inlets of the Marano-Grado lagoon system (NE Italy). Il Nuovo Cim. 2013, 36, 132–144. [Google Scholar]
  41. Dorigo, L. La Laguna di Grado e le Sue Foci. Ricerche e Rilievi Idrografici; Magistrato Alle Acque-Ufficio Idrografico: Venezia, Italy, 1965; 231p. (In Italian) [Google Scholar]
  42. Fontolan, G.; Pillon, S.; Bezzi, A.; Villalta, R.; Lipizer, M.; Triches, A.; D’Aietti, A. Human impact and the historical transformation of saltmarshes in the Marano and Grado Lagoon, northern Adriatic Sea. Estuar. Coast Shelf Sci. 2012, 113, 41–56. [Google Scholar] [CrossRef]
  43. Acquavita, A.; Covelli, S.; Emili, A.; Berto, D.; Faganeli, J.; Giani, M.; Horvat, M.; Koron, N.; Rampazzo, F. Mercury in the sediments of the Marano and Grado Lagoon (Northern Adriatic Sea): Sources, distribution and speciation. Estuar. Coast Shelf Sci. 2012, 13, 20–31. [Google Scholar] [CrossRef]
  44. Sladonja, B.; Bettoso, N.; Zentilin, A.; Tamberlich, F.; Acquavita, A. Manila clam (Tapes philippinarum Adams & Reeve, 1852) in the Lagoon of Marano and Grado (Northern Adriatic Sea, Italy): Socio-economic and environmental pathway of a shell farm. In Aquaculture and the Environment—A Shared Destiny; Sladonja, B., Ed.; Tech Open Publishers: Rijeka, Croatia, 2011; pp. 51–78. [Google Scholar]
  45. Ramieri, E.; Barbanti, A.; Picone, M.; Menchini, G.; Bressan, E.; Dal Forno, E. Integrated plan for the sustainable management of the Lagoon of Marano and Grado. In Proceedings of the Littoral 2010—Adapting to Global Change at the Coast: Leadership, Innovation, and Investment, London, UK, 21–23 September 2010; Available online: http://coastnet-littoral2010.edpsciences.org/articles/litt/pdf/2011/01/litt-05008.pdf (accessed on 10 October 2021).
  46. Acquavita, A.; Falomo, J.; Predonzani, S.; Bettoso, N.; Mattassi, G. The PAH level, distribution and composition in surface sediments from a Mediterranean Lagoon: The Marano and Grado Lagoon (Northern Adriatic Sea, Italy). Mar. Pollut. Bull. 2014, 81, 234–241. [Google Scholar] [CrossRef]
  47. Covelli, S.; Langone, L.; Acquavita, A.; Piani, R.; Emili, A. Historical flux of mercury associated with mining and industrial sources in the Marano and Grado Lagoon (northern Adriatic Sea). Estuar. Coast Shelf Sci. 2012, 13, 7–19. [Google Scholar] [CrossRef]
  48. Saccon, P.; Leis, A.; Marca, A.; Kaiser, J.; Campisi, L.; Böttcher, M.E.; Savarino, J.; Escher, P.; Eisenhauer, A.; Erbland, J. Multi-isotope approach for the identification and characterisation of nitrate pollution sorces in the Marano lagoon (Italy) and parts of its catchment area. App. Geochem. 2013, 34, 75–89. [Google Scholar] [CrossRef] [Green Version]
  49. Bettoso, N.; Aleffi, I.F.; Faresi, L.; D’Aietti, A.; Acquavita, A. Macrozoobenthos monitoring in relation to dredged sediment disposal: The case of the Marano and Grado Lagoon (northern Adriatic Sea, Italy). Reg. Stud. Mar. Sci. 2020, 33, 100916. [Google Scholar] [CrossRef]
  50. Torresan, S.; Critto, A.; Rizzi, J.; Marcomini, A. Assessment of coastal vulnerability to climate change hazards at the regional scale: The case study of the North Adriatic Sea. Nat. Hazards Earth Syst. Sci. 2012, 12, 2347–2368. [Google Scholar] [CrossRef]
  51. Ferrarin, C.; Bajo, M.; Bellafiore, D.; Cucco, A.; De Pascalis, F.; Ghezzo, M.; Umgiesser, G. Toward homogenization of Mediterranean lagoons and their loss of hydrodiversity. Geophys. Res. Lett. 2014, 41, 5935–5941. [Google Scholar] [CrossRef]
  52. Hammer, Ø.; Harper, D.A.T.; Ryan, P.D. Paleontological Statistics Software Package for Education and Data Analysis. Palaeontol. Electron. 2001, 4, 9. [Google Scholar]
  53. Shapiro, S.S.; Wilk, M.B. An analysis of variance test for normality (complete samples). Biometrika 1965, 52, 591–611. [Google Scholar] [CrossRef]
  54. Zar, J.H. Biostatistical Analysis, 3rd ed.; Prentice Hall: Hoboken, NJ, USA, 1996. [Google Scholar]
  55. Graham, P.; Falconer, L.; Telfer, T.; Mossone, P.; Viale, I. A modelling approach to classify the suitability of shallow Mediterranean lagoons for pacific oyster, Crassostrea gigas (Thunberg, 1793) farming. Ocean Coast Manag. 2020, 192, 105234. [Google Scholar] [CrossRef]
  56. Capaccioni, F.; Contò, M.; Failla, S.; Cataudella, S.; Ciccotti, E. Fatty acid profiles of migrating female silver eel from Mediterranean coastal lagoons as integrative descriptors of spawners biological quality. Estuar. Coast Shelf Sci. 2018, 210, 87–97. [Google Scholar] [CrossRef]
  57. Cañedo-Argüelles, M.; Rieradevall, M.; Farrés-Correl, R.; Newton, A. Annual characterisation of four Mediterranean coastal lagoons subjectedto intense human activity. Estuar. Coast Shelf Sci. 2012, 114, 59–69. [Google Scholar] [CrossRef]
  58. Zucchetta, M.; Franco, A.; Torricelli, P.; Franzoi, P. Habitat distribution model for European flounder juveniles in the Venice lagoon. J. Sea Res. 2010, 64, 133–144. [Google Scholar] [CrossRef]
  59. Best, M.A.; Wither, A.W.; Coates, S. Dissolved oxygen as a physico-chemical supporting element in the Water Framework Directive. Mar. Pollut. Bull. 2007, 55, 53–64. [Google Scholar] [CrossRef]
  60. Gilabert, J. Seasonal plankton dynamics in a Mediterranean hypersaline coastal lagoon: The Mar Menor. J. Plankton Res. 2001, 23, 207–218. [Google Scholar] [CrossRef]
  61. Diamantopoulou, E.; Dassenakis, M.; Kastritis, A.; Tomara, V.; Paraskevopoulou, V.; Poulos, S. Seasonal fluctuations of nutrients in a hypersaline Mediterranean lagoon. Desalination 2008, 224, 271–279. [Google Scholar] [CrossRef]
  62. Petranich, E.; Covelli, S.; Acquavita, A.; De Vittor, C.; Faganeli, J.; Contin, M. Benthic nutrient cycling at the sediment-water interface in a lagoon farming system (northern Adriatic Sea, Italy). Sci. Total Environ. 2018, 644, 137–149. [Google Scholar] [CrossRef]
  63. D’Aietti, A.; Altobelli, A.; Cabrini, M. La Vallicoltura nella laguna di Grado: Impatti e problematiche delle valli da pesca. In Linee Guida e Casi di Studio per la Gestione dei siti della rete Natura 2000 in Ambiente di Transizione; EUT Edizioni Università di Trieste: Trieste, Italy, 2007; pp. 224–242. [Google Scholar]
  64. Vincenzi, S.; Caramori, G.; Rossi, R.; De Leo, G.A. A GIS-based habitat suitability model for commercial yield estimation of Tapes philippinarum in a Mediterranean coastal lagoon (Sacca di Goro, Italy). Ecol. Model. 2006, 193, 90–104. [Google Scholar] [CrossRef]
  65. Facchini, A.; Mocenni, C.; Marwan, N.; Vicino, A.; Tiezzi, E. Nonlinear time series analysis of dissolved oxygen in the Orbetello Lagoon (Italy). Ecol. Model. 2007, 203, 339–348. [Google Scholar] [CrossRef]
  66. Coelho, S.; Gamito, S.; Pérez-Ruzafa, A. Trophic state of Foz de Almargem coastal lagoon (Algarve, South Portugal) based on the water quality and the phytoplankton community. Estuar. Coast Shelf Sci. 2007, 71, 218–231. [Google Scholar] [CrossRef]
  67. Specchiulli, A.; Focardi, S.; Renzi, M.; Scirocco, T.; Cilenti, L.; Breber, P.; Bastianoni, S. Environmental heterogeneity patterns and assessment of trophic levels in two Mediterranean lagoons: Orbetello and Varano, Italy. Sci. Total Environ. 2008, 402, 285–298. [Google Scholar] [CrossRef]
  68. Facca, C.; Pellegrino, N.; Ceoldo, S.; Tibaldo, M.; Sfriso, A. Trophic conditions in the Venice Lagoon (Northern Adriatic Sea, Italy). Open Ocean J. 2011, 5, 1–13. [Google Scholar] [CrossRef] [Green Version]
  69. Alp, M.T.; Fakioğlu, Y.E.; Özbay, Ö.; Turan Koçer, M.A. A study on water quality and trophic state of Akgöl Lagoon (Mersin, Turkey). Aquat. Ecosyst. Health Manag. 2016, 19, 58–63. [Google Scholar] [CrossRef]
  70. Rigaud, S.; Deflandre, B.; Grenz, C.; Cesbron, F.; Pozzato, L.; Voltz, B.; Grémare, A.; Romero-Ramirez, A.; Mirleau, P.; Meulé, S.; et al. Benthic oxygen dynamics and implication for the maintenance of chronic hypoxia and ecosystem degradation in the Berre lagoon (France). Estuar. Coast Shelf Sci. 2021, 258, 107437. [Google Scholar] [CrossRef]
  71. Abdel-Tawwab, M.; Monier, M.N.; Hoseinifar, S.H.; Faggio, C. Fish response to hypoxia stress: Growth, physiological, and immunological biomarkers. Fish Physiol. Biochem. 2019, 45, 997–1013. [Google Scholar] [CrossRef]
  72. Gomez Isaza, D.F.; Cramp, R.L.; Franklin, C.E. Exposure to nitrate increases susceptibility to hypoxia in fish. Physiol. Biochem. Zool. 2021, 94, 124–142. [Google Scholar] [CrossRef]
  73. Middelburg, J.J.; Levin, L.A. Coastal hypoxia and sediment biogeochemistry. Biogeosciences 2009, 6, 1273–1293. [Google Scholar] [CrossRef] [Green Version]
  74. Emili, A.; Koron, N.; Covelli, S.; Faganeli, J.; Acquavita, A.; Predonzani, S.; De Vittor, C. Does anoxia affect mercury cycling at the sediment-water interface in the Gulf of Trieste (northern Adriatic Sea)? Incubation experiments using benthic flux chambers. App. Geochem. 2011, 26, 194–204. [Google Scholar] [CrossRef]
  75. Ogrinc, N.; Faganeli, J. Phosphorus regeneration and burial in near-shore marine sediments (the Gulf of Trieste, northern Adriatic Sea). Estuar. Coast Shelf Sci. 2006, 67, 579–588. [Google Scholar] [CrossRef]
  76. Warnken, K.W.; Gill, G.A.; Griffin, L.L.; Santschi, P.H. Sediment-water exchange of Mn, Fe, Ni and Zn in Galveston Bay, Texas. Mar. Chem. 2001, 73, 215–231. [Google Scholar] [CrossRef]
  77. Emili, A.; Acquavita, A.; Covelli, S.; Spada, L.; Di Leo, A.; Giandomenico, S.; Cardellicchio, N. Mobility of heavy metals from polluted sediments of a semi-enclosed basin: In situ benthic chamber experiments in Taranto’s Mar Piccolo (Ionian Sea, Southern Italy). Environ. Sci. Pollut. Res. 2016, 23, 12582–12595. [Google Scholar] [CrossRef]
  78. Rigaud, S.; Radakovitch, O.; Couture, R.M.; Deflandre, B.; Cossa, D.; Garnier, C.; Garnier, J.-M. Mobility and fluxes of trace elements and nutrients at the sediment-water interface of a lagoon under contrasting water column oxygenation conditions. Appl. Geochem. 2013, 31, 35–51. [Google Scholar] [CrossRef] [Green Version]
  79. Formalewicz, M.M.; Rampazzo, F.; Noventa, S.; Gion, C.; Petranich, E.; Crosera, M.; Covelli, S.; Faganeli, J.; Berto, D. Organotin compounds in touristic marinas of the northern Adriatic Sea: Occurrence, speciation and potential recycling at the sediment-water interface. Environ. Sci. Pollut. Res. 2019, 26, 31142–31157. [Google Scholar] [CrossRef]
  80. Petranich, E.; Croce, S.; Crosera, M.; Pavoni, E.; Faganeli, J.; Adami, G.; Covelli, S. Mobility of metal(loid)s at the sediment-water interface in two tourist port areas of the Gulf of Trieste (northern Adriatic Sea). Environ. Sci. Pollut. Res. 2018, 25, 26887–26902. [Google Scholar] [CrossRef]
  81. Emili, A.; Acquavita, A.; Koron, N.; Covelli, S.; Faganeli, J.; Horvat, M.; Žižek, S.; Fajon, V. Benthic flux measurements of Hg species in a northern Adriatic lagoon environment (Marano & Grado Lagoon). Estuar. Coast Shelf Sci. 2012, 13, 71–84. [Google Scholar]
  82. UNESCO. Oxygen Solubility in Sea Water; UNESCO International Oceanographic Tables; UNESCO: Paris, France, 1973; Volume 2. [Google Scholar]
  83. UNESCO. Tenth Report of the Joint Panel on Oceanographic Tables and Standards. UNESCO Tech. Pap. Mar. Sci. 1981, 36, 22. [Google Scholar]
  84. Benson, B.B.; Krause, D., Jr. The concentration and isotopic fractionation of oxygen dissolved in freshwater and seawater in equilibrium with the atmosphere. Limnol. Oceanogr. 1984, 29, 620–632. [Google Scholar] [CrossRef]
  85. Obernosterer, I.; Catala, P.; Reinthaler, T.; Herndl, G.J.; Lebaron, P. Enhanced heterotrophic activity in the surfacemicrolayer of the Mediterranean Sea. Aquat. Microb. Ecol. 2005, 39, 293–302. [Google Scholar] [CrossRef]
  86. Morán, X.A.G.; García, F.C.; Røstad, A.; Silva, L.; Al-Otaibi, N.; Irigoien, X.; Calleja, M.L. Diel dynamics of dissolved organic matter and heterotrophic prokaryotes reveal enhanced growth at the ocean’s mesopelagic fish layer during daytime. Sci. Total Environ. 2022, 804, 150098. [Google Scholar] [CrossRef] [PubMed]
  87. Beardall, J. Photosynthesis and photorespiration in marine phytoplankton. Aquat. Bot. 1989, 34, 105–130. [Google Scholar] [CrossRef]
  88. Hull, V.; Parrella, L.; Falcucci, M. Modelling dissolved oxygen dynamics in coastal lagoons. Ecol. Model. 2011, 211, 468–480. [Google Scholar] [CrossRef]
  89. Borja, Á.; Rodríguez, J.G. Problems associated with the ‘one-out, all-out’ principle, when using multiple ecosystem components in assessing the ecological status of marine waters. Mar. Pollut. Bull. 2010, 60, 1143–1146. [Google Scholar] [CrossRef]
  90. Falace, A.; Curiel, D.; Sfriso, A. Study of the macrophyte assemblages and application of phytobenthic indices to assess the Ecological Status of the Marano-Grado Lagoon (Italy). Mar. Ecol. 2009, 30, 480–494. [Google Scholar] [CrossRef]
  91. Bettoso, N.; Acquavita, A.; D’Aietti, A.; Mattassi, G. The Marano and Grado Lagoon: A brief synopsis on the aquatic fauna and fisheries resources. Ann. Ser. Hist. Nat. 2013, 23, 135–142. [Google Scholar]
  92. Bettoso, N.; Aleffi, I.F.; Faresi, L.; Rossin, P.; Mattassi, G. Evaluation on the ecological status of the macrozoobenthic communities in the Marano and Grado Lagoon (northern Adriatic Sea). Ann. Ser. Hist. Nat. 2010, 20, 193–206. [Google Scholar]
Figure 1. Index map of the Marano and Grado Lagoon with the identified water bodies.
Jmse 10 00208 g001
Figure 2. Example of probe deployment in the Marano and Grado Lagoon.
Jmse 10 00208 g002
Figure 3. Monitoring sites in the Marano and Grado Lagoon (from M1 to M11 Marano basin, and from G1 to G7 Grado basin).
Jmse 10 00208 g003
Figure 4. Boxplot representation of seasonal variability of the measured parameters: (a) temperature (°C), (b) salinity, (c) pH, (d) DO (mg L−1), DO (%). The dashed line in (d,e) represents the limit for sensitive species of fish and invertebrates and the minimum imperative standard required by the EC Shellfish Waters Directive, respectively [59]. In this representation, the presence of outliers is shown as circles if values are 1.5 times out of the box and as stars for values which are 3 times out of the box.
Jmse 10 00208 g004
Figure 5. Spatial distribution of salinity (average of all collected data from 2013 to 2020) obtained by IDW (Inverse Distance Weighted) interpolation.
Jmse 10 00208 g005
Figure 6. Spatial distribution of DO (mg L−1) (average of all collected data from 2013 to 2020) oobtained by IDW (Inverse Distance Weighted) interpolation.
Jmse 10 00208 g006
Figure 7. Pearson linear correlations between physico-chemical variables investigated. Color intensity and the shape of the ellipsis are proportional to the correlation coefficients.
Jmse 10 00208 g007
Figure 8. Time series of intensity of solar radiation (blue) plotted vs. DO (orange) at site M5 at June and July 2019 (see Table S4 in Supplementary Materials). In both cases is reported a sketch of one week. Arrows display the delay of DO peak with respect to the maximum intensity of solar radiation.
Jmse 10 00208 g008
Table 1. Comparison of dissolved oxygen contents measured in some lagoons in the Mediterranean area. The notation n.a. means not available.
SiteDO (%)DO (mg L−1)References
Ria de Aveiro (Portugal)n.a.<1–12[8]
Fogliano Lagoon (Italy)n.a.2–11.5[32]
Ria Formosa Lagoon (Portugal)30–1401.9–10.9[35]
Korissia Lagoon (Greece)n.a.3.5–11.2[61]
Orbetello Lagoon (Italy)26.39–144 ± 44.0n.a.[64]
Orbetello Lagoon (Italy)n.a.0.2–8.65[65]
Foz de Almargem Lagoon (Portugal)69.88–121.85.49–12.65[66]
Orbetello Lagoon (Italy)20.10 ± 9.30/89.60 ± 9.00 (mean ± s.d)n.a.[67]
Varano Lagoon (Italy)77.46 ± 4.40/95.48 ± 6.39 (mean ± s.d)n.a.[67]
Venice Lagoon (Italy)112±34.5/133 ± 36.6 (mean ± s.d)n.a.[68]
Akgöl Lagoon (Turkey)n.a.7.5–8.2 (mean)[69]
Berre Lagoon (France)40–100n.a.[70]
Marano and Grado Lagoon (Italy)<5–155<0.5–17.99This work
Table 2. Classification of investigated sites on the basis of salinity DO mixing curves proposed by Best et al. [59].
Site<2 mg L−1<5 mg L−15%ileSalinityClassification
M1354645.612.6Good
M238554.721.5Good
M331486.18.9Good
M425044.517.7Moderate
M5217634.113.6Moderate
M61617214.217.9Moderate
M7408474.69.4Moderate
M811515.717.8Good
M964575.228.5Good
M1014112954.128.0Moderate
M114418594.313.0Moderate
G119530573.228.4Moderate
G2154531970.126.5Bad
G326525.031.3Good
G4145183.829.4Moderate
G55044313.825.8Moderate
G6313864.531.5Moderate
G7151069191.130.4Bad
Table 3. Classification of the Marano and Grado Lagoon water bodies sensu WFD (2017–2019). The notation n.c. means not classified.
Water BodyPhytoplanktonMacrophyteBenthosFish FaunaNutrientsChemicalDO
TEU 1GoodHighGoodGoodModeratePoorn.c.
TEU 2HighHighModerateHighModerateGoodn.c.
TEU 3HighHighGoodHighModeratePoorn.c.
TEU 4HighHighModerateGoodModerateGoodGood
TPO 1GoodModerateGoodGoodModerateGoodn.c.
TPO 2HighGoodGoodGoodModerateGoodGood
TPO 3GoodModerateHighGoodModerateGoodModerate
TPO 4GoodModerateGoodHighModeratePoorn.c.
TPO 5GoodPoorGoodGoodModeratePoorGood
TME 1GoodPoorGoodGoodGoodPoorn.c.
TME 2ModeratePoorModerateModerateModerateGoodn.c.
TME 3GoodPoorGoodModerateModerateGoodModerate
TME 4GoodPoorGoodModerateModeratePoorGood
FM 1GoodPoorModeraten.c.GoodGoodn.c.
FM 2HighHighModerateModerateGoodPoorn.c.
FM 3HighGoodGoodModerateGoodPoorModerate
FM 4HighHighPoorHighModeratePoorn.c.
Publisher’s Note: MDPI stays neutral with regard to jurisdictional claims in published maps and institutional affiliations.

