Abstract
The buried depth of submarine cables is very important to avoid damage on the cable from dropping and dragging anchors. This study focused on the actual engineering needs of submarine power cable protection and laying construction. In order to investigate the buried depth protection index of submarine cable, physical model tests, theory analysis, and numerical simulations were conducted in this study. The effects of the bottoming velocity, dropping energy, and anchor mass on the anchor penetration depth were analyzed and investigated. The analytical model based on the impact and drag mechanism is presented to analyze the forces and energy on the anchor. The accuracy and reliable of the model test results are verified by the theory analysis and numerical simulation, indicating that the buried depth protection index of the submarine cable in the research area is recommended to be 3 m. The research results can provide guidance for operation of the submarine cable laying machine and submarine cable protection.
1. Introduction
As the main transportation channel of hydrocarbons, submarine pipelines and cables play an important role in offshore oil and gas resources exploitation and operation [1]. However, the pipeline and cable are often exposed to greater risk of impact from fishing and anchors with more and more maritime activities [2]. Since the first cable was laid in 1850, the main contributor to submarine cable damages is human activity, as most of the cable failures are caused by anchors [3]. The protection methods of submarine cables mainly include enclosure protection and embedding protection. Submarine cables in shallow water are buried to a certain depth through the cable laying machine, which can effectively prevent the damage of anchoring and fishing, and prolong the service life of the submarine cable [4].
Recent research related to penetration depth of ship anchors are summarized as follows: DNV-RP-F107 (A standard published by Det Norske Veritas) Risk Assessment of Pipeline Protection proposed an empirical formula to predict the anchor penetration depth in clay and sand [5]. Luger and Harkes conducted field tests to investigate the penetration depth during the drop process in sandy seabed [6]. The physical and numerical simulations also have been performed to study the drag process of the anchor. Grabe et al. performed large deformation finite-element (LDFE) analyses to investigate the anchor drag process in sand and clay, in which the effects of anchor size, dragging speed, soil density, drained condition, and undrained strength were discussed [7,8]. Kim et al. also adopted the LDFE method to analyze the behavior of a torpedo anchor in two-layered non-homogeneous clay sediments, and proposed a total energy-based method to assess the anchor penetration depth in two-layered fine-grained sediments [9,10]. Wang et al. investigated the penetration depth of a free-falling torpedo anchor in cohesive soil, and proposed a formula to calculate the penetration depth of the anchor based on energy conservation principle and experimental measurements [11]. Liu et al. proposed a numerical framework to predict the penetration depth of gravity installed anchors based on coupled Eulerian-Lagrangian (CEL) approach and field tests [12]. Gao et al. experimentally, numerically and theoretically analyzed the anchor penetration process and proposed a method to predict the penetration depth of dropped anchor, based on finite element method (FEM) and coupled Eulerian-Lagrangian (CEL) method [13]. Wang et al. conducted experimentally investigation of the penetration depth of the torpedo anchor in two-layered soil bed. An empirical formula to predict the penetration depth of torpedo anchor in two-layered soil bed was proposed based on the energy analysis and 177 experimental data [14]. Du et al. studied the penetration depth of Hall anchor and AC-14 anchor under sand soil, and the ultimate bearing capacity and the energy algorithm were adopted to establish the theoretical algorithm of anchor dropping depth, and the feasibility of the calculation model was demonstrated by experimental research [15].
At present, there is no unified standard for the determination of burial depth of submarine cable, which is only based on operation experience or general definition. Due to the different influence of geological conditions on submarine cables in various sea areas, these regulations are not generally applicable and cannot be directly applied to the laying of submarine cables in specific area [16]. According to the actual engineering needs of submarine power cable laying construction in Zhoushan Islands (Zhejiang province, China), the penetration depth of the anchor in different weight and velocity are numerically and theoretically analyzed. The theoretical and numerical simulation analysis are then verified by model tests, which can provide guidance for operation of submarine cable laying machine and submarine cable protection.
2. The Damage Mechanism of Anchoring to Submarine Cable
As shown in Figure 1, there are two types of anchor damage on submarine cables: impact and drag damages. If a submarine cable is located below the anchor point when a ship is anchoring, then the anchor may directly hit the pipeline while penetrating the seabed. Occasionally, the mooring point may be located near a submarine cable, so that the anchor is likely to hit the cable when it is dragged.
Figure 1.
The impact and drag damage on submarine cables. (a) Impact damage on submarine cable; (b) Drag damage on submarine cable.
2.1. Impact Damage Analysis
2.1.1. Analysis of the Dropping Velocity of an Anchor
From practical experience, an anchor falling in the water will be subjected to gravity, the buoyancy and resistance of water, anchor chain tension, and water flow. Among these factors, gravity, buoyancy, and resistance of water are the major forces subjected by the anchor, as show in Figure 2.
Figure 2.
(a) The forces acting on the anchor when dropping in the water, and (b) the maximum dropping velocity of the anchor.
In the initial stage, the gravity of the anchor is greater than the resistance of water; the mechanical equation of the dropping process can be expressed as:
where is the gravity of the anchor, is the buoyancy, and is resistance of water. The Equation (1) can be obtained as:
where is the anchor’s mass, is the acceleration of gravity, is water’s density, is anchor’s volume, is the projected area of the anchor in the direction of force, is anchor’s velocity, and is drag coefficient, which is related to the geometric characteristics of the anchor. For ship anchors, the general drag coefficient is 1. The acceleration of the anchor can be expressed as:
where is the dropping height. Assuming that , the initial velocity of the anchor in water is: , which can be expressed as:
Substituting the Equations (3) and (4), and solving the differential equations, the following can be obtained:
When the resistance of water is great enough to be equal to gravity, the maximum dropping velocity of an anchor in seawater can be obtained [5]:
where is the maximum dropping velocity.
The measured data of a set of anchor bottoming velocity are compiled based on foreign literature on anchoring experiments [17]. Equation (6) is used to calculate the velocity of the anchor under the same conditions. The two values are relatively close, with an error of less than 20%. Moreover, the calculated data is larger than the measured data, which is safer for the case of calculating the penetration depth to determine the buried depth of the submarine cable. Therefore, the anchor bottoming velocity method used in this study is reasonable. The detailed data is shown in Table 1.
Table 1.
The comparison of the bottoming velocity of the measured data and the calculated data.
2.1.2. Analysis the Impact Energy of an Anchor
When the anchor hits the submarine cable, in addition to its own energy, the energy carried by the surrounding water is included, which is called hydrodynamic energy. The equivalent density method is used to consider the influence of the additional energy, and the additional hydrodynamic energy is added to the dropping anchor in the form of density [18]. The equivalent density can be expressed as:
where is equivalent density of dropping anchor, and is added mass coefficient, which is related to the geometric characteristics of the anchor. For ship anchors, the general drag coefficient is 0.6 [18,19]. The equivalent mass is:
The energy of the anchor hitting the seabed is:
Substituting Equations (8) and (9), the following can be obtained:
After the anchor hits the seabed, it is mainly subjected to gravity and the resistance of the soil. Therefore, the balance equation of the anchor determined can be expressed as:
where is the resistance of the soil in the depth of z.
When the seabed is sand, the soil resistance is:
where is effective unit weight, is the width of anchor crown, is horizontal projection area, and are the bearing capacity factors, and is overburden pressure, which can be expressed as:
where is soil density.
When the seabed is clay, the soil resistance is:
where is the undrained shear strength at the surface of the seabed, the rate of change of untrained shear strength with respect to depth, and is the bearing capacity factor.
When the anchor penetrates the seabed, the seabed soil absorbs part of the kinetic energy, and the amount of absorbed energy can be expressed as [20]:
The anchor with sharp edges, and with rounded edges are expressed in Equations (15) and (16), respectively, where is effective unit weight, is the length of penetrating side, is the penetration depth, is the shape factor, which is 0.6, and is the capacity of the soil, which can be expressed as:
where is effective friction angle.
After the anchor passes through the water and soil, the impact energy of the anchor can be expressed as:
When is equal to zero, the penetration depth of the anchor can be calculated as:
where is anchor ‘s mass, is anchor’s density, is water’s density, is added mass coefficient, is drag coefficient, which is related to the geometric characteristics of the anchor, is effective unit weight, is the shape factor, which is 0.6, and is the capacity of the soil.
2.2. Drag Damage Analysis
The force acting on the ship when anchored is shown in Figure 3. The ship is subjected to wind and waves, and produces periodic yawing, so that the anchor chain is subjected to both the fixed and periodic tension. At the same time, the anchor chain produces a restraining force on the ship, which will be transmitted to anchor rod ‘A’. At anchor point B, the anchor chain tension is divided into horizontal tension to resist external forces and vertical tension to fix the ship. When the horizontal tension is greater than the force of the anchor and the anchor chain, the anchor will be dragged and even taken away.
Figure 3.
(a) The force acting on the ship and anchor when anchored. (b) The wind and hydrodynamic forces on the ship.
2.2.1. Drag Force
The wind and hydrodynamic forces on the ship are shown in Figure 3, the transverse components of wind and hydrodynamic forces are perpendicular to the direction of ship, which can cancel each other, and the longitudinal components are parallel to the direction of ship, which can be expressed as:
where is the horizontal force, is wind pressure angle, is hydrodynamic angle, and and are hydrodynamic force and wind force, which can be respectively expressed as:
where is seawater density, is air density, is the velocity of the wind relative to the anchored ship, is the velocity of the water relative to the anchored ship, is the waterline length, is the area in the waterline, is the lateral area, is the wind angle, is the draught depth, is hydrodynamic coefficient, and is wind coefficient. According to the actual engineering environment, the typical conditions in Zhoushan Island is selected, as shown in Table 2.
Table 2.
The parameters of wind, water and ship [21,22].
Substituting the parameters into Equations (21) and (22), respectively, the hydrodynamic force and wind force can be obtained:
Therefore, the horizontal force is:
The drag force of the ship is roughly equal to the horizontal force, which can be obtained as [23]:
where is the drag force. The maximum allowable tension of submarine cable is:
where is maximum allowable tension, is the cross-sectional area of a single wire, is the tension of the armoring wire, is the number of armored wires, and is the factor of safety. According to the actual engineering environment in Zhoushan Island, the parameters of the submarine cable are shown in Table 3.
Table 3.
The parameters of the submarine cable.
Substituting the parameters into Equation (27), the maximum allowable tension of the submarine cable is: . The drag force is much larger than the maximum allowable tension of the submarine cable; therefore, it is necessary to protect the submarine cable from dragging damage.
2.2.2. Penetration Depth of Anchor Dragging
The force of the anchor when it is dragging is shown in Figure 4, which mainly includes the gravity (G), the drag force (F), and the force of the soil on the anchor. The force of the soil on the anchor can be subdivided into the supporting force (N), thrust of the anchor claw (F1), and the thrust of the anchor crown (F2).
Figure 4.
The drag force of the anchor in different states. (a) Force analysis of anchor dragging, (b) the anchor claw is submerged in the soil, and (c) the anchor crown is submerged in the soil.
The maximum penetration depth of anchor dragging can be considered only to be related to the sum of the length of the anchor claw and the height of the anchor crown, and the maximum open angle of the anchor claw [24]. The state of the anchor after anchoring and dragging on the seabed is shown in Figure 4b,c.
The length of the open angle of the Hall anchor claw is set as and , and the thickness of the anchor crown is ; therefore, the penetration depth () can be obtained as:
- (1)
- The anchor claw is fully inserted into the soil: .
- (2)
- The anchor crown is fully inserted into the soil:
2.3. Comparison of the Impact Damage and Drag Damage on Submarine Cable
In actual anchoring engineering, the drag process occurs after anchor penetration process is completed. The following situations exist in analyzing the penetration depth of dragging: (1) if the drag force is greater than other external forces (e.g., wind, water flow, etc.) of the ship, the penetration depth in the dropping process is the maximum depth of penetration; (2) if the drag force is smaller than other external forces (e.g., wind, water flow, etc.) of the ship, the anchor will be dragged. In the latter case, increasing the length of the chain or embedding the anchor in a deeper seabed can increase the drag force, and the maximum depth of penetration is the maximum depth after the anchor is dragged.
To ensure the submarine cable avoids anchor damage, the buried depth of the submarine cable should be greater than the penetration depth of the anchor in extreme conditions and the penetration depth of the anchor claw in dragging process, which can be expressed as:
where is the safe buried depth of the submarine cable, is the penetration depth in extreme conditions, and is the penetration depth of the anchor claw in dragging process.
The penetration depth of the anchor was studied, and the maximum penetration depth of a 2100 kg anchor in the process of dragging and impacting is 1.13 m (Section 2.2.2) and 2.88 m (Equation (19)), respectively. Therefore, the impact damage of the anchor needs to be further studied in the following section.
3. Numerical Simulation Analysis
3.1. Finite Element Method
The commercial software LS-DYNA is adopted to simulate the dynamic penetration process of anchor impacting in seabed. LS-DYNA is a nonlinear dynamic program with powerful contact analysis functions and high solution accuracy. The mechanism of the impact between anchor and seabed is complicated; in order to calculate the maximum penetration depth of the anchor, and to provide guidance for the buried depth protection of submarine cables, the simulation analysis in this paper is based on the following assumptions: (1) the anchor is very hard and will not deform when it hits the seabed; (2) the anchor does not rotate during dropping; (3) the impact energy is instantly transferred to the seabed, and most of the energy is absorbed by the deformation pits of the seabed soil; and (4) the anchor reaches the maximum velocity when hitting the seabed.
Explicit dynamic analysis was used to carry out the numerical simulation of the anchor penetrating the soil, the soil model (Part 1) is established by the constitutive model of soil MAT47 in the LS-DYNA preprocessor, and the three-dimensional model of the anchor (Part 2) is established through Solidworks. The two parts are set in the surface-to-surface contact, and a grid (element) consists of eight nodes. The penetration process of the Hall anchor in the seabed is studied, and the most important part is the bottom of the anchor. Therefore, the bottom of the Hall anchor should be close to the real anchor, and the anchor claw and rod should be simplified, as shown in Table 4. The simplified geometric model of the Hall anchor and the finite element model is shown in Figure 5, and the seabed in Zhoushan sea area is mainly sandy clay, the parameters are listed in Table 5 [25,26,27]. In the Option module in LS-DYNA, three different velocities are set for the anchor (Part 1) to study the penetration depth of the anchor.
Table 4.
The specifications of Hall anchor.
Figure 5.
The simplified geometric model and the finite element model of the Hall anchor. (a) The simplified geometric model of the Hall anchor, and (b) The finite element model.
Table 5.
The parameters of the sandy clay in Zhoushan Island.
3.2. Simulation Results
The penetration depth of the anchor with different mass and dropping velocity is analyzed. Different anchor masses (100 kg, 500 kg, 1020 kg, and 2100 kg) were dropped at the same velocity (4 m/s), and the 2100 kg anchor was dropped at different velocities (3.5 m/s, 4.5 m/s, and 5.81 m/s). The penetrating process of the anchor in the soil in the numerical analysis is shown in Figure 6. When the anchor hits the seabed, the soil is squeezed and quickly drained around, forming a bulge, As the anchor falls further, the uplifted soil fell back into the pit.
Figure 6.
Numerical analysis of the penetrating process of the anchor in the soil.
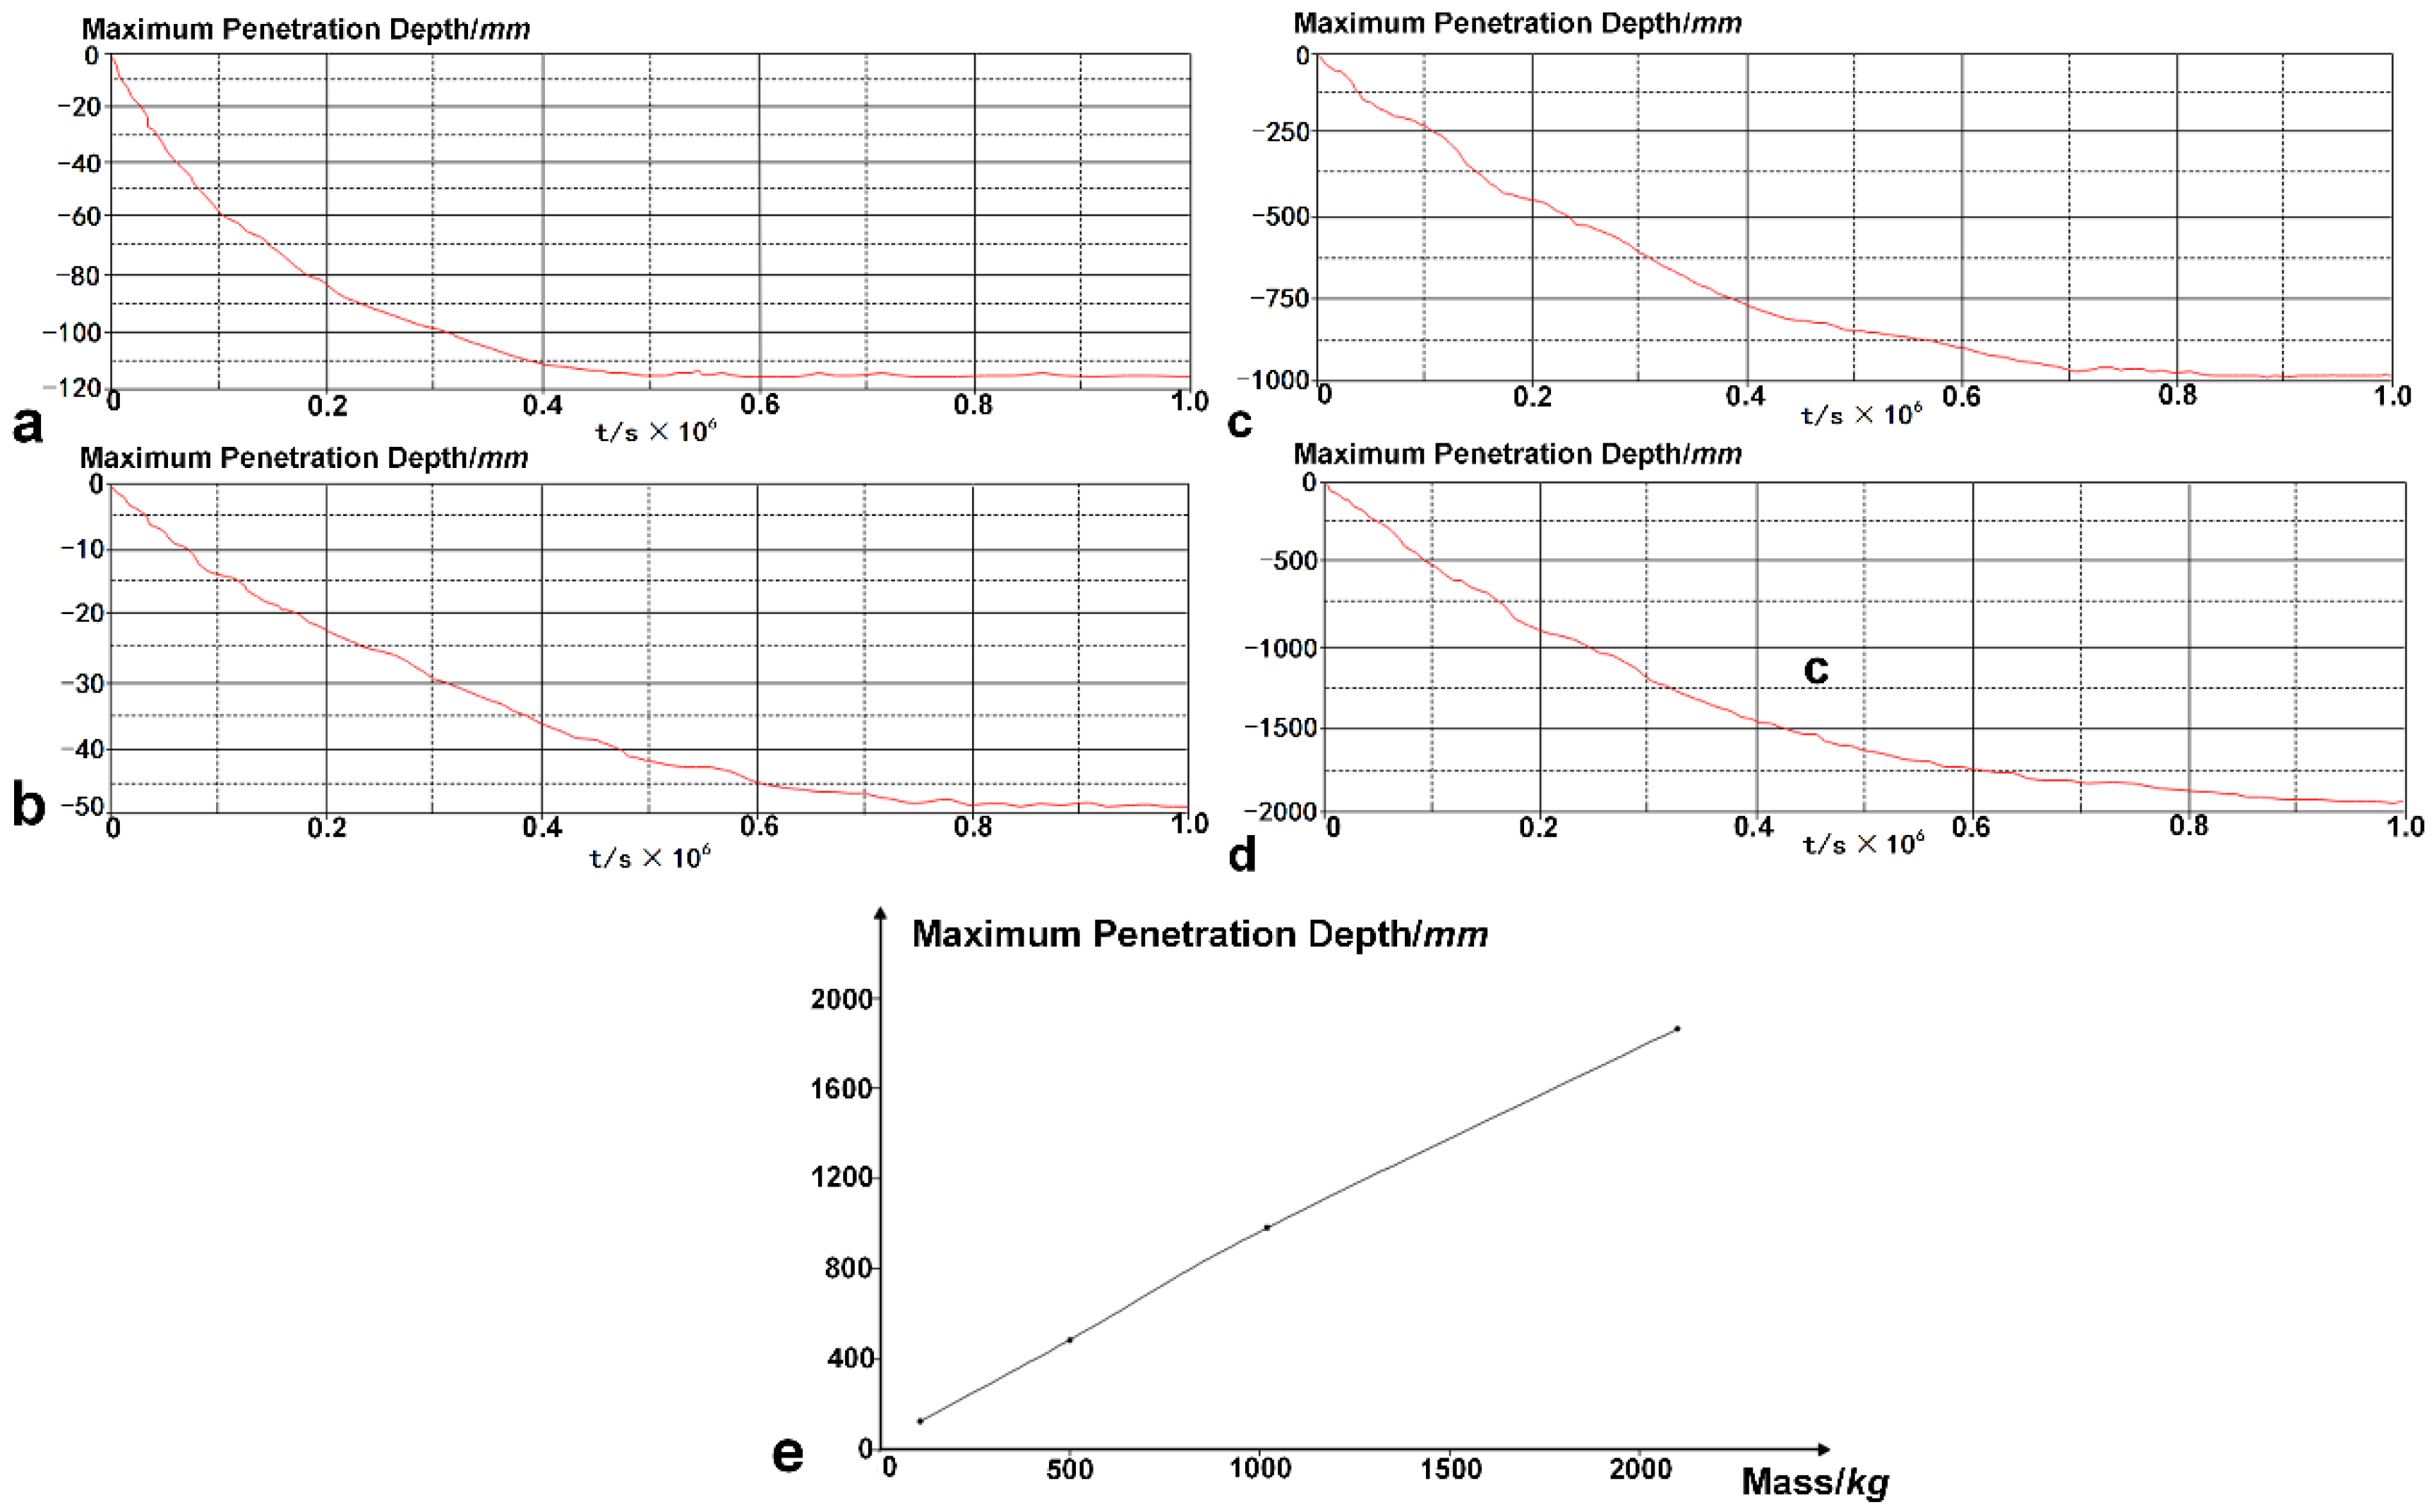
3.2.1. Influence of Anchor Weight on The Penetration Depth of the Anchor
According to Figure 2, the limit dropping velocity of different weights of anchors are different; in order to ensure the comparison of model test, a specific dropping velocity is selected for numerical simulation within the range of the dropping velocity. The maximum penetration depths of different anchor weights in this simulation case are shown in Table 6.
Table 6.
The maximum penetration depths of different anchor weights.
As shown in Figure 7, the dropping depth of the anchor will increase significantly as the anchor weight increases, which is due to the impact energy being directly affected by the anchor weight. The relationship between the maximum penetration depth and the anchor weight is linear relation, as shown in Figure 7.
Figure 7.
The maximum penetration depths of different anchor weights. (a) Case F1-1; (b) Case F1-2; (c) Case F1-3; (d) Case F1-4. (e) The relationship between the maximum penetration depth and the anchor weight.
3.2.2. Influence of Bottoming Velocity on the Penetration Depth of the Anchor
The penetration depth of the 2100 kg anchor with different bottoming velocities is analyzed, and the maximum bottoming velocity of 2100 kg anchor is 5.812 m/s (Section 2.1.1). The maximum penetration depths with different bottoming velocities is shown in Table 7.
Table 7.
The maximum penetration depths with different bottoming velocities.
The maximum penetration depths of the 2100 kg anchor with different bottoming velocities is shown in Figure 8. The dropping velocity is near zero after 1 s, and the dropping velocity reaches a negative value until 2 s, which can be understood that there will be a small rebound after the seabed soil is compressed. The rebound velocity (about 0.1 m/s) of the anchor can be ignored due to the long simulation time, and the penetration depth can be guaranteed to reach a stable state. The relationship between the maximum penetration depth and the bottoming velocity is linear, as shown in Figure 8.
Figure 8.
The maximum penetration depths of different bottoming velocities. (a) Case F2-1; (b) Case F2-2; (c) Case F2-3; (d) The relationship between the maximum penetration depth and the bottoming velocity.
4. Experiment and Results
The original model test is difficult to perform due to the long model test period. Therefore, from the perspective of convenience and the principle of similarity, the original model test is scaled down, and the similar model is studied and analyzed [28]. In order to make the test model similar to the original model, both the geometric and dynamic parameters must be similar. Considering that the force subjected by the soil is mainly gravity, the anchor depends on the kinetic energy and gravitational potential energy to penetrate into the seabed soil, and the anchor weight plays a major role. The Froude similarity criterion is used for the design of the test model, and the Froude number is expressed as [29]:
where is flow velocity and is water depth.
The test model and the original model are required to have the same Froude number in Froude similarity criterion, which can be expressed as:
where and are the physical parameters in the test model and the original model, respectively. The Similarity relationship of the test model and the original model under Froude criterion is shown in Table 8.
Table 8.
Similarity relationship of the test model and the original model under the Froude criterion.
In order to compare the test results, the geometric scale of this model test is . The physical parameters of the test model and the original model are shown in Table 9.
Table 9.
Physical parameters of the test model and the original model.
4.1. Design of Experiment Platform
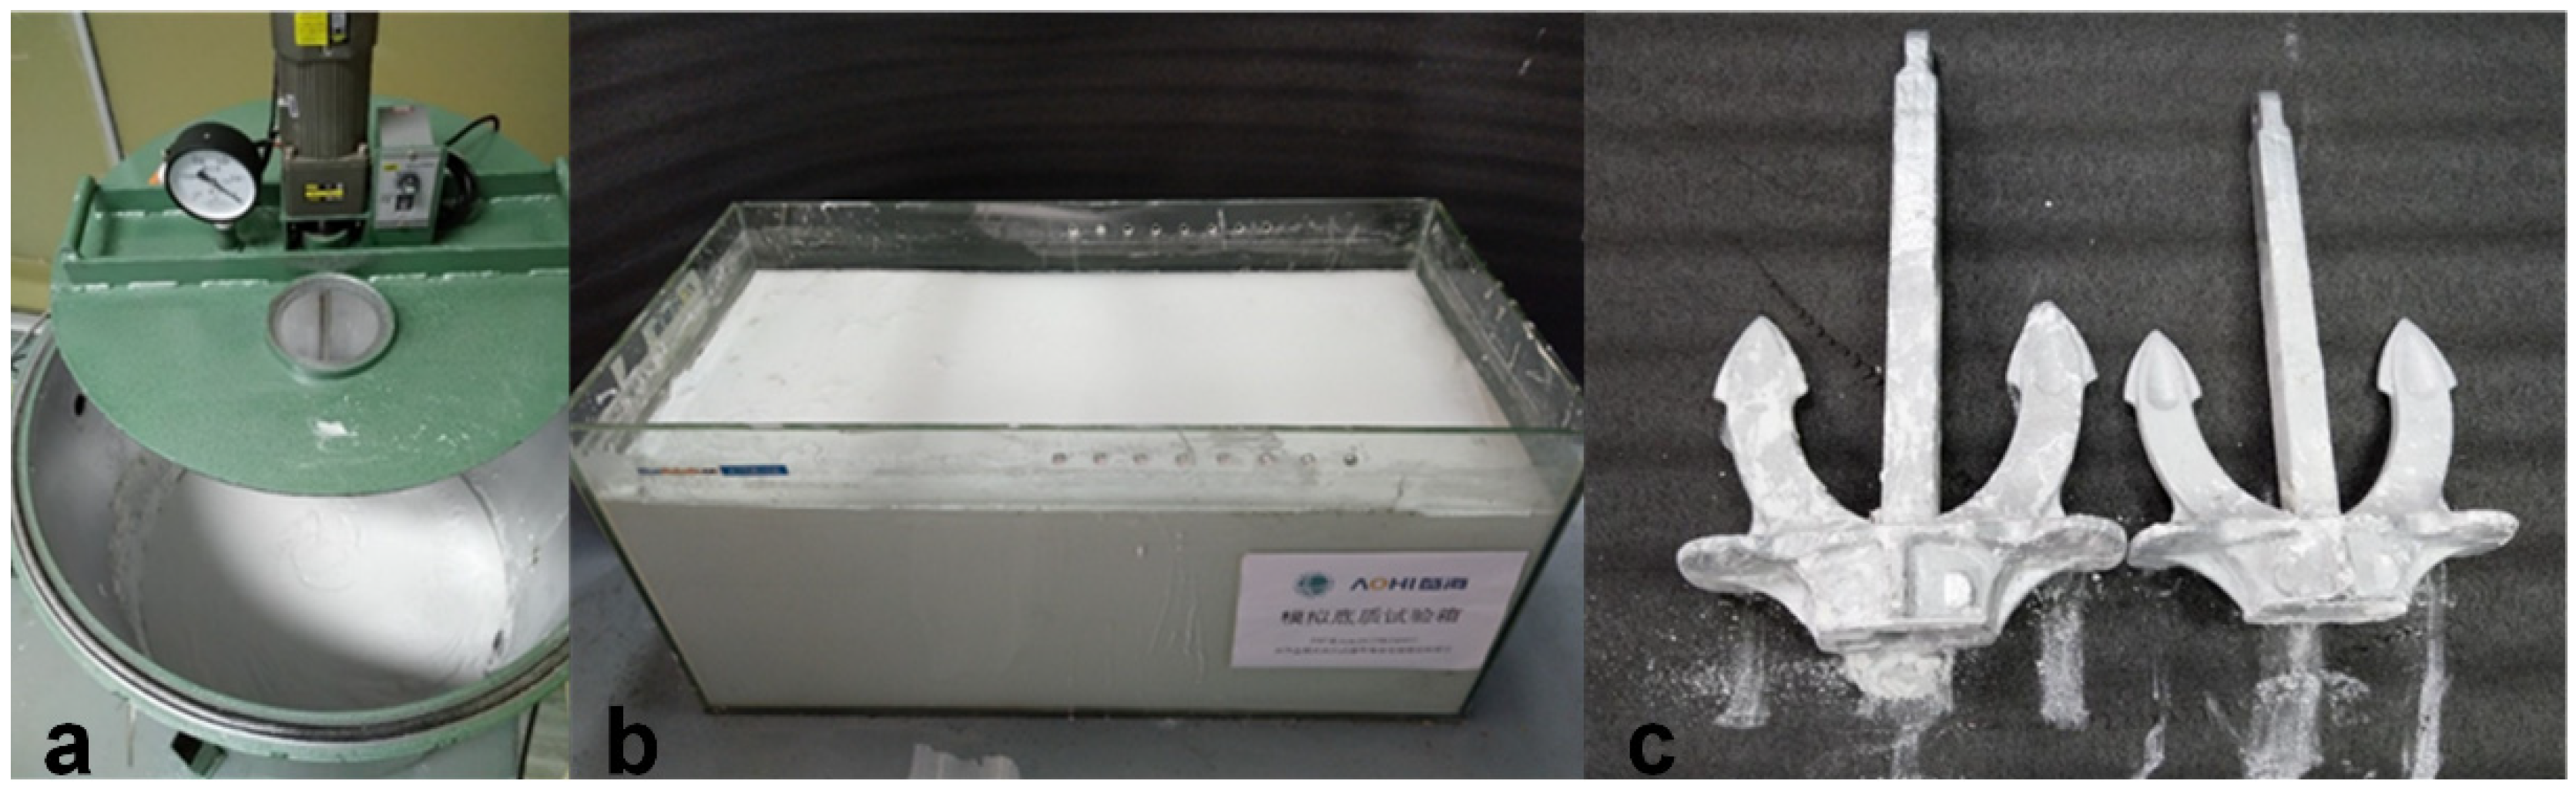
4.1.1. Soil and Anchor Model
- (1)
- Soil preparation
The penetration depth of the anchor is affected by the soil; in order to get accurate test data, the proper soil must be chosen. Speswhite kaolin clay, which has good plasticity and strong bonding, was used to simulate the seabed soil in this test. The characteristics of the Kaolin clay are shown in Table 10.
Table 10.
The characteristics of the Kaolin clay.
Firstly, the Kaolin clay and water are mixed in certain proportions, and then put it into the vacuum stirring blender for 5 h. During this process, the air pressure is kept at 70 kPa to ensure the gas in the soil is completely discharged [30], as shown in Figure 9. The geotechnical test is carried out to determine whether the prepared soil meets the test requirements. The strain controlled direct shear apparatus is applied in the test to measure the shear strength of the prepared soil, and continuously change the proportion of kaolin and water until the shear strength of which was about 4.6 kPa.
Figure 9.
(a) The soil in vacuum stirring blender, (b) prepared soil in tank, and (c) model Hall anchor.
- (2)
- Model anchor
The model anchor was made of iron and the anchor surface was electroplated with a layer of chromium to prevent rusting, as shown in Figure 9. The model anchor was a replica of a full-scale Hall anchor, which weighs 1440 kg and 2100 kg. The scale ratio in model tests is ; hence, the model anchor is 5.1 kg and 7.5 kg, respectively. As shown in Figure 4, the primary dimensions of the Hall anchor are listed in Table 11.
Table 11.
The specifications of Hall anchor.
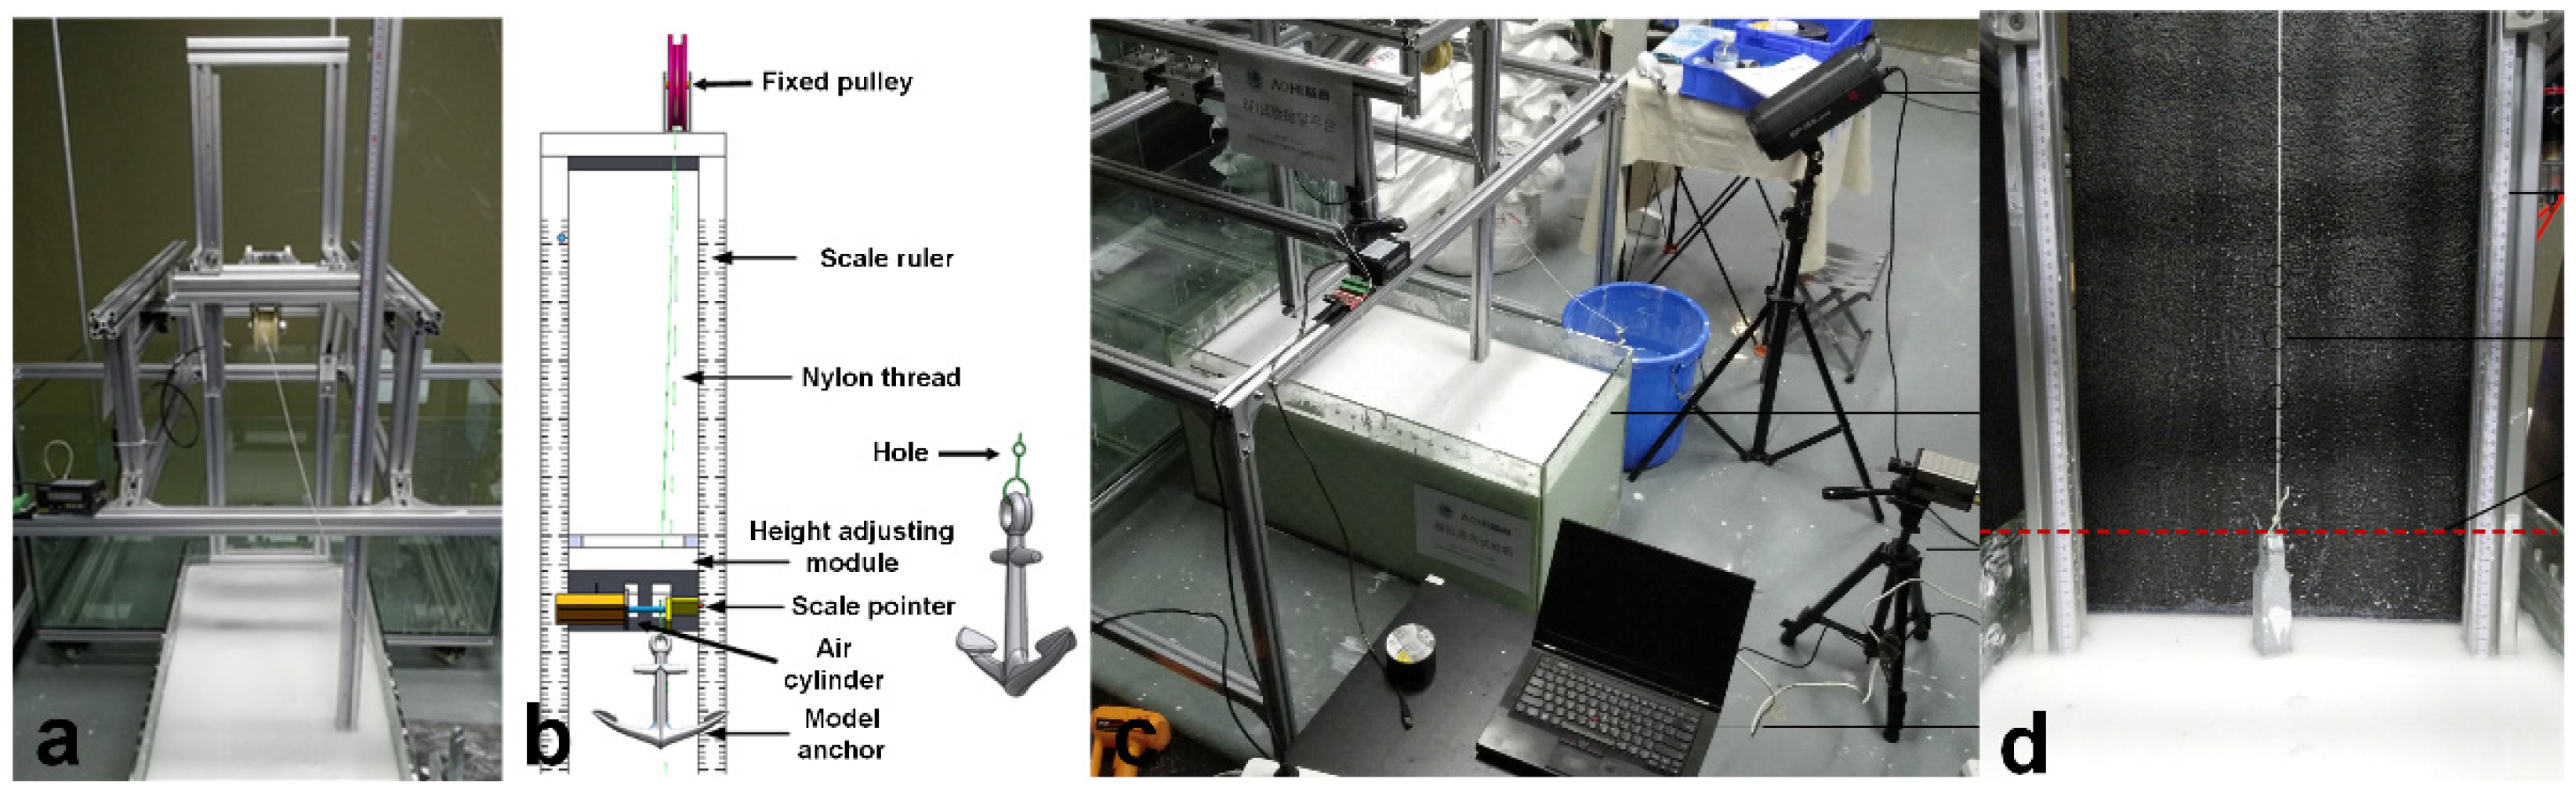
4.1.2. Experiment Platform
The experiment platform consists of a height-adjustable anchoring platform, soil tank, high-speed image acquisition system, and depth measurement module, as shown in Figure 10. The height-adjustable anchoring platform is mainly composed of a height-adjustable module, a cable recovery module and a sliding rail module. The bottoming velocity of the anchor is controlled by the dropping height of the model anchor.
Figure 10.
(a) The experiment platform, (b) height-adjustable anchoring platform, (c) high-speed image acquisition system, and (d) depth measurement module.
The high-speed camera (AOS X-xtreme) is used to collect image data to measure the relationship of the time and space information of the anchor. The soil tank is a transparent glass tank made of methyl methacrylate, the wall of which can be used as observation window. In the vicinity of the wall of the tank, the high-speed camera is used to capture the dropping position of the anchor at different times, as shown in Figure 10c. the capturing frequency of the camera is set to 160,000 FPS (Frames per Second). The dropping velocity can be obtained by combining the corresponding heights of the anchor in the two adjacent pictures and the capturing frequency of the camera. Since the interval time of the adjacent photos captured by high-speed camera is less than 10 μs, the calculated velocity from the images can be regarded as the instantaneous velocity of the anchor.
4.2. Experimental Cases
The penetration depth of the anchor with different weights and bottoming velocity is studied in this paper. The bottoming velocity is controlled by the dropping height of the anchor in the tests of the penetration depth versus the dropping velocity. Assuming that the anchor is only subjected by gravity when dropping, and the air resistance is ignored. As shown in Table 12, a total of nine model tests were performed to investigate the effects of bottoming velocity and anchor weights on the anchor penetration depth. Each model test is repeated three times.
Table 12.
Model test details.
4.3. Experimental Results
Take the case P1-4 as an example to analyze the kinematics characteristics of the anchor during the dropping process. Figure 11 shows the photos of the anchor at different falling positions captured by the high-speed camera. The soil is splashed around in Figure 11b,c, indicating that the surface soil gets a higher impact energy and speed when the anchor is penetrating, and the surface soil is quickly squeezed out.
Figure 11.
The different falling positions of the anchor in case F1-4. (a) The anchor is not touch the soil; (b–e) The anchor is penetrating the soil; (f) The anchor is in the maximum penetration depth.
The curves of dropping velocity versus dropping height and penetration depth are plotted based on the information collected in the images, as shown in Figure 12. Figure 12b is a part of Figure 12a, which only shows the dropping velocity versus penetration depth in the soil. As shown in Figure 12b, A turning point exists when the anchor impacting the soil, which is caused by the following two reasons: (1) the impact energy is absorbed by the soil when the anchor hits the soil, therefore, the acceleration of the anchor will significantly decrease; and (2) the resistance of the soil increases due to the increase in contact area when the anchor touching the soil, which will also change the acceleration of the anchor.
Figure 12.
Dropping velocity versus dropping height and penetration depth. (a) The anchor dropping in the air and the soil. (b) The anchor penetrating in the soil and the turning point.
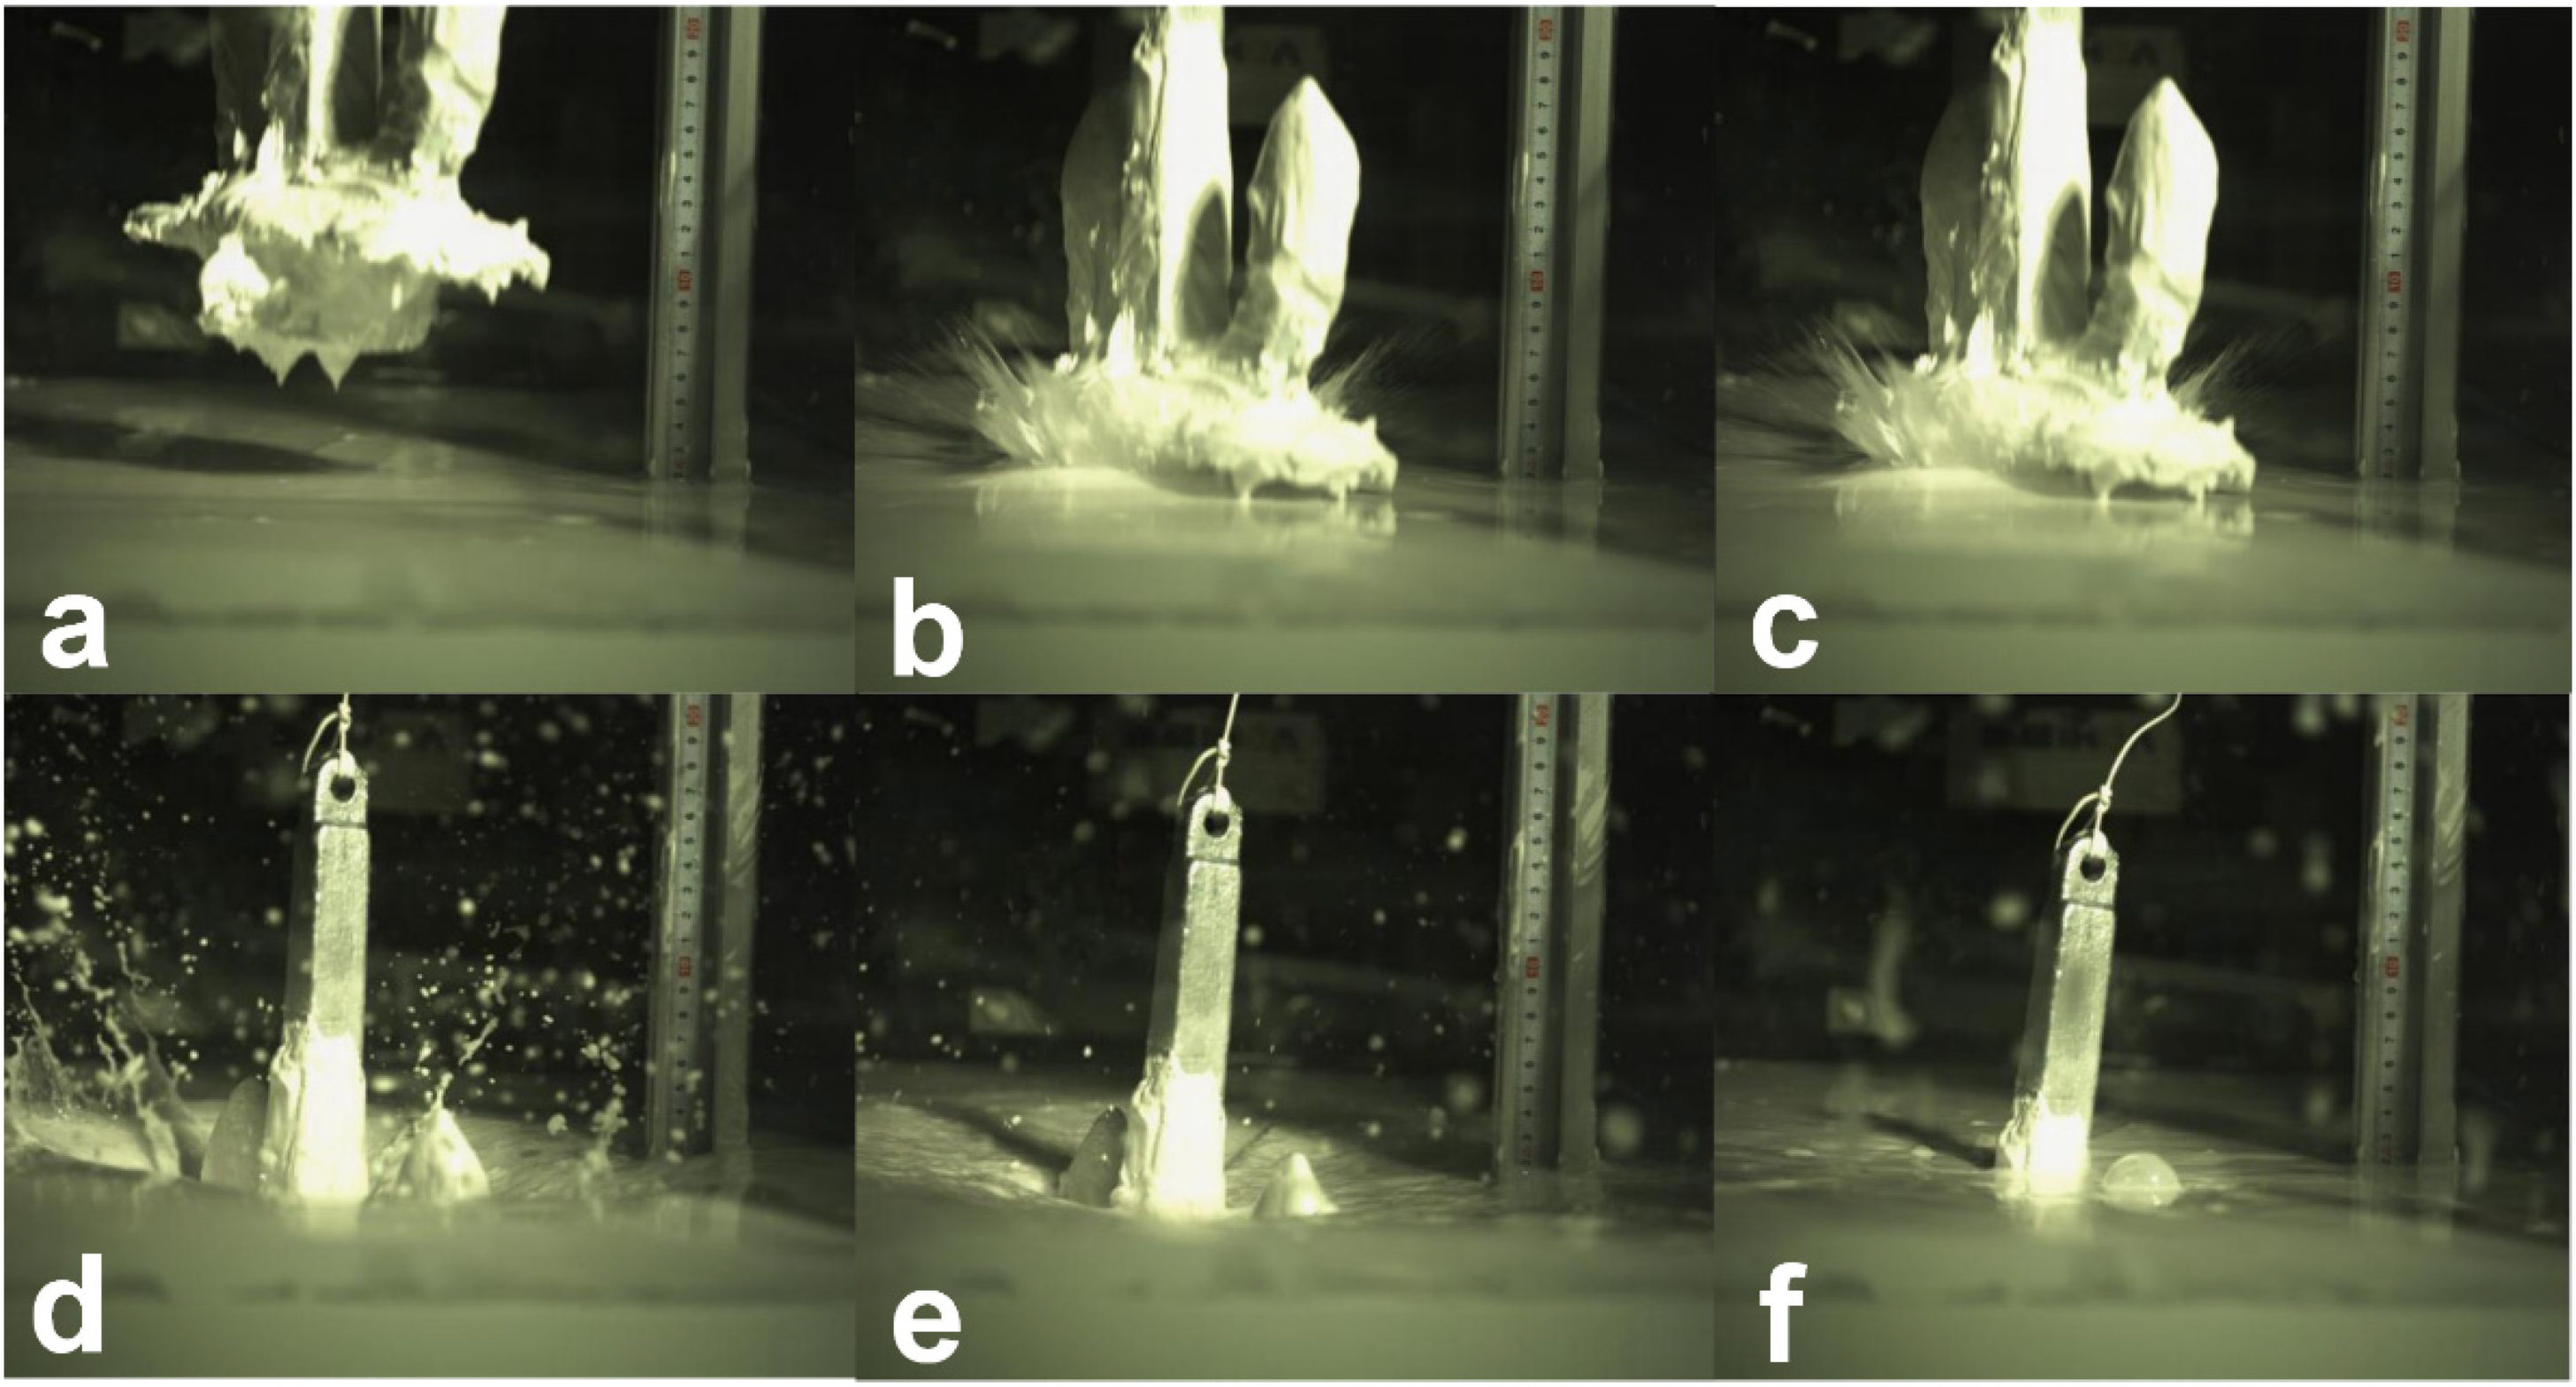
4.3.1. Static Scouring Experiment
The end of the anchor is connected to the roller, therefore, the anchor is subjected to the resistance of the roller, as shown in Figure 10. In order to eliminate the influence of the roller damping, the calculated instantaneous bottoming velocity based on the high-speed camera is used to correct the dropping height required for the corresponding dropping velocity. The modified physical parameters in the model tests are shown in Table 13.
Table 13.
The physical parameters in model tests.
The penetration depth of the anchor in the soil increases significantly as the bottoming velocity increases, because the impact energy is completely absorbed by the soil. The comparison of the penetration depth in the soil of the anchor is shown in Table 14. The penetration depth versus bottoming velocity of the anchor in the model test and simulation is shown in Figure 13.
Table 14.
Comparison of the penetration depth in the model test and numerical simulation.
Figure 13.
The penetration depth versus bottoming velocity of the anchor. (a) The results in the model test (b) The simulation results and the prototype results.
4.3.2. The Penetration Depth Versus the Anchor Weight
The impact energy depends on the dropping velocity and the weight of the anchor. As the anchor mass increases, the penetration depth in the soil increases significantly. The comparison of the penetration depth in the soil of the anchor is shown in Table 15. The penetration depth versus anchor weight and bottoming velocity in the model test and simulation is shown in Figure 14.
Table 15.
Comparison of the penetration depth in the model test and numerical simulation.
Figure 14.
The penetration depth versus bottoming velocity and anchor weight. (a) The results in the model test (b) The numerical simulation results and the prototype results.
4.3.3. Results Analysis
As shown in Figure 13 and Figure 14, the trend of the penetration depth of the anchor in the model test is similar to the numerical analysis results, and the correlation is good, which proves that the model test is correct and reliable. The penetration depth obtained by the experiment is generally smaller than the simulation results, which is caused by the following reasons: (1) due to insufficient solidarity and reinforcement of the soil, the shear strength of the soil is not uniformly distributed in pressure, and there will be a deviation in the shear strength at different depths, and the deeper soil exceeds the set value due to the consolidation and compression of the soil; (2) the shear strength of the soil with a certain depth in the surface is lower than the set value; (3) strain-rate effect is ignored in numerical analysis; and (4) the boundary effects of the soil tank affect the penetration depth of the anchor.
5. Conclusions
We focused on the actual engineering needs of submarine power cable laying construction in Zhoushan Islands (Zhejiang province, China). This paper conducted both model tests, theory and numerical simulation analysis, to investigate the buried depth protection index of a submarine cable. The accuracy and reliability of the model tests are verified by the theory analysis and numerical simulation results. The effects of the bottoming velocity, dropping energy, and anchor mass on the anchor penetration depth were analyzed and investigated. The primary conclusions are summarized in the following:
- (1)
- The parametric study from the model tests and numerical simulation indicates that the anchor penetration depth is affected by the bottom velocity, impact energy, and anchor mass.
- (2)
- The analytical model based on impact and drag mechanism, which is put forward based on Energy conservation law and Newton’s second law, can help to analyze each force subjected by the anchor when dropping and dragging in the soil.
- (3)
- The maximum penetration depth of the 2100 kg anchor in the test and the simulation analysis is 2.53 m and 2.77 m, respectively. Therefore, the buried depth protection index of the submarine cable in Zhoushan Island is recommended to be 3 m.
- (4)
- In future research, the influence of different anchors (e.g., types, size, etc.) on the penetration depth of the seabed soil should be considered, and the penetration depth of the anchor should be studied in the actual submarine cable project in Zhoushan area.
Author Contributions
X.Z. and Z.L. conceived, investigated and designed the experiments; Z.L. and S.L. performed the experiments; C.C. and Y.G. analyzed the data; P.Z. contributed analysis and visualization tools; S.L. contributed materials tools; Y.G. wrote, reviewed and edited the paper; X.Z. and J.C. managed project and provided funding. All authors have read and agreed to the published version of the manuscript.
Funding
This research received no external funding.
Institutional Review Board Statement
Not applicable.
Informed Consent Statement
Not applicable.
Data Availability Statement
The data presented in this study are available on reasonable request from the first author.
Conflicts of Interest
The authors declare no conflict of interest.
References
- Randolph, M.F.; Gaudin, C.; Gourvenec, S.M.; White, D.J.; Boylan, N.; Cassidy, M.J. Recent advances in offshore geotechnics for deep water oil and gas developments. Ocean Eng. 2011, 38, 818–834. [Google Scholar] [CrossRef] [Green Version]
- Osthoff, D.; Heins, E.; Grabe, J. Impact on submarine cables due to anchor-soil interaction. Geotechnik 2017, 40, 265–270. [Google Scholar] [CrossRef]
- Payne, E. CNN. Vandals Cut San Francisco Area Fiber Optic Lines for 11th Time in a Year. 1 July 2015. Available online: https://edition.cnn.com/2015/07/01/tech/california-fiber-optic-cable-cuts/index.html (accessed on 10 December 2021).
- Wu, A.-G.; Yuan, Z.-L.; Gong, Y.-Q. Overview of Construction Technology for Deep-buried Laying of Submarine Cables in China. Zhejiang Electr. Power 2015, 3, 57–62. [Google Scholar]
- Det Norske Veritas. DNVGL-RP-F107 Risk Assessment of Pipeline Protection. May 2017 ed. Available online: https://oilgas.standards.dnvgl.com/download/dnvgl-rp-f107-risk-assessment-of-pipeline-protection (accessed on 10 December 2021).
- Luger, D.; Harkes, M. Anchor Tests German Bight: Test Setup and Results; Project Rep., 1207052-002-GEO-0003; Deltares: Delft, The Netherlands, 2013. [Google Scholar]
- Grabe, J.; Qiu, G.; Wu, L. Numerical simulation of the penetration process of ship anchors in sand. Geotechnik 2015, 38, 36–45. [Google Scholar] [CrossRef]
- Grabe, J.; Wu, L. Coupled-Eulerian-Lagrangian simulation of the penetration and braking behaviour of ship anchors in clay. Geotechnik 2016, 39, 168–174. [Google Scholar] [CrossRef]
- Kim, Y.; Hossain, M.S.; Lee, J. Dynamic Installation of a Torpedo Anchor in Two-layered Clays. Can. Geotech. J. 2017, 55, 446–454. [Google Scholar] [CrossRef] [Green Version]
- Kim, Y.-H.; Hossain, M.S.; Wang, D.; Randolph, M.F. Numerical investigation of dynamic installation of torpedo anchors in clay. Ocean Eng. 2015, 108, 820–832. [Google Scholar] [CrossRef] [Green Version]
- Wang, W.; Wang, X.; Yu, G. Penetration depth of torpedo anchor in cohesive soil by free fall. Ocean Eng. 2016, 116, 286–294. [Google Scholar] [CrossRef]
- Liu, H.; Xu, K.; Zhao, Y. Numerical investigation on the penetration of gravity installed anchors by a coupled Eulerian–Lagrangian approach. Appl. Ocean Res. 2016, 60, 94–108. [Google Scholar] [CrossRef]
- Gao, P.; Duan, M.; Gao, Q.; Jia, X.; Huang, J. A prediction method for anchor penetration depth in clays. Ships Offshore Struct. 2016, 11, 782–789. [Google Scholar] [CrossRef]
- Wang, C.; Zhang, M.-X.; Yu, G.-L. Penetration depth of torpedo anchor in two-layered cohesive soil bed by free fall. China Ocean Eng. 2018, 32, 706–717. [Google Scholar] [CrossRef]
- Du, Y.; Chen, F.; Xu, W. Experimental study and calculation method of falling anchor depth under sand soil. South. Energy Constr. 2018, 5, 222–227. [Google Scholar]
- Zha, M.; Wang, Y.-J.; Wang, Z.-Y.; Fan, X.-M. The Burial Depth of Submarine Cable. Opt. Fiber Electr. Cable Appl. 2015, 2, 33–42. [Google Scholar]
- Wang, Y.-S. Study on the Depth of Penetration of Anchors. Master’s Thesis, Dalian Maritime University, Dalian, China, 2015. [Google Scholar]
- Wang, L.-P. Submarine Cable Mechanical Impact Structural Damage Analysis. Master’s Thesis, China University of Petroleum, Beijing, China, 2016. [Google Scholar]
- Katteland, L.H.; Oygarden, B. Risk analysis of dropped objects for deep water development. In Proceedings of the 14th International Conference on Offshore Mechanics & Arctic Engineering, Copenhagen, Denmark, 18–22 June 1995; American Society of Mechanical Engineers: New York, NY, USA, 1995; Volume 2, pp. 443–450. [Google Scholar]
- Ren, Y.-S.; Yan, S.-W.; Yan, Y.; Chen, G.; He, X.-Q. Numerical Analysis on Dragging Anchors in Soil Based on CEL. Chin. J. Undergr. Space Eng. 2017, 13, 1573–1578. [Google Scholar]
- Lei, D.; Pan, L. Application of integral hoisting technology of VindebyTunoeKnob in Zhoushan sea area. Ocean Dev. Manag. 2018, 35, 6. [Google Scholar]
- Yu, Y.H.; Liu, F.; Jiang, J.; Liu, P.; Cui, Z.M. Continuous arc-shaped laying technique for large diameter flexible pipeline in complicated sea conditions. Pet. Eng. Constr. 2018, 44, 5. [Google Scholar]
- Xuan, K. The Study on Anchoring Damage to Subsea Pipelines. Master’s Thesis, Dalian Maritime University, Dalian, China, 2012. [Google Scholar]
- Xu, W.; Wang, J.-Y.; Zheng, Z.-Y.; Li, Y.-Y. Influence of Dragging Anchor upon the Buried Depth of Submarine Cable. Ship Ocean Eng. 2018, 1, 147–150. [Google Scholar]
- Yue, X.-B. Research on Settlement Characteristics and Calculation of Immersed Tube Tunnel with Soft Foundation and High Siltation. Ph.D Thesis, Chang’an University, Xi’an, China, 2014. [Google Scholar]
- Yu, K.-B.; Yang, T.; Shan, T.-K.; Meng, Q.-J.; Li, Z.-G. Study on the Adsorption Forces of Seabed Platform on Muddy Seafloor Based on ANSYS. J. Ocean Technol. 2017, 36, 58–62. [Google Scholar]
- Wang, Z.-H.; Pan, Y.-J.; Pan, G.-F.; Chen, P.-X. Statistic analysis of physical and mechanical indices of quaternary marine sediments in the western sea area between Zhoushan and Daishan Island. Mar. Sci. Bull. 2011, 30, 557–561. [Google Scholar]
- Dai, B.-L. Research on the Jetting Arm of Jetting Propelled ROV Trencher and Its Jetting Process. Master’s Thesis, Zhejiang University, Hangzhou, China, 2016. [Google Scholar]
- Han, C.-C.; Liu, J. Model tests on the penetration depth of gravity installed plate anchors. Ocean Eng. 2016, 5, 92–100. [Google Scholar]
- Han, C.-C.; Chen, X.-J.; Liu, J. Model tests on penetration depth of hall anchor. Ocean Eng. 2018, 5, 90–98. [Google Scholar]
Publisher’s Note: MDPI stays neutral with regard to jurisdictional claims in published maps and institutional affiliations. |
© 2022 by the authors. Licensee MDPI, Basel, Switzerland. This article is an open access article distributed under the terms and conditions of the Creative Commons Attribution (CC BY) license (https://creativecommons.org/licenses/by/4.0/).