Article

Study on Distribution Law of Gas Phase and Cavitation in the Pressurization Unit of Helical Axial Flow Multiphase Pump

1
State Key Laboratory of Hydroscience and Engineering, Department of Energy and Power Engineering, Tsinghua University, Beijing 100084, China
2
Pumped-Storage Technological & Economic Research Institute State Grid Xinyuan Co., Ltd., Beijing 100161, China
3
Key Laboratory of Fluid and Power Machinery, Ministry of Education, Xihua University, Chengdu 610039, China
*
Author to whom correspondence should be addressed.
J. Mar. Sci. Eng. 2022, 10(11), 1795; https://doi.org/10.3390/jmse10111795
Submission received: 14 October 2022 / Revised: 14 November 2022 / Accepted: 17 November 2022 / Published: 21 November 2022
(This article belongs to the Special Issue CFD Simulation of Floating Offshore Structures)

Abstract

:
Due to the irregular change of gas void fraction (GVF) in multiphase pumps, the pressure distribution in the pump is often uneven, which leads to the formation of low-pressure area and thus the occurrence of cavitation. In order to study the gas phase and cavitation distribution in the impeller region of a multiphase pump under different cavitation stages and GVF conditions, this study used numerical calculations as the main method and experimental verification as a secondary method to investigate the cavitation phenomenon in the pump under different stages and GVF conditions. The results showed that at different stages, both the volume fraction and the covering area of the gas phase were reduced to a certain extent with the increase in blade height, and the distribution law of the gas phase on the blade changed with the development of the cavitation stage, especially on the blade surface. At different GVFs, cavitation first occurred at the inlet of the blade SS and then extended along the blade streamline from the inlet to outlet, with the volume fraction and distribution of cavitation gradually increasing and then extending to the blade PS. The results showed that the presence of the gas phase inhibited the development of cavitation in the multiphase pump to some extent, and the cavitation performance of the multiphase pump was better in the presence of the gas phase than in pure water conditions. The results of this study provide a theoretical basis for improving the cavitation performance of multiphase pumps.

1. Introduction

As terrestrial energy resources dwindle, people are turning to the deep-sea [1,2]. Although deep-sea energy is very abundant, it is much more difficult to exploit and transport than terrestrial energy, and it has not been exploited in large quantities so far. One of the main reasons is that deep-sea mineral resources, such as oil, natural gas, and other energy resources, may contain a variety of gases, solid particles, crude oil, and water in the transportation process, which require higher transportation equipment. Multiphase transport technology has been developed to increase the intensity and efficiency of deep-sea oil field extraction. Helico-axial multiphase pumps have received a lot of attention from scholars at home and abroad because of their advantages, such as high flow rate, small size, and insensitivity to solid particles [3,4]. For example, based on the singular method, Xiao et al. [5] proposed a design method applicable to the controllable velocity moment in a multiphase pump and gave the specific range of dimensionless controllable parameters. Liu et al. [6] applied the decomposition and reconstruction of dynamic modes to mixed transport pumps, compared and analyzed the original flow field and the decomposed and reconstructed flow field from the perspective of time and space, and established the functional relationship between the dynamic mode decomposition parameters and results. Shi et al. [7] proposed a feasible stage-by-stage design method to increase the mixed transport performance of multiphase pumps and, based on this, explored the flow pattern variation law within each level of the pump. Shi et al. [8] established a numerical calculation method to predict the performance of multiphase pump and verified its reliability through tests. The results showed that the multistage pump could effectively slow down the great decline of pump performance under the condition of low inlet gas void fraction (IGVF). Suh et al. [9] combined computational fluid dynamics with experimental verification to analyze the flow patterns in multiphase pumps with different GVFs and studied the influences of important parameters, such as the interphase force between gas and liquid phases and the diameter of bubbles, on the hydraulic performance. Deepak et al. [10] conducted three-dimensional numerical simulation of a mixed pump and found that the internal flow pattern of the multiphase changed constantly with the velocity and concentration of the gas–liquid two phases and the speed of the impeller and found that the number of blades greatly affected the performance of the pump. As indicated by Yu Y et al. [11], compared to the traditional method, the oil–gas multiphase pump adopts the production mode of conveying first and then separating, which has a lot of advantages. For example, it can save significant investment costs and operation and maintenance costs in the production process. Han et al. [12] revealed the distribution law of important parameters, such as the GVF, pressure, and gas–liquid two-phase velocity, in the impeller domain through the steady-state simulation calculation of a mixed-transport pump and then established the internal relationship between the vortex flow in the pump and energy loss.
In addition, a number of scholars have carried out in-depth research on the energy loss and internal flow characteristics of multiphase pumps. For example, Liu et al. [13] conducted an in-depth study of multiphase pumps by combining experiments and simulations to analyze the energy performance and flow field distribution in a multiphase pump at different viscosities. The results showed that at high viscosity conditions, the pump performance deteriorated as the viscosity of the transport medium increased, which was mainly reflected by a significant decrease in both the pump head and speed. Based on the combination of numerical simulation and experimental verification, Shi et al. [14] conducted relevant research on the inevitable tip leakage flow (TLV) in a multiphase pump, revealing the evolution process of TLV in the pump and the relationship between TLV swirl intensity and pressure difference. Ge et al. [15] studied the influence of different blade thickening of screw axial flow in oil–gas multiphase pumps. Sano T et al. [16] explored the different flow patterns inside a multiphase pump using high-speed photography to reveal the influence of important parameters, such as flow rate and speed, on the behavior of bubbles. Unsteady flow in the low speed region was identified from the high frequency pressure obtained from the experimental data and the pressure loading on the blades, and the mechanism was explained. Wang et al. [17] found that at different flow rates, the gas phase changed sharply near the inlet of different blade heights of the head impeller, and the flow rate had a strong influence on the distribution of the gas phase in the rear half of the blade, especially in the suction side. Zhang et al. [18] investigated the effect of different operating parameters, such as GVF and flow rate, on the pressurized performance and stability of multiphase pumps based on the numerical method of solving the Navier–Stokes equations combined with experimental validation. By adding buffer tanks to a multiphase pump, Zhang et al. [19] found that the bubble flow in the flow passage was more uniform and the accumulation of large bubbles slowed down. Shi et al. [20] conducted a quantitative analysis of the energy conversion characteristics of the impeller in a multiphase pump and revealed the energy conversion capabilities of different positions along the envelope angle in the impeller domain under the gas–liquid two-phase condition. Shi et al. [21] conducted numerical simulation and experimental verification, analyzed the cavitation phenomenon in multiphase pumps, examined the influence of GVF on the cavitation phenomenon in multiphase pumps, and found that GVF inhibited the evolution of cavitation. In order to study the gas–liquid two-flow pattern in a multiphase pump under different operating conditions, Zhang et al. [22] chose water and air as mediums to visualize a multiphase pump, and the results showed that the average diameter of the flow bubbles increased with increasing IGVF and decreased with decreasing speed. Abhay et al. [23] conducted an experimental study on axial flow pumps under different operating conditions and found that an increase in GVF reduced efficiency and head, causing the best efficiency point to move towards the low flow region. Xu Y et al. [24] designed a liquid–gas multiphase pump with better performance and verified its performance parameters experimentally, revealing the pressure characteristics of the multiphase pump under nonconstant operating conditions.
According to the above research status, the present research on multiphase pumps mainly focused on internal flow mechanism and energy conversion characteristics and was less involved with research on the cavitation performance of the multiphase pump under the gas–liquid two-phase condition. This study took a multiphase pump as the research object, and the gas phase and cavitation distribution law in the impeller of the multiphase pump were analyzed under different cavitation stages. This included the gas phase distribution law in the impeller passage at different blade heights, the evolution process of cavitation distribution, and the influence of gas phase on the volume fraction of cavitation in the impeller domain. The results of the study can provide a theoretical basis to improve the cavitation performance of multiphase pumps.

2. Introduction of the Multiphase Pump Model

As the impeller is the key part of multiphase pumps to pressurize the fluid, the cavitation phenomenon in the impeller domain was analyzed and studied in this work. The calculation model was composed of an in duct, impeller, and out duct in order to allow the inlet and outlet of the impeller to reach full flow. The inlet pipe and outlet pipe were extended to 2 times and 6 times of the axial length of the impeller, respectively [25]. Specific information on the impeller is shown in the diagrams below. Figure 1 and Figure 2 show the impeller dimensions and the calculated fluid domain of the model, respectively, and Table 1 shows the design parameters of the model. Where, D and d are diameters of impeller shroud and hub respectively.

3. Fundamental Equation

3.1. The Governing Equation

1.
The mass conservation equation
Continuity equation or the mass conservation equation in the applications of fluid flow says that control of the surface quality of the rate of outflow is equal to the loss of internal quality control body. The mass conservation theorem of differential expression is as follows:
ρ t + ρ V = 0
where ρ is the medium density in kg/m3; is the Hamilton operator; and V is the velocity in m/s.
2.
The momentum conservation equation
Momentum conservation theorem says that the ratio of the system fluid to the time rate of change of momentum is equal to the force vector. The momentum theorem of differential expression (N-S equation) is as follows:
ρ u t + ρ u V = ρ f x p x + τ x x x + τ y x y + τ z x z
ρ v t + ρ v V = ρ f y p y + τ x y x + τ y y y + τ z y z
ρ w t + ρ w V = ρ f z p z + τ x z x + τ y z y + τ z z z
where u , v , and w are circumferential, absolute, and relative velocities, respectively, in m/s; f x , f y , and f z are mass force in different directions per unit mass of fluid; p is the pressure in Pa; and τ x x , τ y x , and τ z x are shear forces in different directions.
3.
The energy conservation equation
The theorem of conservation of energy says that the unit time heat input system and environment is equal to the sum of the work done to the system control and the rate of change of time and energy in the body as controlled by the surface energy flow rate. The sum of the differential expression is as follows:
ρ T t + ρ T v i x i = λ c p 2 T x i x i + S T
where T is the thermodynamic temperature in K; λ is the power coefficient; c p is the heat capacity at constant mass pressure in J/(kg/K); and S T is the internal heat source of a fluid and the part of the fluid whose mechanical energy is converted into heat by viscosity.

3.2. The Cavitation Model

Due to the condensate gas and pressure fluctuation caused by larger turbulent influence on the evolution of cavitation [26,27], the Zwart–Gerber–Belamri (ZGB) cavitation model considers the two factors that influence cavitation evolution at the same time. This cavitation model interphase transmission rate is shown below.
When P P v :
R e = F v a p 3 α n u c 1 α v ρ v R B 2 P v P 3 ρ l
When P > P v :
R c = F c o n d 3 α v ρ v R B 2 P P v 3 ρ l
where R B is the bubble radius, equal to 10−6 m; α n u c is the volume fraction of the vapor core position, equal to 5 × 10⁻⁴; and F v a p and F c o n d are vapor evaporation and condensation coefficients, equal to 50 and 0.01, respectively.

4. Mesh Partitioning and Independent Verification

4.1. The Mesh Generation

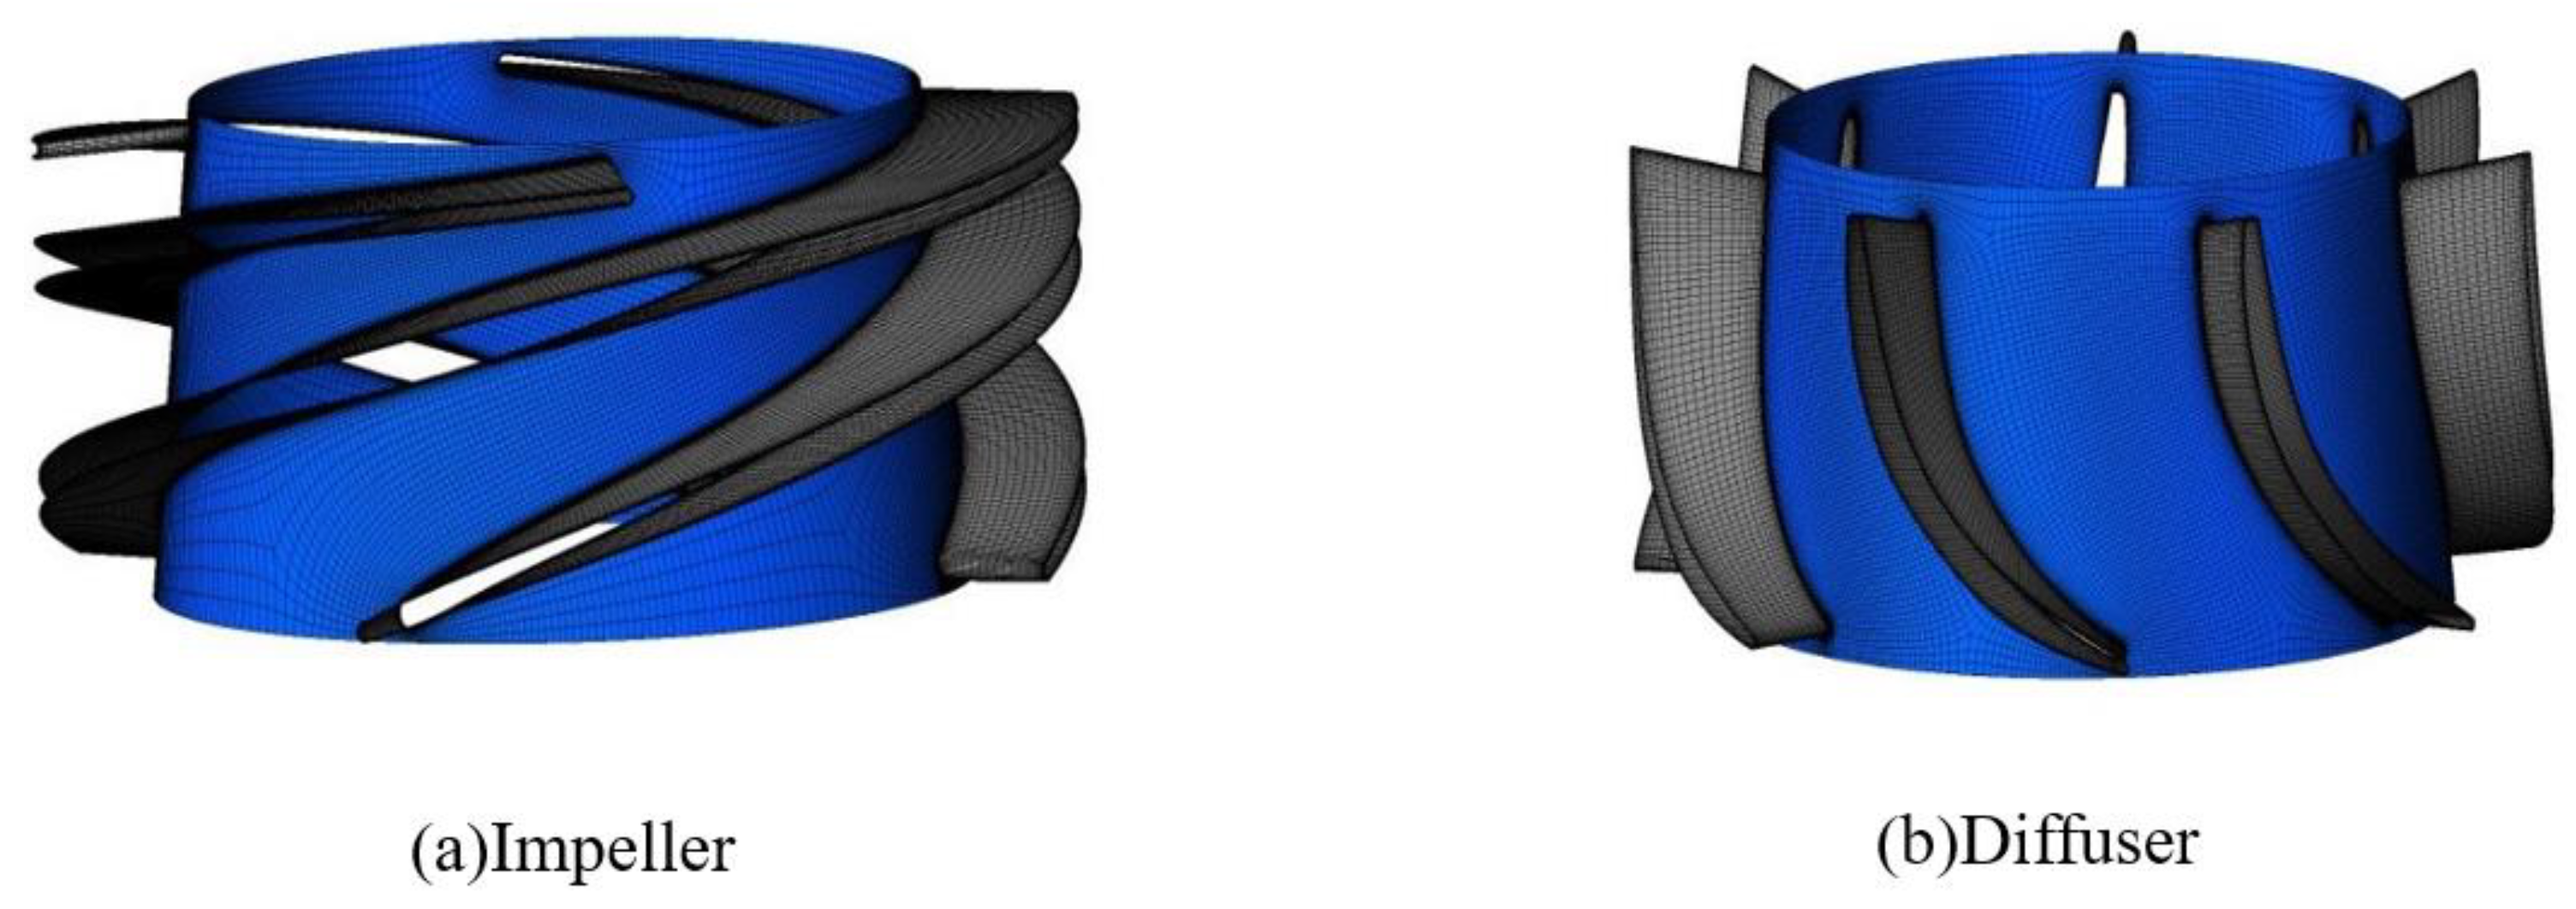
In this study, the single flow passage of the multiphase pump impeller was first divided using the hexahedral mesh method. Then, the mesh of the single passage was rotated and copied into the full channel using ICEM software, and the mesh of the inlet and outlet pipes was divided. Finally, in order to ensure the accurate capture of the flow situation, the basin grid encryption was studied. The mesh generation of the pressurization unit is shown in Figure 3.

4.2. Mesh Independence Validation

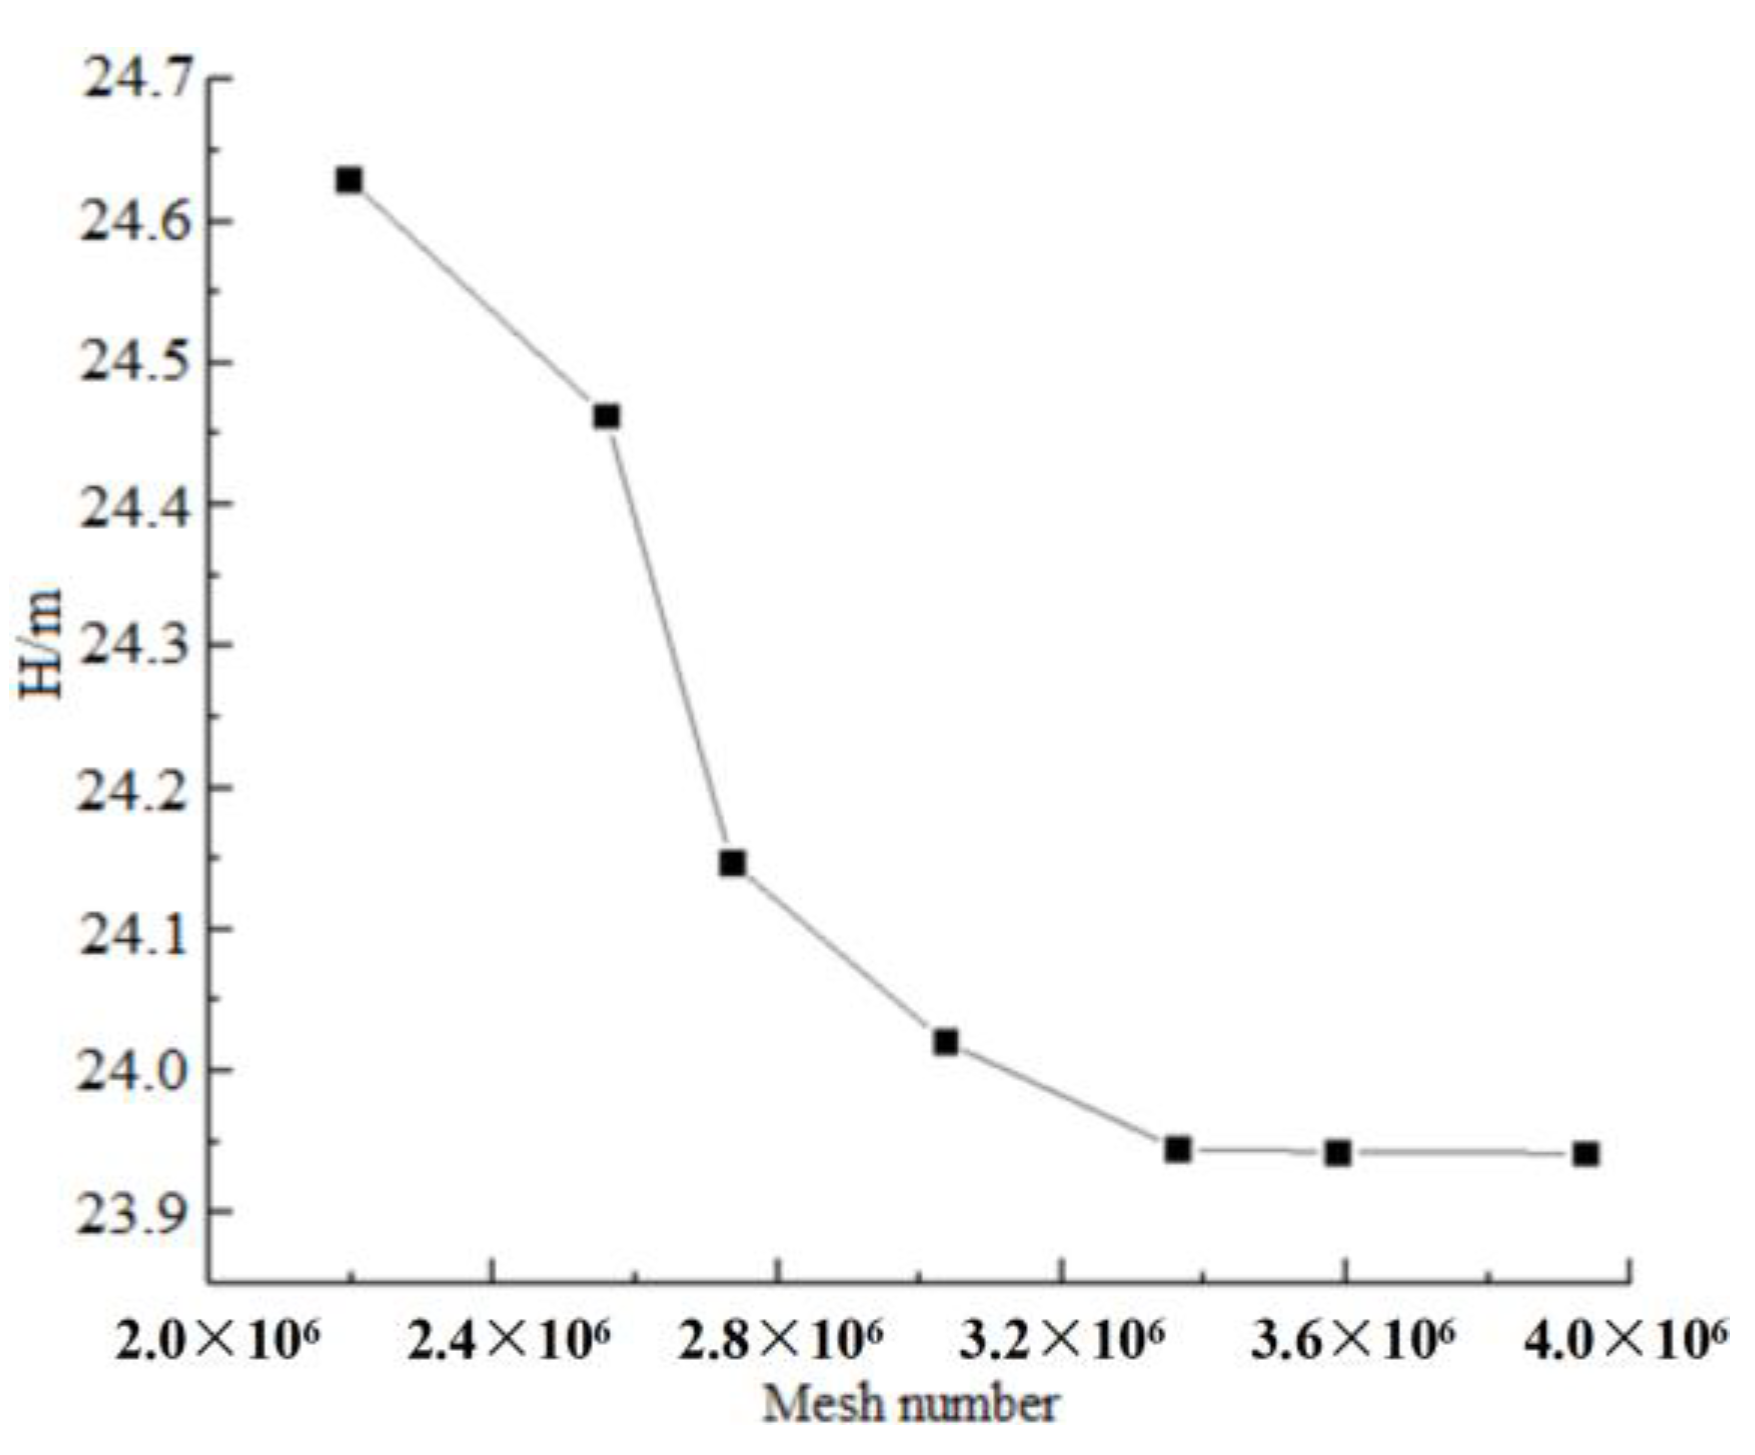
To eliminate the influence of mesh number on the numerical simulation results, the mesh independence was verified in this study while considering the calculation accuracy and efficiency. The fluid domain of the multiphase pump was divided into seven groups of meshes with different grid numbers. The numerical simulation of each group of fluid domains was carried out under pure water condition, and the optimal mesh number was determined for subsequent numerical calculation. The validation of mesh independence is shown in Figure 4. The head represents the energy increment obtained by the unit mass liquid transported by the pump from the inlet to the outlet. It is expressed by the liquid column height (m) of the liquid transported by the pump. The specific expression is H = ( P 2 P 1 ) / ρ g , where P2 and P1 represent the pressure of the liquid at the inlet and outlet of the pump, respectively; ρ is the density of the liquid, and g is the acceleration of gravity.
From Figure 4, it can be seen that the head decreased as the number of grids increased and finally plateaued. When the number of meshes in the computing domain was more than 3.38 million, the change of head was only 0.31%. Therefore, the number of meshes in this calculation model was 3.38 million.

5. Experimental Verification

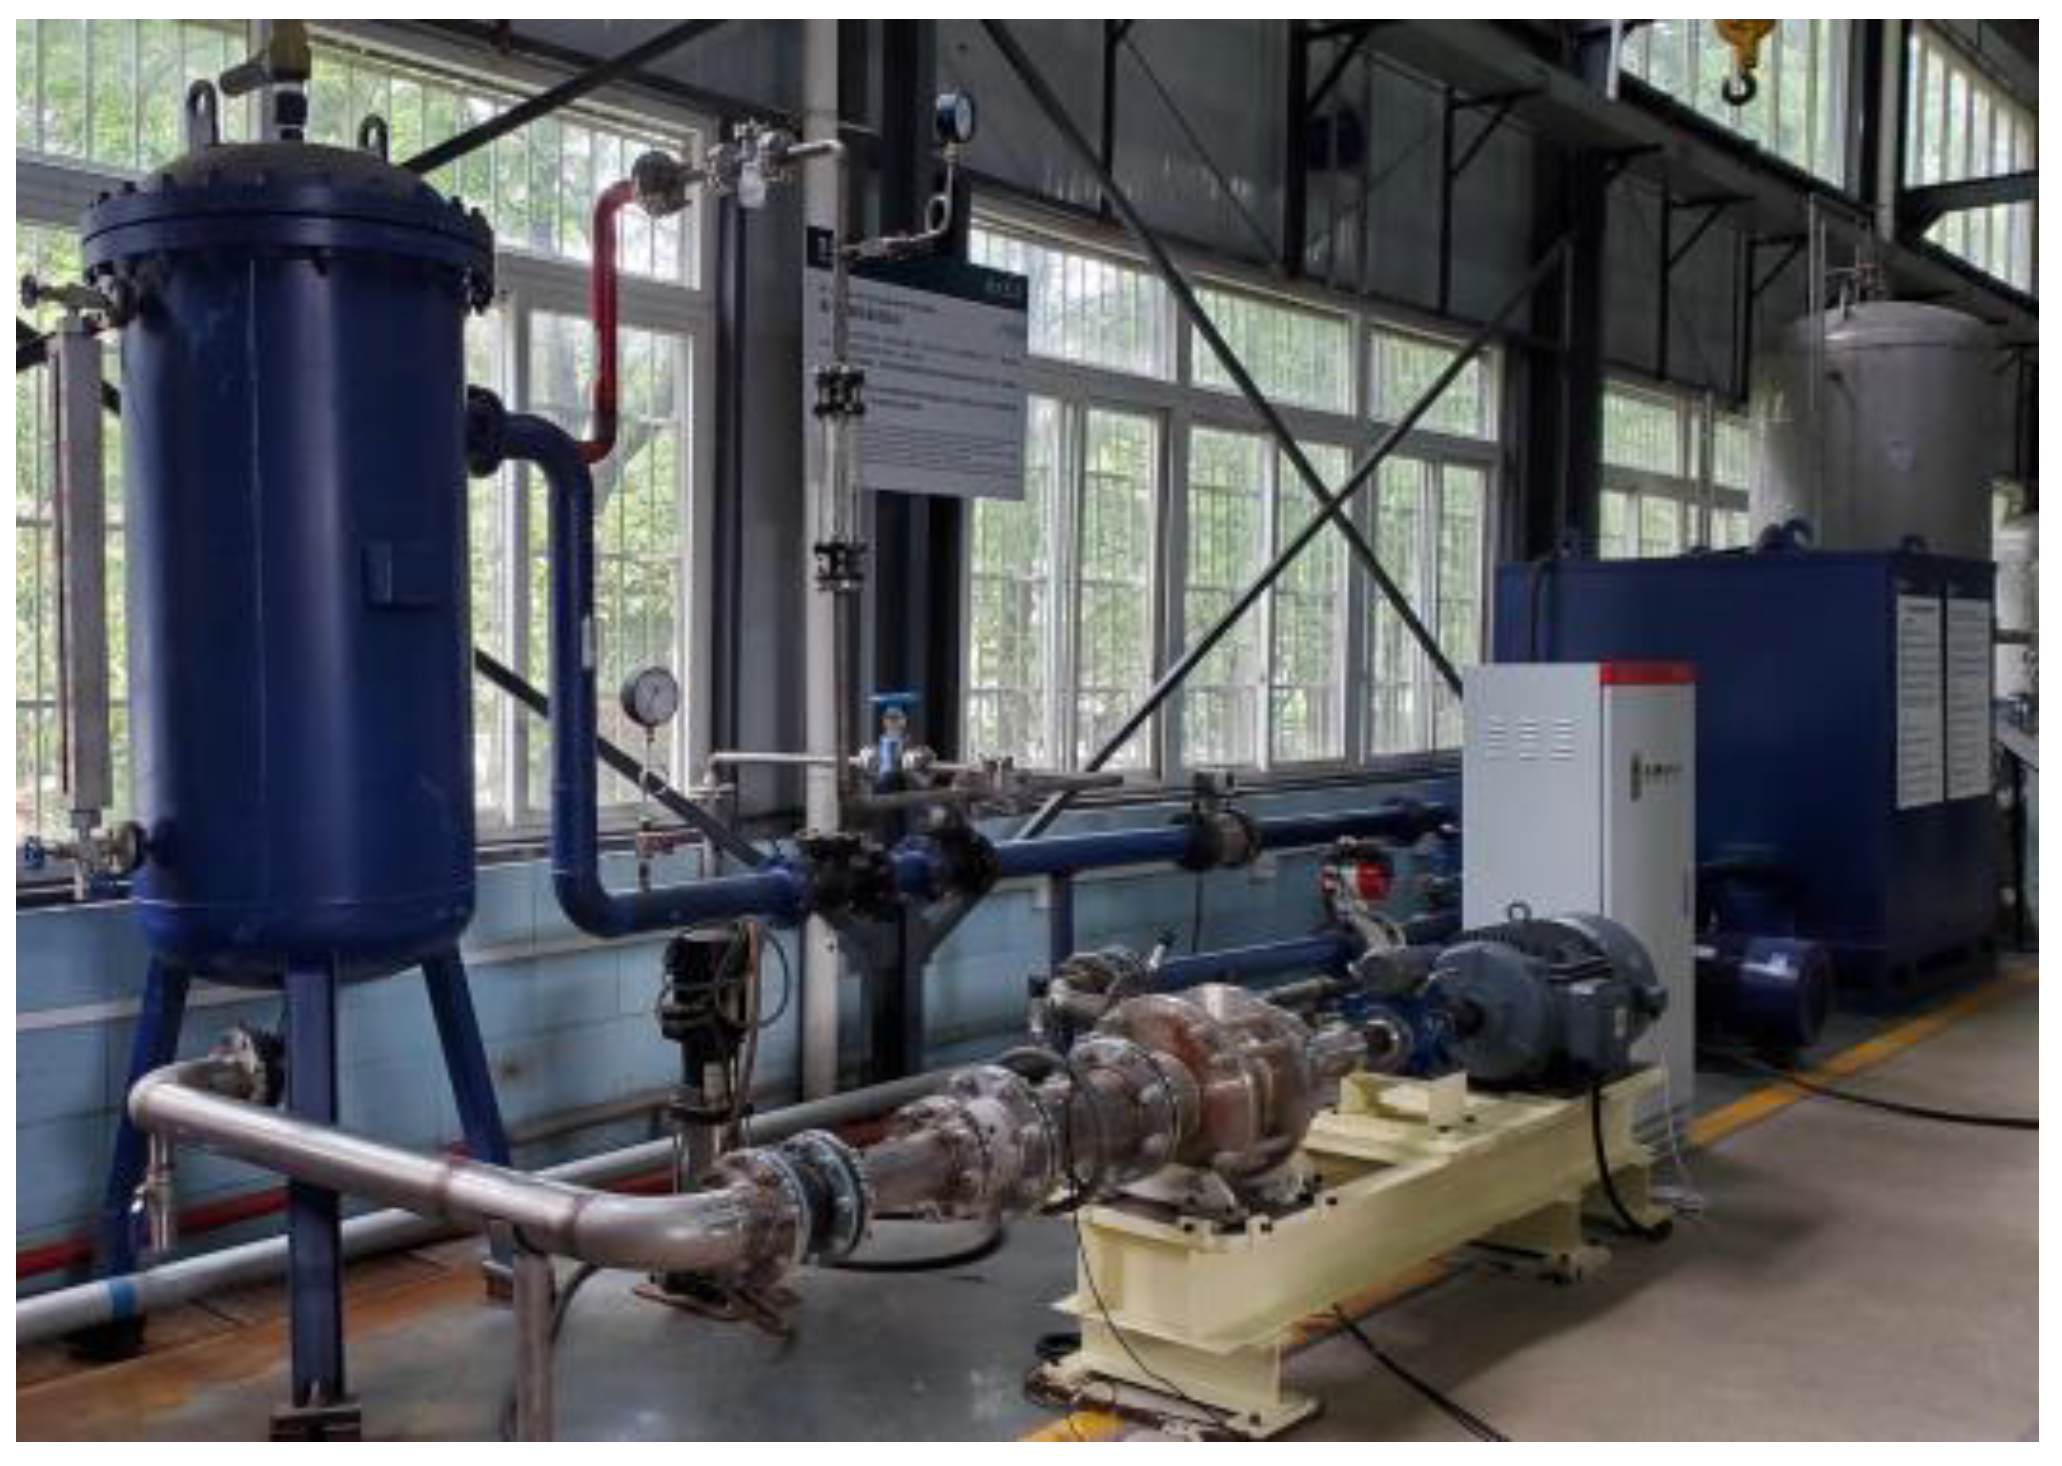
In this experiment, water as the liquid phase and air as the gas phase were selected as mediums in order to capture the two-phase flow state in the multiphase pump capture and test the related performance parameters. The multiphase pump test system is shown in Figure 5. To reduce the test error caused by secondary refraction, this study used transparent plexiglass material with the shape of a pump body designed to be square outside and round inside. At the same time, in order to observe the uniform mixing effect of gas–liquid two phases, a gas–liquid mixing tank was specially assembled at the inlet of the multiphase mixing pump of the test bench, and the inlet pipeline of the mixing pump was designed as a transparent pipeline. Under sufficient illumination, FASTCAM Mini AX100 high-speed photography (as shown in Figure 6) was used to capture the flow field near the blade tip to verify the reliability of the numerical simulation.
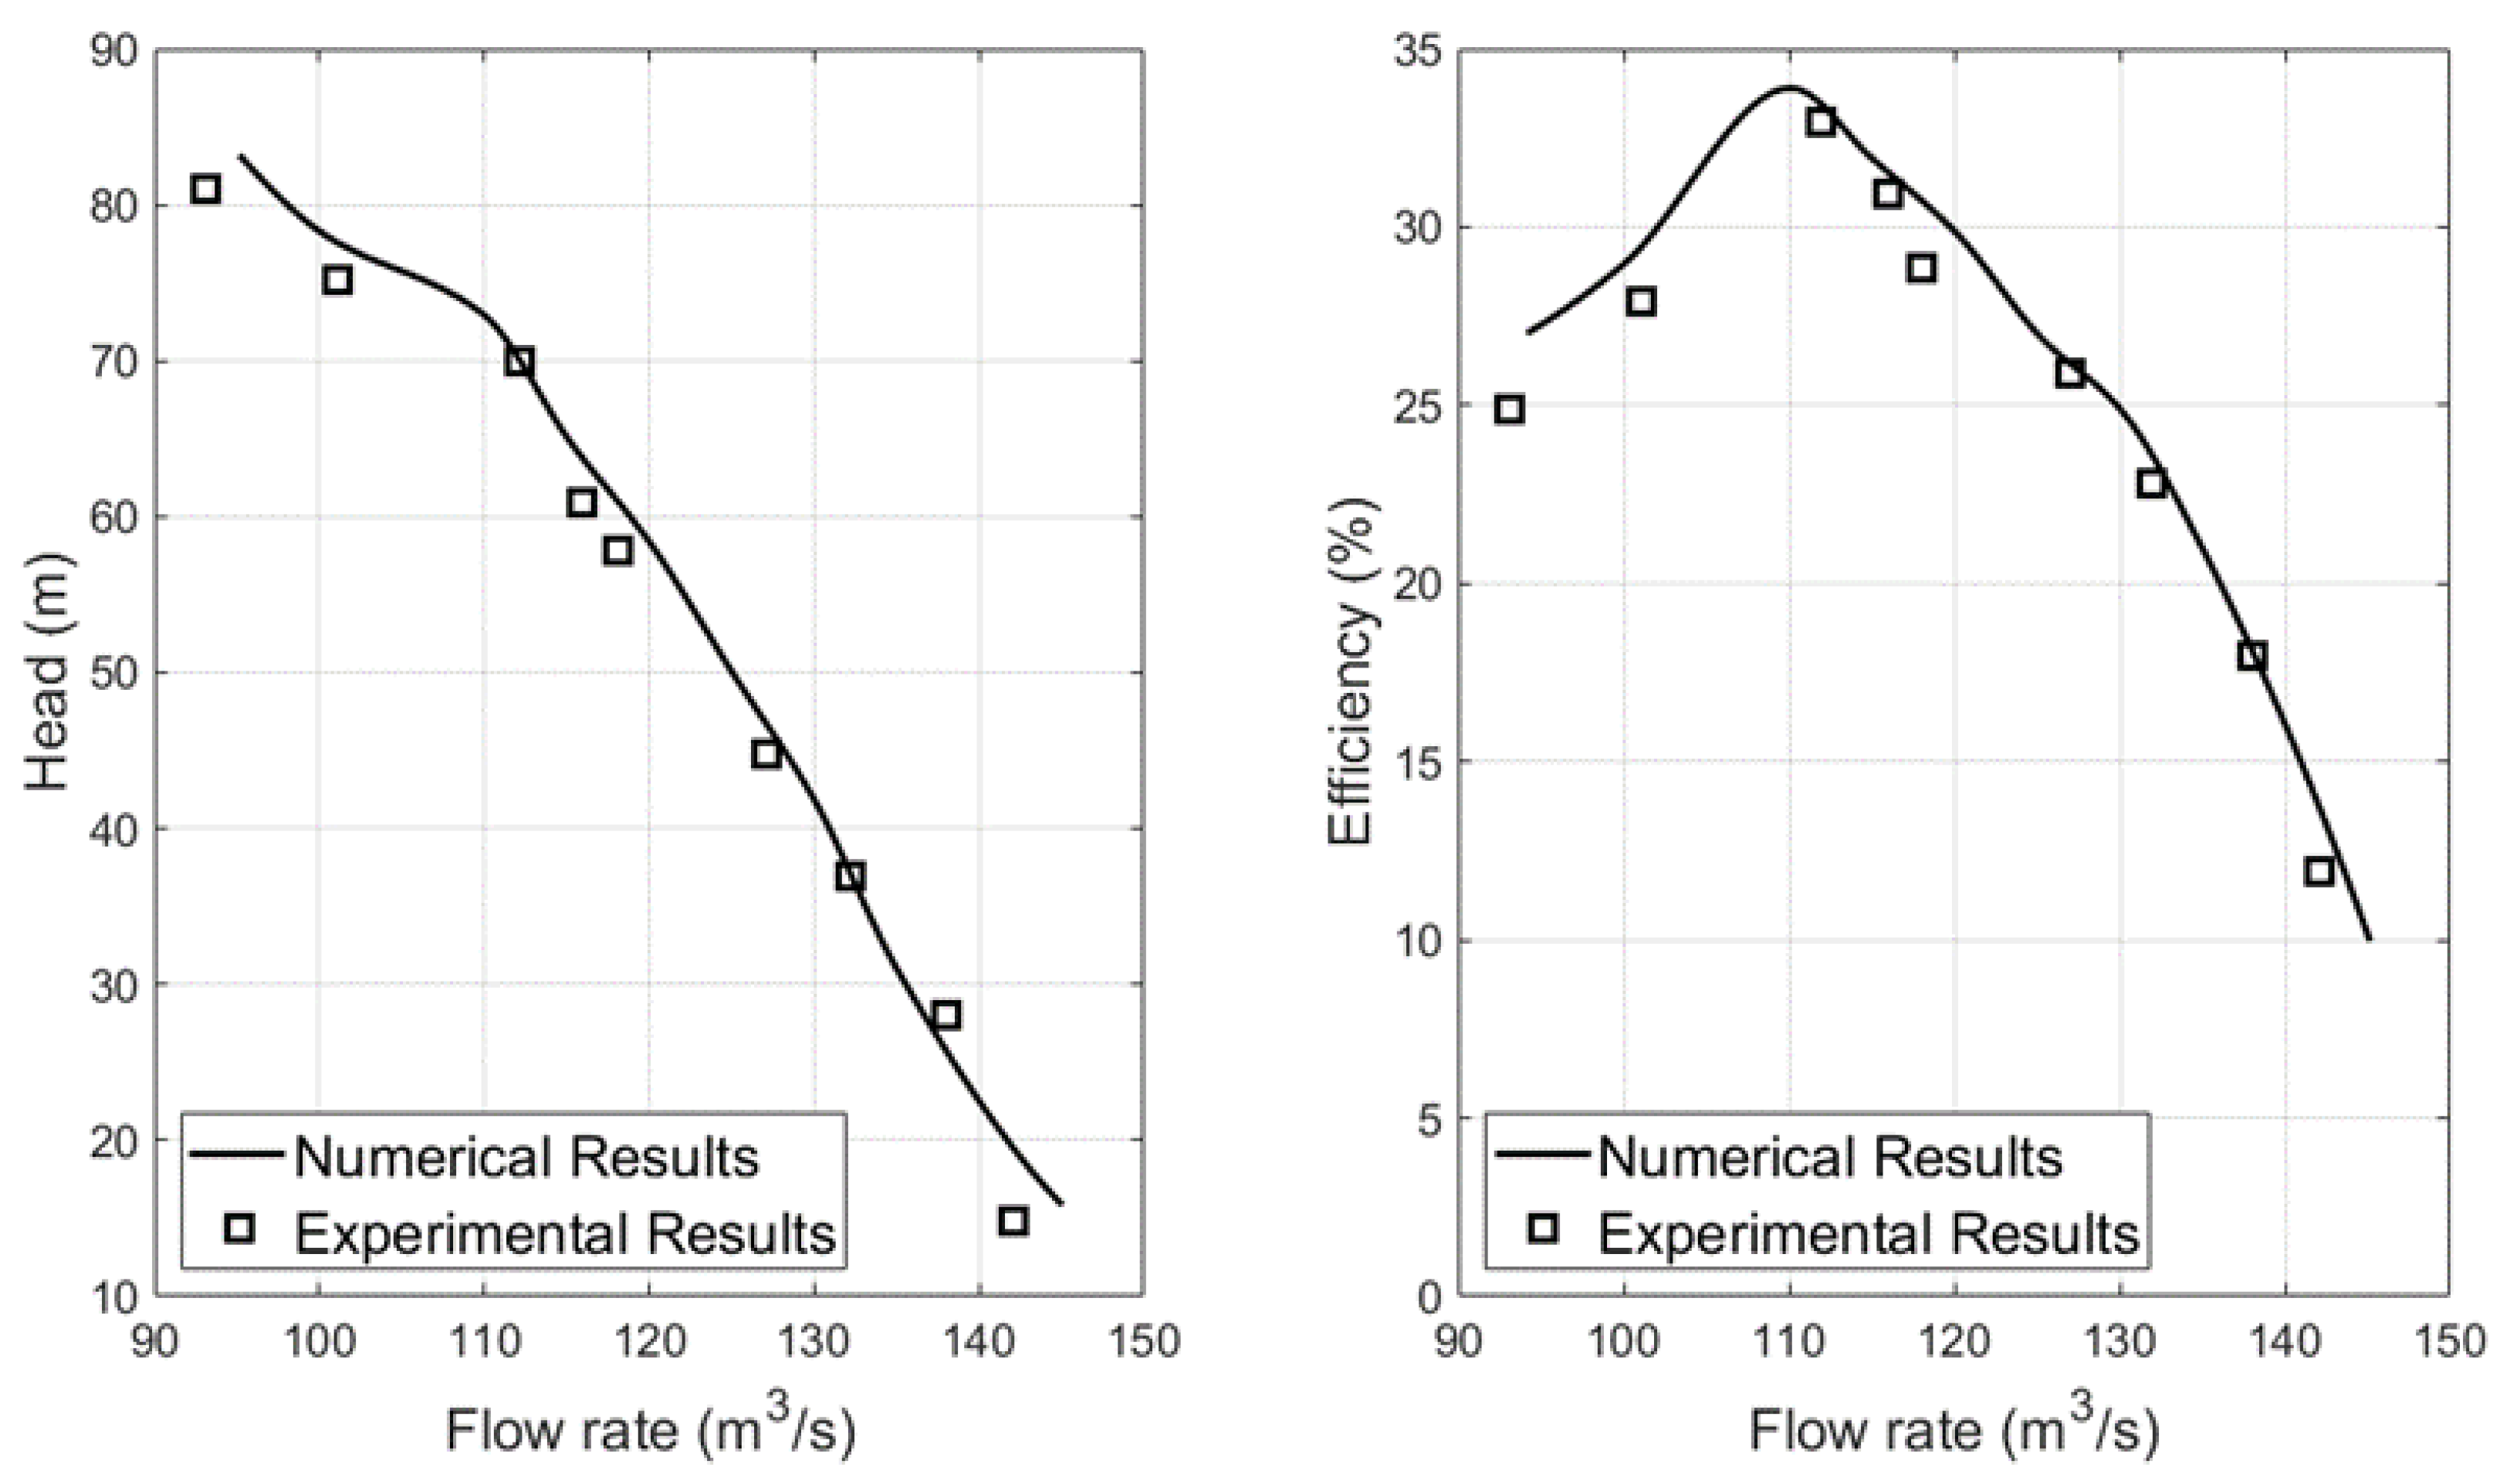
Figure 7 shows the comparative analysis of the flow field obtained by experiment and numerical simulation. It can be seen that the experimental results is in good agreement with the numerical results, thus showing the reliability of the numerical method.

6. Results Analysis

6.1. Distribution of Gas Phase in Impeller Passage at Different Spans

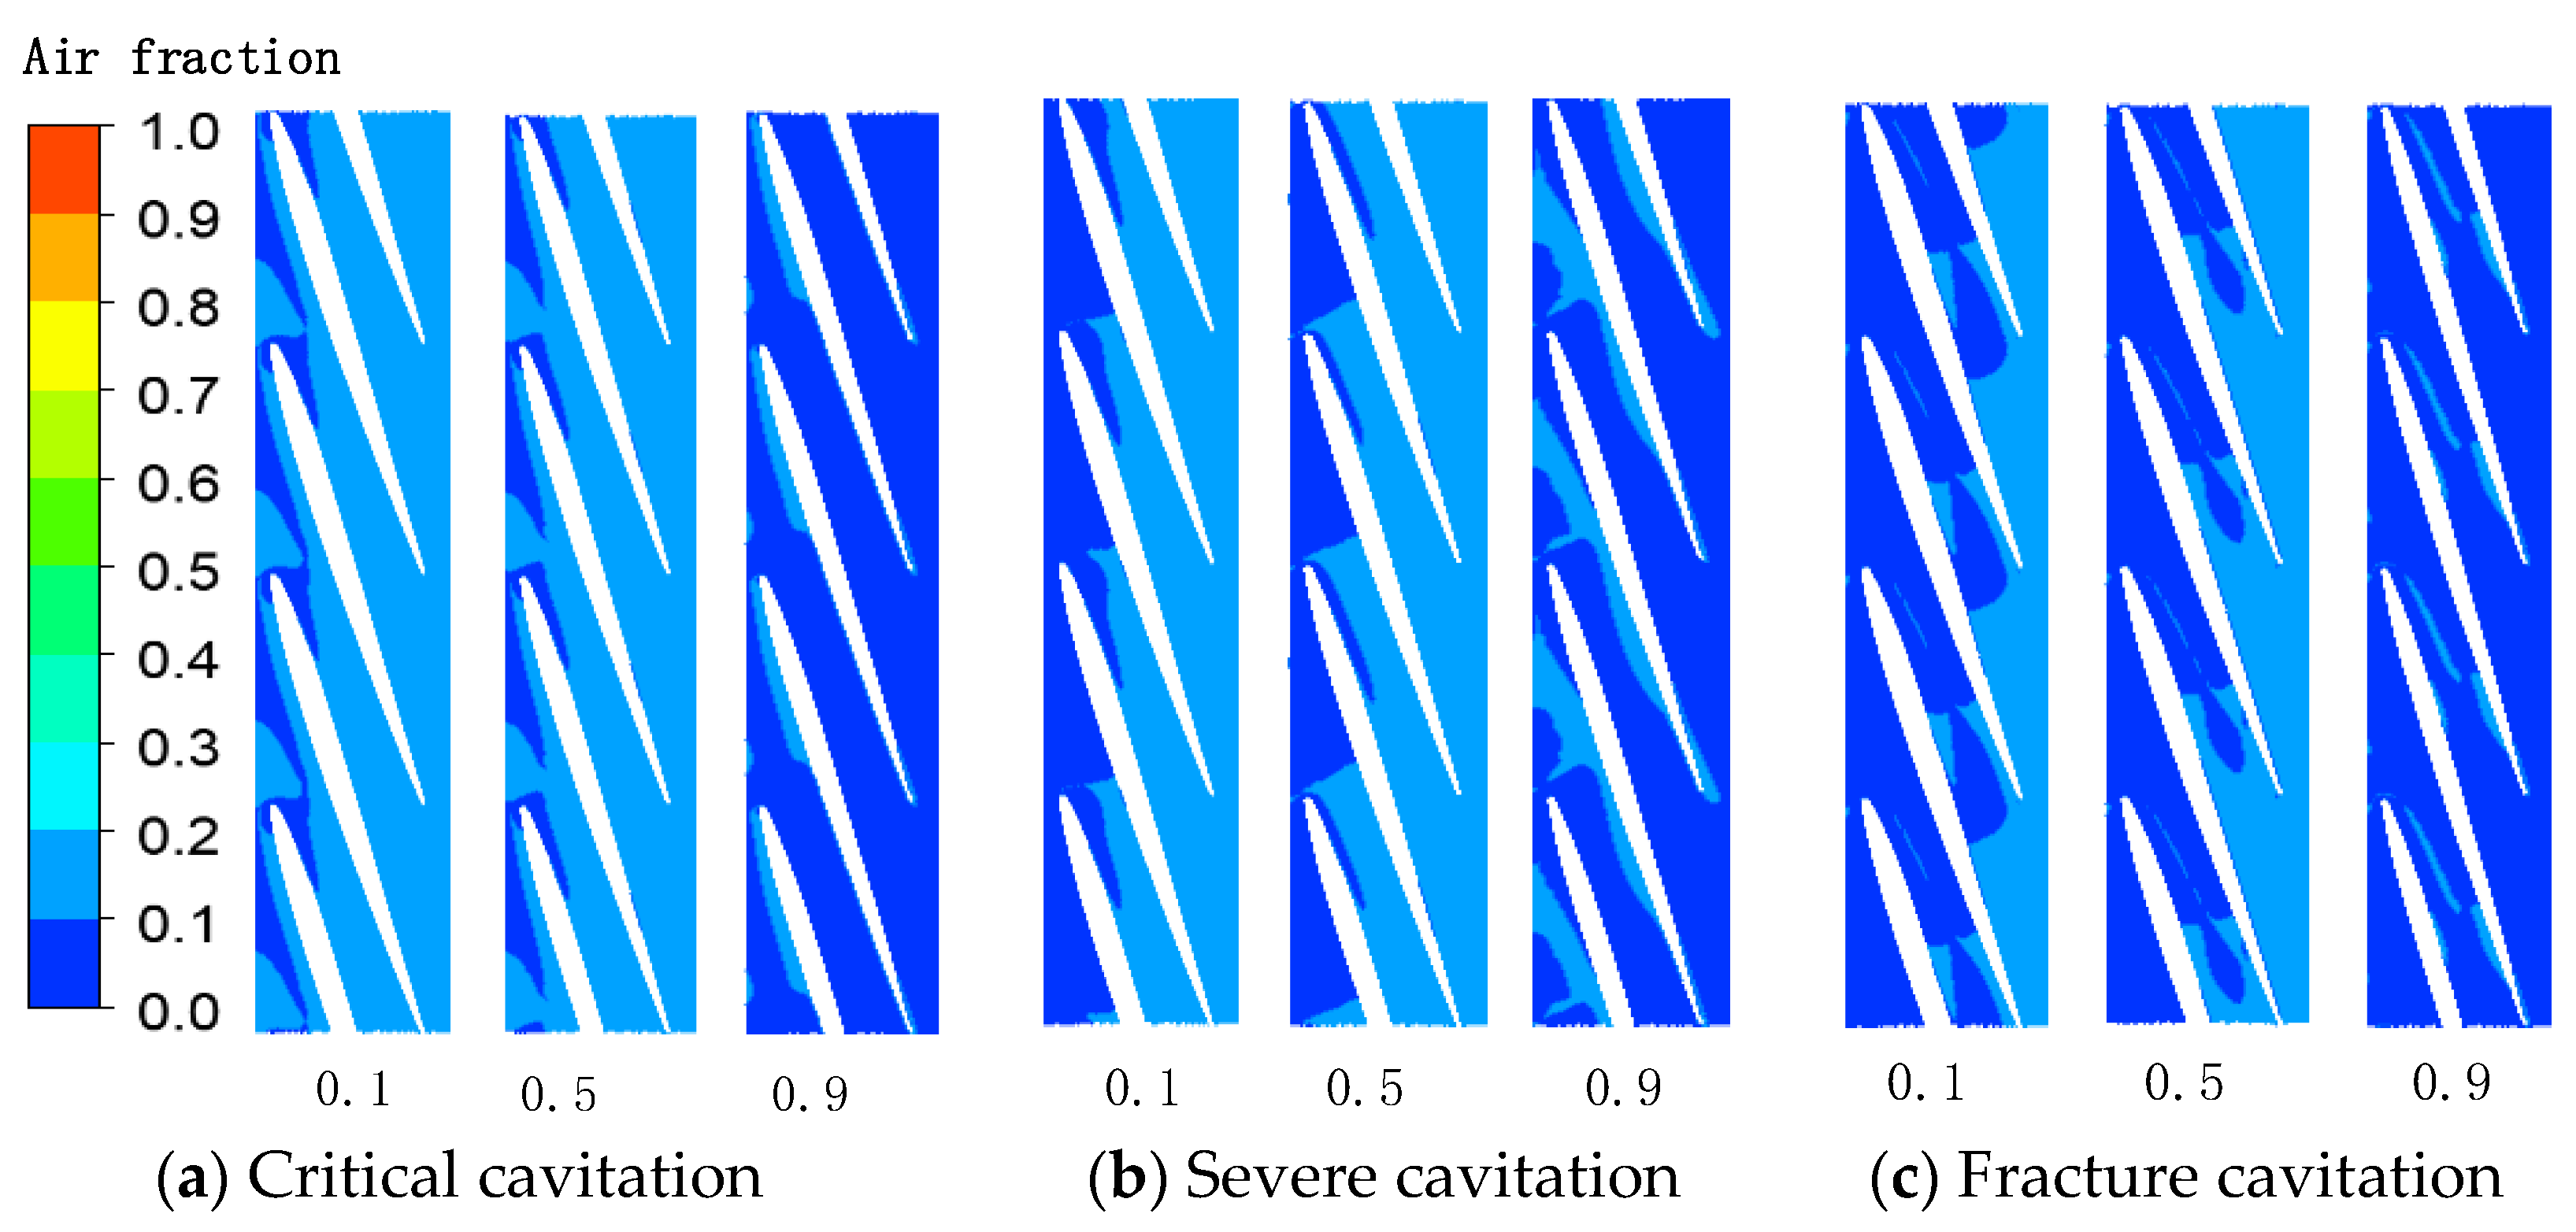
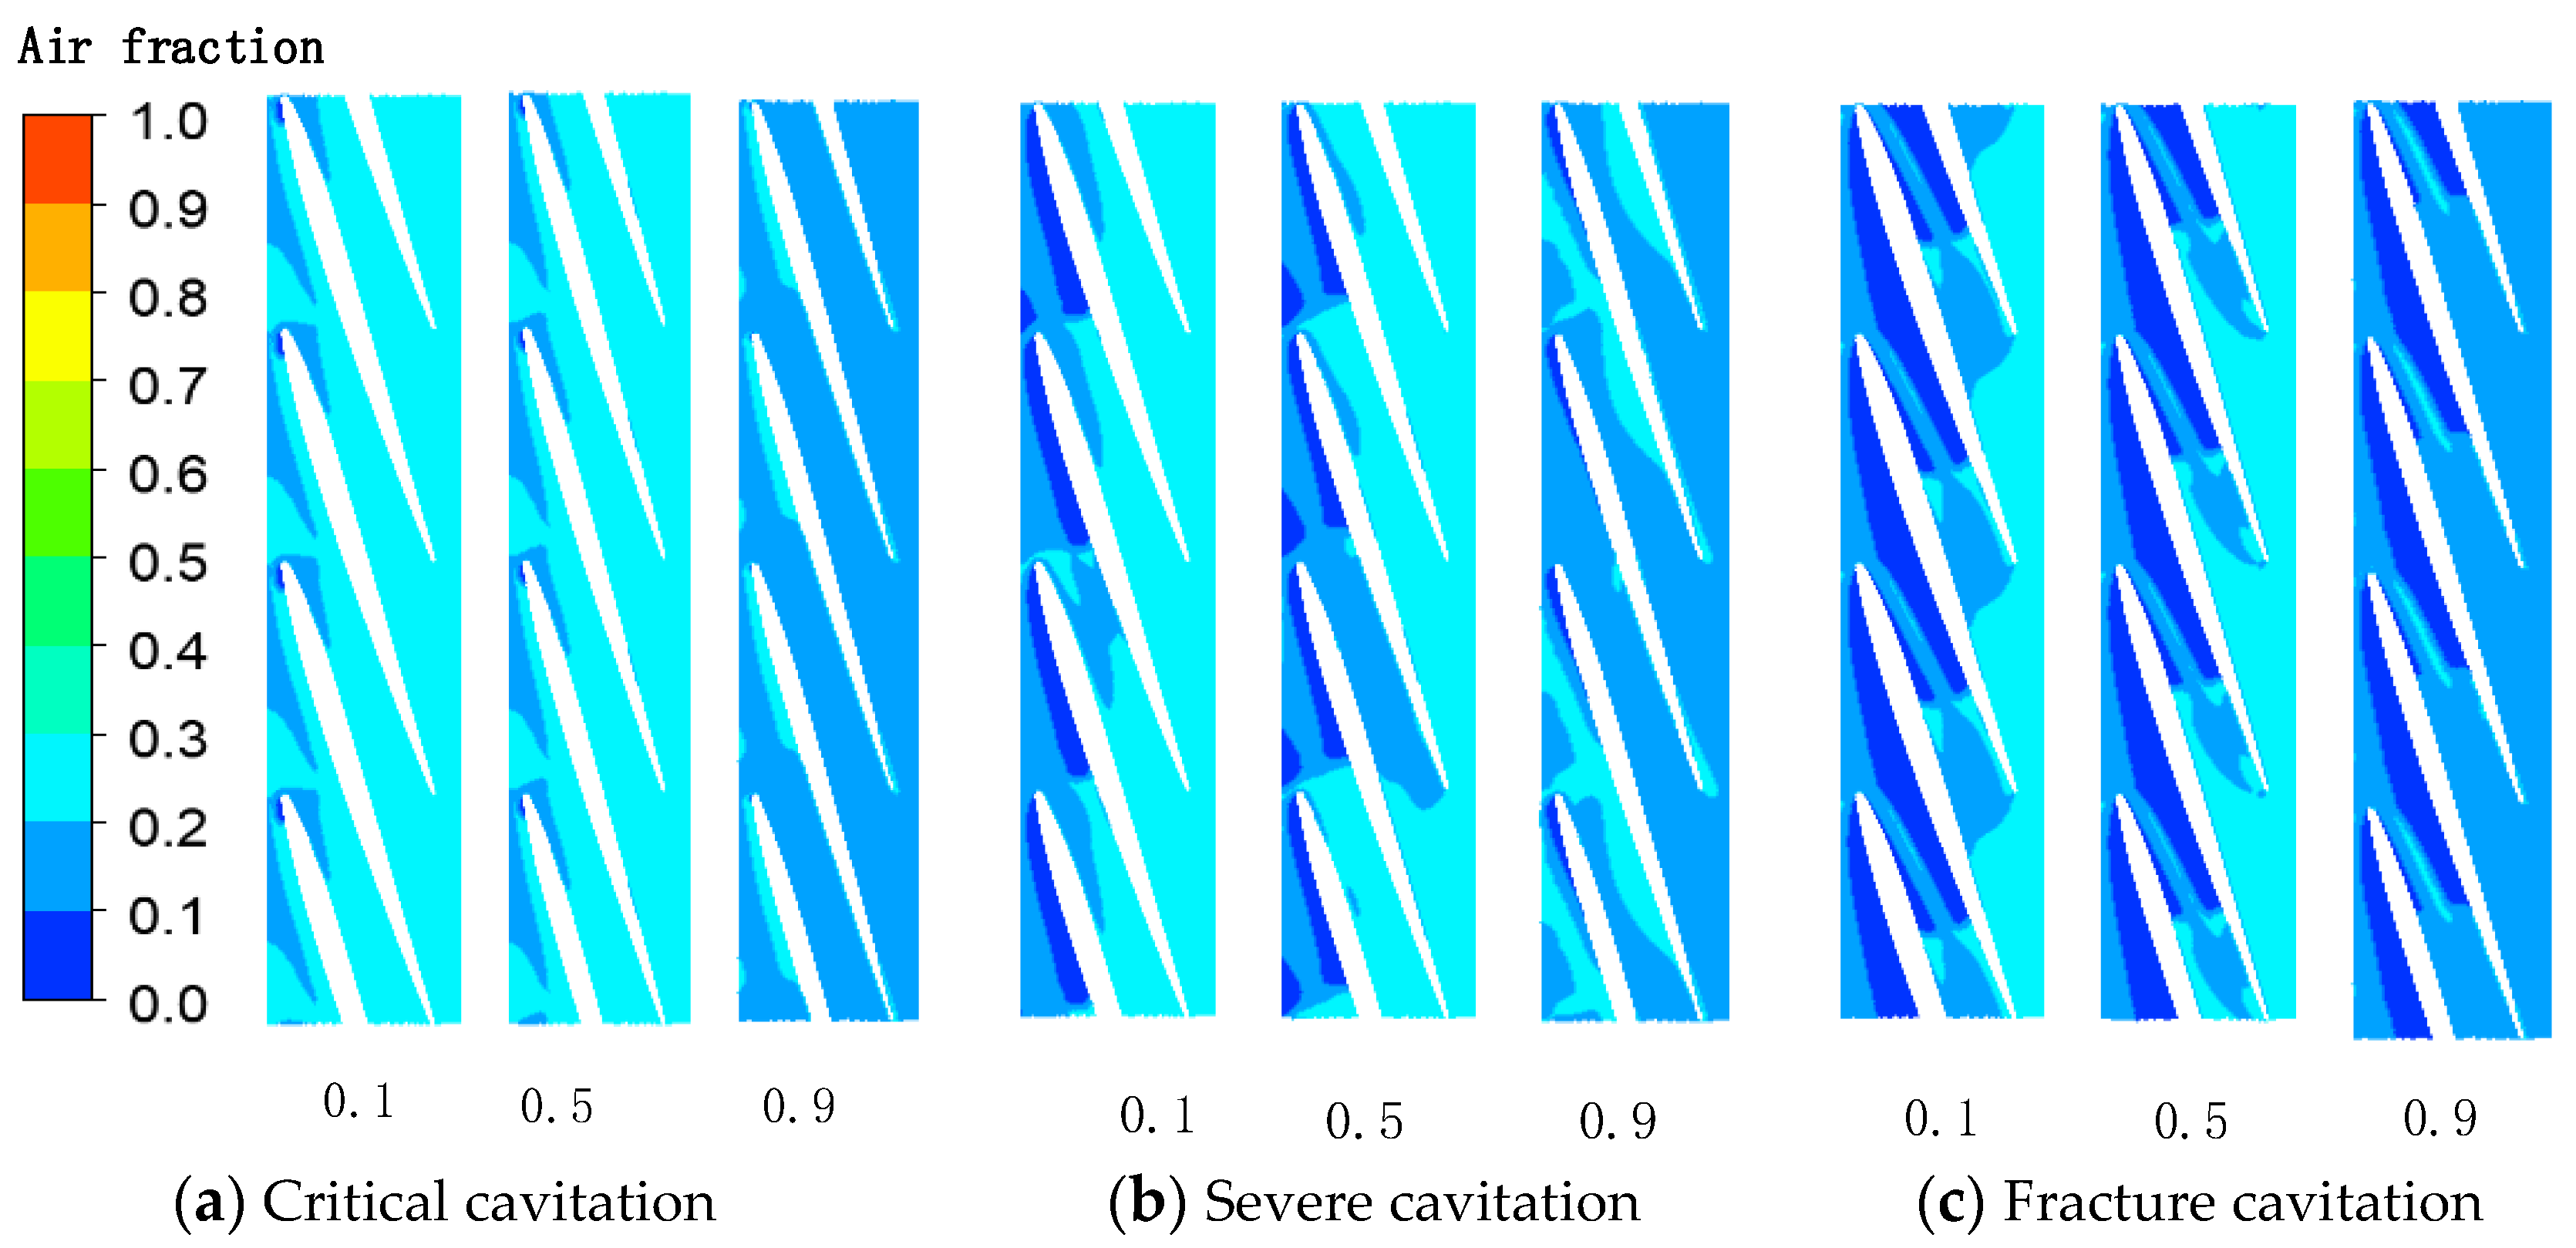
To explore the influence of the change of GVF on the internal cavitation development of the multiphase pump, the gas distribution in the impeller passage at different heights was analyzed. Figure 8 and Figure 9 show the distribution nephograms of GVF in the impeller passage at the spans of 0.1, 0.5, and 0.9 at different cavitation stages corresponding to GVF = 0.1 and GVF = 0.2.
From Figure 8 and Figure 9, it is easy to see that the volume fraction and distribution area of the gas phase decreased with increasing blade height at different operating conditions. This was because the density of the gas phase was much lower than that of pure water, and thus the gas phase was much less affected by the centrifugal force of the impeller rotation. By comparing the gas phase distribution at different cavitation stages with different GVFs, it was found that the gas phase distribution was relatively small when the GVF was small. Under the same GVF condition, with the development of the cavitation stage, the volume fraction and distribution area of the gas phase in the impeller passage gradually decreased.
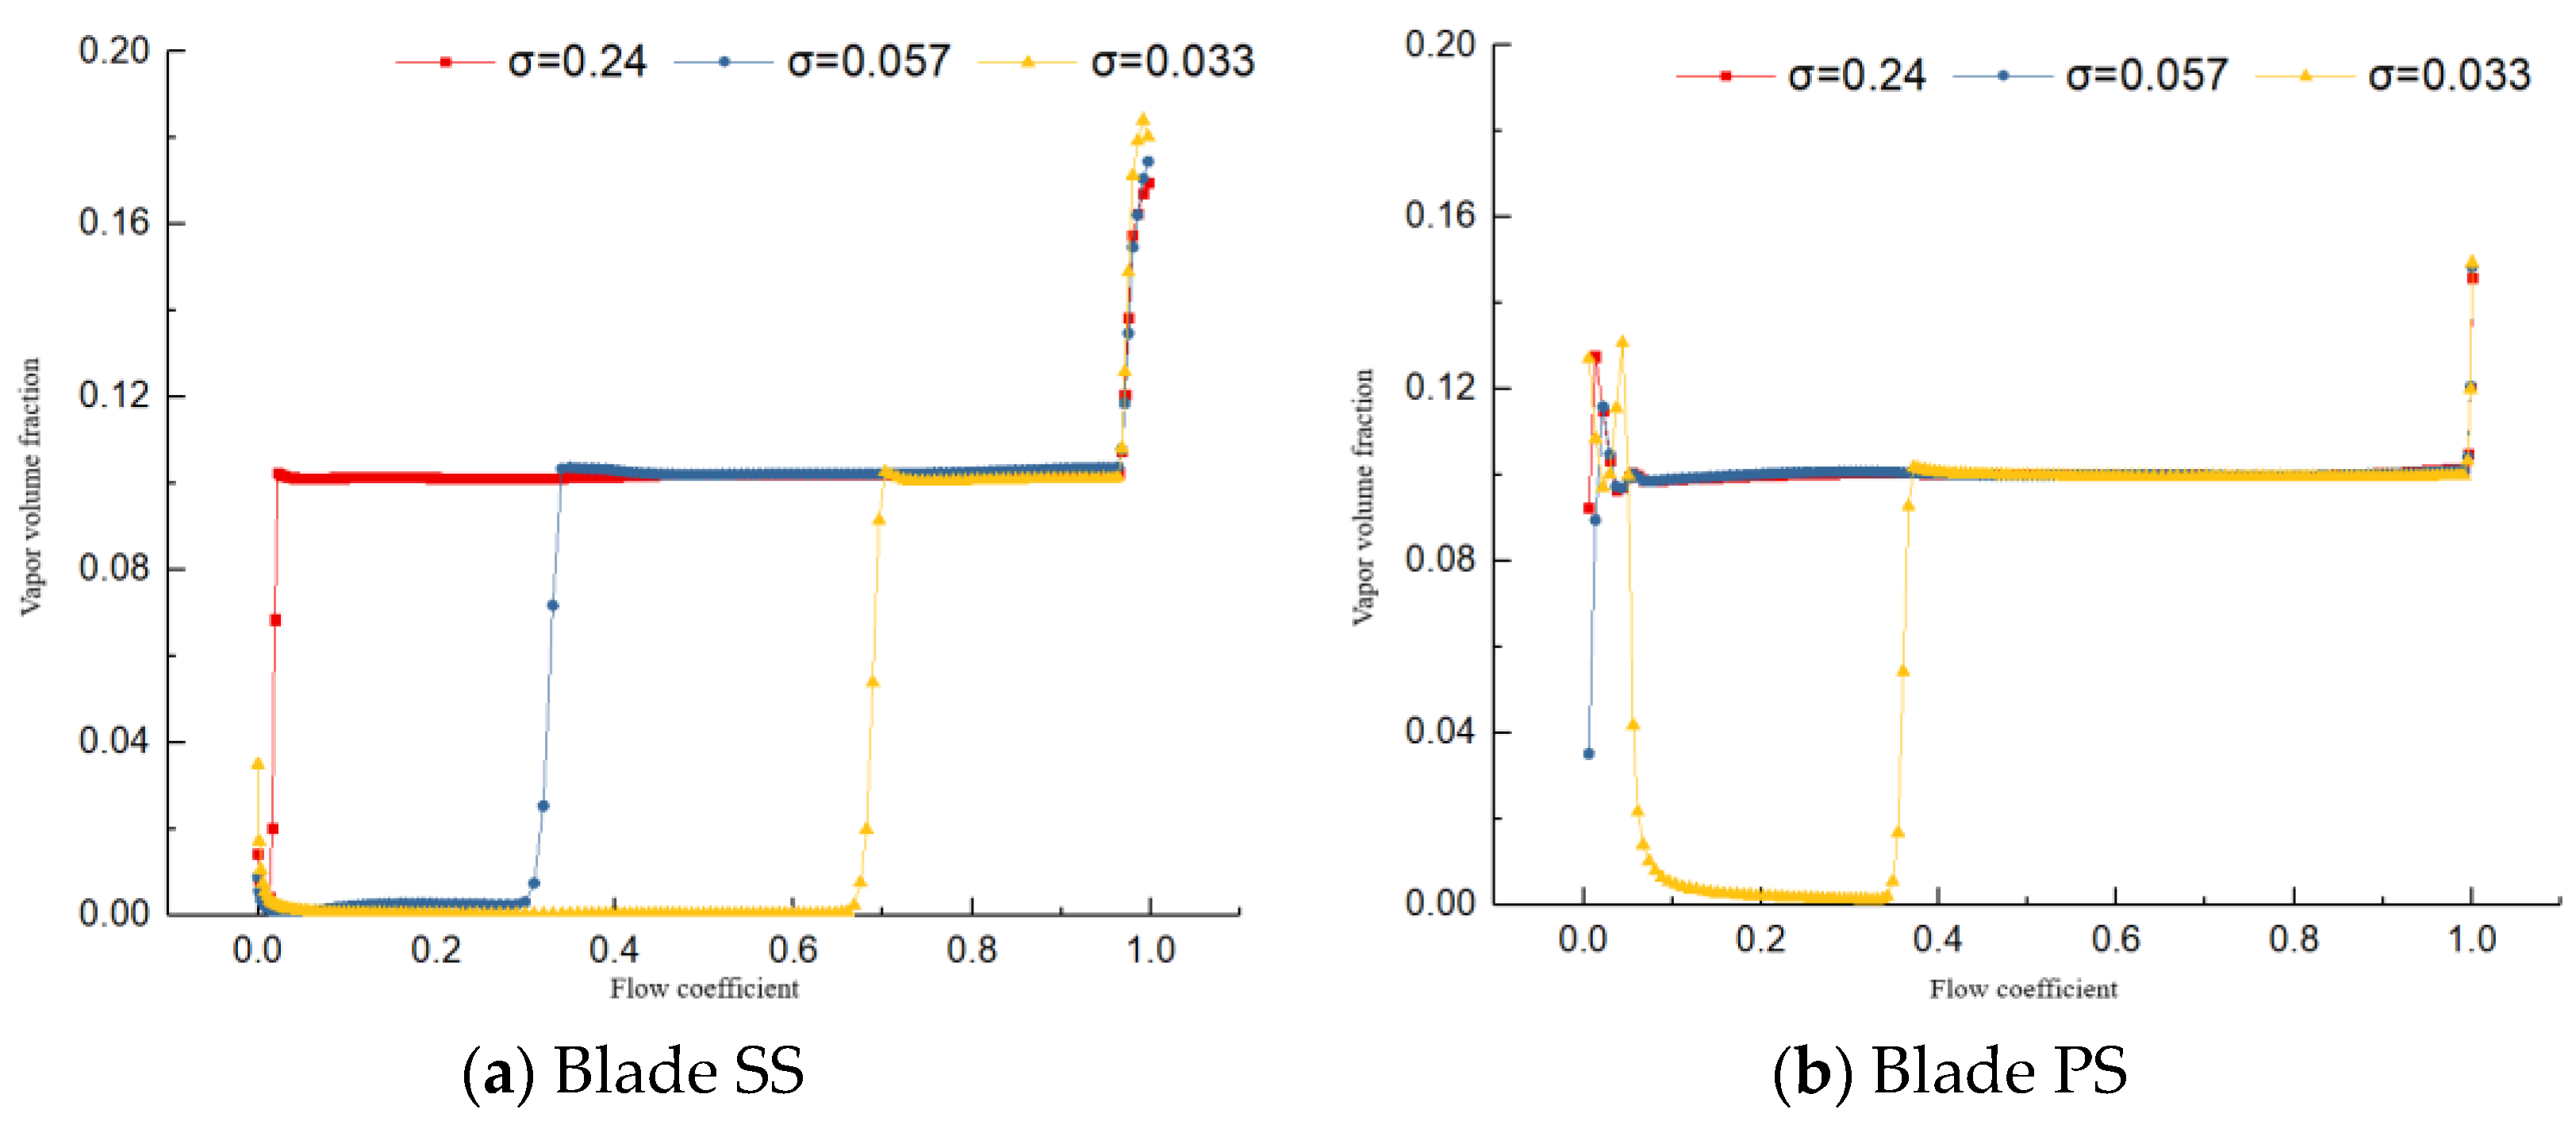
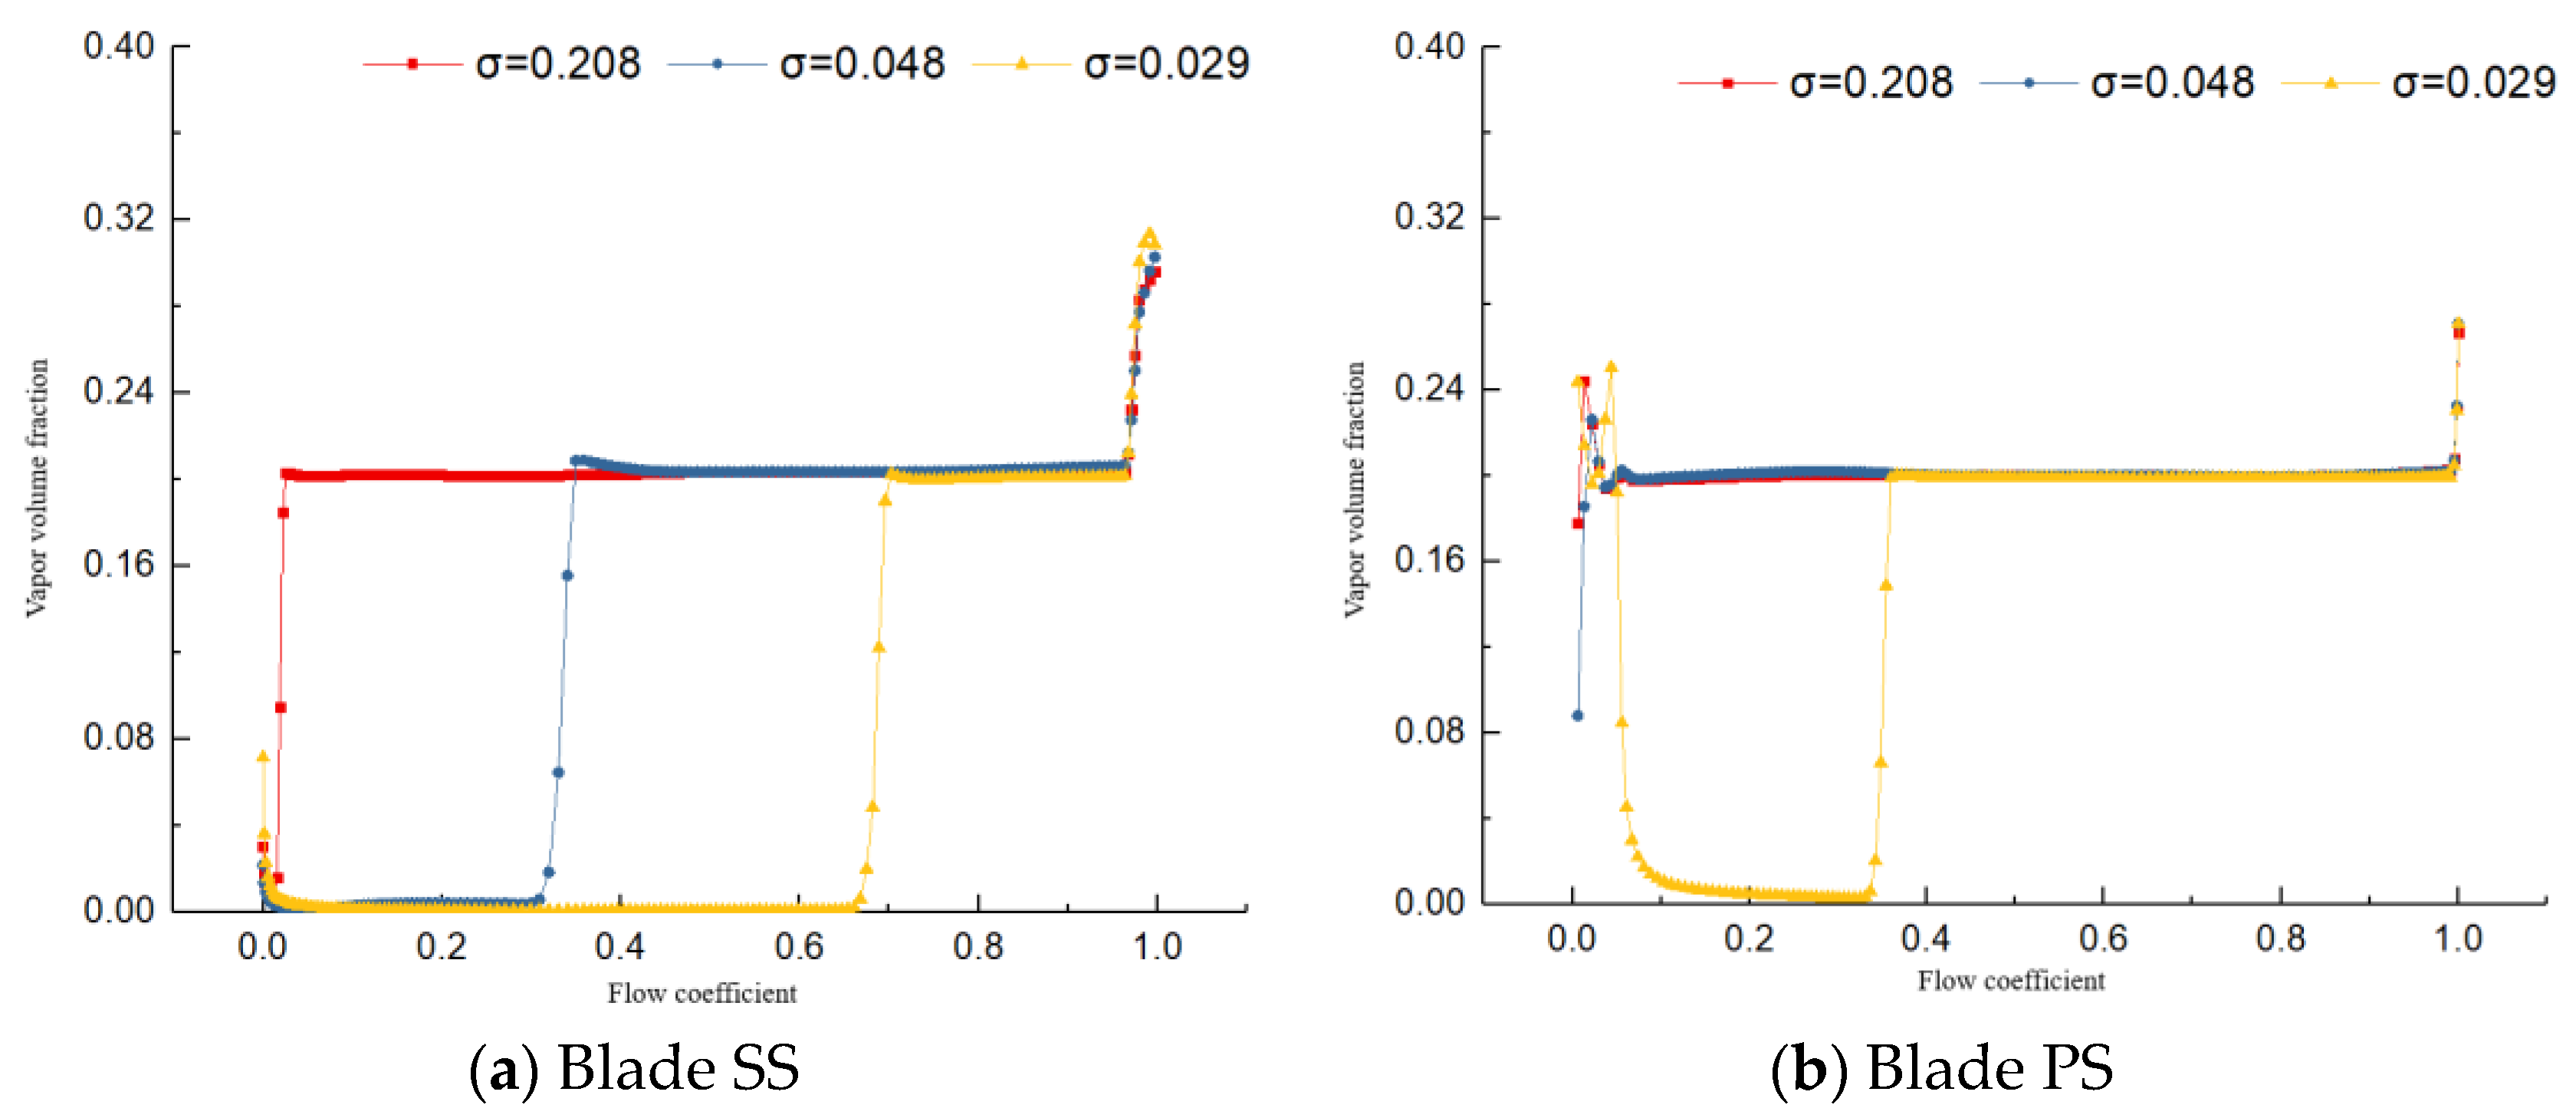
To quantitatively analyze the relationship between the gas phase and the cavitation distribution, the distribution of GVF at 0.5 blade height on the blade surface was analyzed to illustrate the influence of the change of GVF on the cavitation development. Figure 10 and Figure 11 show the GVF distribution at different blade surface heights at different cavitation stages when the GVF was 0.1 and 0.2, respectively.
Figure 10 and Figure 11 show that during the critical cavitation stage, along the blade height, the GVF at the blade inlet was close to 0 at the inlet of the blade SS and approximately 0.1 and 0.2 at the other positions. When it reached the stage of severe cavitation, the volume fraction of the gas phase decreased from 0.1 and 0.2 to 0 at the relative positions of 0–0.32 of the blade SS. When it came to the fracture cavitation stage, the GVF almost completely decreased to 0 at the relative positions of 0–0.65 along the SS of the blade along the flow direction. On the blade PS, when the cavitation was in the critical cavitation stage and severe cavitation stage, the GVF basically remained unchanged at the inlet cavitation. With the development of cavitation, in the relative positions of 0–0.4 along the direction of the blade PS, the volume fraction of the gas phase almost decreased to 0. With cavitation, the volume fraction of the gas phase decreased almost entirely to 0 in the 0–0.4 range along the blade PS.
Through the above analysis of gas distribution, it was found that the development of cavitation had a great influence on the gas distribution on the blade surface, especially on the SS of the blade.

6.2. Cavitation Distribution in Impeller Passage at Different Blade Heights

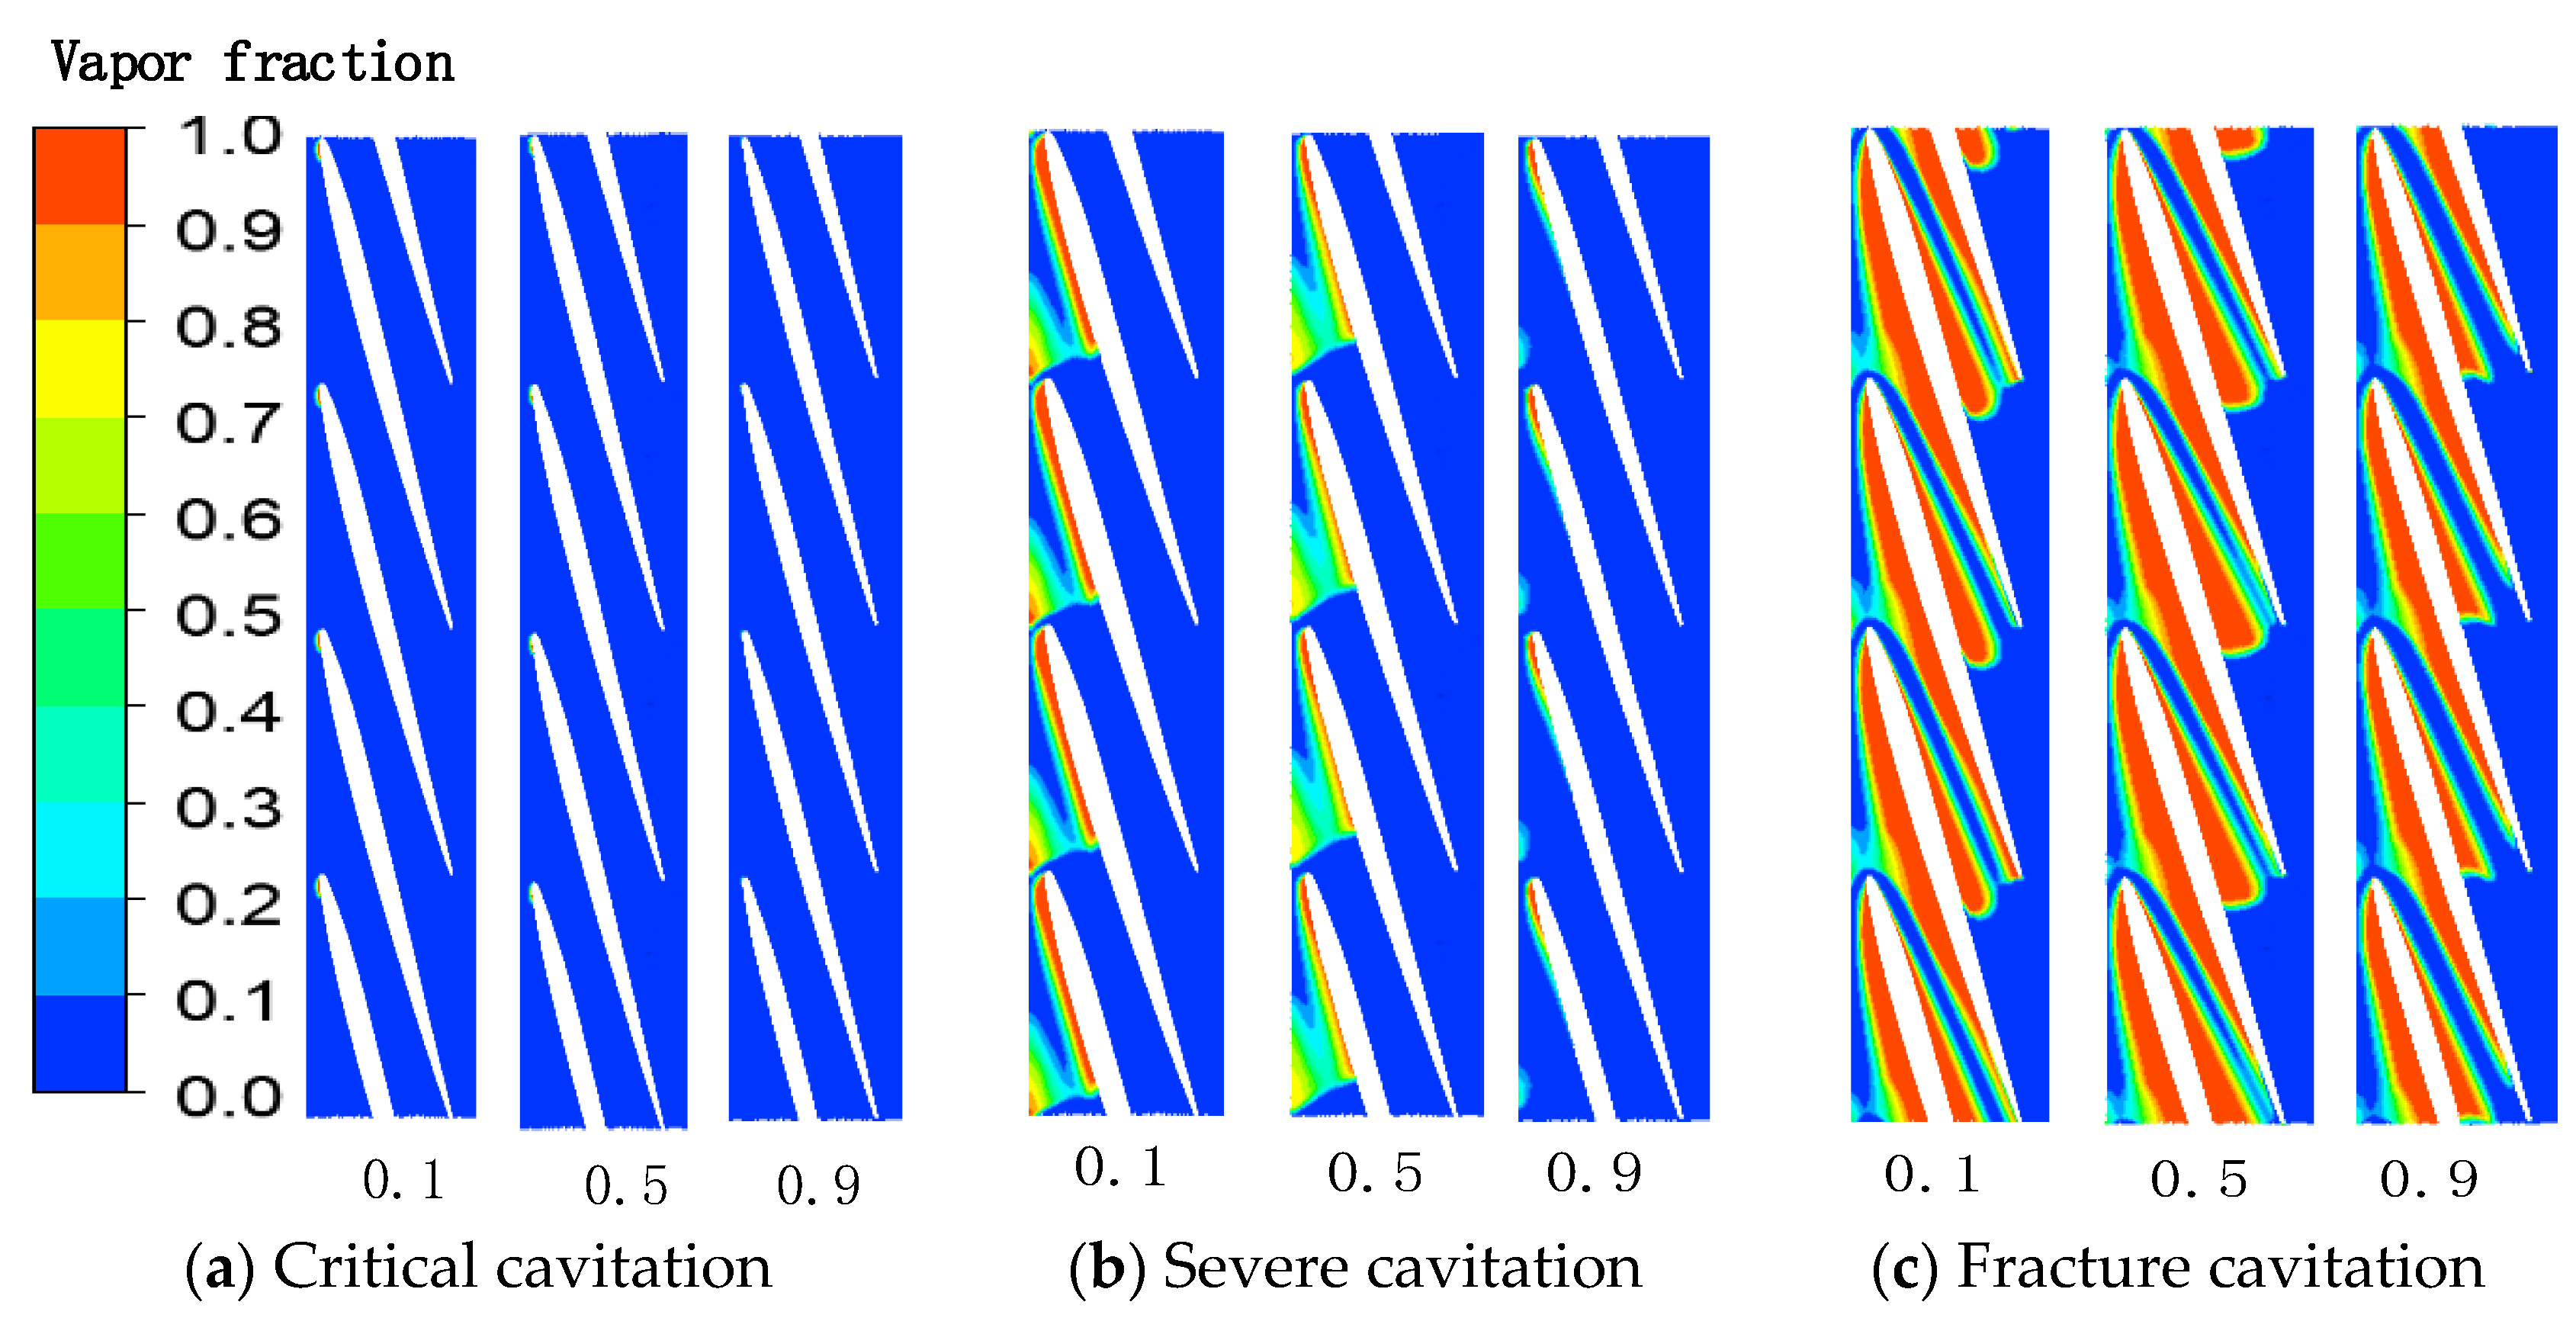
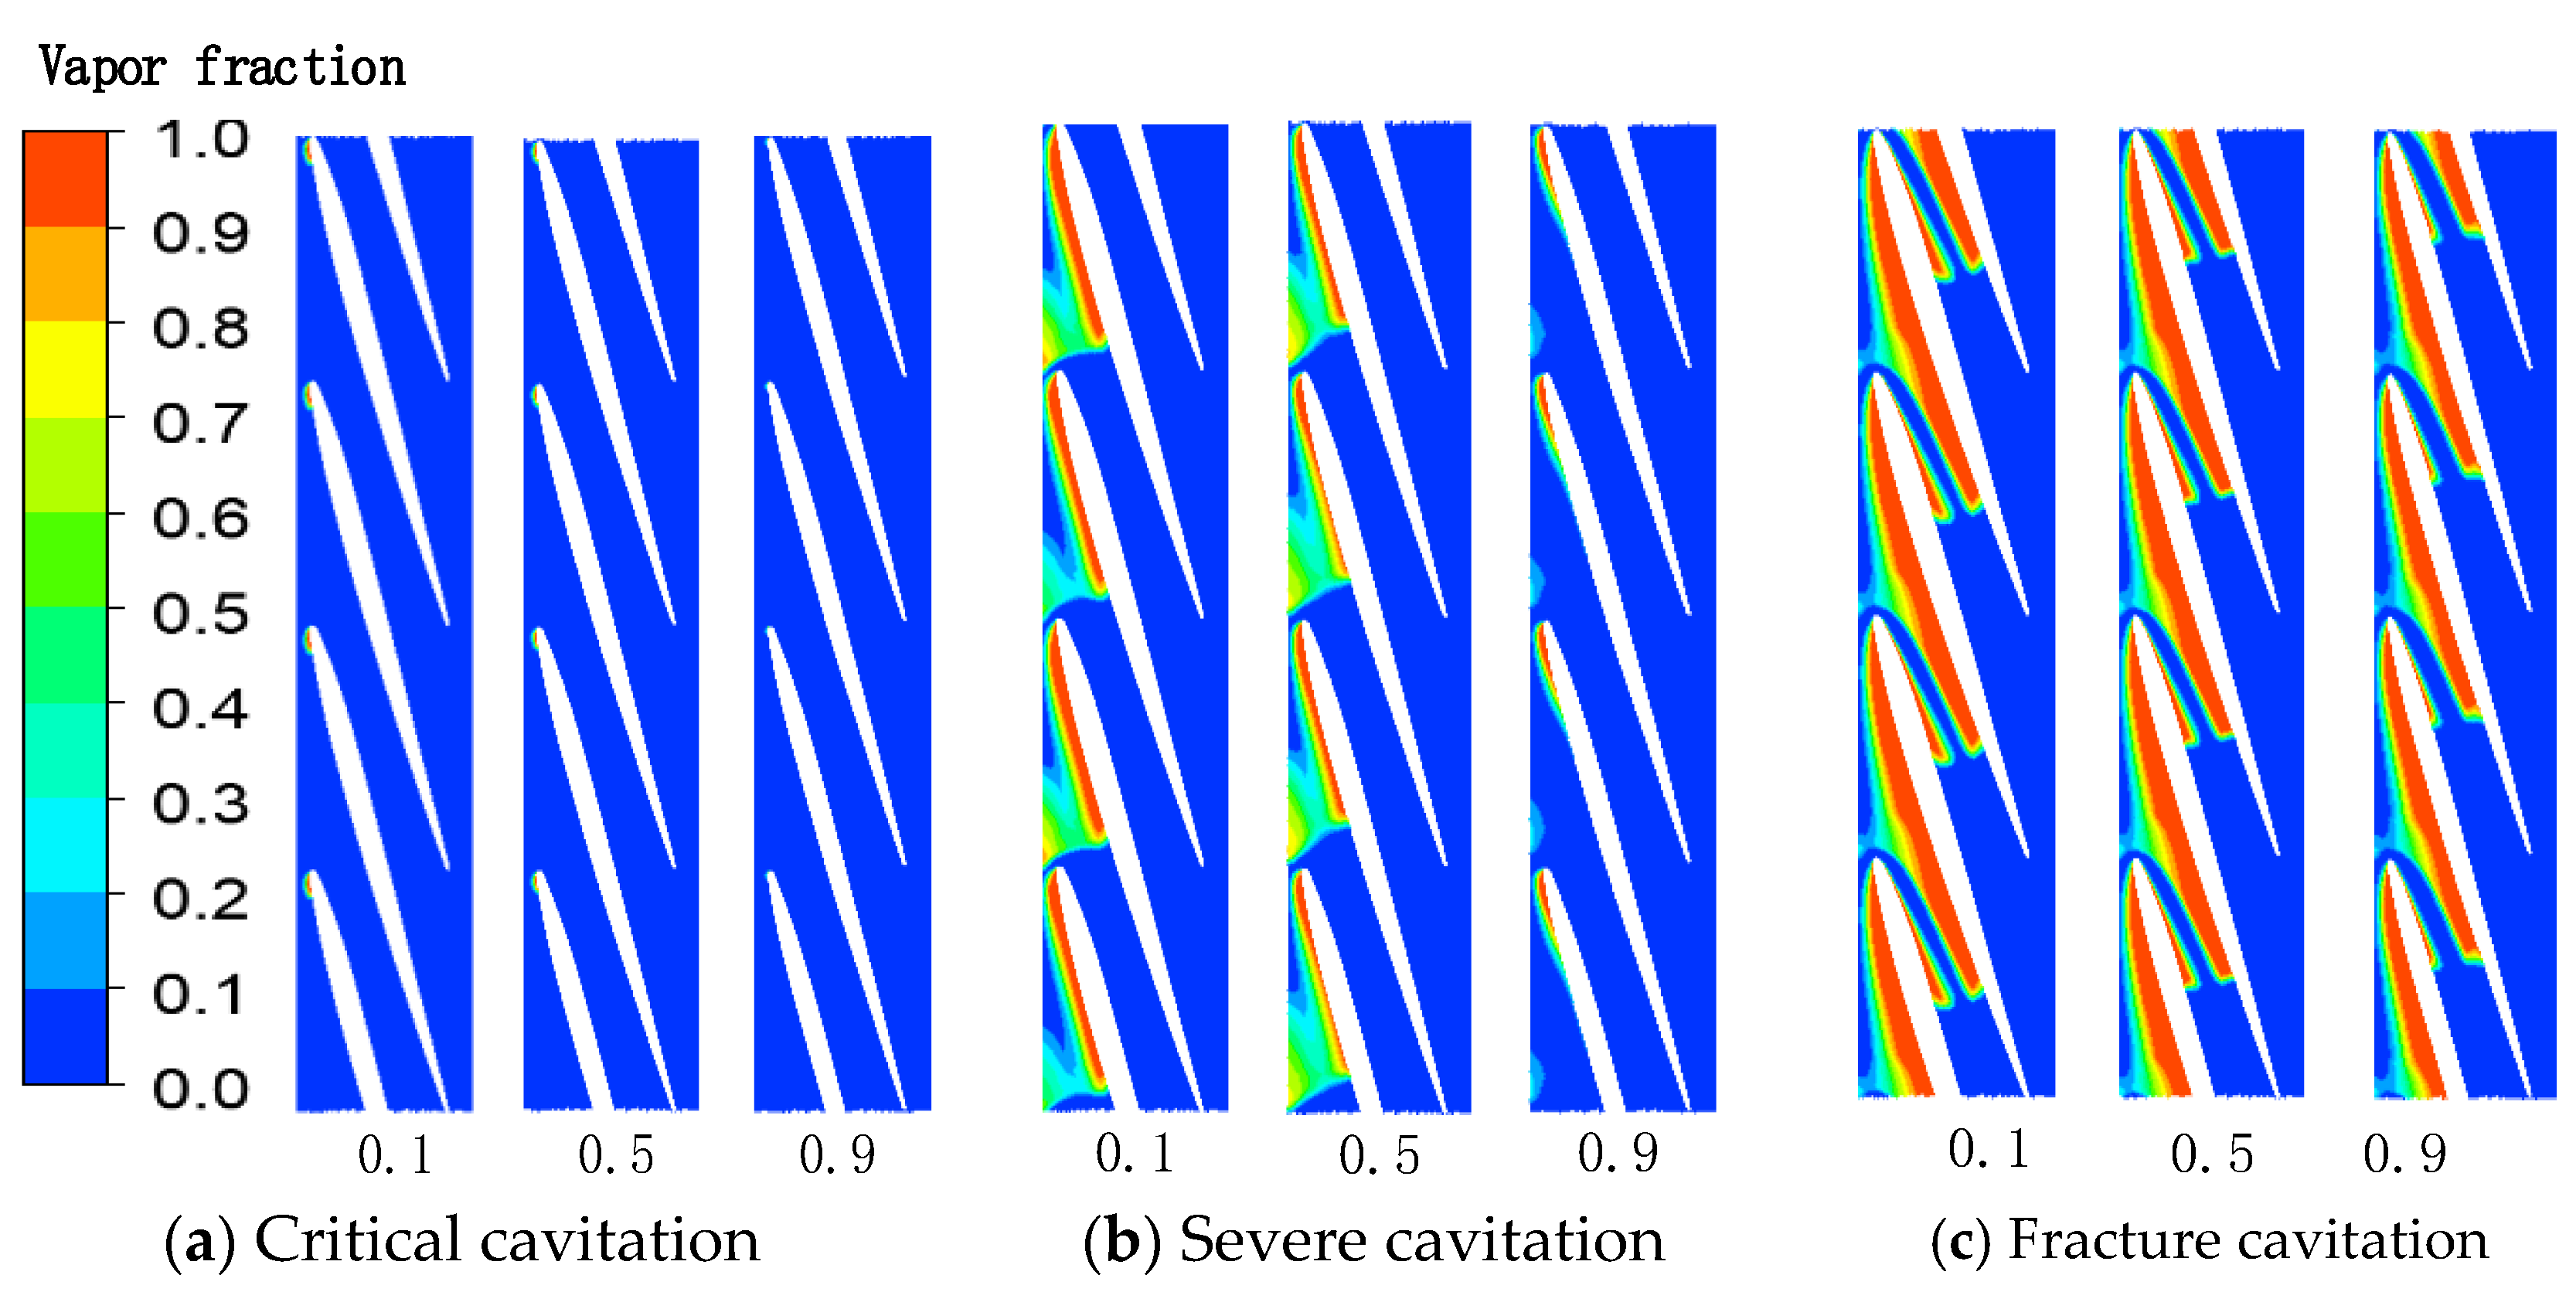
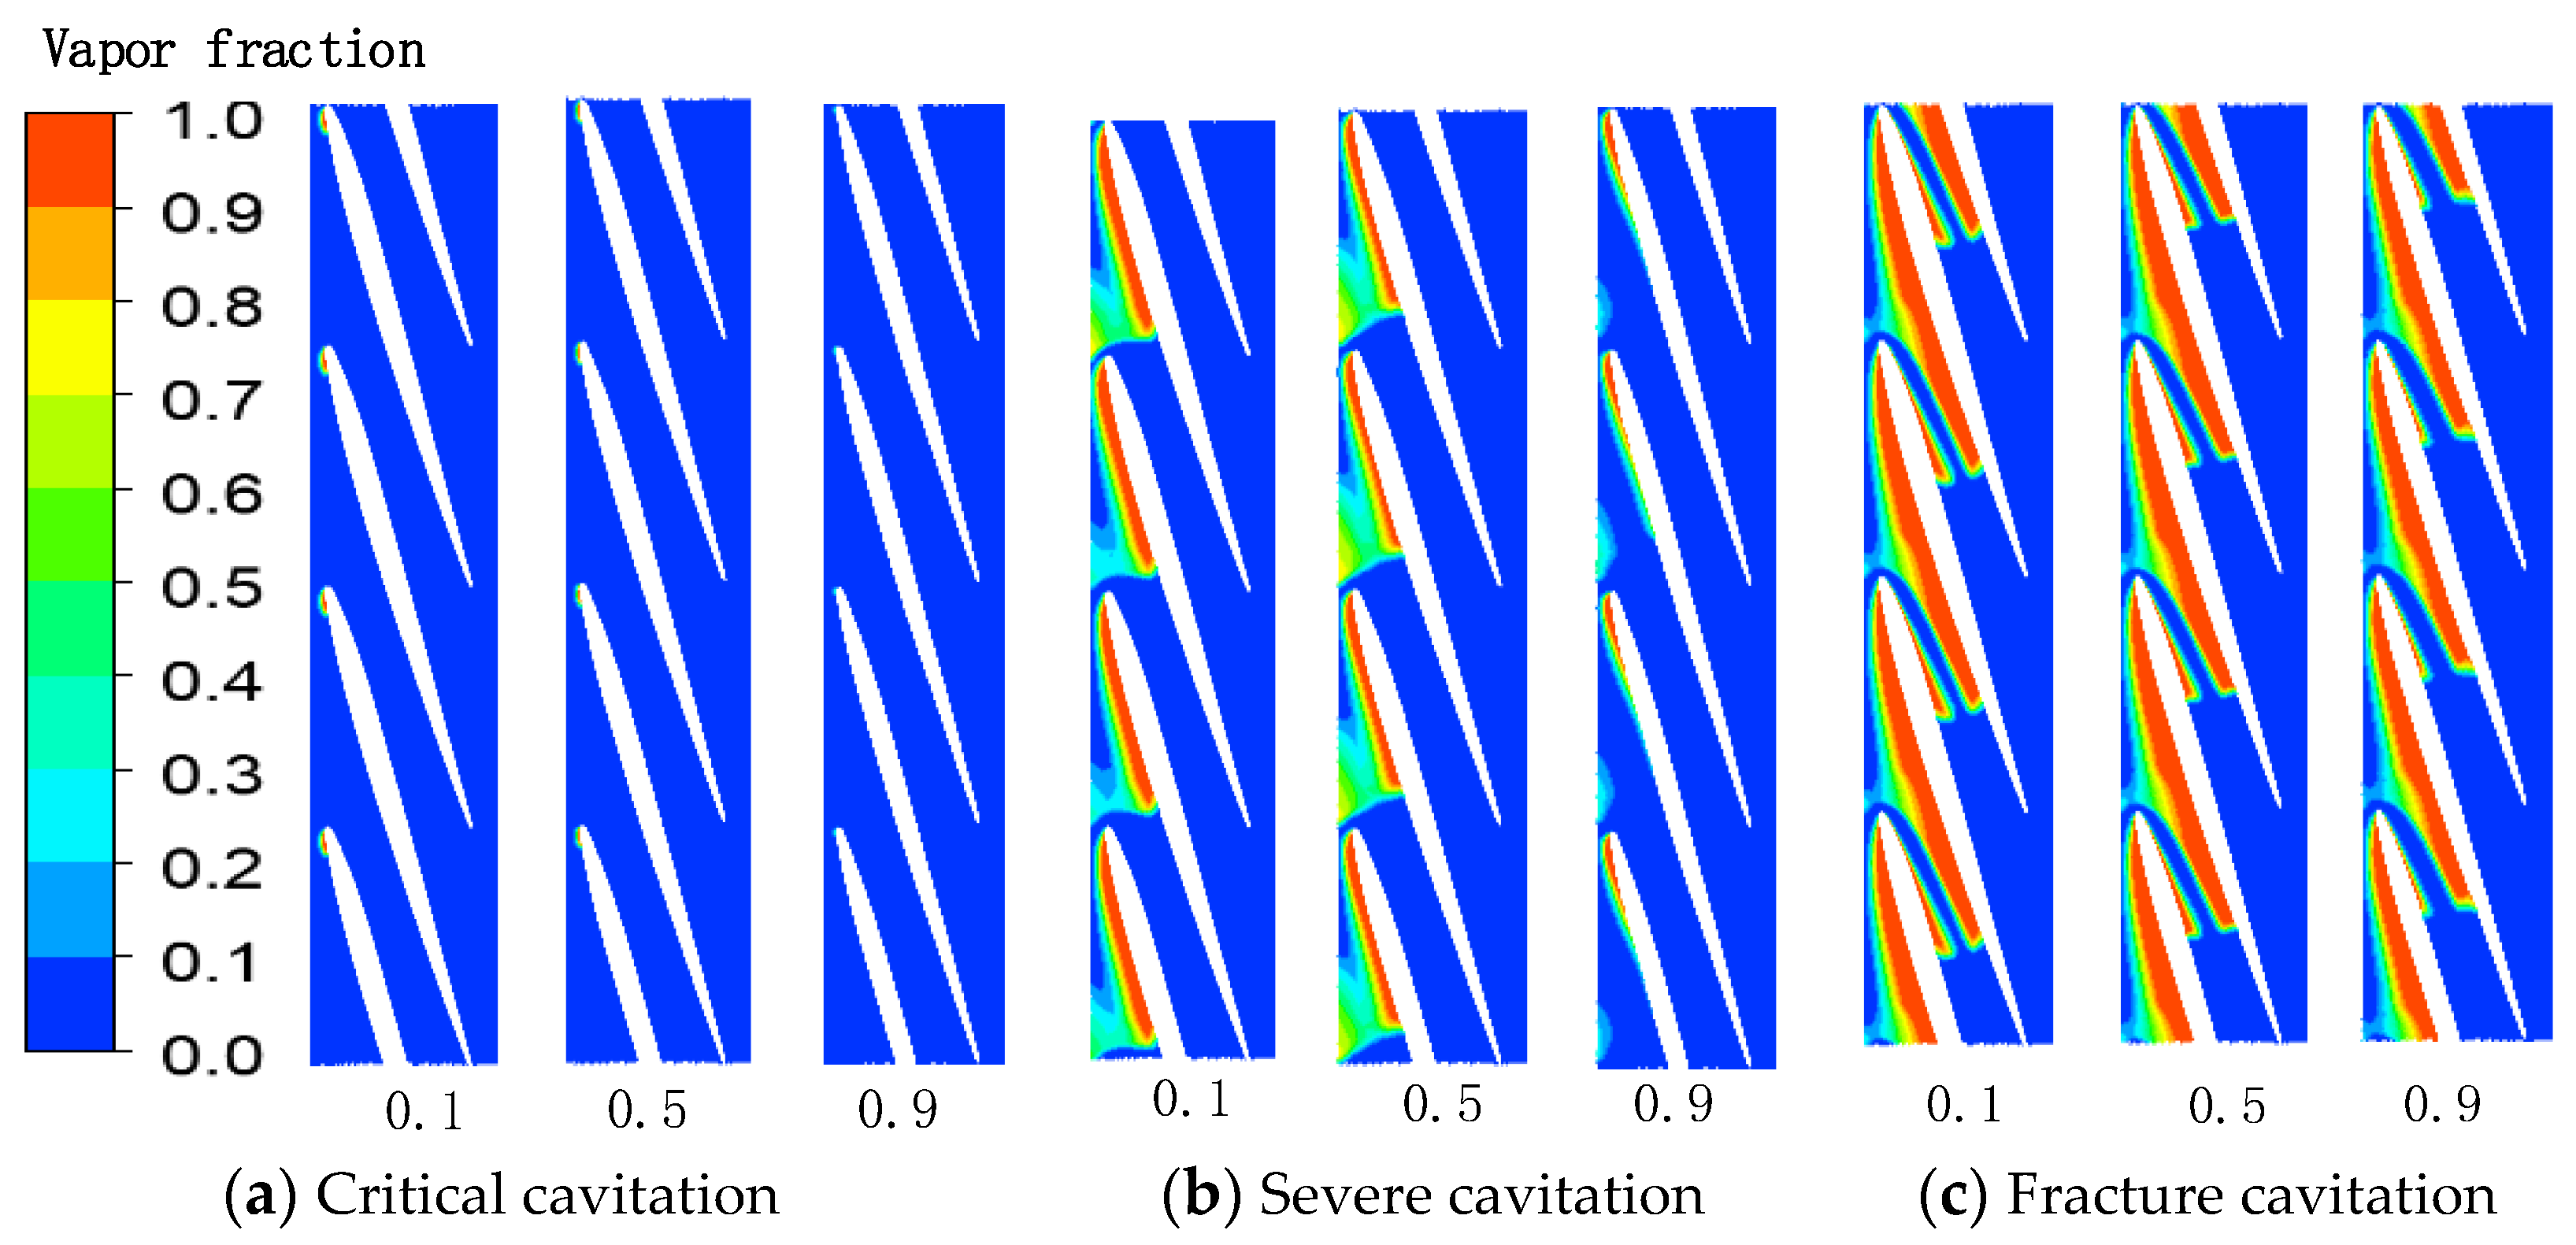
In order to analyze the distribution and development of cavitation in the impeller of multiphase pumps more intuitively, this study specifically analyzed the cavitation distribution laws in the critical cavitation (GVF = 0), severe cavitation (GVF = 0.1), and fracture cavitation (GVF = 0.2) stages. Figure 11, Figure 12 and Figure 13 show the contours of cavitation volume fraction at 0.1, 0.5, and 0.9 blade heights in the impeller passage under different gas phases and different cavitation stages, respectively.
As shown in Figure 12, cavitation first occurred at the inlet of the blade SS and then extended along the blade SS flow line from the inlet to the outlet due to the low pressure at the blade SS in pure water. When the blade SS reached supercavitation, the cavitation phenomenon extended to the blade PS. It was also found that from the critical cavitation stage to the fracture cavitation stage, the cavitation region and cavitation volume fraction in the impeller passage increased gradually. By comparing the distribution of the cavitation volume fraction in the impeller passage at different blade heights, it was found that the cavitation distribution area from the hub to the shroud decreased gradually. As can be seen from Figure 12 and Figure 13, when the GVF was 0.1 and 0.2, with the decrease in the cavitation coefficient σ , the law of cavitation development in the impeller passage was the same and the law of cavitation distribution corresponding to critical cavitation stage and severe cavitation stage was the same as that when the GVF was 0. As the cavitation continued to progress to the fracture cavitation stage, supercavitation did not form on the suction side of the blade, and the bubble was extended to the pressure side of the blade.
Through the above analysis, it was found that under different GVF conditions, with the development of flows, cavitation first appeared at the inlet of the SS of the blade and then extended from the inlet to the outlet along the streamline of the blade. The volume fraction of the cavitation and the distribution range of the cavitation increased gradually. When the cavitation ratio was 0, the cavitation phenomenon completely occupied the SS and then extended to the blade PS. However, under the condition of gas, when the SS of the blade did not reach supercavitation, the cavitation phenomenon continued to extend to the PS of the blade. In addition, by comparing the cavitation distribution in the impeller passage at different blade heights, it was found that from the critical cavitation stage to the fracture cavitation stage, although the cavitation distribution at different blade heights was different, the change trend was roughly the same.
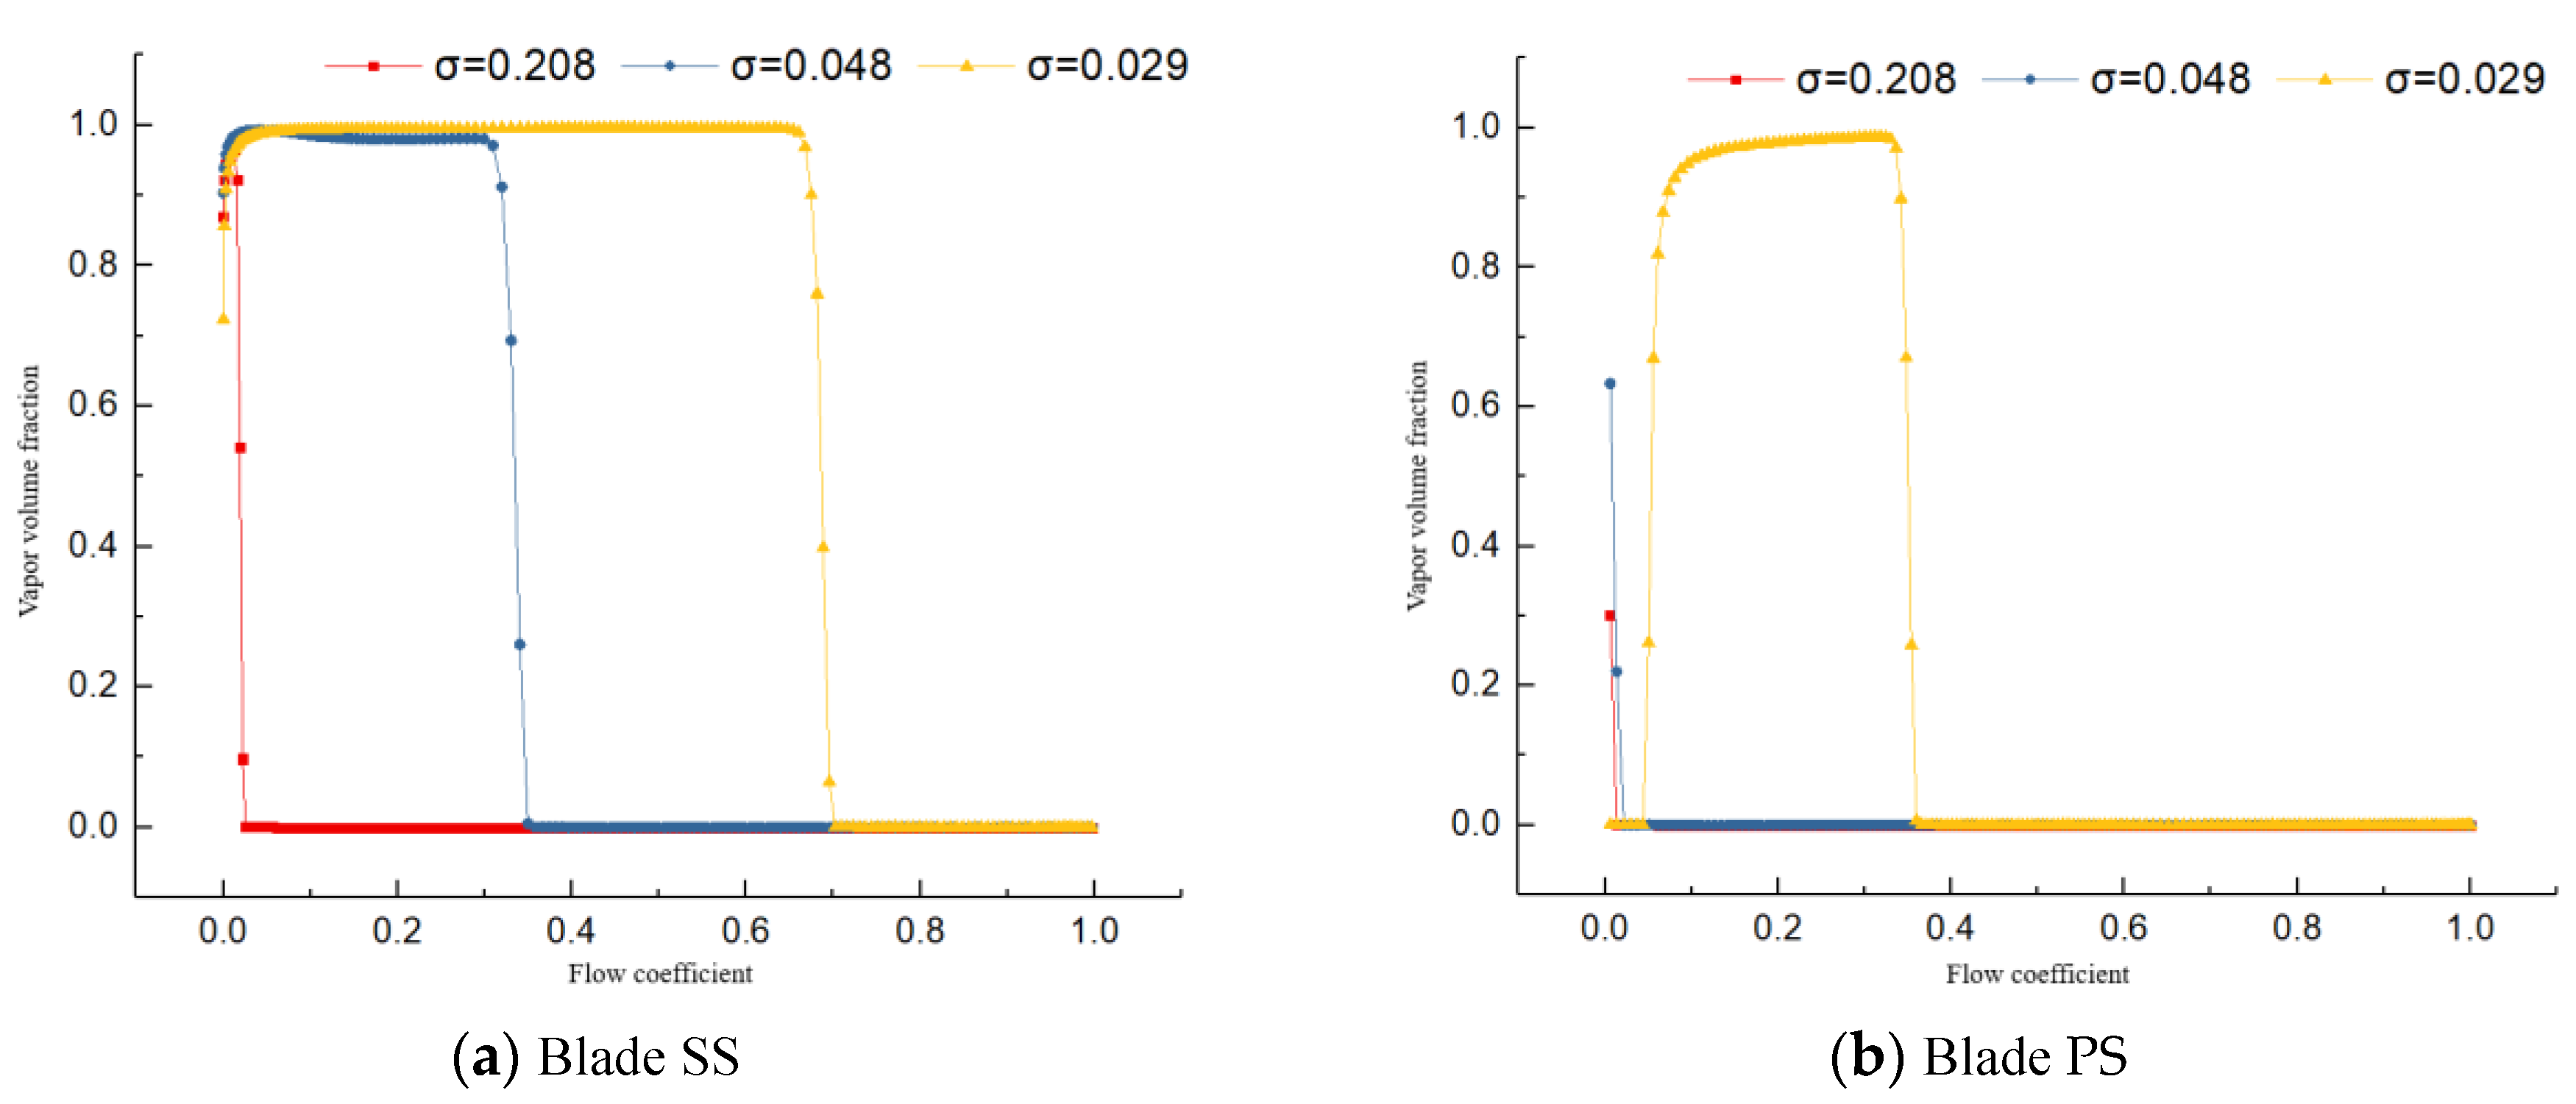
In order to further quantitatively analyze the cavitation volume distribution on the blade surface of the multiphase pump, the cavitation volume fraction at 0.5 blade height on the blade surface of the multiphase pump was quantitatively analyzed. Figure 14, Figure 15 and Figure 16 show the distribution of cavitation volume fraction on the blade PS and SS at 0.5 blade height along the blade streamline direction when GVF = 0, 0.1, and 0.2, respectively.
As can be seen from Figure 15 to Figure 17, at the critical cavitation stage when the GVF was 0, cavitation only appeared at the inlet of the SS of the blade. The cavitation volume fraction was close to 1 only at the inlet and was basically 0 at other positions. When cavitation developed to severe cavitation stage, the cavitation phenomenon extended from the inlet to the relative position of about 0.32 along the flow direction of the SS of the blade. In the relative position of 0–0.32, the volume fraction of the cavitation was about 0.9, and at this time, there was almost no cavitation on the PS. When cavitation continued to develop to the fracture cavitation stage, the SS and PS of the blade were covered by cavitation in the range of 0–0.9 and 0.05–0.62 along the streamline of the blade, respectively, and the cavitation volume fraction in the cavitation area was 1, reaching the state of complete cavitation. When the GVF was 0.1 and 0.2, with the development of cavitation, the distribution of cavitation volume fraction on the blade surface along the streamline direction was almost the same. In the critical cavitation stage, the cavitation phenomenon only appeared at the inlet of the blade SS. In the severe cavitation stage, the cavitation phenomenon extended to the relative position of about 0.35 along the streamlines of the SS of the blade, and the cavitation volume fraction within the cavitation range was close to 1. In the fracture cavitation stage, the SS and PS of the blade were covered by cavitation in the range of 0–0.7 and 0.05–0.38, respectively, along the streamline direction, and the cavitation region almost reached the state of complete cavitation.

6.3. Influence of GVF on the Volume Fraction of Cavitation in Impeller Fluid Domain

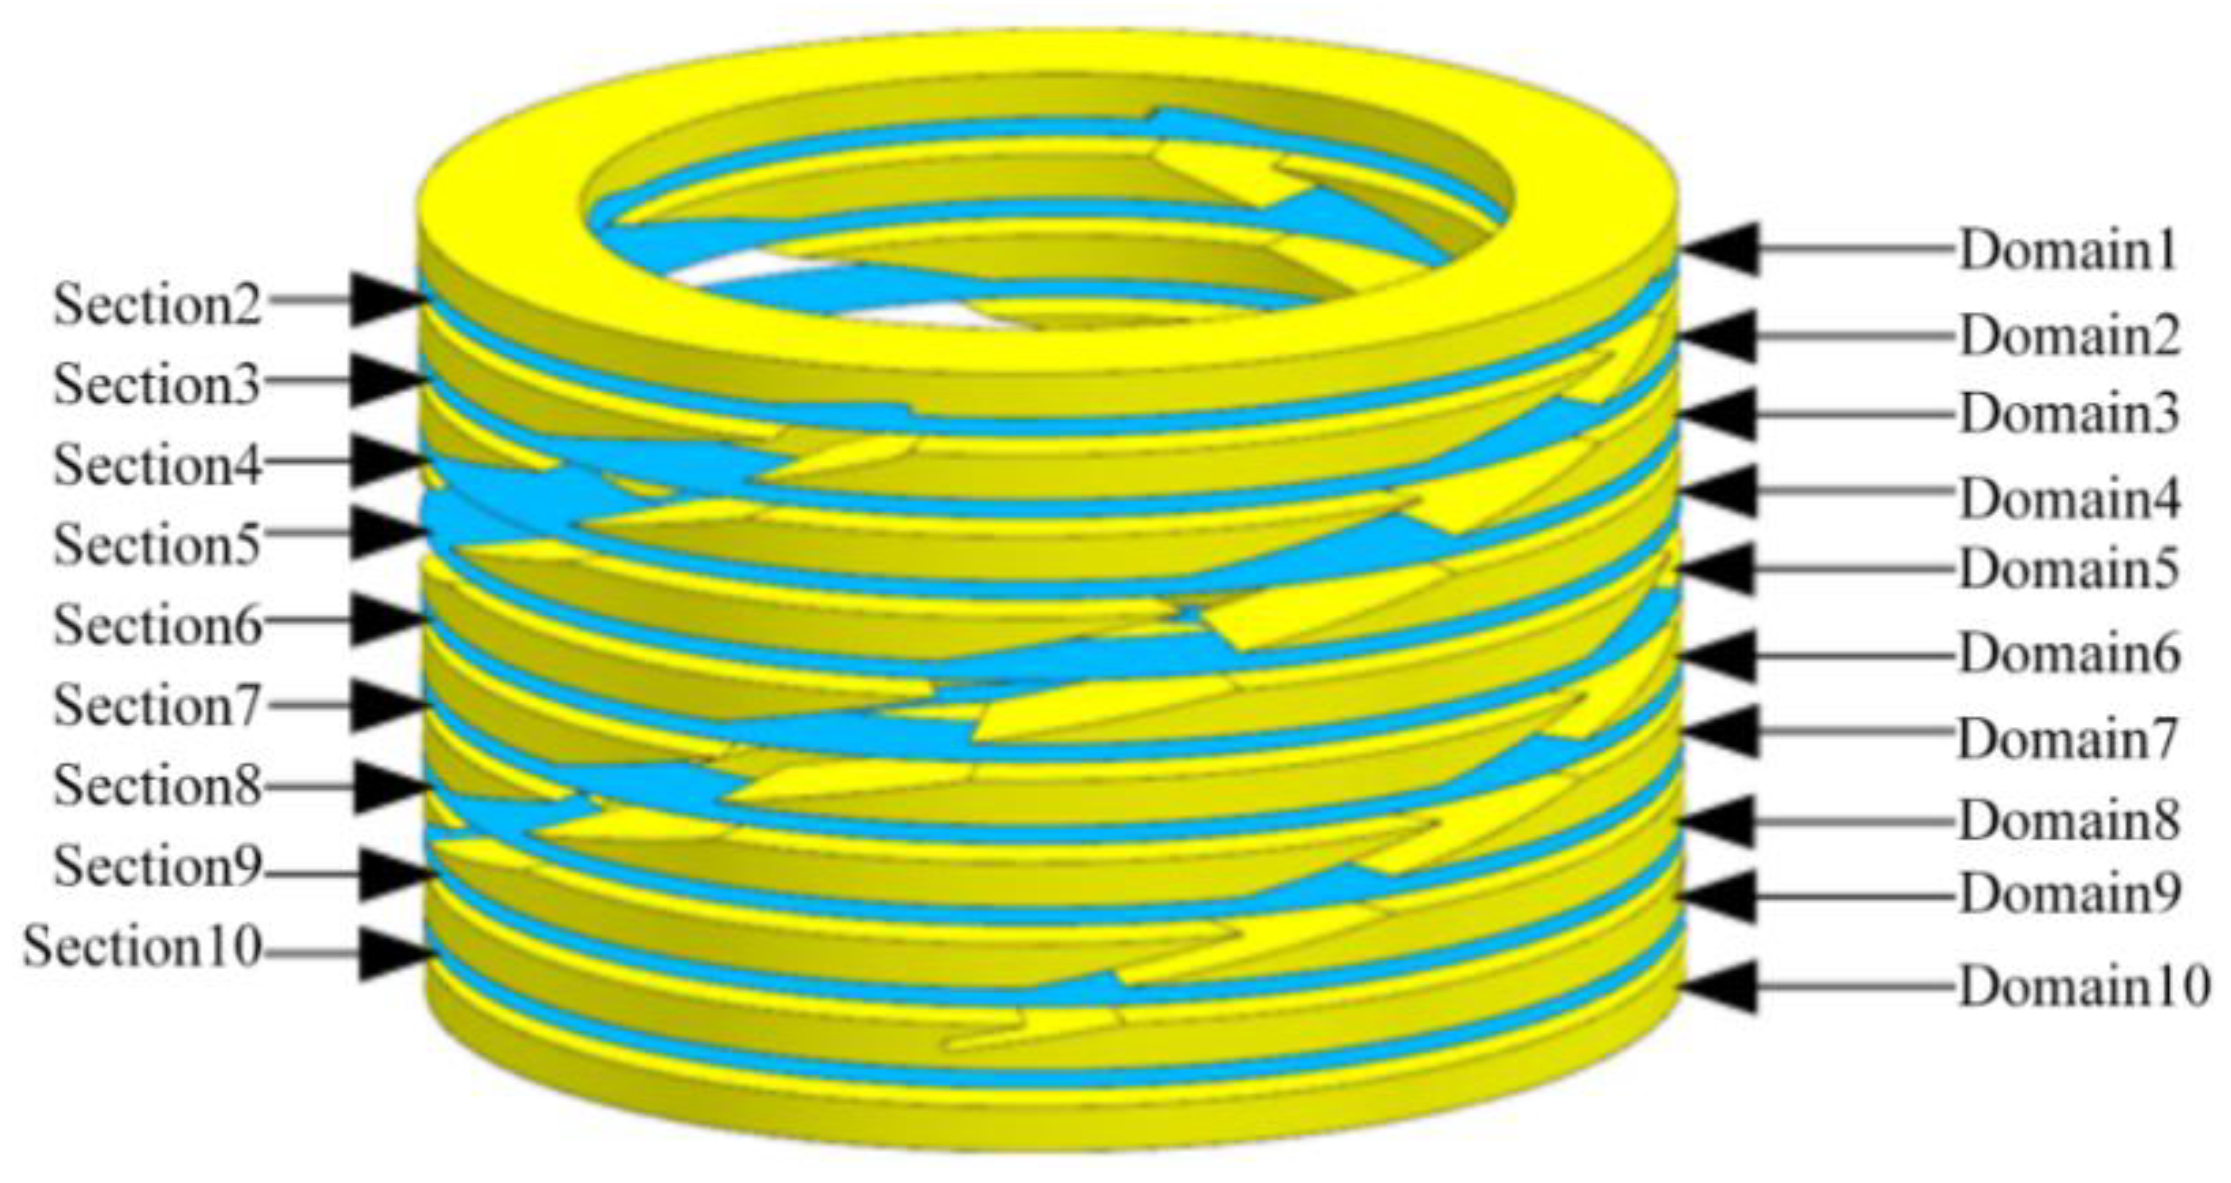
To minutely analyze the influence of gas phase distribution on the cavitation development under different cavitation stages corresponding to each GVF, the impeller fluid domain of the multiphase pump was divided into 10 small regions using 11 sections with equal axial spacing, including the inlet and outlet surface, as shown in Figure 18.
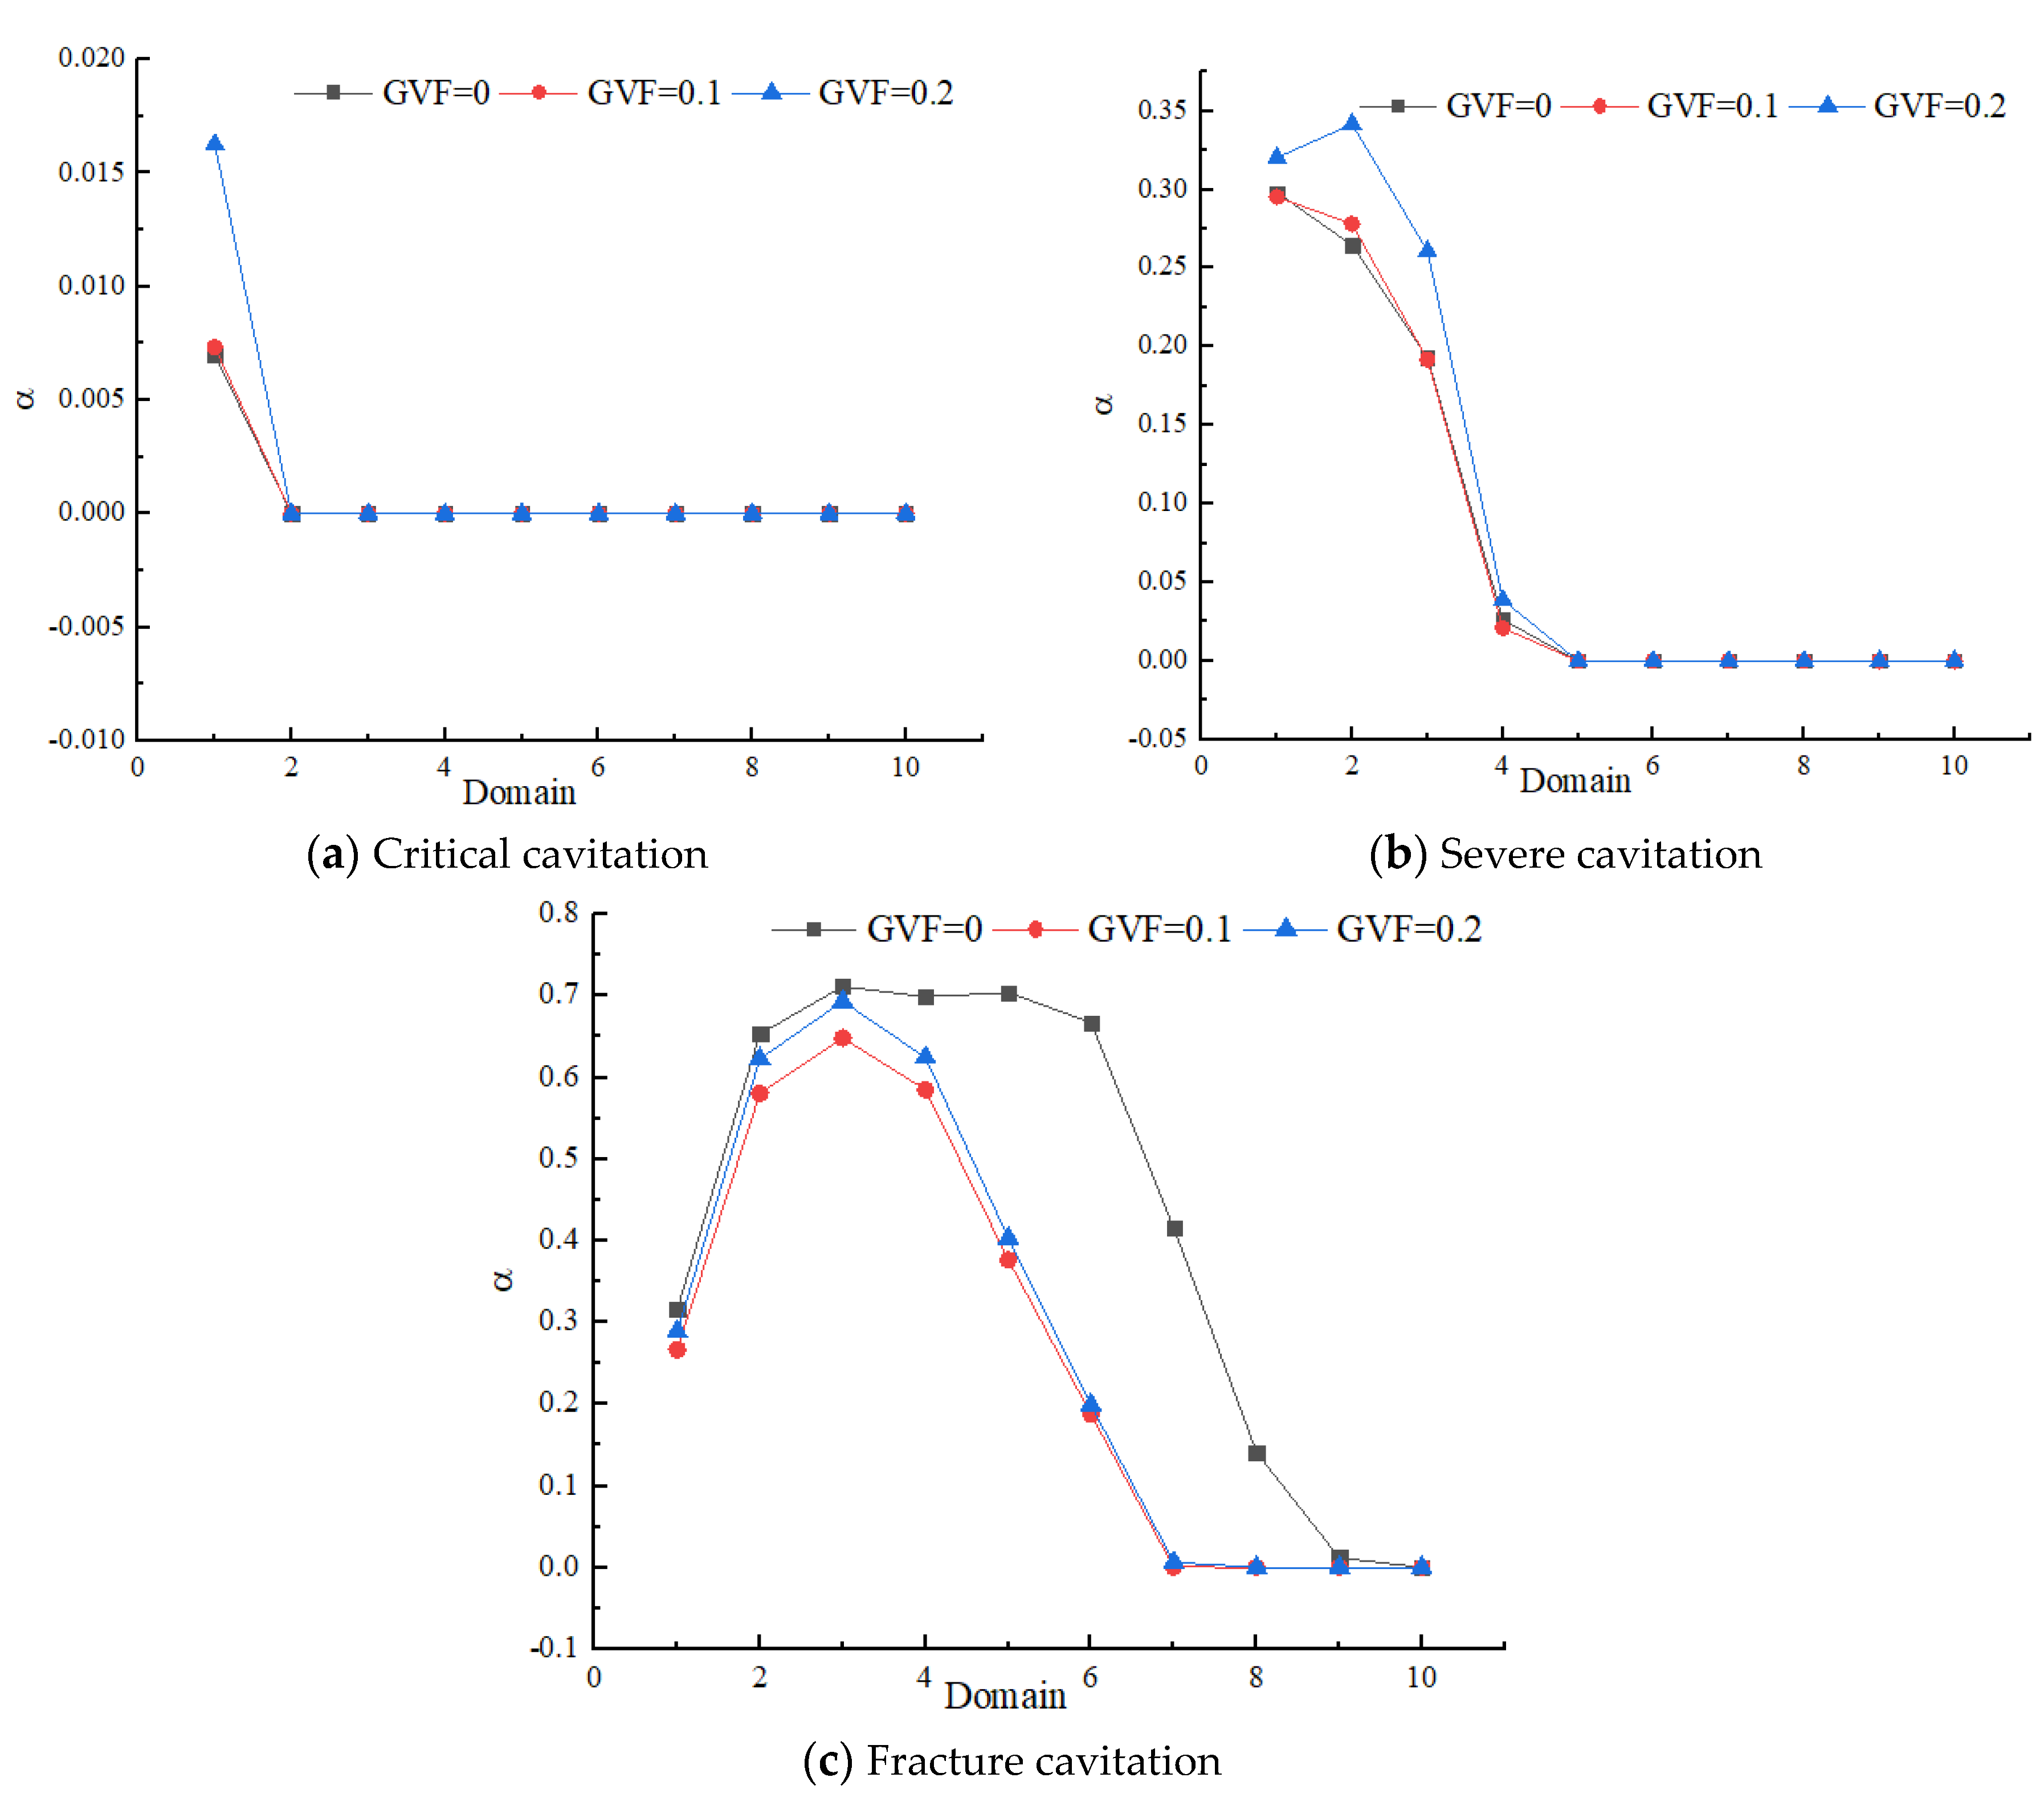
In this study, the cavitation process was divided into three stages: critical, severe, and fracture using a 3, 7.7, and 20% drop in head coefficient as the judging criteria [28]. Figure 19a–c shows the distribution curves of cavitation volume fraction in each fluid domain of the impeller corresponding to each GVF at different cavitation stages. In Figure 8, α stand for the cavitation coefficient σ .
As can be seen from Figure 19, in the critical cavitation stage corresponding to each GVF, the cavitation phenomenon existed only in impeller region 1 (impeller inlet region), and the cavitation volume fraction was relatively low. As the cavitation progressed further to the severe cavitation stage, the phenomenon extended to domain 5 (the front half of the impeller), where the cavitation volume fraction increased faster than the critical cavitation, especially in domains 1 and 2, where the cavitation volume fraction was about 0.3. When the cavitation progressed to the stage of fracturing cavitation, when the GVF was 0, the cavitation phenomenon extended to the entire fluid domain of the impeller. In the range of domains 2–6, when the GVF was 0.1 and 0.2, the bubble volume fraction was up to about 0.7, and the cavitation phenomenon extended to domain 7. In the range of domains 2–4, the bubble accounted for more than 50% of the region. At the same time, it was also found that in the critical cavitation stage, the cavitation volume fraction was the smallest when the GVF value was 0.1 and the largest when the GVF values were 0 and 0.2. The results showed that the effect of GVF on the cavitation volume fraction had no regular distribution. In the severe cavitation stage, the larger the gas phase, the greater the influence of cavitation volume fraction. In the fracture cavitation stage, increasing the gas phase decreased the cavitation volume fraction.
Based on the analysis of the above results, it is clear that GVF has a certain inhibitory effect on the evolution of cavitation development in multiphase pumps, i.e., the cavitation performance of multiphase pumps in gas–liquid two-phase conditions is better than in pure water conditions.

7. Conclusions

(1) At different cavitation stages, with the increase in blade height, the GVF and distribution area decreased gradually. In the same condition, with the development of cavitation stage, the GVF and distribution area in the impeller passage also decreased gradually. The development of cavitation had a great influence on the distribution of the gas phase on the blade surface, especially on the SS.
(2) Under different gas conditions, cavitation first appeared at the inlet of the blade SS. The volume fraction of cavitation was close to 1 only at the inlet and was basically 0 at the other positions. Then, it extended from the inlet to the outlet along the streamline of the blade, and the volume fraction of the cavitation and the distribution range of the cavitation increased gradually. When the GVF was 0, the cavitation phenomenon first fully occupied the blade SS and then extended to the blade PS. Under the working condition of gas, the phenomenon of cavitation in the SS of the blade did not reach supercavitation as it had already extended to the PS. From the critical cavitation stage to the fracture cavitation stage, although the cavitation distribution at different blade heights was different, the change trend was roughly the same.
(3) In the critical cavitation stage corresponding to each GVF, the cavitation phenomenon existed only in the impeller inlet region, and the cavitation volume fraction was low. When cavitation developed to severe cavitation stage, the cavitation phenomenon extended to the front half of the impeller, and the volume fraction of the cavitation in this range increased more than that of the critical cavitation. When cavitation developed to the fracture cavitation stage, the cavitation phenomenon extended to the entire impeller fluid domain when the GVF was 0 and extended to the latter part of the impeller region when the GVF was 0.1 and 0.2.
(4) The existence of the gas phase had a certain inhibitory effect on the development of cavitation in multiphase pumps, that is, the cavitation performance of multiphase pumps in the gas–liquid two-phase condition was better than that in the pure liquid condition.

Author Contributions

Y.X.: literature search, study design, and writing; Z.G.: study design, data collection, and writing; X.L.: experiment design, data collection, manuscript writing; S.T.: data collection, manuscript writing; G.S.: test design, data analysis, and figures; C.G.: literature search, data analysis, and supervision. All authors have read and agreed to the published version of the manuscript.

Funding

This work was supported by the National Natural Science Foundation of China (No. 52279088), the National Science and Technology Major Project of China (2017-II-0007-0021), the Open Research Fund Program of State Key Laboratory of Hydroscience and Engineering (sklhse-2021-E-03, sklhse-2022-KY-06), the State Grid Company LTD Headquarters Management Science and Technology Project (No. 5419-202243054A-1-1-ZN), the State Grid Xinyuan Company LTD Science and Technology Project (No. 52573021N002), the Key Scientific Research Fund of Xihua University of China (Z1510417), the Central Leading Place Scientific and Technological Development Funds for Surface Project (2021ZYD0038), and the National Key Research and Development Program (2018YFB0905200).

Conflicts of Interest

The authors declare that they have no conflict of interest.

References

  1. Barbosa, Y.M.; da Silva, J.A.M.; de Junior, S.O.; Torres, E.A. Deep seawater as efficiency improver for cogeneration plants of petroleum production units. Energy 2019, 177, 29–43. [Google Scholar] [CrossRef]
  2. Viet, N.; Xie, X.; Liew, K.; Banthia, N.; Walng, Q. Energy harvesting from ocean waves by a floating energy harvester. Energy 2016, 112, 1219–1226. [Google Scholar] [CrossRef]
  3. Stuart, S. Multiphase pumping addressed a wide range of operating problems. Oil Gas J. 2009, 101, 59–71. [Google Scholar]
  4. Kim, J.H.; Lee, H.C.; Kim, J.H.; Choi, Y.S.; Yoon, J.Y.; Yoo, I.S.; Choi, W.C. Improvement of hydrodynamic performance of a multiphase pump using design of experiment techniques. J. Fluids Eng. 2015, 137, 081301. [Google Scholar] [CrossRef]
  5. Xiao, W.; Tan, L. Design method of controllable velocity moment and optimization of pressure fluctuation suppression for a multiphase pump. Ocean Eng. 2020, 220, 108402. [Google Scholar] [CrossRef]
  6. Liu, M.; Tan, L.; Cao, S. Method of dynamic mode decomposition and reconstruction with application to a three-stage multiphase pump. Energy 2020, 208, 118344. [Google Scholar] [CrossRef]
  7. Shi, Y.; Zhu, H. Proposal of a stage-by-stage design method and its application on a multi-stage multiphase pump based on numerical simulations. Adv. Mech. Eng. 2021, 13, 1687814020987317. [Google Scholar] [CrossRef]
  8. Suh, J.; Kim, J.; Choi, Y.; Zhang, J.; Zhao, J. Experiment and numerical study of a new generation three-stage multiphase pump. J. Pet. Sci. Eng. 2018, 169, 471–484. [Google Scholar]
  9. Suh, J.; Kim, J.; Choi, Y.; Kim, J.; Joo, W.; Lee, K. Development of numerical Eulerian-Eulerian models for simulating multiphase pumps. J. Pet. Sci. Eng. 2018, 162, 588–601. [Google Scholar] [CrossRef]
  10. Meerakaviyad, D.; Keville, T.; Prakash, A.; Sajid, A.; Hamad, F. Recent progress in multiphase flow simulation through multiphase pumps. Heat Transf. 2020, 49, 2849–2867. [Google Scholar] [CrossRef]
  11. Yu, Y. Analysis of the Model Selection and Application of Oil-gas Multiphase pump. Mod. Chem. Res. 2016, 12, 27–28. [Google Scholar]
  12. Han, W.; Yuan, S.-f.; Quan, H. Analysis on mixed transport characteristics of oil-gas pump. J. Lanzhou Univ. Technol. 2021, 47, 41–46. [Google Scholar]
  13. Liu, M.; Tan, L.; Cao, S. Influence of viscosity on energy performance and flow field of a multiphase pump. Renew. Energy 2020, 162, 1151–1160. [Google Scholar] [CrossRef]
  14. Shi, G.; Liu, Z.; Xiao, Y.; Li, H.; Liu, X. Tip leakage vortex trajectory and dynamics in a multiphase pump at off-design condition. Renew. Energy 2020, 150, 703–711. [Google Scholar] [CrossRef]
  15. Ge, Q. Influence of Different Blade Thickening Method on the Performance of Oil-gas Multiphase Pump. Chin. Hydraul. Pneum. 2020, 158–161. [Google Scholar]
  16. Sano, T.; Wakai, T.; Reclari, M.; Xu, Y.; Cao, S.L. Investigation of internal flow pattern of a multiphase axial pump. IOP Conf. Ser. Earth Environ. Sci. 2019, 240, 062058. [Google Scholar] [CrossRef]
  17. Wang, Q.; Shi, G.; Liu, Z.; Wang, Y. Effect of Flow Rate on Gas Distribution on the First-Stage Impeller of Multiphase Pump. China Pet. Mach. 2021, 49, 75–80. [Google Scholar]
  18. Zhang, J.; Tan, L. Energy Performance and Pressure Fluctuation of a Multiphase Pump with Different Gas Volume Fractions. Energies 2018, 11, 1216. [Google Scholar] [CrossRef] [Green Version]
  19. Zhang, J.; Cai, S.; Hongwu, Z.; Zhang, Y. Experimental investigation of the flow at the entrance of a rotodynamic multiphase pump by visualization. J. Pet. Sci. Eng. 2015, 126, 254–261. [Google Scholar] [CrossRef]
  20. Shi, G.; Liu, Z.; Xiao, Y.; Wang, Z.; Luo, Y.; Luo, K. Energy conversion characteristics of multiphase pump impeller analyzed based on blade load spectra. Renew. Energy 2020, 157, 9–23. [Google Scholar] [CrossRef]
  21. Shi, J.; Tao, S.; Shi, G.; Song, W. Effect of Gas Volume Fraction on the Energy Loss Characteristics of Multiphase Pumps at Each Cavitation Stage. Water 2021, 13, 2293. [Google Scholar] [CrossRef]
  22. Zhang, J.; Cai, S.; Li, Y.; Zhu, H.; Zhang, Y. Visualization study of gas–liquid two-phase flow patterns inside a three-stage rotodynamic multiphase pump. Exp. Therm. Fluid Sci. 2016, 70, 125–138. [Google Scholar] [CrossRef]
  23. Patil, A.; Gudigopuram, S.; Ayyildiz, B.; Delgado, A.; Morrison, G. Performance Evaluation and Dimensional Analysis of Multistage Helico-axial Pump for Two-Phase Flow. Int. J. Turbomach. Propuls. Power 2019, 4, 22. [Google Scholar] [CrossRef] [Green Version]
  24. Xu, Y.; Cao, S.; Sano, T.; Wakai, T.; Reclari, M. Experimental Investigation on Transient Pressure Characteristics in a Helico-Axial Multiphase Pump. Energies 2019, 12, 461. [Google Scholar] [CrossRef] [Green Version]
  25. Zhang, J.Y.; Cai, S.J.; Zhu, H.; Yang, K.; Qiang, R. Numerical Investigation of Compessible Flow in a Three-stage Helico-axial Multiphase Pump. Trans. Chin. Soc. Agric. Mach. 2014, 45, 89–95. [Google Scholar]
  26. Zheng, X.; Liu, L.; Guo, P.; Hong, F. Numerical investigation of three-dimensional cavitating performance of NACA66 hydrofoil base on different cavitation models. Chin. J. Hydrodyn. 2018, 33, 199–206. [Google Scholar]
  27. Leroux, J.; Astolfi, J.; Billard, J. An experimental study of unsteady partial cavitation. J. Fluids Eng. 2004, 126, 94–101. [Google Scholar] [CrossRef]
  28. Liu, X.; Hu, Q.; Shi, G.; Zhao, Q. Cavitation characteristic of multiphase pump at low flow rate. J. Drain. Irrig. Mach. Eng. 2018, 36, 15–20. [Google Scholar]
Figure 1. Outline dimensions of impeller.
Jmse 10 01795 g001
Figure 2. Three-dimension model of multiphase pump.
Jmse 10 01795 g002
Figure 3. Mesh generation of impeller fluid domain.
Jmse 10 01795 g003
Figure 4. The validation of mesh independence.
Jmse 10 01795 g004
Figure 5. The multiphase pump test system.
Jmse 10 01795 g005
Figure 6. High-speed photography.
Jmse 10 01795 g006
Figure 7. Numerical method verification.
Jmse 10 01795 g007
Figure 8. The distribution of air fraction within flow path of impeller at different blade heights under GVF = 0.1 condition.
Jmse 10 01795 g008
Figure 9. The distribution of air fraction within flow path of impeller at different blade heights under GVF = 0.2 condition.
Jmse 10 01795 g009
Figure 10. The distribution of air fraction on the blade surface at 0.5 blade height under GVF = 0.1 condition.
Jmse 10 01795 g010
Figure 11. The distribution of air fraction on blade surface at 0.5 blade height under GVF = 0.2 condition.
Jmse 10 01795 g011
Figure 12. The distribution of bubble within impeller passage at different blade heights under GVF = 0 condition.
Jmse 10 01795 g012
Figure 13. The distribution of bubble within impeller passage at different blade heights under GVF = 0.1 condition.
Jmse 10 01795 g013
Figure 14. The distribution of bubble within impeller passage at different blade heights under GVF = 0.2 condition.
Jmse 10 01795 g014
Figure 15. The distribution of vapor volume fraction on blade surface at 0.5 span under GVF = 0 condition.
Jmse 10 01795 g015
Figure 16. The distribution of vapor volume fraction on blade surface at 0.5 span under GVF = 0.1 condition.
Jmse 10 01795 g016
Figure 17. The distribution of vapor volume fraction on blade surface at 0.5 span under GVF = 0.2 condition.
Jmse 10 01795 g017
Figure 18. The division of impeller domain.
Jmse 10 01795 g018
Figure 19. The distribution curves of cavitation volume fraction in each fluid domain of the impeller corresponding to each GVF at different cavitation stages.
Jmse 10 01795 g019
Table 1. Design parameters.
ParametersSymbolValueUnit
Design flow rateQd110m3/h
Design speedN3000rpm
Inlet hub ratio d 1 0.79(-)
Outlet hub ratio d 2 0.74(-)
Impeller diameterD230.5mm
Blade numberZ4(-)
Blade wrap angle φ 0 179.6°
Publisher’s Note: MDPI stays neutral with regard to jurisdictional claims in published maps and institutional affiliations.