Abstract
When the multiphase pump is running, the internal medium often exists as bubble flow. In order to investigate the bubble occurrence characteristics in the pressurization unit of the multiphase pump more accurately, this paper couples computational fluid dynamics (CFD) with a population balance model (PBM) to investigate the bubble size distribution law of the multiphase pump under different operating conditions, taking into account the bubble coalescence and breakup. The research shows that the mean bubble size in the impeller domain gradually decreases from 1.7013 mm at the inlet to 0.6179 mm at the outlet along the axis direction; the average bubble diameter in the diffuser domain fluctuates around 0.60 mm. The bubbles in the impeller region gradually change from the trend of coalescence to the trend of breakup along the axial and radial directions, and the bubbles in the diffuser tend to be broken by the vortex entrainment. The bubble size development law is influenced by the inlet gas volume fraction (IGVF) and the rotational speed, showing a more obvious rule, where the gas phase aggregation phenomenon enhanced by the increase in IGVF promotes the trend of bubble coalescence and makes the bubble size gradually increase. The increased blade shearing effect with the increase in rotational speed promotes the trend of bubble breakup, which gradually reduces the size of the bubbles. In addition, increasing the bubble coalescence probability is a key factor leading to changes in bubble size; the bubble size development law is not very sensitive to changes in flow, and the bubble size is at its maximum under design conditions. The research results can accurately predict the performance change of the multiphase pump and provide technical guidance for its safe operation and optimal design.
1. Introduction
With the exhaustion of resources and the increasing demand for energy in human society, the energy problem is becoming increasingly prominent. The active and efficient development of energy has become an inevitable trend of social development. People’s continuous exploration has found that the exploitation of deep-sea oil and gas resources have great potential, and it is a difficult problem to improve the exploitation of offshore oil and gas [1,2]. In deep-sea resource extraction technology, multiphase pumps are rapidly becoming a hot spot for research at home and abroad because of their compact structure, wide operating conditions and resistance to wear and tear [3]. However, in actual operation, under complex flow conditions, the generation, change and movement of air bubbles in the pump impeller flow passage make gas–liquid separation and bubble coalescence, breakup and other phenomena often occur. These conditions can lead to a significant reduction in the efficiency and head of the multiphase pump, to extremely unstable operation and, in serious cases, to mechanical failure. The accurate prediction of the physical parameters such as volume fraction, bubble number density and bubble size in complex bubbly flows is extremely important for industrial equipment safety and optimizing analysis in the engineering field.
Due to the particularity of the spiral structure and the complexity of the internal medium, the internal flow state of the multiphase pump studied in this paper is very complex, so the flow mechanism in the pump has not been clearly revealed. In order to accurately grasp the internal flow state, high-speed photography, visualization experiments and other technologies quickly become the focus of research in this domain. Alberto et al. [4] observed in a visualization experiment that the shear force breaks the bubbles and reduces the average diameter of the bubbles under the operating conditions of high rotational speed, making the two-phase distribution more uniform. Zhang et al. [5] set a buffer homogenizer that can evenly mix two gas–liquid phases at the front end of the inlet of the multiphase pump, and explored the variation rule of the gas–liquid two-phase flow pattern and bubble diameter in the inlet section with rotational speed and IGVF through visual tests. Wu et al. [6] studied the diameter range of bubbles inside the diffuser of the down-spraying liquid–gas jet pump using a sampling method and camera method and obtained the internal gas–liquid two-phase flow and bubble distribution characteristics. Mandal et al. [7,8] used high-speed photography technology to photograph the flow diagram of bubbles and deeply analyzed the size distribution and characteristics of bubbles in the jet bubble column. Shao et al. [9] conducted a visualization experiment with a high-speed camera to study the gas–liquid two-phase flow pattern inside the centrifugal pump; four flow types were obtained: separated bubble flow, bubble flow, airbag flow and gas–liquid separation flow. Patel et al. [10] used high-speed photography technology to find that there were two special flow patterns in the impeller passage of the centrifugal pump. Bubbles flowed in the form of small bubbles in the first flow pattern, while in the second flow pattern, the aggregation of small bubbles led to the formation of large fixed bubbles at the impeller inlet, resulting in a significant decrease in pump head.
At the same time, many scholars have also done a lot of research in numerical calculation using CFD, a powerful tool for studying rotating machinery. Zhang et al. [11] established a non-uniform bubble model, and the study showed that a clear flow separation phenomenon could be observed at a higher gas volume, and the performance curve of the pump was more consistent with the experimental measurement data. Caridad et al. [12] used the two-fluid model and the standard k-ε model to carry out CFD simulation of the impeller flow passage under gas–liquid two-phase flow conditions and analyzed the effect of the bubble diameter when the head decreased. The results show that the larger the bubble diameter was, the more serious the head drop was. Schrage et al. [13] performed analytical and experimental studies on the annular motion of isothermal bubbles in liquids rotating at angular velocities ranging from 500 to 1500 rpm. In the case of only considering a single bubble, the particle dynamics equations were used to estimate the bubble motion. Shi et al. [14] used a combination of numerical calculation and experimental verification to analyze in detail the gas phase distribution in the oil–gas multiphase pump and the vortex distribution in the flow passage. The results show that, at different GVFs, the degree of gas phase aggregation gradually increases from the shroud to the hub, and the maximum gas-phase volume distribution area is mainly concentrated in the area near the hub of the diffuser inlet and the middle area of the diffuser outlet. Zhang et al. [15] studied the distribution characteristics of pressure and GVF at all stages in the pump by combining numerical simulation and visualization experiments and discovered the movement of cavitation in the impeller through unsteady simulation. Zhang et al. [16] embedded it into ANSYS-CFX software using secondary development technology and discussed in detail the variation of the internal flow field and bubble diameter of the multiphase rotating pump in combination with the results of the numerical simulation test. It was found that the bubbles in the impeller move along a similar path from the pressure surface of the blade to the suction surface of the blade, where they accumulate.
It is essential to explore the evolution process of bubble size in the multiphase pump to master the two-phase distribution characteristics of the multiphase pump. However, at present, the prediction of bubble diameter in the multiphase pump mostly stays at a fixed bubble size. Obviously, the accuracy of taking the bubble in the multiphase pump as a constant value needs to be improved. In recent years, the CFD-PBM model has been combined, with the ability of CFD to predict the flow field and the advantages of the PBM model to calculate the particle size distribution and variation of discrete phases, namely, the CFD-PBM model. This model takes the local GVF, gas and liquid-phase velocity fields, turbulent kinetic energy and other local flow field data calculated from the two-phase flow model in CFD and provides them to the PBM, which then calculates the distribution of bubbles of different sizes based on the bubble coalescence and breakup model. Finally, the obtained bubble size distribution is corrected for the gas–liquid interaction force and turbulent kinetic energy in CFD, thus forming a complementary closed calculation process. The CFD-PBM model provides a feasible scheme for the study of droplet group dynamics in the multiphase flow of rotating fluid machinery under different hydrodynamic conditions, which makes the simulated flow field more authentic. Luo et al. [17,18] found that the collision between bubbles in the gas–liquid phase is mainly caused by the random motion of turbulent vortices, simplifying the calculation model of collision frequency, and proposed that the energy of turbulent vortices of the same size obeys the index distribution; they used the turbulent kinetic energy of the vortex greater than the increment of surface energy when the bubble is divided into two as the measure of droplet breakup, so as to establish the breakup model. Wang et al. [19] proposed a coupled CFD-PBM simulation based on the combination of the two-fluid model and the population balance model, and quantitatively calculated the bubble size distribution in the uniform and non-uniform bubbling zone in the gas–liquid reactor. Xu et al. [20] used the CFD-PBM coupling method to simulate the particle gas–liquid two-phase flow in the bubble column, introduced a more accurate model of drag force coefficient between the gas and the liquid phase, and studied the GVF, bubble size distribution and gas–liquid two-phase velocity field distribution in the bubble column under different superficial gas velocities. Lü et al. [21] studied the influence of droplet coalescence and breakup on the separation performance of hydrocyclone by using the CFD-PBM numerical simulation method and found that increasing the volume of the oil phase promotes the coalescence of oil droplets, and the optimal processing capacity exists for a hydrocyclone with a fixed size. Zhang et al. [22] used the CFD-PBM model to investigate the effects of superficial gas velocity, temperature and GVF on the average GVF, GVF of large and small bubbles, bubble diameter and bubble size distribution in the heated and pressurized bubble column. The results show that the change of temperature mainly affects the coalescence and breakup of bubbles in the tower, and the effect of temperature on its fluid behavior is explained by the mechanism of coalescence and breakup. Zhu et al. [23] carried out numerical simulation of the horizontal decanter centrifuge based on the CFD-PBM model; the distribution characteristics of crystal particles in the flow field accompanied by salting out in the horizontal decanter centrifuge were revealed, and the particle size distribution, group fraction distribution and concentration distribution of the crystal particles in the flow field accompanied by salting out in the horizontal decanter centrifuge were obtained. Chen et al. [24] compared and analyzed the numerical simulation results of the traditional fixed bubble diameter and CFD-PBM coupling model in an electric submersible pump and verified the effectiveness of the coupling model in a two-phase flow of the electric submersible pump through experiments. It was found that a large amount of gas accumulates on the suction side of the impeller after the phase separation phenomenon occurs. Ge et al. [25,26] verified the conclusion of Chen [24] through experiments, showing that the realizable k-ε turbulence model and Luo and Svendsen’s coalesce broken model can better correct the head calculation in centrifugal pump simulations. The results show that, with the increase in IGVF, more bubbles accumulated in the impeller than in the volute. The small gas pockets accumulated in the impeller and formed large gas masses around the inlet of the impeller, leading to the “surge” of the pump.
Based on the above literature, it has been found that the CFD-PBM model has been applied in many industrial fields. In the field of multiphase pumps, although many scholars have studied the flow field and flow characteristics in the multiphase pump under gas–liquid two-phase flow conditions, the evolution process of bubbles in the pump is rarely mentioned due to the complex flow inside the multiphase pump. Therefore, the accuracy of the study of gas–liquid flow characteristics in the pump needs to be improved, and the flow mechanism and bubble evolution process in the pump need to be revealed. Based on the CFD-PBM model, this paper studies the flow characteristics in the multiphase pump and clarifies the evolution mechanism of bubble size distribution, coalescence and breakup in the flow passage, aiming to provide reference for improving the gas–liquid mixed-transport performance of the multiphase pump.
2. Mathematical Model
2.1. Multiphase Flow Model
The Eulerian–Eulerian model is used in the simulation of the gas–liquid system in this paper. The model can not only reflect the flow distribution and internal flow characteristics of the multiphase pump well, but also has high accuracy and stability in the calculation results. The governing equation is as follows.
Mass conservation equation:
where is the volume gas holdup; g is the gas phase; l is the liquid phase; and Q is the volume flow, m3/s, respectively.
Momentum conservation equation:
where is the rotating force of the impeller; and , and are, respectively, drag, virtual mass force and lift force.
2.2. Interphase Force Model
The introduction of interphase forces makes the Eulerian–Eulerian model a closed system, and the choice of interphase forces is very important for the accuracy of the simulation results. In this paper, only the drag force, lift force and virtual mass force with large force between gas and liquid are considered.
Drag is the most important force between gas and liquid phases, and its magnitude reflects the intensity of the velocity slip phenomenon caused by different densities of multiphase medium in the pump. Its specific expression is as follows:
where is the mean bubble diameter, m; and is the drag coefficient, whose value determines the precision of the drag model. Zhang et al. [27] modified the Schiller–Naumann drag model widely used in multiphase pumps to make the prediction of various conditions more accurate, and the coefficient of the drag model is:
Lift is the pressure gradient in the multiphase pump perpendicular to the bubble streamline. In this paper, the lift model established by Legendre et al. [28] is suitable for small-sized spherical fluid particles, and its expression is:
where is the lift coefficient.
Virtual mass force is the extrusion force generated by the acceleration caused by the density difference between the two gas–liquid phases in the multiphase pump. Maxey M’s [29] virtual mass force model is adopted in this paper:
where is the virtual mass force coefficient.
2.3. Population Balance Model
The PBM is an effective method to describe the bubble size distribution in a multiphase pump, considering the particle size variation caused by coalescence and breakup. In the gas–liquid two-phase system, its expression is:
where is the volume of the mother bubble; is the sub-bubble volume; is the bubble number density function with volume ; is the bubble coalescence rate; and is the sub-bubble distribution function with volume . The terms “birth due to coalescence”, “death due to coalescence”, “birth due to breakup” and “death due to breakup” represent the birth and death rate of a bubble with a diameter of d.
2.3.1. Bubble Breakup Model
In this paper, it is assumed that the bubble only breaks in two, and the breakup model of Luo et al. [18] is adopted. Under this model, only when the energy of the collision between the bubble and the turbulent vortices meets certain conditions is breakup caused, and its specific expression is as follows:
where is the volume ratio of one of the sub-bubbles to the mother bubbles after the bubbles are split in two; is the probability that the energy can cause bubble breakup when the size of inflow vortex is ; is the frequency of bubble breakup in the turbulent vortex size range of , the frequency of bubble breaking; is the average collision frequency between bubble diameter d and size in unit volume; and is the number density of turbulent vortices of size to .
The probability of bubble breaking to generate bubble is:
The final form of probability that any bubble is broken to form sub-bubble is:
2.3.2. Bubble Coalescence Model
In the same way as above, Luo et al.’s [17] coalescence model is adopted in this paper. Under this model, the product of collision frequency and efficiency between bubbles is the coalescence probability, whose expression is as follows:
where is a constant; ; is the Weber number; is the surface tension; is the collision frequency of the two groups of bubbles with volume and ; and is the probability that bubbles can coalesce after collision.
3. Numerical Methods
3.1. Computing Domain Model
In this paper, the single-stage supercharging unit of the multiphase pump is taken as the research object, and the computational domain is modeled by UG software [30]. Its three-dimensional geometric model includes an inlet pipe, impeller, diffuser and outlet pipe, as shown in Figure 1. At the same time, the impeller inlet and diffuser outlet are appropriately extended to ensure that the impeller inlet and diffuser outlet flow can be fully developed and reduce the influence of boundary conditions on the calculation accuracy.
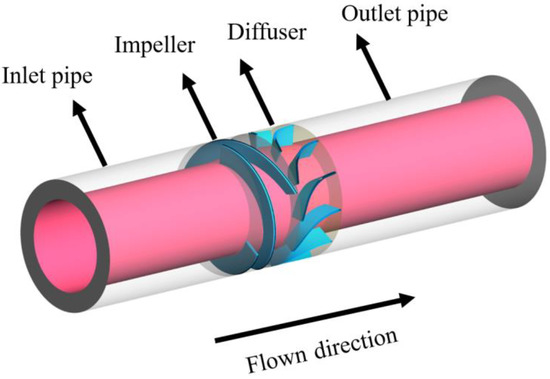
Figure 1.
Computing domain.
3.2. Grid Division
The calculation domain is divided by hexahedral structure grid technology, the inlet and outlet pipes are divided by ICEM CFD software, and the impeller and diffuser are divided by TurboGrid software. Due to the subtle structure of tip clearance and extremely complex flow conditions, this paper precisely analyzed the flow characteristics in the multiphase pump, to ensure that the y+ value was maintained within 80 to meet the requirements of the turbulence model, and refined the radial mesh of tip clearance, as shown in Figure 2.
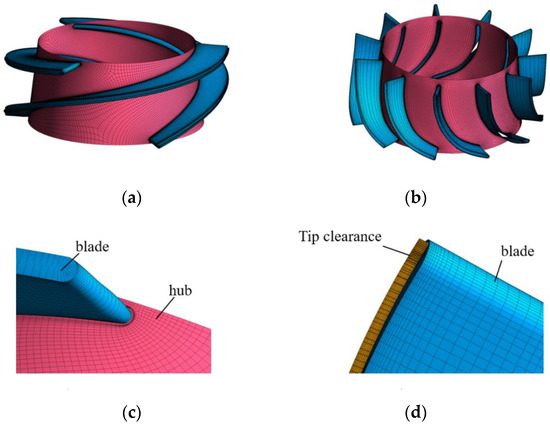
Figure 2.
Computational domain grid. (a) Impeller. (b) Diffuser. (c) Impeller blade. (d) Tip clearance.
In order to improve the accuracy of the numerical simulation, the interference of the grid number on the simulation results was eliminated. In this paper, five groups of grids were selected for independent verification under water conditions. The specific calculation results are shown in Table 1. It can be seen from Table 1 that the head and efficiency of the multiphase pump gradually tend to stabilize with the increase in the number of grids. When the number of grids is larger than the fourth group, the change values of pump head and efficiency are small, and the influence of the grid number on the calculation can be ignored. Considering the computing resources and accuracy, the grid number of the computing domain is finally selected as 4,606,377.

Table 1.
Grid independence verification.
3.3. CFD-PBM Coupling Numerical Calculation Method
In this paper, CFD-PBM coupling calculation is carried out for the multiphase pump with tip clearance of 1.0 mm using ANSYS FLUENT 18.1 software. The calculation is divided into three steps: steady calculation, transient calculation and PBM coupling calculation. Considering the applicability and computation time of the turbulence model, the k-ε model is chosen to be applicable for numerical simulation in this paper [25]. The model combines linear deformation and angular deformation to correct the vortex viscosity coefficient, and the model is applicable to rotating flow fields. Ten groups of different bubble sizes were selected to explore the evolution mechanism of coalescence and breakup of bubbles in the multiphase pump. The specific size range is shown in Table 2. Using the boundary conditions of velocity inlet and pressure outlet, the impeller is set to a rotation mode with a speed of 3000 r/min. In the calculation process, firstly, the Eulerian–Eulerian model, suitable for gas–liquid two-phase flow, was used for steady numerical calculation; the convergence accuracy was set to 10−6, and the rotating fluid domain was selected as the motion reference frame. After stabilization, the rotating fluid field was changed to the dynamic grid, the time step was set to 0.000111 (impeller rotation 2°), and the transient numerical calculation of the model was carried out. After being stabilized again, the CFD-PBM model was added to continue the transient numerical calculation. When the detected physical quantity fluctuated gently, the numerical calculation was completed.

Table 2.
Discrete bubble size.
3.4. Verification of Numerical Simulation Method
3.4.1. Test Model
In this experimental study, the liquid phase is water, and the gas phase is air. The test content mainly involves the flow state test of the multiphase pump under gas–liquid two-phase conditions. In order to ensure a clear and accurate test of the flow in the pressurization unit, this study adopts transparent plexiglass material with the shape of the pump body designed to be square on the outside and round on the inside. Its refractive index is similar to that of clean water, so as to reduce test errors caused by secondary refraction. To ensure that the medium entering the multiphase pump has mixes gas and liquid evenly, a gas–liquid mixing tank is specially assembled at the entrance of the multiphase pump on the test bench, and the inlet pipe of the multiphase pump is designed as a transparent pipe, in order to observe the gas–liquid mixing effect (as shown in Figure 3). After the preparation work was completed, the multiphase pump could be started to adjust the gas–liquid two-phase flow. After the stabilization, FASTCAM Mini AX100 high-speed photography (as shown in Figure 4) was used to take photos. At the same time, a special light source should be designed to supplement the illumination for the flow state in the multiphase pump captured in high definition. In addition, the main performance indicators of the test instrument are shown in Table 3, and the schematic diagram of the multiphase pump test system is shown in Figure 5.
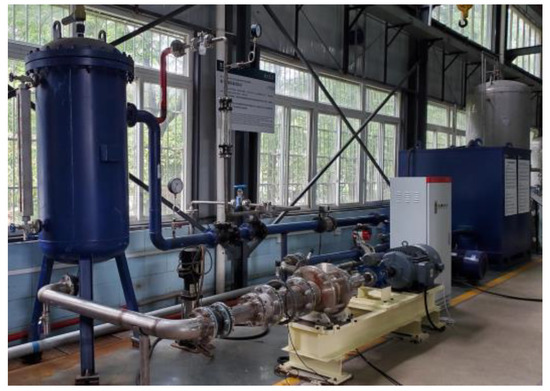
Figure 3.
Multiphase test system.
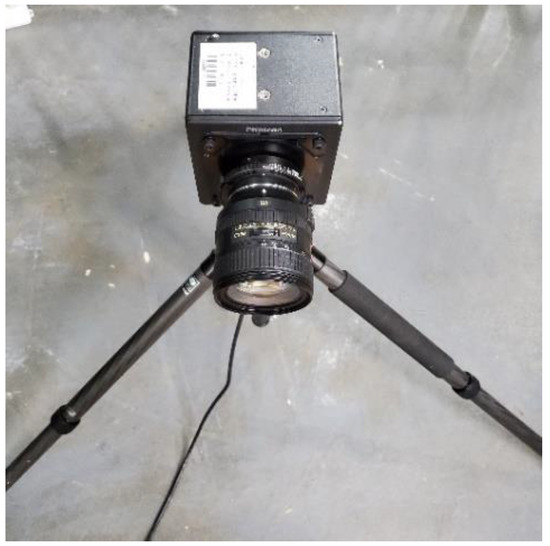
Figure 4.
High-speed photography.

Table 3.
Main parameters of multiphase pump.
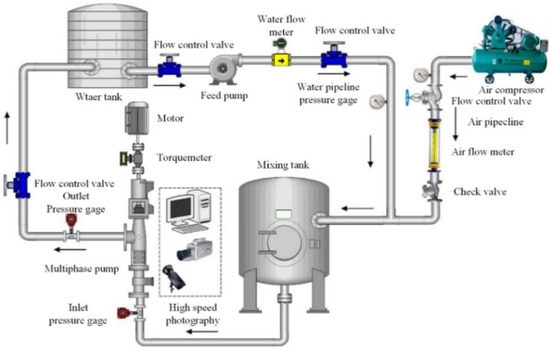
Figure 5.
Diagram of multiphase test system.
3.4.2. Single-Phase Test Verification
In this paper, to ensure the accuracy of the calculation method, the single-phase test study of a pure water multiphase transport pump with blade tip clearance of 1 mm and rotational speed of 3000 r/min was carried out, and the test values, such as head and efficiency, were collected on site. At the same time, the obtained test values and the relevant simulation values obtained by computational fluid dynamics numerical simulation were used to investigate, and the external characteristic curve of the multiphase pump was finally drawn, as shown in Figure 6. It can be seen from Figure 6 that the test value is highly consistent with the simulation value in the flow range of 60~120 m3/h, and the relative error between them is no more than 5%. Since there is energy loss in the test process, the phenomenon that the test value is often less than the simulated value is inevitable, so the numerical simulation results in this paper can predict the energy characteristics of the multiphase pump more accurately.
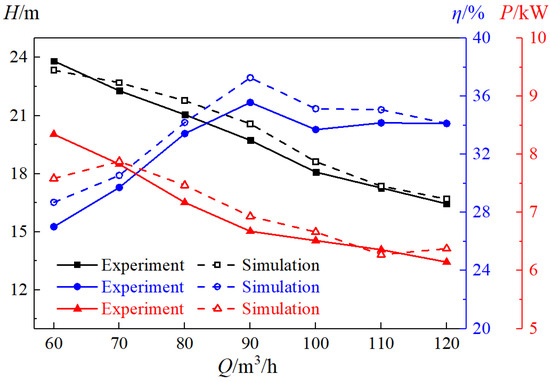
Figure 6.
Comparison of external characteristics of the experiment and numerical simulation.
3.4.3. Two-Phase Test Verification
In order to further verify the accuracy of predicting the performance of the multiphase pump under gas–liquid two-phase conditions, the above model pump was used in this paper to conduct experimental research under the operating conditions of 3000 r/min speed, 100 m3/h flow rate and 1%, 5% and 9% IGVF, respectively. Figure 7 shows the comparison between the CFD-PBM numerical simulation results and the bubble number density in the experiment under gas–liquid two-phase conditions. As can be seen from the figure, the simulation results of the CFD-PBM coupling model are highly consistent with the test results. It can be clearly seen that the number density of bubbles increases gradually with IGVF, and the bubbles are mainly concentrated on the suction surface of the blade in the impeller domain and near the vortex in the diffuser. By comparison and analysis, the head errors of the three groups of test values and calculated values are all less than 7.5%. Considering that the flow inside the multiphase pump is extremely complex and the number of bubbles set in the simulation is limited under the gas–liquid two-phase flow conditions, this paper considers the error within the reasonable range of numerical fluctuation. Therefore, the CFD-PBM coupling model is effective in flow field calculation and analysis, and can be used to calculate the bubble size distribution in a multiphase pump under gas–liquid two-phase flow conditions.
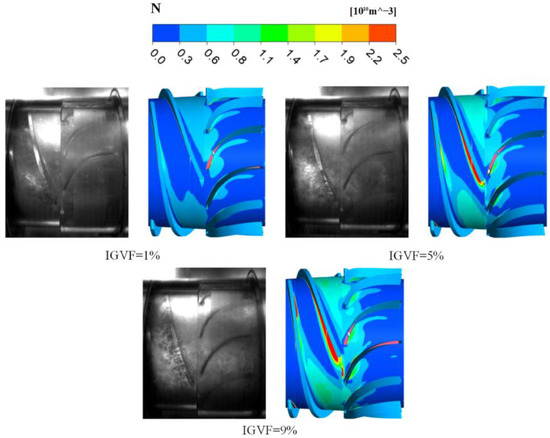
Figure 7.
Comparison of experimental and numerical simulation results.
4. Results and Discussion
4.1. Bubble Size Distribution in the Pressurization Unit
In order to deeply explore the formation mechanism of gas–liquid two-phase distribution, it is necessary to analyze the bubble diameter and bubble number distribution in the multiphase pump. In the calculation, Bin4 (1.2916 mm), the medium size of discrete bubbles, was set as the inlet bubble of the multiphase pump. The size and number distribution of bubbles in the multiphase pump can be obtained through the CFD-PBM coupling model. For a detailed analysis of the impeller domain of axial multiphase pumps, the change rule of bubble size selection conditions for IGVF of 5% and a rotational speed of 3000 rpm from the results of numerical simulation were analyzed, and the impeller and diffuser from the inlet along the axial direction were evenly divided into 11 sections, section 1 for the inlet and section 11 for the outlet, as shown in Figure 8.
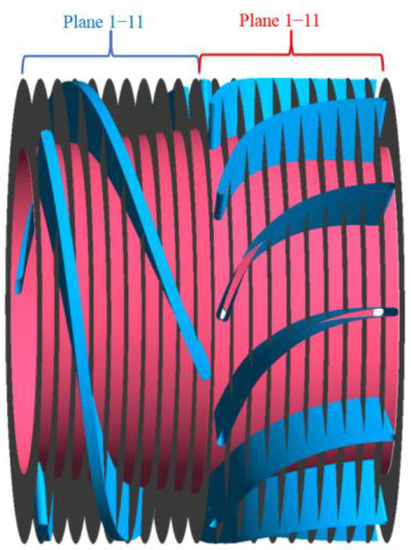
Figure 8.
Schematic diagram of pressurization unit division of multiphase pump.
Figure 9 shows the change curve of the mean bubble size along the axial section of the pressurizing unit under this condition. As can be seen from Figure 9, the mean bubble size in the impeller domain gradually decreases from 1.7013 mm at the inlet to 0.6179 mm at the outlet along the axis direction, and the average bubble diameter in the diffuser domain fluctuates around 0.6 mm. This is because the bubble in the impeller area has two trends of coalescence and rupture. After the gas enters the impeller passage, a relatively obvious coalescence trend first appears, but the coalescence trend gradually weakens due to the shear action of the impeller blade. When passing through Plane 6, the bubble shows a trend of breakup rather than coalescence, and the bubble size begins to decrease. It can also be seen from Figure 9 that bubbles in the whole diffuser domain show a breakup trend, except that the inlet and outlet of the diffuser have bubble size fluctuations due to the influence of the interface, and the other sections show a similar breakup trend. This is mainly because the entrainment of the vortex in the diffuser makes the bubbles in the diffuser gather in a large number, which increases the bubble collision rate. At the same time, the flow in the diffuser is extremely unstable compared with that in the impeller domain, so that the bubble breakup dominates.
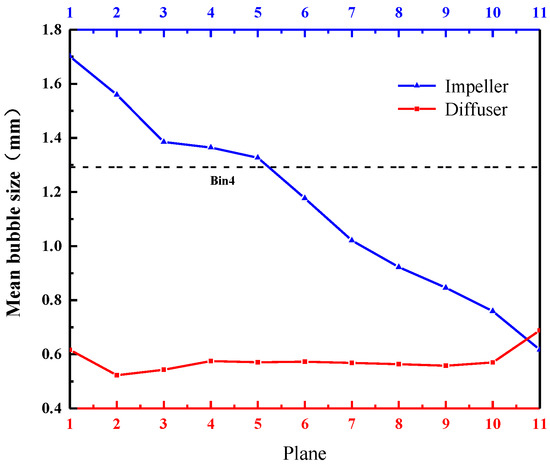
Figure 9.
Change curve of average bubble size along axial section of pressurizing unit.
In order to explore the distribution law of different variables along the radial direction of the pressurization unit, a dimensionless position parameter is introduced, namely, the radial coefficient , which is defined as the radial direction of the impeller and diffuser from the hub to the impeller (diffuser) chamber; distances were normalized to 0 for the hub position and 1 for the shroud position. Figure 10 shows the mean bubble size distribution along the radial direction of the pressurizing unit under this condition. Where the radial coefficients of 0.1, 0.5 and 0.9 represent the positions near the hub, the blade height middle area and the shroud, respectively. It can be seen from Figure 10 that the diameter of the bubble at the hub of the pressurization unit is significantly larger than that at the shroud, and the diameter of the bubble gradually decreases in the radial direction. This is mainly because the centrifugal force in the impeller domain and the density difference between the two phases of gas and liquid make a large amount of gas gather near the hub, and the trend of bubble coalescence at the hub is obvious. At the same time, it can also be seen that the bubble aggregation degree at the impeller inlet is strong, the bubble diameter is large, and the bubble diameter decreases with the flow affected by the blade shear force. The coalescence of bubbles in the diffuser decreases with the increase in the radial coefficient, and the location of the coalescence moves obviously backward. This is because the vortex scale generated by flow separation in the diffuser blade gradually decreases with the radial coefficient, and the bubble collision rate in the diffuser increases dramatically due to the entrainment of vortices, and the bubbles in the vortices are dominated by coalescence.

Figure 10.
Circumferential mean bubble size distribution of the pressurization unit of the multiphase pump at 5%.
4.2. Effect of IGVF on Bubble Size Development in Pressurization Unit
Figure 11 shows the gas-phase volume fraction distribution and mean bubble size distribution in the pressurization unit of the multiphase pump under different gas–liquid two-phase media conditions. It can be seen from Figure 11 that the IGVF is a key parameter affecting the performance of the multiphase pump, and the internal gas-phase distribution and bubble size distribution are obviously different under different IGVF conditions. As the IGVF increases, the volume fraction of the gas phase in the pressurization unit increases correspondingly with the dramatic increase in the gas phase, and when the IGVF is large, there is an obvious phenomenon of gas-phase aggregation in the flow passage, which makes the head and efficiency of the multiphase pump greatly reduced, and the performance becomes poor. Among them, the gas phase is mainly concentrated near the suction surface of the impeller blade and the tail of the pressure surface of the diffuser. This is because, during the rotation process, the pressure on the pressure surface of the blades of the multiphase pump is greater than that on the suction surface, and the bubbles accumulate on the suction surface under the action of the pressure difference. At the same time, it can be seen that the mean bubble size in the pressurization unit increases significantly with the increase in IGVF, and the coalescence of bubbles mainly occurs in the region where gas-phase aggregation is more intense. This is because the increase in the number of bubbles reduces the distance between bubbles and increases the probability of bubble collision. At the same time, the coalescence of bubbles is dominant, and the probability of breakup is small, thus increasing the mean bubble size of bubbles.
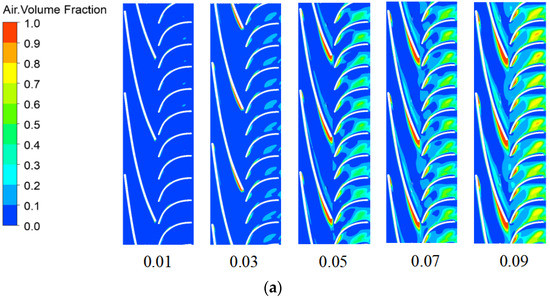
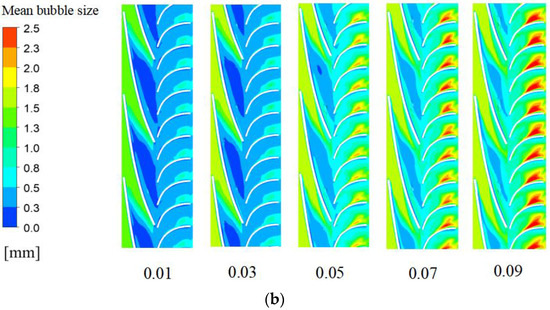
Figure 11.
Circumferential gas-phase volume fraction and bubble size distribution of the pressurization unit of the multiphase pump under different IGVF conditions for gas–liquid two-phase media. (a) Gas phase volume fraction. (b) Mean bubble size.
In order to quantitatively analyze the axial distribution of bubble size evolution in the pressurization unit, the bubble size on different sections divided above is analyzed. Figure 12 shows the bubble size change curve along the axial section of the pressurization unit of the multiphase pump under different IGVF conditions for gas–liquid two-phase media. It can be seen from Figure 12a that the mean bubble size in the impeller domain of the axial-flow multiphase pump varies with the flow process in a very similar way under different IGVFs. It can also be seen from the figure that the size of the bubbles passing through the impeller generally decreases, and the size of the bubbles at the impeller inlet is much larger than that at the impeller outlet. When the IGVF is 1%, the gas-phase volume in the multiphase pump is extremely low, the number of bubbles is small, the chance of bubble collision is small, and the bubbles in the whole flow domain of the impeller show a trend of breakup, and the degree of breakup increases with the flow direction. As the IGVF rises, the trend of bubble coalescence gradually increases, and the trend of breakup gradually decreases. When the IGVF is 5%, the change of bubble size in the impeller domain is more balanced. However, under high IGVF conditions, the coalescence trend of bubbles is obviously stronger than the breaking trend. The increase in the number of bubbles in the impeller area increases the probability of bubble collision, and coalescence is the dominant factor, resulting in a sharp increase in bubble size. As can be seen in Figure 12b, the bubble size within the diffuser is distributed almost below the inlet bubble size, with bubble breakup occurring throughout the entire diffuser domain at each IGVF. With the increase in the IGVF, the trend of bubble breakage slows down, but, except for the IGVF of 9%, the trend of bubble breakage is always stronger than the trend of coalescence, and the bubble size decreases compared with the inlet size. However, compared to the impeller, the bubble size fluctuations within the diffuser are smaller, with a significant decrease occurring behind the diffuser inlet and a sharp increase at the outlet. This is because the area of sudden decrease in bubble size is located behind the intersection, where the effect of dynamic and static interference makes the flow turbulent and bubble breakup dominant. The sharp increase at the outlet is due to the increased interaction between the bubbles caused by the wake of the vortex of the diffuser, which is dominated by bubble coalescence.
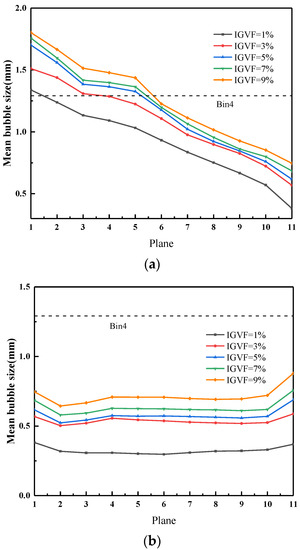
Figure 12.
Bubble size distribution along axial sections of pressurization unit of multiphase pump under different gas–liquid two-phase media with different IGVF conditions. (a) Bubble size distribution of impeller along axial sections. (b) Bubble size distribution of diffuser along axial sections.
4.3. Effect of Flow on Bubble Size Development in Pressurization Unit
Figure 13 shows the gas-phase distribution in the pressurization unit of the multiphase pump under different flow conditions in gas–liquid two-phase media. It can be seen from Figure 13 that the aggregation degree of the gas phase in the pressurizing unit increases first and then slows down with the increase in flow. When the flow is 0.8 Q, the volume fraction of the gas phase in the pump is smaller, the velocity slip of the gas and liquid phases in the flow passage is not obvious, the number of bubbles is correspondingly smaller, and the bubble size is more stable compared to the inlet size. With the increase in flow rate to 1.0 Q, it can be clearly seen that the degree of gas-phase aggregation in the flow passage becomesincreasingly intense, the aggregation of bubbles makes the bubbles constantly collide, the increase in the number of bubbles and the size of the increase in the flow passage shows a localized gas mass, intensifying the velocity difference between the gas and liquid phases, and the pump performance suffers deterioration. As the flow continues to increase to 1.2 Q, the trend for the gas-phase aggregation in the flow passage decreases again. This is mainly because the resistance of the liquid phase to the gas mass at high flow conditions forces the large gas mass in the flow passage to begin to break up into smaller gas masses, the broken small gas masses flow out of the pressurization unit and no longer remain in the flow passage, the flow passage is gradually unclogged, the pump flow pattern has improved, and the performance is improved.
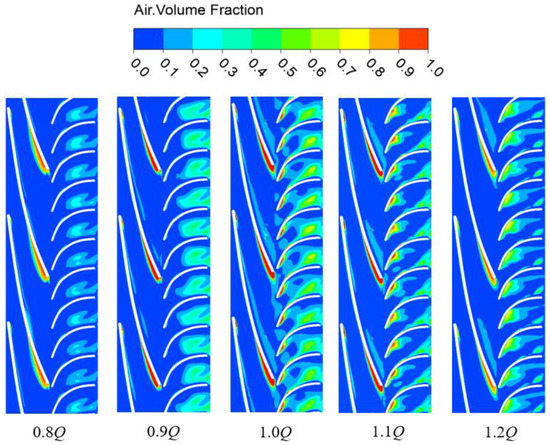
Figure 13.
Circumferential gas-phase volume fraction distribution of pressurization unit of multiphase pump under different flow conditions for gas–liquid two-phase media.
Figure 14 shows the bubble size distribution in the pressurization unit of the multiphase pump under different flow conditions for gas–liquid two-phase media. It can be seen from Figure 14 that the volume distribution of the multiphase pump and the gas phase in the pressurization unit are similar, and the bubble size increases first and then decreases with the increase in the flow. With the continuous increase in the flow, the flow state in the multiphase pump changes constantly, and the degree of gas-phase aggregation in the flow passage increases first and then decreases. It can be seen that the increase in bubble collision probability is the key factor leading to the evolution of bubble size. It can also be seen from Figure 14 that, with the change of flow, the size of the bubbles at the shroud increases sharply, but it can be seen from Section 4.1 that the gas phase mainly gathers near the hub. This further confirms that the coalescence and breakup behavior of bubbles is not only related to the collision probability of the bubbles, but also to the coalescence and breakup probability of the behavior that occurs. The bubble model used in this paper considers the collision between bubbles in the gas–liquid phase to be mainly caused by the random movement of turbulent vortices. In order to be close to the actual working conditions, a certain tip clearance is set on the shroud and wall to disorder the boundary layer flow, and the resulting turbulent vortices promote the coalescence behavior of bubbles in the flow passage.
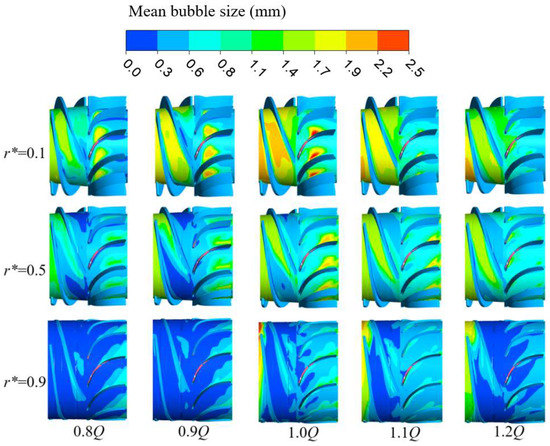
Figure 14.
Bubble size distribution of gas–liquid two-phase media in the pressurization unit of the multiphase pump under different flow conditions.
4.4. Effect of Rotational Speed on Bubble Size Development in Pressurization Unit
Figure 15 shows the bubble number density distribution in the pressurization unit of the multiphase pump with gas–liquid two-phase media at different speeds, and its numerical value represents the number of bubbles per unit volume. As can be seen from Figure 15, bubbles in the flow passage in the impeller domain mainly move towards the suction surface of the blade under the influence of the pressure gradient, and with the increase in rotational speed, the area covered by bubbles and the number of bubbles show an obvious increase. At the same time, it can also be seen that, at low rotational speed, as the size of the minimum turbulence vortex in the pump is small enough, increasing the rotational speed has a limited influence on the number of bubbles, and the energy carried by the minimum turbulence vortex is still not enough to cause the obvious behavior of bubbles in the diffuser, and the number of bubbles in the diffuser is not sensitive to the increase in rotational speed. However, with the increase in rotational speed, the scale of the turbulent vortex is obviously enlarged due to the sharp increase in turbulent kinetic energy, and the number of bubbles is obviously concentrated near the vortex center due to the entrainment effect of the vortex.
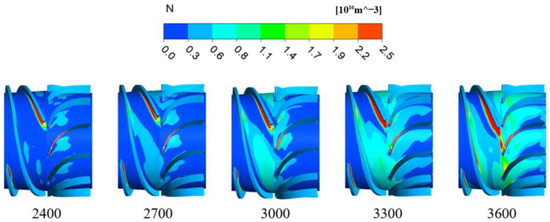
Figure 15.
Bubble number density distribution of gas–liquid two-phase media in the pressurization unit of the multiphase pump at different rotational speeds.
Figure 16 shows the bubble size distribution in the pressurization unit of the multiphase pump with gas–liquid two-phase media at different rotational speeds. It can be seen from Figure 16 that, in the impeller, with the progress of the axial direction, the coalescence trend of the bubbles gradually weakens, and the breakup trend gradually strengthens. On the contrary, the bubbles in the diffuser are less affected by the axial section, and the bubbles in the entire diffuser are mainly broken. At the same time, it can also be seen that the bubble size changes very little in the low rotational speed area and the impeller inlet. With the increase in the rotational speed and the increase in the pump shaft power, the bubble breakup trend in the impeller area under the greater shear action of the blade is gradually enhanced, and the number of bubbles increases correspondingly, which is consistent with the analysis above. However, in the diffuser, bubbles break up violently, the size of the bubbles is always much smaller than that of the inlet bubbles, and the number of bubbles is large. This fully shows that the rotational speed plays a role in promoting the breakup of the bubbles, and the promoting effect is gradually strengthened with the increase in the rotational speed. At the same time, its promoting effect on the diffuser is obviously stronger than that of the impeller, but the promoting strength remains relatively stable.
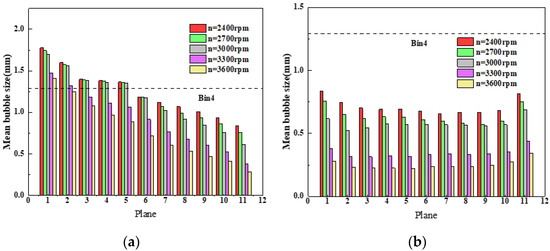
Figure 16.
Bubble size distribution in the pressurization unit of the multiphase pump with gas–liquid two-phase media at different rotational speeds. (a) Impeller. (b) Diffuser.
5. Conclusions
In this paper, in order to explore the characteristics of bubble coalescence and breakup in the multiphase pump, the flow field parameters in the pump are solved based on the CFD-PBM coupled model, and the bubble size distribution is obtained. Through the analysis of air content, bubble number density and bubble size, the influence of different IGVFs, flow and rotational speed on bubble coalescence and breakup in the multiphase pump is revealed. The main conclusions are as follows:
- (1)
- In the pressurization unit of the multiphase pump, the bubbles show different behaviors at different positions. The size of the bubbles in the impeller region decreases significantly along the radial and axial directions, the coalescence trend between the bubbles gradually weakens, and the breakup trend gradually increases, making it gradually appear from the coalescence trend to the breakup trend. The bubbles in the diffuser area are affected by the vortex in the flow passage, and their size is always small, and the bubbles tend to be broken.
- (2)
- The gas aggregation caused by the increase in IGVF plays an obvious role in promoting the coalescence of bubbles. When the IGVF is low, the gas-phase volume in the pump is less, the number of bubbles is less, and the bubble breakup trend caused by the pressurization unit is higher than the coalescence trend, and the bubbles tend to coalesce. As the IGVF rises, the degree of gas-phase aggregation in the pump increases, the number of bubbles increases, the probability of bubble aggregation caused in the pressurization unit increases, and the bubble size increases significantly.
- (3)
- The bubble size development pattern is not very sensitive to changes in flow, with bubble size showing an increase followed by a decrease with increasing flow. As the flow increases, the size of the bubbles in the pump gradually increases to the maximum bubble size under the design conditions, due to the gas-phase distribution law of the flow passage, from a small flow to a large flow, under the scouring effect; the gas phase is removed by the liquid phase out of the flow passage, the number of bubbles decreases, and the bubbles begin to show breakup behavior.
- (4)
- The increased shearing action of the blades as the rotational speed increases is an increasingly significant contributor to the breakup of bubbles. As the rotational speed increases, the bubbles in the multiphase pump are subjected to greater shearing action by the blades at high rotational speeds, the number of bubbles increases in a more turbulent flow state, and the probability of collision strengthens, but the trend of breakup is much stronger than the trend of coalescence.
For future work, it is suggested that a better visualization method should be used in the multiphase pump to accurately grasp the evolution law of bubble coalescence and breakup in the flow passage. At the same time, it is hoped that the mechanism of bubble coalescence and breakup in the multiphase pump can be deeply studied, and the internal relationship between bubble evolution and external characteristics of the multiphase pump can be established.
Author Contributions
Conceptualization, S.T.; G.S. and Y.X.; methodology, S.T.; Software, S.T., G.S. and Y.X.; writing—original draft preparation, G.S.; writing—review and editing, S.T. and G.S.; supervision, Y.X., Z.H. and H.W. All authors have read and agreed to the published version of the manuscript.
Funding
This work was supported by the Open Research Fund Program of State Key Laboratory of Hydroscience and Engineering (sklhse-2021-E-03, sklhse-2022-KY-06); the Key scientific research fund of Xihua University of China (Z1510417); the Central Leading Place Scientific and Technological Development Funds for Surface Project (2021ZYD0038); the National Key Research and Development Program (2018YFB0905200); and the Graduate Innovation Fund in 2021 (YCJJ2021059). The National Natural Science Foundation of China (52279088).
Institutional Review Board Statement
Not applicable.
Informed Consent Statement
Not applicable.
Data Availability Statement
Not applicable.
Conflicts of Interest
The authors declare that they have no conflict of interest.
References
- Xiao, W.; Tan, L. Correlation between radial force and flow state of blade gas-liquid multiphase pump. J. Hydroelectr. Eng. 2019, 38, 90–101. [Google Scholar]
- Dal Porto, D.F.; Larso, L.A. Multiphase-pump field trials demonstrate practical applications for the technology. SPE Prod. Facil. 1997, 12, 159–164. [Google Scholar] [CrossRef]
- Alberto, S.; Lars, E.B. Design of a multiphase pump test laboratory allowing to perform flow visualization and instability analysis. In Proceedings of the ASME 2015 Power Conference POWER2015, San Diego, CA, USA, 28 June–2 July 2015. [Google Scholar]
- Alberto, S.; Lars, E.B. Flow visualization of unsteady and transient phenomena in a mixed-flow multiphase pump. In Proceedings of the ASME Turbo Expo 2016: Turbomachinery Technical Conference and Exposition GT2016, Seoul, Korea, 13–17 June 2016. [Google Scholar]
- Zhang, J.; Cai, S.; Zhu, H. Visualization test of gas-liquid two-phase flow field at the inlet of a blade multiphase pump. J. Mech. Eng. 2015, 51, 184–190. [Google Scholar] [CrossRef]
- Wu, Y.; Xiang, Q.; Li, H.; Yun, Q.; Wang, C. Experimental study on bubble size in diffusion tube of liquid-gas jet pump. Fluid Mach. 2012, 40, 1–5. [Google Scholar]
- Mandal, A.; Kundu, G.; Mukherjee, D. A comparative study of gas holdup, bubble size distribution and interfacial area in a dowm flow bubble column. Chem. Eng. Res. Des. 2005, 83, 423–428. [Google Scholar] [CrossRef]
- Mandal, A. Characterization of gas-liquid parameters in a down-flow jet loop bubble column. Braz. J. Chem. Eng. 2010, 27, 253–264. [Google Scholar] [CrossRef]
- Shao, C.; Li, C.; Zhou, J. Experimental investigation of flow patterns and external performance of a centrifugal pump that transports gas-liquid two-phase mixtures. Int. J. Heat Fluid Flow 2018, 71, 460–469. [Google Scholar] [CrossRef]
- Patel, B.; Runstadler, P. Investigations into the two-phase behavior of centrifugal pumps. Flow Meas. Instrum. 2015, 46, 262–267. [Google Scholar]
- Zhang, W.; Yu, Z.; Li, Y. Application of a non-uniform bubble model in a multiphase rotodynamic pump. J. Pet. Sci. Eng. 2019, 173, 1316–1322. [Google Scholar] [CrossRef]
- Caridad, J.; Asuaje, M.; Kenyery, F.; Tremante, T.; Aguillón, O. Characterization of a centrifugal pump impeller under two-phase flow conditions. J. Pet. Sci. Eng. 2008, 63, 18–22. [Google Scholar] [CrossRef]
- Schrage, D.L.; Perkings, H.C., Jr. Isothermal bubble motion through a rotating liquid. J. Fluids Eng. 1972, 9, 187–192. [Google Scholar] [CrossRef]
- Shi, G.; Tao, S.; Liu, X.; Wen, H. Effect of Gas Volume Fraction on the Gas-Phase Distribution in the Passage and Blade Surface of the Axial Flow Screw-Type Oil-Gas Multiphase Pump. Processes 2021, 9, 760. [Google Scholar] [CrossRef]
- Zhang, J.; Li, Y.; Cai, S.; Zhu, H.; Zhang, Y. Investigation of gas–liquid two-phase flow in a three-stage rotodynamic multiphase pump via numerical simulation and visualization experiment. Adv. Mech. Eng. 2016, 8, 1687814016642669. [Google Scholar] [CrossRef]
- Zhang, W.; Zhu, B.; Yu, Z. Characteristics of bubble motion and distribution in a multiphase rotodynamic pump. J. Pet. Sci. Eng. 2020, 19, 107435. [Google Scholar] [CrossRef]
- Luo, H. Coalescence, Breakup and Liquid Circulation in Bubble Column Reactors; The University of Trondheim: Trondheim, Norway, 1993. [Google Scholar]
- Luo, H.; Svenden, H.F. Theoretical model for drop and bubble breakup in turbulent dispersions. AIChE J. 1996, 42, 1225–1233. [Google Scholar] [CrossRef]
- Wang, T. Experimental Study and Numerical Simulation on Hydrodynamic Behavior of Gas-Liquid (Slurry) Reactor; Tsinghua University: Beijing, China, 2004. [Google Scholar]
- Yuan, H.; Zhang, X. Investigation into mechanism of coalescence in vortex field. Chem. Eng. 2005, 33, 30–33. [Google Scholar]
- Lü, F.; Yang, H.; Yuan, H.; Zhang, Y.; Zhou, L. Numerical simulation of oil droplet breakup and coalescence in liquid-liquid separation hydrocyclones. Pet. Mach. 2017, 45, 71–76. [Google Scholar]
- Zhang, W.; Hou, Y.; Jin, H.-B.; Ma, L.; He, G.; Yang, S.; Guo, X.; Zhang, R. Numerical simulation of air-water two-phase flow with coupled CFD-PBM model under heating and pressurization. J. Chem. Eng. 2021, 72, 4594–4606. [Google Scholar]
- Zhu, G.; Zhang, A.; Ba, S.; Chen, Y.; Hu, Z. Coupled CFD-PBM calculation of the flow field of salt precipitation in a horizontal decanter centrifuge. Chem. Ind. Eng. Prog. 2019, 38, 3947–3955. [Google Scholar]
- Chen, Y.; Patil, A.; Chen, Y.; Bai, C.; Wang, Y.; Morrison, G. Numerical Study on the First Stage Head Degradation in An Electrical Submersible Pump with Population Balance Model. J. Energy Resour. Technol. 2019, 141, 022003. [Google Scholar] [CrossRef]
- Ge, Z.; He, D.; Huang, R. Application of CFD-PBM coupling model for analysis of gas-liquid distribution characteristics in centrifugal pump. J. Pet. Sci. Eng. 2020, 194, 107518. [Google Scholar] [CrossRef]
- He, D.; Ge, Z.; Bai, B. Gas liquid two-phase performance of centrifugal pump under bubble inflow based on computational fluid dynamics population balance model coupling model. J. Fluids Eng. 2020, 142, 081402. [Google Scholar] [CrossRef]
- Zhang, W.; Zhu, B.; Yu, Z. Influence of flow parameters on the interaction characteristics of gas-liquid phases in the full flow passage of a multiphase pump. J. Eng. Thermophys. 2020, 41, 1911–1916. [Google Scholar]
- Legendre, D.; Magnaudet, J. The lift force on a spherical bubble in a viscous linear shear flow. J. Fluid Mech. 1998, 368, 81–126. [Google Scholar] [CrossRef]
- Maxey, M.; Riley, J. Equation of motion for a small rigid sphere in a nonuniform flow. Phys. Fluids 1983, 26, 883–889. [Google Scholar] [CrossRef]
- Shu, Z.; Shi, G.; Yao, X.; Sun, G.; Tao, S. Influence factors and prediction model of enstrophy dissipation from the tip leakage vortex in a multiphase pump. Sci. Rep. 2022, 12, 16032. [Google Scholar] [CrossRef]
Publisher’s Note: MDPI stays neutral with regard to jurisdictional claims in published maps and institutional affiliations. |
© 2022 by the authors. Licensee MDPI, Basel, Switzerland. This article is an open access article distributed under the terms and conditions of the Creative Commons Attribution (CC BY) license (https://creativecommons.org/licenses/by/4.0/).