Article

Effects of Dietary Vegetable Oils Replacing Fish Oil on Fatty Acid Composition, Lipid Metabolism and Inflammatory Response in Adipose Tissue of Large Yellow Croaker (Larimichthys crocea)

1
Key Laboratory of Aquaculture Nutrition and Feed (Ministry of Agriculture and Rural Affairs) & Key Laboratory of Mariculture (Ministry of Education), Ocean University of China, Qingdao 266003, China
2
Laboratory for Marine Fisheries Science and Food Production Processes, Qingdao National Laboratory for Marine Science and Technology, Qingdao 266237, China
*
Author to whom correspondence should be addressed.
J. Mar. Sci. Eng. 2022, 10(11), 1760; https://doi.org/10.3390/jmse10111760
Submission received: 31 October 2022 / Revised: 11 November 2022 / Accepted: 13 November 2022 / Published: 16 November 2022
(This article belongs to the Special Issue Marine Fish Physiology and Molecular Nutrition)

Abstract

:
The present study was conducted to investigate the effects of dietary vegetable oils (VOs) replacing fish oil (FO) on fatty acid composition, lipid metabolism and inflammatory response in adipose tissue (AT) of large yellow croaker (Larimichthys crocea). The initial body weight of a large yellow croaker was 10.07 ± 0.13 g. Three iso-nitrogenous and iso-lipidic diets were formulated by replacing FO with 0% (the control group), 100% soybean oil (SO) and 100% linseed oil (LO). Results showed that the contents of C18:2n-6 and C18:3n-3 were significantly increased in AT of fish fed the SO and LO diets compared with the FO diet, respectively. The proportion of n-6 polyunsaturated fatty acid (PUFA) was increased in SO and LO diets, while the proportions of saturated fatty acid and n-3 LC-PUFA were decreased. Moreover, dietary SO and LO significantly induced excess fat accumulation of AT by increasing the triglyceride content and the hypertrophy of adipocytes. Dietary SO and LO significantly increased lipogenesis-related gene expressions (dagt2, fabp10, srebp1, cebpα and pparγ), while decreasing the gene expression of lpl. Meanwhile, dietary SO increased the expression of genes related to fatty acid β-oxidation (cpt1 and aco), while LO showed no differences. Furthermore, dietary SO and LO increased the pro-inflammatory gene expressions and decreased the anti-inflammatory gene il10 expression. The phosphorylation levels of p38 MAPK and NF-κB were significantly upregulated by dietary SO and LO. In addition, there was a significant increase in macrophage infiltration and M1 polarization in AT of fish fed SO and LO diets. In conclusion, the present study revealed that dietary SO and LO replacing FO affected fatty acid composition and induced lipid dysmetabolism and inflammatory response in the adipose tissue of large yellow croaker.

1. Introduction

Fish oil (FO), with a relatively high content of long-chain polyunsaturated fatty acids (LC-PUFA), is used as the major lipid component in the fish diet. Due to the high price and limited supply of fish oil (FO), vegetable oil (VO) has been widely used as a promising alternative to FO in the fish diet due to its low price and high output [1]. Soybean oil (SO) and linseed oil (LO), which are enriched in linoleic acid (LA) and α-linolenic acid (ALA), respectively, are two of the most commonly used vegetable oils to replace FO [2]. Previous studies have confirmed that VO could partially replace FO without a significant reduction in growth performance in many fish species, such as Atlantic salmon (Salmo salar), rainbow trout (Oncorhynchus mykiss) and gilthead sea bream (Sparus aurata) [3,4,5]. However, the high percentage of dietary VO replacing FO always induces abnormal lipid deposition and inflammatory response due to the imbalance in fatty acid profile of the diet [6,7,8]. Therefore, exploring the mechanism of high levels of dietary VO on lipid metabolism and inflammatory response can improve the utilization of VO in aquafeed.
Adipose tissue (AT) is an important tissue for lipid storage [9]. In mammals, the hypertrophy of AT caused by excess fat accumulation results in lipid dysmetabolism, which is characterized by abnormal lipolysis and adipokine secretion [10,11]. Furthermore, AT has also been regarded as a tissue with an important immune function [12]. The enlargement of AT induced by excess fat accumulation leads to chronic-degree tissue inflammation, which is associated with an increased abundance of adipose tissue macrophages (ATMs) infiltrating into AT [13]. In fish, adipose tissue is also considered to be a specific tissue for fat deposition. Excess energy intake and a nutritionally unbalanced diet can induce excess fat accumulation in AT, which impairs fish health and reduces aquatic production [14]. In addition, previous studies also revealed that AT plays an important role in the regulation of inflammatory response in fish [15,16]. However, the regulatory mechanism of lipid metabolism and inflammatory response in response to VO in AT is still not completely understood.
Large yellow croaker (Larimichthys crocea) is an economically important mariculture fish in China, and the use of dietary VO is prevalent in large yellow croaker feed. Based on a large number of studies about dietary vegetable oils replacing fish oil, large yellow croaker is a good model to systematically explore the effect of VO on lipid metabolism and inflammation in fish [6,17,18,19]. This study hypothesized that the high level of VO replacing FO could affect lipid metabolism and inflammatory response in adipose tissue of large yellow croaker. Thus, the present study was conducted to investigate the mechanism of a high level of dietary SO and LO replacing FO in fatty acid composition, lipid metabolism and inflammatory response in large yellow croaker.

2. Materials and Methods

2.1. Experiment Diets and Fish Culture

The design and fatty acid composition of the experimental diets (Table 1 and Table 2) were given in a previous study [6,20]. In brief, three iso-nitrogenous (43% crude protein) and iso-lipidic (12% crude lipid) diets were formulated by replacing FO with 0% (the control group), 100% SO and 100% LO. The SO was enriched with linoleic acid (LA; C18:2n-6) and the LO was enriched with α-linolenic acid (ALA; C18:3n-3). Large yellow croakers with the same initial size (mean weight 10.07 ± 0.13 g) were obtained from Fu Fa Aquatic Fishery Company (Ningde, Fujian, China). A total of 720 fish was randomly distributed into 12 floating sea cages (1 × 1 × 1.8 m). Four floating sea cages were used per group with 60 fish per cage. Fish were hand-fed twice daily for 10 weeks. The salinity ranged from 25.0 to 30.0 g/L, the water temperature ranged from 22.0 to 28.0 °C and the dissolved oxygen content was approximately 7.0 mg/L. At the end of the feeding experiment, fish were fasted for 24 h and anesthetized with MS-222 before sampling. Tissues were collected and frozen in liquid nitrogen and then stored at −80 °C or −20 °C for further analyses.
In the present study, all experimental procedures performed on fish were strictly according to the Management Rule of Laboratory Animals (Chinese Order No. 676 of the State Council, revised 1 March 2017).

2.2. Analysis of Fatty Acid Profiles

Adipose tissue from large yellow croakers was selected for the analysis of fatty acid profiles. Samples were placed in freeze-dryers (Alpha 1-4 LD Plus, Osterode, Germany) for 48 h. The analysis of fatty acid profiles was based on the previous method with some modifications using a gas chromatography-mass spectrometer (GS-MC; Shimadzu GSMC-QP2010 Ultra, Tokyo, Japan) [21]. In brief, samples were saponified with KOH-ethanol (1 N) and acid catalyzed with methanolic hydrogen chloride (2 N). The fatty acid methyl ester was quantified by GS-MC with a fused silica capillary column (007-CW, Hewlett Packard, Palo Alto, CA, USA).

2.3. Triglyceride (TG) Content Quantification

Tissue samples were lysed in a lysing solution for 10 min at room temperature. Then, the TG content of tissues was tested by a commercial assay kit (Applygen Technologies Inc., Beijing, China) according to the manufacturer’s instruction. The absorbance of samples was measured at 550 nm using a microplate reader (SpectraMax i3x, Silicon Valley, Francisco Bay, CA, USA). TG contents were adjusted by protein concentration per mg.

2.4. H&E Staining

Adipose tissues were soaked in 4% paraformaldehyde for 24 h and then dehydrated with a gradient of alcohol and dimethylbenzene. The dehydrated tissue was subsequently blocked using paraffin, followed by freezing and solidification. The paraffin-embedded tissues were sliced in a paraffin slicer at a thickness of 4 μm. Then, the slices were stained with hematoxylin–eosin (H&E) to observe the structure.

2.5. RNA Extraction, Complementary DNA (cDNA) Synthesis and Real-Time Quantitative Polymerase Chain Reaction (RT-qPCR)

Total RNA was extracted from adipose tissue using RNAiso Plus (Takara, Tokyo, Japan) according to the manufacturer’s instruction. The concentration and quality of extracted total RNA were measured by NanoDrop spectrophotometer (Thermo Scientific NanoDrop 2000, Waltham, MA, USA). Then, the extracted RNA was reversed to cDNA by PrimeScript™ RT reagent Kit (Takara, Maebashi, Japan) according to the manufacturer’s instruction. The mRNA expression levels were measured using SYBR qPCR Master Mix (Takara, Japan). RT-qPCR primer sequences for target genes were designed by Primer Premier 5.0 software according to the nucleotide sequences of large yellow croaker (Table 3). β-actin was used as the housekeeping gene in the present study. Gene expression levels were calculated and normalized via the 2−ΔΔCT method [22].

2.6. Western Blot Analysis

First, total proteins were extracted from tissues with a total protein extraction kit (Beyotime Biotechnology, Shanghai, China). All protein concentrations were adjusted to the same level before heating. Proteins were loaded onto 10% sodium dodecyl sulfate-polyacrylamide gel electrophoresis with 20 μg protein samples and transferred to polyvinylidene difluoride (PVDF) membranes (Merck Millipore, Berlin, Germany). After incubation with 5% non-fat milk for 2 h, the membranes were incubated with the targeting antibody overnight at 4 °C. The primary antibodies used in this study were against the following proteins according to the previous study [23]: p38 (Cat. No. 8690, CST), phospho-p38 (Thr180/Tyr182; Cat. No. 9215, CST), IKKα/β (Cat. No. 2678, CST), phospho-IKKα/β (Ser176/180; Cat. No. 2697, CST) and GAPDH (AF1186; Beyotime Biotechnology). Then the membranes were incubated with the secondary antibody (HRP-labeled goat anti-rabbit IgG(H + L)) for 2 h at room temperature. Finally, the ECL Plus kit (Beyotime Biotechnology, China) was used to visualize the immune complex. The target proteins were quantified and analyzed using ImageJ software (National Institutes of Health, Bethesda, MD, USA).

2.7. Immunohistochemical (IHC)

The tissue sections used in IHC were preprocessed via antigen retrieval by citric acid, endogenous peroxidase activity blocking by hydrogen peroxide and serum sealing by 3% bovine serum albumin (BSA; Sangon Biotech, Shanghai, China). Then, the sections were successively incubated with primary antibodies, secondary antibodies and DAB color liquid. The polyclonal antibodies against CD68 were produced by immunizing rabbits with synthetic proteins according to gene sequences from large yellow croaker according to the previous study [24]. Brown areas represented the positive ratio and were analyzed using ImageJ software (National Institutes of Health, Bethesda, MD, USA).

2.8. Statistical Analysis

The analyses were performed with SPSS 22.0 (IBM, Armonk, NY, USA). The results were presented as the mean with standard error of mean (S.E.M.). All data were subjected to one-way analysis of variance (ANOVA) followed by Tukey’s multiple-range test or independent sample t-tests in this study. A value of p < 0.05 was considered statistically significant.

3. Results

3.1. Dietary SO and LO Affected the Fatty Acid Profile of Adipose Tissue

Considering the difference in fatty acid profiles between FO and VO, we first detected the fatty acid profile of adipose tissue at the end of the feeding experiment (Table 4). Significant increases were observed in the contents of C18:2n-6 (LA) and C18:3n-3 (ALA) in adipose tissue of fish fed SO and LO diets compared with fish fed the FO diet (p < 0.05). The maximum content of C18:2n-6 (LA) was detected in the adipose tissue of fish fed the SO diet and the maximum content of C18:3n-3 (ALA) was detected in fish fed the LO diet. The contents of C16:0, C20:5n-3 (EPA) and C22:6n-3 (DHA) were significantly decreased in fish fed diets with SO and LO (p < 0.05). In addition, the proportion of n-6 PUFA was significantly increased in adipose tissue of fish fed SO and LO diets, while proportions of SFA and n-3 LC-PUFA were significantly decreased (p < 0.05).

3.2. Dietary SO and LO Induced Excess Fat Accumulation of Adipose Tissue

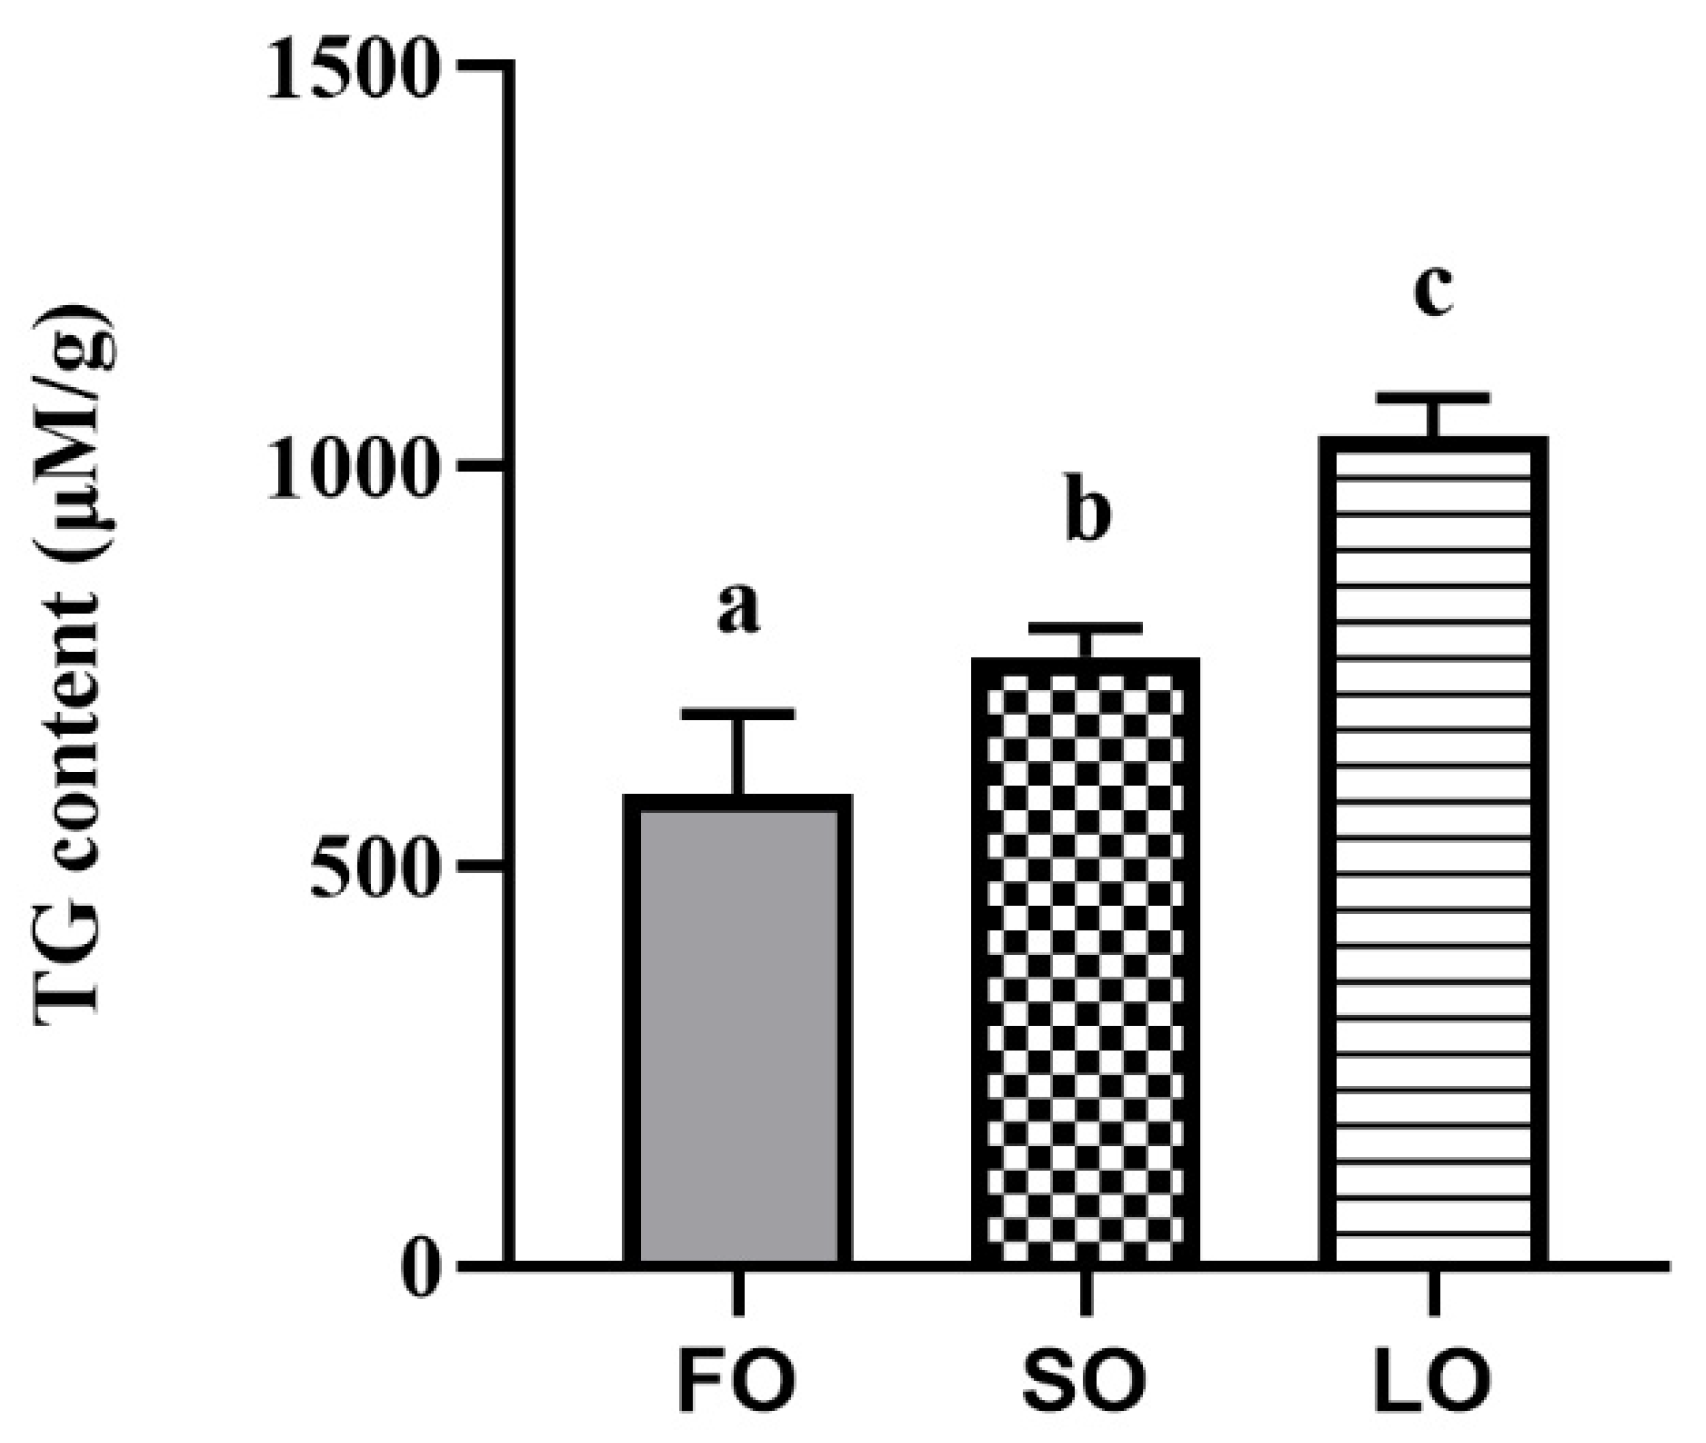
3.2.1. Dietary SO and LO Increased the TG Content in Adipose Tissue

To investigate whether the replacement of FO by VO in diets could induce excess fat accumulation, the TG content of adipose tissue was detected. Results showed that the TG content of adipose tissue was significantly increased when fish were fed SO and LO diets compared with the FO diet (p < 0.05) (Figure 1).

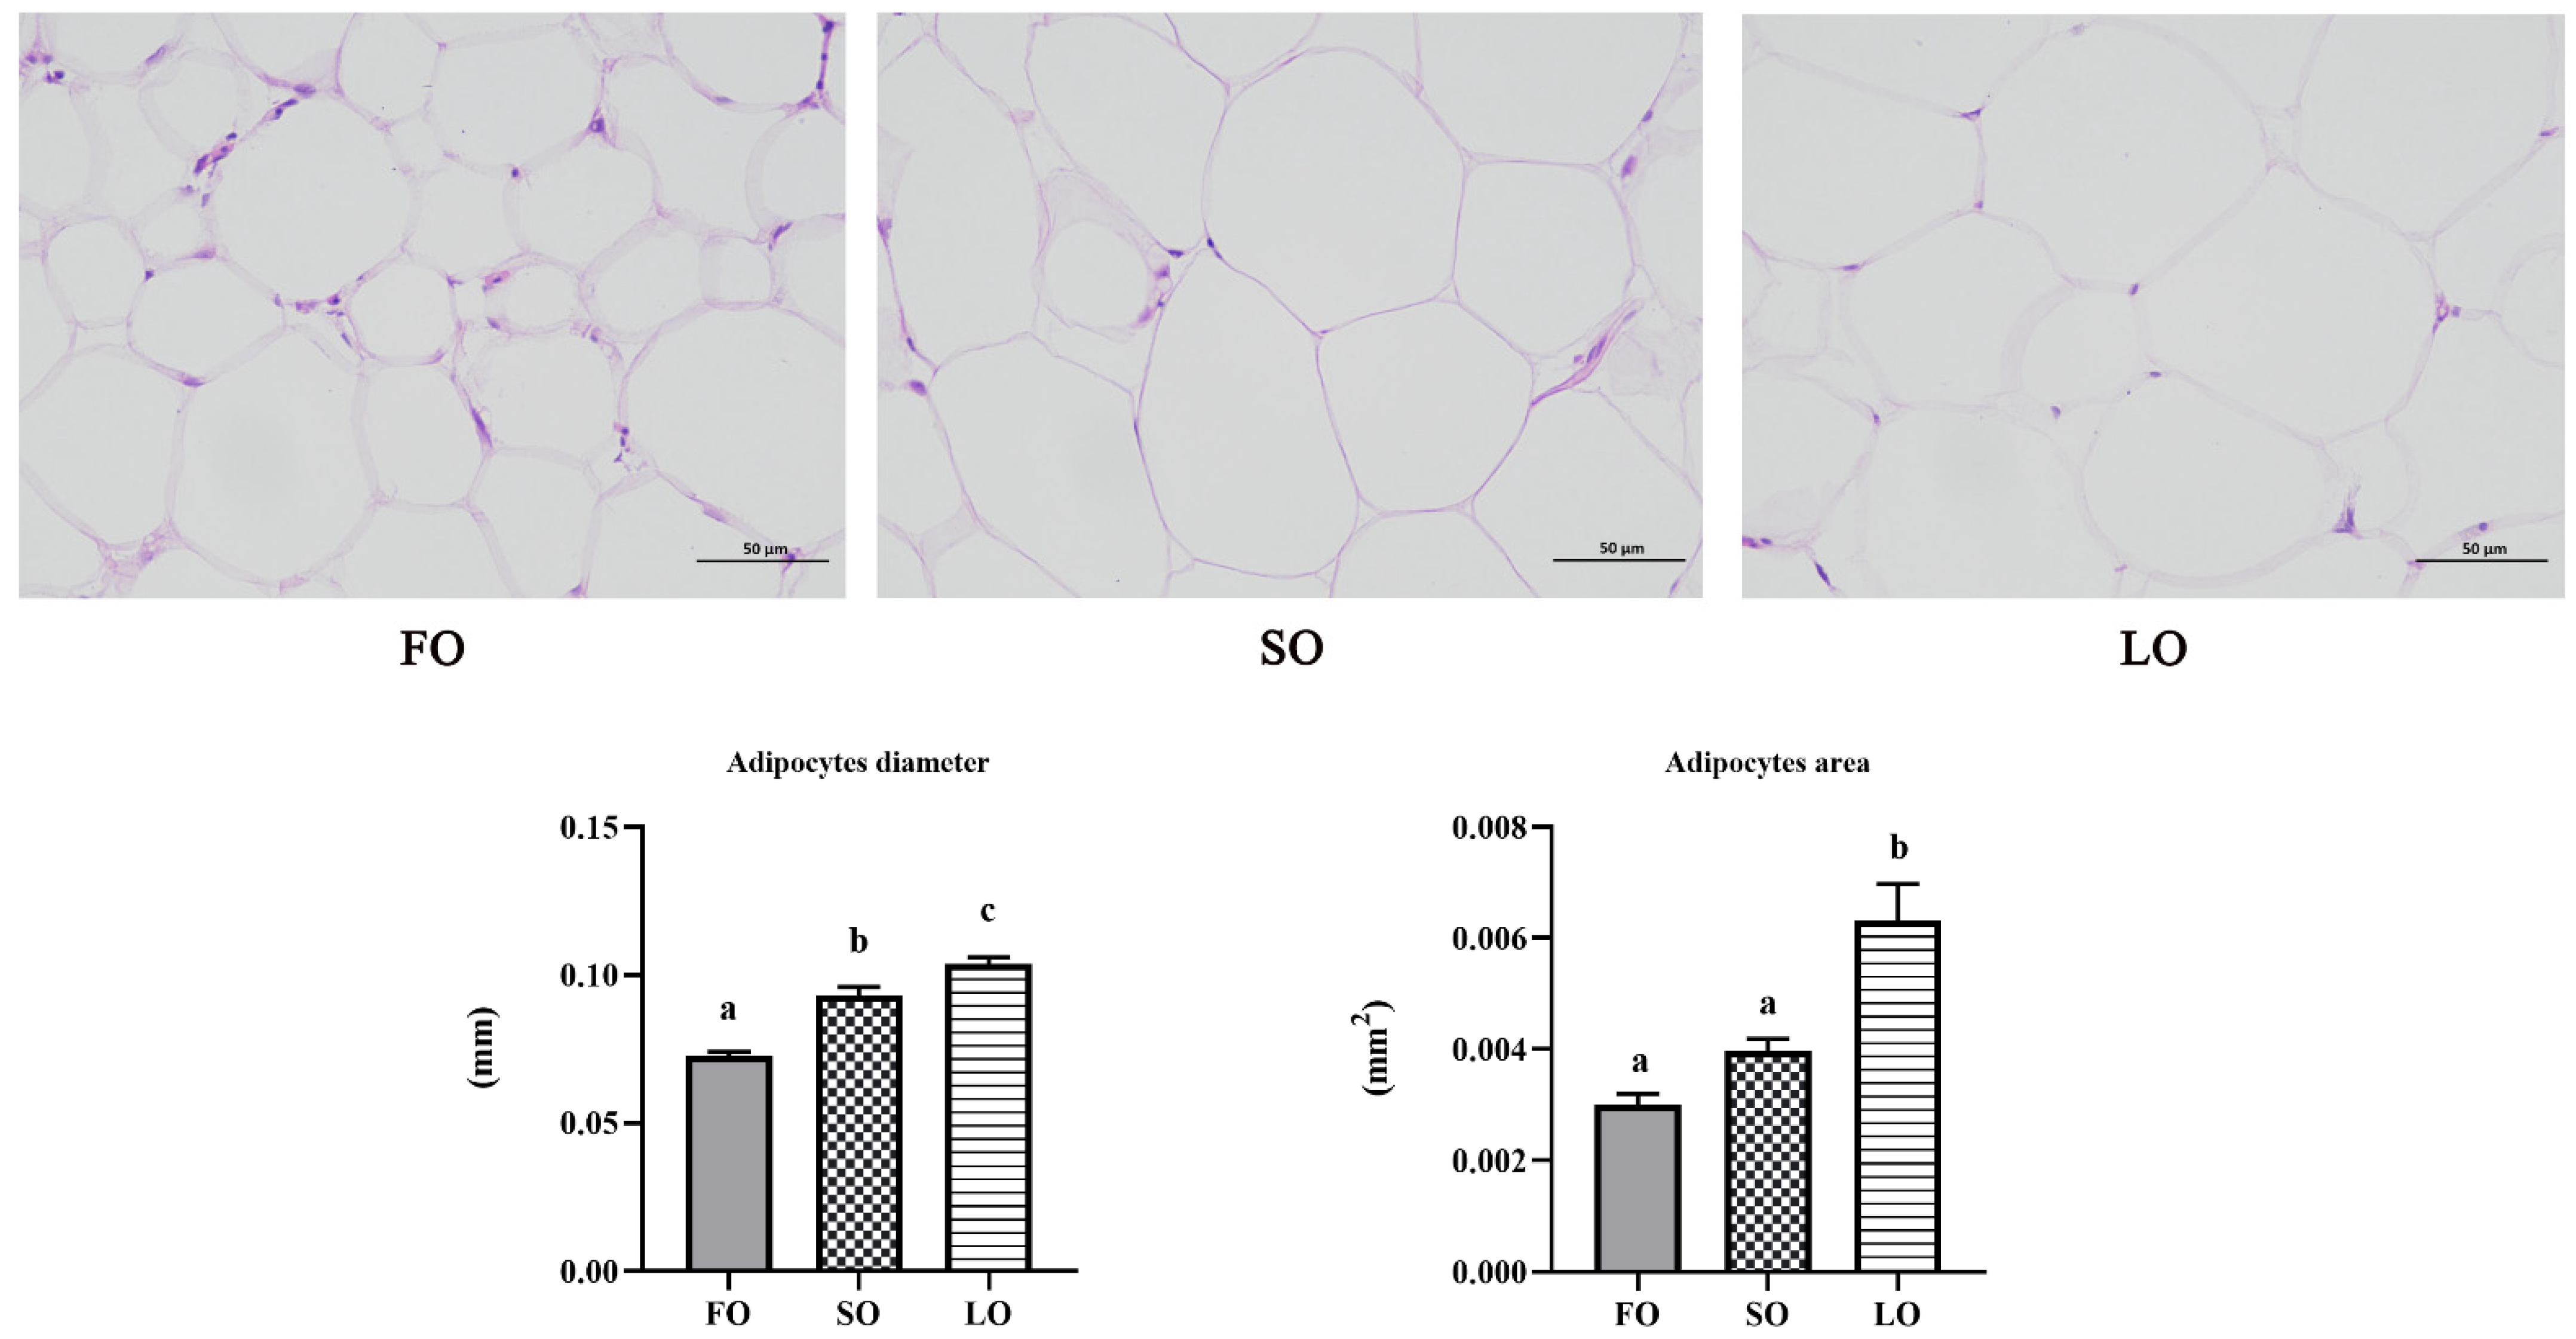
3.2.2. Dietary SO and LO Induced Hypertrophy in Adipose Tissue

Furthermore, H&E staining of adipose tissue showed that the average diameter and volume of adipocytes were significantly upregulated in fish fed the SO and LO diets compared with fish fed the FO diet (p < 0.05) (Figure 2). These results showed that dietary SO and LO increased hypertrophy of adipocytes in adipose tissue.

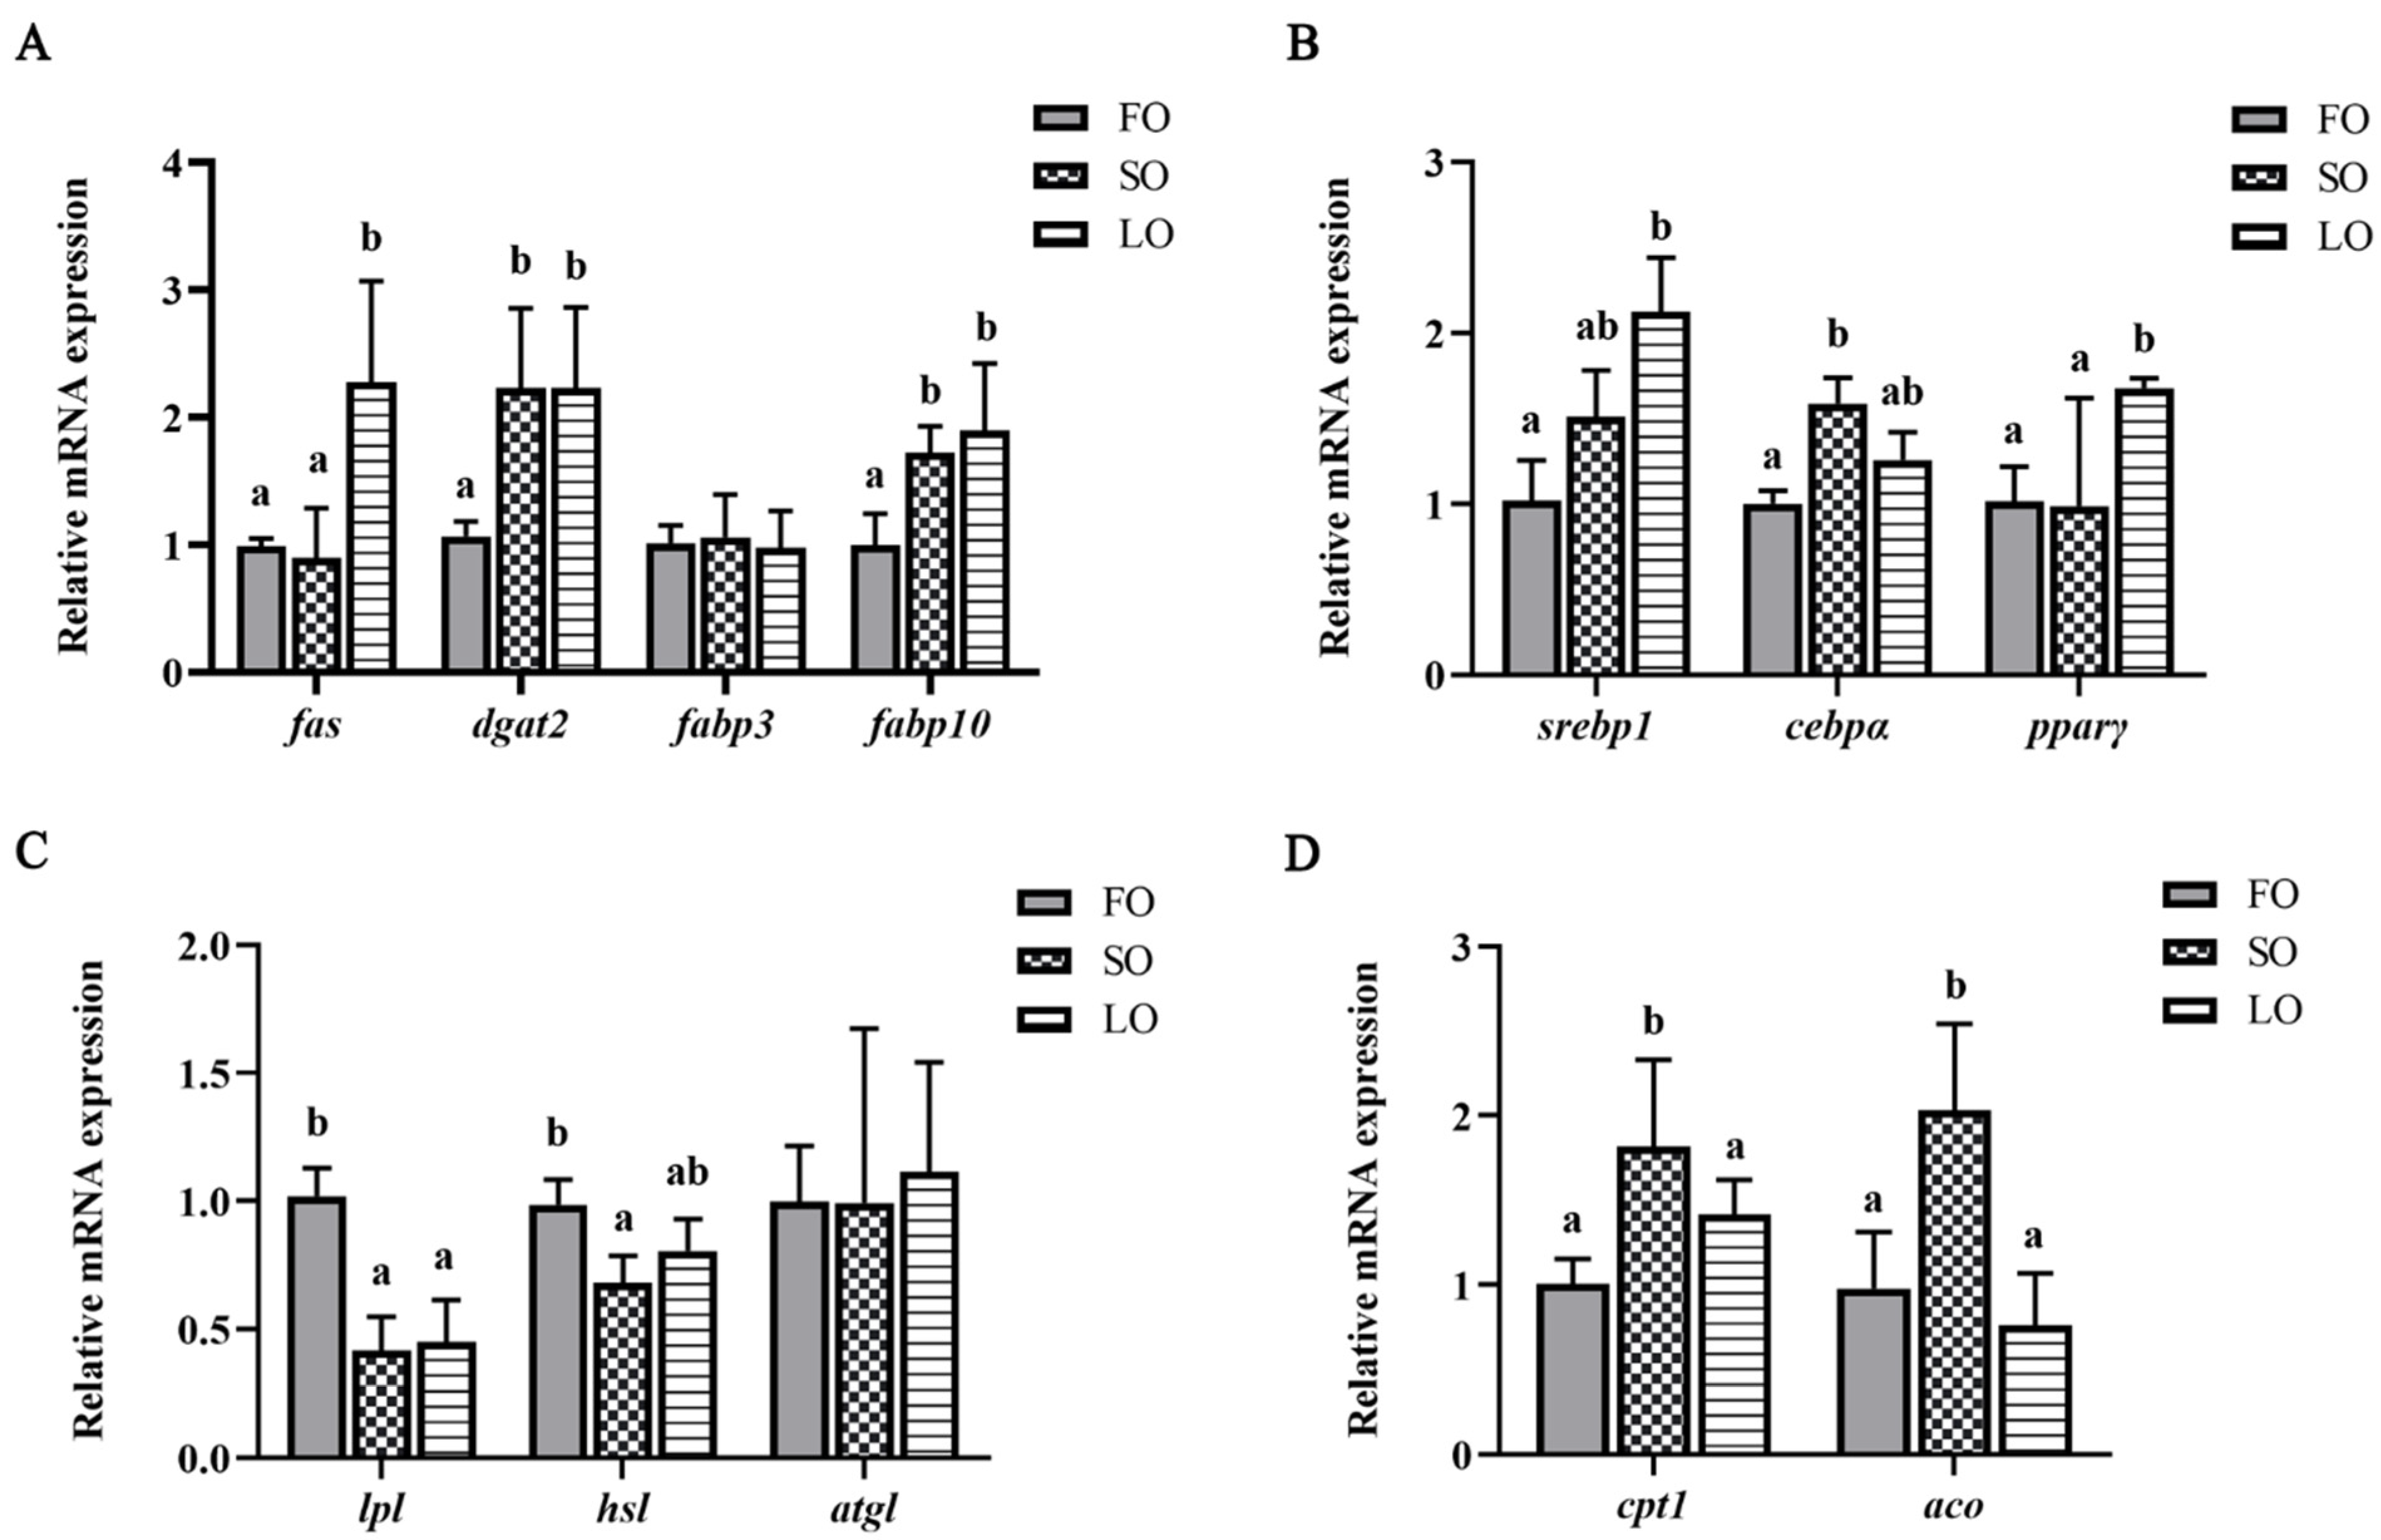
3.3. Effects of Dietary SO and LO on the Expression of Lipid-Metabolism-Related Genes in Adipose Tissue

We further explored changes in the expression of genes related to lipid metabolism in adipose tissue. Results showed that the replacement of FO with SO in diets significantly increased the mRNA expression levels of genes, including dgat2, fabp10, cebpα, cpt1 and aco, while the mRNA expression levels of lpl and hsl were significantly decreased (p < 0.05) (Figure 3A–D). The mRNA expression levels of fas, fabp3, srebp1, pparγ and atgl showed no significant differences between FO and SO groups (p > 0.05). Moreover, the mRNA expression levels of genes, including fas, dgat2, fabp10, srebp1 and pparγ, were significantly increased in the LO diet compared with the FO diet, while the mRNA expression level of lpl was significantly decreased (p < 0.05) (Figure 3A–D). The mRNA expression levels of fabp3, cebpα, cpt1, aco and atgl showed no significant differences between FO and LO groups (p > 0.05).

3.4. Dietary SO and LO Induced the Inflammatory Response of Adipose Tissue

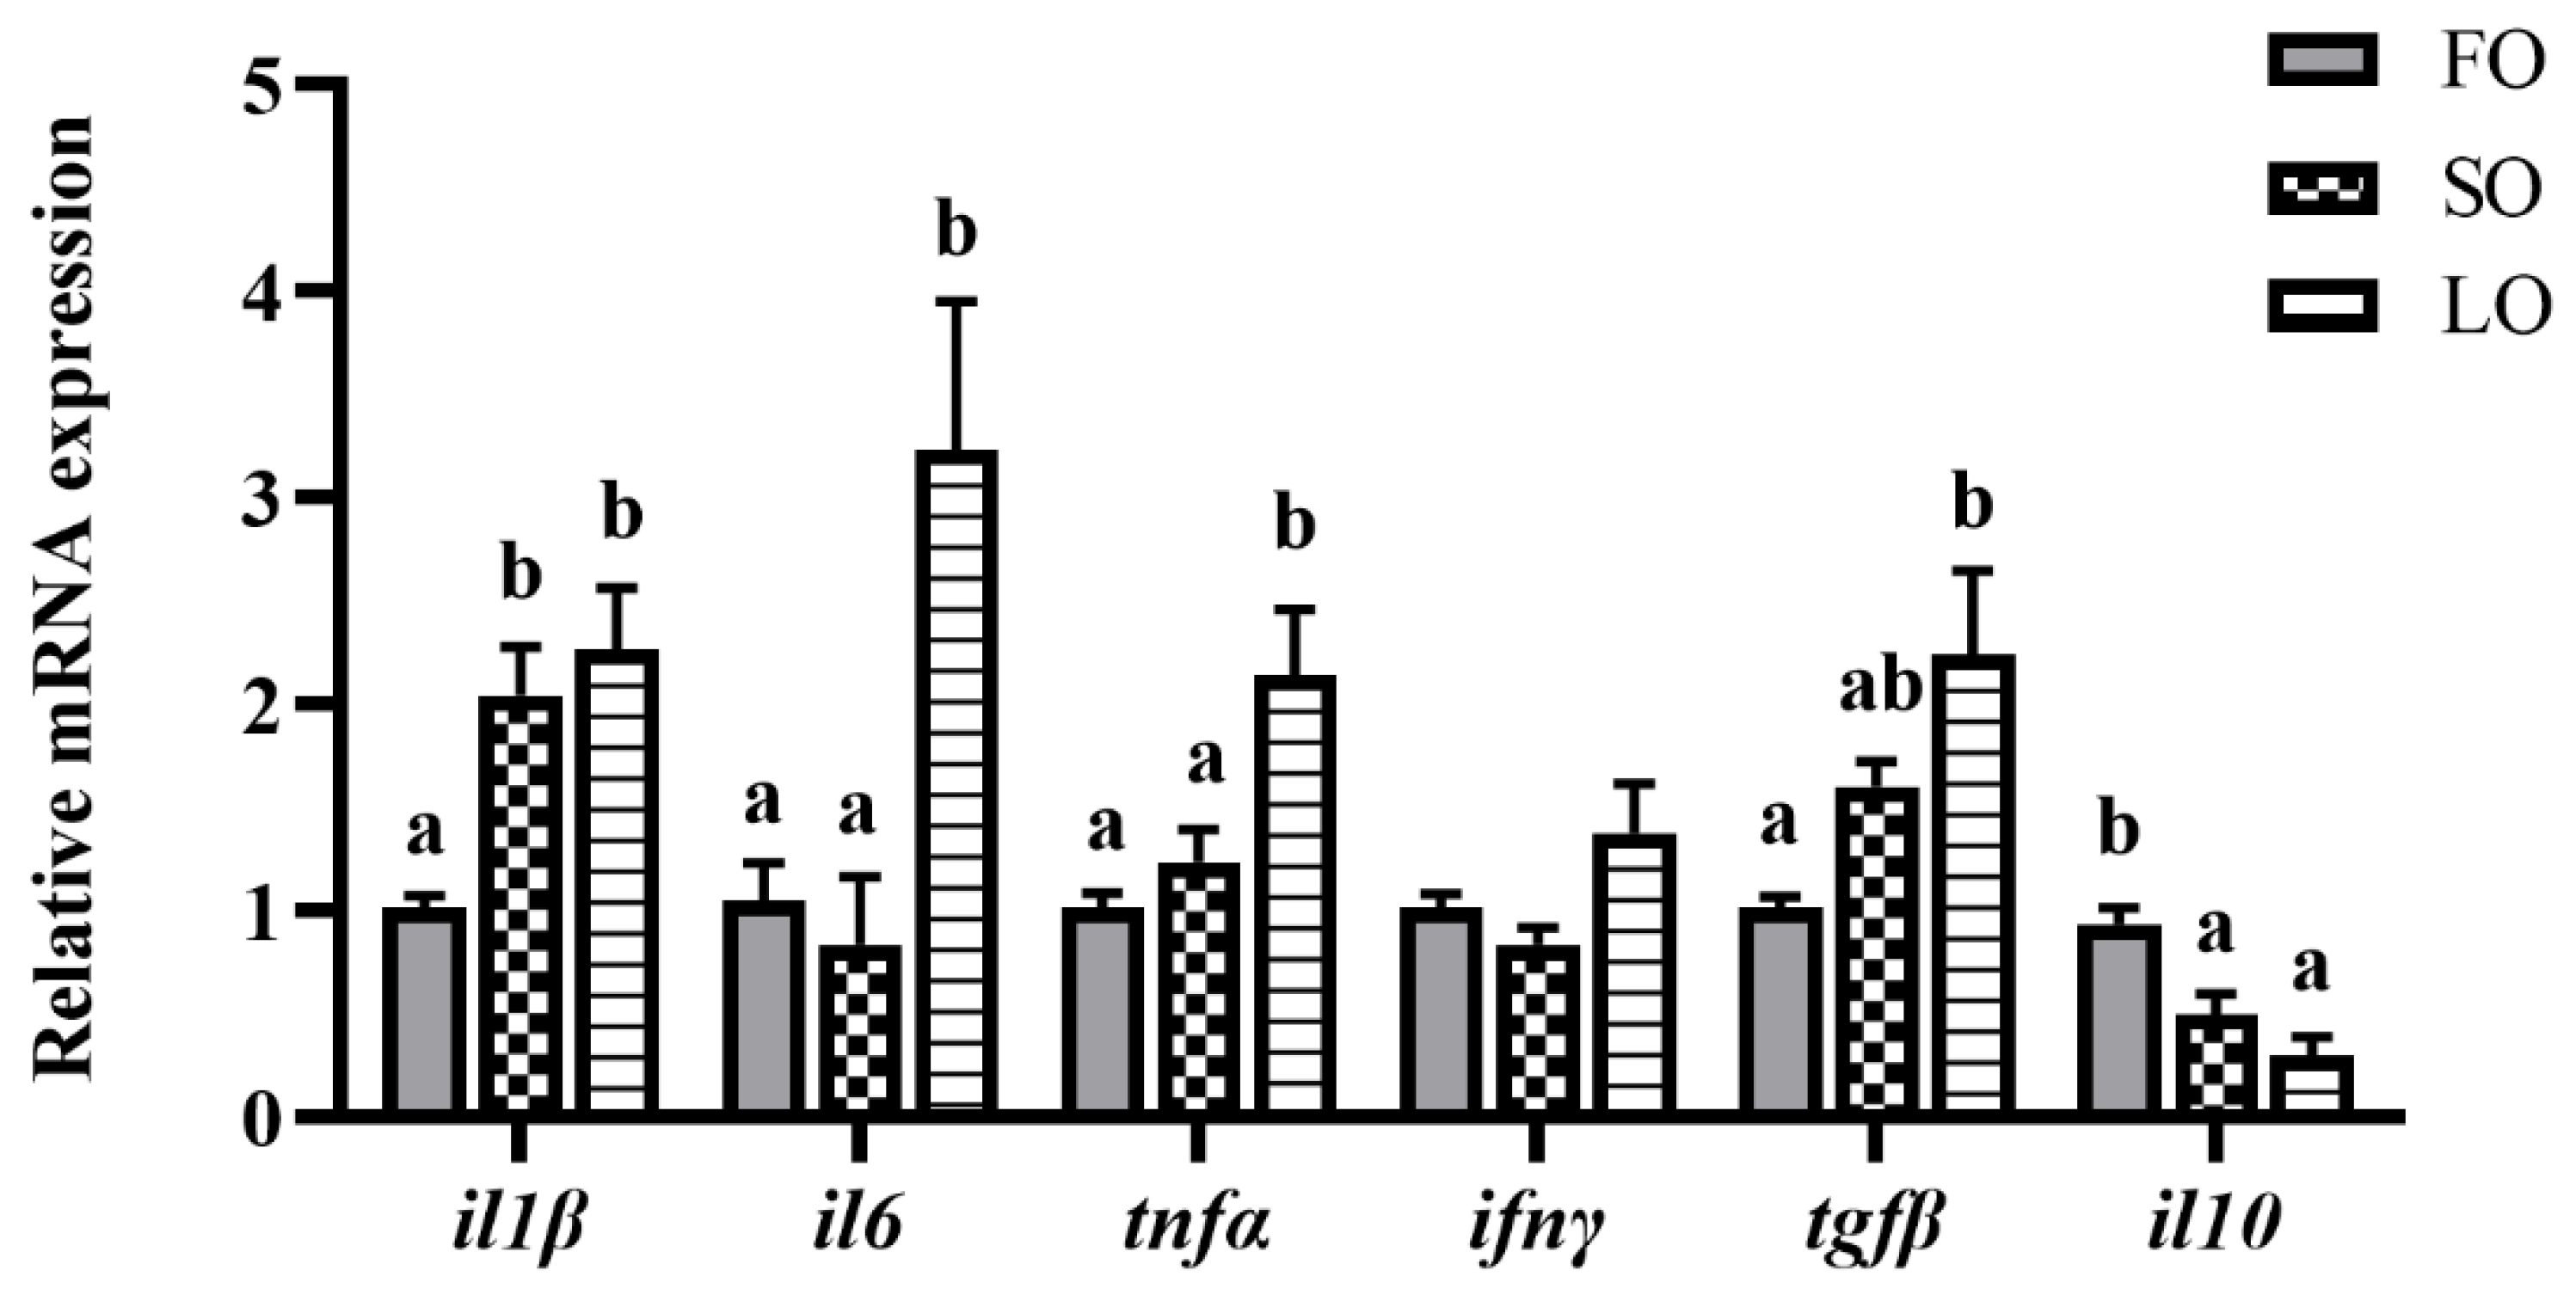
3.4.1. Dietary SO and LO Induced the Inflammation-Related Gene Expression

With the occurrence of excess fat accumulation, the effects of dietary SO and LO on the inflammatory response in adipose tissue were examined. Results showed that the replacement of FO with SO and LO in diets induced the inflammation-related gene expressions in adipose tissue. The SO diet significantly increased the mRNA expression level of il1β, while the mRNA expression of il10 was significantly decreased (p < 0.05) (Figure 4). The LO diet significantly increased the mRNA expression levels of il1β, il6, tnfα and tgfβ, while the mRNA expression of il10 was significantly decreased (p < 0.05) (Figure 4).

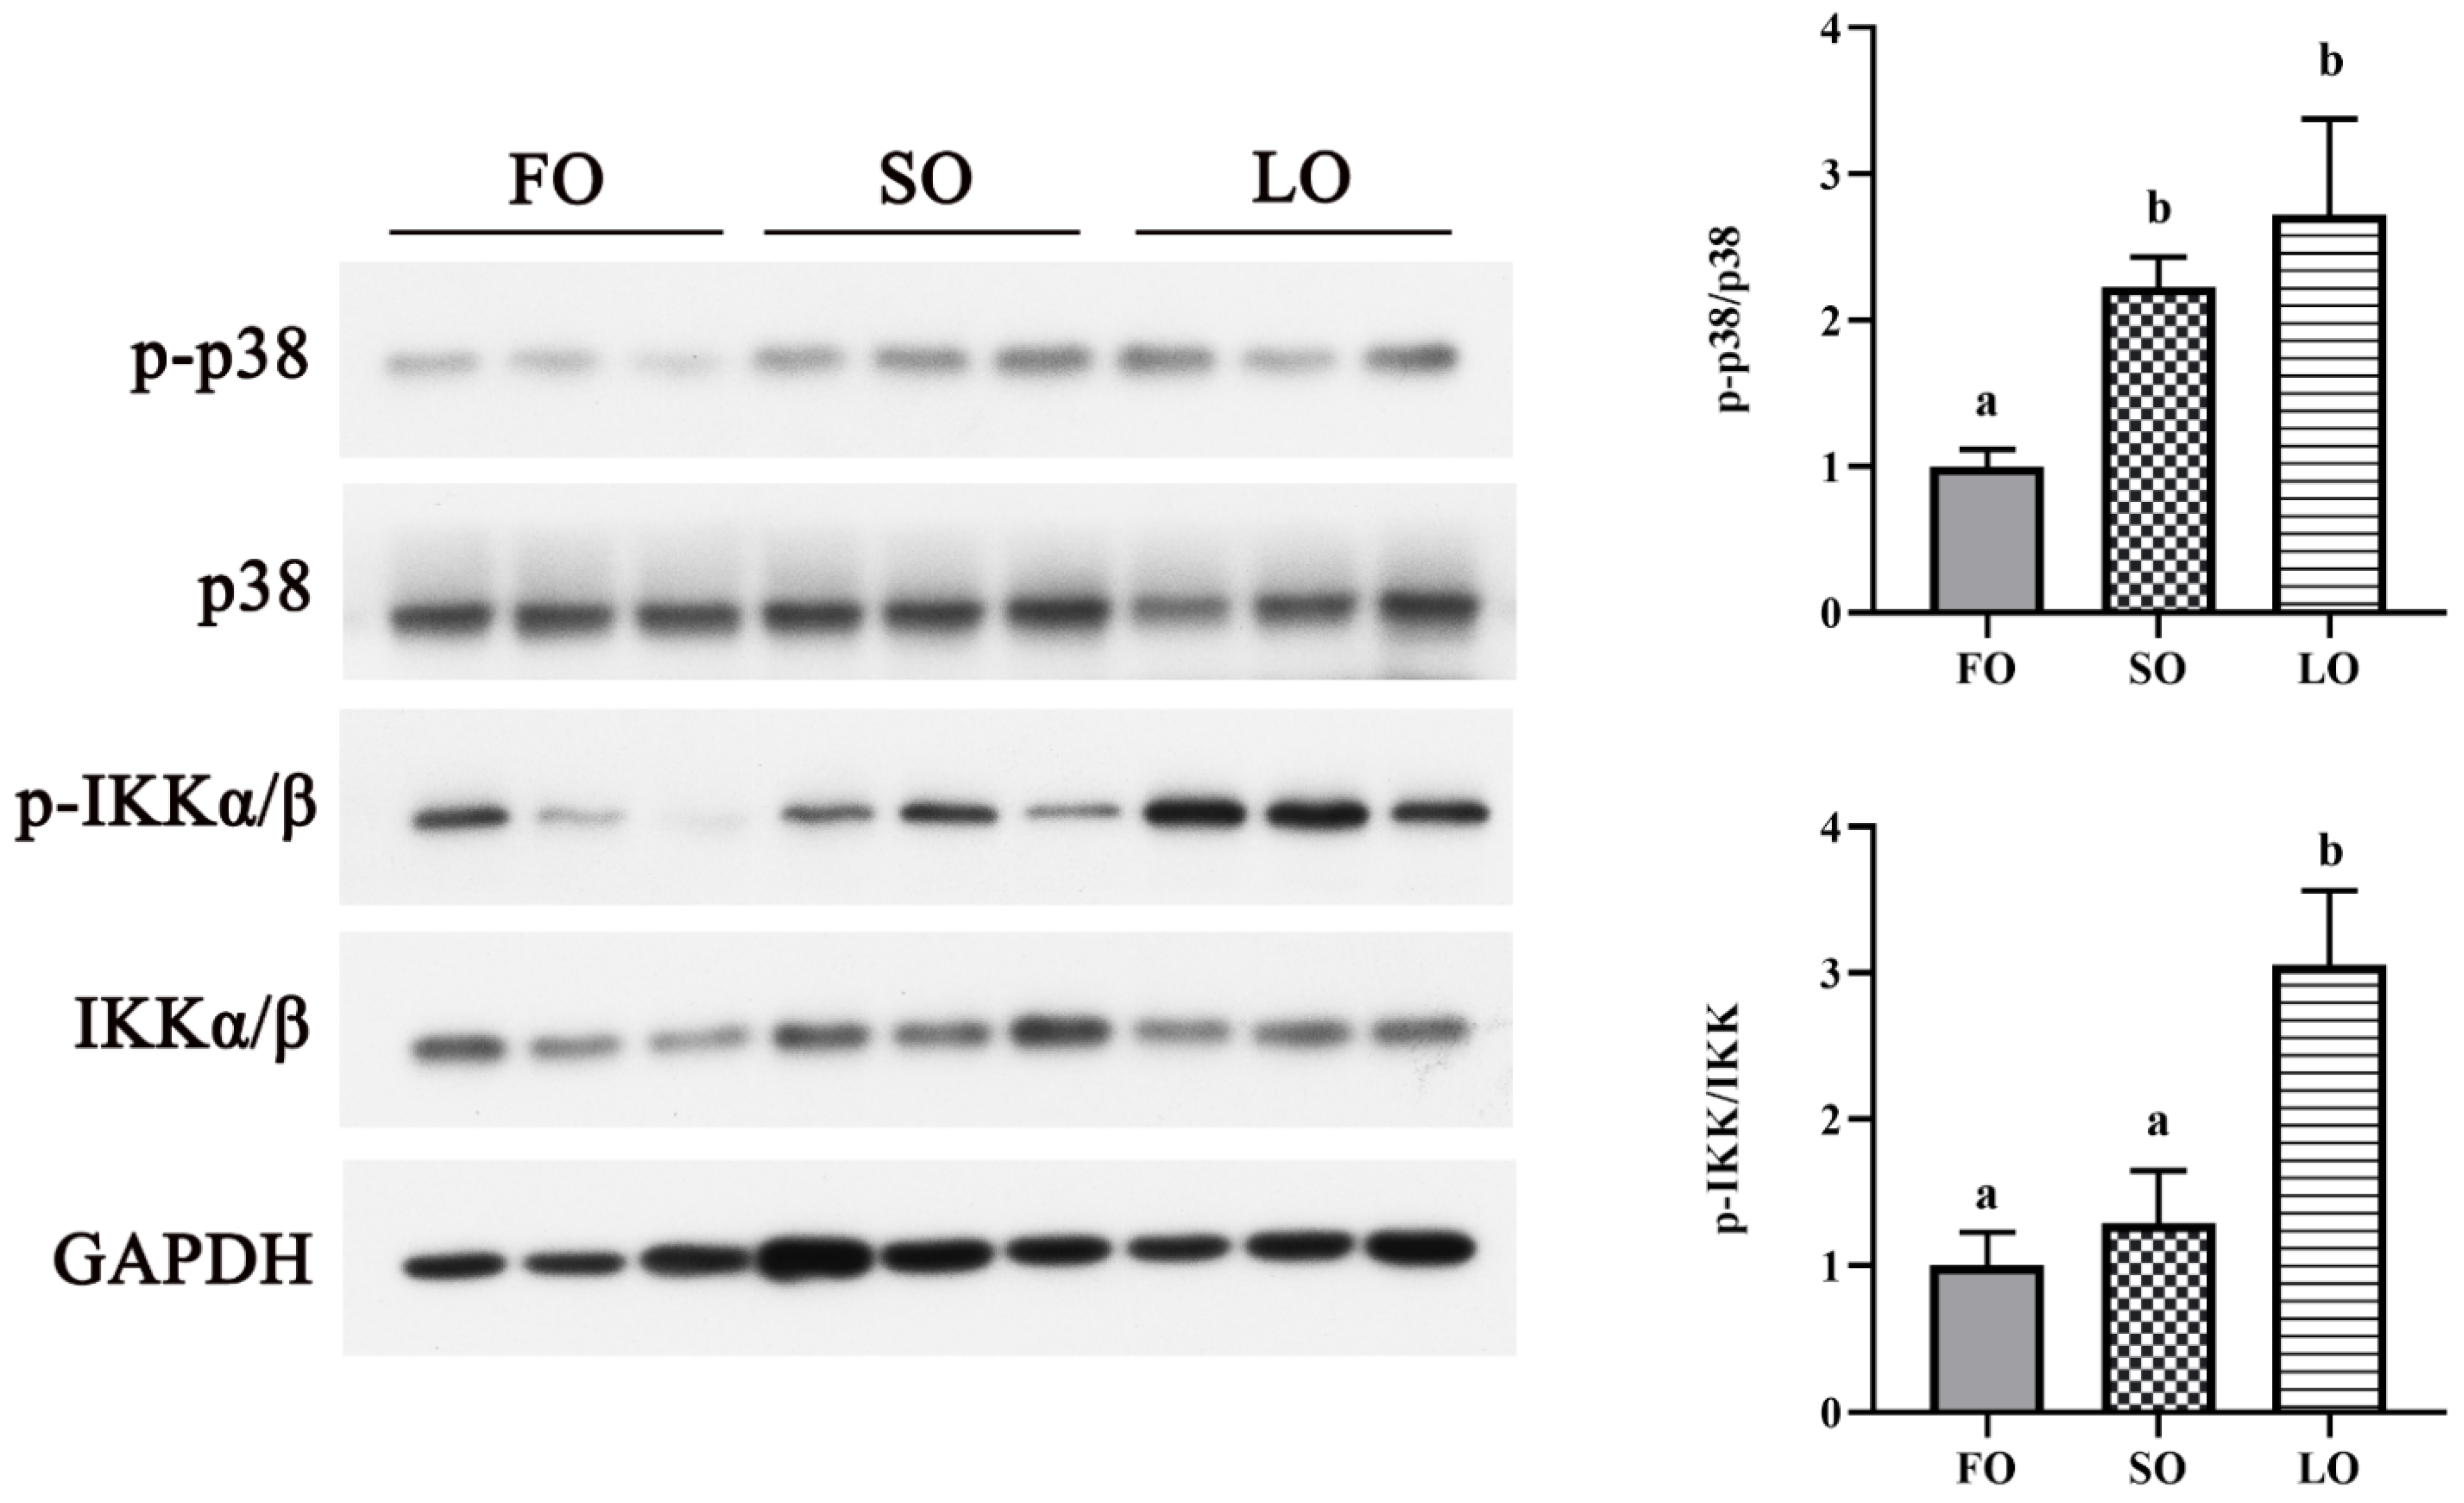
3.4.2. Dietary SO and LO Activated p38 MAPK and NF-κB Signaling Pathway

We further detected the activation of the inflammatory signaling pathway in adipose tissue. Compared with the control group, the SO diet significantly upregulated the phosphorylation level of p38 MAPK (p < 0.05), while the phosphorylation level of IKKα/β showed no significant differences (p > 0.05) (Figure 5). Meanwhile, the phosphorylation levels of p38 MAPK and IKKα/β were significantly increased in the LO diet compared with the FO diet (p < 0.05) (Figure 5).

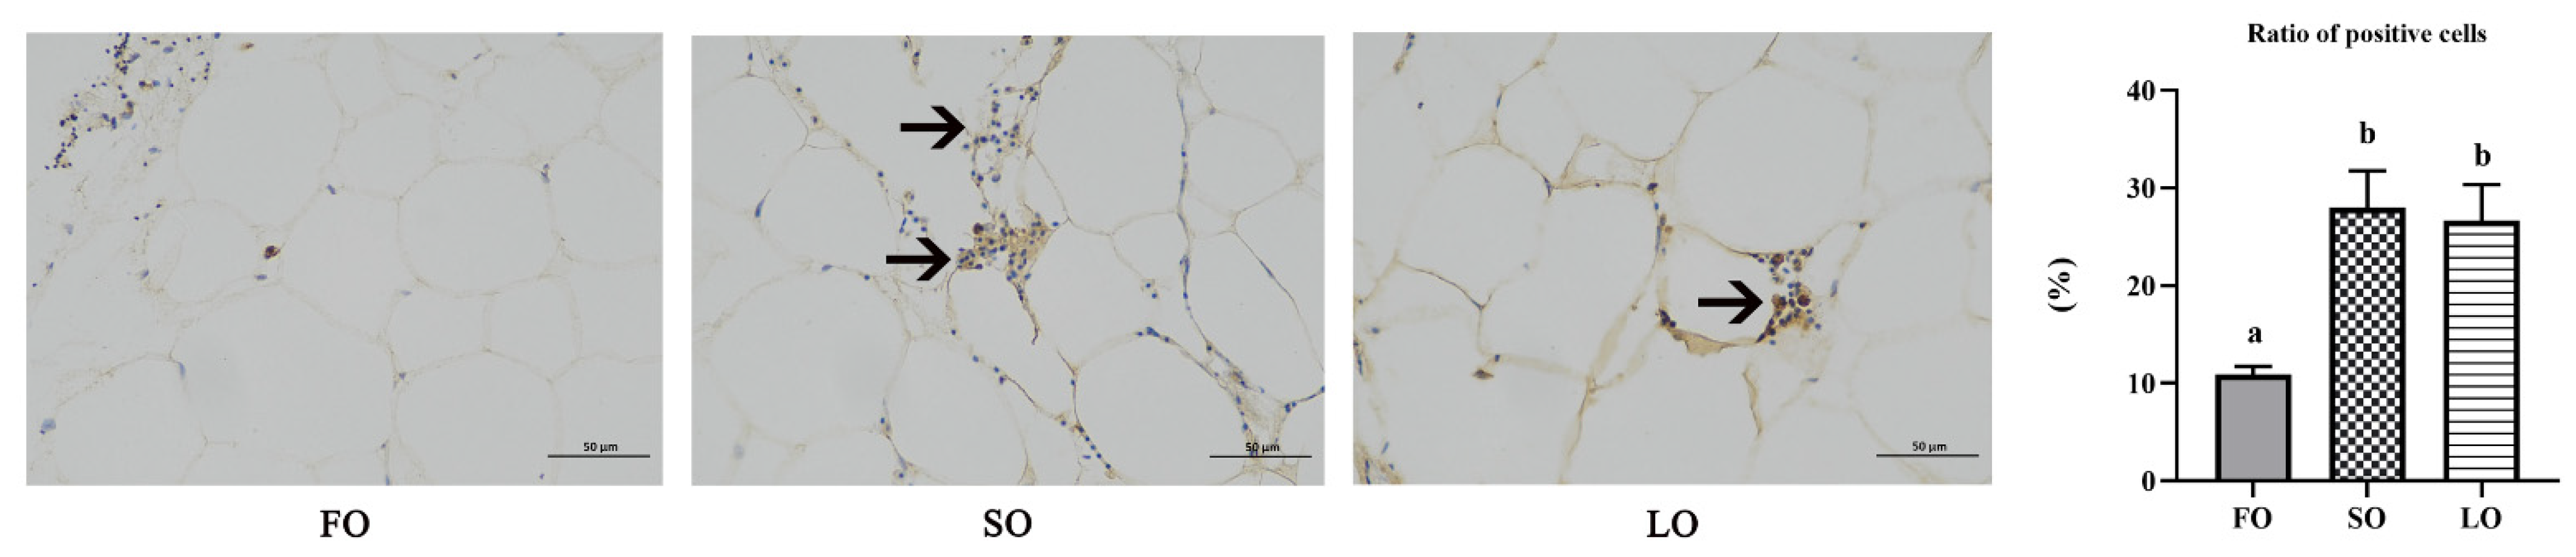
3.4.3. Dietary SO and LO Induced Infiltration and Polarization of Macrophages

The inflammation of adipose tissue is also characterized by an increased abundance of pro-inflammatory macrophages. We next investigated whether dietary SO and LO induced macrophage infiltration and polarization in AT. Immunohistochemistry results showed that there was a significant increase in CD68+ (the M1 marker) positive macrophages in SO and LO diets compared with the FO diet (p < 0.05) (Figure 6). These results illustrated that dietary SO and LO induced the inflammatory response of adipose tissue.

4. Discussion

With resource shortages and price rises in fish oil, dietary VO replacing FO is widely used in aquaculture [25]. However, because the replacement of vegetable oil changed the fatty acid composition and supply in the diet, high-percentage replacement and long-term feeding could reduce the growth performance and induce inflammatory response in fish. This severely limits the application of high-percentage dietary VO in aquaculture. In the present study, fatty acid profile of adipose tissue in large yellow croakers was changed according to the fatty acid composition of the experimental diets. Dietary SO and LO mostly increased LA and ALA in AT, respectively, while the proportion of n-3 LC-PUFA (DHA and EPA) was significantly decreased. However, most marine fish (such as large yellow croaker) cannot synthesize LC-PUFA using LA and ALA due to the lack and low activity of some key enzymes in the synthesis pathway, so n-3 LC-PUFA is the essential fatty acid for marine fish [26,27]. Therefore, one of the reasons for the reduced growth performance of fish caused by the high proportion of VO replacement may be the lack of essential fatty acids. In fish, the degree of alteration in fatty acid tissue is always based on the composition of different dietary fatty acid [28]. Previous studies on many fish species have shown that dietary VO influences the fatty acid composition in liver, muscle and head kidney [17,29,30]. However, little attention has been given to adipose tissue in fish. As the main lipid storage depot, adipose tissue can secrete FFA in circulation, which further affects the function in other tissues [31].
Many studies have shown that lipid metabolism in fish could be affected by the different dietary fatty acid compositions [32,33,34]. Therefore, we explored the effects of VO on lipid metabolism in AT. In this study, dietary SO and LO induced excess fat accumulation of AT by increasing the TG contents and adipocyte cell size, which reflected the hypertrophy and expansion of AT. Dietary LO showed a more effective capacity in inducing excess fat deposition than SO. Previous studies in gilthead sea bream have shown that a high level of mixed FO replacement could increase the adipocyte cell size and mesenteric fat mass [35,36]. However, the intermediate replacement level of VO showed no differences in visceral mass of Atlantic salmon [37]. Subsequently, the expression of genes related to lipid metabolism was examined to explain the hypertrophy of AT. The high level of SO and LO significantly increased the expression of genes related to lipogenesis and fatty acid transport, demonstrating an excessive TG biosynthesis and lipid intake. The promoted lipid accumulation and expanded adipocytes were consistent with the changes in lipid-metabolism-related gene expressions. In particular, dietary SO increased the fatty acid β-oxidation-related gene expressions (cpt1 and aco), while LO showed no changes. CTP1 and ACO are both rate-limiting enzymes for fatty acid β-oxidation in mitochondria and the increased expression is related to fatty acid utilization [38]. Previous studies in mammals have proven that abdominal fat accumulation could be inhibited by the induction of fatty acid β-oxidation [39,40]. Therefore, the increased gene expressions of fatty acid β-oxidation in SO diets may be to alleviate the excess fat accumulation of AT via negative feedback regulation, which was the probable reason for the lower TG content in the SO group than in the LO group. However, previous studies did not have uniform results on the changes in lipid-metabolism-related gene expressions in response to dietary VO in AT [4,36,41,42,43,44]. These inconsistent results may be due to the different replacement concentrations and the different resources of vegetable oil. Therefore, the lipid metabolism regulated by VO replacing FO remains to be further explored in fish.
Adipose tissue is not only a main site for lipid storage but also plays an important role during immunity modulation. Thus, we further explored whether dietary SO and LO could induce inflammatory response in AT. Dietary SO replacing FO increased the pro-inflammatory gene il1β expression and activated the p38 MAPK signaling pathway in AT of large yellow croaker. Meanwhile, LO increased the pro-inflammatory gene expressions of il1β, il6, tnfα and tgfβ and activated the p38 MAPK and NF-κB signaling pathways. In this study, LO showed a stronger ability to induce inflammatory response in AT. These results indicated that several inflammation-related signaling pathways play an essential role in VO-induced inflammation in fish. Previous studies in our lab have also shown that VO could induce inflammation by activating MAPK and TLR signaling pathways in liver and head kidney [21,29,45]. On the other hand, the inflammation of AT is closely related to the accumulation and M1 polarization of adipose tissue macrophages. Results in the present study showed that dietary SO and LO significantly induced infiltration and M1 polarization of macrophages in AT, which was consistent with previous studies in our lab using mixed SO and LO (1:1) replacing FO [16]. In mammals, evidence has suggested that n-3 LC-PUFA could suppress inflammation by preventing TLR4 translocation and subsequent downstream signaling activation and decreasing M1-type ATM polarization [46,47]. In addition, previous studies in Atlantic salmon and gilthead sea bream have shown that the increased ratio of n-6/n-3 reduced nonspecific immunity [48,49]. Therefore, the imbalance of n-6/n-3 PUFA ratio caused by the decrease in n-3 PUFA and the increase in n-6 PUFA is the main reason for the inflammatory response induced by VO replacing FO in AT of large yellow croakers.

5. Conclusions

In conclusion, the present study indicated that dietary VO replacing FO changed the fatty acid composition and induced excess fat accumulation by lipid dysmetabolism in adipose tissue of large yellow croakers. Moreover, VO diets induced the inflammatory response in adipose tissue, which was caused by the activation of the p38 MAPK and NF-κB pathways and the infiltration and polarization of macrophages. Compared with SO, LO showed a stronger capacity to induce fat accumulation and inflammatory response. These results could advance the understanding of the influence of dietary VO replacing FO and provide a potential target to decrease the lipid dysmetabolism and inflammatory response induced by VO, thereby improving the utilization rate of VO in aquafeed.

Author Contributions

D.X.: Conceptualization, Data curation, Formal analysis, Methodology, Visualization, Writing—review and editing. X.X.: Investigation, Validation. X.L.: Investigation, Methodology. N.X.: Visualization, Software. W.Z.: Visualization, Software, Writing—original draft. K.M.: Data curation, Resources, Supervision. Q.A.: Conceptualization, Data curation, Resources, Writing—review and editing, Supervision, Project administration, Funding acquisition. All authors have read and agreed to the published version of the manuscript.

Funding

This research was supported by the Key Program of National Natural Science Foundation of China (Grant no. 31830103), the National Science Fund for Distinguished Young Scholars of China (Grant no. 31525024), the Ten-thousand Talents Program (Grant no. 2018-29), the Scientific and Technological Innovation of Blue Granary (Grant no. 2018YFD0900402) and the earmarked fund for CARS-47.

Institutional Review Board Statement

The animal study protocol was approved by the Animal Care Committee of the Ocean University of China.

Informed Consent Statement

Not applicable.

Data Availability Statement

Data is contained within the article.

Conflicts of Interest

No conflict of interest exists in this manuscript and the manuscript is approved by all authors for publication.

References

  1. Tacon, A.G.; Metian, M. Aquaculture feed and food safety: The role of the food and agriculture organization and the Codex Alimentarius. Ann. N. Y. Acad. Sci. 2008, 1140, 50–59. [Google Scholar] [CrossRef] [PubMed]
  2. Turchini, G.M.; Torstensen, B.E.; Ng, W.-K. Fish oil replacement in finfish nutrition. Rev. Aquac. 2009, 1, 10–57. [Google Scholar] [CrossRef]
  3. Menoyo, D.; Izquierdo, M.S.; Robaina, L.; Gines, R.; Lopez-Bote, C.J.; Bautista, J.M. Adaptation of lipid metabolism, tissue composition and flesh quality in gilthead sea bream (Sparus aurata) to the replacement of dietary fish oil by linseed and soyabean oils. Br. J. Nutr. 2004, 92, 41–52. [Google Scholar] [CrossRef] [PubMed] [Green Version]
  4. Richard, N.; Kaushik, S.; Larroquet, L.; Panserat, S.; Corraze, G. Replacing dietary fish oil by vegetable oils has little effect on lipogenesis, lipid transport and tissue lipid uptake in rainbow trout (Oncorhynchus mykiss). Br. J. Nutr. 2006, 96, 299–309. [Google Scholar] [CrossRef] [PubMed] [Green Version]
  5. Kutluyer, F.; Sirkecioğlu, A.N.; Aksakal, E.; Aksakal, F.İ.; Tunç, A.; Günaydin, E. Effect of dietary fish oil replacement with plant oils on growth performance and gene expression in Juvenile Rainbow Trout (Oncorhynchus mykiss). Ann. Anim. Sci. 2017, 17, 1135–1153. [Google Scholar] [CrossRef]
  6. Li, X.; Ji, R.; Cui, K.; Chen, Q.; Chen, Q.; Fang, W.; Mai, K.; Zhang, Y.; Xu, W.; Ai, Q. High percentage of dietary palm oil suppressed growth and antioxidant capacity and induced the inflammation by activation of TLR-NF-kappaB signaling pathway in large yellow croaker (Larimichthys crocea). Fish Shellfish Immunol. 2019, 87, 600–608. [Google Scholar] [CrossRef]
  7. Li, X.; Chen, Q.; Li, Q.; Li, J.; Cui, K.; Zhang, Y.; Kong, A.; Zhang, Y.; Wan, M.; Mai, K.; et al. Effects of High Levels of Dietary Linseed Oil on the Growth Performance, Antioxidant Capacity, Hepatic Lipid Metabolism, and Expression of Inflammatory Genes in Large Yellow Croaker (Larimichthys crocea). Front. Physiol. 2021, 12, 631850. [Google Scholar] [CrossRef]
  8. Chen, Y.; Sun, Z.; Liang, Z.; Xie, Y.; Su, J.; Luo, Q.; Zhu, J.; Liu, Q.; Han, T.; Wang, A. Effects of dietary fish oil replacement by soybean oil and l-carnitine supplementation on growth performance, fatty acid composition, lipid metabolism and liver health of juvenile largemouth bass, Micropterus salmoides. Aquaculture 2020, 516, 734596. [Google Scholar] [CrossRef]
  9. Wu, J.-L.; Zhang, J.-L.; Du, X.-X.; Shen, Y.-J.; Lao, X.; Zhang, M.-L.; Chen, L.-Q.; Du, Z.-Y. Evaluation of the distribution of adipose tissues in fish using magnetic resonance imaging (MRI). Aquaculture 2015, 448, 112–122. [Google Scholar] [CrossRef]
  10. Rutkowski, J.M.; Stern, J.H.; Scherer, P.E. The cell biology of fat expansion. J. Cell Biol. 2015, 208, 501–512. [Google Scholar] [CrossRef]
  11. Morigny, P.; Boucher, J.; Arner, P.; Langin, D. Lipid and glucose metabolism in white adipocytes: Pathways, dysfunction and therapeutics. Nat. Rev. Endocrinol. 2021, 17, 276–295. [Google Scholar] [CrossRef] [PubMed]
  12. Grant, R.W.; Dixit, V.D. Adipose tissue as an immunological organ. Obesity 2015, 23, 512–518. [Google Scholar] [CrossRef] [PubMed] [Green Version]
  13. Zeyda, M.; Stulnig, T.M. Adipose tissue macrophages. Immunol. Lett. 2007, 112, 61–67. [Google Scholar] [CrossRef] [PubMed]
  14. Salmeron, C. Adipogenesis in fish. J. Exp. Biol. 2018, 221, jeb161588. [Google Scholar] [CrossRef] [PubMed] [Green Version]
  15. Veenstra, K.A.; Wangkahart, E.; Wang, T.; Tubbs, L.; Ben Arous, J.; Secombes, C.J. Rainbow trout (Oncorhynchus mykiss) adipose tissue undergoes major changes in immune gene expression following bacterial infection or stimulation with pro-inflammatory molecules. Dev. Comp. Immunol. 2018, 81, 83–94. [Google Scholar] [CrossRef] [PubMed]
  16. Tan, P.; Dong, X.; Mai, K.; Xu, W.; Ai, Q. Vegetable oil induced inflammatory response by altering TLR-NF-kappaB signalling, macrophages infiltration and polarization in adipose tissue of large yellow croaker (Larimichthys crocea). Fish Shellfish Immunol. 2016, 59, 398–405. [Google Scholar] [CrossRef] [PubMed]
  17. Qiu, H.; Jin, M.; Li, Y.; Lu, Y.; Hou, Y.; Zhou, Q. Dietary lipid sources influence fatty acid composition in tissue of large yellow croaker (Larmichthys crocea) by regulating triacylglycerol synthesis and catabolism at the transcriptional level. PLoS ONE 2017, 12, e0169985. [Google Scholar] [CrossRef] [PubMed] [Green Version]
  18. Gu, Z.; Mu, H.; Shen, H.; Deng, K.; Liu, D.; Yang, M.; Zhang, Y.; Zhang, W.; Mai, K. High level of dietary soybean oil affects the glucose and lipid metabolism in large yellow croaker Larimichthys crocea through the insulin-mediated PI3K/AKT signaling pathway. Comp. Biochem. Physiol. B Biochem. Mol. Biol. 2019, 231, 34–41. [Google Scholar] [CrossRef]
  19. Ding, T.; Xu, N.; Liu, Y.; Li, X.; Xiang, X.; Xu, D.; Yao, C.; Liu, Q.; Yin, Z.; Mai, K.; et al. Optimal amounts of coconut oil in diets improve the growth, antioxidant capacity and lipid metabolism of large yellow croaker (Larimichthys crocea). Mar. Life Sci. Technol. 2020, 2, 376–385. [Google Scholar] [CrossRef]
  20. Li, Y.; Pang, Y.; Xiang, X.; Du, J.; Mai, K.; Ai, Q. Molecular Cloning, Characterization, and Nutritional Regulation of Elovl6 in Large Yellow Croaker (Larimichthys crocea). Int. J. Mol. Sci. 2019, 20, 1801. [Google Scholar] [CrossRef]
  21. Li, X.; Cui, K.; Fang, W.; Chen, Q.; Xu, D.; Mai, K.; Zhang, Y.; Ai, Q. High level of dietary olive oil decreased growth, increased liver lipid deposition and induced inflammation by activating the p38 MAPK and JNK pathways in large yellow croaker (Larimichthys crocea). Fish Shellfish Immunol. 2019, 94, 157–165. [Google Scholar] [CrossRef] [PubMed]
  22. Livak, K.J.; Schmittgen, T.D. Analysis of relative gene expression data using real-time quantitative PCR and the 2−ΔΔCT Method. Methods 2001, 25, 402–408. [Google Scholar] [CrossRef] [PubMed]
  23. Xu, D.; Cui, K.; Li, Q.; Zhu, S.; Zhang, J.; Gao, S.; Hao, T.; Mai, K.; Ai, Q. Docosahexaenoic acid alleviates palmitic acid-induced inflammation of macrophages via TLR22-MAPK-PPARgamma/Nrf2 pathway in large yellow croaker (Larimichthys crocea). Antioxidants 2022, 11, 682. [Google Scholar] [CrossRef] [PubMed]
  24. Xu, D.; Li, Q.; Zhou, Y.; Shen, Y.; Lai, W.; Hao, T.; Ding, Y.; Mai, K.; Ai, Q. Functional analysis and regulation mechanism of interferon gamma in macrophages of large yellow croaker (Larimichthys crocea). Int. J. Biol. Macromol. 2022, 194, 153–162. [Google Scholar] [CrossRef] [PubMed]
  25. Tacon, A.G.J.; Metian, M. Global overview on the use of fish meal and fish oil in industrially compounded aquafeeds: Trends and future prospects. Aquaculture 2008, 285, 146–158. [Google Scholar] [CrossRef]
  26. Tocher, D.R. Omega-3 long-chain polyunsaturated fatty acids and aquaculture in perspective. Aquaculture 2015, 449, 94–107. [Google Scholar] [CrossRef]
  27. Tocher, D.R. Metabolism and functions of lipids and fatty acids in teleost fish. Rev. Fish. Sci. Aquac. 2003, 11, 107. [Google Scholar] [CrossRef]
  28. Xu, H.; Turchini, G.M.; Francis, D.S.; Liang, M.; Mock, T.S.; Rombenso, A.; Ai, Q. Are fish what they eat? A fatty acid’s perspective. Prog. Lipid Res. 2020, 80, 101064. [Google Scholar] [CrossRef]
  29. Cui, K.; Li, X.; Chen, Q.; Li, Q.; Gao, S.; Tan, P.; Mai, K.; Ai, Q. Effect of replacement of dietary fish oil with four vegetable oils on prostaglandin E2 synthetic pathway and expression of inflammatory genes in marine fish Larimichthys crocea. Fish Shellfish Immunol. 2020, 107, 529–536. [Google Scholar] [CrossRef]
  30. Nayak, M.; Saha, A.; Pradhan, A.; Samanta, M.; Giri, S.S. Dietary fish oil replacement by linseed oil: Effect on growth, nutrient utilization, tissue fatty acid composition and desaturase gene expression in silver barb (Puntius gonionotus) fingerlings. Comp. Biochem. Physiol. B Biochem. Mol. Biol. 2017, 205, 1–12. [Google Scholar] [CrossRef]
  31. Rondinone, C.M. Adipocyte-derived hormones, cytokines, and mediators. Endocrine 2006, 29, 81–90. [Google Scholar] [CrossRef]
  32. Teoh, C.-Y.; Turchini, G.M.; Ng, W.-K. Genetically improved farmed Nile tilapia and red hybrid tilapia showed differences in fatty acid metabolism when fed diets with added fish oil or a vegetable oil blend. Aquaculture 2011, 312, 126–136. [Google Scholar] [CrossRef]
  33. Ofori-Mensah, S.; Yıldız, M.; Arslan, M.; Eldem, V. Fish oil replacement with different vegetable oils in gilthead seabream, Sparus aurata diets: Effects on fatty acid metabolism based on whole-body fatty acid balance method and genes expression. Aquaculture 2020, 529, 735609. [Google Scholar] [CrossRef]
  34. Qin, G.; Xu, D.; Lou, B.; Chen, R.; Wang, L.; Tan, P. iTRAQ-based quantitative phosphoproteomics provides insights into the metabolic and physiological responses of a carnivorous marine fish (Nibea albiflora) fed a linseed oil-rich diet. J. Proteom. 2020, 228, 103917. [Google Scholar] [CrossRef]
  35. Cruz-Garcia, L.; Sanchez-Gurmaches, J.; Bouraoui, L.; Saera-Vila, A.; Perez-Sanchez, J.; Gutierrez, J.; Navarro, I. Changes in adipocyte cell size, gene expression of lipid metabolism markers, and lipolytic responses induced by dietary fish oil replacement in gilthead sea bream (Sparus aurata L.). Comp. Biochem. Physiol. A Mol. Integr. Physiol. 2011, 158, 391–399. [Google Scholar] [CrossRef] [Green Version]
  36. Sánchez-Moya, A.; García-Meilán, I.; Riera-Heredia, N.; Vélez, E.J.; Lutfi, E.; Fontanillas, R.; Gutiérrez, J.; Capilla, E.; Navarro, I. Effects of different dietary vegetable oils on growth and intestinal performance, lipid metabolism and flesh quality in gilthead sea bream. Aquaculture 2020, 519, 734881. [Google Scholar] [CrossRef]
  37. Torstensen, B.E.; Espe, M.; Stubhaug, I.; Lie, O. Dietary plant proteins and vegetable oil blends increase adiposity and plasma lipids in Atlantic salmon (Salmo salar L.). Br. J. Nutr. 2011, 106, 633–647. [Google Scholar] [CrossRef] [Green Version]
  38. Schreurs, M.; Kuipers, F.; van der Leij, F.R. Regulatory enzymes of mitochondrial beta-oxidation as targets for treatment of the metabolic syndrome. Obes. Rev. 2010, 11, 380–388. [Google Scholar] [CrossRef]
  39. Kim, J.E.; Choi, S.I.; Lee, H.R.; Hwang, I.S.; Lee, Y.J.; An, B.S.; Lee, S.H.; Kim, H.J.; Kang, B.C.; Hwang, D.Y. Selenium significantly inhibits adipocyte hypertrophy and abdominal fat accumulation in OLETF rats via induction of fatty acid beta-oxidation. Biol. Trace Elem. Res. 2012, 150, 360–370. [Google Scholar] [CrossRef]
  40. Noh, H.; Lee, H.; Kim, E.; Mu, L.; Rhee, Y.K.; Cho, C.W.; Chung, J. Inhibitory effect of a Cirsium setidens extract on hepatic fat accumulation in mice fed a high-fat diet via the induction of fatty acid beta-oxidation. Biosci. Biotechnol. Biochem. 2013, 77, 1424–1429. [Google Scholar] [CrossRef]
  41. Bouraoui, L.; SÁNchez-Gurmaches, J.; Cruz-Garcia, L.; Gutiérrez, J.; Benedito-Palos, L.; Pérez-Sánchez, J.; Navarro, I. Effect of dietary fish meal and fish oil replacement on lipogenic and lipoprotein lipase activities and plasma insulin in gilthead sea bream (Sparus aurata). Aquac. Nutr. 2011, 17, 54–63. [Google Scholar] [CrossRef] [Green Version]
  42. Torstensen, B.E.; Nanton, D.A.; Olsvik, P.A.; Sundvold, H.; Stubhaug, I. Gene expression of fatty acid-binding proteins, fatty acid transport proteins (cd36 and FATP) and β-oxidation-related genes in Atlantic salmon (Salmo salar L.) fed fish oil or vegetable oil. Aquac. Nutr. 2009, 15, 440–451. [Google Scholar] [CrossRef]
  43. Richard, N.; Mourente, G.; Kaushik, S.; Corraze, G. Replacement of a large portion of fish oil by vegetable oils does not affect lipogenesis, lipid transport and tissue lipid uptake in European seabass (Dicentrarchus labrax L.). Aquaculture 2006, 261, 1077–1087. [Google Scholar] [CrossRef]
  44. Shi, X.C.; Jin, A.; Sun, J.; Tian, J.J.; Ji, H.; Chen, L.Q.; Du, Z.Y. The protein-sparing effect of alpha-lipoic acid in juvenile grass carp, Ctenopharyngodon idellus: Effects on lipolysis, fatty acid beta-oxidation and protein synthesis. Br. J. Nutr. 2018, 120, 977–987. [Google Scholar] [CrossRef]
  45. Mu, H.; Wei, C.; Zhang, Y.; Zhou, H.; Pan, Y.; Chen, J.; Zhang, W.; Mai, K. Impacts of replacement of dietary fish oil by vegetable oils on growth performance, anti-oxidative capacity, and inflammatory response in large yellow croaker Larimichthys crocea. Fish Physiol. Biochem. 2020, 46, 231–245. [Google Scholar] [CrossRef]
  46. Wong, S.W.; Kwon, M.-J.; Choi, A.M.; Kim, H.-P.; Nakahira, K.; Hwang, D.H. Fatty acids modulate Toll-like receptor 4 activation through regulation of receptor dimerization and recruitment into lipid rafts in a reactive oxygen species-dependent manner. J. Biol. Chem. 2009, 284, 27384–27392. [Google Scholar] [CrossRef] [Green Version]
  47. De Boer, A.A.; Monk, J.M.; Robinson, L.E. Docosahexaenoic acid decreases pro-inflammatory mediators in an in vitro murine adipocyte macrophage co-culture model. PLoS ONE 2014, 9, e85037. [Google Scholar] [CrossRef] [Green Version]
  48. Thompson, K.; Tatner, M.; Henderson, R. Effects of dietary (n-3) and (n-6) polyunsaturated fatty acid ratio on the immune response of Atlantic salmon, Salmo salar L. Aquac. Nutr. 1996, 2, 21–31. [Google Scholar] [CrossRef]
  49. Montero, D.; Mathlouthi, F.; Tort, L.; Afonso, J.M.; Torrecillas, S.; Fernandez-Vaquero, A.; Negrin, D.; Izquierdo, M.S. Replacement of dietary fish oil by vegetable oils affects humoral immunity and expression of pro-inflammatory cytokines genes in gilthead sea bream Sparus aurata. Fish Shellfish Immunol. 2010, 29, 1073–1081. [Google Scholar] [CrossRef]
Figure 1. Effects of dietary SO and LO on triglyceride (TG) contents in adipose tissue of large yellow croaker. Results were presented as the means ± S.E.M. and were analyzed using Tukey’s test (n = 4). Bars labeled with the same letters are not significantly different (p > 0.05). FO, fish oil; SO, soybean oil; LO, linseed oil.
Jmse 10 01760 g001
Figure 2. H&E staining and the average diameter and area of adipocytes in adipose tissue of large yellow croaker fed SO and LO diets. Scale bars, 50 µm. Five adipocytes per slice were selected for measurement (n = 15). Results are presented as the means ± S.E.M. and were analyzed using Tukey’s test. Bars labeled with the same letters are not significantly different (p > 0.05).
Jmse 10 01760 g002
Figure 3. Effects of dietary SO and LO on the gene expressions related to lipid metabolism in adipose tissue of large yellow croaker. (A,B) Lipogenesis and fatty acid transport; (C) lipolysis; (D) fatty acid β-oxidation. Results are presented as the means ± S.E.M. and were analyzed using Tukey’s test (n = 4). Bars labeled with the same letters are not significantly different (p > 0.05; no difference between the unlabeled bars).
Jmse 10 01760 g003
Figure 4. Effects of dietary SO and LO on the mRNA expression of inflammatory-response-related genes in adipose tissue of large yellow croaker. Results are presented as the means ± S.E.M. and were analyzed using Tukey’s test (n = 4). Bars labeled with the same letters are not significantly different (p > 0.05; no difference between the unlabeled bars).
Jmse 10 01760 g004
Figure 5. Effects of dietary SO and LO on the activation of p38 MAPK and NF-κB signaling pathways in adipose tissue of large yellow croaker. Results are presented as the means ± S.E.M. and were analyzed using Tukey’s test (n = 3). Bars labeled with the same letters are not significantly different (p > 0.05).
Jmse 10 01760 g005
Figure 6. Immunohistochemical and the ratio of positive cells in adipose tissue of large yellow croaker fed SO and LO diets. Scale bars, 50 µm. Three visual fields per slice were selected for calculation (n = 9). Results are presented as the means ± S.E.M. and were analyzed using Tukey’s test. Bars labeled with the same letters are not significantly different (p > 0.05).
Jmse 10 01760 g006
Table 1. Formulation and chemical proximate composition of the experimental diets (%. dry matter) [7].
Ingredient aDietary Treatments b
Fish Oil (FO)Soybean Oil (SO)Linseed Oil (LO)
White fish meal b353535
Soybean meal b282828
Wheat meal b23.823.823.8
Soybean lecithin1.51.51.5
Vitamin premix c222
Mineral premix c222
Attractant mixture d0.10.10.1
Mold inhibitor e0.10.10.1
Fish oil7.5
Soybean oil 7.5
Linseed oil 7.5
Total100.00100.00100.00
Proximate analysis (%)
Crude protein42.2341.9842.42
Crude lipid12.0512.1912.14
a All of these ingredients were supplied by Great Seven Biotechnology Co., Ltd., Qingdao, China. b Fish meal (dry mater, %): 70.55% crude protein and 7.21% crude lipid; Soybean meal (dry mater, %): 51.89% crude protein and 1.16% crude lipid; Wheat meal (dry mater, %): 15.09% crude protein and 0.15% crude lipid. c Mixture of vitamin mixture and mineral mixture (mg/kg premix): cholecalciferol, 5 mg; retinol acetate, 32 mg; thiamin 25 mg; vitamin B12 (1%), 10 mg; riboflavin, 45 mg; pyridoxine HCl, 20 mg; ascorbic acid, 2000 mg; alpha-tocopherol (50%), 240 mg; vitamin K3, 10 mg; pantothenic acid, 60 mg; inositol, 800 mg; niacin acid, 200 mg; folic acid, 20 mg; biotin (2%), 60 mg; choline chloride (50%), 4000 mg; microcrystalline cellulose, 12.47 g; CuSO4·5H2O, 10 mg; Ca (IO3)2·6H2O (1%), 60 mg; CoCl2·6H2O (1%), 50 mg; FeSO4·H2O, 80 mg; MgSO4·7H2O, 1200 mg; MnSO4·H2O, 45 mg; NaSeSO3·5H2O (1%), 20 mg; ZnSO4·H2O, 50 mg; CaH2PO4·H2O, 10 g; zeolite, 8.485 g. d Attractant mixture: the mixture of 50% glycine acid and 50% betaine by weight. e Mold inhibitor: the mixture of 50% calcium propionic acid and 50% fumaric acid by weight.
Table 2. Fatty acid composition of the experimental diets (% total fatty acids) [20].
Fatty Acid
(% Total Fatty Acid)
FOSOLO
14:08.770.080.07
16:019.1510.325.39
18:04.263.953.76
20:01.180.270.17
∑SFA 133.2614.629.39
16:1n-711.850.090.10
18:1n-99.7526.1020.45
∑MUFA 221.626.1920.55
18:2n-6 (LA)1.5449.6515.52
20:4n-61.300.000.00
∑n-6 PUFA 32.8449.6515.52
18:3n-3 (ALA)0.764.9253.02
20:5n-3 (EPA)12.340.000.00
22:6n-3 (DHA)7.300.000.00
∑n-3 PUFA 420.404.9253.02
∑n-3 LC-PUFA 519.640.000.00
1 SFA: saturated fatty acids. 2 MUFA: monounsaturated fatty acids. 3 n-6 PUFA: n-6 polyunsaturated fatty acids. 4 n-3 PUFA: n-3 polyunsaturated fatty acids. 5 LC-PUFA: long chain-polyunsaturated fatty acids. Some fatty acids contents are minor, trace amount or not detected.
Table 3. Primers used for RT-qPCR and genes’ accession numbers.
Target
Gene
Forward (5’-3’)Reverse (3’-5’)Accession
Number
β-actinTTATGAAGGCTATGCCCTGCCTGAAGGAGTAGCCACGCTCTGTXM_010732326
fasCAGCCACAGTGAGGTCATCCTGAGGACATTGAGCCAGACACXM_027289105
dgat2TTCGGTGCTTTCTGCAACTTCGAAGGATGGGGAAGCGGAAGTXM_019255019
fabp3CCAAACCCACCACTATCATCTCAGGCACCATCTTTCCCTCCTCTATTGXM_010731330
fabp10CAATGGAACATGGCAGGTTTACGTGATTGGCTTGATGTCCTTGGCXM_010738161
srebp1TCTCCTTGCAGTCTGAGCCAACTCAGCCCTTGGATATGAGCCTXM_010730705
cebpαGAGGCGGGAAGCACAAGAAGTTCGCCTTGTCGCGGCTCTTACXM_027281242
pparγTGTCCGAGCTGGAAGACAACTGGGGTCATAGGGCATACCAXM_010731330
lplGAATTCAACGCGGAAACACAGACGCTCATAGAGGGCAGACACNM_001303397
hslTCACAAAGTGCCTCAATGCCCAAACGGGTTCCTGATAATGGXM_019254673
atglATTTCCGACAACCTCCCTCACATCACTGCTCCCTCTTTCANM_001303332
cpt1αGCTGAGCCTGGTGAAGATGTTCTCCATTTGGTTGAATTGTTTACTGJX434612
acoAGTGCCCAGATGATCTTGAAGCCTGCCAGAGGTAACCATTTCCTXM_010748324
il1βCATAGGGATGGGGACAACGAAGGGGACGGACACAAGGGTAXM_010736551
il6CGACACACCCACTATTTACAACTCCCATTTTCTGAACTGCCTCXM_010734753
tnfαACACCTCTCAGCCACAGGATCCGTGTCCCACTCCATAGTTNM_001303385
ifnγTCAGACCTCCGCACCATCAGCAACCATTGTAACGCCACTTAXM_010751697
tgfβATCTTCCGTCTTCCAAACCACCATTCACTCACTGCCTCTGTXM_027280465
il10AGTCGGTTACTTTCTGTGGTGTGTATGACGCAATATGGTCTGXM_010738826
fas, fatty acid synthase; dgat2, diacylglycerol acyltransferase 2; fabp3, fatty acid binding protein 3; fabp10, fatty acid binding protein 10; srebp1, sterol regulatory element binding transcription factor 1; cebpα, CCAAT/enhancer binding protein α; pparγ, peroxisome proliferators-activated receptor γ; lpl, lipoprotein lipase; hsl, hormone sensitive lipase; atgl, adipose triglyceride lipase; carnitine palmitoyl transferase-1; aco, acyl CoA oxidase; il1β, interleukin-1β; il6, interleukin-6; tnfα, tumor necrosis factor-α; ifnγ, interferon-γ; tgfβ, transforming growth factor-β; il10, interleukin-10.
Table 4. Fatty acid profiles (% total fatty acids) in adipose tissue of large yellow croaker (Larmichthys crocea) fed diets with FO replaced by SO and LO.
FOSOp-ValueLOp-Value
12:00.325 ± 0.010.151 ± 0.0220.0060.09 ± 0.01<0.001
14:03.422 ± 0.111.149 ± 0.04<0.0011.11 ± 0.06<0.001
16:019.544 ± 1.7613.689 ± 0.430.03512.82 ± 0.320.020
18:04.815 ± 0.394.39 ± 0.120.3734.888 ± 0.380.899
20:00.143 ± 0.020.326 ± 0.060.0030.323 ± 0.020.002
∑SFA 128.249 ± 0.9219.705 ± 0.280.01919.231 ± 0.260.013
16:1n-75.686 ± 0.361.712 ± 0.06 <0.0011.599 ± 0.05 <0.001
18:1n-915.444 ± 0.3513.794 ± 1.850.56610.678 ± 4.170.318
∑MUFA 221.13 ± 0.3315.461 ± 1.82 0.11012.277 ± 4.19 0.104
18:2n-6 (LA)10.679 ± 0.7634.283 ± 1.27 <0.00120.502 ± 0.44 <0.001
20:4n-60.174 ± 0.03 0.08 ± 0.02 0.1090.127 ± 0.02 0.262
∑n-6 PUFA 310.853 ± 0.07934.363 ± 1.19 <0.00120.629 ± 0.4 <0.001
18:3n-3 (ALA)1.732 ± 0.114.285 ± 0.14 <0.00124.134 ± 0.18 <0.001
20:5n-3 (EPA)0.712 ± 0.060.277 ± 0.03 0.0040.375 ± 0.05 0.013
22:6n-3 (DHA)0.931 ± 0.090.366 ± 0.04 0.0060.359 ± 0.02 0.003
∑n-3 PUFA 43.375 ± 0.134.928 ± 0,17 0.00624.868 ± 0.19 <0.001
∑n-3 LC-PUFA 51.643 ± 0.080.643 ± 0.03 0.0050.734 ± 0.04 0.005
1 SFA: saturated fatty acids. 2 MUFA: monounsaturated fatty acids. 3 n-6 PUFA: n-6 polyunsaturated fatty acids. 4 n-3 PUFA: n-3 polyunsaturated fatty acids. 5 LC-PUFA: long chain-polyunsaturated fatty acids. Some fatty acids are minor, trace amount or not detected. Data are presented as means ± S.E.M. Data were determined by independent sample t-tests and the p-value of each parameter was shown.
Publisher’s Note: MDPI stays neutral with regard to jurisdictional claims in published maps and institutional affiliations.

