Article

Spatial Distribution of Tsunami Hazard Posed by Earthquakes along the Manila Trench

State Key Laboratory of Hydroscience and Engineering, Department of Hydraulic Engineering, Tsinghua University, Beijing 100084, China
*
Author to whom correspondence should be addressed.
J. Mar. Sci. Eng. 2022, 10(10), 1449; https://doi.org/10.3390/jmse10101449
Submission received: 29 July 2022 / Revised: 27 September 2022 / Accepted: 4 October 2022 / Published: 7 October 2022
(This article belongs to the Special Issue Coastal Risk Assessment and Management)

Abstract

:
Quantitative probability has been computed for the tsunami hazard posed by earthquakes from the Manila Trench, which has been regarded as a huge threat in the South China Sea. This study provides a spatial distribution of the tsunami hazard covering the affected area with a spatial resolution of 0.1° for disaster prevention of islands and continental coasts. The quantitative probability of the tsunami hazard is computed by an efficient model, which can realize a large amount of potential tsunami scenarios analysis in order to consider the randomness and uncertainty in earthquake magnitude, source location and focal depth. In the model, for each potential tsunami scenario, the occurrence probability of the corresponding earthquake and the intensity of tsunami waves at each target location are computed. The occurrence probability of each scenario is estimated based on the historical earthquake records. Then, the subsequent tsunami caused by each scenario is computed using a new, efficient approach, instead of direct simulation using an ocean dynamics model. A total of 1,380,000 scenarios are computed in order to obtain a stable statistical result. Based on the results, the spatial distribution of the tsunami hazard is discussed and high-hazard regions along the coast have been identified.

1. Introduction

Hazard regionalization is an important part of disaster prevention and mitigation in ocean and coastal management. Since tsunamis are one of the most hazardous disasters in continental coasts and islands, quantifying the tsunami hazard probability can be helpful in developing the disaster strategy and the designing of nearshore and offshore structures. The Manila Trench is located on the east of the South China Sea and to the west of Luzon Island, where the Eurasian plate has subducted beneath the Philippine plate at a fast speed of 55–91 mm per year [1,2,3,4]. Some studies showed that large earthquakes can occur in this region and the maximum possible magnitude is estimated to be 8.8–9.2 [5]. Once a large earthquake happens, it might trigger dangerous tsunami in the South China Sea. Thus, the Manila Trench has been widely considered as the main source of tsunami hazards in the South China Sea [6,7].
Over the past two decades, some studies have assessed the tsunami hazard of some coastal areas in the South China Sea. For example, Wu and Huang modeled tsunami hazards from the Manila Trench to Taiwan [8]. Dao et al. analyzed tsunami hazards to the coast of China, Vietnam, Brunei, Malaysia, Singapore and the Philippines [9]. Ren et al. investigated worst-case-scenario tsunami hazards for cities in Guangdong Province, Hainan Island and Taiwan Island [10]. However, these studies are mainly based on several hypothetical extreme tsunami scenarios. The Probabilistic Tsunami Hazard Assessment (PTHA) can provide a more comprehensive understanding by quantifying the probability and it has been widely used in coastal areas all over the world [11,12,13,14,15,16]. There are also some studies which applied PTHA to some target coasts in the South China Sea through Monte Carlo [15,17]. Studies have been conducted which concentrated on some specific important coastal cities. However, there is still lack of a dataset covering the wider region in and around the South China Sea. Zhang and Niu proposed an efficient approach to carry out PTHA and applied it to the coast of Hainan Island [18]. The method is based on the linear assumption of tsunami waves in deep water and makes it possible to calculate a large number of scenarios and generate a dataset. A dataset covering the affected area can provide an overall picture of the hazard distribution, while it can be a boundary condition for further risk assessment in a local region [19].
The aim of this study is to establish a tsunami hazard dataset with a spatial resolution of 0.1° covering the affected area of the earthquakes in the Manila Trench, and to clarify the feature of spatial distribution of the tsunami hazard. In Section 2, the assessment model and basic data are introduced. In Section 3, parameters of earthquakes around the Manila Trench are statistically analyzed. The sampling, simulation and statistics of potential tsunami scenarios are briefly described and discussed. The occurrence probability of the corresponding potential earthquake scenarios is analyzed. Then, based on the occurrence probability of each earthquake scenario and the intensity of the subsequent tsunami simulated, the quantitative probability of tsunami wave height at each location is calculated and, finally, the spatial distribution of the tsunami hazard is shown in Section 4.

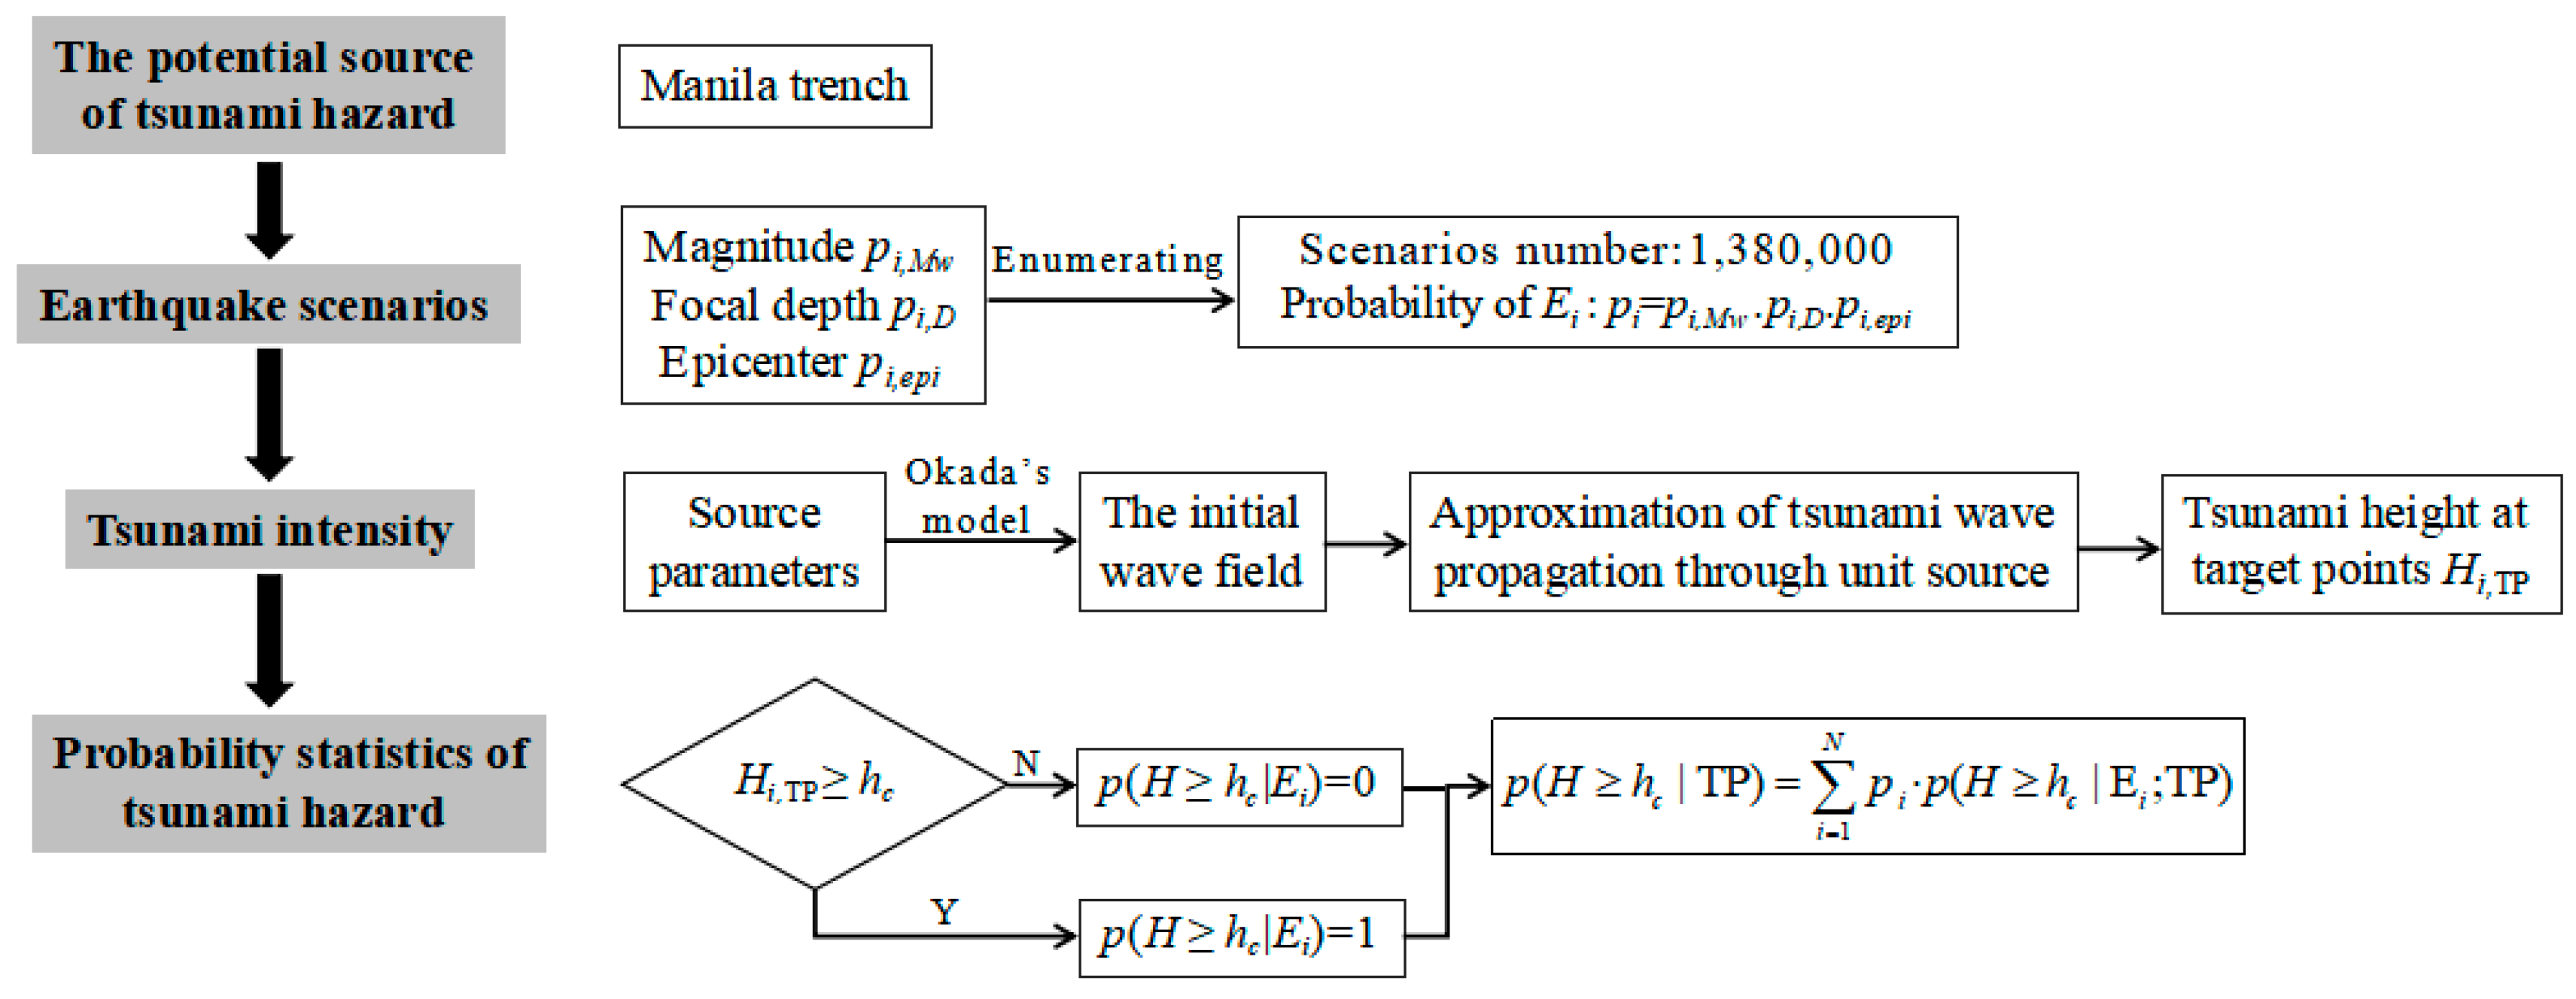
2. Probabilistic Tsunami Hazard Assessment Model

Probabilistic Tsunami Hazard Assessment (PTHA) is developed from the concept of Probabilistic Seismic Hazard Assessment (PSHA) and has been widely used since the early 1970s [20]. The model used in this study has been improved and is based on the previous model of Zhang and Niu [18]. The maximum tsunami height at a target position during one potential earthquake scenario is collected. Integrating the occurrence probability of the scenario, the exceedance probability for a certain tsunami height is statistically estimated. The process of probabilistic tsunami hazard assessment is shown in Figure 1.
At a target point (TP), the exceedance possibility that the tsunami wave height H exceeds a certain critical value of tsunami height hc, in the case that one earthquake happens, can be given as:
p ( H h c | TP ) = i = 1 N p i · p ( H h c | E i ; TP )
where p i is the occurrence probability of the i-th potential earthquake scenario Ei. p ( H h c | E i ; TP ) is the possibility of tsunami height at the target point (TP) in the earthquake scenario Ei, which equals 1 when H h c and otherwise equals 0.
Considering the fact that the number of historical records on earthquakes is relatively large, it is assumed that the probability density of earthquake parameters can be estimated from the public earthquake catalog. Further assuming that the source parameters are independent, the occurrence probability of a specific earthquake scenario p i can be calculated from the product of the probability density of the main source parameters. The main source parameters considered are moment magnitude Mw, focal depth D, epicenter and focal mechanism (including fault strike angle ϕ, dip angle δ and slip angle λ). The range and probability density of each parameter are given from the statistics of historical seismic data.
Because earthquakes can be considered as periodic crustal movements in long-term sequences, the number of earthquakes occurring in a fixed interval of time can be modeled as a Poisson process. The possibility that tsunami height H exceeds h c within a time interval T is given as:
P ( H h c ; TP , T ) = 1 exp [ ν M · p ( H h c | TP ) · T ]
where ν M is the annual occurrence rate of earthquakes with moment magnitude greater than M which is the low limitation for tsunami generation.
According to Equation (2), the corresponding return period Tr is given as:
T r = 1 ν M · p ( H h c | TP )

3. Seismic Characteristics of the Manila Trench and Potential Tsunami Simulation

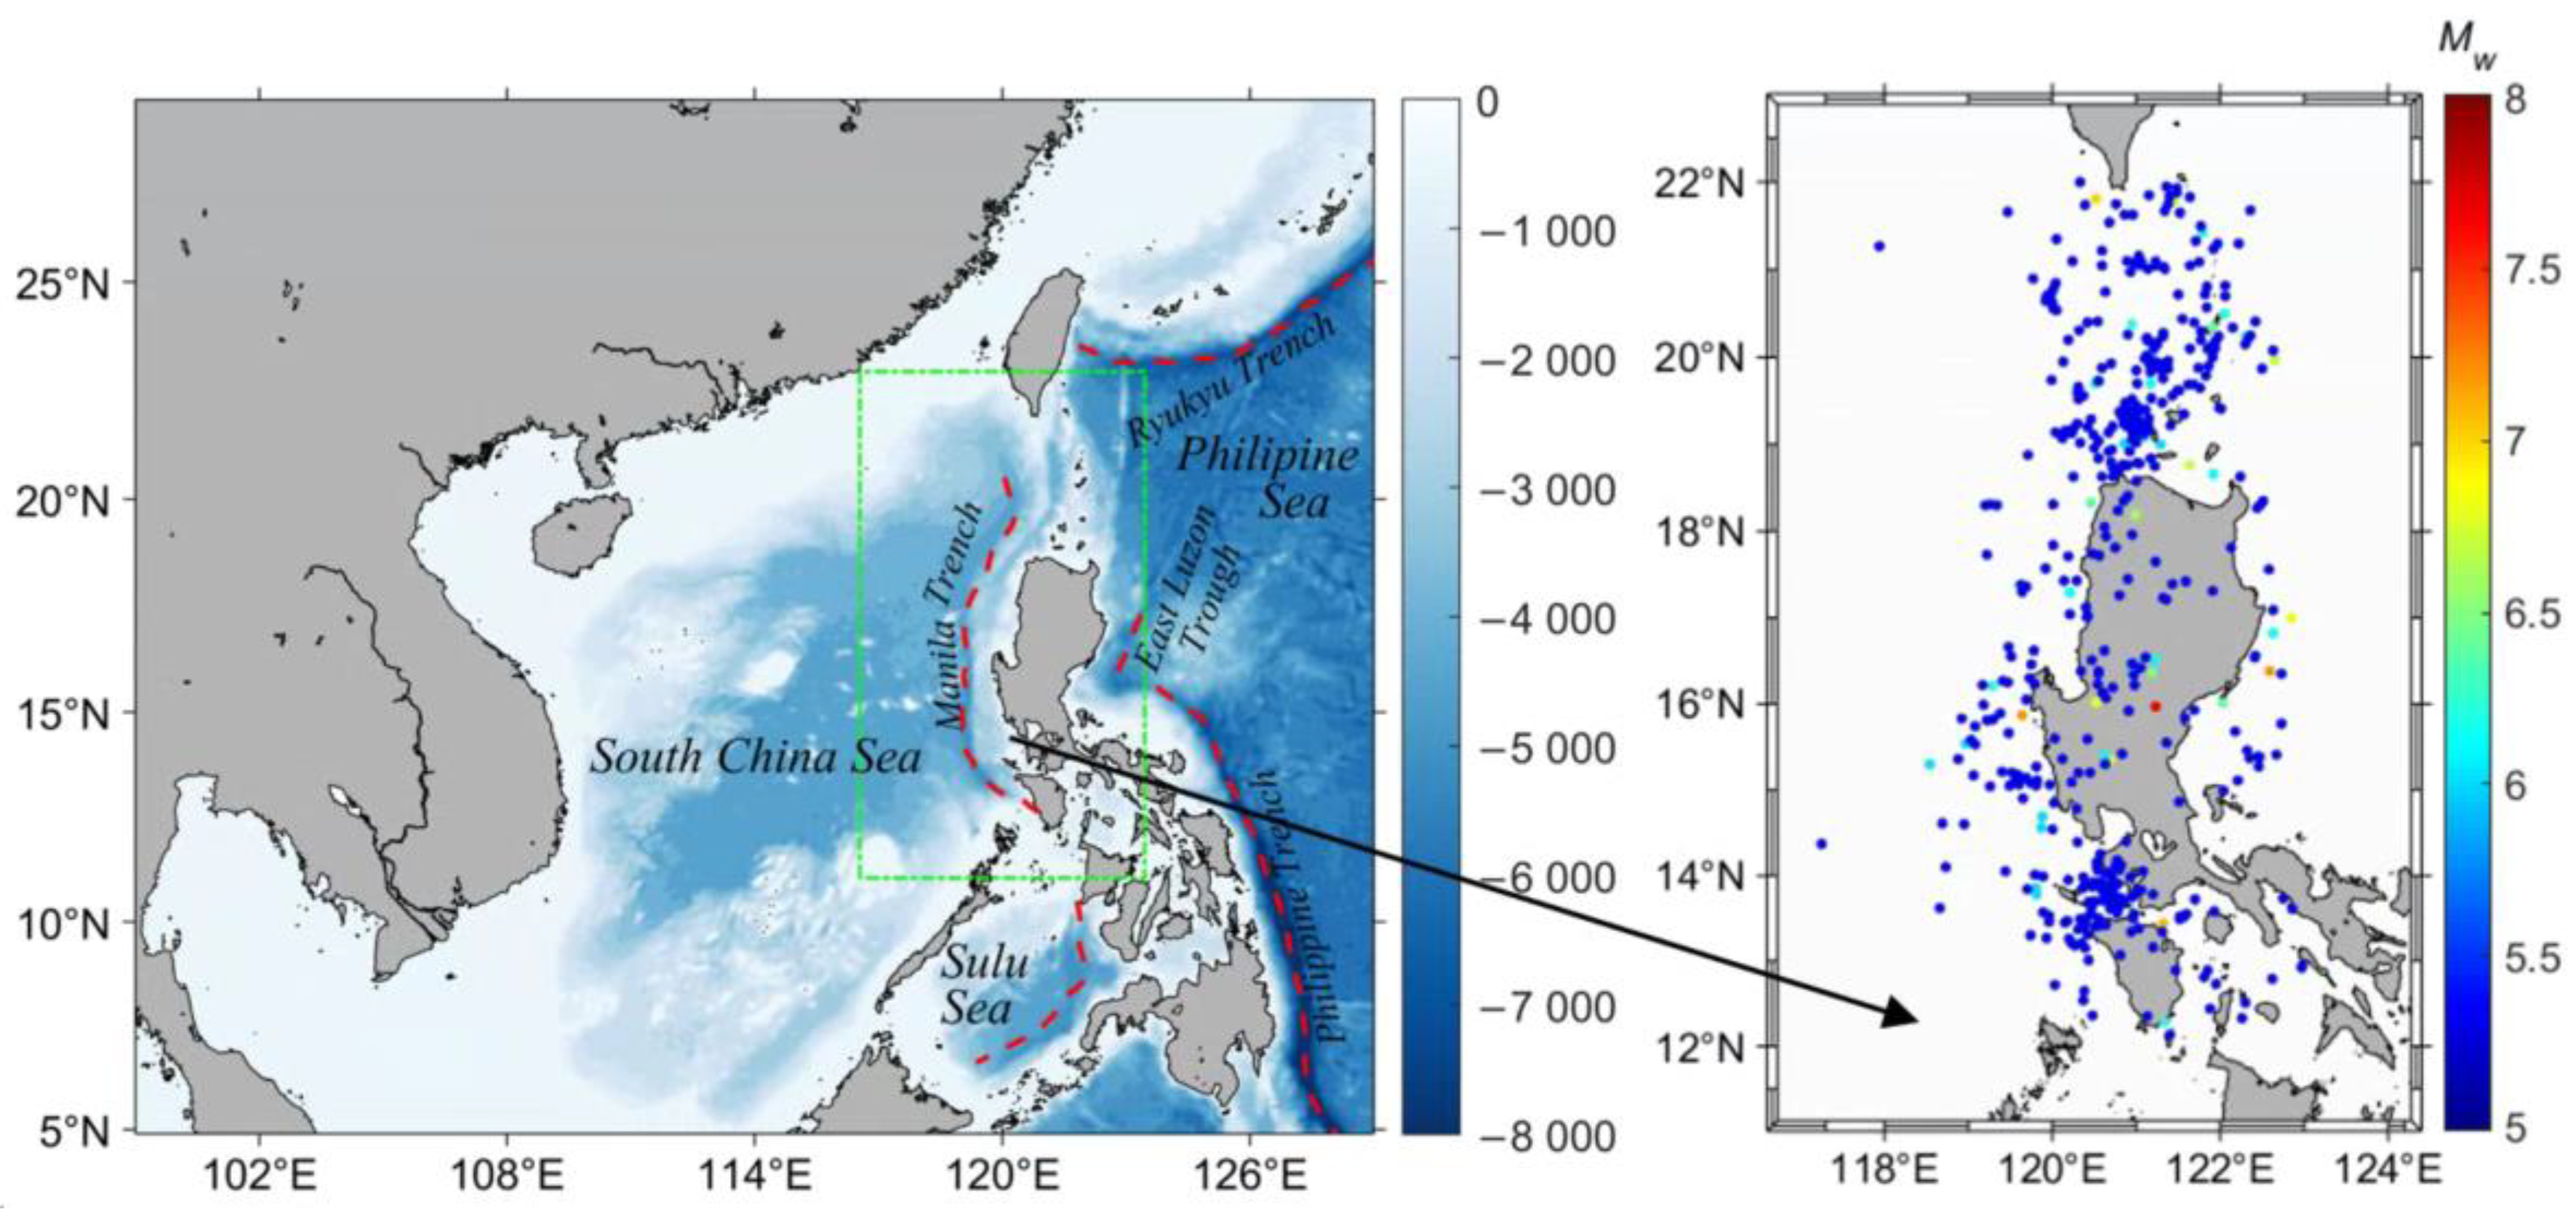
3.1. Study Area and Potential Earthquake Scenarios

This study focuses on the tsunami hazard from the Manila Trench region, and the area within 99.0° E–129.0° E and 5.0° N–29.0° N is selected as the study area, as shown in Figure 2. Bathymetric data are obtained from ETOPO1 and the data of shoreline are obtained from GSHHGD (Global Self-consistent, Hierarchical, High-resolution Geography Database). To show the spatial distribution of the tsunami hazard, the spatial resolution of target points in the area is set to be 0.1°.
Earthquakes which happened in the range 117° E–123° E and 12° N–22° N are statistically analyzed to estimate the occurrence possibility of each earthquake scenario. Available earthquake catalogs include USGS (U. S. Geological Survey), GCMT (Global Centroid-Moment-Tensor) [21,22], ISC (International Seismological Centre) [23,24], etc. The earthquake catalogs GCMT and USGS are used in this study. USGS has a longer time range, starting from 1900, which includes more than 5000 earthquakes in our concerned area. According to USGS, from January 1900 to December 2017, the annual occurrence rate of earthquakes with a moment magnitude greater than 7 within the Manila Trench area is given as 0.162. Earthquakes in GCMT were recorded from 1976. This catalog has a shorter time range but includes more source information such as strike angle, dip angle and slip angle, which are needed for tsunami hazard assessment. According to the GCMT database, from January 1977 to December 2017, a total of 493 earthquakes with moment magnitude 5 or above occurred in the Manila Trench. Earthquake distribution (GCMT; 5.0 ≤ Mw ≤ 8.0; 1977–2017) is shown in Figure 2.
In this study, we temporarily focus on the influence of moment magnitude (Mw), focal depth (D) and epicenter (Epi). Based on previous studies, it is regarded that earthquakes greater than 7.0 can induce notable tsunami; therefore, we only simulate earthquakes with Mw ≥ 7. Hsu et al. suggested that earthquakes may occur in the Manila Trench with an Mw up to 9.2, so the maximum earthquake moment magnitude Mu is set to be 9.2 [5]. Twenty-three magnitude scenarios are considered with an interval of 0.1. The occurrence probability of each magnitude range is estimated using the Gutenberg–Richter (G-R) relationship [25] and the coefficients in the G-R relationship are fitted using historical data from 1900 to 2017 recorded in USGS. Longer cataloging may result in a relatively reliable estimation. Considering that the initial disturbance of the surface is too small and can be neglected when the focal depth is larger than 100 km, the range of focal depth is set from 10 km to 100 km with an interval of 10 km. For the epicenter, we assume that the epicenter can appear anywhere but with a different probability in the region of the Manila Trench (117° E–123° E, 12° N–22° N). In total, 6000 possible epicenter cases are computed with a spatial interval of 0.1°. The occurrence probability of each focal depth and epicenter case is estimated by using statistics from the historical data in GCMT. Other source parameters that affect tsunami generation are treated as fixed values. Considering the most dangerous conditions, the slip angle is set to be 90° and the dip angle is set to be 30°. The strike angle is set to be consistent with the direction of the trench following Zhang and Niu [18]. The length and width of the fault are estimated using the scaling relationship given by Blaser et al. [26], which is linked with the magnitude. The combination of all source parameters results in a large number of possible earthquake scenarios, totaling 23 × 6000 × 10 × 1 = 1,380,000 in the present study. The occurrence probability of each scenario is given in the next section (Section 3.2). For a specific scenario, the generation and propagation of tsunami are deterministic processes, which can be simulated using hydrodynamic models. However, such a large number of scenario simulations is computationally time consuming. It requires an efficient alternative method of simulating the tsunami process, which is introduced in Section 3.3.

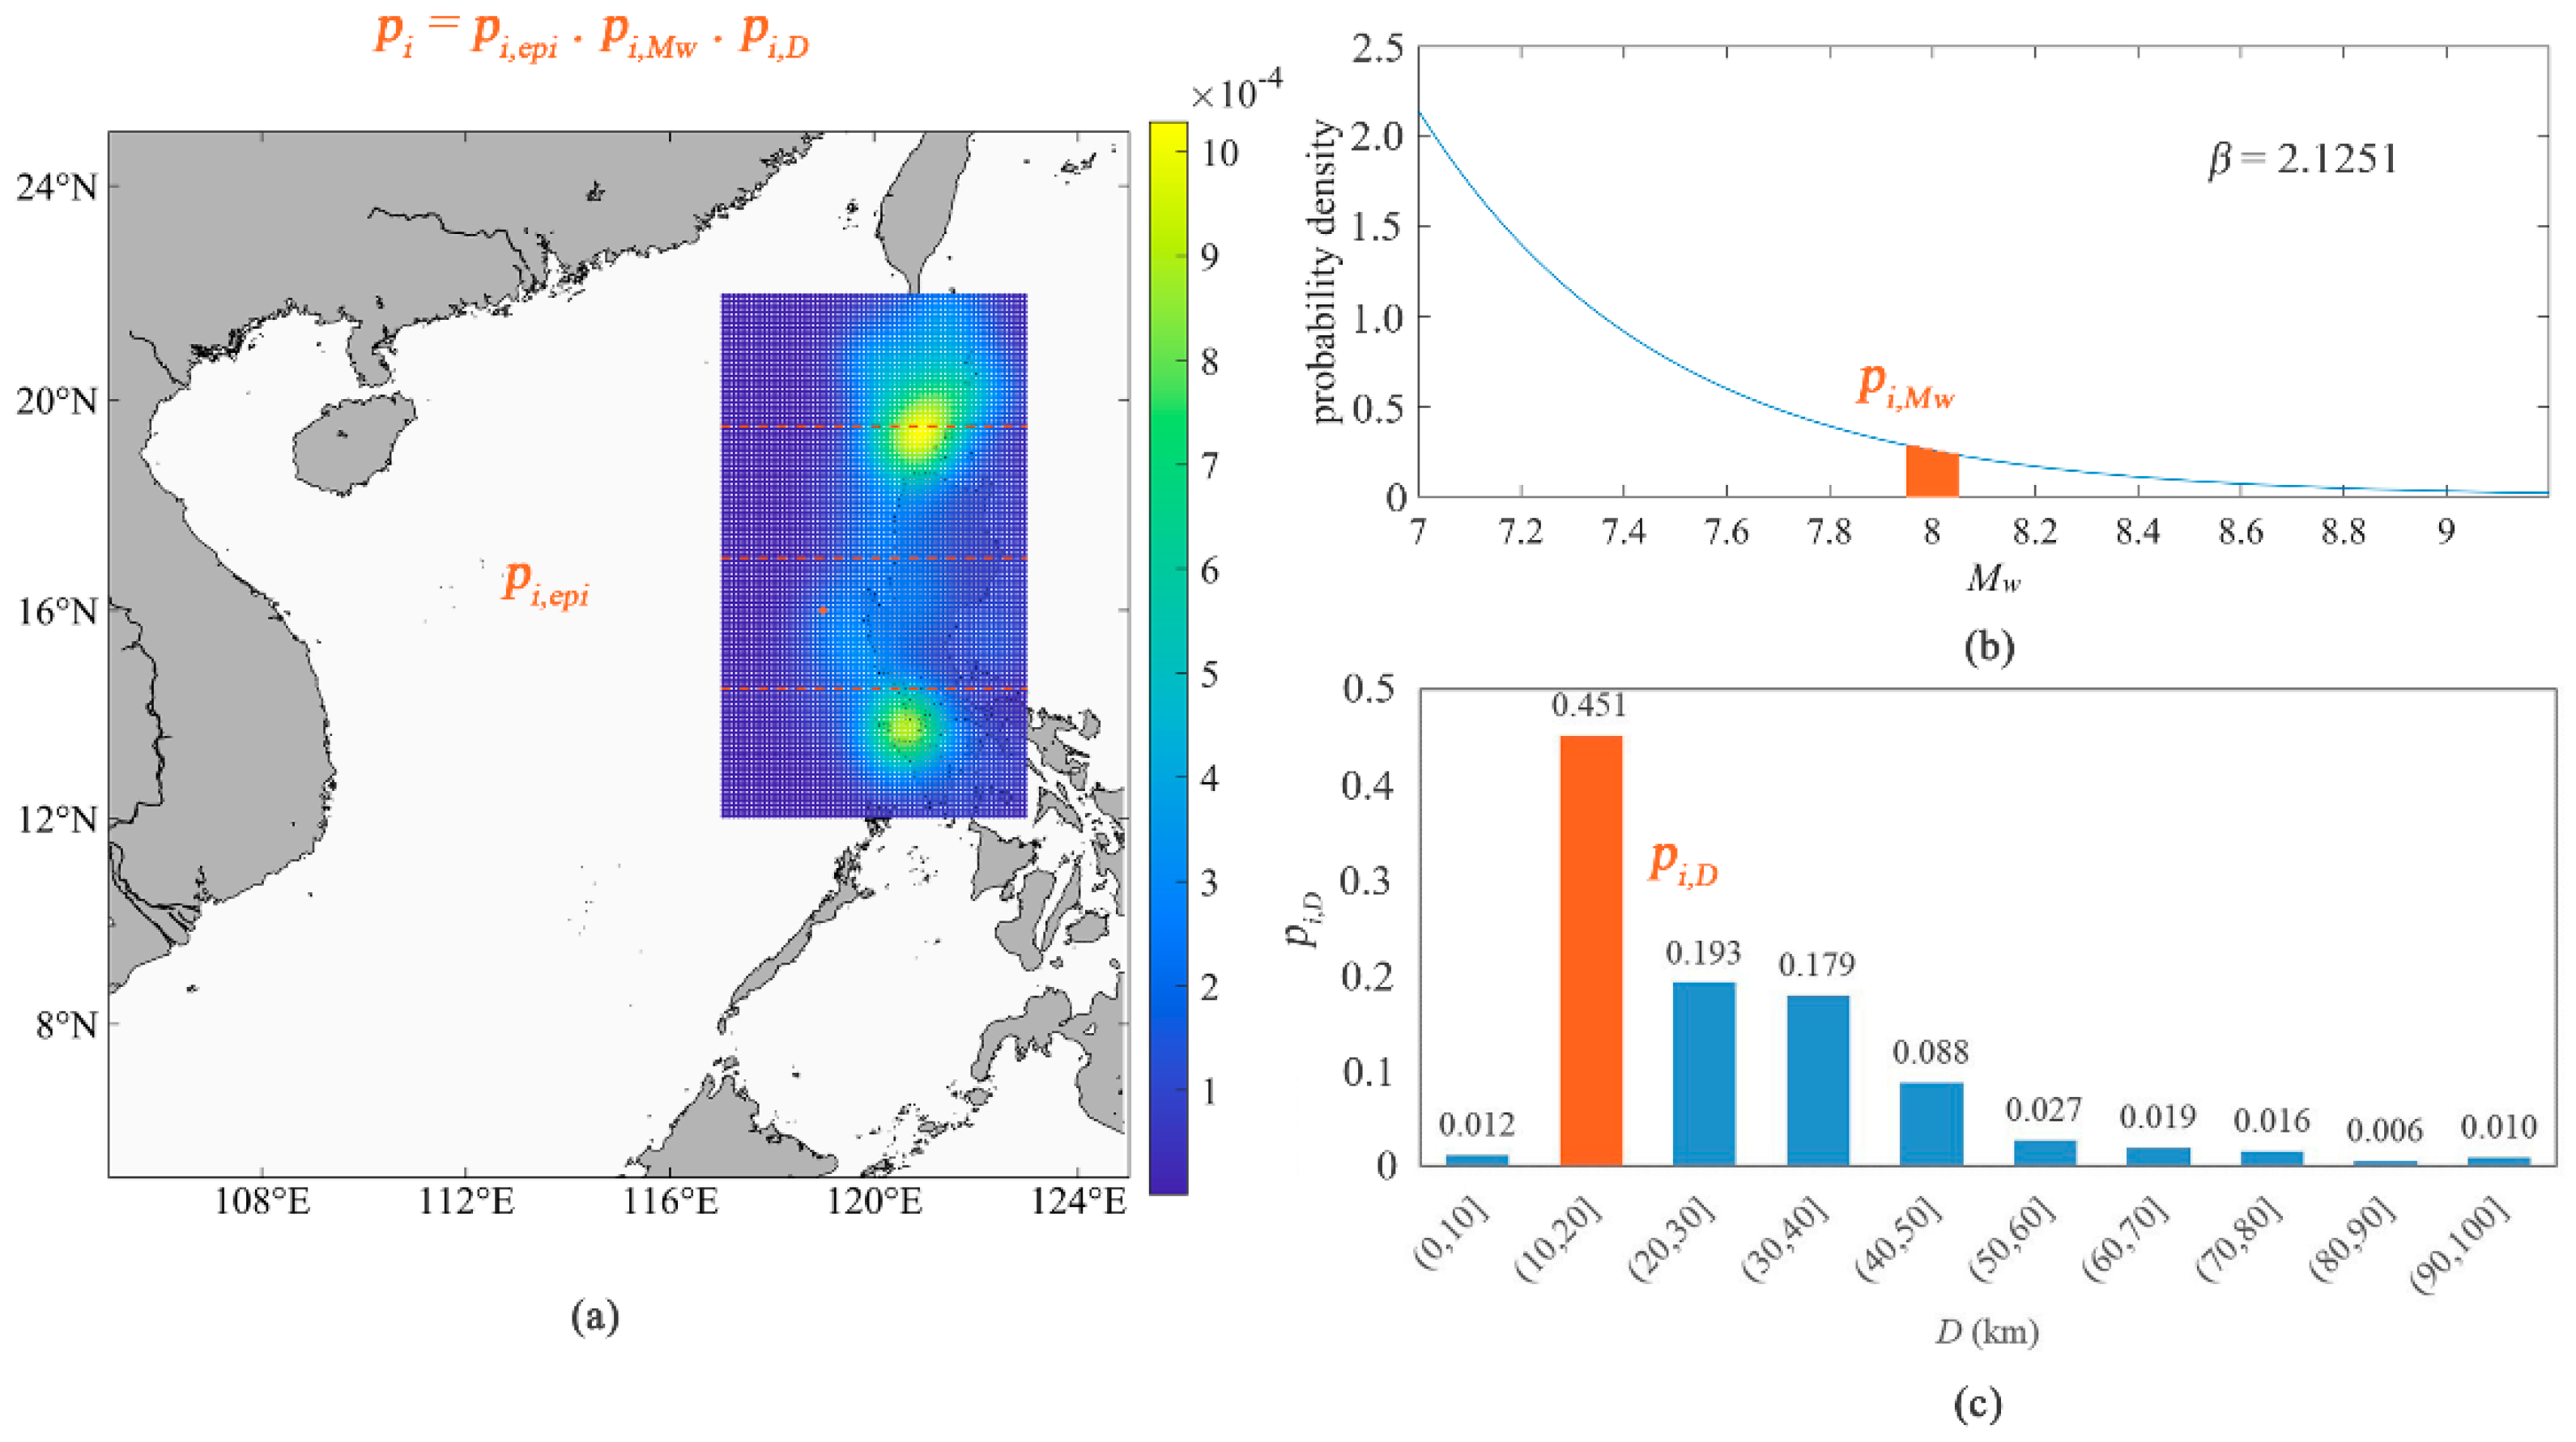
3.2. Occurrence Probability of Each Earthquake Scenario

The occurrence probability of each scenario is equal to the product of the probability of each source parameter, as shown in Equation (4).
p i = p i , e p i · p i , M w · p i , D
Here, the randomness of source parameters, including magnitude, epicenter and focal depth, is considered, and the probability density distributions of those parameters are shown in Figure 3. p i , M w is the probability of moment magnitude M w , which is shown in Figure 3b. As the number of earthquakes within a certain magnitude range follows the G-R relationship [25], the probability density of moment magnitude M w is given as
f ( M w ) = { β exp [ β ( M w M 0 ) ] 1 exp [ β ( M u M 0 ) ]   M 0 M w M u 0                               e l s e
where Mu is the upper boundary of moment magnitude and M0 is the lower boundary selected considering that earthquakes with moment magnitude smaller than M0 are unlikely to generate notable tsunami. M0 = 7.0 and Mu = 9.2 are adopted in this study. β = bln10, and b is the coefficient in the G-R relationship, which is obtained from the statistical analysis of historical data. Based on our previous study, the parameters are adopted as a = 7.6332, b = 0.9229, and β = 2.1251. Then, p i , M w can be calculated through
p i , M w = M w δ M M w + δ M f ( M w ) d M w
The solid line in Figure 3b is the probability density of magnitude and the orange bar denotes the probability of magnitude within the range 8 − 0.05 to 8 + 0.05. p i , e p i is the probability of the epicenter within a spatial range of 0.1° × 0.1°, as shown in Figure 3a. p i , D is the probability of focal depth, which is the statistical frequency of historical earthquakes within 100 km, as shown in Figure 3c.

3.3. Simulation of Tsunami Triggered by Each Earthquake Scenario

The generation and propagation of tsunami can be numerically simulated, and an efficient alternative method is proposed for simulating a large number of scenarios. The generation of tsunami is treated as an instantaneous process associated with the sudden deformation of the seafloor in an earthquake event. The initial sea surface displacement can be estimated using the widely used Okada model [27], under the conditions of given focal depth D, fault strike angle ϕ, dip angle δ, slip angle λ, fault length, width and slip amount. The length, width and slip amount of the fault are estimated from moment magnitude [26,28]. It should be noted that non-uniform slip of the crustal faults will occur randomly in actual earthquake scenarios, and the simple uniform slip model that is widely used in tsunami simulation is only an approximation. Although the method used in this study can be applied to the problem of non-uniform slip, due to the limited time and computing resources, the influence of non-uniform slip distribution has not been considered in the present study. After the initial sea surface displacement is known, the propagation of a tsunami wave can be simulated by a number of ocean dynamic models, such as COMCOT [29], TUMANI [30] and FVCOM [31]. This study uses FVCOM, but the propagation of tsunami is not directly simulated from the initial sea surface displacement. A number of cases with unit water displacement at the time of occurrence is pre-computed as a unit source database to reconstruct the propagation of tsunami. Based on the linearity of tsunami waves in deep water, the tsunami wave at a target point corresponding to a specific earthquake event can be approximated by the linear superposition of waves from unit sources. The initial water surface displacement in a unit source case is set to be 2D Gaussian-shaped distribution. In total, 7853 unit sources are placed in the range of 116.5° E~123.5° E and 11° N~23° N with an interval of 0.1°, to cover the area of initial sea surface displacement in all earthquake scenarios.
To simulate the time series of tsunami waves in a specific earthquake event, the initial sea level displacement is firstly estimated using Okada’s model and then approximated as a superposition of unit sources multiplied by scaling factors. After the scaling factor of each unit source is determined, the tsunami waves at a target point can be superposed using the time series of waves from unit sources. By doing it this way, we greatly reduce the computing cost required for the simulation of more than one million scenarios, and improve the efficiency of hazard assessment. The effectiveness and accuracy of this method have been verified by comparing the previous simulation results of a tsunami corresponding to a special earthquake event in the South China Sea [18]. Based on this method, the maximum wave height of each tsunami scenario at each target point is collected and statistically analyzed. It should be pointed out that the present method is not suitable for very shallow water depths. The results can be used as boundary conditions for assessing the detailed runup and inundation of local areas.

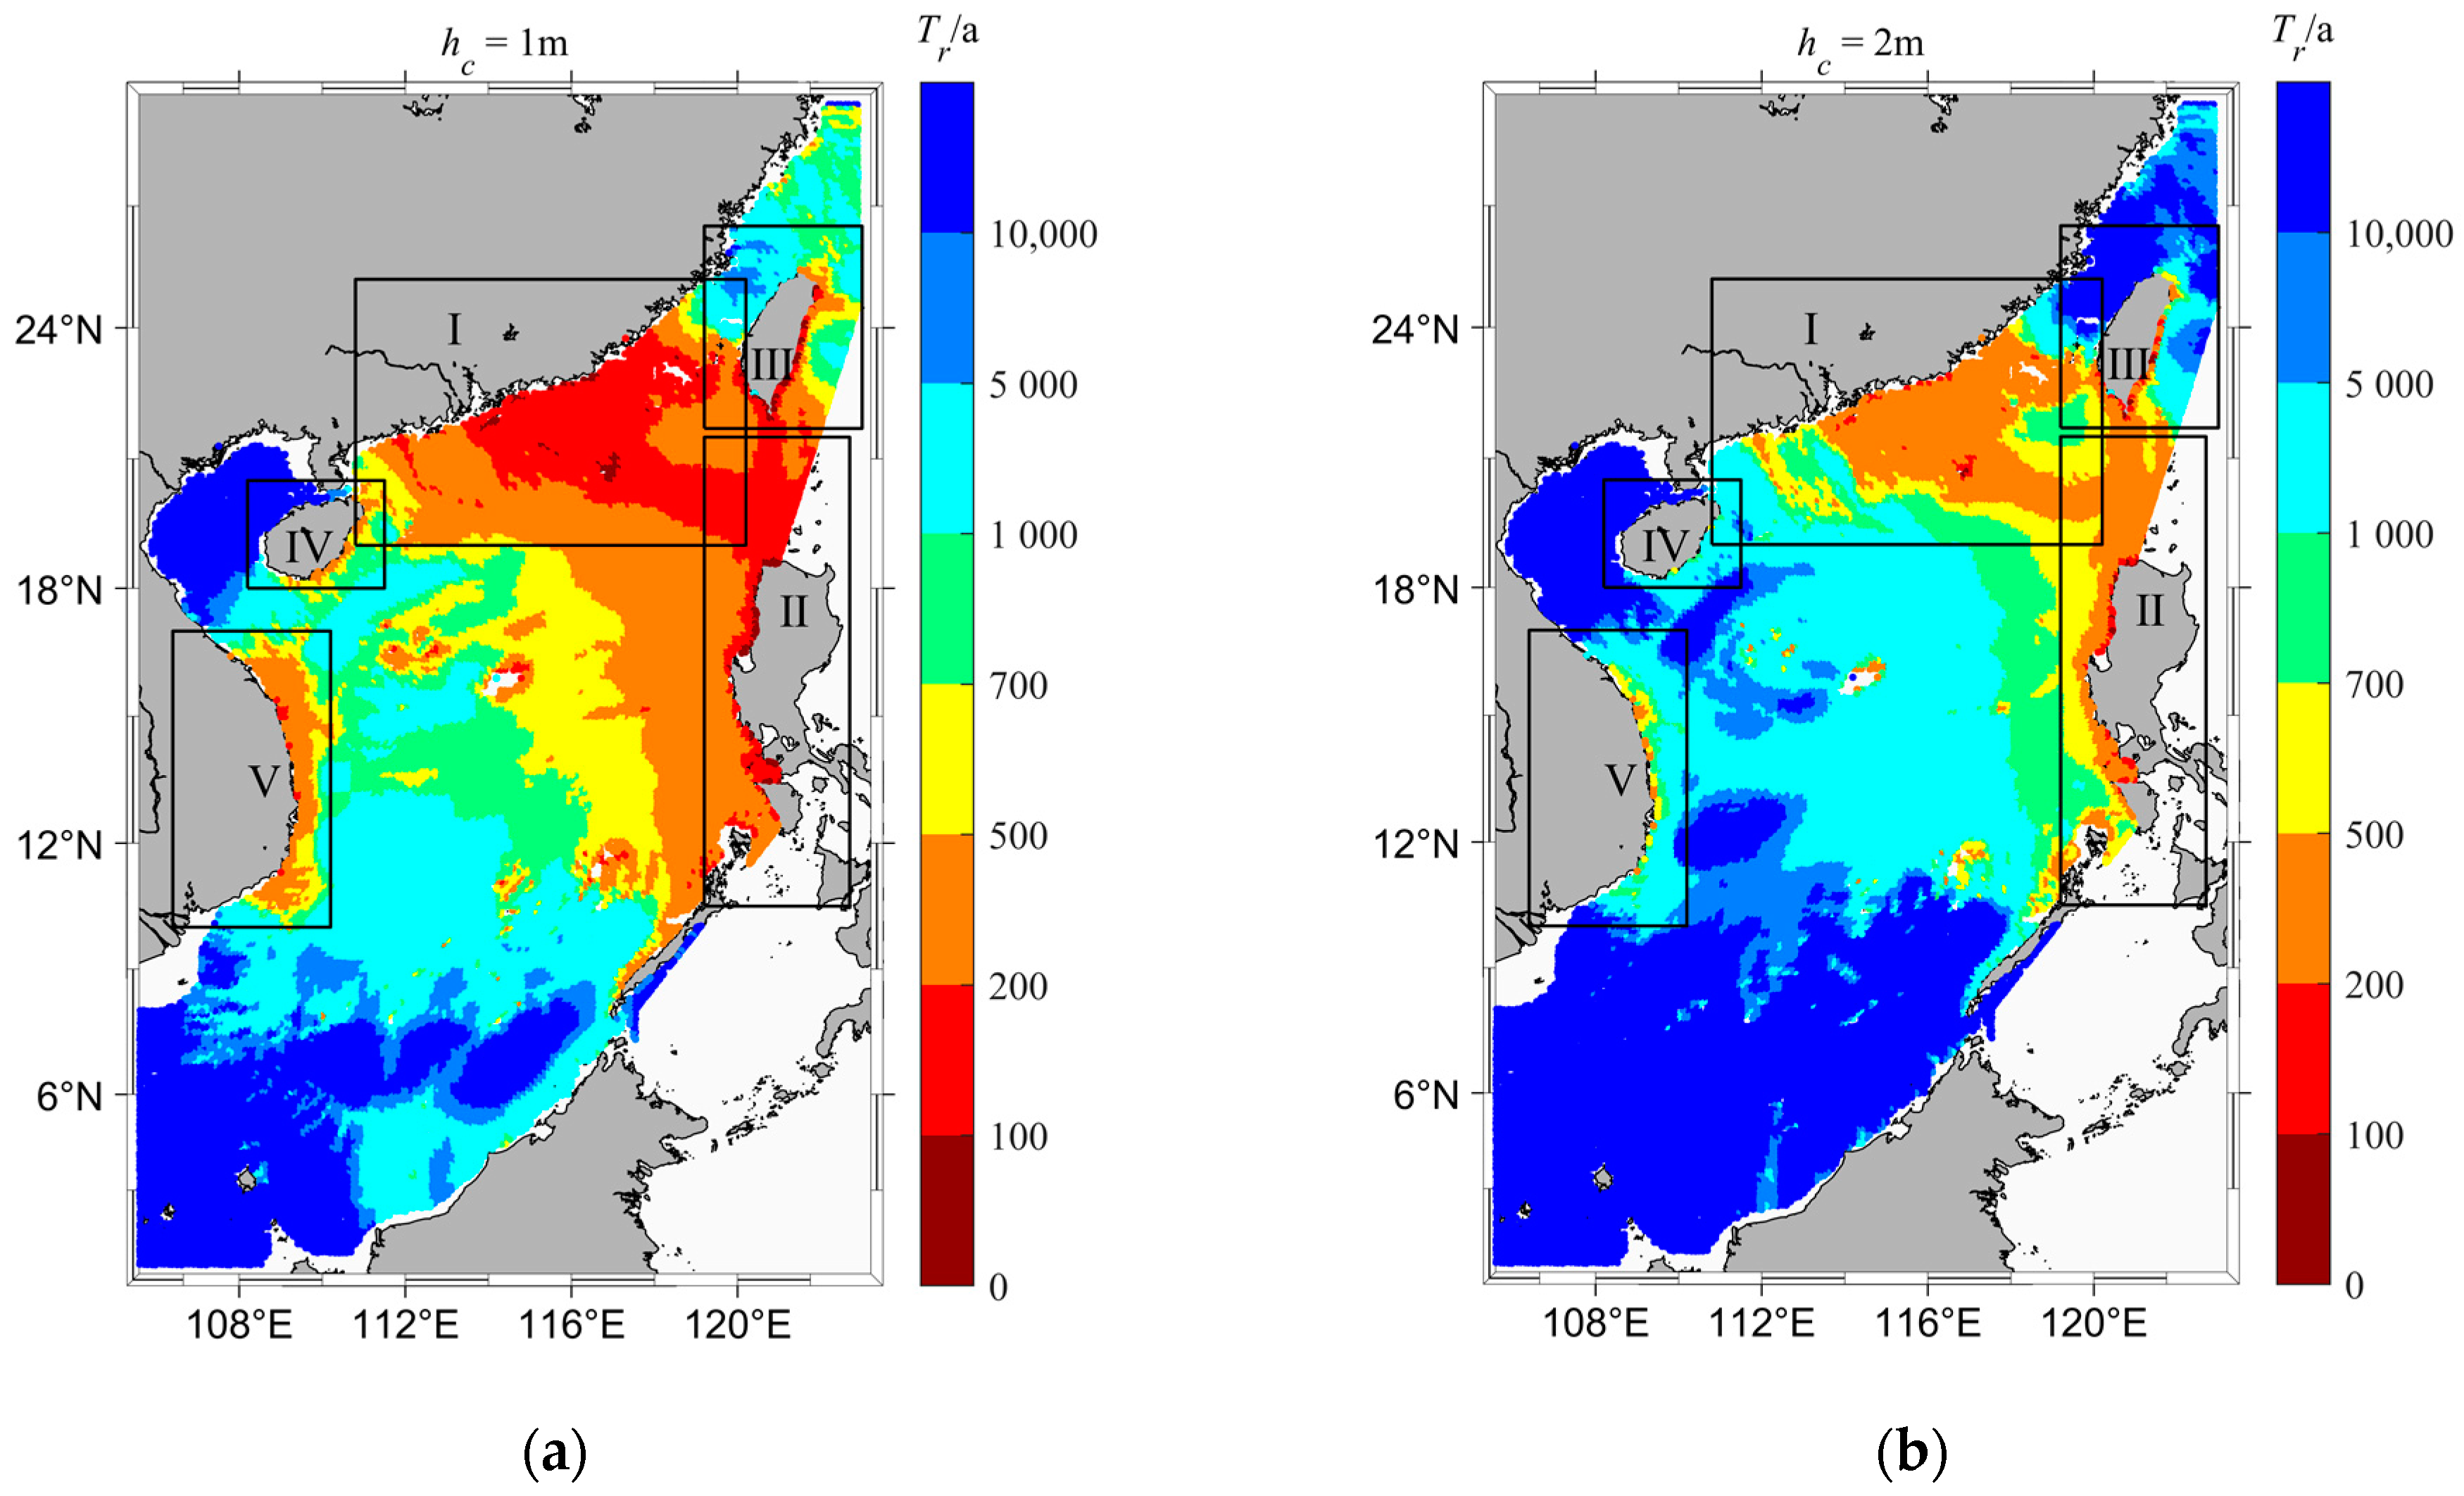
4. Distribution Characteristics of Tsunami Hazard

The present study aims to show the spatial distribution of the tsunami hazard over the affected area of an earthquake around the Manila Trench. Considering that the efficient method is inaccurate in shallow water, we selected target points in the South China Sea with a water depth under 20 m and calculated the exceedance probability of different critical wave height hc, and its corresponding return period. Figure 4 shows the spatial distribution of the return period when hc = 1 m, 2 m, 3 m and 5 m. Figure 5 shows the spatial distribution of wave height when the return period is equal to 100a, 200a, 500a and 1000a. As the critical wave height hc increases, its return period increases. The overall tsunami hazard in the study area is not so high, and, generally, the southern area has less tsunami hazard than the northern area.
It can be seen that the tsunami hazard in the study area from the Manila Trench has a certain spatial difference. There are regions that may suffer 1 m-high tsunami with a return period of less than 200 years, denoted by the red color in Figure 4a. Those regions may suffer 2 m-high tsunami with a return period of less than 500 years, as denoted by the orange color in Figure 4b. Only small parts of those regions may suffer higher tsunami with a longer return period.
Let us focus on the area where the return period is less than 200 years for 1 m-high tsunami, and we can divide the area into five regions, as specified in Figure 4a. Region I is the continental shelf to the southeast coast of the Chinese mainland. The rapid climb of terrain leads to higher tsunami waves and wave energy accumulation in this area. In addition, the southeast coast of China is roughly perpendicular to the strike direction in the north part of the Manila Trench. When an earthquake with a large magnitude occurs in the north part of the Manila Trench, most energy from tsunami waves will travel perpendicular to the strike direction, resulting in relatively high tsunami wave height in this area. Figure 6 is the spatial distribution of wave height corresponding to a return period of 200 years in Region I. This can also be seen in Figure 6, where the accumulation of wave energy in and around the lee side of Dongsha Islands is clear. This can be explained by the theoretical analysis on the refraction and diffraction of waves over an island [32,33]. Region II is the source area along the Manila Trench. Most areas in Region II may suffer a tsunami wave in the return period of 200 years. The tsunami hazard is relatively high along the western coast of Luzon Island and the northwest coast of Palawan Island. Region III is Taiwan Island. It can be seen that the south part of the west coast and the whole east coast are exposed to large tsunami hazard. Region IV is the Hainan Island and Region V is the east coast of the China–Indochina Peninsula. Although these two parts are relatively far from the Manila Trench, due to the shoaling of tsunami waves there is still a high-hazard area along the coast.

5. Conclusions

This study conducted a probabilistic tsunami hazard assessment for potential earthquakes occurring around the Manila Trench, which is considered as the main source of tsunami hazard in the South China Sea. To achieve an assessment considering the randomness of the earthquake epicenter, focal depth and magnitude, tsunami in 1,380,000 potential earthquake scenarios have been simulated using an efficient method based on a pre-simulated unit source database. Benefiting from the efficiency of the assessment method, it is possible to assess many target points. Finally, the spatial distribution of tsunami hazard in the affected area of earthquakes around the Manila Trench has been obtained for the first time. Target points are evenly distributed in the sea area with a spatial resolution of 0.1°, covering most of the South China Sea. This dataset can provide boundary conditions for tsunami runup and inundation analysis on a small scale.
The spatial distribution clearly shows the high hazard area where more attention needs to be paid in tsunami prevention and mitigation. Generally, the overall tsunami hazard from the Manila Trench is not high. Tsunami wave height in most areas is less than 1 m under the return period of 200 years. However, there are still some areas with high tsunami hazard, including the southeast coast of the Chinese mainland, the western coast of Luzon Island, the northwest coast of Palawan Island, the south part of the west coast and the whole east coast of Taiwan Island, the east coast of Hainan Island and the east coast of China–Indochina Peninsula.

Author Contributions

Conceptualization, X.N.; methodology, X.N., F.M., G.Z. and X.G.; software, F.M. and G.Z.; validation, F.M., G.Z. and X.G.; formal analysis, F.M.; writing—original draft preparation, F.M.; writing—review and editing, X.N.; supervision, X.N.; funding acquisition, X.N. All authors have read and agreed to the published version of the manuscript.

Funding

This research was funded by the National Natural Science Foundation of China under the grant no. 51779125, and State Key Laboratory of Hydroscience and Engineering under grant no. 2022-KY-05.

Data Availability Statement

Datasets used in this research are all available online. Bathymetric data are available online at https://ngdc.noaa.gov/mgg/global/global.html (accessed on 10 July 2021), the global CMT project is available online at https://www.globalcmt.org/CMTcite.html (accessed on 10 July 2021) and USGS is available at https://earthquake.usgs.gov/earthquakes (accessed on 10 July 2021). The data presented in this study are available on request from the corresponding author.

Conflicts of Interest

The authors declare no conflict of interest.

References

  1. Hsu, Y.J.; Yu, S.B.; Song, T.R.A.; Bacolcol, T. Plate coupling along the Manila subduction zone between Taiwan and northern Luzon. J. Asian Earth Sci. 2012, 51, 98–108. [Google Scholar] [CrossRef]
  2. Karig, D.E. Accreted terranes in the northern part of the Philippine archipelago. Tectonics 1983, 2, 211–236. [Google Scholar] [CrossRef]
  3. Barrier, E.; Huchon, P.; Aurelio, M. Philippine fault: A key for Philippine kinematics. Geology 1991, 19, 32–35. [Google Scholar] [CrossRef]
  4. Yang, T.F.; Lee, T.; Chen, C.H.; Cheng, S.N.; Knittel, U.; Punongbayan, R.S.; Rasdas, A.R. A double island arc between Taiwan and Luzon: Consequence of ridge subduction. Tectonophysics 1996, 258, 85–101. [Google Scholar] [CrossRef]
  5. Hsu, Y.J.; Yu, S.B.; Loveless, J.P.; Bacolcol, T.; Solidum, R.; Luis, A.; Woessner, J. Interseismic deformation and moment deficit along the Manila subduction zone and the Philippine Fault system. J. Geophys. Res. Solid Earth 2016, 121, 7639–7665. [Google Scholar] [CrossRef] [Green Version]
  6. Megawati, K.; Shaw, F.; Sieh, K.; Huang, Z.; Wu, T.R.; Lin, Y.; Pan, T.C. Tsunami hazard from the subduction megathrust of the South China Sea: Part I. Source characterization and the resulting tsunami. J. Asian Earth Sci. 2009, 36, 13–20. [Google Scholar] [CrossRef]
  7. Liu, Y.; Santos, A.; Wang, S.M.; Shi, Y.; Liu, H.; Yuen, D.A. Tsunami hazards along Chinese coast from potential earthquakes in South China Sea. Phys. Earth Planet. Inter. 2007, 163, 233–244. [Google Scholar] [CrossRef]
  8. Wu, T.R.; Huang, H.C. Modeling tsunami hazards from Manila trench to Taiwan. J. Asian Earth Sci. 2009, 36, 21–28. [Google Scholar] [CrossRef]
  9. Dao, M.H.; Tkalich, P.; Chan, E.S.; Megawati, K. Tsunami propagation scenarios in the South China Sea. J. Asian Earth Sci. 2009, 36, 67–73. [Google Scholar] [CrossRef]
  10. Ren, Z.; Zhao, X.; Wang, B.; Dias, F.; Liu, H. Characteristics of wave amplitude and currents in South China Sea induced by a virtual extreme tsunami. J. Hydrodyn. 2017, 29, 377–392. [Google Scholar] [CrossRef]
  11. Ren, Y.; Wen, R.; Zhang, P.; Yang, Z.B.; Pan, R.; Li, X.J. Implications of local sources to probabilistic tsunami hazard analysis in south Chinese coastal area. J. Earthq. Tsunami 2017, 11, 1740001. [Google Scholar] [CrossRef]
  12. Annaka, T.; Satake, K.; Sakakiyama, T.; Yanagisawa, K.; Shuto, N. Logic-tree approach for probabilistic tsunami hazard analysis and its applications to the Japanese coasts. Tsunami Its Hazards Indian Pac. Ocean. 2007, 164, 577–592. [Google Scholar]
  13. Geist, E.L.; Parsons, T. Probabilistic analysis of tsunami hazards. Nat. Hazards 2006, 37, 277–314. [Google Scholar] [CrossRef]
  14. Grezio, A.; Marzocchi, W.; Sandri, L.; Gasparini, P. A Bayesian procedure for probabilistic tsunami hazard assessment. Nat. Hazards 2010, 53, 159–174. [Google Scholar] [CrossRef]
  15. Li, L.; Switzer, A.D.; Chan, C.H.; Wang, Y.; Weiss, R.; Qiu, Q. How heterogeneous coseismic slip affects regional probabilistic tsunami hazard assessment: A case study in the South China Sea. J. Geophys. Res. Solid Earth 2016, 121, 6250–6272. [Google Scholar] [CrossRef] [Green Version]
  16. Lorito, S.; Selva, J.; Basili, R.; Romano, F.; Tiberti, M.M.; Piatanesi, A. Probabilistic hazard for seismically induced tsunamis: Accuracy and feasibility of inundation maps. Geophys. J. Int. 2015, 200, 574–588. [Google Scholar] [CrossRef] [Green Version]
  17. Ren, Y.F.; Wen, R.Z.; Song, Y.Y. Recent progress of tsunami hazard mitigation in China. Epis. J. Int. Geosci. 2014, 37, 277–283. [Google Scholar]
  18. Zhang, X.; Niu, X. Probabilistic tsunami hazard assessment and its application to southeast coast of Hainan Island from Manila Trench. Coast. Eng. 2020, 155, 103596. [Google Scholar] [CrossRef]
  19. Gao, X.; Zhao, G.; Niu, X. An approach for quantifying nearshore tsunami height probability and its application to the Pearl River Estuary. Coast. Eng. 2022, 175, 104139. [Google Scholar] [CrossRef]
  20. Mori, N.; Goda, K.; Cox, D. Recent process in probabilistic tsunami hazard analysis (PTHA) for mega thrust subduction earthquakes. In The 2011 Japan Earthquake and Tsunami: Reconstruction and Restoration; Springer: Cham, Switzerland, 2018; pp. 469–485. [Google Scholar]
  21. Dziewonski, A.M.; Chou, T.A.; Woodhouse, J.H. Determination of earthquake source parameters from waveform data for studies of global and regional seismicity. J. Geophys. Res. Solid Earth 1981, 86, 2825–2852. [Google Scholar] [CrossRef]
  22. Ekström, G.; Nettles, M.; Dziewoński, A.M. The global CMT project 2004–2010: Centroid-moment tensors for 13,017 earthquakes. Phys. Earth Planet. Inter. 2012, 200, 1–9. [Google Scholar] [CrossRef]
  23. Giacomo, D.D.; Storchak, D.A.; Safronova, N.; Ozgo, P.; Harris, J.; Verney, R.; Bondár, I. A new ISC service: The bibliography of seismic events. Seismol. Res. Lett. 2014, 85, 354–360. [Google Scholar] [CrossRef]
  24. International Seismological Centre, Seismological Dataset Repository. Available online: https://doi.org/10.31905/6TJZECEY (accessed on 15 September 2022).
  25. Gutenberg, B.; Richter, C.F. Frequency of earthquakes in California. Bull. Seismol. Soc. Am. 1944, 34, 185–188. [Google Scholar] [CrossRef]
  26. Blaser, L.; Krüger, F.; Ohrnberger, M.; Scherbaum, F. Scaling relations of earthquake source parameter estimates with special focus on subduction environment. Bull. Seismol. Soc. Am. 2010, 100, 2914–2926. [Google Scholar] [CrossRef]
  27. Okada, Y. Surface deformation due to shear and tensile faults in a half-space. Bull. Seismol. Soc. Am. 1985, 75, 1135–1154. [Google Scholar] [CrossRef]
  28. Kanamori, H. Mechanism of tsunami earthquakes. Phys. Earth Planet. Inter. 1972, 6, 346–359. [Google Scholar] [CrossRef]
  29. Liu, P.L.F.; Woo, S.B.; Cho, Y.S. Computer Programs for Tsunami Propagation and Inundation; School of Civil and Environmental Engineering, Cornell University: Ithaca, NY, USA, 1998. [Google Scholar]
  30. Imamura, F.; Yalciner, A.C.; Ozyurt, G. Tsunami Modelling Manual. 2006. Available online: https://www.tsunami.irides.tohoku.ac.jp/media/files/_u/project/manual-ver-3_1.pdf (accessed on 15 September 2022).
  31. Chen, C.; Beardsley, R.C.; Cowles, G. An Unstructured Grid, Finite-Volume Coastal Ocean Model, FVCOM User Manual, 2nd ed.; SMAST/UMASSD Technical Report-06-0602; Sea Grant College Program, Massachusetts Institute of Technology: Cambridge, MA, USA, 2006; 315p. [Google Scholar]
  32. Liu, P.L.F.; Cho, Y.S.; Briggs, M.J.; Kanoglu, U.; Synolakis, C.E. Runup of solitary waves on a circular island. J. Fluid Mech. 1995, 302, 259–285. [Google Scholar] [CrossRef]
  33. Niu, X. Resonance of long waves around a circular island and its relation to edge waves. Eur. J. Mech.-B/Fluids 2021, 86, 15–24. [Google Scholar] [CrossRef]
Figure 1. Process of probabilistic tsunami hazard assessment.
Jmse 10 01449 g001
Figure 2. Map of study area. The right panel shows historical earthquakes around the Manila Trench based on GCMT (1977–2017), in which the color of dots shows the moment magnitude.
Jmse 10 01449 g002
Figure 3. Occurrence probability of each source parameter: (a) epicenter; (b) moment magnitude (c) focal depth.
Jmse 10 01449 g003
Figure 4. The spatial distribution of return period (Tr) when critical wave height hc = 1 m, 2 m, 3 m and 5 m. (a) hc = 1 m, (b) hc = 2 m, (c) hc = 3 m, (d) hc = 5 m.
Jmse 10 01449 g004aJmse 10 01449 g004b
Figure 5. The spatial distribution of wave height (H) when return period Tr = 100a, 200a, 500a and 1000a. The isobaths of 100 m and 1000 m are marked in the figure. (a) Tr = 100a, (b) Tr = 200a, (c) Tr = 500a, (d) Tr = 1000a.
Jmse 10 01449 g005aJmse 10 01449 g005b
Figure 6. The spatial distribution of wave height (H) along the southeast coast of China when return period Tr = 200a. The isobaths of 100 m and 1000 m are marked in the figure.
Jmse 10 01449 g006
Publisher’s Note: MDPI stays neutral with regard to jurisdictional claims in published maps and institutional affiliations.

