
Influence of the Implantation of the Onshore Power Supply (OPS) System in Spanish Medium-Sized Ports on the Reduction in CO2 Emissions: The Case of the Port of Santander (Spain)

 , ,
, ,  ,
,  and
and
Abstract
1. Introduction
2. Literature Review
Health Background, Data and Policies
3. Methodology
3.1. Framework of Calculation
- Scenario and reasons.
- Authors classified vessels by type per each year.
- Calculate (via EPA and ENTEC method) CO2 emitted. Basis is the number of hours burning fuel and auxiliary engine power of each ship.
- Basis is the electricity production of the grid, as authors apply % of renewable energy per each year to the total CO2 yearly emitted, so total CO2 tons which could have been avoided if using OPS is calculated.
3.2. Scenario—Port of Santander
3.3. Analysis of the Used Models
- Time that the vessel employs in the operation that is to be calculated
- Consumption of the vessel during this period
- A calculation of the emissions is obtained based on the fuel used
- The hours of stay of each call have been calculated using the registry data of the Santander Port Authority [56]. Thanks to these data, it is possible to know the exact time from which any ship docks until the time it leaves port.
- The power of the auxiliary engines is a fundamental value. However, given the volume of the data sample used in this article, it has been decided to proceed differently depending on the type of vessel and based on information obtained from Seaweb [57]. On the one hand, due to the power needed to maintain cruise ships and ferries and to the proximity of these docks to urban centers, the values have been carefully entered scale by scale and vessel by vessel for the 2346 entries. However, for the rest of the vessels (chemical, oil, RORO (roll on-roll off), general cargo or bulk carrier), these values have been assigned by the authors based on the study of a sample. In the bibliography consulted, the question of the difficulty of assigning these values is raised due to the usual lack of information and the complicated relationship with GT, length, or other characteristics, leading some articles/authors to consider this value constant [49].
4. Results
5. Discussion
6. Conclusions
- The current measures are not enough to meet the emission reduction targets set by international organizations and governments. Bearing in mind that Santander is a medium-sized port and emissions could have been reduced by 38.26%, the OPS system has great reduction potential if applied to all ports in the area. It is also compatible with the introduction of other preventive measures.
- From an economic point of view, the greater the fuel/electricity price difference, the more attractive it will be for private entities to undertake the necessary investments.
- The OPS system is an innovative ship power supply system where its development should focus on the standardization, safety, and speed of the system. Technological advances in electricity production and the increase in green energy generation plants will directly improve the OPS’ emission reduction potential without the need for new investments.
- The reduction in emissions into the atmosphere will be greater the longer this system is in use.
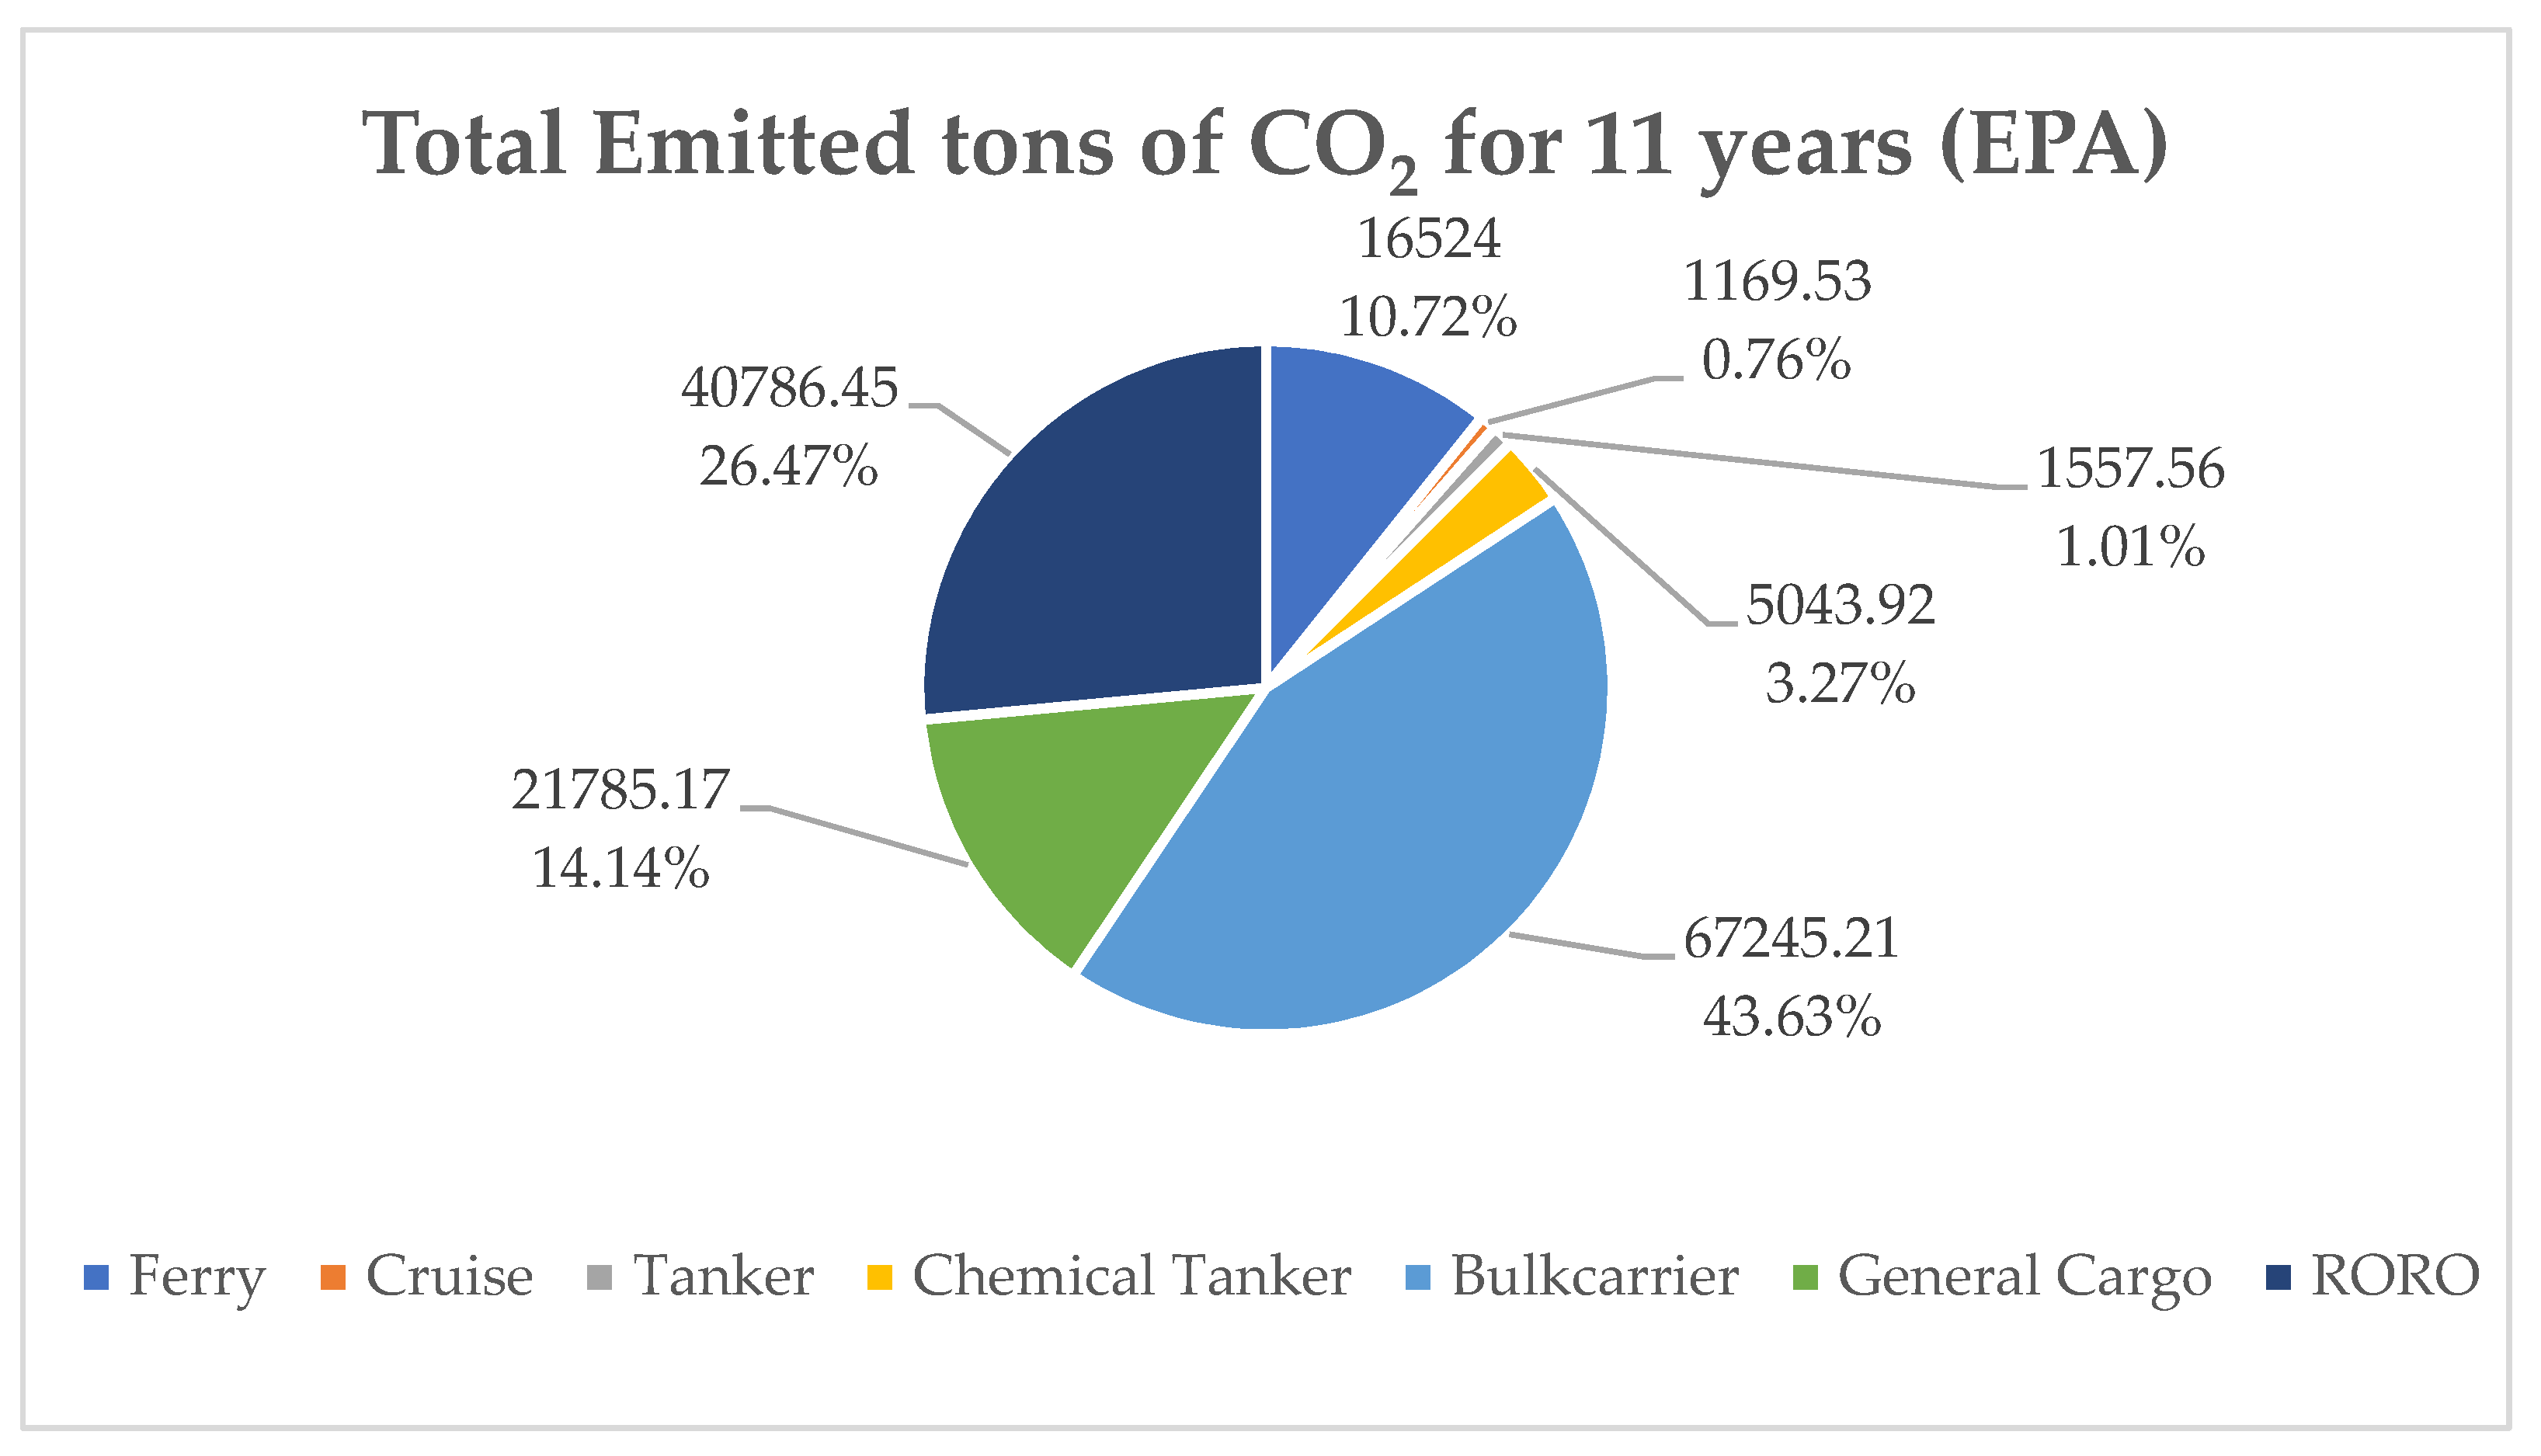
- Regularity is a key factor in its development, both on ships and in ports. Decision makers need to carefully evaluate pier priorities case by case per each port/traffic. From the results obtained in this work, it is deduced that, for the Port of Santander, the initial objective should be to implement the OPS for RORO, Ferry, and Cruise ships, which account for 37.95% of the total CO2 emissions during the period studied.
- OPS environmental performance varies directly depending on the source of the energy supplied.
- It is inferred that between 2011 and 2021, the reduction in emissions in Santander could have reached an average of 38.26%. Hall [11] already in 2010 estimated potential CO2 reduction of OPS around 37.8%. Its reducing capacity is not constant, but it is yearly increasing. It is expected that this positive trend will continue multiplying benefits during the next years due to the significant development of green energies in recent times.
- Regardless of the source of energy, a vessel docked and connected to the OPS reduces auxiliary engines port emissions locally to 0, improving the quality of life of the port community and all those located in its area of influence. (In the case of releasing CO2 emissions to the atmosphere, these are relocated where energy production facilities are settled).
Author Contributions
Funding
Institutional Review Board Statement
Informed Consent Statement
Conflicts of Interest
References
- United Nations. Report of the World Commission on Environment and Development. In Proceedings of the United Nations General Assembly—42nd Session, New York, NY, USA, 20 November 1987. [Google Scholar]
- European Commission. A Roadmap for Moving to a Competitive Low Carbon Economy in 2050; European Commission: Brussels, Belgium, 2011.
- European Parliament. Deployment of Alternative Fuels Infrastructure. 2014. Available online: https://eur-lex.europa.eu/legal-content/EN/TXT/PDF/?uri=CELEX:32014L0094&from=EN (accessed on 25 May 2021).
- European Commission. The European Green Deal—COM/2019/640 Final. 2019. Available online: https://eur-lex.europa.eu/legal-content/EN/TXT/?uri=COM%3A2019%3A640%3AFIN (accessed on 25 February 2021).
- Mikova, N.; Eichhammer, W.; Pfluger, B. Low-carbon energy scenarios 2050 in north-west European countries: Towards a more harmonised approach to achieve the EU targets. Energy Policy 2019, 130, 448–460. [Google Scholar] [CrossRef]
- European Environment Agengy. Greenhouse Gas Emissions from Transport in Europe. 2019. Available online: https://www.eea.europa.eu/data-and-maps/indicators/transport-emissions-of-greenhouse-gases-7/assessment (accessed on 8 January 2021).
- Song, S.-K.; Shon, Z.-H. Current and future emission estimates of exhaust gases and particles from shipping at the largest port in Korea. Environ. Sci. Pollut. Res. 2014, 21, 6612–6622. [Google Scholar] [CrossRef]
- Du, Y.; Chen, Q.; Quan, X.; Long, L.; Fung, R.Y.K. Berth allocation considering fuel consumption and vessel emissions. Transp. Res. Part E Logist. Transp. Rev. 2011, 47, 1021–1037. [Google Scholar] [CrossRef]
- Winkel, R.; Weddige, U.; Johnsen, D.; Hoen, V.; Papaefthimiou, S. Shore side electricity in Europe: Potential and environmental benefits. Energy Policy 2016, 88, 584–593. [Google Scholar] [CrossRef]
- Chang, C.-C.; Wang, C.-M. Evaluating the effects of green port policy: Case study of Kaohsiung harbor in Taiwan. Transp. Res. Part D Transp. Environ. 2012, 17, 185–189. [Google Scholar] [CrossRef]
- Hall, W.J. Assessment of CO2 and priority pollutant reduction by installation of shoreside power. Resour. Conserv. Recycl 2010, 54, 462–467. [Google Scholar] [CrossRef]
- Paul, D.; Haddadian, V. Cold ironing-power system grounding and safety analysis. In Proceedings of the Fourtieth IAS Annual Meeting. Conference Record of the 2005 Industry Applications Conference, Hong Kong, China, 2–6 October 2005; Volume 2, pp. 1503–1511. [Google Scholar]
- European Union. Promotion of Shore-Side Electricity for Use by Ships at Berth in Community Ports. 2006. Available online: https://eur-lex.europa.eu/legal-content/EN/TXT/PDF/?uri=CELEX:32006H0339&from=EN (accessed on 17 March 2021).
- European Parliament. Council Directive 2012/33/UE. 2012. Available online: https://eur-lex.europa.eu/legal-content/ES/TXT/PDF/?uri=CELEX:32012L0033&from=IT (accessed on 23 March 2021).
- European Union. Directive 2014/94/Eu Deployment of Alternative Fuels Insfrastructure. 2014. Available online: https://eur-lex.europa.eu/legal-content/EN/TXT/PDF/?uri=CELEX:32014L0094&from=ES (accessed on 5 April 2021).
- Zis, T.P. Prospects of cold ironing as an emissions reduction option. Transp. Res. Part A Policy Pract. 2019, 119, 82–95. [Google Scholar] [CrossRef]
- Molavi, A.; Lim, G.J.; Shi, J. Stimulating sustainable energy at maritime ports by hybrid economic incentives: A bilevel optimization approach. Appl. Energy 2020, 272, 115188. [Google Scholar] [CrossRef]
- Wu, L.; Wang, S. The shore power deployment problem for maritime transportation. Transp. Res. Part E Logist. Transp. Rev. 2020, 135, 101883. [Google Scholar] [CrossRef]
- Yiğit, K.; Kökkülünk, G.; Parlak, A.; Karakaş, A. Energy cost assessment of shoreside power supply considering the smart grid concept: A case study for a bulk carrier ship. Marit. Policy Manag. 2016, 43, 469–482. [Google Scholar] [CrossRef]
- Goverment, S. Puertos del Estado. 2022. Available online: https://www.puertos.es/es-es/estadisticas/Paginas/estadistica_mensual.aspx (accessed on 20 September 2022).
- Du, K.; Monios, J.; Wang, Y. Green port strategies in China. In Green Ports; Elsevier: Amsterdam, The Netherlands, 2019; pp. 211–229. [Google Scholar]
- Díaz-Ruiz-Navamuel, E.; Piris, A.O.; Pérez-Labajos, C.A. Reduction in CO2 emissions in RoRo/Pax ports equipped with automatic mooring systems. Environ. Pollut. 2018, 241, 879–886. [Google Scholar] [CrossRef]
- United Nations. Review of Maritime Transport. 2020. Available online: https://unctad.org/webflyer/review-maritime-transport-2020 (accessed on 15 November 2021).
- Cabral, T.; Clemente, D.; Rosa-Santos, P.; Taveira-Pinto, F.; Morais, T.; Belga, F.; Cestaro, H. Performance assessment of a hybrid wave energy converter integrated into a harbor breakwater. Energies 2020, 13, 236. [Google Scholar] [CrossRef]
- Rosa-Santos, P.; Taveira-Pinto, F.; Clemente, D.; Cabral, T.; Fiorentin, F.; Belga, F.; Morais, T. Experimental study of a hybrid wave energy converter integrated in a harbor breakwater. J. Mar. Sci. Eng. 2019, 7, 33. [Google Scholar] [CrossRef]
- Cascajo, R.; García, E.; Quiles, E.; Correcher, A.; Morant, F. Integration of marine wave energy converters into seaports: A case study in the Port of Valencia. Energies 2019, 12, 787. [Google Scholar] [CrossRef]
- Murai, M.; Li, Q.; Funada, J. Study on power generation of single Point Absorber Wave Energy Converters (PA-WECs) and arrays of PA-WECs. Renew. Energy 2020, 164, 1121–1132. [Google Scholar] [CrossRef]
- Bertram, D.V.; Tarighaleslami, A.H.; Walmsley, M.R.W.; Atkins, M.J.; Glasgow, G.D.E. A systematic approach for selecting suitable wave energy converters for potential wave energy farm sites. Renew. Sustain. Energy Rev. 2020, 132, 110011. [Google Scholar] [CrossRef]
- de Antonio, F. Wave energy utilization: A review of the technologies. Renew. Sustain. Energy Rev. 2010, 14, 899–918. [Google Scholar]
- Ramos, V.; Carballo, R.; Álvarez, M.; Sánchez, M.; Iglesias, G. A port towards energy self-sufficiency using tidal stream power. Energy 2014, 71, 432–444. [Google Scholar] [CrossRef]
- Hua-Ming, W.; Xiao-Kun, Q.; Lin, C.; Lu, T.; Qiao, W. Numerical study on energy-converging efficiency of the ducts of vertical axis tidal current turbine in restricted water. Ocean Eng. 2020, 210, 107320. [Google Scholar] [CrossRef]
- Krämer, I.; Czermański, E. Onshore power one option to reduce air emissions in ports. Nachhalt. Manag. Forum Sustain. Manag. Forum 2020, 28, 13–20. [Google Scholar] [CrossRef]
- Schwartz, H.; Gustafsson, M.; Spohr, J. Emission abatement in shipping–is it possible to reduce carbon dioxide emissions profitably? J. Clean. Prod. 2020, 254, 120069. [Google Scholar] [CrossRef]
- Yu, J.; Voß, S.; Tang, G. Strategy development for retrofitting ships for implementing shore side electricity. Transp. Res. Part D Transp. Environ. 2019, 74, 201–213. [Google Scholar] [CrossRef]
- Sorte, S.; Rodrigues, V.; Borrego, C.; Monteiro, A. Impact of harbour activities on local air quality: A review. Environ. Pollut. 2020, 257, 113542. [Google Scholar] [CrossRef] [PubMed]
- Corbett, J.J.; Winebrake, J.J.; Green, E.H.; Kasibhatla, P.; Eyring, V.; Lauer, A. Mortality from ship emissions: A global assessment. Environ. Sci. Technol. 2007, 41, 8512–8518. [Google Scholar] [CrossRef]
- Bailey, D.; Plenys, T.; Solomon, G.M.; Campbell, T.R.; Feuer, G.R.; Masters, J.; Tonkonogy, B. Harboring Pollution: Strategies to Clean Up US Ports; NRDC: New York, NY, USA, 2004; pp. 1–85. [Google Scholar]
- Quaranta, F.; Fantauzzi, M.; Coppola, T.; Battistelli, L. Analysis of the Pollution Level and Possible solutions. J. Marit. Res. 2012, 9, 81–86. [Google Scholar]
- MEPC, IMO. Reduction of GHG Emissions from Ships. Available online: https://safety4sea.com/wp-content/uploads/2020/08/MEPC-75-7-15-Fourth-IMO-GHG-Study-2020-Final-report-Secretariat.pdf (accessed on 25 September 2021).
- Smith, T.W.P.; Jalkanen, J.P.; Anderson, B.A.; Corbett, J.J.; Faber, J.; Hanayama, S.; O’keeffe, E.; Parker, S.; Johanasson, L.; Aldous, L. Third IMO GHG Study 2014. Available online: https://greenvoyage2050.imo.org/wp-content/uploads/2021/01/third-imo-ghg-study-2014-executive-summary-and-final-report.pdf (accessed on 2 February 2022).
- Acomi, N.; Acomi, O.C. The influence of different types of marine fuel over the energy efficiency operational index. Energy Procedia 2014, 59, 243–248. [Google Scholar] [CrossRef]
- Psaraftis, H.N.; Kontovas, C.A. Green maritime transportation: Speed and route optimization. In Green Transportation Logistics; Springer: Berlin, Germany, 2016; pp. 299–349. [Google Scholar]
- Psaraftis, H.N.; Kontovas, C.A. Speed models for energy-efficient maritime transportation: A taxonomy and survey. Transp. Res. Part C Emerg. Technol. 2013, 26, 331–351. [Google Scholar] [CrossRef]
- Wang, S.; Meng, Q. Sailing speed optimization for container ships in a liner shipping network. Transp. Res. Part E Logist. Transp. Rev. 2012, 48, 701–714. [Google Scholar] [CrossRef]
- Hermeling, C.; Klement, J.H.; Koesler, S.; Köhler, J.; Klement, D. Sailing into a dilemma: An economic and legal analysis of an EU trading scheme for maritime emissions. Transp. Res. Part A Policy Pract. 2015, 78, 34–53. [Google Scholar] [CrossRef]
- European Parliament. Council Directive 1999/32/UE. 1999. Available online: https://eur-lex.europa.eu/legal-content/EN/TXT/PDF/?uri=CELEX:31999L0032&from=ES (accessed on 14 October 2021).
- European Parliament. Concil Directive 2005/33/UE. 2005. Available online: https://eur-lex.europa.eu/legal-content/ES/TXT/PDF/?uri=CELEX:32005L0033&from=EN (accessed on 17 August 2022).
- Tichavska, M.; Tovar, B.; Gritsenko, D.; Johansson, L.; Jalkanen, J.P. Air emissions from ships in port: Does regulation make a difference? Transp. Policy 2019, 75, 128–140. [Google Scholar] [CrossRef]
- Stolz, B.; Held, M.; Georges, G.; Boulouchos, K. The CO2 reduction potential of shore-side electricity in Europe. Appl. Energy 2021, 285, 116425. [Google Scholar] [CrossRef]
- Maragkogianni, A.; Papaefthimiou, S.; Zopounidis, C. Current methodologies for the estimation of maritime emissions. In Mitigating Shipping Emissions in European Ports; Springer: Berlin, Germany, 2016; pp. 25–35. [Google Scholar]
- Dolphin, M.J.; Melcer, M. Estimation of ship dry air emissions. Nav. Eng. J. 2008, 120, 27–36. [Google Scholar] [CrossRef]
- Piris, A.O.; Díaz-Ruiz-Navamuel, E.; Pérez-Labajos, C.A.; Chaveli, J.O. Reduction of CO2 emissions with automatic mooring systems. The case of the port of Santander. Atmos. Pollut. Res. 2018, 9, 76–83. [Google Scholar] [CrossRef]
- MEPC. Directrices Sobre el Método de Cálculo del Índice de Eficiencia Energética (EEDI) de Proyecto Para Buques Nuevos. MEPC. 2012. Available online: https://www.directemar.cl/directemar/site/artic/20190212/asocfile/20190212091101/mepc_212_63_.pdf (accessed on 18 August 2021).
- Grebot, B.; Scarbrough, T.; Ritchie, A.; Mahoney, C.; Noden, R.; Sobey, M.; Whall, C. Study to Review Assessments Undertaken of the Revised MARPOL Annex VI Regulations; Entec UK Limited: London, UK, 2010. [Google Scholar]
- U.S. Environmental Protection Agency. EPA. Available online: https://www.epa.gov/air-emissions-factors-and-quantification/basic-information-air-emissions-factors-and-quantification (accessed on 12 December 2021).
- Santander Port Authority. Available online: https://www.puertosantander.es/cas/home.aspx (accessed on 10 January 2022).
- Sea-Web AIS Life. Available online: https://maritime.ihs.com/ (accessed on 25 January 2022).
- Goverment, S. Spanish National Grid. Available online: https://www.ree.es/es/datos/generacion/estructura-generacion-emisiones-asociadas (accessed on 12 February 2022).
- Eólica, A.E. Asociación Empresarial Eólica. Available online: https://www.aeeolica.org/sobre-la-eolica/la-eolica-espana (accessed on 15 November 2021).
- Eide, M.S.; Chryssakis, C.; Endresen, Ø. CO2 Abatement Potential towards 2050 for Shipping, including Alternative Fuels. Carbon Manag. 2013, 4, 275–289. [Google Scholar] [CrossRef]
- WalleniusWilhelmsen. WWL—Wind Powered RORO. 2022. Available online: https://www.walleniuswilhelmsen.com/news-and-insights/highlighted-topics/orcelle (accessed on 23 March 2022).
- Hoegh. Hoegh—Zero Carbon New Building. 2022. Available online: https://www.hoeghautoliners.com/news-and-media/news-and-press-releases/hoegh-signs-contract-with-china-merchants-heavy-industry-to-build-a-series-of-its-zero-carbon-ready-aurora-class-vessels (accessed on 25 March 2022).
- Bouman, E.A.; Lindstad, E.; Rialland, A.I.; Strømman, A.H. State-of-the-art technologies, measures, and potential for reducing GHG emissions from shipping–a review. Transp. Res. Part D Transp. Environ. 2017, 52, 408–421. [Google Scholar] [CrossRef]
- Ecological Cars. Estrecho Digit. 2022. Available online: https://www-elestrechodigital-com.cdn.ampproject.org/c/s/www.elestrechodigital.com/2022/01/26/el-puerto-de-santander-sustituye-trece-vehiculos-contaminantes-por-otros-ecologicos/amp/?p=139190 (accessed on 20 July 2021).
- Vaishnav, P.; Fischbeck, P.S.; Morgan, M.G.; Corbett, J.J. Shore power for vessels calling at US ports: Benefits and costs. Environ. Sci. Technol. 2016, 50, 1102–1110. [Google Scholar] [CrossRef]
- Innes, A.; Monios, J. Identifying the unique challenges of installing cold ironing at small and medium ports–The case of Aberdeen. Transp. Res. Part D Transp. Environ. 2018, 62, 298–313. [Google Scholar] [CrossRef]
- European Commission. Masterplan for OPS in Spanish Ports. Available online: https://ec.europa.eu/inea/sites/default/files/fiche_2015-eu-tm-0417-s_final.pdf (accessed on 15 August 2022).
- Europe Facility (CEF) for Transport. OPS Masterplan for Spanish Ports. Available online: http://poweratberth.eu/?page_id=38&lang=en (accessed on 23 September 2021).
- European Union. Green Ports. 2022. Available online: https://greencportsproject.eu/ (accessed on 15 May 2022).
- 295 FINAL—An Engine for Growth. 2013. Available online: EUR.COM (accessed on 10 April 2021).
- European Union. OPS Master Plan. 31 December 2021. Available online: https://poweratberth.eu/?lang=english (accessed on 11 May 2021).
- Mercantil, E. OPS Bilbao Port. El Merc. 2022. Available online: https://elmercantil.com/2022/03/21/el-puerto-de-bilbao-prepara-la-electrificacion-de-sus-muelles-para-2025/ (accessed on 19 December 2021).
- Canal, E. EL Canal MARITIMO. Canal Marit. 2022. Available online: https://www.diarioelcanal.com/puerto-barcelona-one-ocean-summit-sistemas-ops-2028/ (accessed on 5 January 2021).


| Chemical Tanker | Tanker | Bulkcarrier | General Cargo | RORO | |
|---|---|---|---|---|---|
| GT | Pot Aux (kW) | Pot Aux (kW) | Pot Aux (kW) | Pot Aux (kW) | Pot Aux (kW) |
| <2000 | 325 | 350 | 129.13 | ||
| 2001/4000 | 424.08 | 417.76 | 272.41 | 207.37 | 300 |
| 4001/6000 | 527.53 | 567.14 | 343.12 | 317.95 | |
| 6001/8000 | 541.05 | 704.77 | 370.37 | ||
| 8001/10,000 | 544.47 | 384.12 | 395.31 | 354.71 | |
| 10,001/12,000 | 709.06 | 451.34 | |||
| >12,000 | 850 | 1049.72 | |||
| 10,001/15,000 | 419.2 | 476.73 | |||
| 15,001/25,000 | 450.58 | 538.53 | |||
| 25,001/35,000 | 563.54 | 735.51 | |||
| >35,001 | 654.16 | 800 | |||
| 10,001/20,000 | 544.38 | ||||
| 20,001/30,000 | 1022.96 | ||||
| 30,001/40,000 | 1054.51 | ||||
| 40,001/50,000 | 1224.69 | ||||
| 50,001/60,000 | 1524.57 | ||||
| >60,001 | 1620.03 |
| 2011–2013 | 2014–2016 | 2017–2019 | 2020–2021 | TOTAL | |||
|---|---|---|---|---|---|---|---|
| FERRY | Number of ships | 576 | 597 | 740 | 336 | 2249 | |
| Hours alongside | 2736 | 3817 | 5422 | 3864 | 15,840 | ||
| Total tons of CO2 |  | EPA-1984/2000 | 3134.250 | 4133.770 | 5822.540 | 3880.030 | 16,970.590 |
| EPA-2000+ | 3051.770 | 4024.990 | 5669.310 | 3777.930 | 16,524.000 | ||
| ENTEC-1984/2000 | 1567.125 | 2066.885 | 2911.270 | 1940.015 | 8485.295 | ||
| ENTEC-2000+ | 1525.885 | 2012.495 | 2834.655 | 1888.965 | 8262.000 | ||
| CRUISE | Number of ships | 29 | 25 | 40 | 3 | 97 | |
| Hours alongside | 278 | 229 | 399 | 29 | 936 | ||
| Total tons of CO2 | | EPA-1984/2000 | 377.290 | 251.700 | 522.970 | 49.160 | 1201.120 |
| EPA-2000+ | 367.360 | 245.080 | 509.220 | 47.870 | 1169.530 | ||
| ENTEC-1984/2000 | 188.645 | 125.850 | 261.485 | 24.580 | 600.560 | ||
| ENTEC-2000+ | 183.680 | 122.540 | 254.610 | 23.935 | 584.765 | ||
| TANKER | Number of ships | 16 | 27 | 52 | 37 | 132 | |
| Hours alongside | 544 | 817 | 1965 | 1258 | 4587 | ||
| Total tons of CO2 | | EPA-1984/2000 | 178.930 | 216.200 | 739.560 | 464.970 | 1599.660 |
| EPA-2000+ | 174.220 | 210.510 | 720.100 | 452.730 | 1557.560 | ||
| ENTEC-1984/2000 | 89.4650 | 108.100 | 369.780 | 232.485 | 799.830 | ||
| ENTEC-2000+ | 87.110 | 105.255 | 360.050 | 226.365 | 778.780 | ||
| CHEMICAL TANKER | Number of ships | 220 | 148 | 190 | 86 | 644 | |
| Hours alongside | 4783 | 3677 | 5363 | 2395 | 16,219 | ||
| Total tons of CO2 | | EPA-1984/2000 | 1480.110 | 1179.100 | 1757.860 | 763.170 | 5180.240 |
| EPA-2000+ | 1441.150 | 1148.080 | 1711.610 | 743.080 | 5043.920 | ||
| ENTEC-1984/2000 | 740.055 | 589.550 | 878.930 | 381.585 | 2590.120 | ||
| ENTEC-2000+ | 720.575 | 574.040 | 855.805 | 371.540 | 2521.960 | ||
| BULKCARRIER | Number of ships | 1784 | 1824 | 1749 | 1235 | 6592 | |
| Hours alongside | 9108 | 81,276 | 92,446 | 62,238 | 32,7042 | ||
| Total tons of CO2 | | EPA-1984/2000 | 18,087.770 | 17,118.850 | 20,398.200 | 13,457.820 | 69,062.640 |
| EPA-2000+ | 17,611.780 | 16,668.350 | 19,861.400 | 13,103.680 | 67,245.210 | ||
| ENTEC-1984/2000 | 9043.885 | 8559.425 | 10,199.100 | 6728.910 | 34,531.320 | ||
| ENTEC-2000+ | 8805.890 | 8334.175 | 9930.700 | 6551.840 | 33,622.605 | ||
| GENERAL CARGO | Number of ships | 752 | 696 | 681 | 488 | 2617 | |
| Hours alongside | 31,310 | 34,129 | 30,153 | 21,776 | 11,7370 | ||
| Total tons of CO2 | | EPA-1984/2000 | 5708.07 | 6741.19 | 5699.700 | 4225.100 | 22,374.060 |
| EPA-2000+ | 5557.76 | 6563.79 | 5549.710 | 4113.910 | 21,785.170 | ||
| ENTEC-1984/2000 | 2854.035 | 3370.595 | 2849.850 | 2112.550 | 11,187.030 | ||
| ENTEC-2000+ | 2778.88 | 3281.895 | 2774.855 | 2056.955 | 10,892.585 | ||
| RORO | Number of ships | 1243 | 1507 | 1799 | 1191 | 5740 | |
| Hours alongside | 16,516 | 16,773 | 22,219 | 2112 | 76,629 | ||
| Total tons of CO2 | | EPA-1984/2000 | 6969.470 | 9871.820 | 12,451.010 | 12,596.470 | 41,888.770 |
| EPA-2000+ | 6786.060 | 9612.040 | 12,123.360 | 12,264.990 | 40,786.450 | ||
| ENTEC-1984/2000 | 3484.735 | 4935.910 | 6225.505 | 6298.235 | 20,944.385 | ||
| ENTEC-2000+ | 3393.030 | 4806.020 | 6061.680 | 6132.495 | 20,393.225 | ||
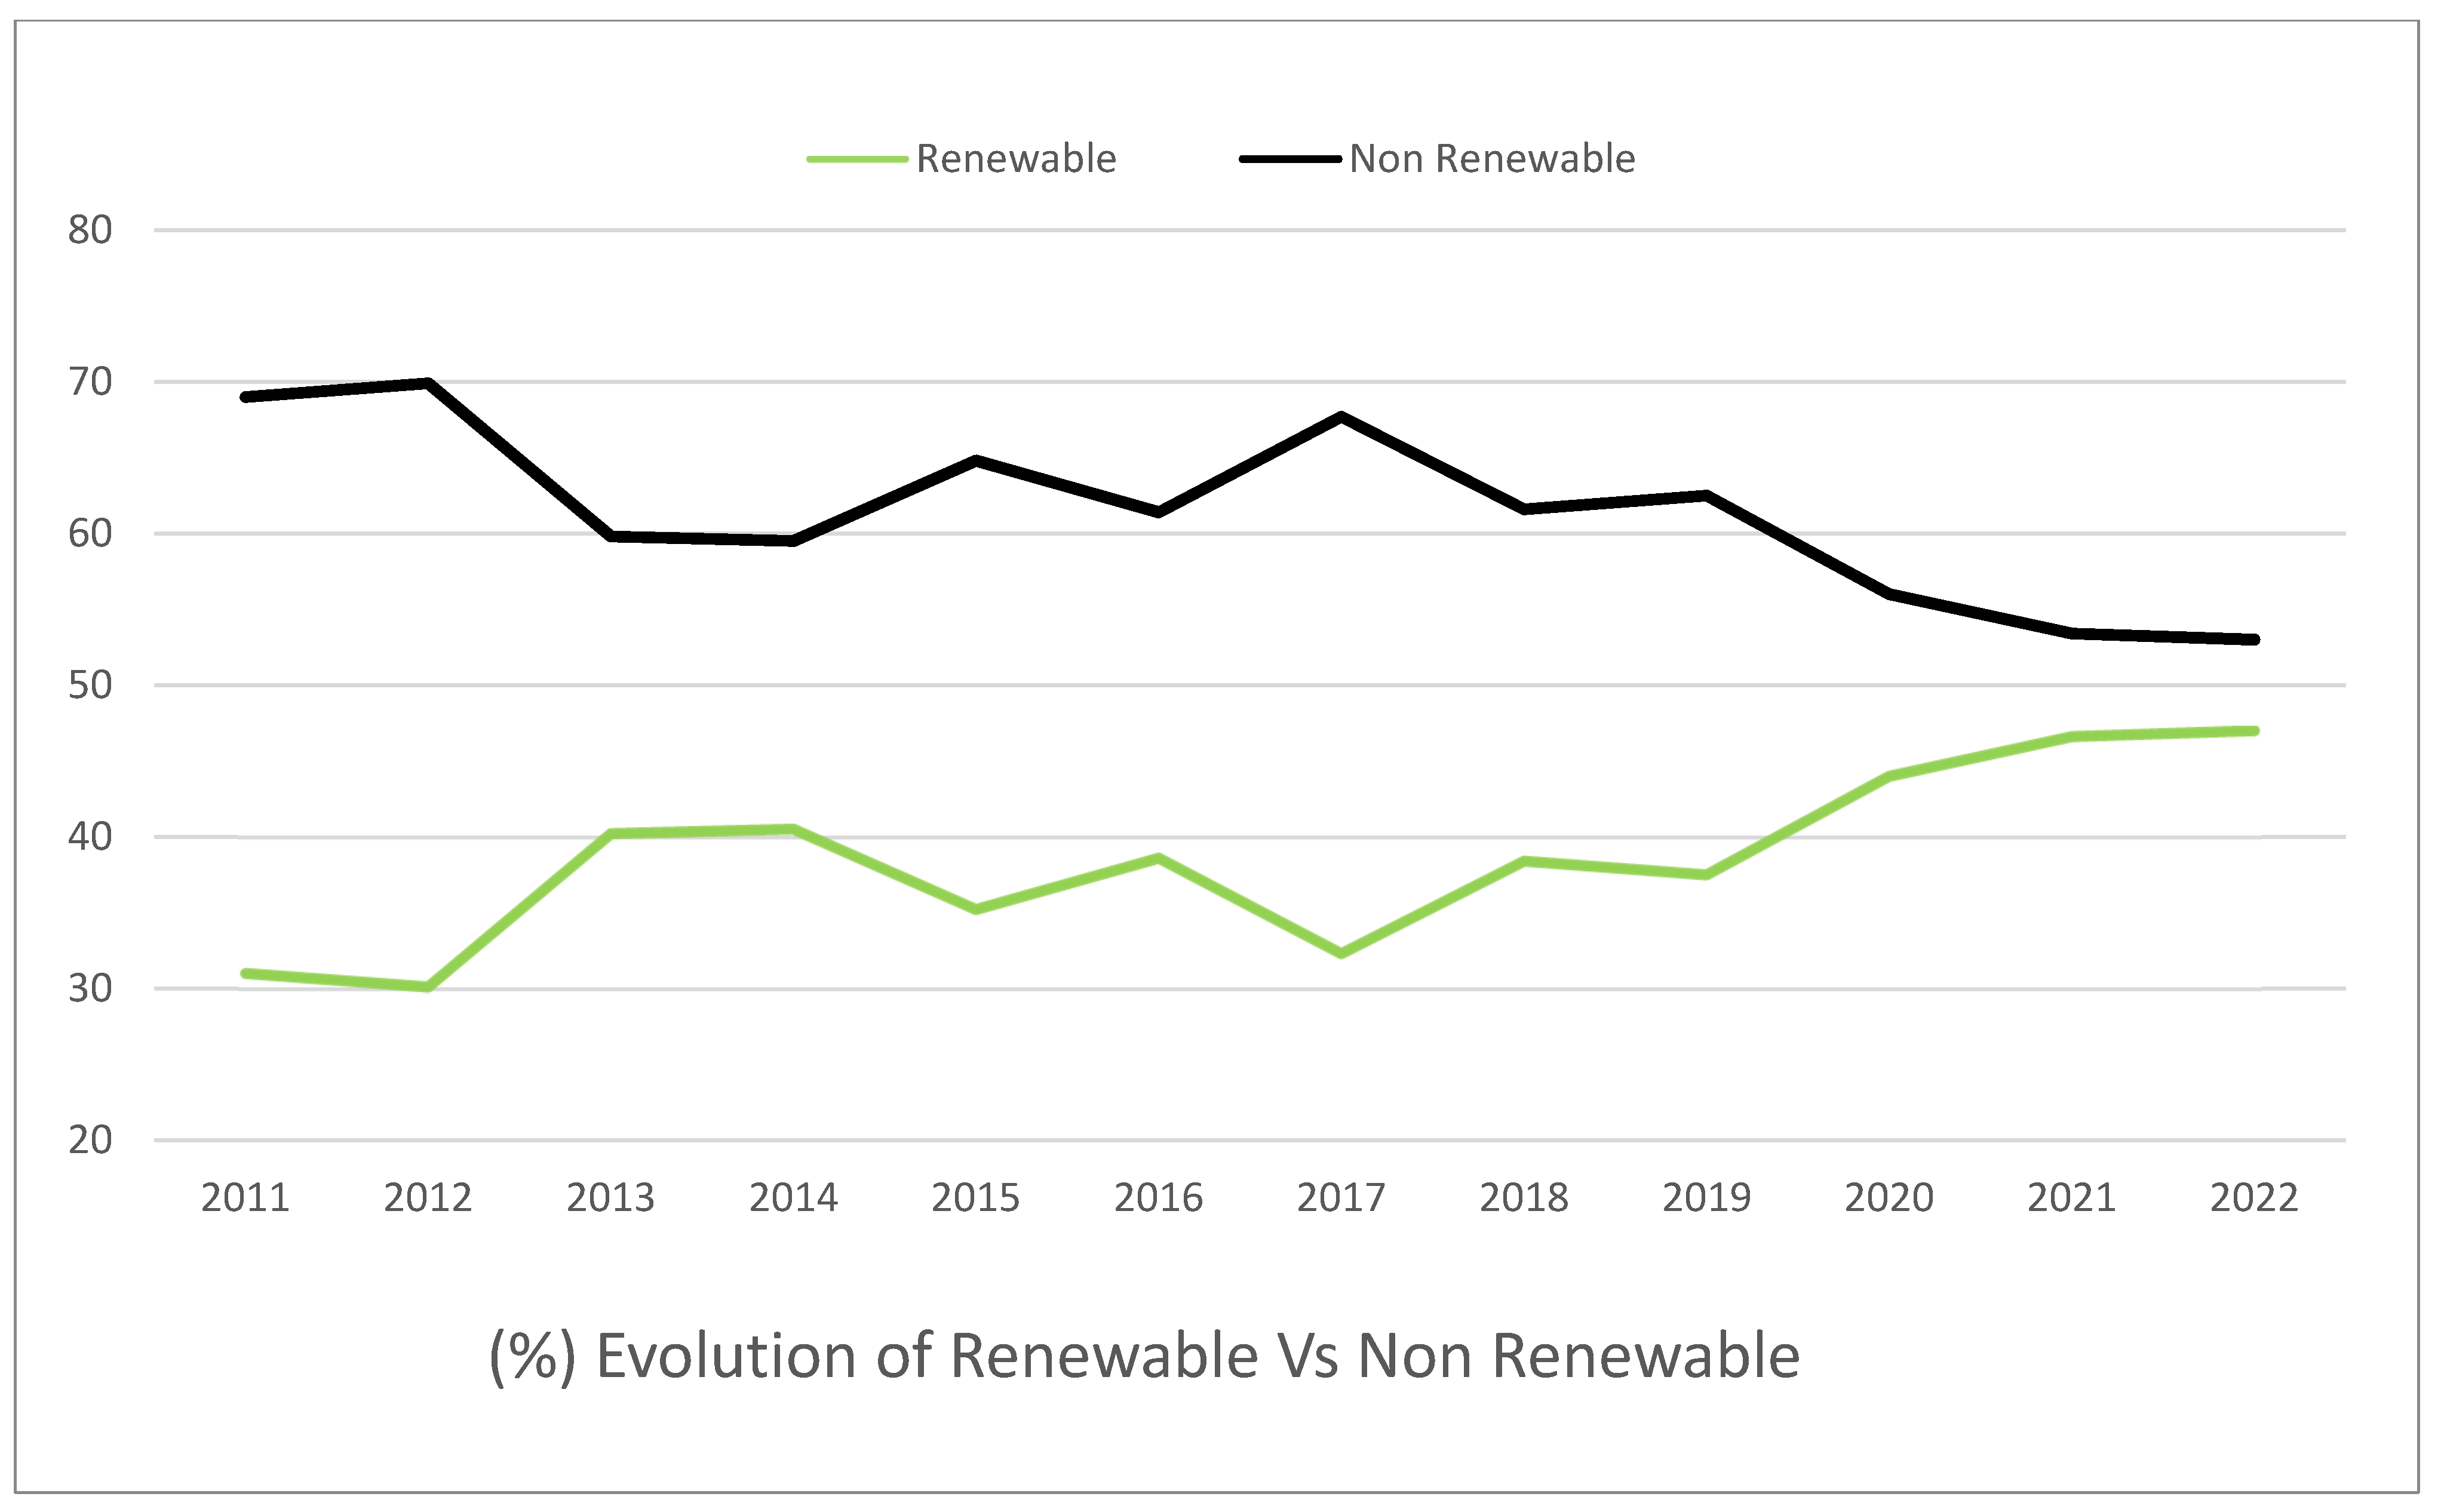
| % | 2011 | 2012 | 2013 | 2014 | 2015 | 2016 | 2017 | 2018 | 2019 | 2020 | 2021 | 2022 |
|---|---|---|---|---|---|---|---|---|---|---|---|---|
| Renewable | 31 | 30.1 | 40.2 | 40.5 | 35.2 | 38.6 | 32.3 | 38.4 | 37.5 | 44 | 46.6 | 47 |
| Non-Renewable | 69 | 69.9 | 59.8 | 59.5 | 64.8 | 61.4 | 67.7 | 61.6 | 62.5 | 56 | 53.4 | 53 |
| 2011–2013 | 2014–2016 | 2017–2019 | 2020–2021 | TOTAL | ||
|---|---|---|---|---|---|---|
| FERRY | 576 | 597 | 740 | 336 | 2249 | |
| Potential save of CO2 tons | EPA | 1021.874 | 1.542.659 | 2083.966 | 1691.343 | 6339.842 |
| ENTEC | 510.937 | 771.3293 | 1041.983 | 845.6715 | 3169.921 | |
| CRUISE | 29 | 25 | 40 | 3 | 97 | |
| Potential save of CO2 tons | EPA | 125.3275 | 92.83066 | 181.2379 | 22.30742 | 421.7034 |
| ENTEC | 62.66374 | 46.41533 | 90.61894 | 11.15371 | 210.8517 | |
| TANKER | 16 | 27 | 52 | 37 | 132 | |
| Potential save of CO2 tons | EPA | 61.34269 | 79.32283 | 264.673 | 205.7943 | 611.1328 |
| ENTEC | 30.67135 | 39.66142 | 132.3365 | 102.8971 | 305.5664 | |
| CHEMICAL TANKER | 220 | 148 | 190 | 86 | 644 | |
| Potential save of CO2 tons | EPA | 486.0212 | 437.1079 | 618.5519 | 338.0673 | 1879.748 |
| ENTEC | 243.0106 | 218.5539 | 309.2759 | 169.0337 | 939.8741 | |
| BULKCARRIER | 1784 | 1824 | 1749 | 1235 | 6592 | |
| Potential save of CO2 tons | EPA | 5992.793 | 6350.675 | 7171.244 | 5950.531 | 25,465.24 |
| ENTEC | 2996.396 | 3175.337 | 3585.622 | 2975.266 | 12,732.62 | |
| GENERAL CARGO | 752 | 696 | 681 | 488 | 2617 | |
| Potential save of CO2 tons | EPA | 1935.544 | 2528.522 | 2017.093 | 1868.55 | 8349.708 |
| ENTEC | 967.7719 | 1264.261 | 1008.546 | 934.275 | 4174.854 | |
| RORO | 1243 | 1507 | 1799 | 1191 | 5740 | |
| Potential save of CO2 tons | EPA | 2294.555 | 3662.479 | 4384.614 | 5548.578 | 15,890.23 |
| ENTEC | 1147.278 | 1831.239 | 2192.307 | 2774.289 | 7945.114 |
Publisher’s Note: MDPI stays neutral with regard to jurisdictional claims in published maps and institutional affiliations. |
© 2022 by the authors. Licensee MDPI, Basel, Switzerland. This article is an open access article distributed under the terms and conditions of the Creative Commons Attribution (CC BY) license (https://creativecommons.org/licenses/by/4.0/).
Share and Cite
Herrero, A.; Ortega Piris, A.; Diaz-Ruiz-Navamuel, E.; Gutierrez, M.A.; Lopez-Diaz, A.-I. Influence of the Implantation of the Onshore Power Supply (OPS) System in Spanish Medium-Sized Ports on the Reduction in CO2 Emissions: The Case of the Port of Santander (Spain). J. Mar. Sci. Eng. 2022, 10, 1446. https://doi.org/10.3390/jmse10101446
Herrero A, Ortega Piris A, Diaz-Ruiz-Navamuel E, Gutierrez MA, Lopez-Diaz A-I. Influence of the Implantation of the Onshore Power Supply (OPS) System in Spanish Medium-Sized Ports on the Reduction in CO2 Emissions: The Case of the Port of Santander (Spain). Journal of Marine Science and Engineering. 2022; 10(10):1446. https://doi.org/10.3390/jmse10101446
Chicago/Turabian StyleHerrero, Alvaro, Andrés Ortega Piris, Emma Diaz-Ruiz-Navamuel, Miguel A. Gutierrez, and Alfonso-Isidro Lopez-Diaz. 2022. "Influence of the Implantation of the Onshore Power Supply (OPS) System in Spanish Medium-Sized Ports on the Reduction in CO2 Emissions: The Case of the Port of Santander (Spain)" Journal of Marine Science and Engineering 10, no. 10: 1446. https://doi.org/10.3390/jmse10101446
APA StyleHerrero, A., Ortega Piris, A., Diaz-Ruiz-Navamuel, E., Gutierrez, M. A., & Lopez-Diaz, A.-I. (2022). Influence of the Implantation of the Onshore Power Supply (OPS) System in Spanish Medium-Sized Ports on the Reduction in CO2 Emissions: The Case of the Port of Santander (Spain). Journal of Marine Science and Engineering, 10(10), 1446. https://doi.org/10.3390/jmse10101446