

Evaluation of the Corrosion Depth of Double Bottom Longitudinal Girder on Aging Bulk Carriers


1
Faculty of Maritime Studies Kotor, University of Montenegro, Put I Bokeljske Brigade 44, 85330 Kotor, Montenegro
2
Faculty of Applied Sciences, University of Donja Gorica, Oktoih 1, Donja Gorica, 81000 Podgorica, Montenegro
3
Faculty of Mechanical Engineering, University of Belgrade, Kraljice Marije 16, 11000 Belgrade, Serbia
4
Faculty of Maritime Studies, University of Rijeka, Studentska 2, 51000 Rijeka, Croatia
*
Author to whom correspondence should be addressed.
J. Mar. Sci. Eng. 2022, 10(10), 1425; https://doi.org/10.3390/jmse10101425
Submission received: 23 August 2022
/
Revised: 19 September 2022
/
Accepted: 28 September 2022
/
Published: 3 October 2022
(This article belongs to the Special Issue Design, Analysis and Maintenance of Green Innovative Marine Structures)
Abstract
:The longitudinal girder (LG) between fuel oil tanks (FOT) and water ballast tanks in the double bottoms of ships represent critical structural parts whose watertight nature could be harmed by corrosion, thus, causing the pollution of water ballast tanks and adjacent areas. The new common structural rules (CSR) define the minimum thickness values of structural elements and corrosion margins. The assessment of the deviations from the prescribed values during ship operation could optimize the prescribed criteria. Assuming that corrosive processes begin after four years of operation, the paper analyzes a linear model that describes the percentage of plate wear as a function of the built-in thickness of LG of FOT. The research included 20 ships and provided the database for 1918 corrosion depth values. The gauging records included the average values of the original thickness of steel plates grouped in three intervals (11–13 mm, 13–15 mm, 15–18 mm). Based on the difference between the built-in and subsequently measured values, the paper analyzes the percentage of thickness reduction due to corrosion, concerning the original plate thickness. The findings of the research should facilitate the optimization of corrosion margins and prevent potential structural collapse and pollution.
1. Introduction
Maritime incidents occur with new ships despite the fact that ships are typically designed to operate for more than 25 years. The research has shown that incidents resulting in complete losses of ships generally occur after 15 years of operation. According to the data from a survey conducted between 2001 and 2010, 12% of incidents involved ships aged 15–19 years, 26% of incidents involved ships aged 20–24 years and 47% of incidents involved ships aged over 25 years [1].
Over the last five decades, two separate studies indicated that a total of 444 shipwrecks resulted in 2397 human casualties [2,3]. Fifty-two out of four hundred and forty-four ship losses were caused by structural errors, while other incidents were related to fires, stranding, collisions, etc. [2,3]. Therefore, the maintenance of the operating conditions and impermeability of steel plates and structural elements should be a priority on board. Collisions, strands, fires, etc. are accidental causes of incidents. However, structural errors and harmful consequences caused by corrosion could be reduced. The harmful effects of corrosion can lead to material losses that are related to the degradation of stiffening, breakage and leakage of steel plates, which can further result in pollution and total ship losses.
The most excessive environmental pollution occurs due to oil spills from tankers after collisions, fires, grounding, structural failures, etc. However, a lot of incidents are also caused by the collision or stranding of bulk carriers, which lead to oil spills as well. Pollution can also occur due to poor maintenance and structural defects, which are the consequences of intensive corrosion processes in the adjacent contact zones of fuel tanks and ballast tanks, dry areas, cargo storage, engine room, etc.
To reduce structural errors, in 1992, the IACS (International Association of Classification Societies) Council introduced an intensified program for the inspection of bulk carriers IACS, which was in 1995 included in the SOLAS Convention [4]. In that sense, inspections became mandatory for all the ships flying the flags of the IMO member states. Similarly, according to the IMO Maritime Safety Committee, from 1 July 1999, bulk carriers longer than 150 m and older than 10 years are not allowed to transport heavy loads without a special inspection within particular inspection programs (Enhanced Survey Program) [5]. The application of the new rules led to the formation of databases and the processing of the collected data on ships in operation. Data collection and processing should identify critical factors that cause structural failures. Furthermore, in 2006, IACS adopted the Common Structural Rules for Bulk Carriers and Oil Tankers that are meant to render ship designs more uniform. The adopted rules were last updated in 2021 [6].
The study by individual researchers and classification societies included technical research and examinations that assessed the physical causes of failures that occurred in bulk carriers. One study proved that the primary causes of the total loss of bulk carriers included hull defects (caused by corrosion and physical damage during cargo operations) and the old structure of bulk carriers that transported iron for more than 20 years [7]. On the other hand, another similar study reported that corrosion or fatigue of materials were the most common causative factors of the wear of metal plates [8,9,10]. Other recent studies also indicated that increased risk to old bulk carriers is associated with the transport of heavy cargo such as iron ore, coal, etc. [2].
Corrosion modelling methods and the strength of corroded ship structures were thoroughly reviewed by Woloszyk [11]. Moreover, the effect of totally corroded elements on ship structural design was investigated by Pereira [12]. The corrosion effect, which dealt with the mechanical behavior of AH36 steel exposed to the marine environment was studied in [13], while a similar investigation was performed on AISI 316 L stainless steel [14].
The deterioration of ship structures and their accelerated ageing is a monotonous process that depends on the length of exploitation, the complexity of operating conditions, understanding of corrosion mechanisms, etc. The dominant influences are certainly the atmosphere, sea, and operating conditions on a ship [15].
The deterioration of ship structures also represents a type of accelerated ageing that occurs as a result of environmental influences and regular ship operation. Therefore, environmental conditions along with the operational characteristics of a ship have a decisive influence on the intensity of the decay of ship structures during exploitation. In that sense, the corrosive damage of steel structures on ships is influenced by numerous environmental factors, such as the marine environment (submerged, changeable, atmospheric, or closed); chemical characteristics of seawater, cargo, and air; as well as various operational factors (e.g., transport routes, maintenance systems, surface protection systems, the frequency of cleaning, sludge collection, water content, use of heaters and inert gas system in tankers, etc.)
Depending on the above-mentioned factors, there are different corrosion forms on metal surfaces. Many authors analyzed corrosion and identified the most common types: uniform, intergranular, galvanic, crevice, pitting, hydrogen damage, stress-corrosion, corrosion fatigue, hydrogen-induced cracking, cavitation, erosion, and fretting corrosion [16]. Each of the forms has specific harmful effects. Previous studies focused particularly on the occurrence of general and pitting corrosion.
The most important factors related to maritime accidents include transport routes, cargo types, national flag, length of operation, size and type of bulk carriers, place and date of shipbuilding, a month in the year, and the period in which the accident occurred [2].
Fuel tanks that store heavy fuel are often additionally heated to the temperature of (60–70) °C. The heating affects the steel plates of the adjacent water ballast tank (WBT). The heating of the watertight girders between heavy fuel and water ballast tanks increases the temperature and triggers the dynamic influences of wet and dry cycles due to ballast change.
The corrosion of ballast tanks depends on the overall time a ship spends under ballast. Gardiner and Melchers expressed the ratio of ballast as the ratio of total time in which ballast tanks are exposed to seawater, as opposed to the time that cargo holds spend in closed atmospheric conditions, e.g., after cargo holds are loaded [17,18]. The research that considered the relationship between geographic routes and the length of ballast tank exposure showed that ships were 25% of the time under ballast [19].
The water ballast maintenance and protection systems have a dominant influence on protective steel plates. High-quality surface coatings, impressed current cathodic protection, or the sacrificial anodes system contribute to full or partial protection of steel plates, prolonging and slowing down corrosion processes. Corrosion prevention by cathodic protection optimization was explored by Kolovelonis et al. [20] on an example of a container ship. Furthermore, due to the different maintenance requirements under the Enhanced Survey Program conducted by ship management companies and the application of the Performance Standard for Protective Coatings since 2006, which are not part of this research, it is to be expected that the condition of steel surfaces will be better in the future.
The authors of this article previously analyzed fuel tanks and two critical structural elements (inner bottom plating and longitudinal girder plating), employing a linear corrosion model [21,22]. This paper analyzes longitudinal girder plates based on the assumption that the thickness of girder plating behaves differently during exploitation, as it is investigated on the inner bottom plating [23]. Based on the decay rate of three thickness segments of longitudinal girder steel plates (11–13 mm, 13–15 mm, and 15–18 mm) the paper facilitates the optimization of the hull designs of the watertight longitudinal girder plating of fuel oil tanks. The research is based on the empirical data collected from the group of ageing bulk carriers. Nonetheless, it should be noted that future regulations will not allow fuel oil tanks to be located in the double bottom area. However, this is still not applied to all ships so this investigation could be helpful for the prediction of corrosion development in structures carrying bulk and displaying the same arrangement as one included in this study.
2. Corrosion Models
The corrosion mechanism can be based on theoretical assumptions. In that sense, some models are developed to present the physical and chemical properties of corrosion. Utilizing the developed models, the extent and rate of corrosion can be predicted through the estimation of the potential degrees of the influences that might affect the operation of a ship.
However, the usual approach to the prediction of corrosion rates in the atmosphere and marine environment is based on the adjustment of the equation of the measuring results that were collected from ships in operation. The development of corresponding models is based on the monitoring of ships during operation and the collection of the data measured. The quality of the models depends on the quality of the data used for the determination of model parameters since the analyses of the available data have very high variability.
In terms of corrosion mechanisms, the key factors are the likelihood of the occurrence of corrosion, time of occurrence, and the extent and rate of corrosion over time. A proper evaluation of the listed factors enables much easier and more accurate determination and identification of the corrosion mechanisms of ship structures.
Extensive databases and a lot of linear and nonlinear corrosion models were developed for the prediction of corrosion depth and rate over time. Southwell et al. developed a linear model [24] while Soares and Garbatov [25], Yamamoto et al. [26], Paik et al. [9,10,27,28,29], Melcher [30,31,32], and other researchers developed different non-linear models.
The development of these models enabled the prediction of the corrosion of individual structural elements and the corresponding corrosion margins. For example, Paik determined the corrosion margins for 19 structural elements of bulk carriers, with the maximum margin of 2.5 mm for inner bottom plating, 2.0 mm for the main deck and hopper plating, and 1.00 mm for girders in double deck ballast tanks [28].
It should be noted that the rules of classification societies prescribe corrosion margins as well as allowed deviations from the built-in values during the operational cycle. In that sense, the degree of acceptable steel damage due to corrosion is between (10–30)%. For the damage exceeding the prescribed values, there are additional inspections that have to be performed to check the condition of entire areas, and the requirements sometimes are increased to the maximum of 10% of the wear of a structural area. The corroded surfaces have to be replaced with new plates during the repair if the allowed deviations are exceeded. Higher corrosion entails the replacement of larger surfaces, longer retention during repair, and higher maintenance costs. For these reasons, the optimization of corrosion margins during the design phase of structural elements is crucial for the smooth use of vessels during the projected lifespan.
3. Design Corrosion Addition
In ship design, corrosion addition represents a value that is determined as a difference between gross and net thickness, whereby gross thickness is built-in, while net thickness is used for structural assessments. Additionally, rules generally allow a “ship-owner margin” when owner requires additional safety to prolong the life expectancy of a structural element.
There are different types of rules based on corrosion addition models, such as they are: historic corrosion rules (pre-CSR), Common Structural Rules (CSR), harmonized Common Structural Rules (CSRH), the Union of Greek Ship-owners (UGS) model, or the Time-Dependent Corrosion Wastage model (TDCWM) [33].
Nevertheless, in the case of longitudinal girder plating (LG) located between the FOT and WBT in the double bottom structures of bulk carriers, the corrosion addition is determined according to the Common Structural Rules (CSR) [6]. This means that the total corrosion addition sums up the additions of the plate side touching FOT and the plate side touching WBT. The sums of additions are rounded at a half millimeter. Moreover, a reserve thickness of 0.5 mm is also added to the rounded value, while the total corrosion addition should not be below 2 mm, as stated by CSR, Table 1.
Table 2 shows the relationship between thickness and corrosion addition for the range of the assumed net thickness values of the LG plating. From the perspective of design, the total corrosion addition is not influenced by the actual value of the thickness of an element. Therefore, thick plating has a lower percentage of the designed corrosion addition in comparison with thin plating. In that regard, thinner plates would potentially have higher margins to waste before the replacement.
Over the years of exploitation, the built-in thickness of elements is reduced. Therefore, the rules of classification societies have certain requirements for the maintenance of ageing ships. The percentage of the reduction in built-in thickness over time is related to the share of total corrosion addition that is already determined in the design phase (Table 2), taking into account the lifespan of 25 years.
Ideally, designed corrosion addition should never be totally wasted over 25 years of operation. Theoretically, in the last year of the service, the minimum thickness of a structural element should at least equal net thickness, which means that corrosion wear should never exceed the total corrosion addition during the operation. In other words, the corroded thickness should not be below the net thickness that was determined during the structural assessments in the design phase. This is, however, rarely possible in practice.
In addition to the proximity to net thickness, the rules of classification societies also regulate corrosion depth percentage and allow thickness diminution up to 20% or 25% of the built-in thickness for bulk carriers.
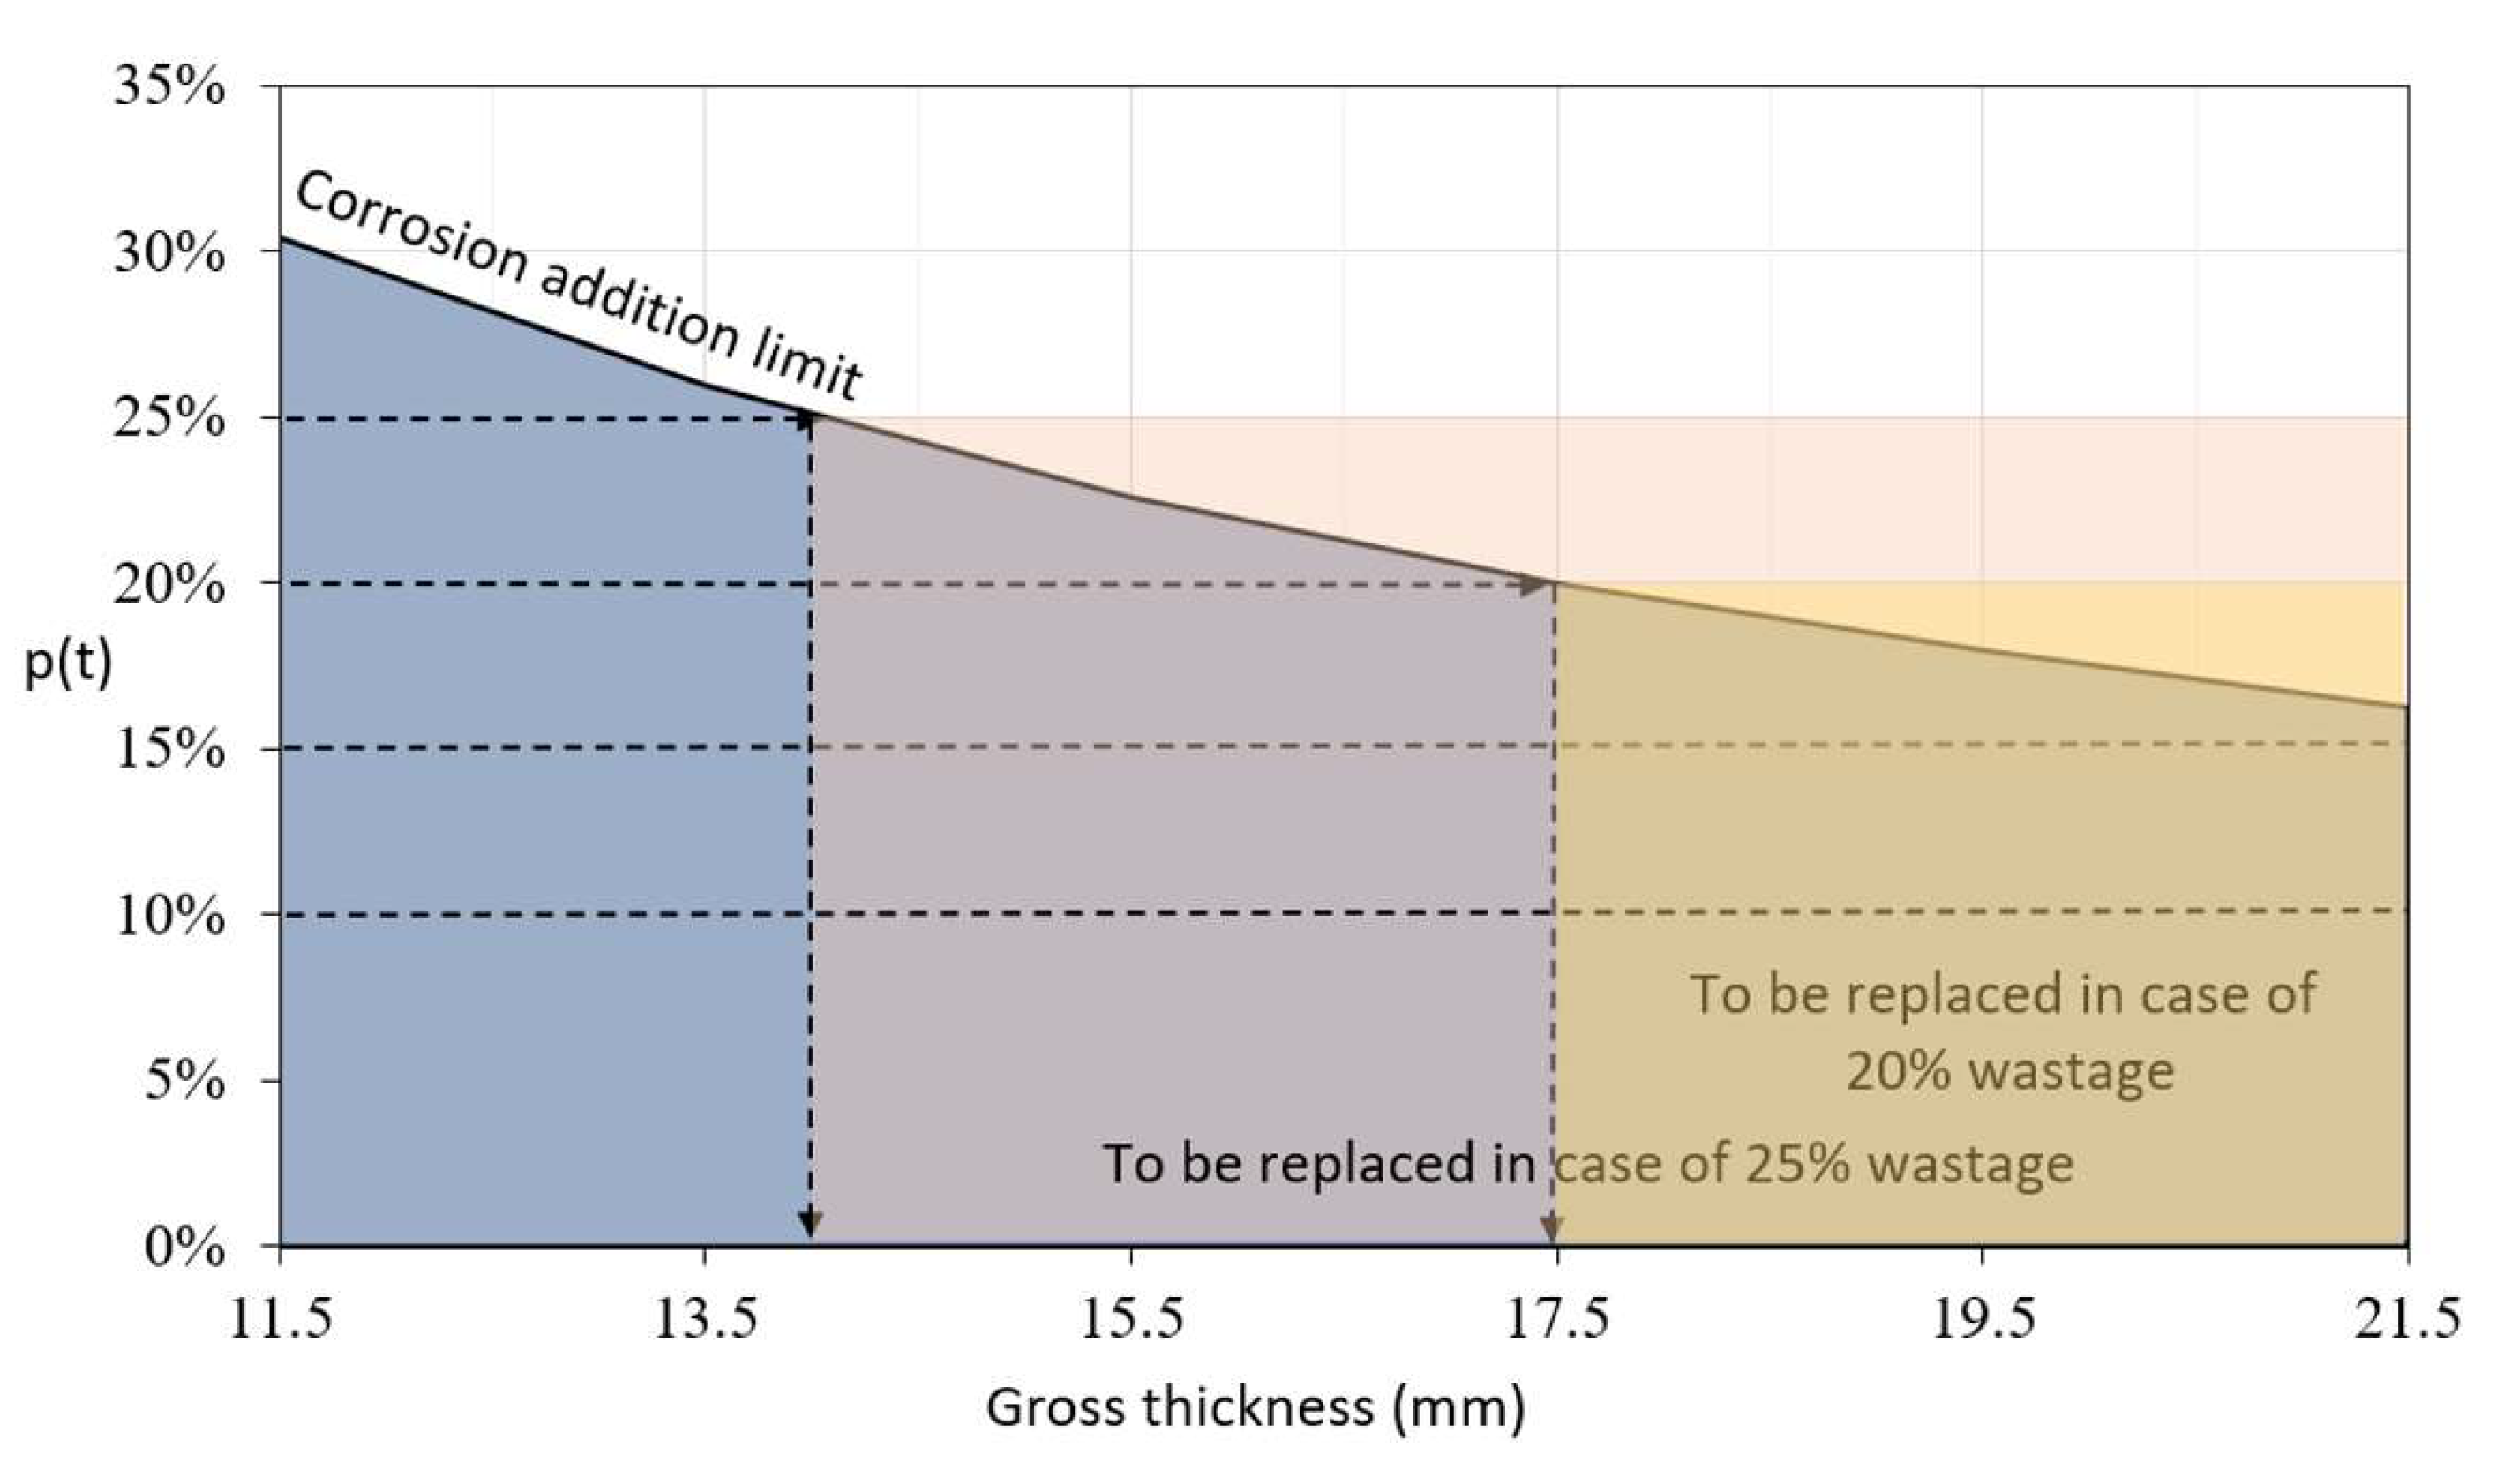
According to Table 2, the design values of corrosion addition and corresponding gross thicknesses are illustrated in Figure 1, considering the most common criteria for plating replacement (shaded areas)—10%, 15%, 20%, and 25% of corrosive wear, labeled here as and expressed in %. Assuming that the strict criteria of 10% or 15% of corrosive wear are reached, thinner plates would have a larger margin before they reach the corrosion addition limit and net thickness. On the other hand, plating whose thickness is 21.5 mm would have a margin of only 2% (in case of 15% wear).
Considering less strict criteria, such as 25% of wear, all the plates whose thickness exceeds 14 mm of gross thickness would have to be replaced, whereas, in the case of 20% of allowable wear, only the plates that are more than 17.5 mm thick would have to be removed.
The ageing of LG is heavily influenced by fuel oil and water ballast. In the following analysis, the assumed onset of corrosion is between 4 and 7 years of exploitation [21]. For instance, we considered the lifespan of coating on bulk carriers, which varies between 5.0, 7.5, and 10 years depending on the position of a structural element [28]. On the assumption that the lifespan of coating is four years (which is generally used when modeling the average quality of coating [21]) and based on a linear corrosion model (rather than non-linear or probabilistic due to practicality in engineering application), the paper analyzes more critical moments when girder plates reach the wear of 10%, 15%, 20%, and 25% and detects the loss of 15%, 20%, and 25%.
4. Materials and Methods
4.1. A Brief Description of the Input Database
The research is based on a database consisting of the data measured and collected between 2005 and 2017. A total of 20 ageing bulk carriers aged between 5 and 25 years were measured one, two, or three times during special surveys. Based on the previous research by the same authors, the collected data were systematized and presented in Table 3 [15,21,22,23]. Based on the data collecting methodology, it is assumed that each longitudinal girder in each tank was observed in upper and lower girder zones at five identical positions (at two ends of a tank and at three positions that were equally distanced from tank ends). The port and starboard sides of tanks were both subjected to the analysis. This enabled a proper observation of all measuring positions, including those that were exclusively in the upper or lower zones of girders. All measurements were performed following the rules of classification societies in terms of allowable wear and the scope of measurements. The analysis focused only on the measured values of steel plates that indicate corrosion wear. The study examined the total of 1960 input data values of the damage percentage of steel plates since the empirical database consists of 980 measured data in the lower part of a girder and 980 measuring data in the upper part of a girder. All data were grouped in three intervals of built-in thickness—11–13 mm, 13–15 mm, and 15–18 mm.
The measuring in upper and lower girder zones resulted in 490 cross-sections on the left and right side of fuel tanks, which provided 1960 measured data points for the initial database. The original empirical database, thus, contained 1960 measurements. However, not all of the measurements were suitable for statistical analysis due to redundant data and potential outliers that had to be removed to ensure the validity of the statistical analysis. Finally, after the elimination of redundant data, the statistical analysis was conducted for 1918 measurements.
4.2. The Proposed Problem and Corresponding Methodology
One of the most frequently used corrosive models that is successfully used in the analyses of corrosive processes of ship structures is the Paik et. al. [10] and Qin and Cui [34] model, which has the following structure:
The mathematical model presented by expression (1) describes the dependence of corrosion depth ( expressed in nm or mm) as a function of ship operating time ( expressed in months or years), assuming that corrosive processes begin at a particular time (). The model has two parameters, labeled with and . In the presented model (1), the parameter defines the intensity of the influence of the time component on corrosion processes. Certain authors [10] suggest two values of the parameter ( or ). Larger values of the parameter ensure that in the corrosion model the influence of the exposure time of the metal structure to the environmental influence increases, i.e., a corrosion process is modeled that is significantly dependent on the time component. The value of the parameter is determined experimentally and is interpreted as a corrosion rate expressed in mm/year or nm/month. In the following statistical analysis, the mathematical model (1) is used on the assumption that corrosive processes begin after 4 years of ship operation, while the assumed value of parameter is 1. This value was chosen based on the recommendation of Paik and Thayamballi, who concluded that the increase in corrosion with the age of the ship varies slightly with the coefficient and that it can be assumed that [10].
The corrosive model of the LG structure and was obtained in the mathematical model (1) and is described by the following expression:
whereby represents the length of ship operation.
For all metal structures of ships, there are legally defined allowable values of wear percentage that were prescribed by classification societies. The goal of this paper is to compare the percentage of the wear of the LG structural elements of ships with the prescribed limits. Therefore, the analysis focuses on the percentage values of corrosive damage calculated concerning the original average thicknesses of metal plates that constitute the observed structural elements of ships. The wear percentage is obtained based on the initial average thickness of structural elements , as follows:
Considering the expression given in Formula (2), the previously defined wear percentage () can be transformed in the following way:
Formula (4) describes the wear percentage of a metal structure as a function of operating time () in the form of a linear model. The coefficient represents the annual wear percentage of metal structures expressed concerning the average original thickness of a metal plate ().
5. Results
As previously indicated, the assumed onset of corrosion is after 4 years of ship operation. In that regard, Expression (4) assumes the following form:
whereby .
The obtained Formula (5) can be used for the calculation of the annual wear percentage () of the LG section of the fuel oil tanks observed.
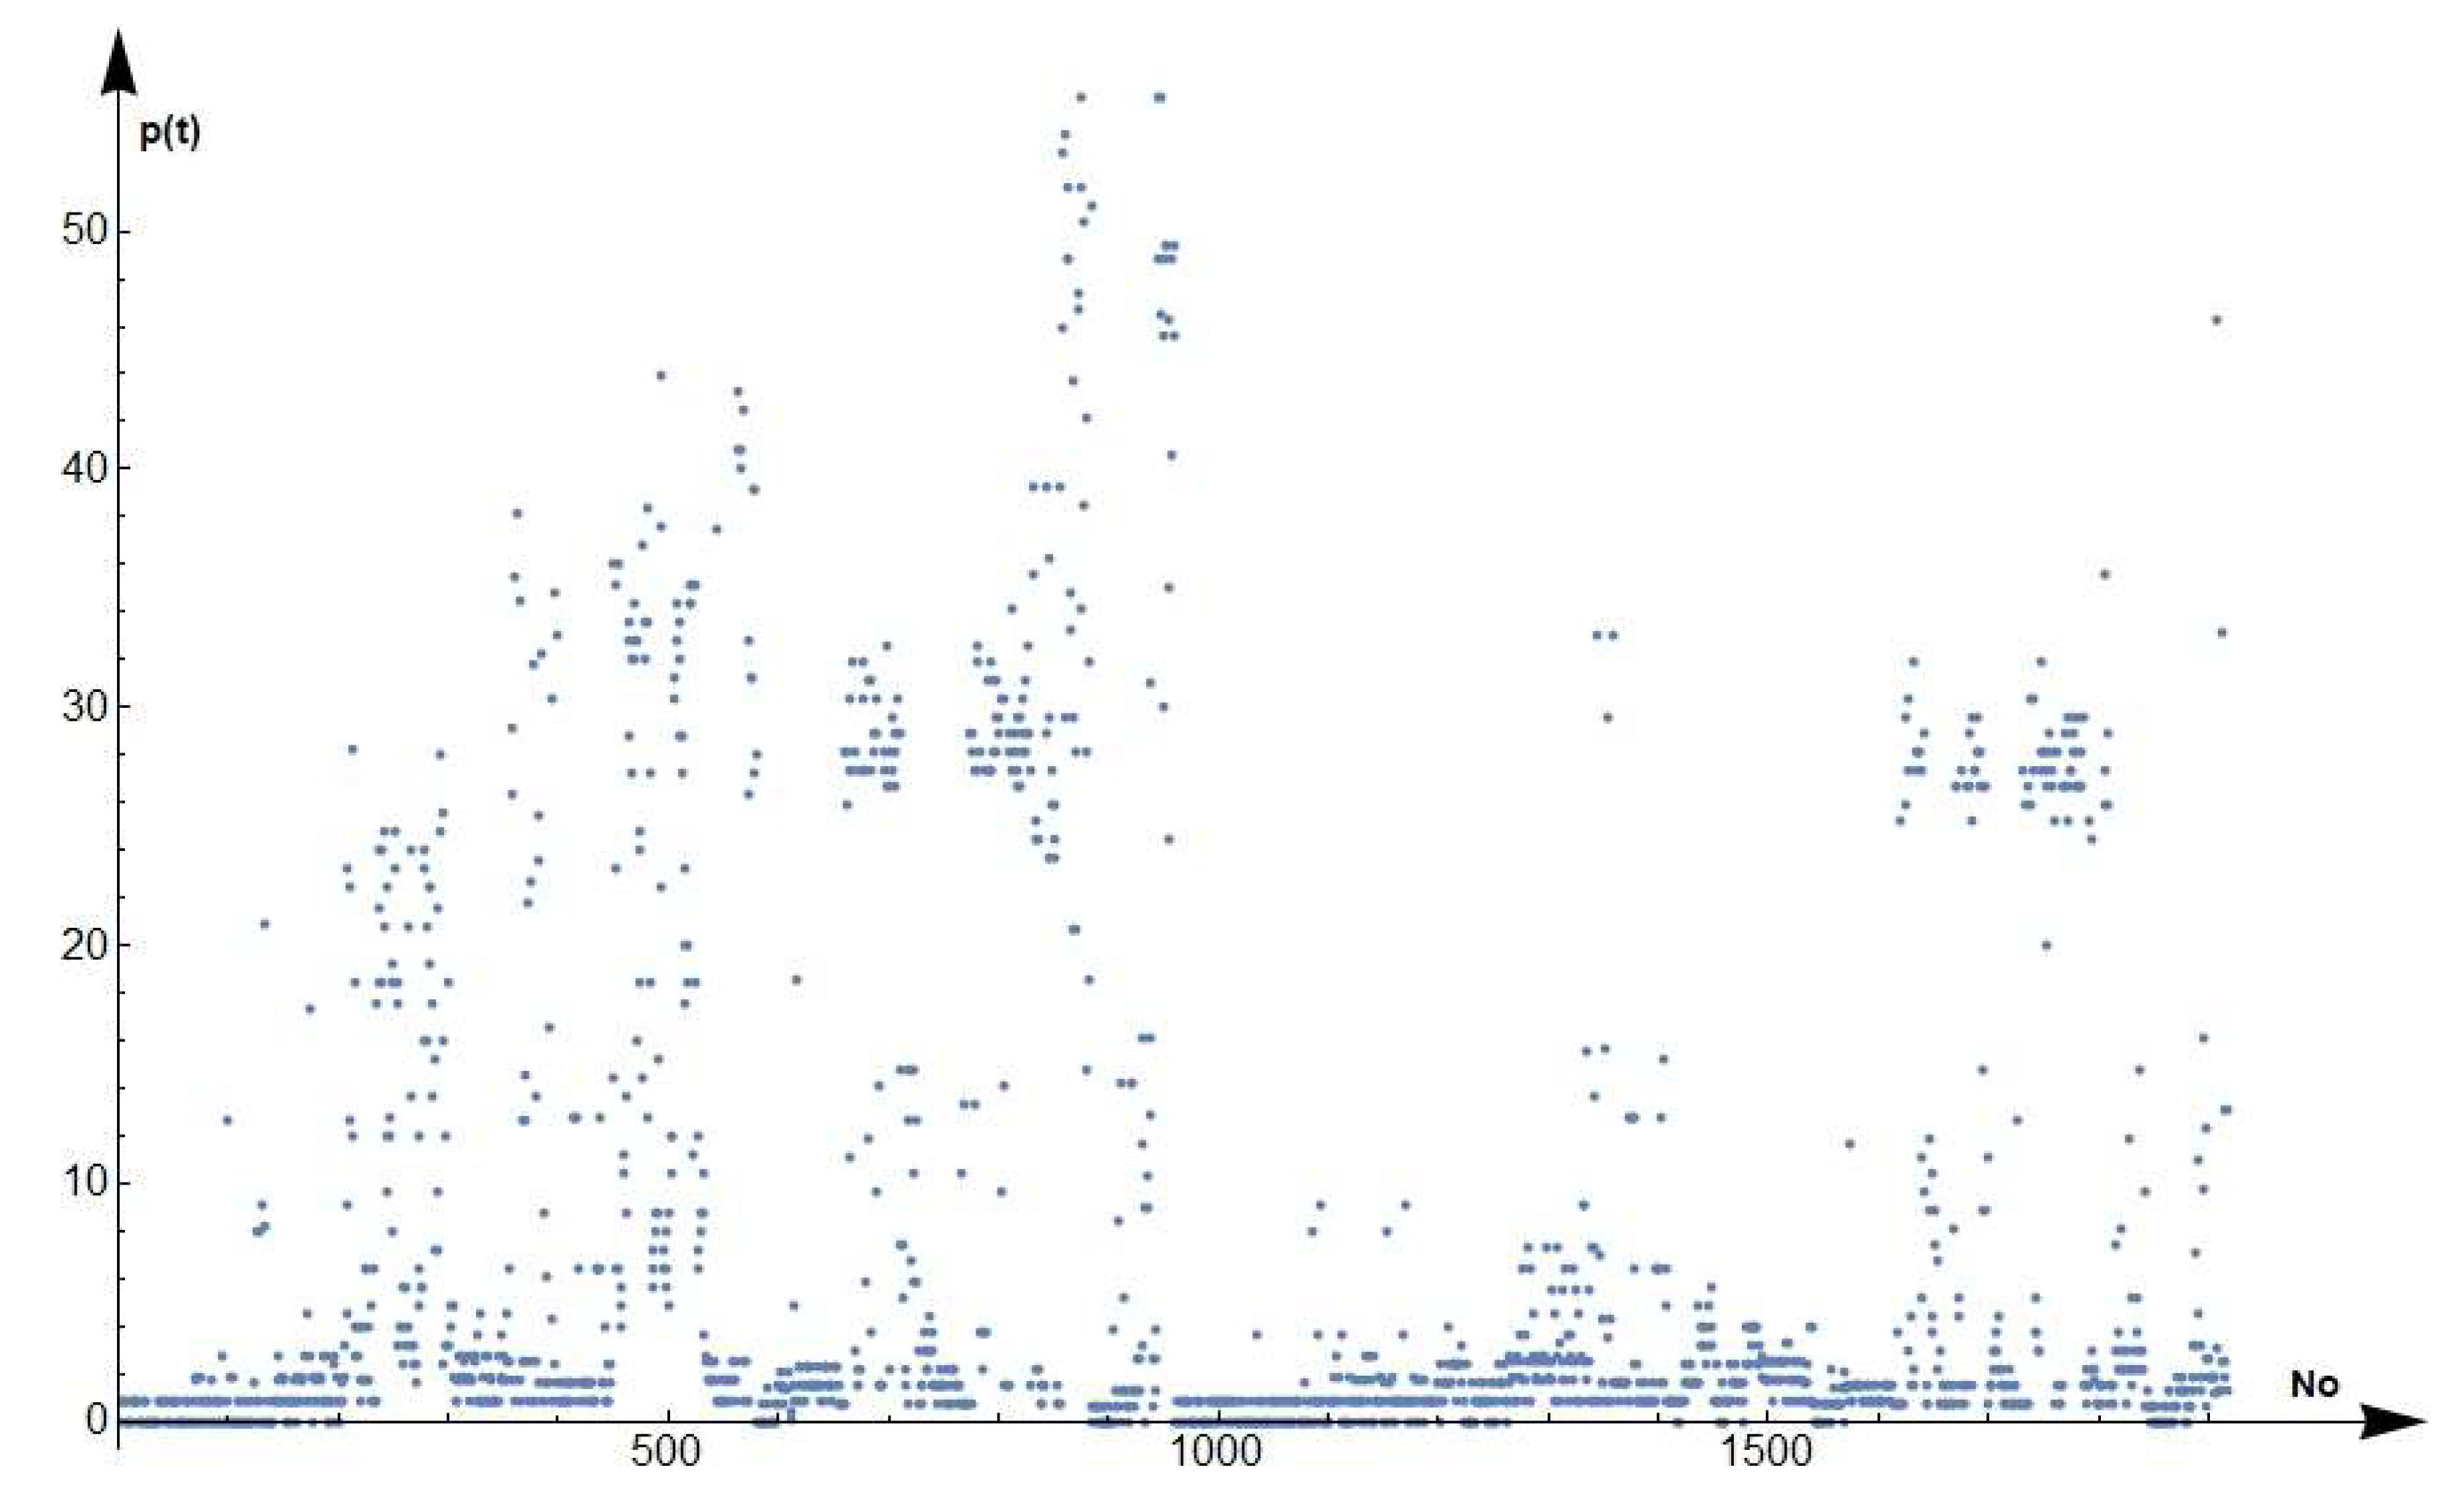
Figure 2 shows 1918 elements of the empirical database. The ordinal numbers of the measurements are shown on the x-axis, while the values of the wear percentage of the LG section are shown on the y-axis. Each element of the input database is associated with one point on the graph shown in Figure 2. This empirical database was used in the statistical analysis that was conducted to establish a linear relationship between the wear percentage of metal structures and the operating time of the ships. The statistical analysis enables the prediction of the time in the operation cycle when LG structures reach the critical values of the corrosive wear percentage.
This paper analyzed the total of 1918 empirical data points on the depth of corrosion that was collected during 20 years of ship operation. Corrosion depths were calculated as wear percentage based on the original metal plate thickness. The original plate thickness values were first grouped into three sets based on thicknesses intervals (11–13 mm, 13–15 mm, and 15–18 mm), whereby all numerical values were expressed in mm. The values of the wear percentage of the LG metal structures were calculated based on the average thickness of metal plates for each interval and the collected empirical data. Basic descriptive statistics were calculated for the obtained wear percentage. Table 4 exhibits the corresponding values of descriptive statistics related to the measured corrosion depth expressed in nm/year. After sorting the data in ascending order, the values below in which 25% and 75% of the data are found were determined. In other words, the first (Q1) and the third quartile (Q3) were determined, respectively.
As indicated, the original thickness values of metal plates were grouped into intervals [11,13), [13,15), [15,18]. The intervals are labelled by ordinal numbers respectively. The average thickness of the original metal plate was determined for each interval and used to transform previously described 1918 empirical data points on the corrosion depth into corresponding percentage values of corrosive wear.
The procedure of data fitting into mathematical models represented by Formulas (4) and (5) was performed based on the obtained percentage values. The results of the fitting are presented in Expressions (6)–(14):
whereby .
The linear models formed in expressions (6)–(14) have labels such as , whereby index assumes the value from the set {1,2,3} and represents the ordinal number of the observed interval of the original metal plate thickness. Exponent corresponds to the subset of the empirical database and can have the value of Q1, M, or Q3. These subsets correspond to the minimum, mean, and maximum values of wear percentage and are determined as the first, second, and third quartiles of the elements from the empirical database (Table 4). This classification into subsets of empirical data enabled the formation of three linear models for each interval of the original metal plate thickness. The linear models correspond to the lowest, average, and extreme values of wear percentage. Corresponding coefficients are determined during the fitting process for each linear model. The coefficients represent the annual percentage of corrosion rate.
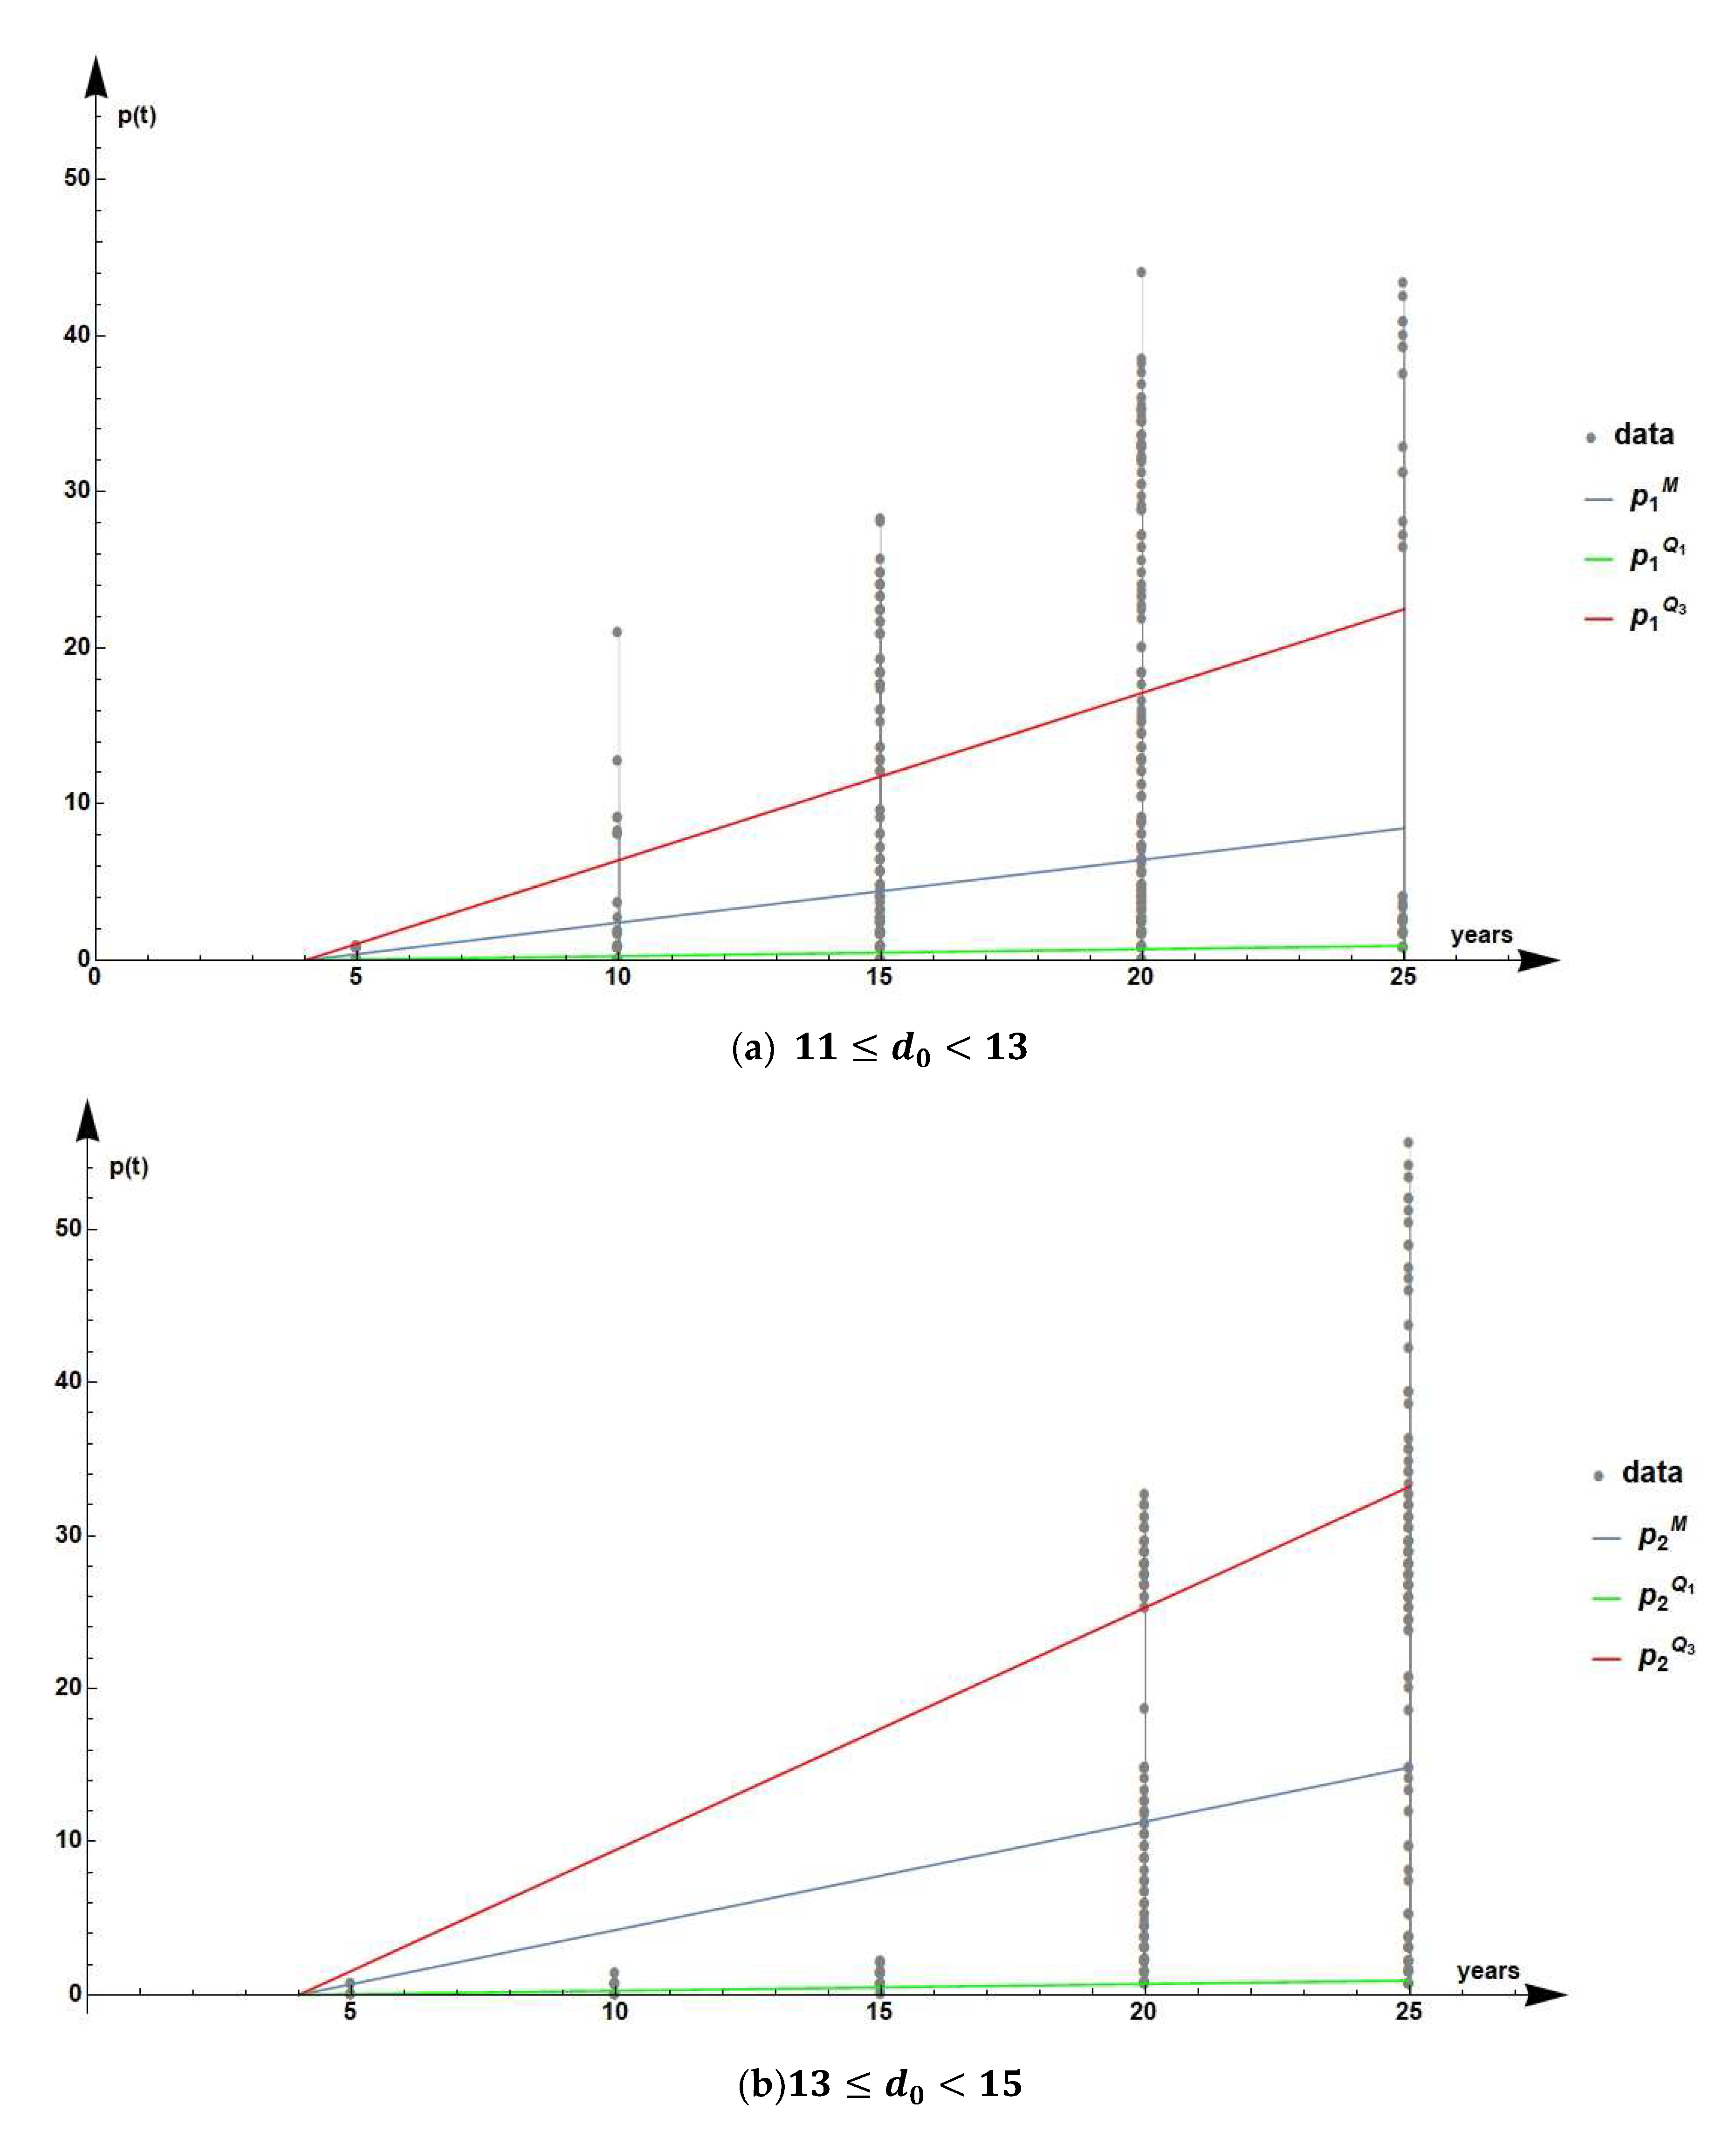
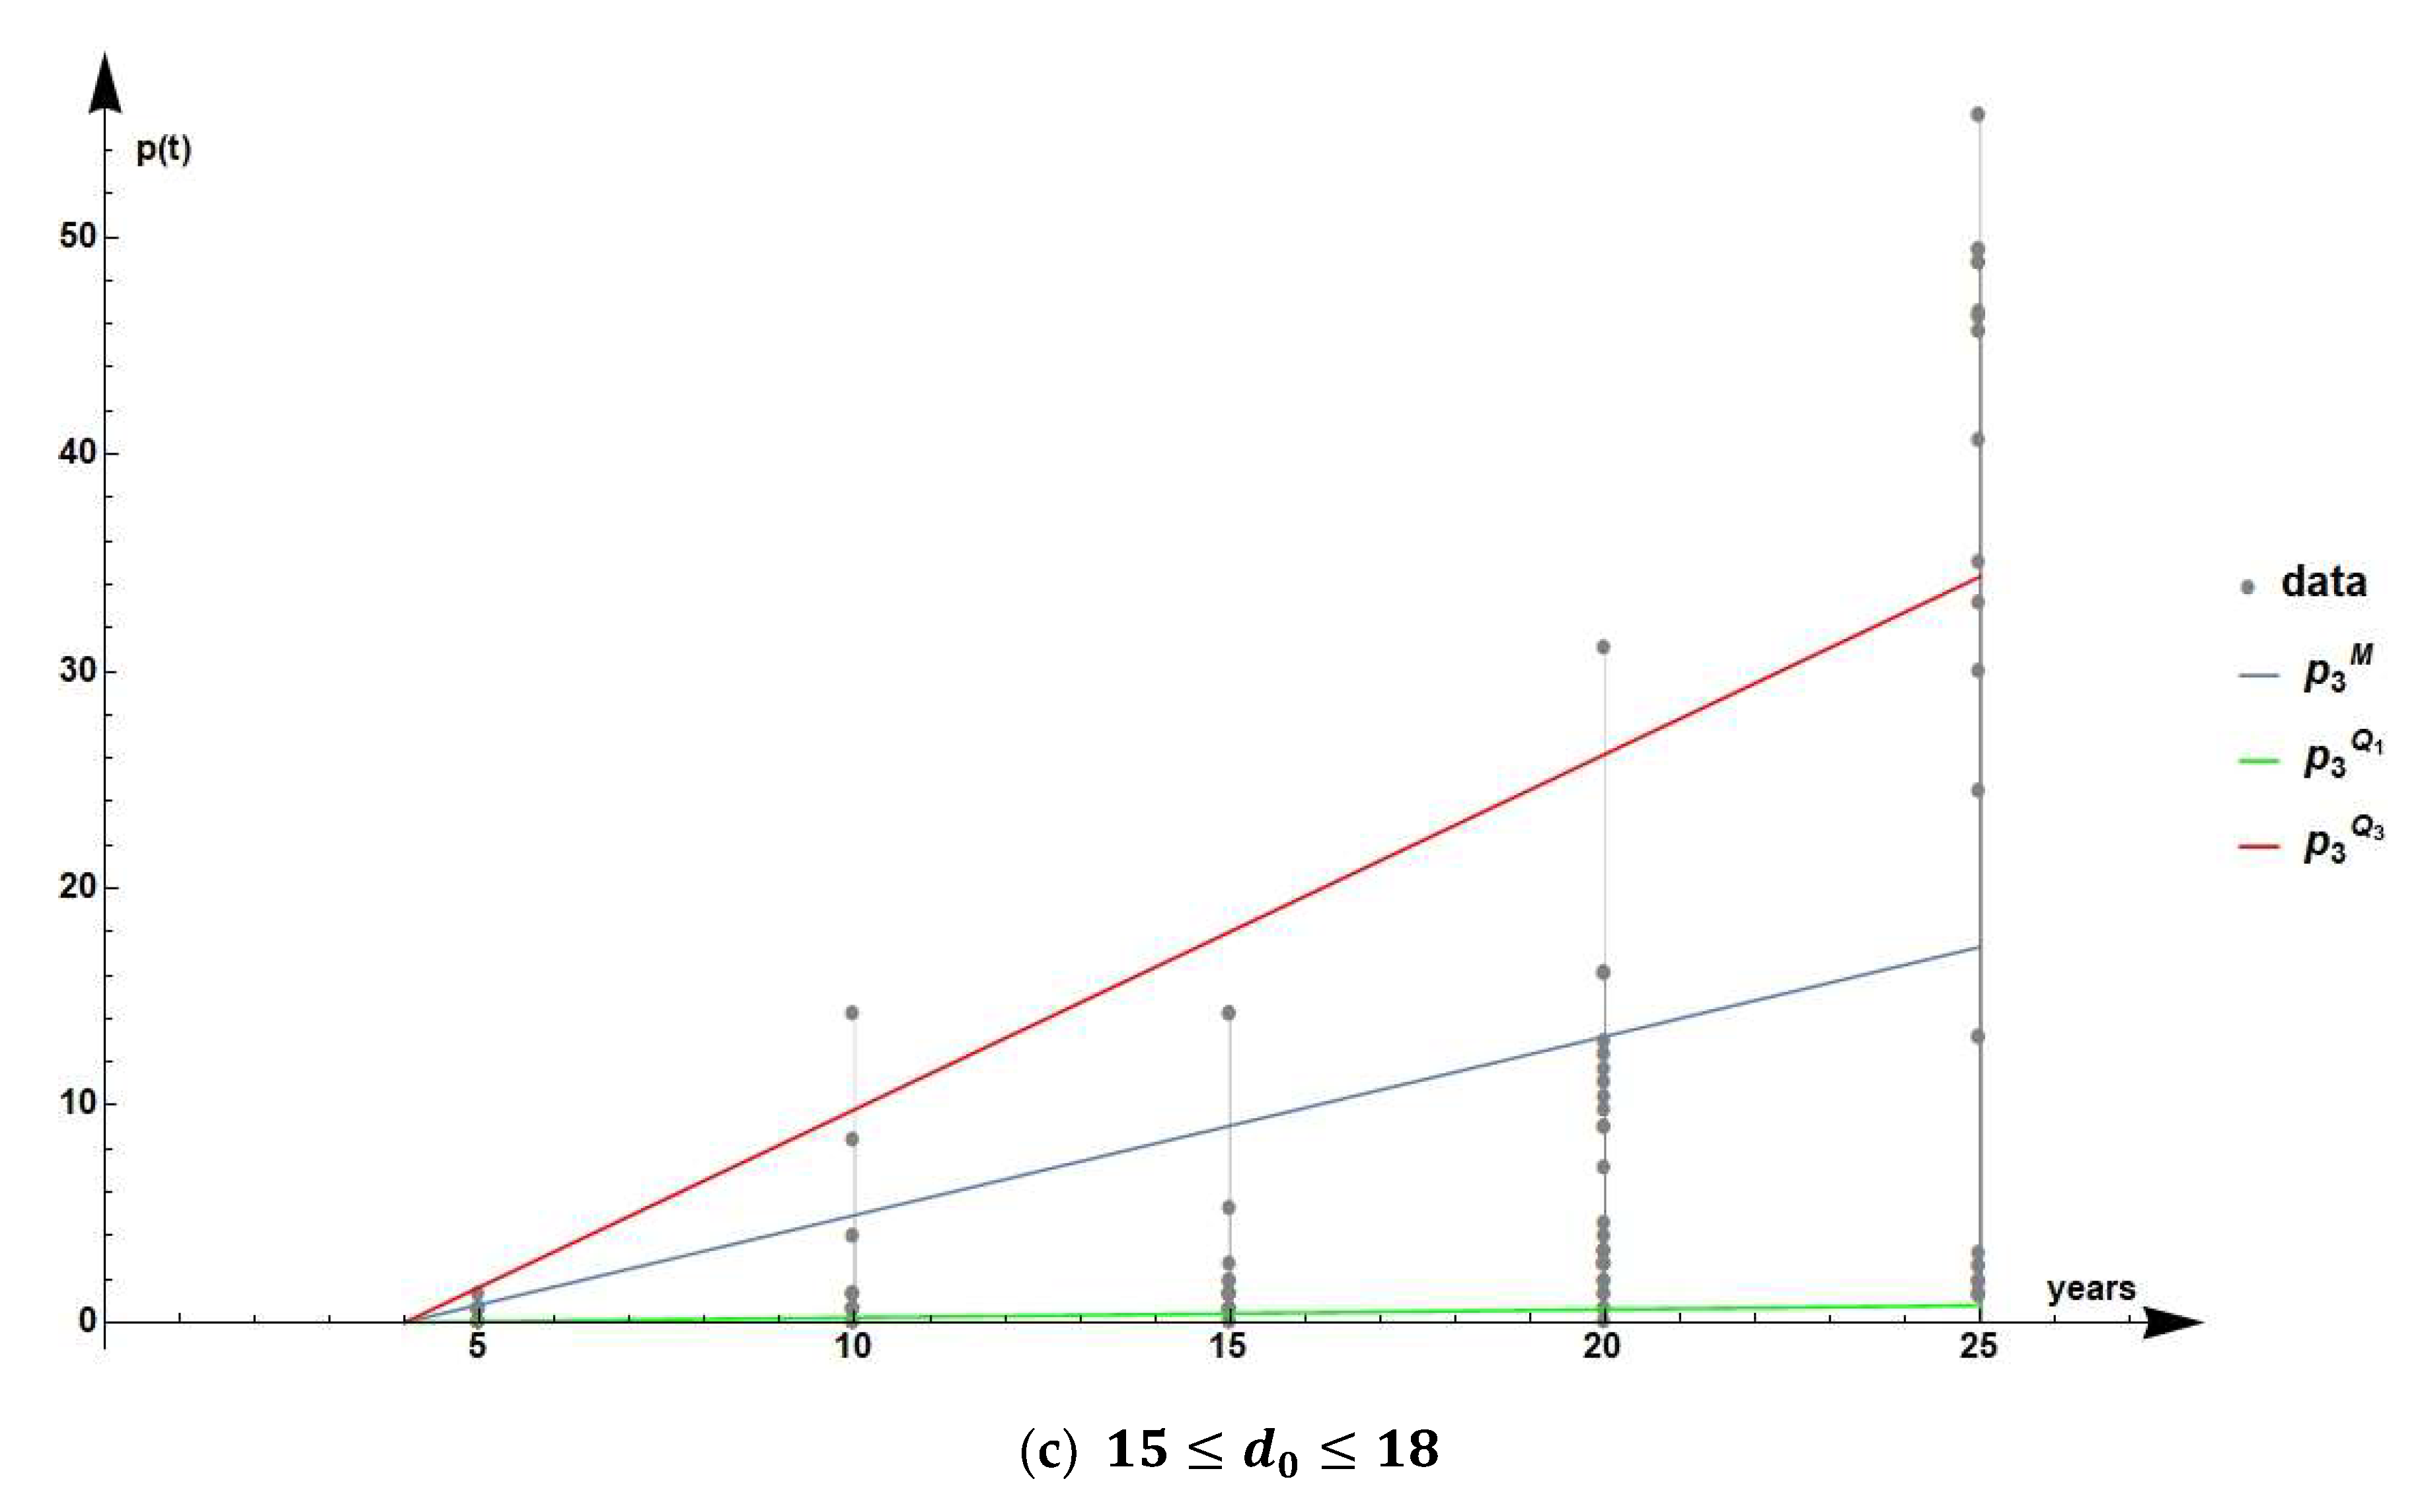
Figure 3 graphically presents the linear dependence of the corrosive wear percentage (Equations (6)–(14)) in the LG section on the elapsed time of ship operation. In addition, these figures show the empirical data on the wear percentage of the LG section that were grouped in terms of the length of ship operation. According to the figures, the lowest percentage of corrosive wear was recorded for the original steel thickness in 13 mm–15 mm intervals on the ships that were in operation for less than 15 years. The ships aged between 20 and 25 years exhibited significantly different characteristics. In the case of the older ships, the highest percentage of corrosive damage was noted at higher original thickness values of the metal plates, while the thinnest metal plates showed stable corrosive behavior without drastic and abrupt changes.
The points when the LG ship structures reached critical values of corrosive wear percentage, which were defined by classification societies, can be determined based on the linear models formed. The critical value is typically 10% of the wear of the original metal plate thickness. When a certain structure reaches the critical value, the ship has to be withdrawn from use and repaired. The paper examined the maximum values of corrosive wear. Additionally, the detection of the time when wear percentage reaches the critical, predefined values is highly important because ship operation is considered unsafe once critical points are reached. Based on the formed linear corrosion models and the allowable wear of 10%, the research identified the time when LG structures reached the maximum values of corrosive wear percentage. The analysis also included less critical values of corrosive wear such as 15%, 20%, and 25%.
Linear Models (12)–(14) define the behavior of the LG structural elements in terms of the maximum percentage of corrosive wear. Table 5 shows the time (expressed in years) when linear models represented by Expressions (12)–(14) reach the critical wear of 10%, 15%, 20%, and 25%, respectively. Critical moments were determined for three observed intervals of the original thickness of metal plates.
Figure 4 additionally illustrates the critical wear of 10%, 15%, 20%, and 25%, as well as the time when these values were reached by the three observed intervals of the original thickness of metal structures. In the case of the 11 mm–13 mm interval of the original steel thickness, the prescribed wear limit of 10% was reached after 13.3 years. On the other hand, in the case of the maximum thickness (15 mm–18 mm interval), the wear of 10% was reached after 10.1 years of operation.
According to Figure 4, corrosive processes on LG are highly intensive. Therefore, considering the total wear of 10% of the longitudinal girder area, the entire area should be replaced after 10 to 13 years of usage. The projected ship lifespan of 25 years is, thus, unreachable. Furthermore, corrosion intensity exceeds the projected corrosion margins, and better optimization and the increase in corrosion margin are necessary for the design phase.
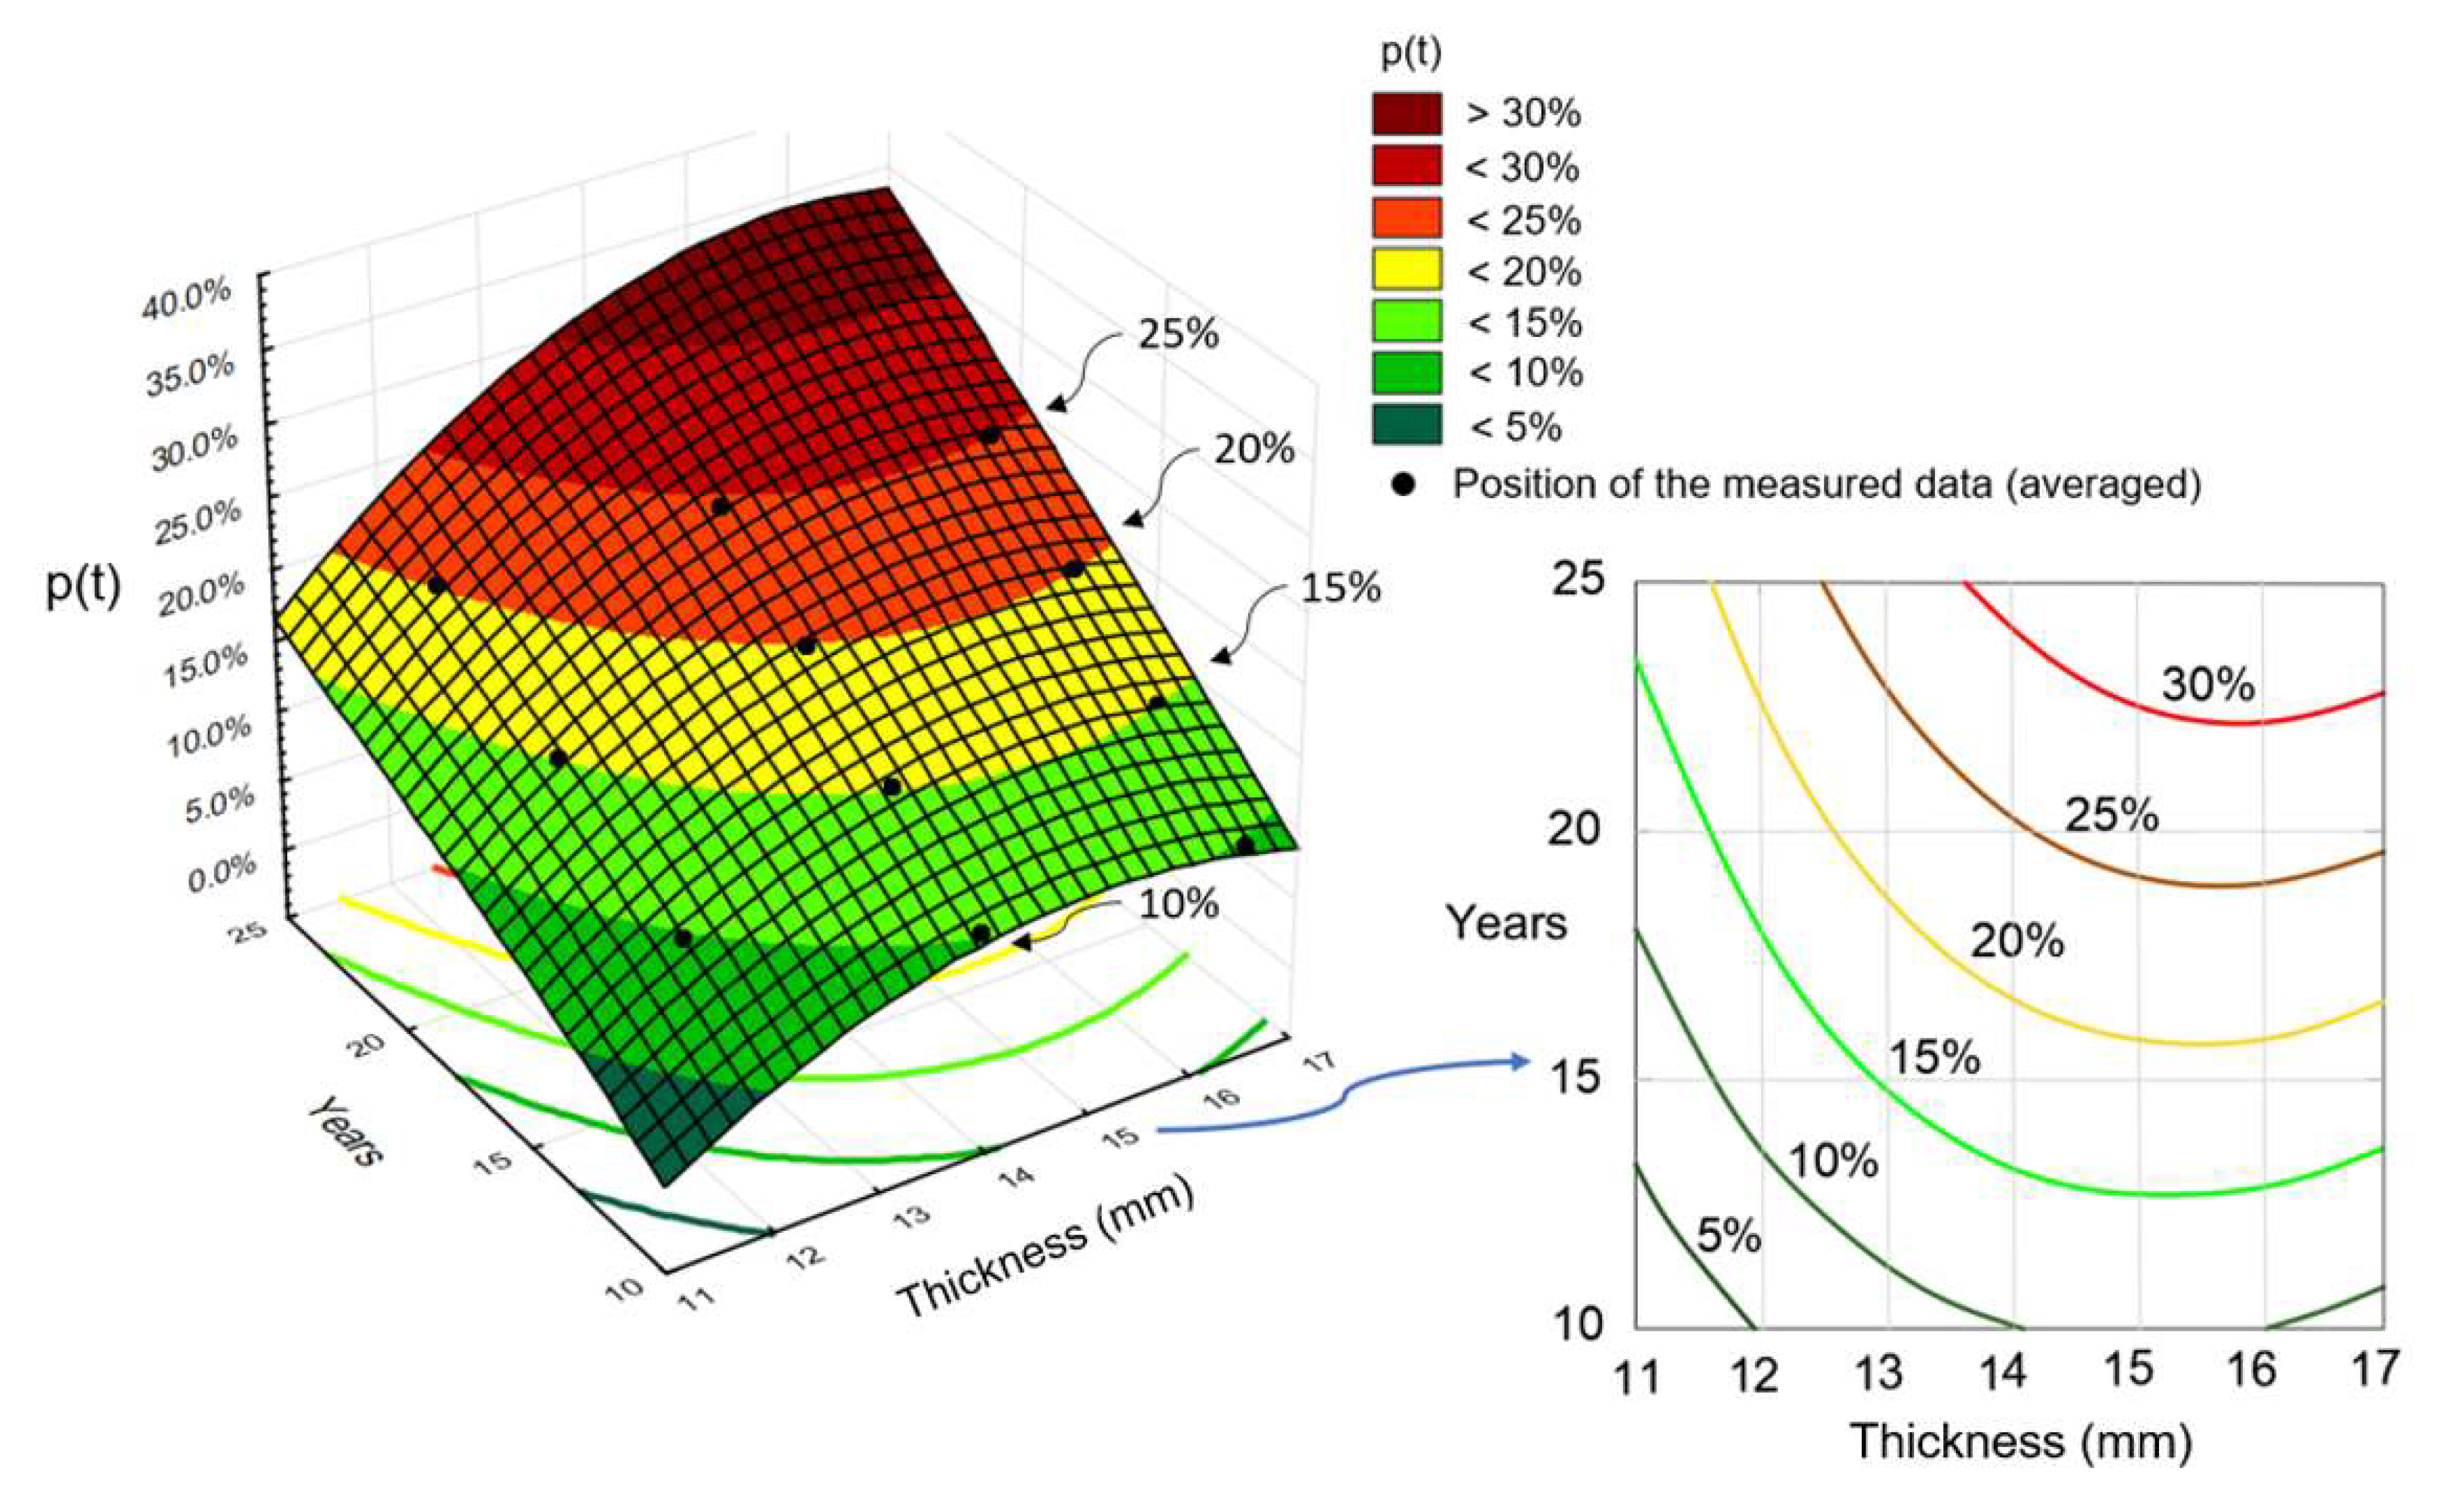
Figure 5 shows the percentage of corrosion depth on LG, which is plotted against the operating time and built-in thickness. The plotted surface is created based on the empirical data on ageing bulk carriers using the cubic spline function. Black spots represent the position of the average values of the measured data that were previously examined (11–13 mm, 13–15 mm, 15–18 mm). Different ranges of the wear percentage of metal plates are highlighted in Figure 5 in different colors, as shown in the corresponding legend. Moreover, the graph shows the position of plating replacement criteria (10%, 15%, 20%, and 25%) that are following the relevant requirements of classification societies. These sections are further projected on the year/thickness plane and illustrated by the figure on the right that depicts the relationship between age and thicknesses of LG.
The data above show that thicker longitudinal girders reach the replacement criteria faster. For example, an LG whose thickness is 12 mm will reach a 20% of corrosion depth percentage in around 22.5 years. The limit of 25% will not be reached at all and replacement would not be necessary. However, an LG that is 15–16 mm thick will reach the limit of 20% in about 16 years and the limit of 25% in approximately 19 years. Figure 5 (right 2D plot) shows a range of thickness values (see 14–16 mm) whose corrosion depth is increasing faster than for thin plates since the requirements minima are gravitating towards such a range. These findings correspond to the conclusions from Section 3, which indicate that thinner plates from the same range exhibit a higher margin considering the designed corrosion addition (Figure 1 and Figure 6). Furthermore, the range between 16 mm and 17 mm (Figure 5) offers a glimpse of corrosion depth margin that has an opposite trend in comparison with the margin relevant for the thickness interval between 14 mm and 16 mm.
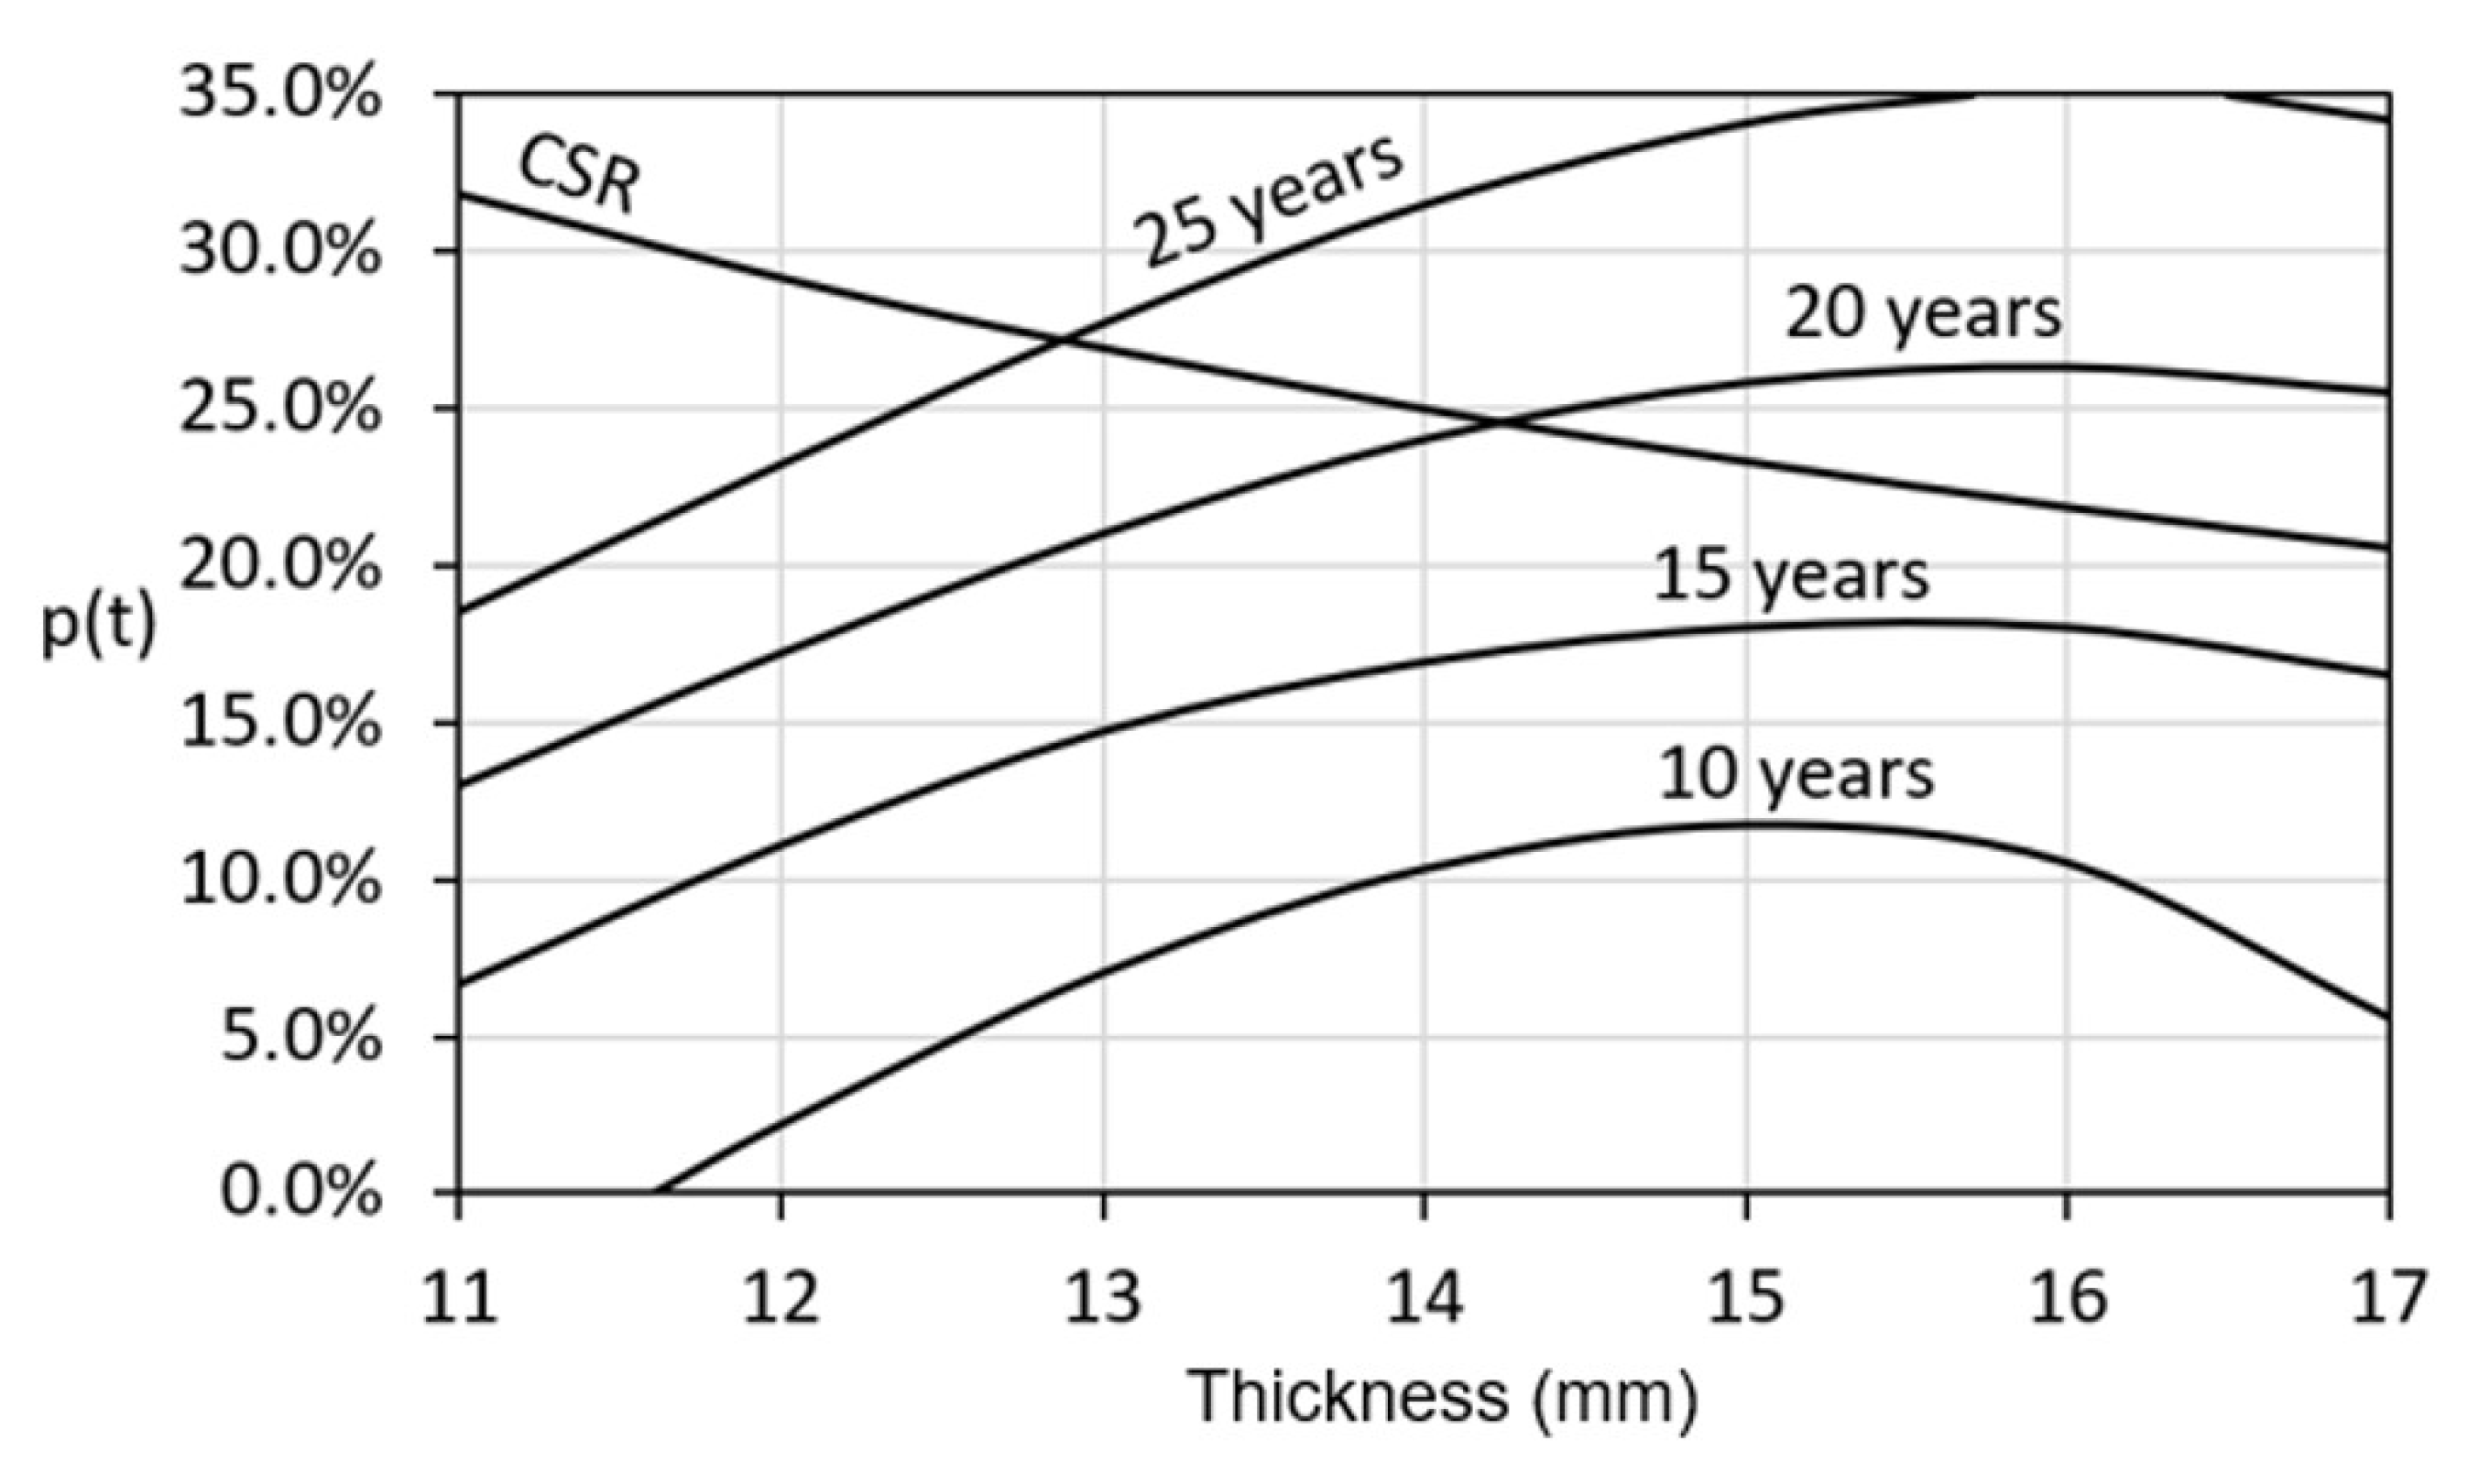
Additionally, Figure 6 is obtained by the projection of a surface (Figure 5) to the thicknesses/percentage (i.e., vertical) plane based on operating time. Moreover, the CSR data (corrosion addition limit) from Table 2, see IACS [6], overlap with the curves allowing the comparison between measured and designed values.
The CSR corrosion addition and 25-year curve intersect approximately at 12.8 mm and have different trends. Below the limit of 12.8 mm, the CSR corrosion addition is providing a larger margin than 25 years of full operating life. However, for the thickness above 12.8 mm, the designed margin of 3.5 mm (see Section 3) of the LG does not sustain the entire operating cycle.
The current IACS regulations [6] address only the position of a structural element upon the determination of corrosion addition. This research, however, aims to facilitate the optimization of such margins during the design phase based on the original thickness of structural elements.
Therefore, this study proposes an estimation curve for the designed corrosion addition of LG (located between FOT and WBT) and emphasizes the dependence on the thickness of plating (Figure 6, 25-year curve) that varies between 11 mm and 17 mm for the LG. The CSR curve for the thickness below 12.8 mm and the 25-year curve for the thickness above 12.8 mm could be used for more precise estimation. In that way, corrosion addition would not depend only on the original thickness of structural elements. Moreover, corrosion addition would be expressed as a depth percentage of the original thickness, rather than an absolute value.
As proposed, corrosion addition would be more practical if it were dependent on the net instead of gross thickness, because gross thickness already includes the margin in the design phase. In that regard, the starting point of this research was the measures from an already constructed ship rather than net scantlings. The aim of the research and estimations (Figure 6, CSR and 25-year curve) is to emphasize the neglected influence of the original thickness on the corrosive phenomena in the design phase and to provide a strategy for the designers, starting inversely from the ship repair/ageing data and heading towards the design phase.
The paper provides a specific interpretation of the evaluation of the proposed corrosion addition. Gross thickness can be obtained according to CSR through standard methods, see IACS [6]. Furthermore, design practice (regulations) exhibits a potential for the optimization of corrosion addition based on research (measurements), as previously indicated. It should be noted that most of the rules of the classification societies follow similar principles for years. For instance, when a classical “prescribed formula” for scantling determination calculates the thickness of a structural part, the increase or decrease in the calculated thickness is allowed (to a certain extent) if direct calculations (assessments) prove the structural strength of the examined part for the lower or higher thickness values. Therefore, the corrosion margin optimization regarded here could be considered as a “direct assessment”.
6. Conclusions
The paper investigated a linear model for the estimation of the percentage of corrosion wear of the LG of 20 ageing bulk carriers containing 95 fuel oil tanks that provided 1918 data points. The percentage of wear is considered to be a function of operating time-based on the initial assumption that a corrosive coating protects metal plates for four years, after which corrosive processes begin. The empirical database that describes the percentage of the corrosive wear of the LGs of bulk carriers was obtained based on a corresponding empirical database that contained 1918 measured data points on corrosion depth values, which were expressed in mm and grouped into three distinct intervals depending on the original plate thickness.
The conducted analysis of the three intervals of built-in plate thickness proves that the longitudinal girders whose thickness ranges between 11 mm and 13 mm meet the CSR standard and the projected lifespan of 25 years with the maximum allowable wear of 20% of the original thickness. For the thickness values above 13 mm, the existing CSR standard cannot sustain the projected life expectancy of 25 years, which makes the optimization of the corrosion margin necessary.
The paper further investigates corrosion addition, which is determined in the design phase from the perspective of the measurements from aged ships. Therefore, an examination of the projected 25-year lifespan of the longitudinal girders located between FOT and WBT is based on the collected data and intended for the determination of corrosion addition during the design phase. Interestingly, corrosion addition was expressed as a function of operating time (25 years) rather than a finite value as in regulations (CSR). Furthermore, corrosion addition was presented as the wear percentage of the thickness of elements, which unifies the understanding of corrosion from the perspectives of design and maintenance. The paper, hence, provides an optimization tool for ship design.
Further research should include extended databases, more vessels, and more thickness measurements. The specific data on ship operation that would innovatively extend research include ballast ratio, cargo characteristics and frequencies, location and orientation of structural parts, and maintenance activities. Future research would also benefit from the analysis of more complex, nonlinear models of corrosive processes.
Author Contributions
Conceptualization, Š.I. and N.K.; methodology, Š.I. and N.K.; software, N.K.; validation, N.K., N.M. and G.V.; formal analysis, N.K. and G.V.; investigation, Š.I., N.M. and G.V.; resources, Š.I., N.M., and G.V.; data curation, Š.I. and N.K.; writing—original draft preparation, Š.I., N.K., N.M. and G.V.; writing—review and editing, Š.I. and N.K.; visualization, N.K. and N.M.; supervision, Š.I. and N.M.; project administration, Š.I.; funding acquisition, Š.I. and N.M. All authors have read and agreed to the published version of the manuscript.
Funding
This research received no external funding.
Institutional Review Board Statement
Not applicable.
Informed Consent Statement
Not applicable.
Data Availability Statement
Not applicable.
Acknowledgments
This research was supported by INVAR-Ivošević—an approved thickness measurement company. More information about the company is available at: http://www.invar.me (accessed on 1 June 2022). Namely, the presented probabilistic analysis of the corrosion effects on the analyzed group of ageing bulk carriers relies on the data that were collected and systematized over the last twenty-five years by the operators and experts from the same company. Over the last decades, INVAR-Ivošević Company performed ultrasonic thickness measurement reports of the vessels for the recognized classification societies such as LR, BV, DNV, GL, RINA, ABS, and ClassNK. More than four hundred vessels are currently being inspected by the company.
Conflicts of Interest
The authors declare no conflict of interest.
References
- INTERCARGO. Casualty Report 2010; International Association of Dry Cargo Shipowners: London, UK, 2010. [Google Scholar]
- Roberts, S.E.; Marlow, P.B. Casualties in dry bulk shipping (1963–1996). Mar. Policy 2002, 26, 437–450. [Google Scholar] [CrossRef]
- IMO. MSC 83/INF.6, Bulk Carrier Casualty Report; IMO: London, UK, 2007. [Google Scholar]
- IACS. UR Z10.2F Unified Requirement: Hull Surveys of Bulk Carriers; International Association of Classification Societies: London, UK, 1992. [Google Scholar]
- Solas, I.M.O. International Convention for the Safety of Life at Sea (SOLAS); (IMO–158E); International Maritime Organization: London, UK, 1999. [Google Scholar]
- IACS. Common Structural Rules for Bulk Carriers and Oil Tankers; International Association of Classification Societies: London, UK, 2021. [Google Scholar]
- Lloyd’s Register of Shipping. Bulk Carriers—The Safety Issues; Lloyd’s Register of Shipping: London, UK, 1991. [Google Scholar]
- Nippon Kaiji Kyokai. Study Report on Bulk Carrier Losses; Nippon Kaiji Kyokai: Tokyo, Japan, 1992. [Google Scholar]
- Paik, J.K.; Kim, S.K.; Lee, S.K. A probabilistic corrosion rate estimation model for longitudinal strength members of bulk carriers. Ocean Eng. 1998, 25, 837–860. [Google Scholar] [CrossRef]
- Paik, J.K.; Thayamballi, A.K. Ultimate strength of aging ships. J. Eng. Marit. Environ. 2002, 1, 57–77. [Google Scholar]
- Woloszyk, K.; Gabrbatov, Y. Advances in Modelling and Analysis of Strength of Corroded Ship Structures. J. Mar. Sci. Eng. 2022, 10, 807. [Google Scholar] [CrossRef]
- Pereira, T.; Garbatov, Y. Multi-Attribute Decision-Making Ship Structural Design. J. Mar. Sci. Eng. 2022, 10, 1046. [Google Scholar] [CrossRef]
- Vukelić, G.; Vizentin, G.; Brnić, J.; Brčić, M.; Sedmak, F. Long-Term Marine Environment Exposure Effect on Butt-Welded Shipbuilding Steel. J. Mar. Sci. Eng. 2021, 9, 491. [Google Scholar] [CrossRef]
- Daille, L.K.; Aguirre, J.; Fischer, D.; Galarce, C.; Armijo, F.; Pizarro, G.E.; Walczak, M.; De la Iglesia, R.; Vargas, I.T. Effect of Tidal Cycles on Bacterial Biofilm Formation and Biocorrosion of Stainless Steel AISI 316L. J. Mar. Sci. Eng. 2020, 8, 124. [Google Scholar] [CrossRef] [Green Version]
- Ivošević, Š.; Meštrović, R.; Kovač, N. An Approach to the Probabilistic Corrosion Rate Estimation Model for Inner Bottom Plates of Bulk Carrier, Shipbuilding: Theory and Practice of Naval Architecture. Brodogradnja 2017, 68, 57–70. [Google Scholar] [CrossRef] [Green Version]
- Chaturvedi, T.P. An overview of the corrosion aspect of dental implants (titanium and its alloys). Indian J. Dent. Res. 2009, 20, 91–98. [Google Scholar] [CrossRef]
- Gardiner, C.P.; Melchers, R.E. Bulk Carrier Corrosion Modelling. In Proceedings of the Eleventh International Offshore and Polar Engineering Conference Stavanger, Stavanger, Norway, 17–22 June 2001. [Google Scholar]
- Gardiner, C.P.; Melchers, R.E. Corrosion analysis of bulk carriers, Part I: Operational parameters influencing corrosion rates. Mar. Struct. 2003, 16, 547–566. [Google Scholar] [CrossRef]
- Gudze, M.T.; Melchers, R.E. Operational based corrosion analysis in naval ships. Corros. Sci. 2008, 50, 3296–3307. [Google Scholar] [CrossRef]
- Kolovelonis, D.T.; Rodopoulos, D.C.; Gortsas, T.V.; Polyzos, D.; Tsinopoulos, S.V. Cathodic Protection of A Container Ship Using A Detailed BEM Model. J. Mar. Sci. Eng. 2020, 8, 359. [Google Scholar] [CrossRef]
- Ivošević, Š.; Meštrović, R.; Kovač, N. Probabilistic estimates of corrosion rate of fuel tank structures of aging bulk carriers. Int. J. Naval Arch. Ocean Eng. 2019, 11, 165–177. [Google Scholar] [CrossRef]
- Ivošević, Š.; Meštrović, R.; Kovač, N. A Probabilistic Method for Estimating the Percentage of Corrosion Depth on the Inner Bottom Plates of Aging Bulk Carriers. J. Mar. Sci. Eng. 2020, 8, 442. [Google Scholar] [CrossRef]
- Ivošević, Š.; Kovač, N.; Momčilović, N.; Vukelić, G. Analysis of corrosion depth percentage on the inner bottom plates of aging bulk carriers with an aim to optimize corrosion margin. Shipbuild. Theory Pract. Nav. Archit. 2021, 72, 81–95. [Google Scholar] [CrossRef]
- Southwell, C.R.; Bultman, J.D.; Hummer, C.W. Estimating of service life of steel in seawater. Seawater Corros. Handb. 1979, 87, 374. [Google Scholar]
- Soares, C.G.; Garbatov, Y. Reliability of maintained, corrosion protected plates subjected to non–linear corrosion and compressive loads. Mar. Struct. 1999, 12, 425–445. [Google Scholar] [CrossRef]
- Yamamoto, N.; Kumano, A.; Matoba, M. Effect of corrosion and its protection on hull strength (2nd report). J. Soc. Nav. Archit. Jpn. 1994, 176, 281–289. [Google Scholar] [CrossRef]
- Paik, J.K.; Lee, J.M.; Park, Y.I.; Hwang, J.S.; Kim, C.W. Time-variant ultimate longitudinal strength of corroded bulk carriers. Mar. Struct. 2003, 16, 567–600. [Google Scholar] [CrossRef]
- Paik, J.K.; Thayamballi, A.K.; Park, Y.I.; Hwang, J.S. A time-dependent corrosion wastage model for bulk carrier structures. Int. J. Mar. Eng. 2003, 145, 61–87. [Google Scholar]
- Paik, J.K.; Wang, G.; Thayamballi, A.K.; Lee, J.M.; Park, Y.I. Time-dependent risk assessment of aging ships accounting for general/pit corrosion, fatigue cracking and local denting damage. Trans. SNAME 2003, 111, 159–197. [Google Scholar]
- Melchers, R.E. Corrosion uncertainty modelling for steel structures. J. Constr. Steel Res. 1999, 52, 3–19. [Google Scholar] [CrossRef]
- Melchers, R.E. Probabilistic Model for Marine Corrosion of Steel for Structural Reliability Assessment. J. Struct. Eng. 2003, 129, 1484–1493. [Google Scholar] [CrossRef]
- Melchers, R.E. Advances in Mathematical-Probabilistic Modelling of the Atmospheric Corrosion of Structural Steels in Ocean Environments. In Proceedings of the 3rd International ASRANet Colloquium, Glasgow, UK, 10–12 July 2006. [Google Scholar]
- Kim, H.B.; Zhang, X.; Li, C.G.; Paik, J.K. Ultimate strength performance of tankers associated with industry corrosion addition practices. Int. J. Nav. Archit. Ocean Eng. 2014, 6, 507–528. [Google Scholar] [CrossRef]
- Qin, S.; Cui, W. Effect of corrosion models on the time-dependent reliability of steel plated elements. Mar. Struct. 2003, 16, 15–34. [Google Scholar] [CrossRef]
Figure 1.
Gross thickness and corrosion addition percentage plotted against the corrosion wear percentage of gross thickness with corresponding criteria for the LG of bulk carriers.
Figure 1.
Gross thickness and corrosion addition percentage plotted against the corrosion wear percentage of gross thickness with corresponding criteria for the LG of bulk carriers.

Figure 2.
Input corrosion depth database for the LG structural elements.

Figure 3.
Linear models for the minimum (a), mean (b), and maximum (c) corrosion wear percentage of the LG ship structures.
Figure 3.
Linear models for the minimum (a), mean (b), and maximum (c) corrosion wear percentage of the LG ship structures.


Figure 4.
The critical values of the maximum wear percentage—of LG.

Figure 5.
Corrosion depth percentage plotted against the operating time and built-in thicknesses of the LG of the bulk carriers examined.
Figure 5.
Corrosion depth percentage plotted against the operating time and built-in thicknesses of the LG of the bulk carriers examined.

Figure 6.
Corrosion depth percentage plotted against the thicknesses of LG: measured data vs. CSR corrosion addition limit.
Figure 6.
Corrosion depth percentage plotted against the thicknesses of LG: measured data vs. CSR corrosion addition limit.


Table 1.
Corrosion additions for the LG plating of bulk carriers according to IACS [6].
Table 1.
Corrosion additions for the LG plating of bulk carriers according to IACS [6].
| Corrosion Addition—FOT Side (mm) | Corrosion Addition—WBT Side (mm) | Reserve Thickness (mm) | Total Corrosion Addition (mm) |
|---|---|---|---|
| 0.7 | 2 | 0.5 | 3.5 |
Table 2.
Corrosion addition percentage and gross thickness for the LG of bulk carriers calculated according to IACS [6].
Table 2.
Corrosion addition percentage and gross thickness for the LG of bulk carriers calculated according to IACS [6].
| (Assumed) Net Thickness of LG (mm) | Total Corrosion Addition, Table 1 (mm) | Gross Thickness (mm) | Corrosion Addition as a Percentage of Gross Thickness (mm) |
|---|---|---|---|
| 8 | 3.5 | 11.5 | 30.4% |
| 10 | 3.5 | 13.5 | 25.9% |
| 12 | 3.5 | 15.5 | 22.6% |
| 14 | 3.5 | 17.5 | 20.0% |
| 16 | 3.5 | 19.5 | 17.9% |
| 18 | 3.5 | 21.5 | 16.3% |
Table 3.
The basic information on the database and the original thickness of the longitudinal girder plate.
Table 3.
The basic information on the database and the original thickness of the longitudinal girder plate.
| The Age of Ships (Years) | The Number of Ship Surveys | The Number of Tanks | The Number of Sections | The Available Built-in Thickness of Plates (mm) |
|---|---|---|---|---|
| 0–5 | 4 | 9 | 45 | 11–14, 16–17, 18–19 |
| 5–10 | 4 | 10 | 50 | 11–16 |
| 10–15 | 7 | 19 | 100 | 11–16 |
| 15–20 | 12 | 39 | 200 | 11–16 |
| 20–25 | 5 | 17 | 90 | 11–14, 16–18 |
| Total: | 31 | 95 | 490 |
Table 4.
The descriptive statistics of the LG empirical database.
| Statistics | Value | Statistics | Value | Statistics | Value |
|---|---|---|---|---|---|
| Sample Size | 1160 | Sample Size | 606 | Sample Size | 152 |
| Mean (M) | 4.73422 | Mean (M) | 11.3899 | Mean (M) | 7.72303 |
| Min | 0 | Min | 0 | Min | 0 |
| Max | 44 | Max | 55.6 | Max | 55.6 |
| Std. Deviation | 8.4675 | Std. Deviation | 13.5874 | Std. Deviation | 14.4824 |
| 25% (Q1) | 0.8 | 25% (Q1) | 1.4 | 25% (Q1) | 0.6 |
| 75% (Q3) | 3.4 | 75% (Q3) | 26.7 | 75% (Q3) | 4.85 |
Table 5.
The time when the critical values of wear percentage are reached.
| Intervals of the Original Thickness | |||||
|---|---|---|---|---|---|
| [11,13) | years | years | years | years | |
| [13,15) | years | years | years | years | |
| [15,18] | years | years | years | years |
Publisher’s Note: MDPI stays neutral with regard to jurisdictional claims in published maps and institutional affiliations. |
© 2022 by the authors. Licensee MDPI, Basel, Switzerland. This article is an open access article distributed under the terms and conditions of the Creative Commons Attribution (CC BY) license (https://creativecommons.org/licenses/by/4.0/).
Share and Cite
MDPI and ACS Style
Ivošević, Š.; Kovač, N.; Momčilović, N.; Vukelić, G. Evaluation of the Corrosion Depth of Double Bottom Longitudinal Girder on Aging Bulk Carriers. J. Mar. Sci. Eng. 2022, 10, 1425. https://doi.org/10.3390/jmse10101425
AMA Style
Ivošević Š, Kovač N, Momčilović N, Vukelić G. Evaluation of the Corrosion Depth of Double Bottom Longitudinal Girder on Aging Bulk Carriers. Journal of Marine Science and Engineering. 2022; 10(10):1425. https://doi.org/10.3390/jmse10101425
Chicago/Turabian StyleIvošević, Špiro, Nataša Kovač, Nikola Momčilović, and Goran Vukelić. 2022. "Evaluation of the Corrosion Depth of Double Bottom Longitudinal Girder on Aging Bulk Carriers" Journal of Marine Science and Engineering 10, no. 10: 1425. https://doi.org/10.3390/jmse10101425
Note that from the first issue of 2016, this journal uses article numbers instead of page numbers. See further details here.