Article

Effect of Low Temperature on the Undrained Shear Strength of Deep-Sea Clay by Mini-Ball Penetration Tests

1
State Key Laboratory of Coastal and Offshore Engineering, Dalian University of Technology, Dalian 116024, China
2
Shandong Provincial Key Laboratory of Marine Environment and Geological Engineering, Ocean University of China, Qingdao 266100, China
3
Department of Civil, Environmental, Geomatic Engineering, University College London, London WC1E 6BT, UK
*
Authors to whom correspondence should be addressed.
J. Mar. Sci. Eng. 2022, 10(10), 1424; https://doi.org/10.3390/jmse10101424
Submission received: 15 July 2022 / Revised: 16 September 2022 / Accepted: 21 September 2022 / Published: 3 October 2022
(This article belongs to the Special Issue Advances in Marine Engineering: Geological Environment and Hazards)

Abstract

:
The technology for in situ testing of the undrained shear strength of deep-sea clay is underdeveloped. Indoor tests remain necessary, and there is a large temperature difference between in situ and laboratory tests. To analyse the effect of temperature on undrained shear strength, in this study the physical characteristics of marine clay samples from the South China Sea were determined, followed by penetration tests by the mini-ball method under low (4 °C) and room (20 °C) temperatures. The results indicated that the clay strength increased by 14.1–30.0% as the temperature decreased from 20 °C to 4 °C, and the strength of the bound water and the viscosity of the free water in the clay sample increased as the temperature decreased, which was the root cause of the increase in the clay strength. Based on the research, it is possible to correct the undrained shear strength values measured in laboratory tests and provide more reasonable parameters for ocean engineering.

1. Introduction

Marine engineering construction has moved to the deep sea, and researchers are paying more attention to the undrained shear strength of deep-sea clay [1], which is crucial for the design and installation of marine pipelines [2,3], development of marine mineral resources [4] and evaluation of marine geological hazards [5,6,7,8,9,10,11]. Nevertheless, the in situ technology for testing the undrained shear strength of deep-sea clay is not well developed, especially for seawater depths exceeding 4000 m [12]. Therefore, it is necessary to retrieve samples from the deep sea and conduct laboratory tests to comprehensively evaluate the deep-sea clay strength. In situ tests of deep-sea clay were conducted in a low-temperature environment, e.g., the continental shelf (6–14 °C), continental slope (2–6 °C), and deep-sea basin (2–3 °C) [13], while the clay samples were tested in the laboratory at 20–35 °C. To reasonably evaluate the deep-sea clay strength, the effect of low temperatures must be explored in the laboratory.
A series of experiments were conducted by researchers to investigate the effect of temperature on the undrained shear strength of marine clay. Mitchell et al. [14] tested the undrained shear strength of remoulded San Francisco Bay mud under isotropically consolidated undrained triaxial compression, which demonstrated a 9% increase as the temperature decreased from 20 °C to 4.7 °C. In the case of marine clay, Perkins and Sjursen [15] performed tests on intact specimens of Troll clay using consolidated anisotropic undrained compression (CAUC), and the results indicated that the undrained shear strength was 10–21% greater at low temperatures than at room temperature. Gue et al. [16] studied clay in the Norwegian Sea, including the preconsolidation stress, undrained shear strength, rate effects, and anisotropy ratio, at different temperatures. The results showed that the undrained shear strength increased by 15–30% when tested at low temperatures by triaxial tests.
Measuring the undrained shear strength of deep-sea clay through a temperature-controlled triaxial instrument requires solving two problems: (1) it is difficult to test ultrasoft clay with very low strength in a triaxial apparatus; and (2) there is an unavoidable temperature effect on membrane stiffening for triaxial tests [16]. To address both issues, a full-flow penetrometer could be used to determine the effect of temperature on the undrained shear strength of deep-sea clay. Full-flow penetrometers have many advantages, which have been described by numerous researchers [17,18,19,20,21,22,23]. In particular, full-flow penetrometers are suitable for measuring low-strength clay and can achieve direct contact between the test instrument and clay. There are two main types of full-flow penetrometers, namely, the T-bar and the ball. The T-bar was first introduced in 1991 [24,25] and applied to in situ testing in 1998. However, due to its slender structure, a bending moment was produced during the testing that resulted in inaccurate results [26]. The ball-type penetrometer was subsequently invented and used in 2005 to avoid the bending moment [17]. Consequently, a mini-ball full-flow penetrometer was used in this study.
Above all, studies have indicated that the undrained shear strength differs between room and low temperatures. However, the mechanism of the temperature effect on the undrained shear strength of deep-sea clay has rarely been studied and discussed. In this paper, based on the same full-flow test principle in both the in situ and laboratory tests, mini-ball penetration tests were conducted to discover and quantify the effect of temperature on the undrained shear strength of deep-sea clay from the South China Sea. Then, the mechanism of temperature influence was analysed and explained in detail. The results will be useful to correct the undrained shear strength measured in the laboratory and provide more reasonable parameters for deep-sea development and disaster prevention.

2. Methodology

2.1. Sediment Samples

Deep-sea sediment samples were taken in the South China Sea at 21°23′30″ N and 118°45′44.4″ E. At the sampling position, the water depth was 2535 m, which was classified as deep sea, and the seabed surface temperature was approximately 4 °C. The sediment samples were collected from the deep sea by a gravity core sampler whose length and diameter are 7 m and 0.1 m, respectively, and stored in the geotechnical laboratory at 4 °C. Finally, these sediment samples were transported to the geotechnical laboratory of Dalian University of Technology for storage, where the temperature was maintained at 20 °C.

2.2. Physical Properties of Sediment Samples

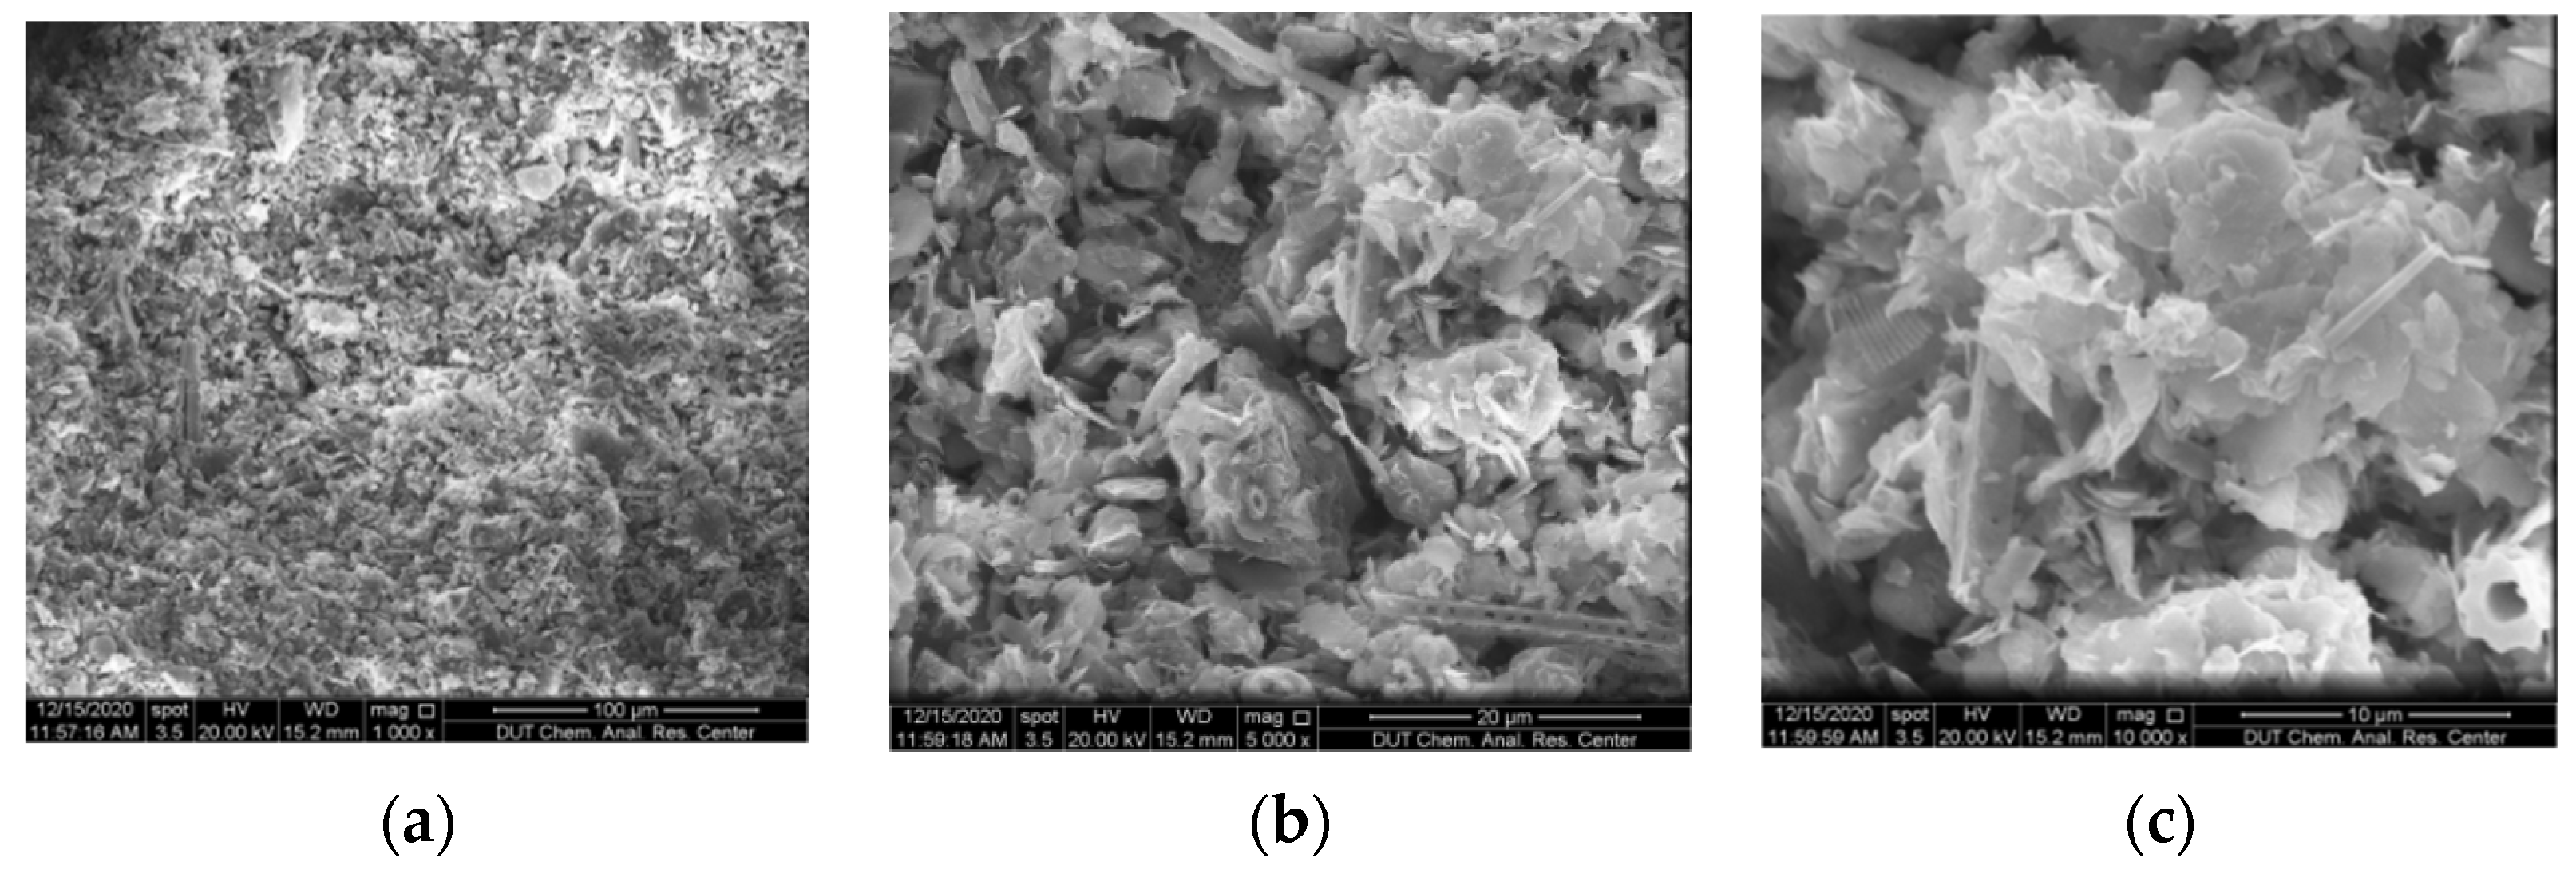
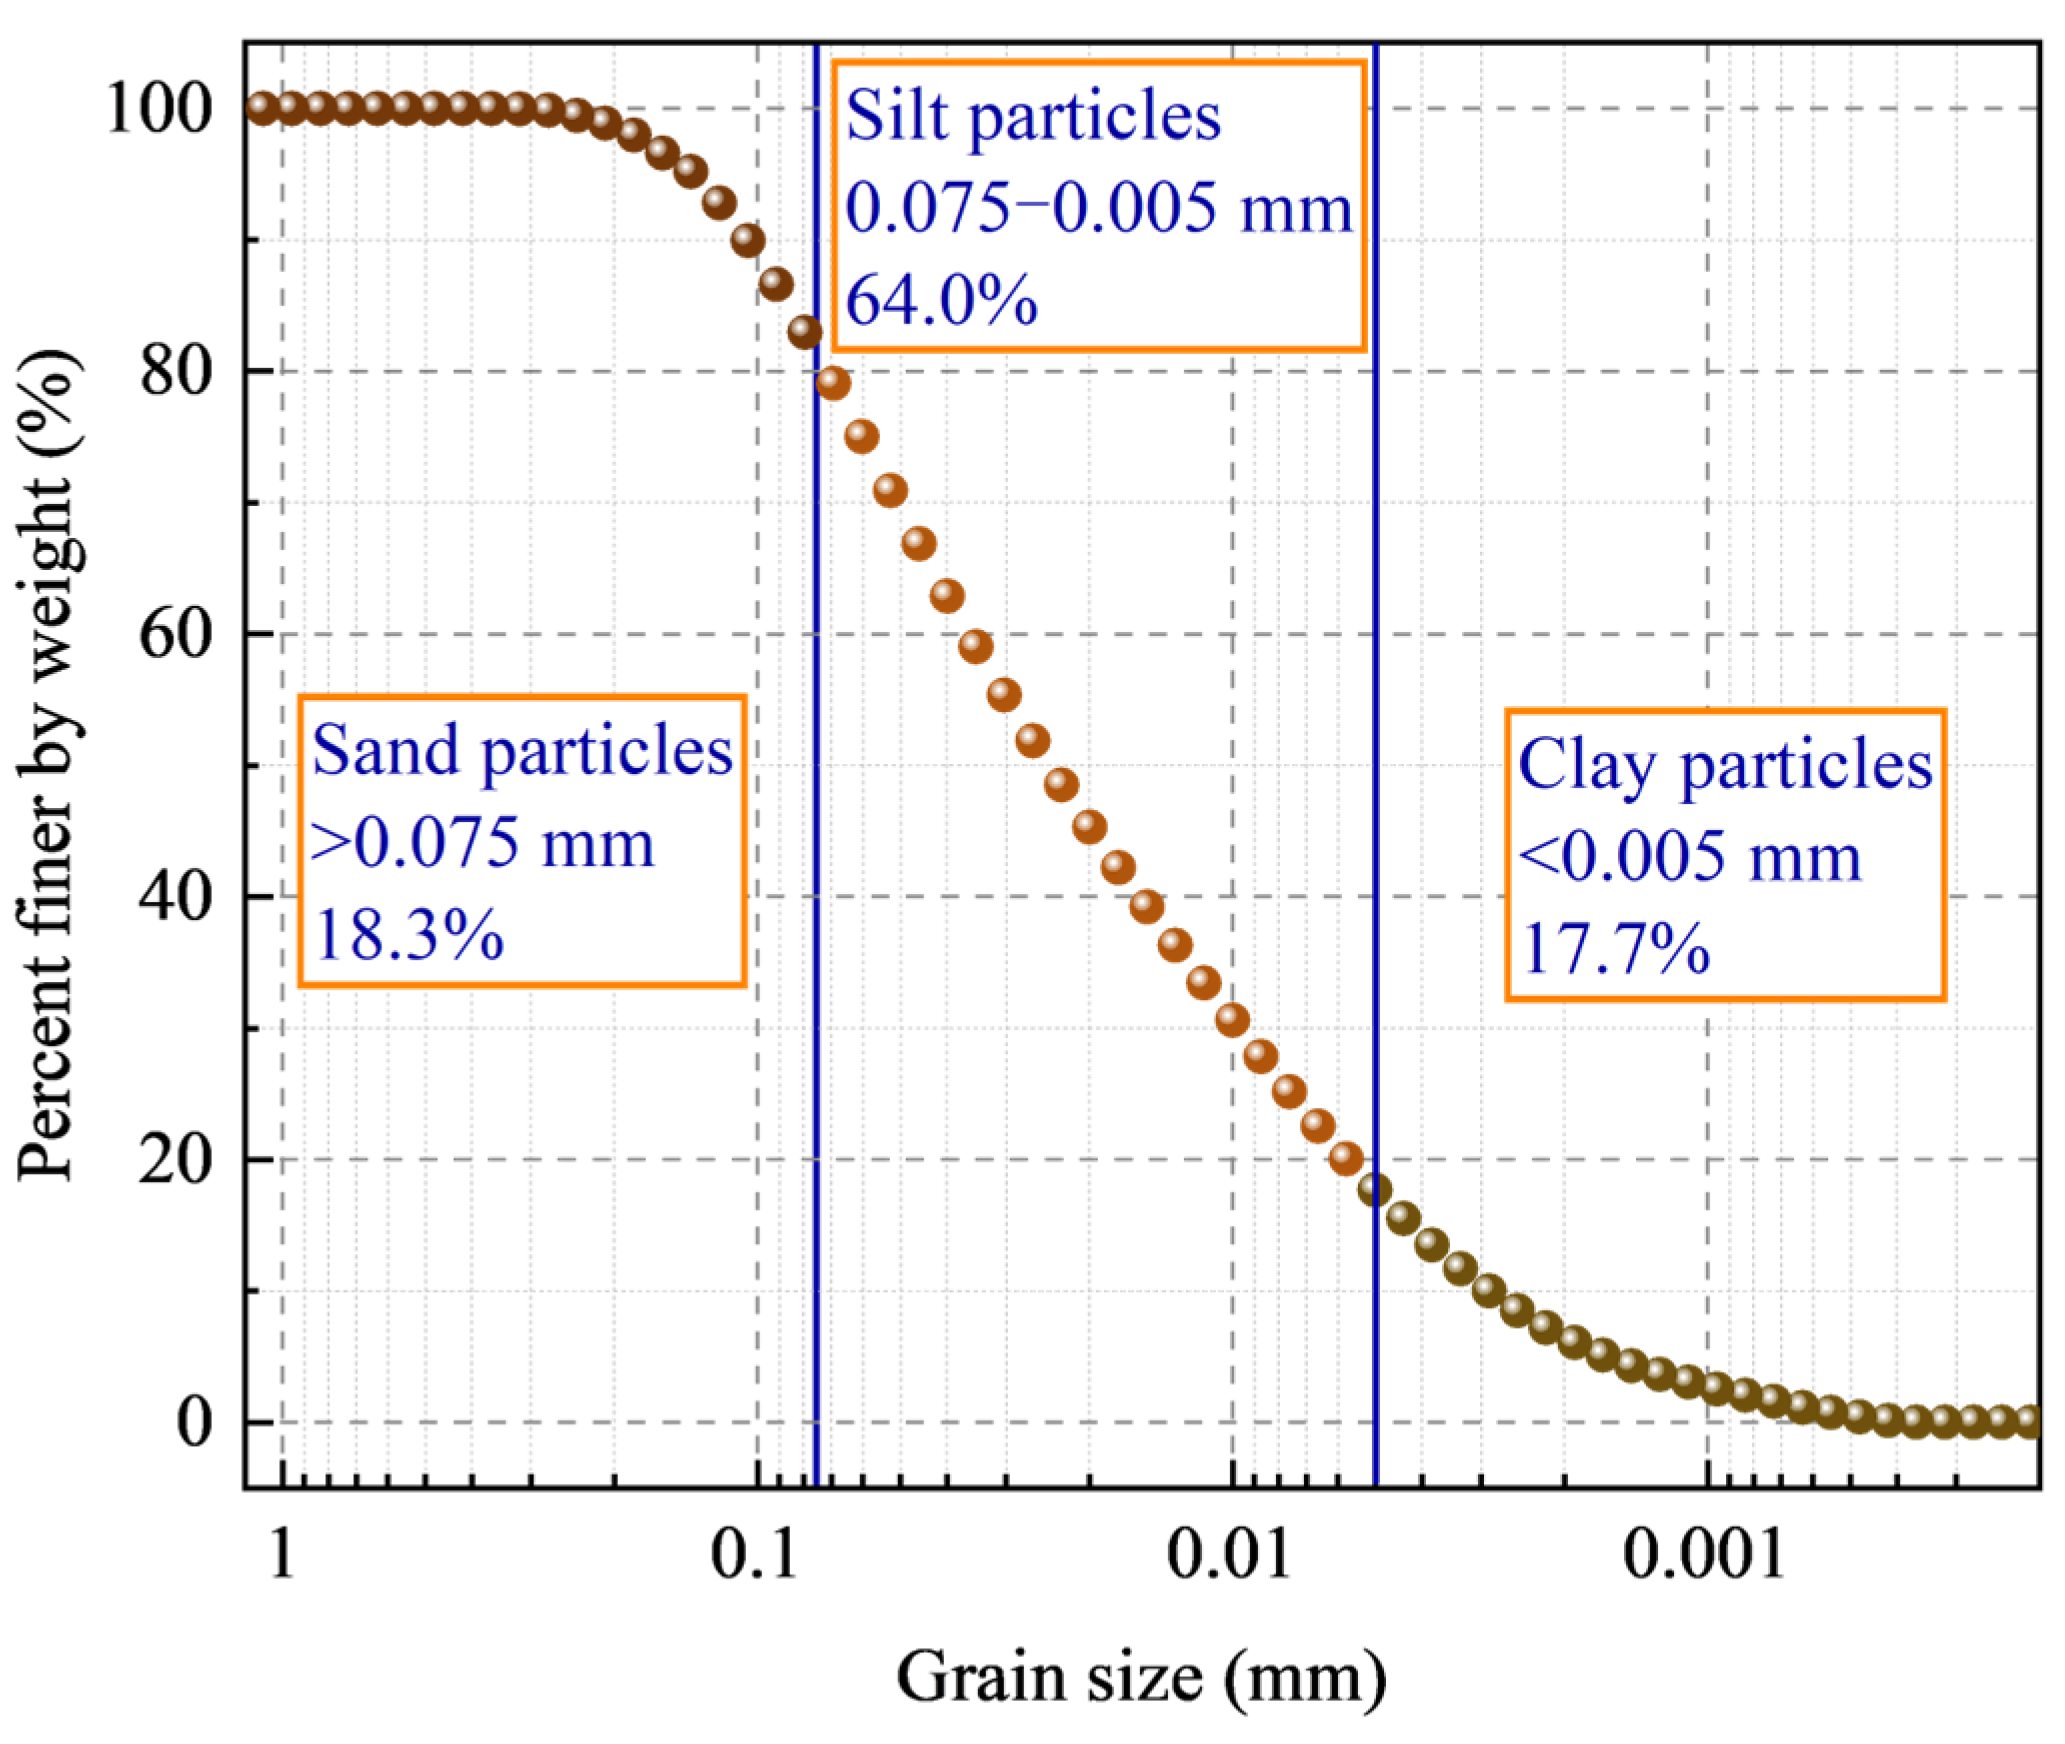
There were six sediment segments in total (i.e., from S1 to S6), each 20 cm long. Various tests were performed to provide a description of the six sediment segments, partly shown in Figure 1, including measurements of density, water content, plastic and liquid limits, specific gravity, organic content, compression factor, permeability factor, grain-size, and imaging by scanning electron microscopy (Figure 2). Table 1 summarizes the results of the physical properties of the sediment segments. From the grain size data (Figure 3) and using the China Standard for Engineering Classification of Soils (GB/T 50145-2007) and the USA Unified System of Soil Classification (ASTM D2487-00), the sediment has been classified as “clay” [27,28]. Note that the consolidation loads are 12.5, 25, 50, 100, 200, and 400 kPa. To determine the consolidation coefficients, first calculate the void ratio under consolidation pressures of 0.1 and 0.2 MPa and then calculate according to Equation (1) below. All the sediment segments belong to high liquid limit clay containing organic matter based on the Casagrande plasticity diagram:
a = e 1 e 2 P 2 P 1
where α is the compression coefficient; e1 is the void ratio under 0.1 MPa consolidation pressure; e2 is the void ratio under 0.2 MPa consolidation pressure; P1 is 0.1 MPa consolidation pressure; and P2 is 0.2 MPa consolidation pressure.

3. Results

3.1. Temperature Calibration of the Load Cell

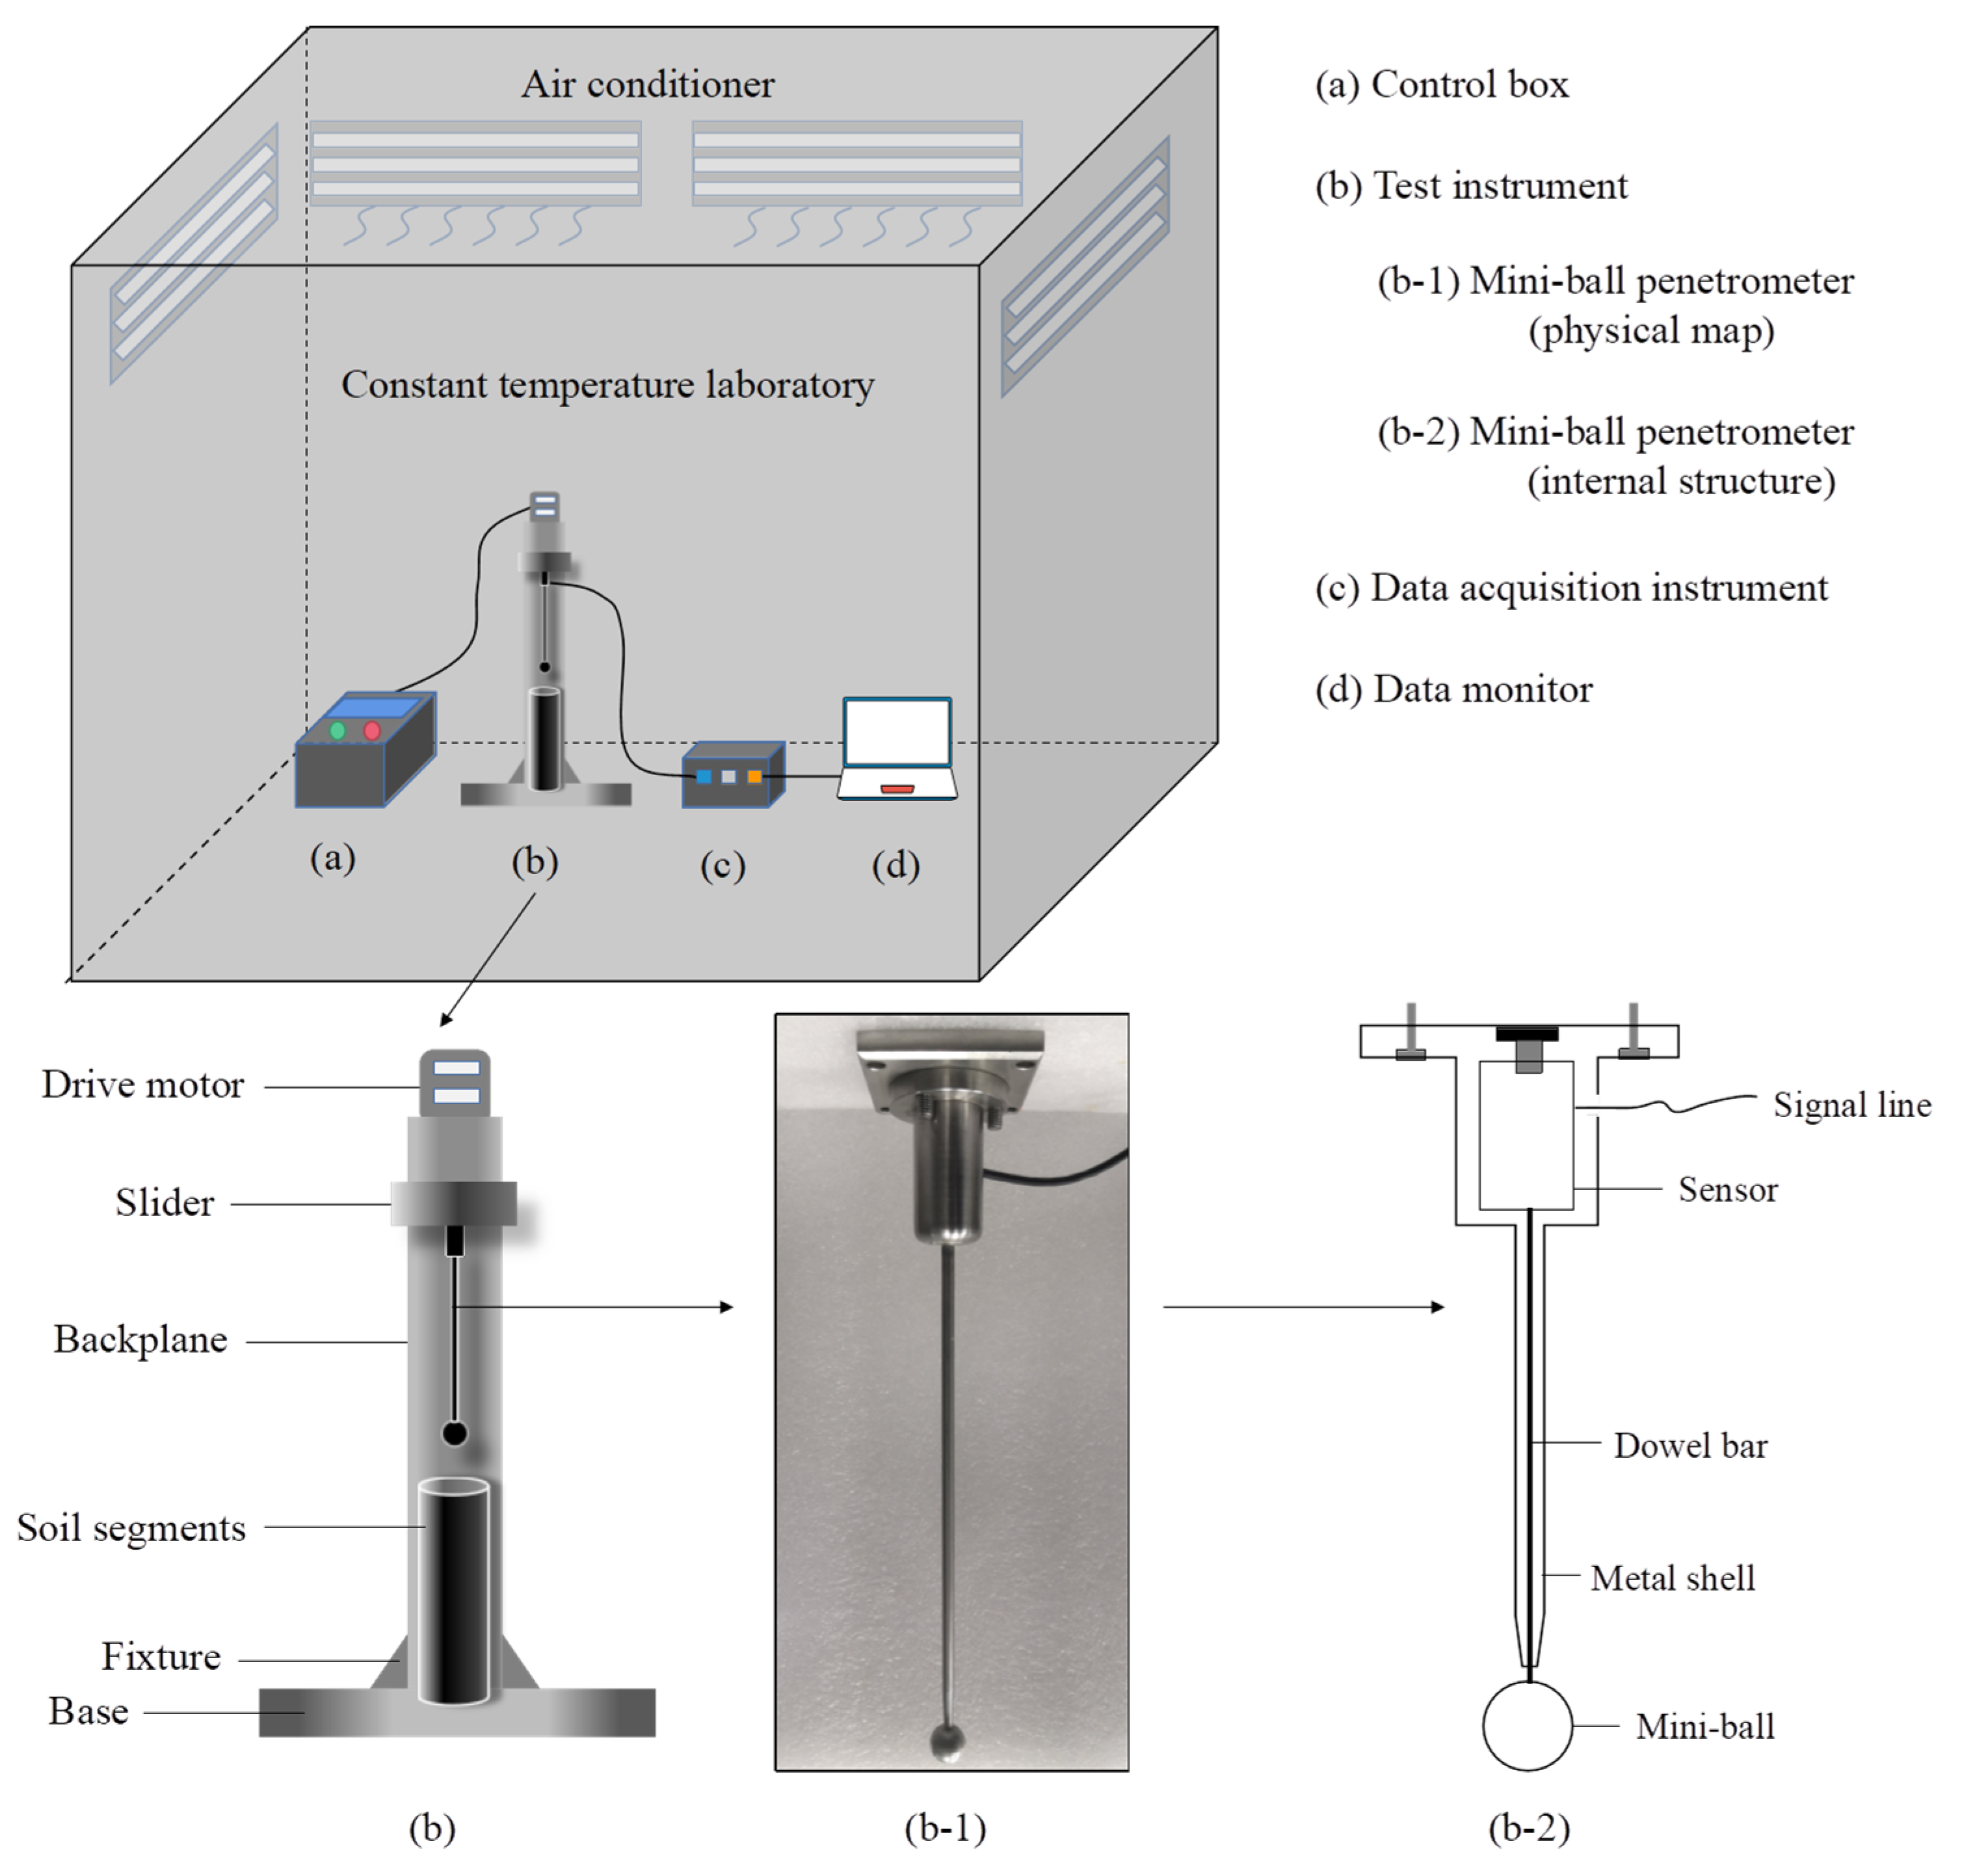
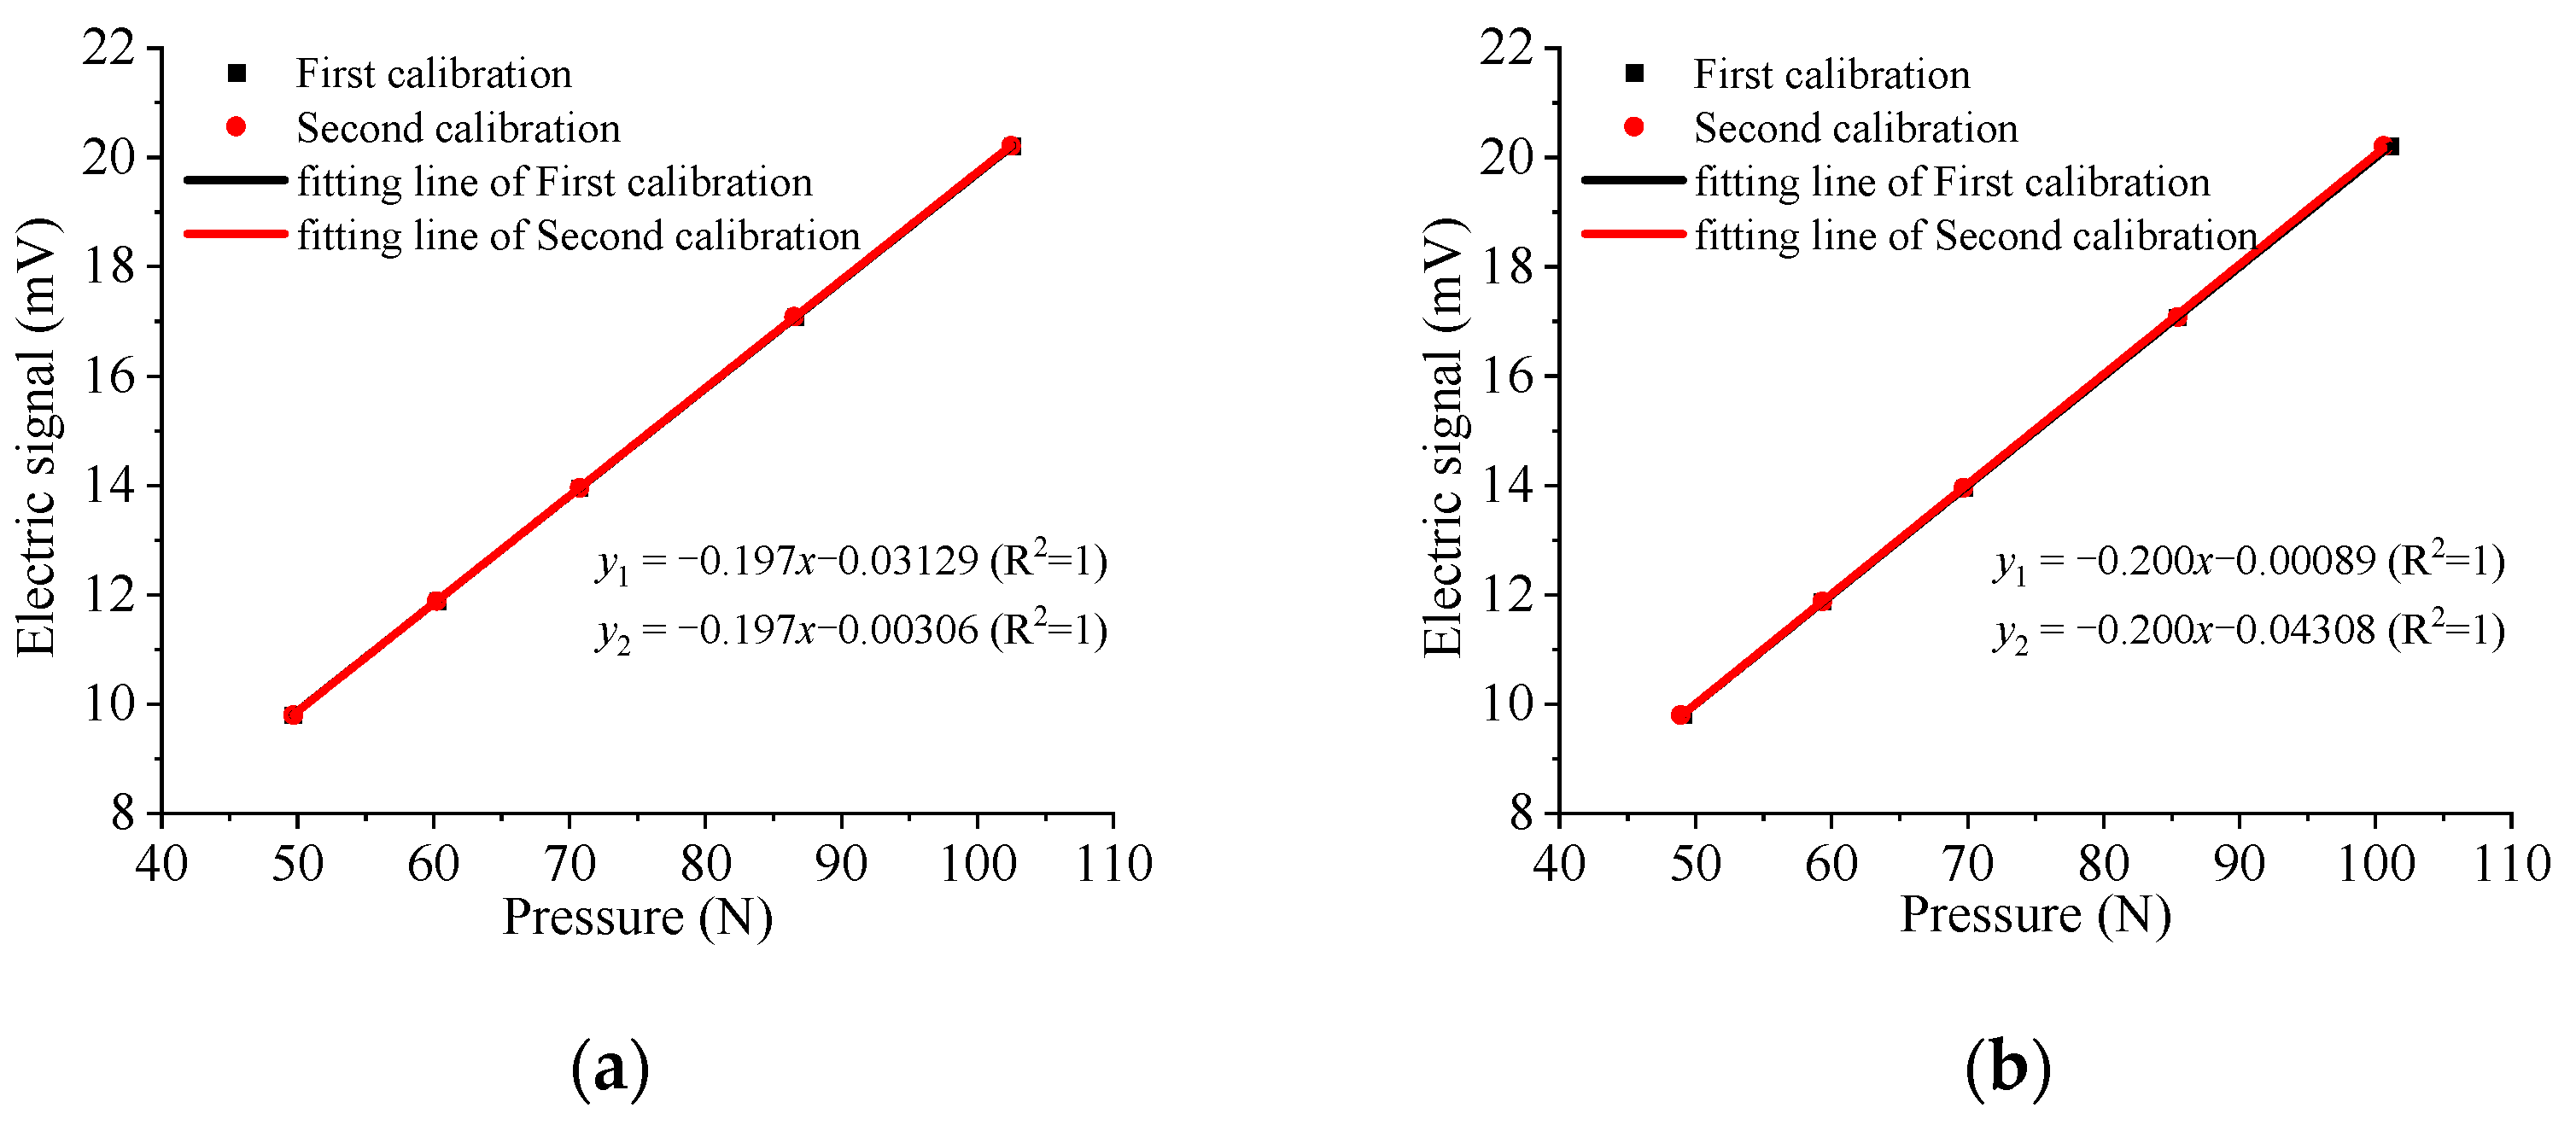
Figure 4 shows the mini-ball device used to measure the undrained shear strength of sediment segments, with a probe diameter of 1.58 cm, a shaft diameter of 0.6 cm, and a length of 28.5 cm. When the mini-ball is forced, the force is transmitted to the load cell through the dowel bar, which can then detect penetration resistance. As the load cell may be affected by temperature, it is necessary to calibrate it at various temperatures. Figure 5 shows that the sensor calibration factor was 0.200 at 4 °C and 0.197 at 20 °C.

3.2. Penetration Tests at Room and Low Temperatures

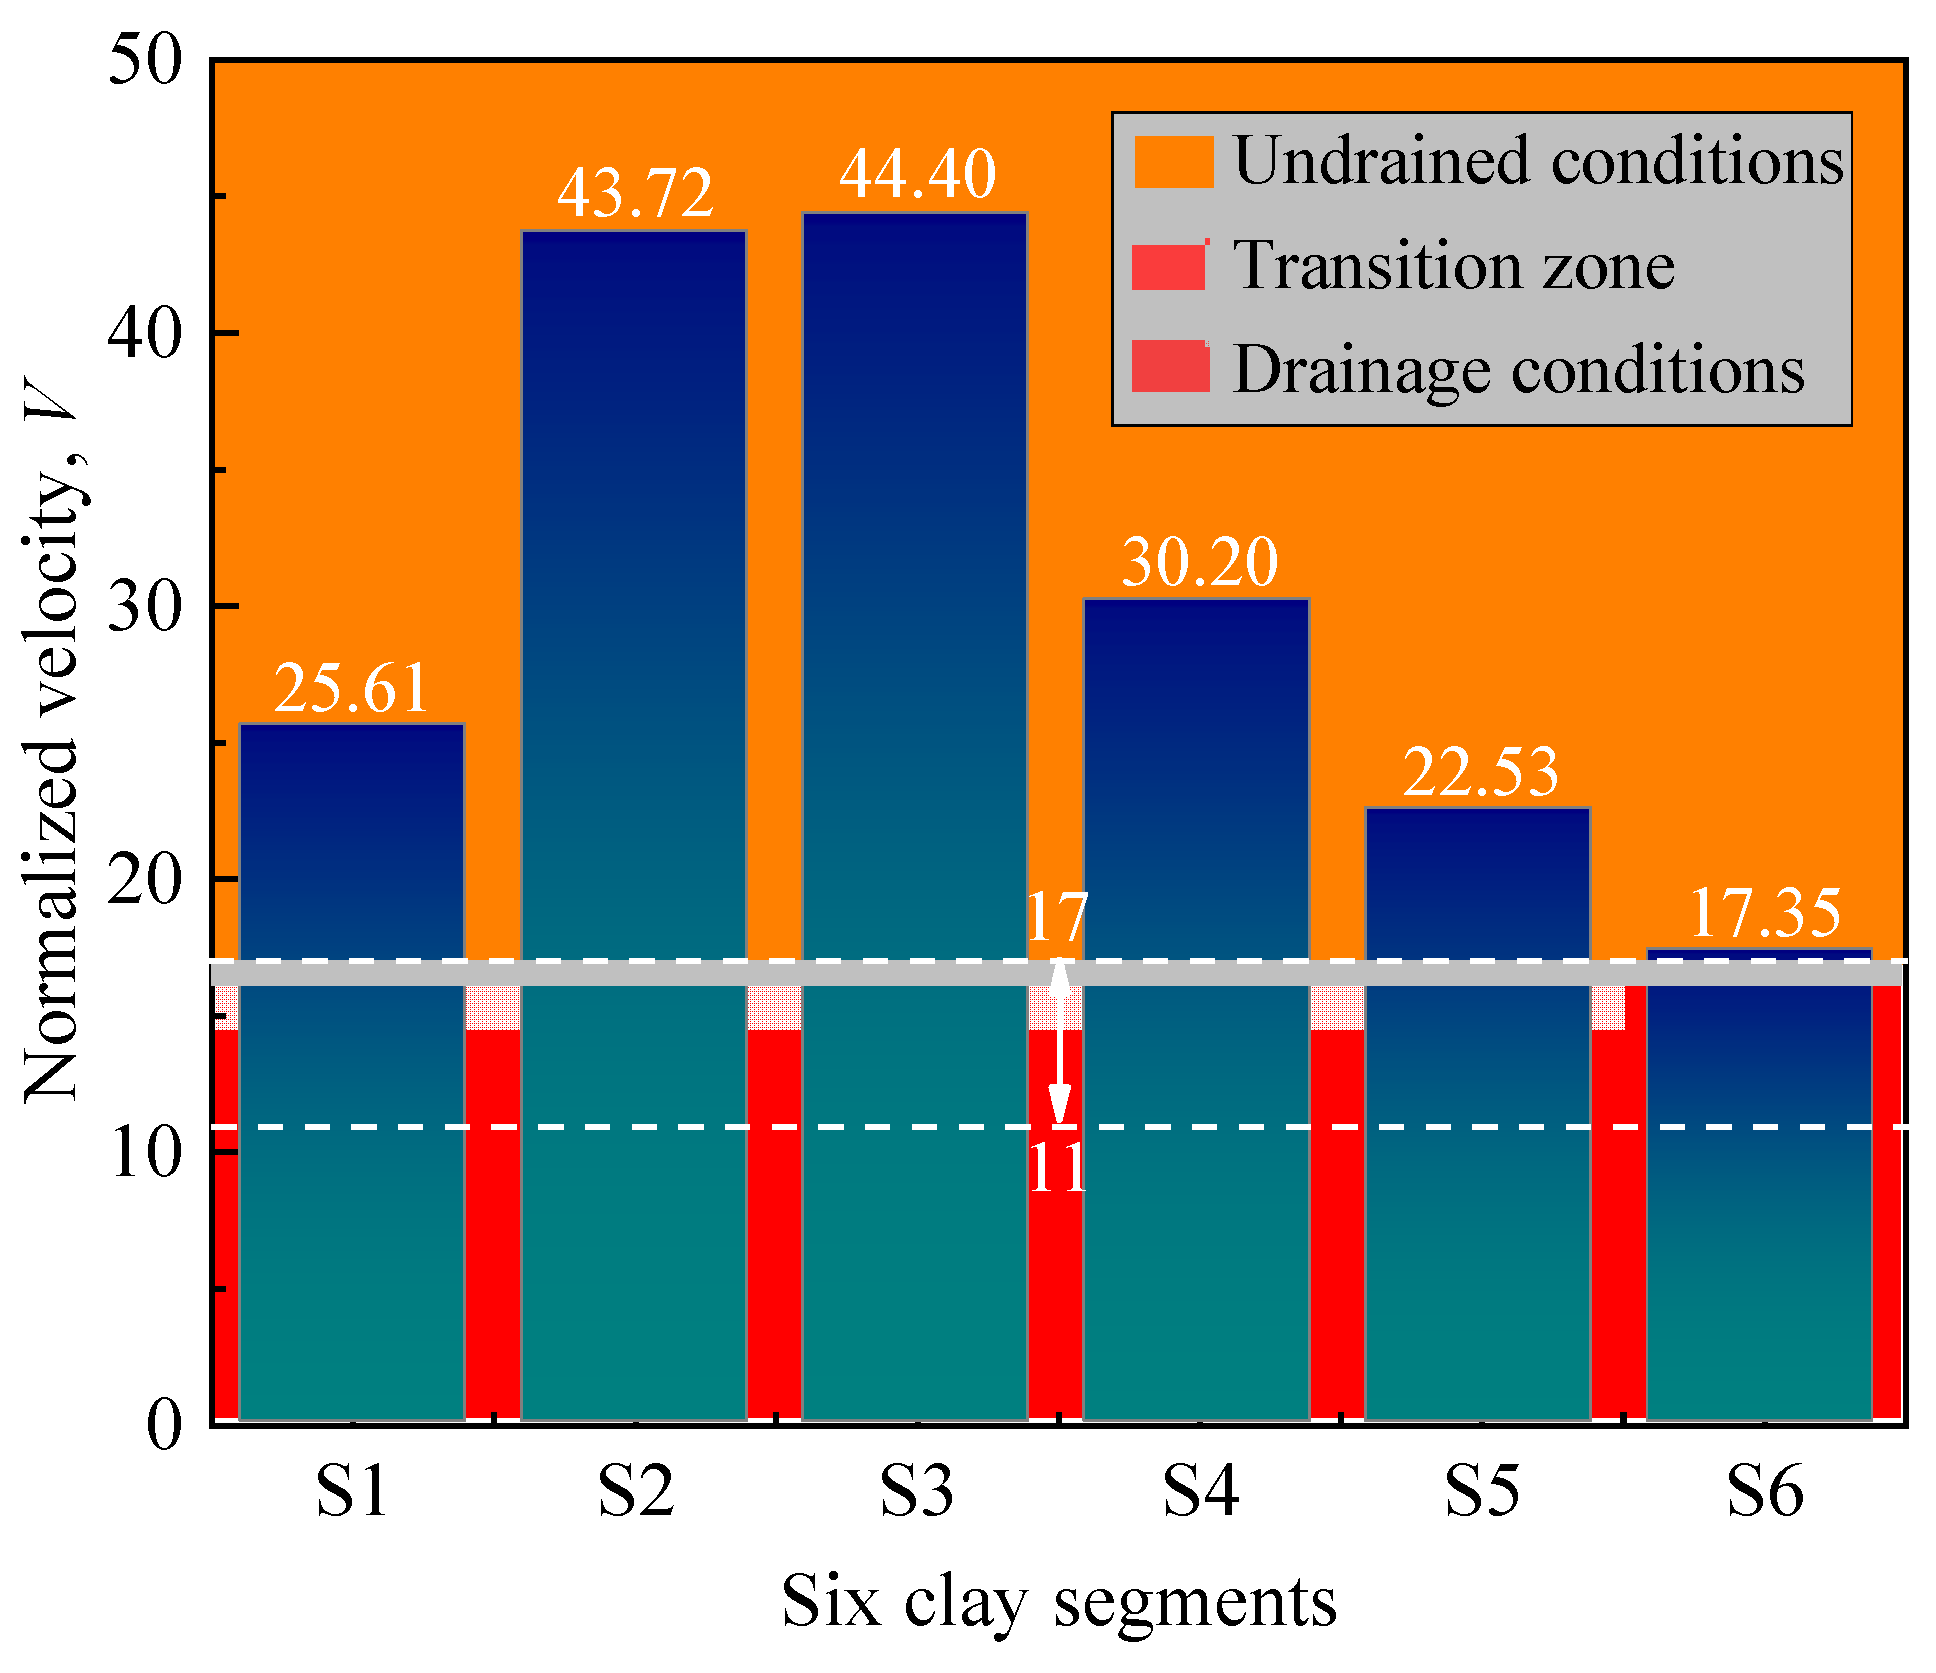
Mini-ball penetration tests were conducted consecutively at room and low temperatures in the constant temperature laboratory (Figure 4). First, to control the test temperature, both the mini-ball and sediment segments were placed in a constant temperature laboratory for at least 24 h, where the temperature was set to 20 °C. To ensure that the sediment sample reached the desired temperature, the temperature was then tested with a thermometer. After that, the test was performed with a maximum penetration depth of approximately 12 cm and a penetration velocity of 0.2 cm/s. According to Lehane et al. [29], Equation (2) was used to determine whether the sediment was in an undrained condition, i.e., when the normalized velocity (V) exceeded the range of 11–17, it was deemed to be undrained. In Figure 6, the normalized velocities for all sediment segments were under undrained conditions, and thus the results of the penetration tests represented the undrained shear strength:
{ V = v D c v c v = k ( 1 + e ) a r w
where V is the normalized velocity; v is the penetration velocity (0.2 cm/s); D is the diameter of the mini-ball (1.58 cm); cv is the vertical consolidation coefficient, cm2/s; k is the permeability coefficient, cm/s; e is the natural pore ratio; a is the compression coefficient, kPa−1; and γw is the water weight, 10 kN/m3.
After room-temperature penetration tests were performed, the temperature was set to 4 °C for at least 24 h to ensure that the six sediment segments were fully at the low temperature. Next, low-temperature penetration tests were conducted using the same procedures as the room-temperature penetration tests.

4. Results and Analysis

4.1. Penetration Results at Room and Low Temperatures

A method for evaluating the undrained shear strength (su) was proposed by DeJong et al. [21] and Zhou et al. [30] as follows:
{ q net = q F A F = f b × γ × V e s u = q net N Ball
where qnet is the net penetration resistance, kPa; q is the penetration resistance, kN; A is the project area of the mini-ball, m2; F is buoyancy, kN; fb accounts for the effect of local heave (since there is little or no heave in the penetration process, as shown in Figure 1b, it is set as 1); γ is the gravity of sediment, kN/m3; Ve is the volume of the embedded mini-ball below the mud line level, m3; and NBall is the penetration resistance factor, which ranges from 11.21 to 15.19 and is related to surface roughness based on Equation (4) [31]:
N Ball - ideal = 11.21 + 5.04 α 1.06 α 2
where NBall-ideal is the penetration resistance factor in the ideal state and α is the surface roughness of the probe. Usually, the probe surface is sandblasted, so it is recommended that α = 0.4. Although the surface of the mini-ball was polished smoothly, it still could not reach an ideal smooth state. According to Table 2, the penetration resistance factors were in the 12.0–12.5 range; therefore, NBall was adopted as 12.18 with α = 0.2 based on Equation (4).
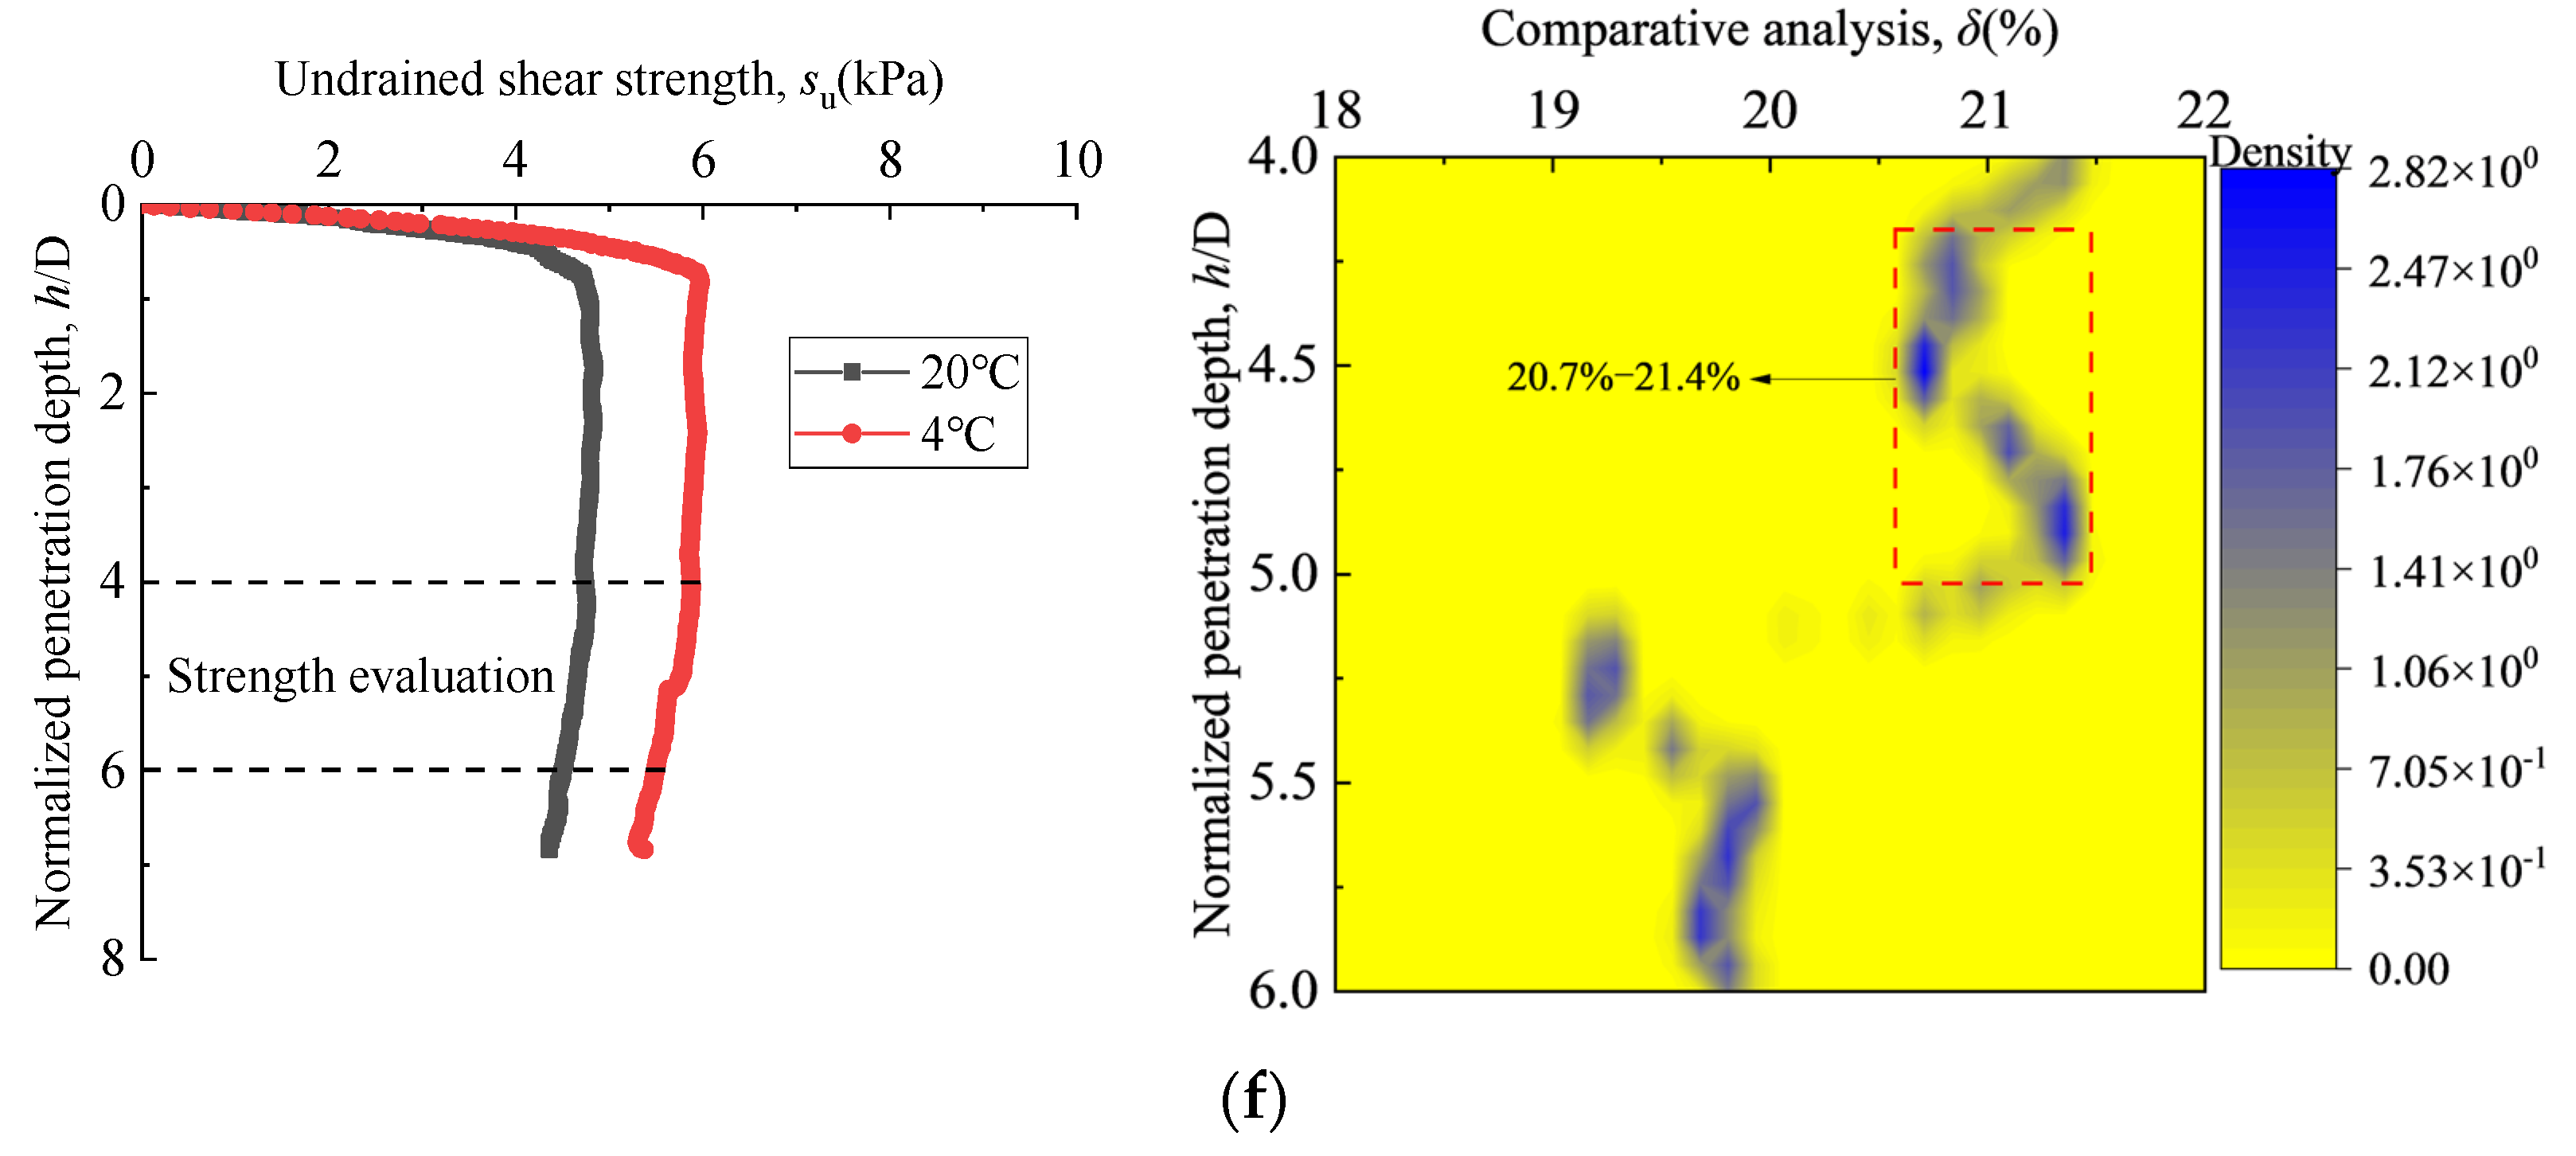
In addition, this study focused on the temperature effect on su; the changes in NBall with penetration depth were not considered. The su profiles at 4–6 times the diameter of the mini-ball (4–6 D) were used to assess the difference in su between 20 °C and 4 °C. According to Equation (3), su tested by the mini-ball penetration tests at 20 °C and 4 °C is shown in Figure 7, where su ranged from approximately 3.2 kPa to 7.7 kPa in the six sediment segments and was lower at 20 °C than 4 °C in all tests except for S3. For S3, su decreased from 6.8 kPa to 5.9 kPa at 20 °C, while it was nearly stable at 5.9 kPa at 4 °C.

4.2. Strength Difference at Room and Low Temperatures

Figure 7 shows that the su values at 20 °C and 4 °C were different. To quantify these differences, two possible factors were analysed, namely, the inhomogeneity of sediment segments and temperature. The inhomogeneity is shown in Figure 7c. For S3, su profiles tested at 20 °C and 4 °C were crossed together and divided into three stages. For 0–1.3 D (Stage 1), su measured at 4 °C was greater, while for 1.3–4.2 D (Stage 2), it was higher at 20 °C. The values of su tested at 20 °C and 4 °C were very close for 4.2–6.6 D (Stage 3). After the penetration tests, this clay segment (i.e., S3) was cut near the 20 °C penetration position. Some sand particles and biological remains were found, as shown in Figure 1b, which caused su to be higher at 20 °C in Stage 2. Additionally, sand particles may have been carried into Stage 3, which caused su to be higher at 20 °C than at 4 °C in Stage 3. Due to the extreme nonuniformity of S3, the test data were not suitable for the analysis of the temperature effect. The other five sediment segments, S1, S2, S4, S5, and S6, however, were more uniform and suitable.
To quantify the temperature effect on su, the following comparative analysis equation was proposed:
{ δ = 2 s u low s u room s u low + s u room × 100 % ( a ) δ T = δ ave . = δ max . + δ min . 2 ( b )
where δ is the normalized effect of temperature on su, %; su-low is the su measured at 4 °C, kPa; and su-room is the su measured at 20 °C, kPa. The δmax. and δmin. can be obtained from Figure 7. It is considered that δave. (i.e., δT) is also the normalized effect of temperature on su, %, which could eliminate the effect caused by the inhomogeneity of the clay.
Table 3 shows that the result of temperature effect on su for the five sediment segments, where can be found that su was approximately 14.1–30.0% lower at 20 °C than at 4 °C. In addition, the result is consistent with Gue et al. [16] and Lunne et al. [34]. Note that Gue et al. proposed that su (the peak shear stress) would be increased by 15–30% with temperature decreasing from 20 °C to 5 °C, and Lunne et al. pointed out that su (the peak shear stress) in the laboratory at 20 °C is 10–20% lower than su at in-situ temperature (5 °C).

5. Discussion

As illustrated in Figure 7, a decrease in temperature leads to an increase in the undrained shear strength of the sediment segments. Considering that the sediment segments consist of clay structure and free water, to analyse the mechanism of the influence of temperature on undrained shear strength, the effect of temperature on clay structure and free water are discussed.

5.1. Effect of Temperature on the Clay Sturcture

5.1.1. Effect of Temperature on Clay Particles

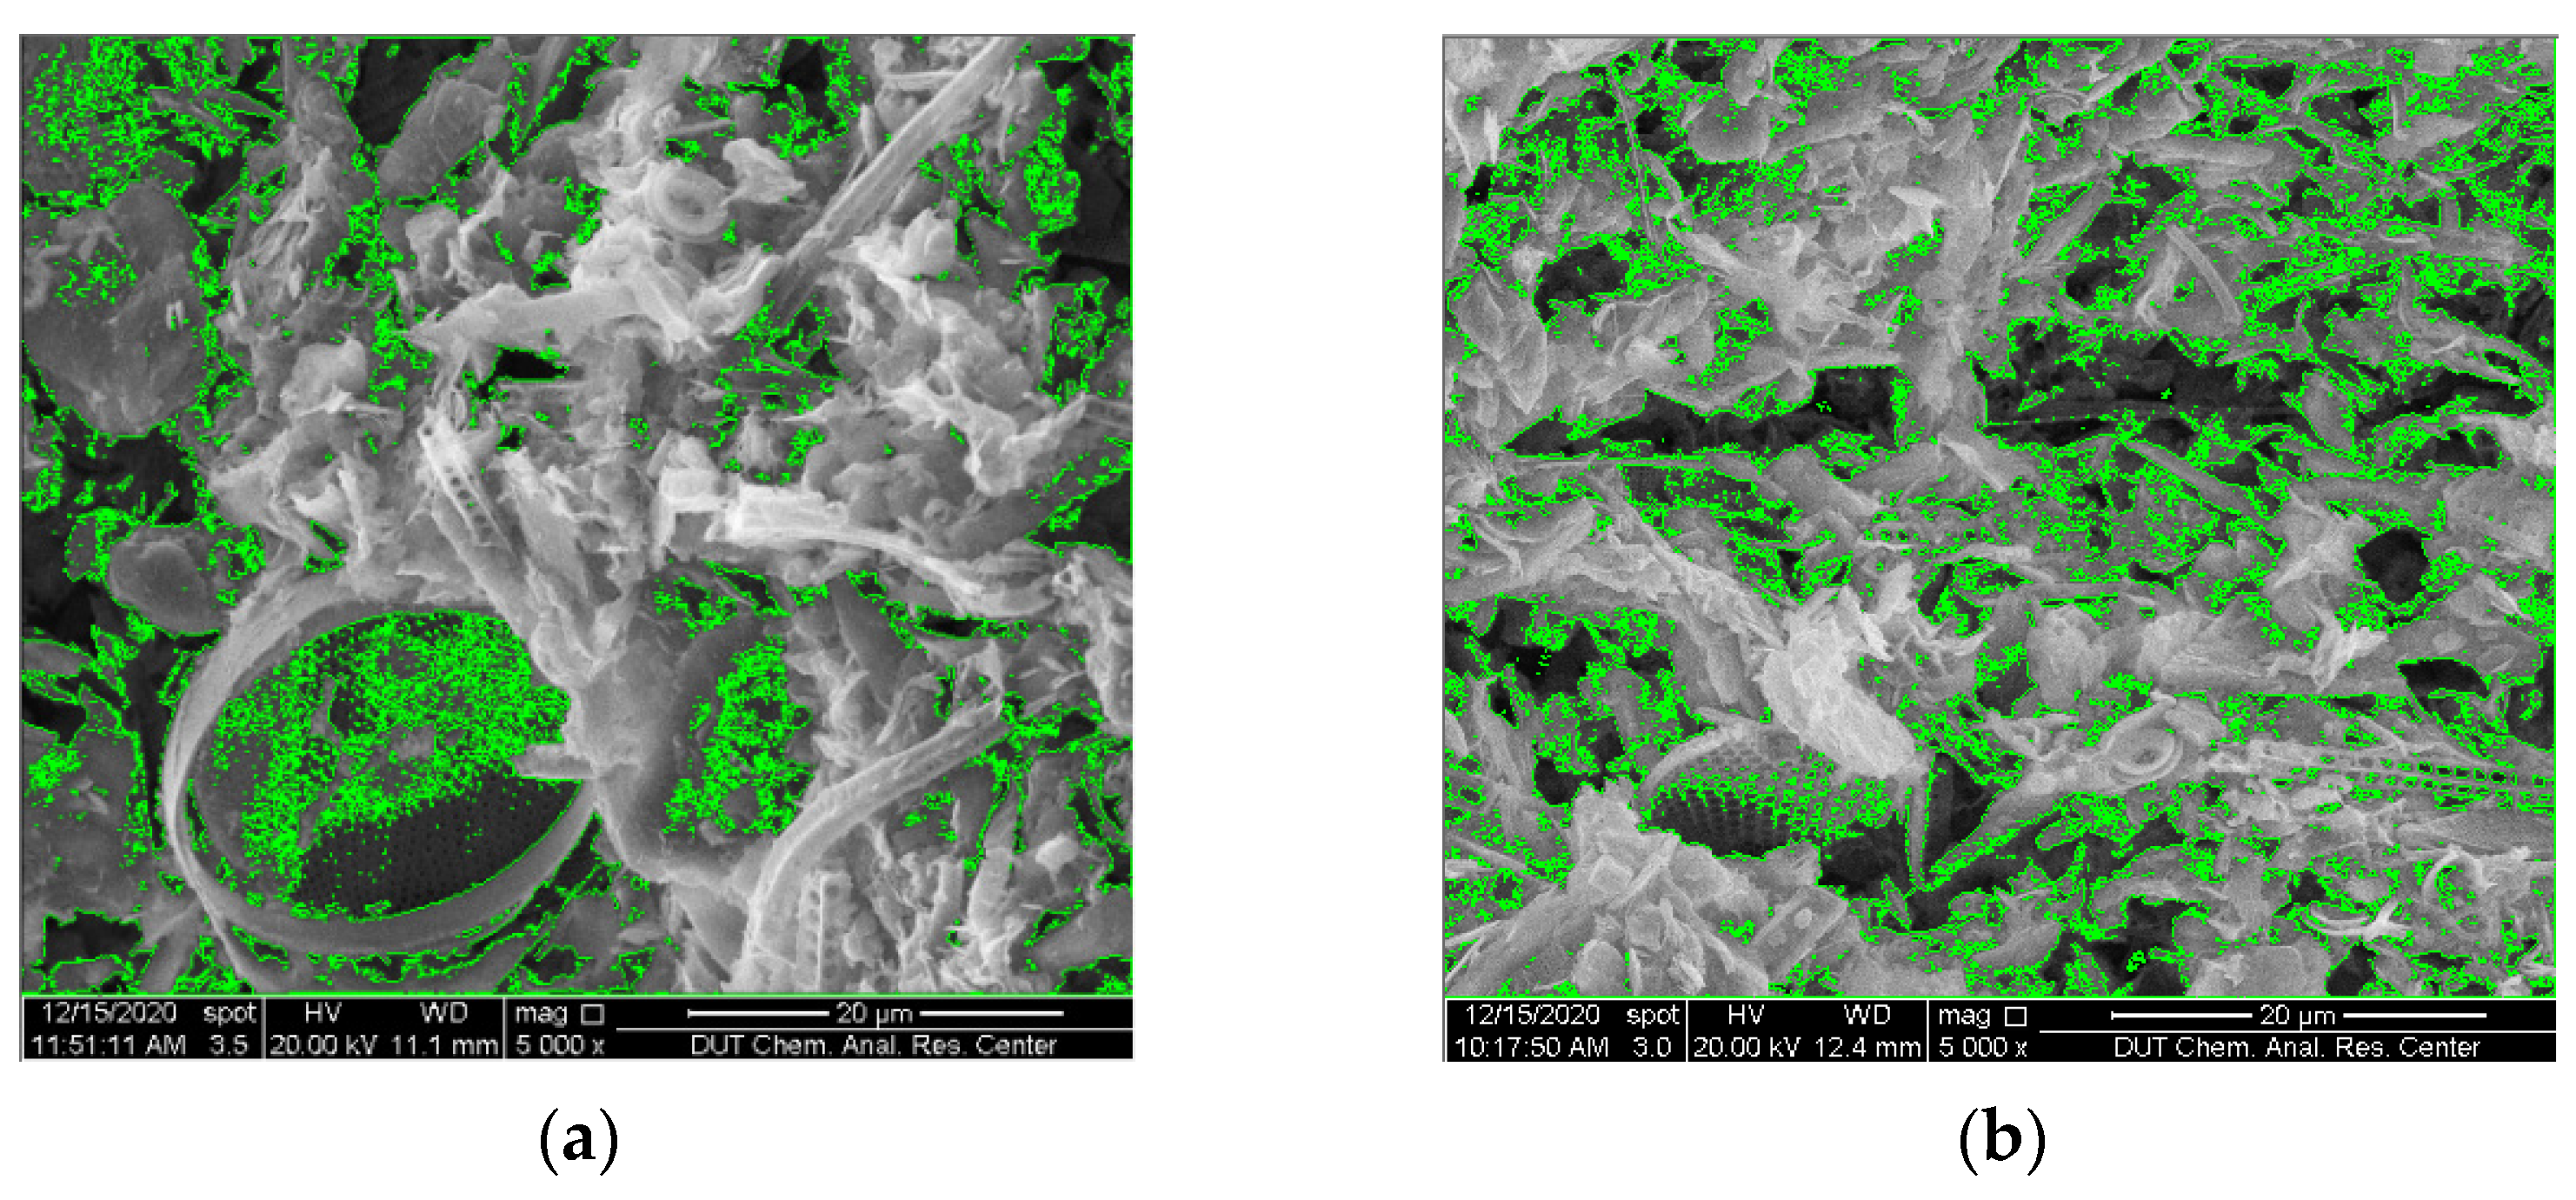
According to the principle of thermal expansion and cold contraction, the clay particles should become closer with decreasing temperatures, and the pores among the sediment segments should decrease. Thus, SEM tests [35] at room and low temperatures were conducted to verify this hypothesis. The green coils are drawn with the pores of the sediment samples. By observing the size and quantity of the green circle of the sediment samples under room temperature and low temperature, we can compare and analyse the pore size under room temperature and low temperature. Unfortunately, the changes in the pores of the sediment segments could not be clearly observed with changes in temperature, as shown in Figure 8, which demonstrated that: (1) the effect of temperature on clay particles was too small to be observed; or (2) the effect was not suitable to be observed at this scale. The shrinkage of clay particles caused by a temperature drop of only 16 °C should be very small, so the pore changes could not be clearly observed in the SEM images.

5.1.2. Effect of Temperature on Bound Water

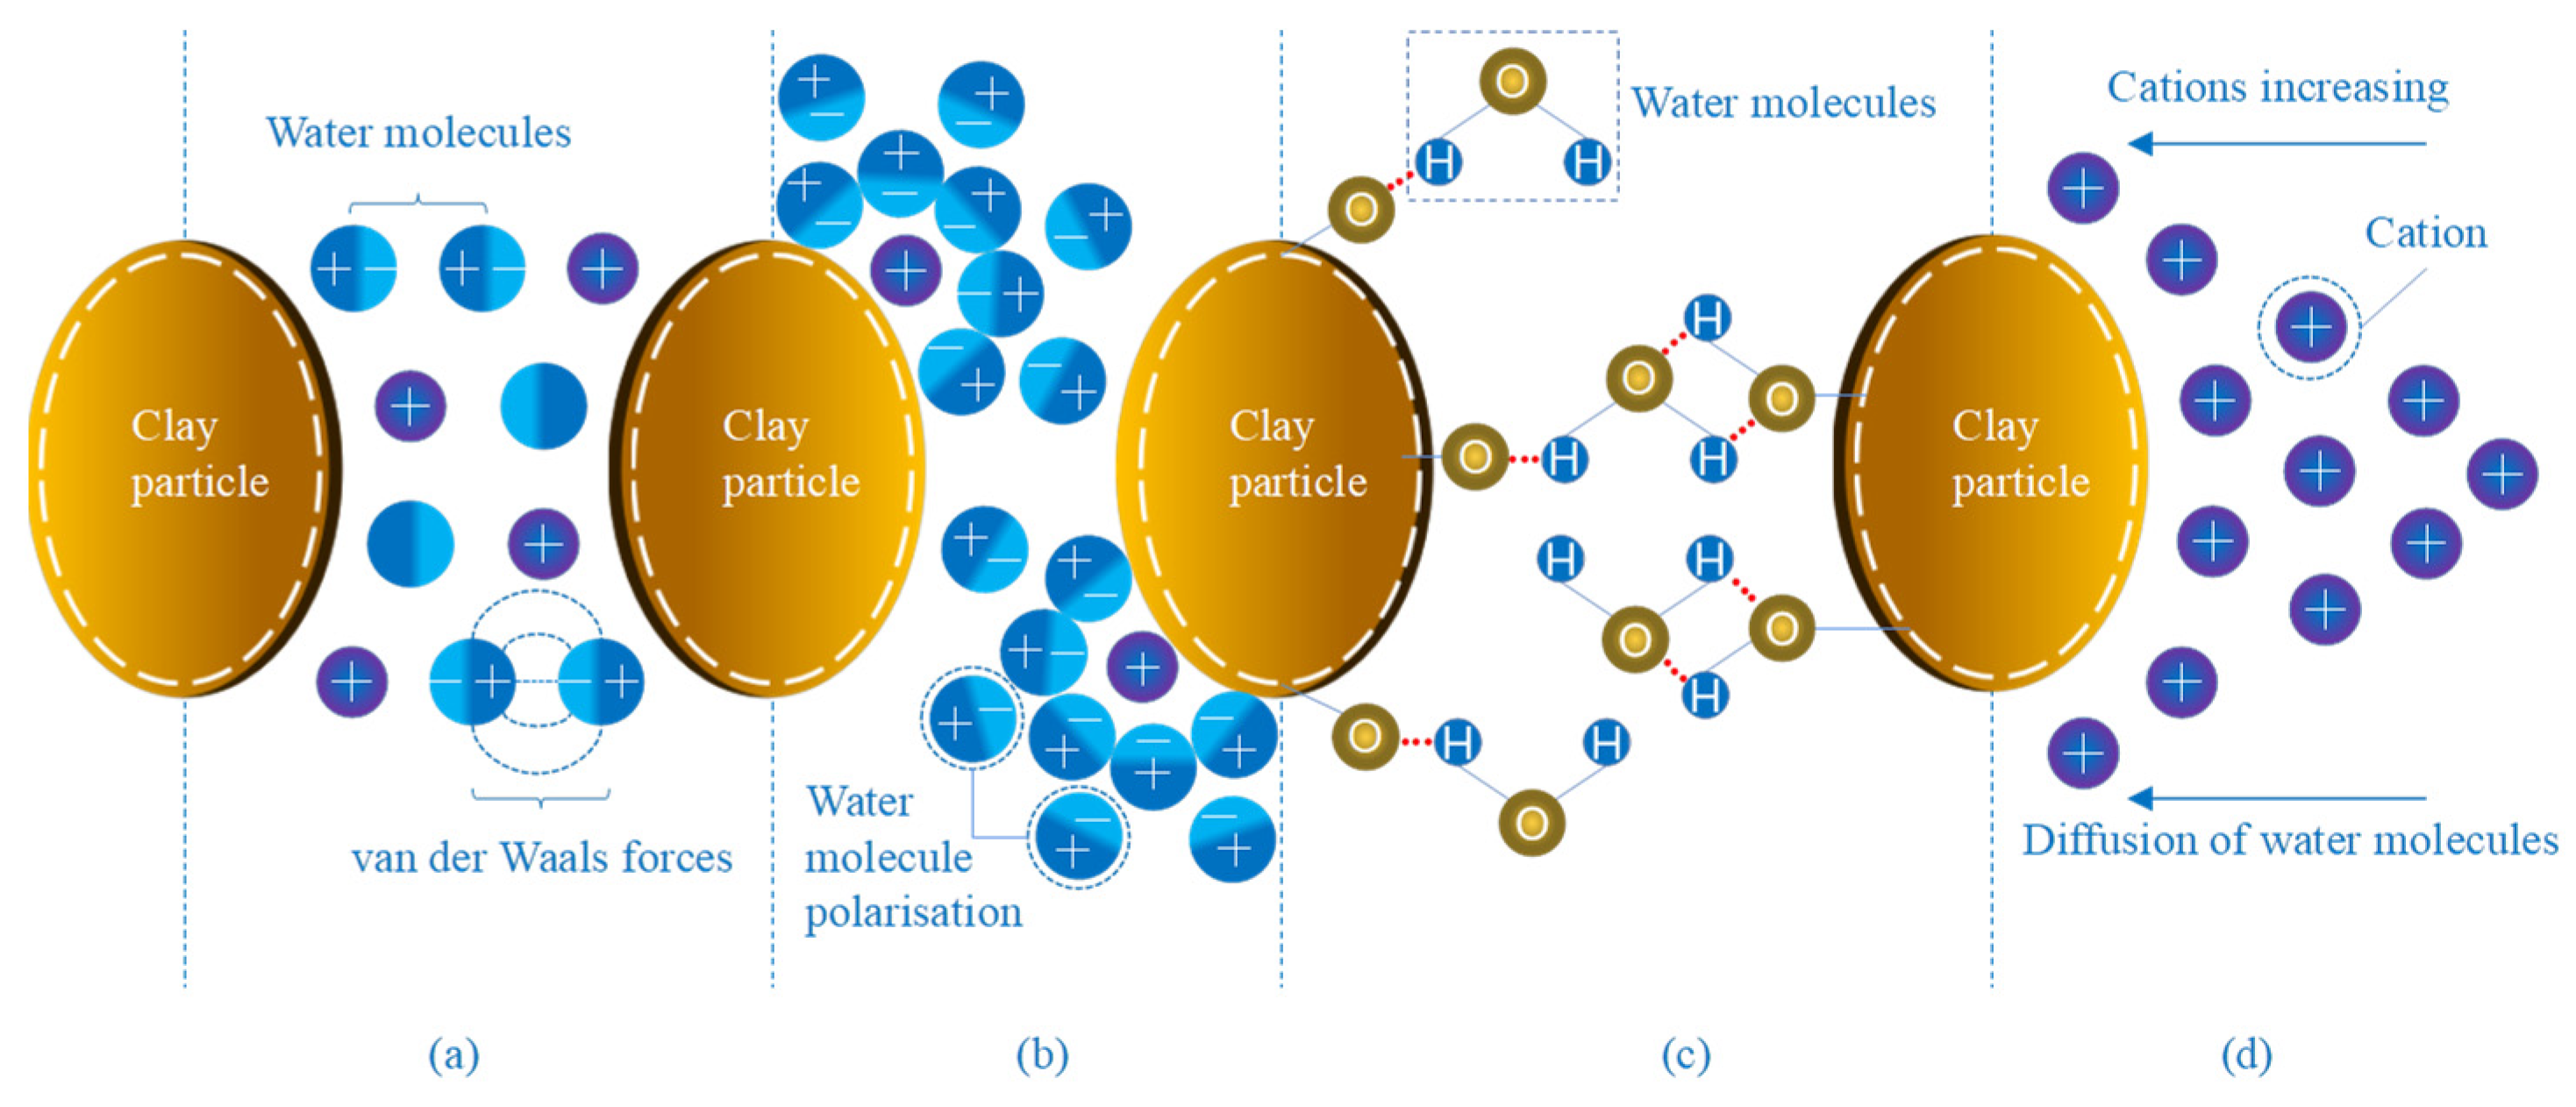
The clay structure includes clay particles and bound water, as illustrated in Figure 9 [36], and the interaction forces between the two are displayed in Figure 10 [37,38]. Clay particles with a negative surface charge attract and collect cations and polar water molecules around them under the influence of electrostatic forces, upon interacting with the pore fluid. The cations and polar water molecules are subjected to three kinds of forces: (1) the electrostatic force, leading to being neatly and closely arranged on the surface of the clay particles; (2) the diffusion force of cations and polar water molecules caused by thermal movement, which leads them to diffuse to the free water layer; and (3) van der Waals forces, as illustrated in Figure 10a.
Likewise, cations can also attract polar water molecules by electrostatic attraction to form hydrated cations, which are capable of transporting water molecules to adsorb on clay particles, as shown in Figure 10b. Furthermore, clay mineral crystal cells are generally exposed to oxygen at the bottom of a silicon–oxygen tetrahedron or hydrogen–oxygen at the bottom of an octahedron, which attract the positive and negative ends of water molecules, respectively, to form hydrogen bonds. As a result, water molecules are attracted to the surfaces of clay particles, as shown in Figure 10c. In addition, as the concentration of cations on the surface of the clay particles increases, the water molecules continue to penetrate and diffuse towards its surface, as depicted in Figure 10d.
As shown in Figure 10, the electrostatic force is the most important force between clay particles and water molecules in the strongly bound layer, while penetration and van der Waals forces gradually become the main forces in the weakly bound water layer. In strongly bound water layers, as the temperature decreases from 20 °C to 4 °C, the thermal movement of cations and water molecules in the pore fluid decreases, which leads to a decrease in the diffusion tendency. Therefore, the distance between cations or water molecules and clay particles becomes shorter, which leads to an increase in electrostatic forces. Many scholars have already illustrated that the hydrogen bonds between water molecules and clay particles become stronger with decreasing temperature [39,40]. Similarly, in weakly bound water layers, lower temperatures increase the van der Waals force between polarized molecules [41]. Therefore, it can be inferred that the strength of bond water in the clay structure increases with decreasing temperature, which in turn represents an increase in the undrained shear strength of the sediment segments.

5.2. Effect of Temperature on Free Water

Free water is a typical Newtonian fluid whose viscosity increases rapidly as the temperature decreases. It shows a 54.5% increase in water viscosity as the temperature decreases from 20 °C to 4 °C according to Guo et al. [42]. Considering that the penetration tests in this study were performed under undrained conditions, it is reasonable to infer that the undrained shear strength of sediment segments increases with increasing viscosity of water, which explains the increase in undrained shear strength at low temperatures.

5.3. Summary of the Temperature Effect Mechanism

Through the above analysis, it can be determined that the clay structure and free water are affected when the temperature is reduced from 20 °C to 4 °C. In the clay structure, the volume change in clay particles is too small to be observed with the decrease in temperature, but the strength of bound water is improved due to the increases in electrostatic forces, van der Waals forces, and hydrogen bonds. In free water, the viscosity of water increases rapidly with decreasing temperature. For these two reasons, the undrained shear strength of the sediment segments increases at low temperatures.

6. Conclusions

For the deep-sea clay samples from the South China Sea, the basic physical parameters of sediment segments were first determined, and then six penetration tests were performed by the mini-ball method at low (4 °C) and room (20 °C) temperatures. Finally, the mechanism of the influence of temperature on the undrained shear strength of the sediment segments was revealed. The main conclusions are as follows:
(1)
The undrained shear strength of the sediment segments tested by the mini-ball method showed a 14.1–30.0% increase with decreasing temperature from 20 °C to 4 °C, which was consistent with the research of Gue et al. and Lunne et al.;
(2)
In the clay structure, both the clay particles and the bound water were affected by temperature. As the temperature decreased from 20 °C to 4 °C, based on SEM tests, the clay particles were less affected by temperature. However, the increases in electrostatic forces, hydrogen bonds between the clay particles and water molecules, and van der Waals forces between the water molecules led to an increase in the strength of the bound water, which was manifested as an increase in the undrained shear strength of the clay;
(3)
The free water in sediment segments was also affected by temperature. As the temperature decreased from 20 °C to 4 °C, the viscosity of the free water increased by 54.5%, which increased the undrained shear strength of the sediment segments.

Author Contributions

Conceptualization, T.N. and Z.G.; formal analysis, Z.G., X.G. and T.N.; investigation, T.N. and X.G.; resources, Y.J. and T.N.; data curation, Z.G., X.G. and H.J.; writing—original draft preparation, Z.G., X.G. and H.J.; writing—review and editing, X.G. and H.J.; supervision, T.N. and Y.J.; funding acquisition, T.N. and Y.J. All authors have read and agreed to the published version of the manuscript.

Funding

This research was funded by the National Key Research and Development Program of China (No. 2018YFC0309200) and the National Natural Science Foundation of China (Nos. 41831280, 51879036, and 52079020).

Institutional Review Board Statement

Not applicable.

Informed Consent Statement

Not applicable.

Data Availability Statement

Not applicable.

Acknowledgments

We thank Wei Zhao provided the Mini-ball and the help of Hao Zhang, Xinchang Liao, and Guodong Wang in the experiments.

Conflicts of Interest

The authors declare no conflict of interest.

References

  1. Guo, X.; Nian, T.; Wang, D.; Gu, Z. Evaluation of undrained shear strength of surficial marine clays using ball penetration-based CFD modelling. Acta Geotech. 2022, 17, 1627–1643. [Google Scholar] [CrossRef]
  2. Fan, N.; Jiang, J.; Dong, Y.; Guo, L.; Song, L. Approach for evaluating instantaneous impact forces during submarine slide-pipeline interaction considering the inertial action. Ocean Eng. 2022, 245, 110466. [Google Scholar] [CrossRef]
  3. Nian, T.; Guo, X.; Fan, N.; Jiao, H.; Li, D. Impact forces of submarine landslides on suspended pipelines considering the low-temperature environment. Appl. Ocean Res. 2018, 81, 116–125. [Google Scholar] [CrossRef]
  4. Amon, D.; Gobin, J.; Van Dover, C.; Levin, L.; Marsh, L.; Raineault, N. Characterization of methane-seep communities in a deep-sea area designated for oil and natural gas exploitation off Trinidad and Tobago. Front. Mar. Sci. 2017, 4, 342. [Google Scholar] [CrossRef] [Green Version]
  5. Guo, X.; Stoesser, T.; Nian, T.; Jia, Y.; Liu, X. Effect of pipeline surface roughness on peak impact forces caused by submarine mudflow. Ocean Eng. 2022, 243, 110184. [Google Scholar] [CrossRef]
  6. Al-Umar, M.; Fall, M.; Daneshfar, B. GIS-based modelling of snowmelt-induced landslide susceptibility of sensitive marine clays. Geoenviron. Disasters 2020, 7, 9. [Google Scholar] [CrossRef] [Green Version]
  7. Nian, T.; Shen, Y.; Zheng, D.; Lei, D. Research advances on the chain disasters of submarine landslides. J. Eng. Geol. 2021, 29, 1657–1675. [Google Scholar]
  8. Nian, T.; Song, X.; Zhao, W.; Jiao, H.; Guo, X. Submarine slope failure due to overpressure fluid associated with gas hydrate dissociation. Environ. Geotech. 2020, 9, 108–123. [Google Scholar] [CrossRef]
  9. Fu, C.; Nian, T.; Guo, X.; Gu, Z.; Zheng, D. Investigation on responses and capacity of offshore pipelines subjected to submarine landslides. Appl. Ocean Res. 2021, 117, 102904. [Google Scholar] [CrossRef]
  10. Guo, X.; Nian, T.; Zhao, W.; Gu, Z.; Liu, C.; Liu, X.; Jia, Y. Centrifuge experiment on the penetration test for evaluating undrained strength of deep-sea surface soils. Int. J. Min. Sci. Technol. 2022, 32, 363–373. [Google Scholar] [CrossRef]
  11. Coffin, S.; Weisberg, S.; Rochman, C.; Kooi, M.; Koelmans, A. Risk Characterization of Microplastics in San Francisco Bay, California. Microplast. Nanoplast. 2022, 2, 9. [Google Scholar] [CrossRef]
  12. Lunne, T. The CPT in offshore soil investigations-a historic perspective. In Proceedings of the 2nd International Symposium on Cone Penetration Testing, Hundtington Beach, CA, USA, 9–11 May 2010. [Google Scholar]
  13. Jin, C.; Wang, J. A preliminary study of the gas hydrate stability zone in the South China Sea. Acta Geol. Sin.-Engl. Ed. 2002, 76, 423–428. [Google Scholar] [CrossRef]
  14. Mitchell, J. Shearing resistance of soils as a rate process. J. Soil Mech. Found. Div. 1964, 90, 29–61. [Google Scholar] [CrossRef]
  15. Perkins, S.; Sjursen, M. Effect of cold temperatures on properties of unfrozen Troll clay. Can. Geotech. J. 2009, 46, 1473–1481. [Google Scholar] [CrossRef]
  16. Gue, C.; Lunne, T.; Perkins, S. Temperature effects on laboratory measured strength on deep water soft clays. In Frontiers in Offshore Geotechnics III, Proceedings of the 3rd International Symposium on Frontiers in Offshore Geotechnics (ISFOG 2015); Taylor & Francis Books Ltd.: Abingdon, UK, 2015; Volume 1, pp. 1055–1060. [Google Scholar]
  17. Kelleher, P.; Randolph, M. Seabed geotechnical characterization with a ball penetrometer deployed from the portable remotely operated drill. In Proceedings of the International Symposium on Frontiers in Offshore Geotechnics (ISFOG), Perth, WA, Australia, 19–21 August 2005; pp. 365–371. [Google Scholar]
  18. Yafrate, N.; DeJong, J.; DeGroot, D.; Randolph, M. Evaluation of remoulded shear strength and sensitivity of soft clay using full-flow penetrometers. J. Geotech. Geoenviron. Eng. 2009, 135, 1179–1189. [Google Scholar] [CrossRef]
  19. Low, H.; Randolph, M.; Lunne, T.; Andersen, K.; Sjursen, M. Effect of soil characteristics on relative values of piezocone, T-bar and ball penetration resistances. Géotechnique 2011, 61, 651–664. [Google Scholar] [CrossRef]
  20. Lunne, T.; Andersen, K.; Low, H.; Randolph, M.; Sjursen, M. Guidelines for offshore in situ testing and interpretation in deepwater soft clays. Can. Geotech. J. 2011, 48, 543–556. [Google Scholar] [CrossRef]
  21. DeJong, J.; Yafrate, N.; DeGroot, D.; Low, H.; Randolph, M. Recommended practice for full-flow penetrometer testing and analysis. Geotech. Test. J. 2010, 33, 137–149. [Google Scholar] [CrossRef]
  22. DeJong, J.; Yafrate, N.; DeGroot, D. Evaluation of undrained shear strength using full-flow penetrometers. J. Geotech. Geoenviron. Eng. 2011, 137, 14–26. [Google Scholar] [CrossRef]
  23. Long, M.; Colreavy, C.; Ward, D.; Quigley, P. Piezoball tests in soft Irish clays. In Proceedings of the 3rd International Symposium on Cone Penetration Testing, Las Vegas, NV, USA, 13–14 May 2014; Volume 14. [Google Scholar]
  24. Stewart, D. A new site investigation tool for the centrifuge. In Proceedings of the International Conference Centrifuge 91, Boulder, Colorado, 13–14 January 1991. [Google Scholar]
  25. Stewart, D.; Randolph, M. T-bar penetration testing in soft clay. J. Geotech. Eng.-ASCE 1994, 120, 2230–2235. [Google Scholar] [CrossRef]
  26. Randolph, M.; Hefer, P.; Geise, J.; Watson, P. Improved seabed strenght profiling using T-bar penetrometer. In Offshore Site Investigation and Foundation Behaviour: New Frontiers, Proceedings of the International Conference, London, UK, 22–24 September 1998; Society of Underwater Technology: London, UK, 1998. [Google Scholar]
  27. GB/T 50145-2007; Standard for Engineering Classification of Soil. China National Standards: Beijing China, 2007.
  28. ASTM D2487-00; Standard Practice for Classification of Soils for Engineering Purposes (Unified Soil Classification System). American Society for Testing and Materials (ASTM): West Conshohocken, PA, USA, 2000.
  29. Lehane, B.; O’loughlin, C.; Gaudin, C.; Randolph, M. Rate effects on penetrometer resistance in kaolin. Géotechnique 2009, 59, 41–52. [Google Scholar] [CrossRef]
  30. Zhou, M.; Hossain, M.; Hu, Y.; Liu, H. Behaviour of ball penetrometer in uniform single-and double-layer clays. Géotechnique 2013, 63, 682–694. [Google Scholar] [CrossRef]
  31. Martin, C.; Randolph, M. Upper-bound analysis of lateral pile capacity in cohesive soil. Géotechnique 2006, 56, 141–145. [Google Scholar] [CrossRef]
  32. Nguyen, T.; Chung, S. Ball penetration test for characterization of soft clays. Proc. Inst. Civ. Eng.-Geotech. Eng. 2018, 171, 133–146. [Google Scholar] [CrossRef]
  33. Liu, J.; Chen, X.; Han, C.; Wang, X. Estimation of intact undrained shear strength of clay using full-flow penetrometers. Comput. Geotech. 2019, 115, 103161. [Google Scholar] [CrossRef]
  34. Lunne, T.; Gue, C.; Perkins, S.; Selvig, M. Temperature effects on laboratory strength measured on soft clays sampled in deepwater and cold environments. In Offshore Site Investigation and Geotechnics: Integrated Technologies-Present and Future; Society of Underwater Technology: London, UK, 2012. [Google Scholar]
  35. Nian, T.; Jiao, H.; Fan, N.; Guo, X. Microstructure analysis on the dynamic behavior of marine clay in the South China Sea. Mar. Geores. Geotechnol. 2020, 38, 349–362. [Google Scholar] [CrossRef]
  36. Kong, J.; Gao, X.; Xiao, J.; Wei, H.; Tian, H.; Sun, J.; Lv, C. Soil Mechanics and Foundations; China Electric Power Press: Beijing, China, 2015. [Google Scholar]
  37. Li, G. Advanced Soil Mechanics, 2nd ed.; Tsinghua University Press: Beijing, China, 2016. [Google Scholar]
  38. Liu, G.; Liu, H.; Gong, X.; Zhang, J. Geotechnics and Soil Mechanics; Science Press: Beijing, China, 2009. [Google Scholar]
  39. Muller, N.; Reiter, R. Temperature dependence of chemical shifts of protons in hydrogen bonds. J. Chem. Phys. 1965, 42, 3265–3269. [Google Scholar] [CrossRef]
  40. Raiteri, P.; Laio, A.; Parrinello, M. Correlations among hydrogen bonds in liquid water. Phys. Rev. Lett. 2004, 93, 087801. [Google Scholar] [CrossRef]
  41. Parsegian, V.; Ninham, B. Temperature-dependent van der Waals forces. Biophys. J. 1970, 10, 664–674. [Google Scholar] [CrossRef] [Green Version]
  42. Guo, X.; Nian, T.; Wang, Z.; Zhao, W.; Fan, N.; Jiao, H. Low-temperature rheological behaviour of submarine mudflows. J. Waterw. Port Coast. Ocean Eng. 2020, 146, 04019043. [Google Scholar] [CrossRef]
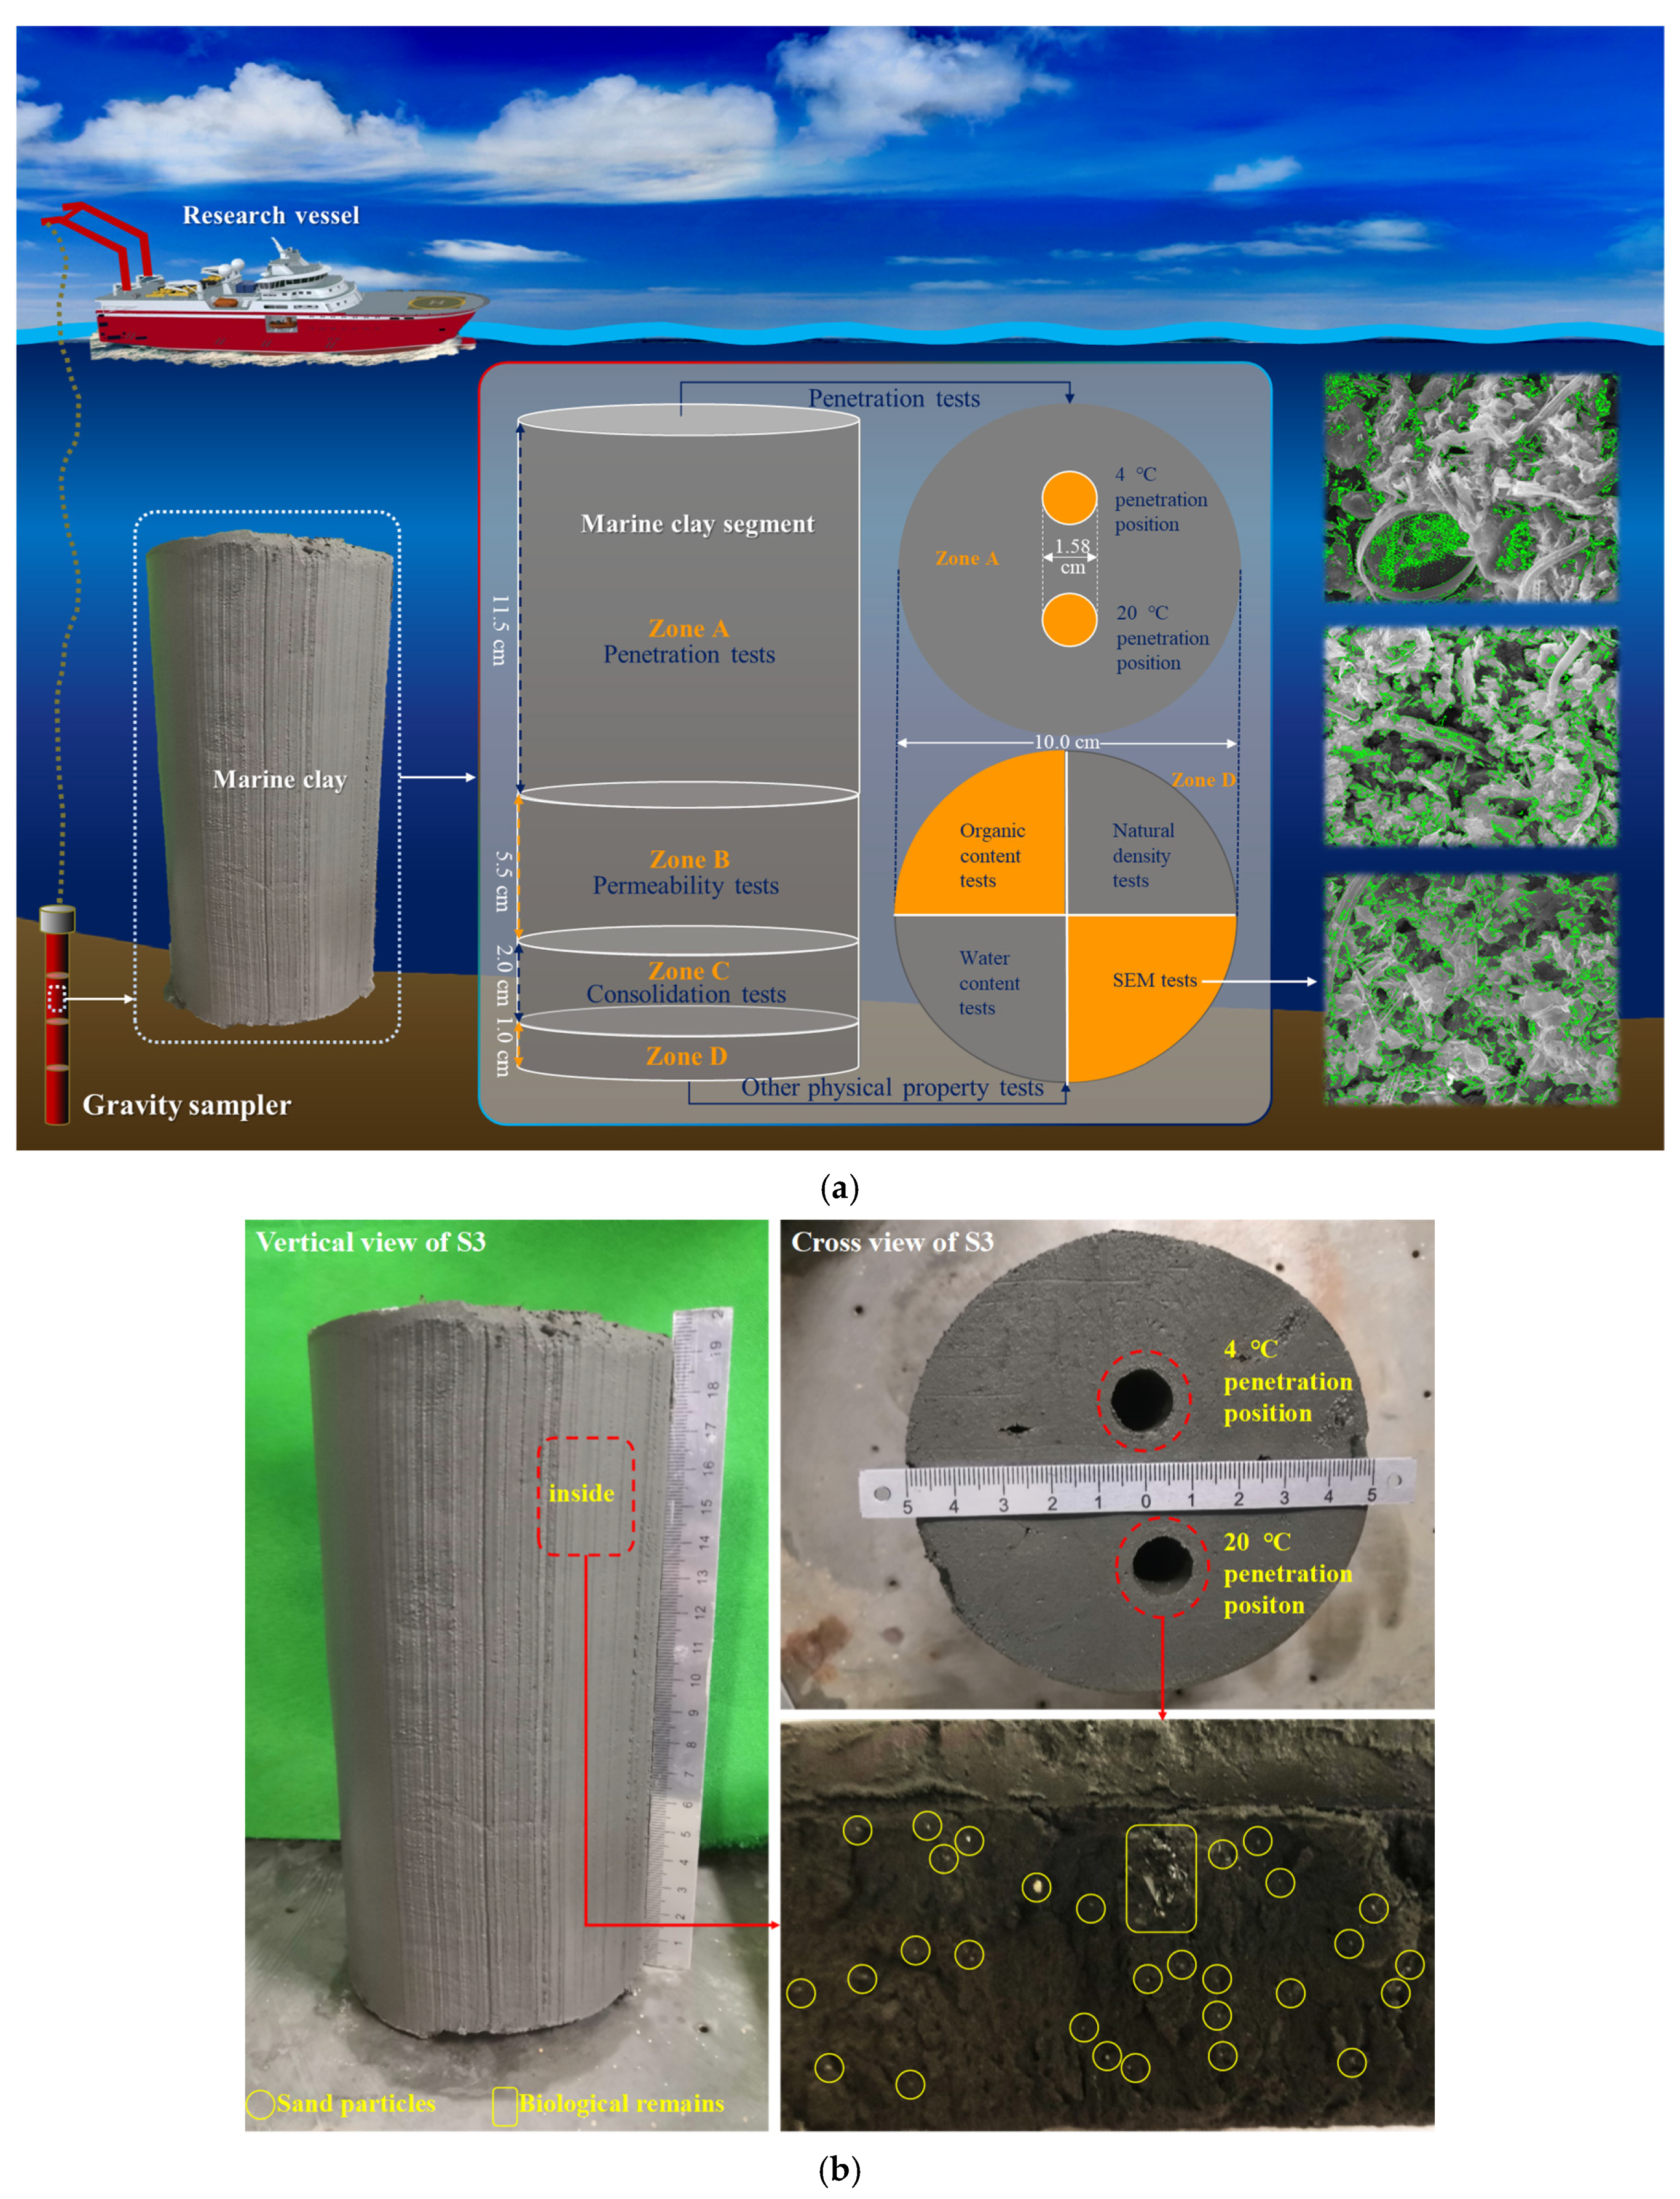
Figure 1. Diagram and physical map of the sediment segments: (a) Schematic diagram of the spatial layout of penetration and physical property tests of each sediment segment; (b) Physical map of a 100–150 cm sediment segment (S3).
Jmse 10 01424 g001
Figure 2. SEM images of the 0–20 cm sediment segment S1 at different magnifications: (a) 1000×; (b) 5000×; (c) 10000×.
Jmse 10 01424 g002
Figure 3. Average grain size distribution curve of the six sediment segments.
Jmse 10 01424 g003
Figure 4. Mini-ball penetration tests in the constant temperature laboratory: (a) Control box; (b) Test instrument; (c) Data acquisition instrument; (d) Data monitor.
Jmse 10 01424 g004
Figure 5. Temperature calibration of the load cell at 20 °C and 4 °C: (a) Pressure calibration at 20 °C; (b) Pressure calibration at 4 °C.
Jmse 10 01424 g005
Figure 6. Normalized velocity for each sediment segment.
Jmse 10 01424 g006
Figure 7. Undrained shear strength and difference in strength caused by temperature for six sediment segments at 20 °C and 4 °C: (a) 0–20 cm sediment segment S1; (b) 50–70 cm sediment segment S2; (c) 100–120 cm sediment segment S3; (d) 150–170 cm sediment segment S4; (e) 200–220 cm sediment segment S5; and (f) 250–270 cm sediment segment S6.
Jmse 10 01424 g007aJmse 10 01424 g007bJmse 10 01424 g007c
Figure 8. SEM images of the five sediment segments at 20 °C and 4 °C (pores of sediment segments represented by the green outlines): (a) S1 at 20 °C; (b) S1 at 4 °C; (c) S2 at 20 °C; and (d) S2 at 4 °C.
Jmse 10 01424 g008aJmse 10 01424 g008b
Figure 9. Bound water around a clay particle (reproduced with permission from from Kong et al., Soil Mechanics and Foundations; published by China Electric Power Press: Beijing, China, 2015 [36]).
Jmse 10 01424 g009
Figure 10. Interaction forces between clay particles and water (reproduced with permission from from Li., Advanced Soil Mechanics; 2nd ed.; published by Tsinghua University Press: Beijing, China, 2016. [37], and Liu et al., published by Geotechnics and Soil Mechanics; published by Science Press: Beijing, China, 2009 [38]).
Jmse 10 01424 g010
Table 1. Physical properties of the six sediment segments.
Clay
Segments
DepthWater Content
(w)
Density
(ρ)
Plastic Limit
(wP)
Liquid Limit
(wL)
Plastic Index
(IP)
Liquid Index
(IL)
Compression Coefficient
(a)
Permeability Coefficient
(k)
Organic ContentMean Grain Size
(D50)
Specific Gravity
(GS)
cm%g/cm3%%--MPa−110−7 cm/s%μm-
S10–2097.621.4836.7564.4227.672.201.043.622.7117.5682.65
S250–7093.851.6033.4056.6423.242.601.262.832.2428.777
S3100–12087.011.5235.2960.8225.532.031.583.292.1748.6632.78
S4150–17090.731.5035.7258.9123.192.371.203.542.0423.456
S5200–22093.621.4534.7456.7021.962.681.224.671.9220.1362.74
S6250–270109.331.4935.7357.8222.093.331.004.762.0723.827
Table 2. Penetration resistance factors (NBall) from different studies.
Detail InformationNBallResearchers
Soft massive clay and shelly massive clay.
DIS-2 and DIS-5, located in the floodplain of the Nakdong River delta, west of Busan, Korea.
12.09–12.21Nguyen and Chung [32]
Irish clay, located in Athlone, Belfast, Lough Erne12.00Long et al. [23]
Onshore sites: Onsøy (Norway), Burswood (Australia), Ariake (Japan)
Offshore sites: West Africa, Norwegian Sea, Timor Sea, and offshore Egypt
12.00–12.38Low et al. [19]
Kaolin clay, Laboratory tests (1 g)12.50Liu et al. [33]
Table 3. Temperature effect on the undrained shear strength of deep-sea sediment segments.
Clay
Segments
Depth
(cm)
δ (%)
Max.Min.Ave. (δT)
S10–2017.517.117.3
S250–7017.310.814.1
S4150–17030.629.430.0
S5200–22020.215.117.7
S6250–27021.420.721.1
Notes: δ is the normalized effect of temperature on the undrained shear strength (%), which can be obtained by Equation (5a); δT is also the normalized effect of temperature on undrained shear strength (%), which could eliminate the effect caused by the inhomogeneity of the clay and can be obtained by Equation (5b).
Publisher’s Note: MDPI stays neutral with regard to jurisdictional claims in published maps and institutional affiliations.