Article

Sediment Waves on the Western Slope of the Chukchi Rise (Arctic Ocean) and Their Implications for the Paleoenvironment

1
Key Laboratory of Marine Geology and Metallogeny, First Institute of Oceanography, Ministry of Natural Resources, Qingdao 266061, China
2
Qingdao National Laboratory for Marine Science and Technology, No. 1 Wenhai Road, Jimo City, Qingdao 266237, China
3
Key Laboratory of Marine Science and Numerical Modeling, First Institute of Oceanography, Ministry of Natural Resources, Qingdao 266061, China
4
National Deep Sea Center, Ministry of Natural Resources, No. 1 Weiyang Road, Jimo City, Qingdao 266237, China
*
Author to whom correspondence should be addressed.
J. Mar. Sci. Eng. 2022, 10(11), 1586; https://doi.org/10.3390/jmse10111586
Submission received: 7 September 2022 / Revised: 15 October 2022 / Accepted: 19 October 2022 / Published: 26 October 2022
(This article belongs to the Special Issue Advances in Marine Engineering: Geological Environment and Hazards)

Abstract

:
Based on multibeam bathymetric data and high-resolution shallow sub-bottom profiles acquired during China’s 10th Arctic Scientific Expedition Cruise in 2019, a sediment wave field was found on the western slope of the Chukchi Rise, in the Arctic Ocean. This sediment wave field developed on the lower slope with water depths of between 1200 m and 1800 m and stretched 15 km in the downslope direction. It comprised several parallel sediment waves, with wavelengths ranging from 700 m to 3400 m and wave heights from 12 m to 70 m. In the vertical direction, well-stratified deposits, tens of meters thick, were affected by sediment waves, which exhibit asymmetric waveforms and upslope migration trends. The morphological and seismostratigraphic characteristics of the sediment waves suggested their genesis as a result of the interaction between the bottom current and seafloor morphology, which was also supported by hydrographical data adjacent to the sediment wave field. It was infered that this bottom current was related to the Arctic Circumpolar Boundary Current, which many researchers suggest flows through the study area.

1. Introduction

A sediment wave is defined as a large-scale (generally between tens of meters and a few kilometers long and several meters high), undulating, depositional bedform that is generated beneath a current flowing at, or close to, the seafloor [1]. The wave-forming current can either be a contour current or a turbidity current in the deep ocean [1,2,3]. Sediment wave formation, which often takes hundreds to thousands of years, represents the long-term response of sedimentation processes to environmental conditions [4], thereby influencing thick strata below the seabed [5]. As such, sediment waves are often clearly displayed on the seabed topography and on shallow strata, and they can be effectively identified using modern technology, such as multibeam bathymetry, sub-bottom profiles, and side-scan sonar. Based on the features of sediment waves in plain view and of vertical stacking patterns, in combination with regional settings, the characteristics of the wave-forming bottom current can be determined [1,6,7] and important information on the modern and palaeoceanographic environment and dynamic processes can be obtained [3]. Most sediment waves are found in deep-sea areas in middle and low latitudes [2,3,7], where research investment is greatest; in higher-latitude sea areas, the sediment waves are mainly found around Antarctica [8,9,10]. In recent years, sediment waves have also been found in some regions around the Arctic, such as the Nordic Seas [11], the Faroe Islands [12,13], off the coast of Greenland [14], and in the Canadian Basin [15].
Multibeam bathymetry and sub-bottom profile data obtained from China’s 10th Arctic Scientific Expedition in 2019 at the protrusion of the western continental slope of the Chukchi Rise (Figure 1b) revealed a sediment wave field [16]. In the same period, scholars from Korea also found evidence of the presence of sediment waves in this area [17], but they did not conduct an in-depth analysis of their characteristics. Considering the unique position of the Chukchi Borderland in the Arctic flow field [18,19,20], studying these sediment waves should aid our understanding of the characteristics of the bottom current, thereby providing useful information on the Arctic Ocean environment.

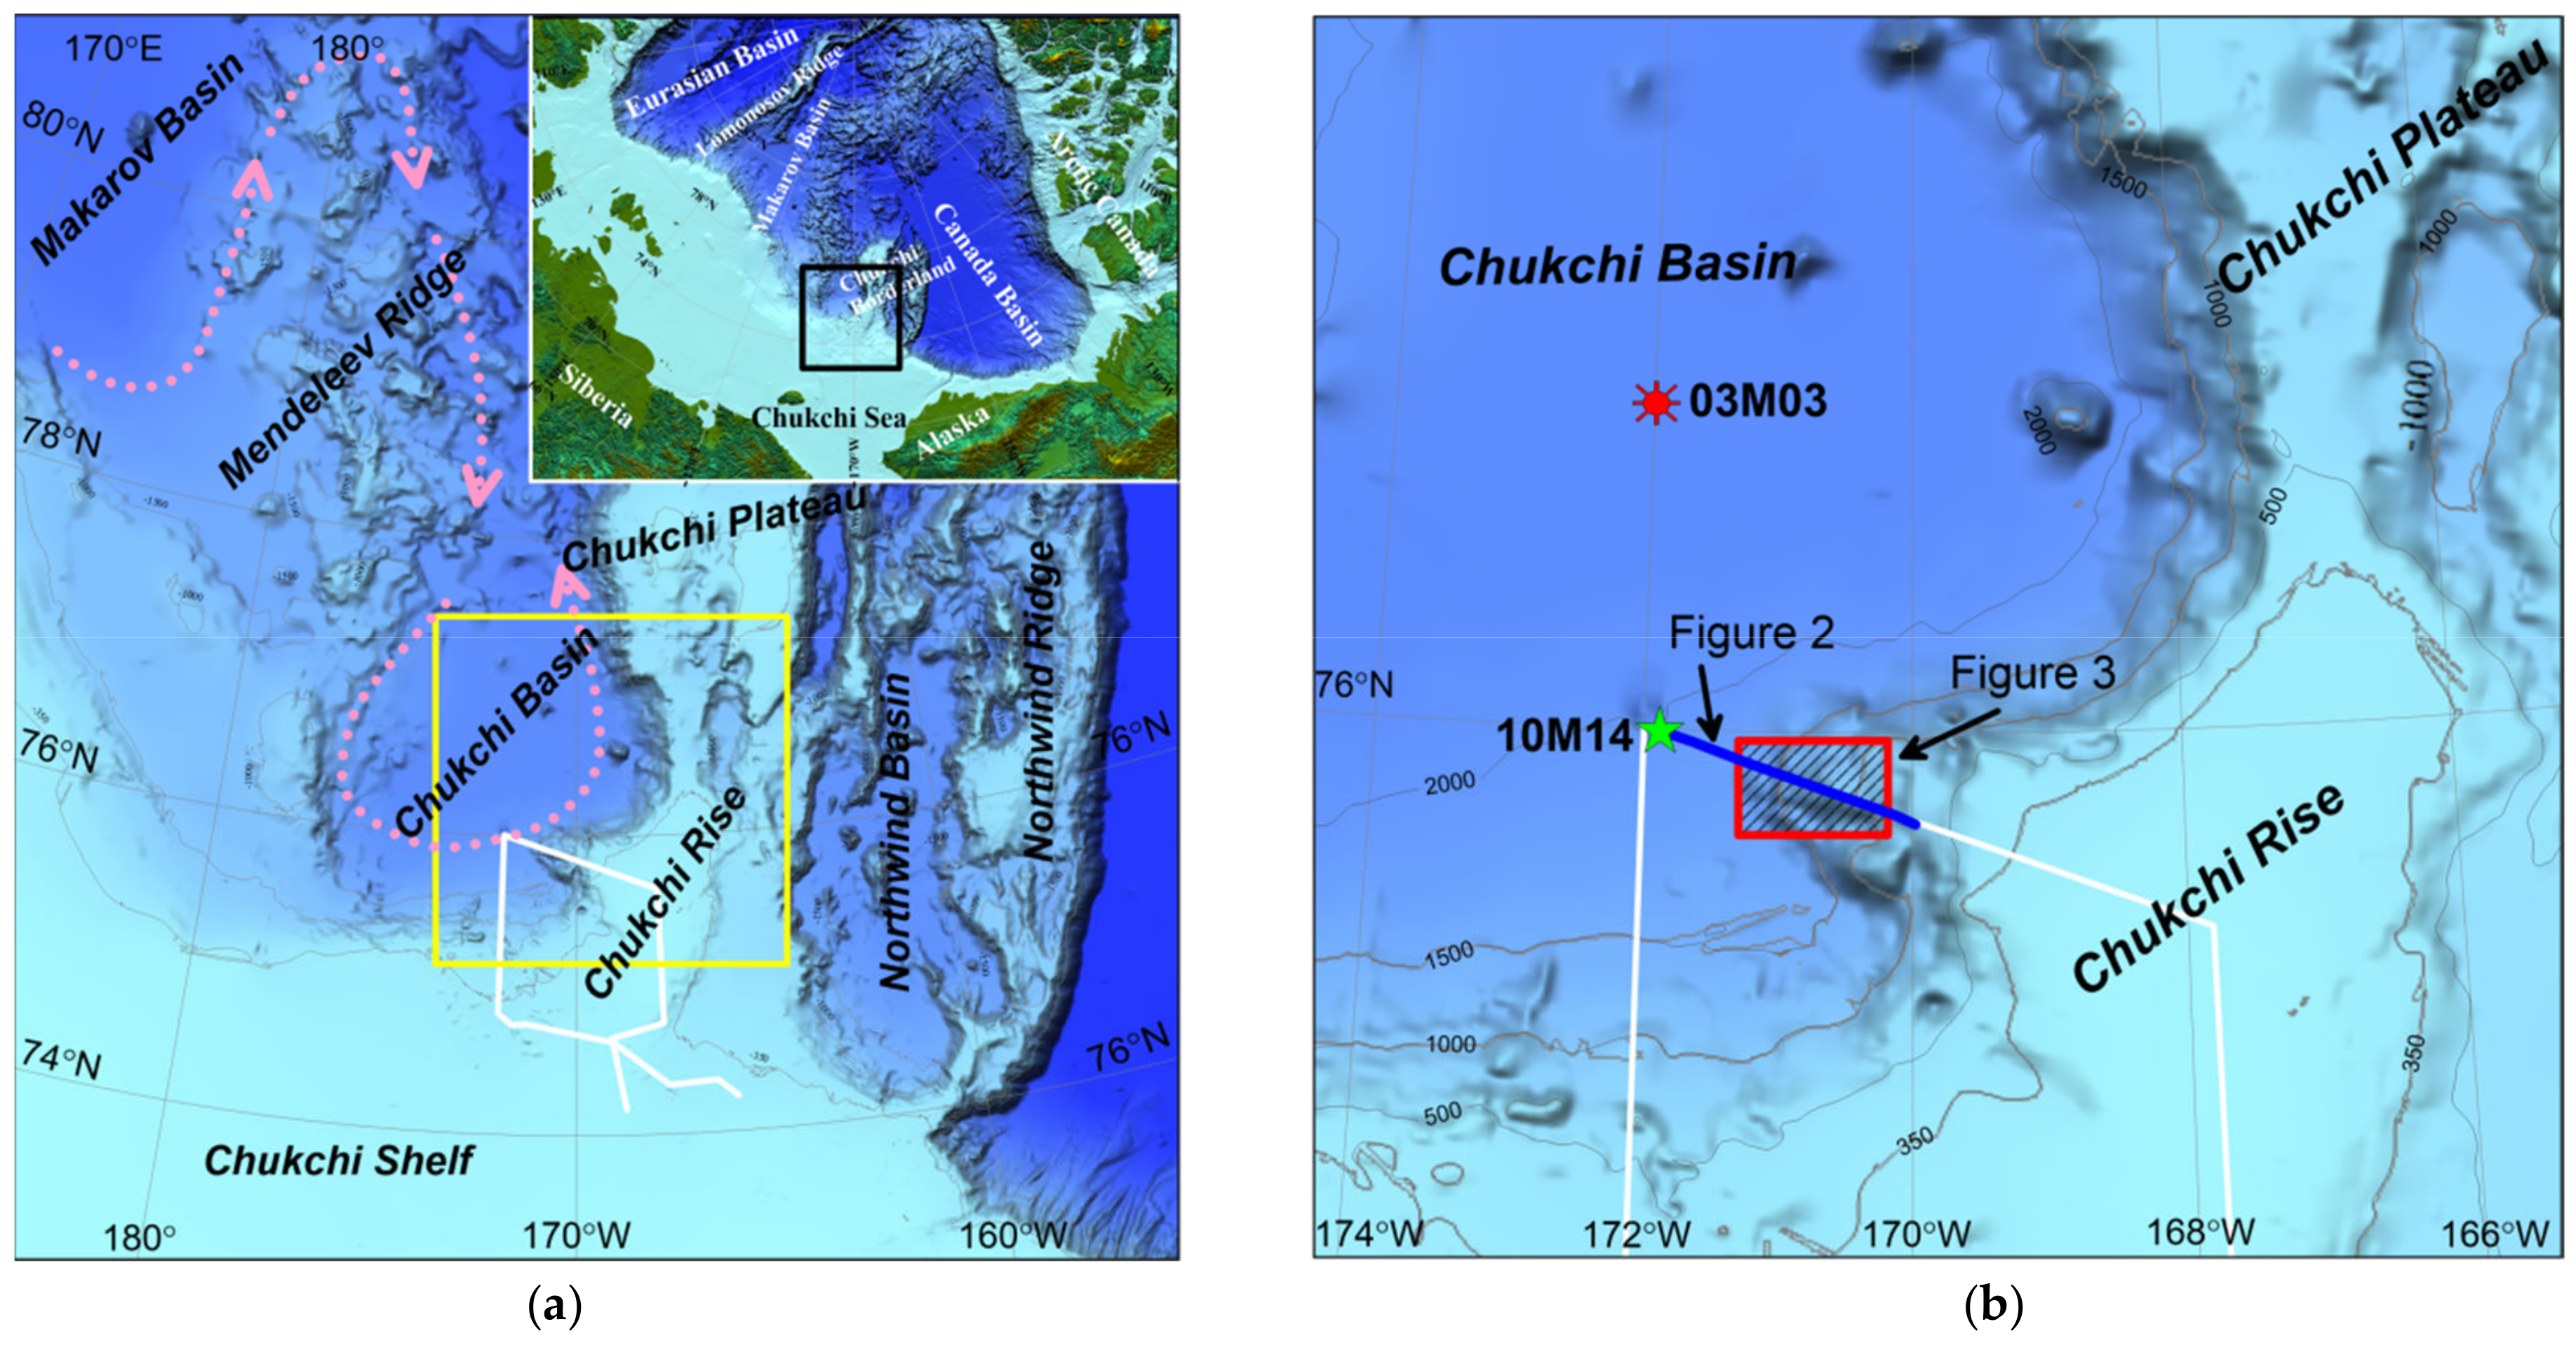
2. Regional Settings

The study area is located at the junction of the Chukchi Borderland and the Chukchi Shelf, in the western Arctic Ocean. The Chukchi Borderland is a large underwater platform extending northward from the Chukchi Shelf into the Amerasian Basin and comprises four geomorphological units: the Chukchi Rise, the Chukchi Plateau, the Northwind Ridge, and the Northwind Basin (Figure 1a). The water depth here changes drastically, ranging from less than 300 m in the Chukchi Rise and the Chukchi Plateau to nearly 3000 m in the Northwind Basin [21]. The Chukchi Rise is adjacent to two deep-water basins, the Northwind Basin in the east and the Chukchi Basin in the west, and is connected in the north to the Chukchi Plateau through a narrow, saddle-shaped underwater depression. The rise is roughly triangular, but, in the middle, a spur-like protrusion extends westward into the Chukchi Basin, forming “W”-shaped contour lines on the continental slope between the Chukchi Rise and the Chukchi Basin (Figure 1b).
The Chukchi Rise developed the Cenozoic strata which is several-hundred-meters-thick and multiple sets of progradational sequences formed from the Oligocene to the Pliocene [22,23]. Glacial sedimentation became dominant in this area during some period of the Quaternary. Many plow marks and mega-scale glacial lineations caused by ice-grounding developed across the shelf breaks. Multistage glaciogenic debris-flow deposits formed on the continental slope and the bottom of the slope, buried by tens of meters of thick hemipelagic deposits [24,25,26,27,28,29].
The oceanographic environment in the study area is heavily influenced by the anticyclonic Beaufort Gyre circulation at the surface, while Pacific and Atlantic water inputs contribute to the intermediate and deep-water masses [18,19,20]. The Atlantic water, which constitutes the bottom current of the Arctic Circumpolar Boundary Current, may reach the Chukchi Borderland after crossing the Mendeleev Ridge and the southern slope of the Chukchi Basin, extending to 1000 m and below, as proposed by Woodgate et al. [30].

3. Methods

In China’s 10th Arctic Scientific Expedition, the research vessel “Xiangyanghong 01” was used to conduct geophysical, geological and hydrological surveys on the southwestern Chukchi Rise and the adjacent Chukchi Basin and Chukchi Shelf (Figure 1a). A hull-mounted multibeam bathymetry system and a sub-bottom profiling system were used to obtain more than 700 km of high-resolution data, revealing the seabed topography and shallow seismostratigraphic structure along the route.

3.1. Multibeam Bathymetry

Seabed topography was measured using a Wärtsilä ELAC SeaBeam 3012 full-ocean-deep multibeam echo-sounder system. The water depth of the working area ranged from 80 to 2500 m, of which the beam coverage width was approximately 3–3.5 times the water depth when the water depth was shallower than 1000 m and approximately 3.5–4 times the water depth when the water depth exceeded 1000 m. During the voyage, an AML Minos series sound velocity profiler was used to acquire the vertical variation in the seawater sound velocity. Caris software was used to perform multibeam data processing and corrections according to the standard workflow, which included parameter correction, navigation data editing, water-depth point-noise editing, tide level correction, and sound speed correction. Then, a built-in combined uncertainty and bathymetry estimator (CUBE) multibeam automatic processing tool was used to construct the CUBE surface and multibeam grid data with a grid spacing of 20 m.

3.2. Sub-Bottom Profiling

A hull-mounted Kongsberg TOPAS PS18 parametric sub-bottom profiler system, which has a high spatial resolution in water depths between less than 20 m and full ocean depth, was used for shallow stratum detection. This system transmits frequency modulation (FM) signals with a frequency band of 2–6 kHz and acquires the returned signals with a sampling rate of 36 kHz and record length of 800 ms. The seabed was tracked automatically according to the water depth input from the multibeam system, and the acquisition delay was adjusted accordingly. Then, the SEGY format record was processed by TRITON software for filtering, automatic gain, reflection interface tracking, and digitization. Because of the lack of sound velocity data on the seabed strata in the study area, a sound velocity of 1500 m/s was used for travel time–depth conversion of the sub-bottom profile, as proposed previously by other authors [24,28]. The penetration depth of the sub-bottom profile ranged from 10 to 80 m, depending mainly on the regional seabed undulation and sediment type. At the top of the Chukchi Rise and the upper part of the neighboring continental slope, the penetration depth was less than 20 m, while on the lower continental slope, where the sediment wave field was located, the penetration depth exceeded 50 m (Figure 2).

3.3. Hydrological Measurement

The hydrographical data (Figure 5) were collected at site 10M14 (171°57.37′ W, 70°01.89′ N, see Figure 1b for location), including lowered acoustic Doppler current profiling (LADCP) and conductivity–temperature–depth (CTD) measurement. The full-depth current profile was obtained by Teledyne RDI Workhorse Sentinel self-contained 300 kHz LADCP. The seawater pressure, in situ temperature, and salinity were measured using a Seabird SBE 911 Plus CTD. The LADCP was bound on the frame of the CTD system, and was lowered down to a depth near the seabed. The “LDEO Implementation” of the velocity-inversion method [31] was used for processing the LADCP data, and the CTD time-series data were included as input parameters; then, the eastward and northward components of the horizontal velocity of the current could be figured out.

4. Results

4.1. Echo Character Type and Distribution along the Slope

In Figure 2, the sub-bottom profiling data show the stratal geometries, internal structure, stacking patterns, and sequence relationships of the uppermost tens of meters of thick deposits on the middle–lower slope of the Chukchi Rise within a water depth range of approximately 700–2000 m. Along this profile, the slope break occurs at a water depth of approximately 450 m, according to multibeam bathymetry data [16]. Downward from the slope break, until approximately 900 m depth (TWT 1200 ms), deposits less than 30 m-thick were captured by a sub-bottom profiler. The acoustically stratified reflection, with strong, continuous, and subparallel internal reflectors, became increasingly thin toward the slope break and finally pinched out. Below a 900 m depth, a thicker acoustically stratified reflection was shown. The internal reflectors became weaker, and severe undulation was found at the lower slope. At the bottom of the slope, a transparent reflection was observed. It wedges into the stratified reflection at the slope and then away from the slope, and its thickness becomes gradually constant, to approximately 50 m.

4.2. Location, Morphology, and Acoustic Structure of Sediment Waves

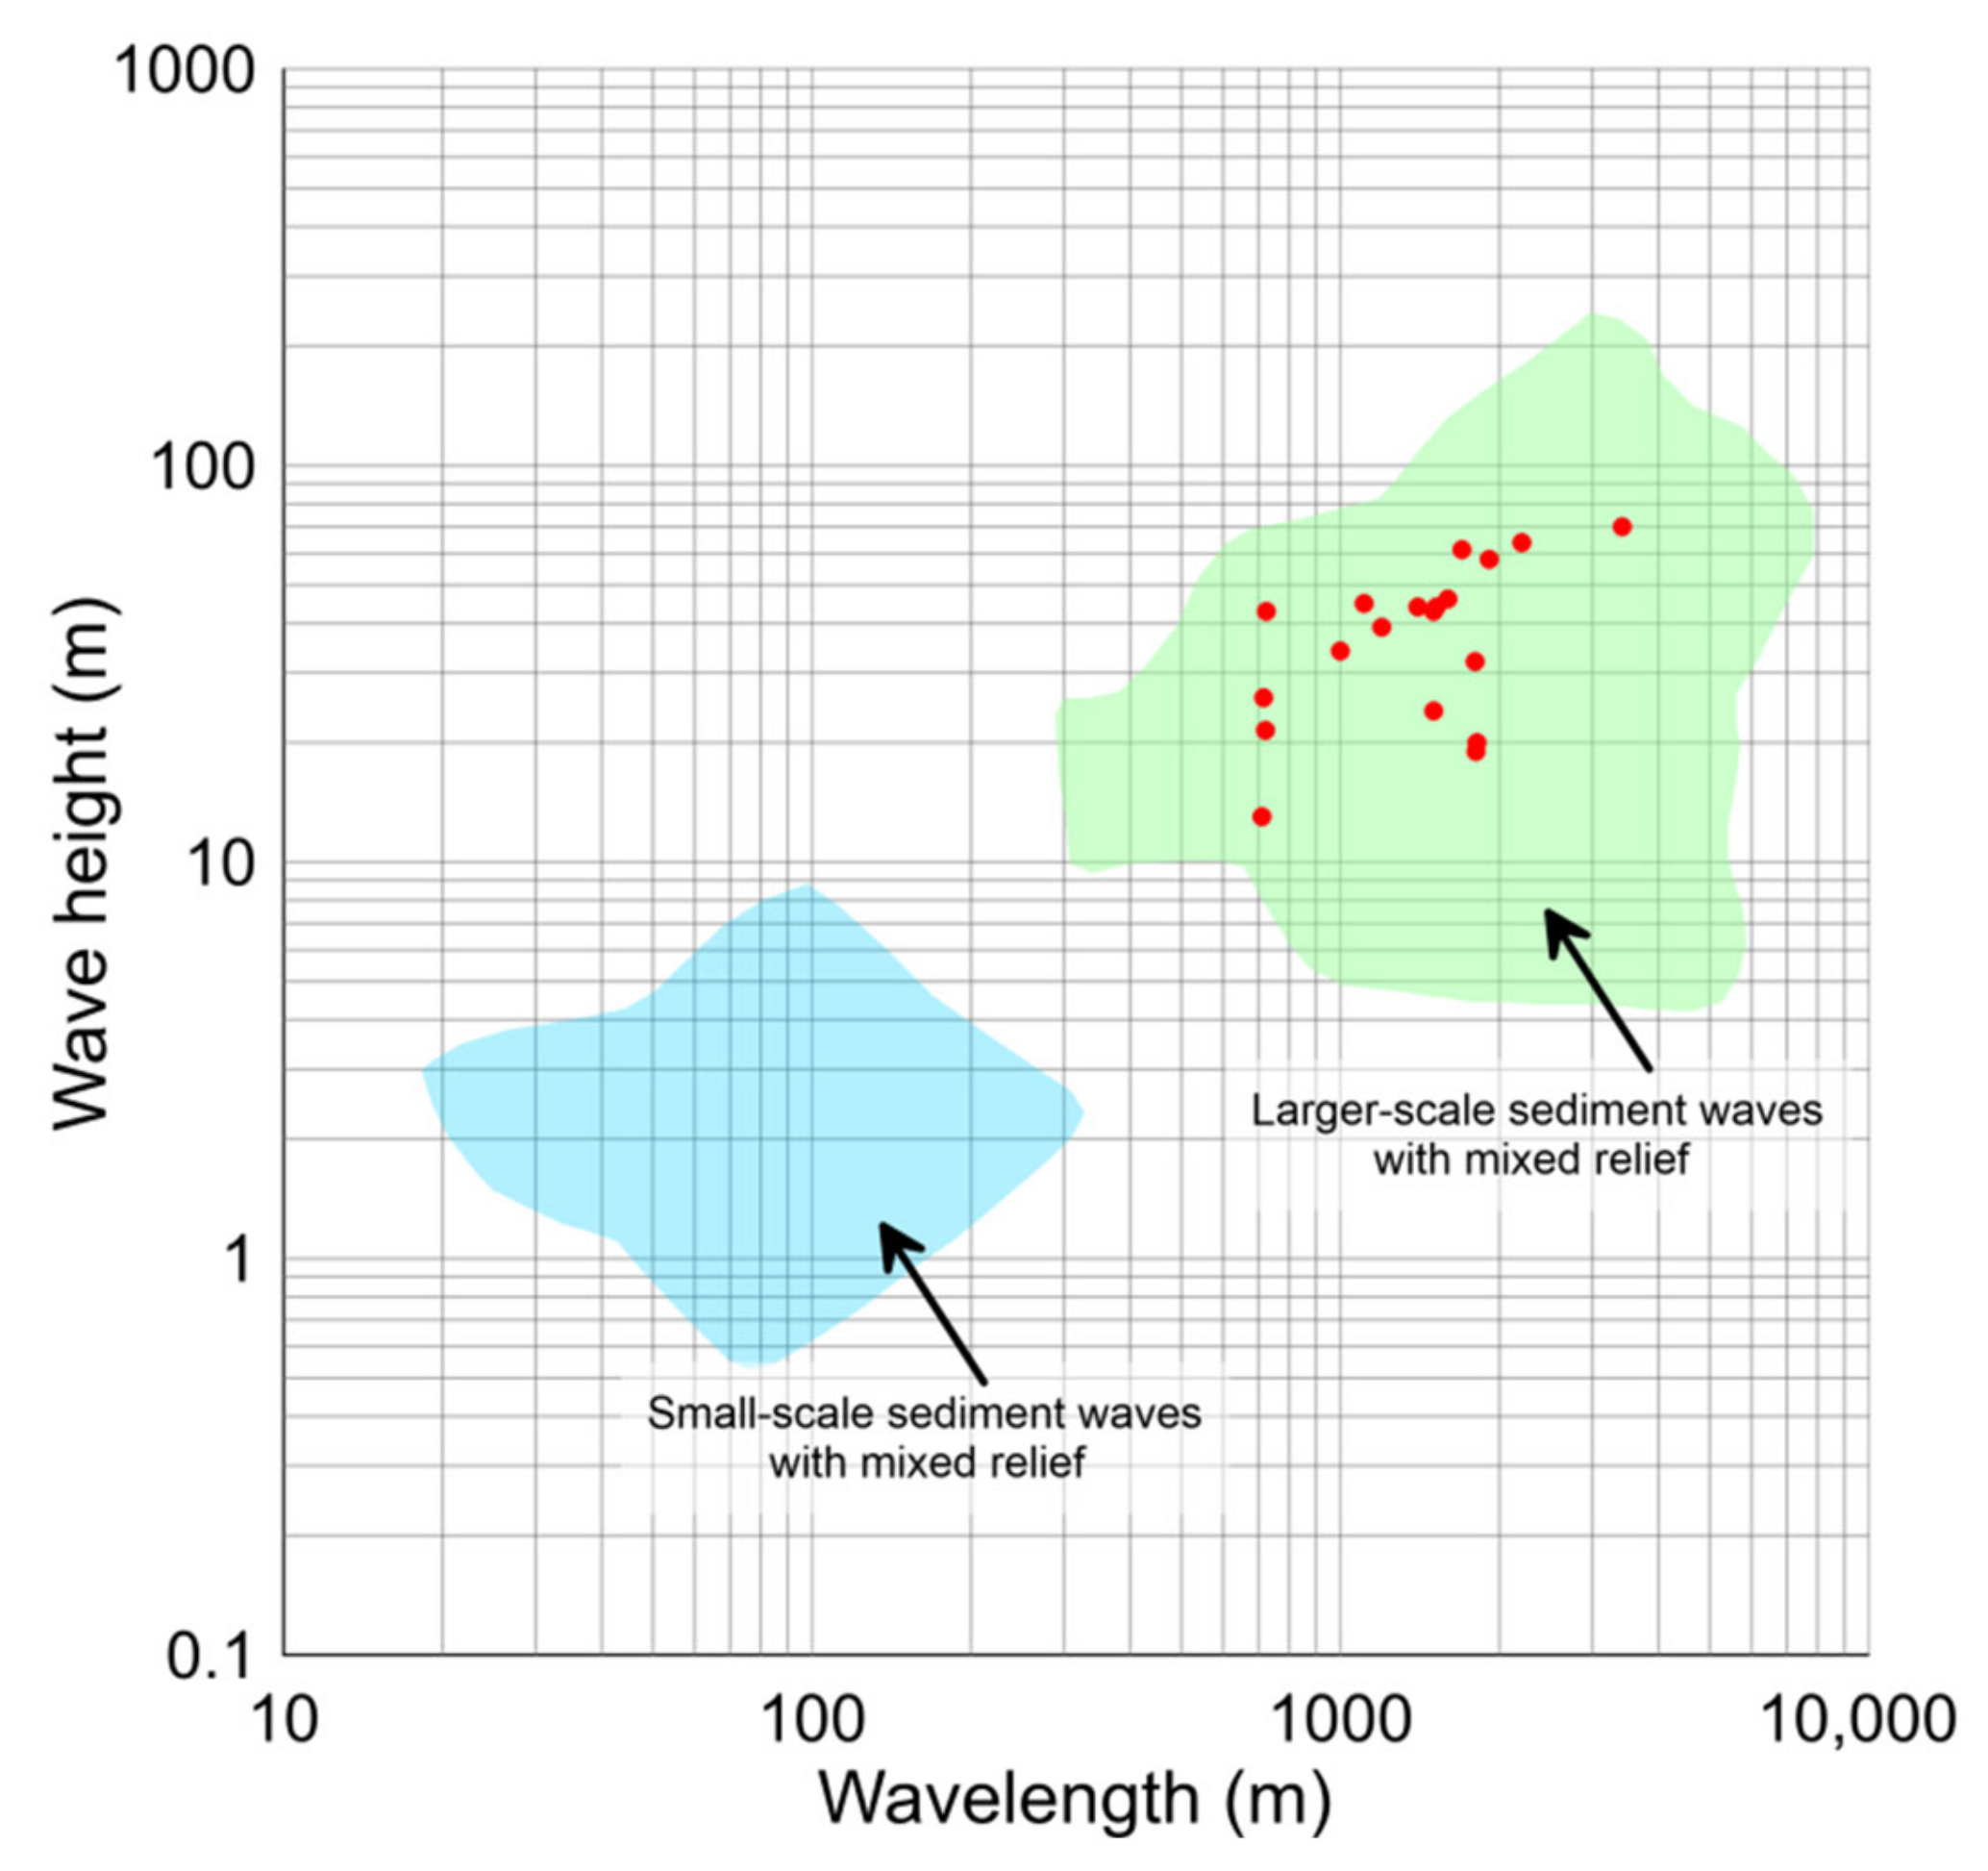
4.2.1. Geomorphic Features

The wavy bedforms are located on the middle and lower parts of the continental slope at a water depth of 1200–1800 m; the largest one occurs at about 1500 m (Figure 3a,b). The incline of the slope is approximately 1.8–1.9°. On the bathymetric map, the sediment wave field is shown as a series of alternating ridges and gullies, or some locally closed depressions. In addition, the wave field span exceeds 15 km in range; the single sediment wave crest forms a linear or crescent shape on the plane, which is generally oblique to the contour at a small angle (Figure 3a). The wavelength and wave height parameters of the sediment waves were calculated along three water depth sections, as shown in Figure 3a. To eliminate the influence of the slope incline, the average water depth along the continental slope was calculated using a polynomial fitting method and subtracted from the measured water depth (Figure 3b). The results indicate that the wavelength is between 700 m and 3400 m, and the wave height is between 12 m and 70 m (Figure 3c); therefore, it is a so-called large-scale sediment wave [1,7]. The wave in the middle of the field has the largest wavelength and height in the direction perpendicular to the continental slope, which gradually decreases toward both sides (Figure 3c). Moreover, the wavelength and wave height vary along the direction of the sediment wave. The wave crest length exceeds the beam width of the multibeam echo sounder, which measures about 5 km in the wave field.

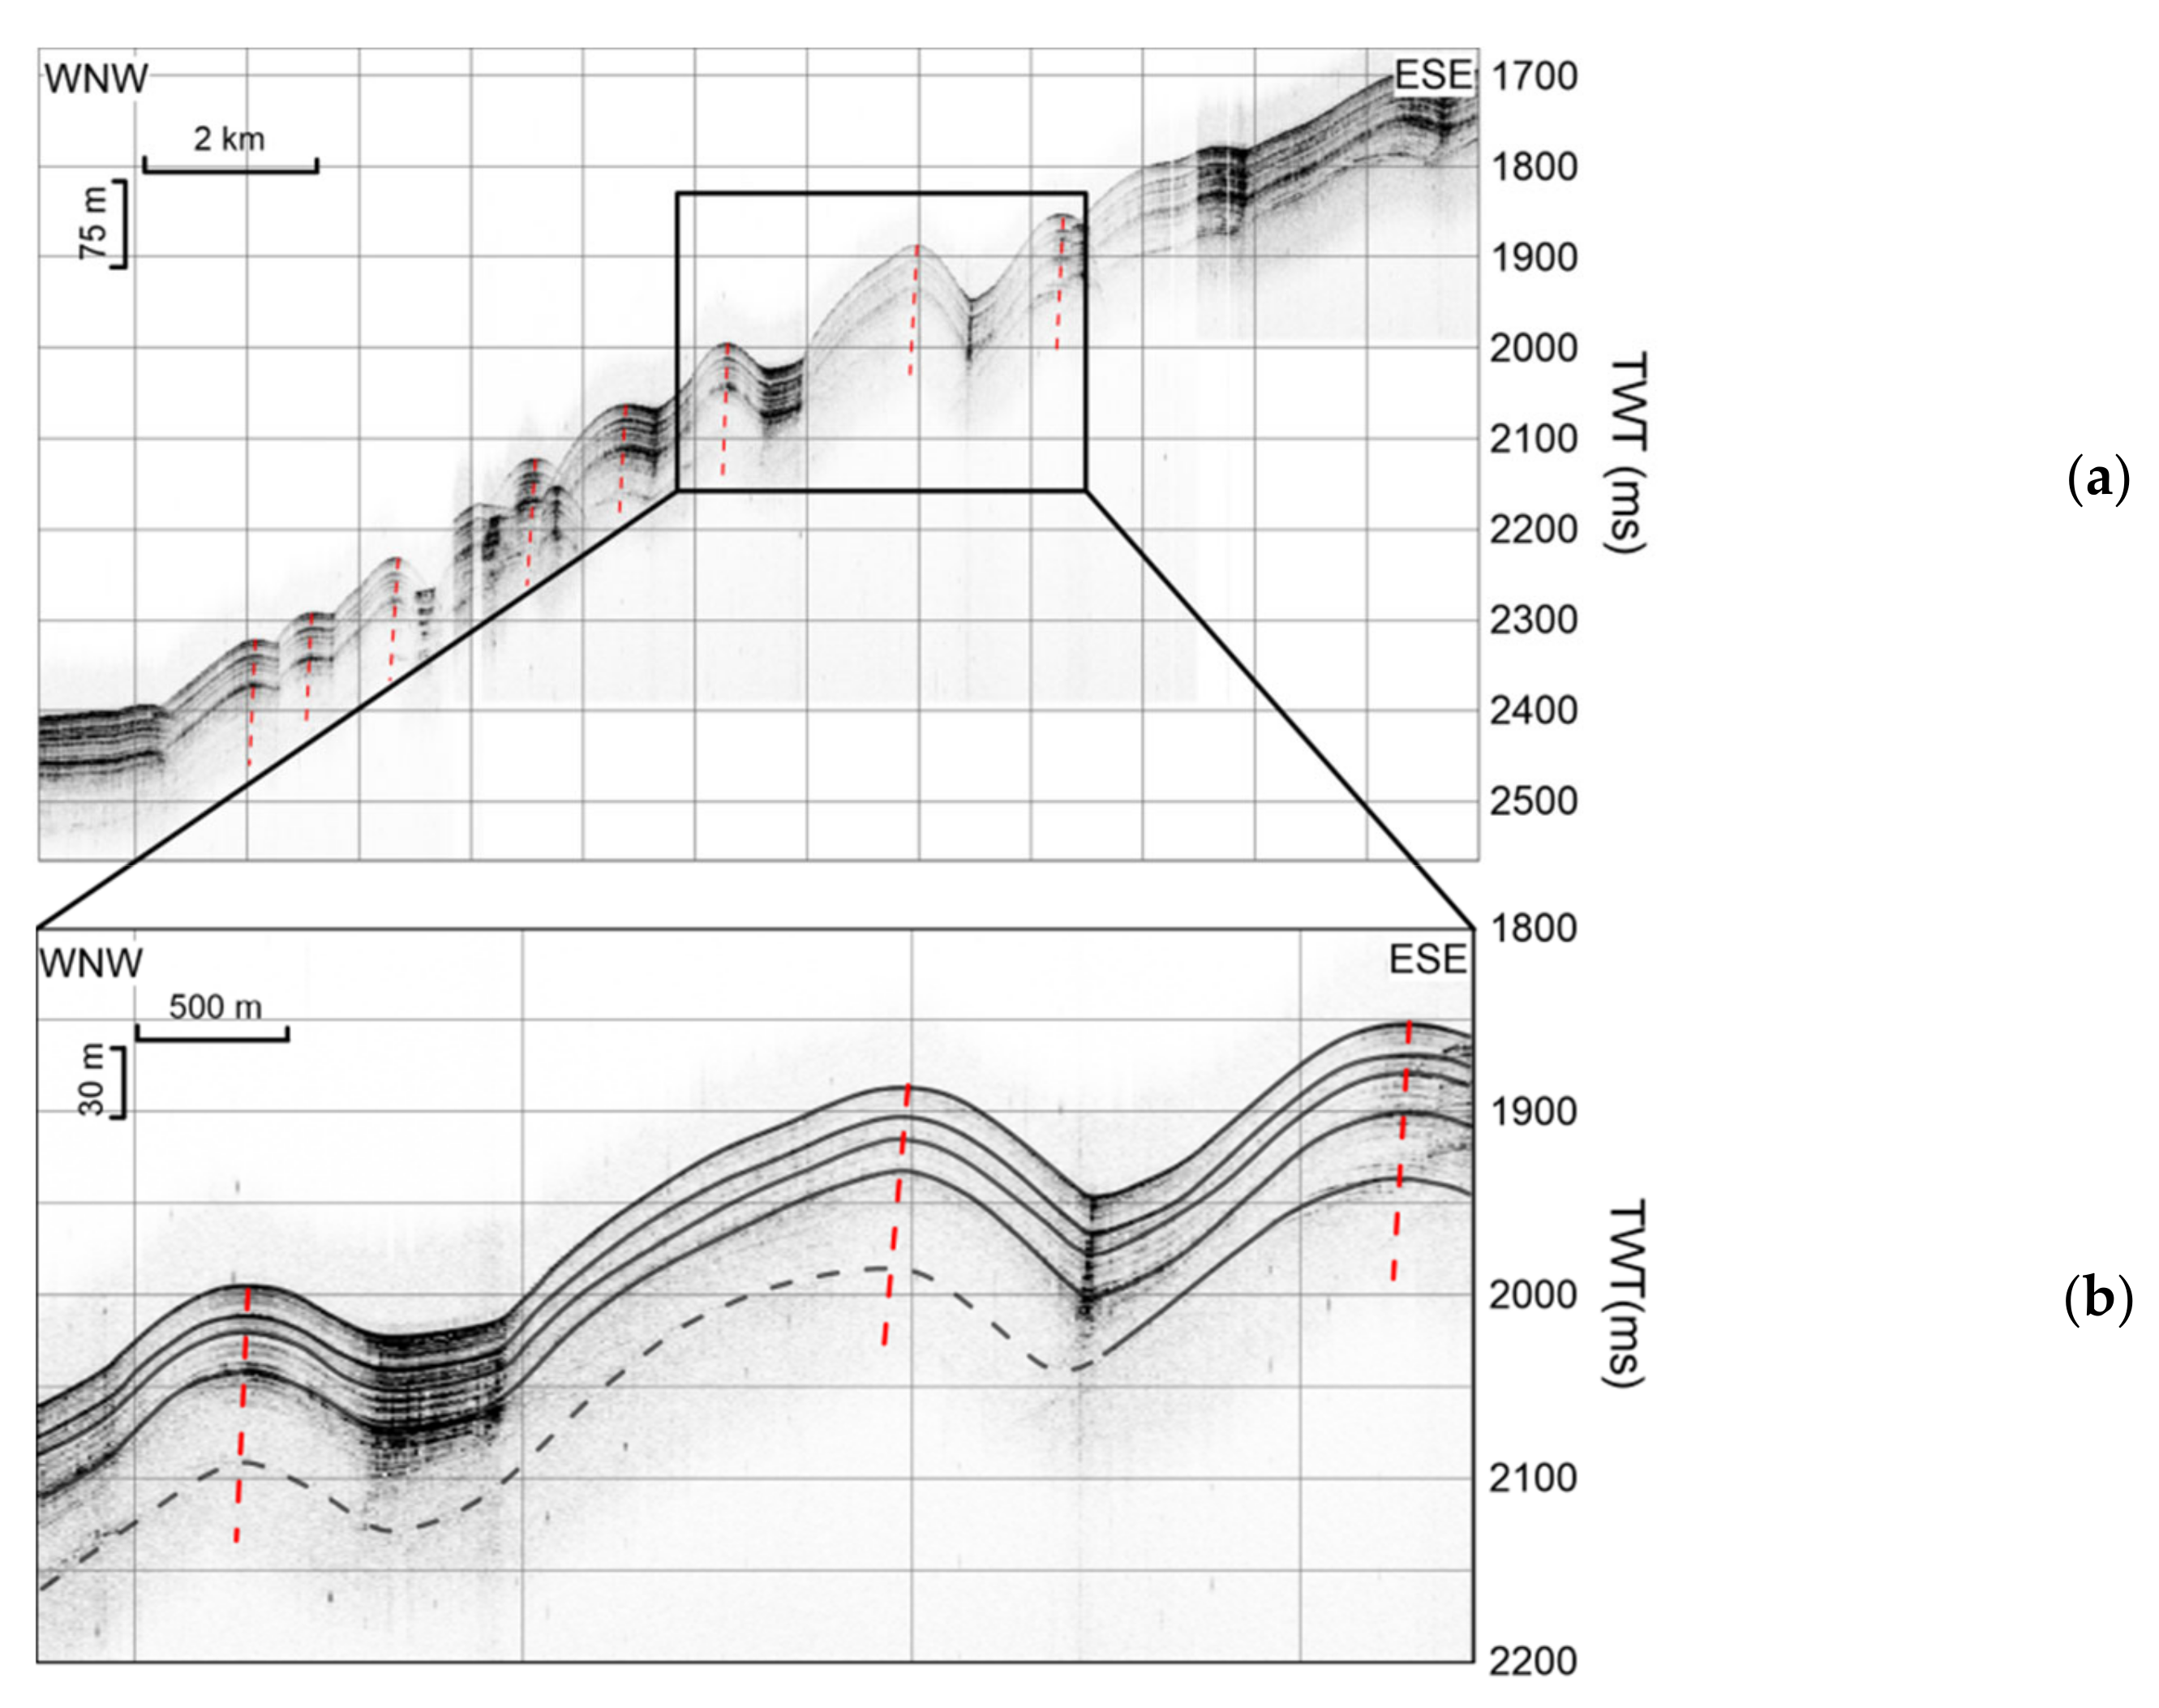
4.2.2. Seismostratigraphic Features

The wavy bedforms correspond to continuous wave-like bending of the well-stratified seismic reflector below the seabed within the thickness visible in the sub-bottom profile (Figure 4a). The sedimentary layer affected by these waves maintains the original good stratification, with moderate–weak internal reflectors and nearly transparent, constant-thickness layers within them. Most of the reflectors can be continuously traced along the adjacent waves. The wave shape is laterally variable but mostly shows asymmetrical waveforms, of which the upslope wing has a larger inclination and thickness than the downslope wing (Figure 4b). The line connecting the wave crests of each reflection interface of the waves is slightly inclined downslope, indicating a characteristic of upslope migration (Figure 4a,b). For the whole wave field, the waveform asymmetry on both sides of the field is higher than that at the center, whereas the wave height is larger at the center than on both sides.

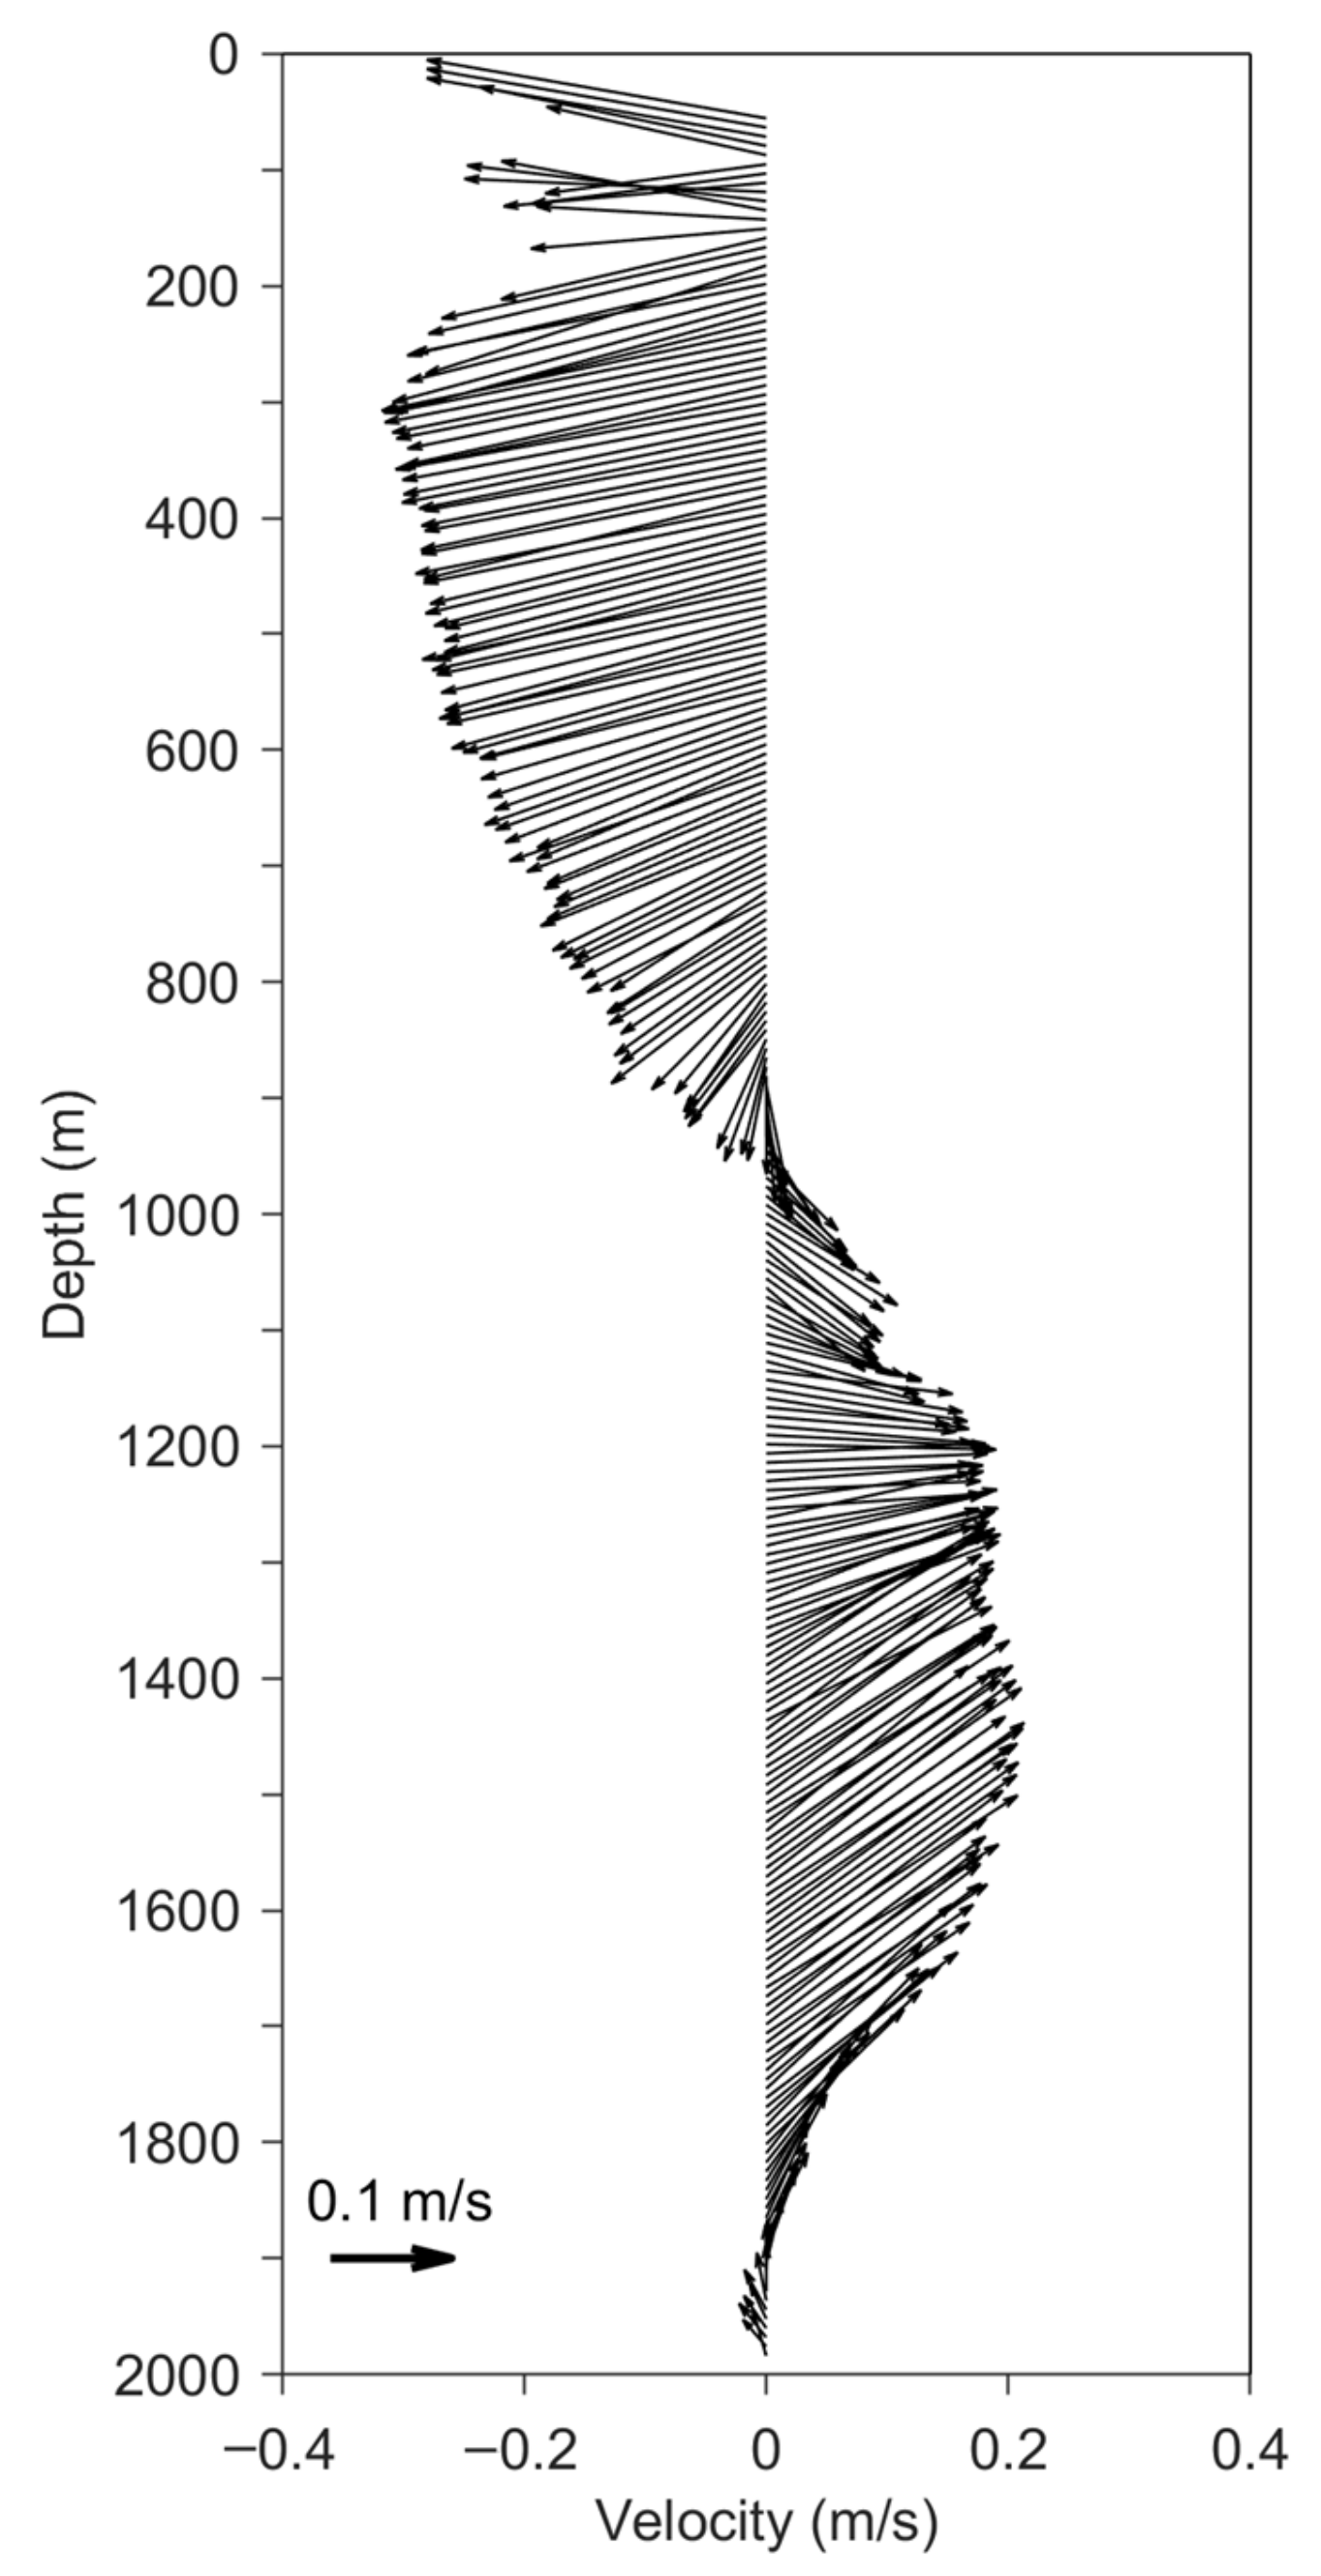
4.3. Current Velocity Profile at Site 10M14

Figure 5 shows the horizontal velocity profile observed by the LADCP at 10M14, a site near the bottom of the continental slope, approximately 15 km away from the wave field. Strikingly, different current direction was observed in the upper and lower parts of the seawater. There are westward currents in the upper 800 m, with a maximum velocity speed of approximately 0.33 m/s, whereas eastward and northeastward currents in the intermediate (800–1300 m) and deep (1300–2000 m) layers have maximum velocity speeds of approximately 0.22 and 0.26 m/s, respectively.

5. Discussion

5.1. Sediment Wave Formation

The wavy bedforms observed in the spur-like protrusion of the continental slope were interpreted as sediment waves, according to its planar and vertical characteristics in multibeam bathymetry and the sub-bottom profile [1,7]. The more widely distributed multibeam survey lines revealed that sediment waves spread all over the slope of the protrusion, and their wave crest lengths mostly exceeded 5 km [17].
Sediment waves can be formed by contour currents flowing laterally along the slope or turbidity currents flowing down the slope. To distinguish between the sediment waves formed by these two processes, five criteria, including wave regularity, wave crest alignment, sequence thickness, sediment type, and regional setting, were proposed by Wynn and Stow [1].
In terms of wave regularity, each sediment wave under consideration has an asymmetrical waveform, the wave height and length decrease from the middle of the wave field to both sides, and the waves show a trend of upslope migration, which are all typical features of sediment waves due to contour currents. In contrast, the dimensions of sediment waves with turbidity current origins tend to decrease gradually downward along the slope. In terms of the wave crest shape and alignment, the crest of the sediment waves in question is slightly crescent-shaped and aligned obliquely to the contour at a small angle, while the crest of turbidity current sediment waves is relatively straight in most cases, and the direction is mostly parallel to the contour. For the sequence thickness, sediment waves with turbidity current origins generally decrease progressively downslope as they move from the provenance area, with the reduction range reaching 40–60% [1]. In contrast, the sequence thickness affected by the sediment wave here is almost unchanged down the continental slope, showing a key feature of contour current sediment waves.
For the sediment type, although no sediment samples were collected on the sediment wave field in this cruise, some lithostratigraphic and seismostratigraphic studies in the Chukchi–East Siberian margin seem to support the idea that the well-stratified deposits forming sediment waves are mainly composed of fine-grained or sandy mud [17,32,33,34]. Similar acoustical characteristics to the study area were observed on the Chukchi–East Siberian margin and the Chukchi Basin [17,24,25,28]. The acoustically stratified reflection with subparallel internal reflectors might be correlated with the fine-grained–sandy muds revealed by lithostratigraphic studies [32,33,34]. The internal weak reflectors were interpreted as poorly sorted sandy muds with lower concentrations of iceberg-rafted debris, and the outermost constant thickness layers within internal reflectors were interpreted through fine-grained muds deposited in a hemipelagic environment [17,24]. The acoustically transparent reflection at the slope bottom indicates homogeneous sediments without internal bedding, which was interpreted thanks to the fast sedimentation of glaciogenic debris flow [17,28].
Regarding the regional setting, sediment waves formed by turbidity currents are mostly located in some confined environments, such as the levees of submarine canyons or on channel mouths. In contrast, sediment waves formed by contour currents, especially large-scale sediment waves, mostly develop in the lower part of the unconfined slope, as revealed by the multibeam bathymetric data discussed here and that of Kim et al. [17].
The above analysis indicates that the sediment waves in the study area may have been formed by contour currents as a result of the interaction between the seabed and bottom currents flowing laterally along the continental slope. The hydrological data (Figure 5) collected at site 10M14 adjacent to the wave field (Figure 1b) also support the contour current genesis. The strong and stable bottom current at water depths between 1200 m and 1800 m would subsequently contribute to the wavy bottom topography observed in the study area.
The source and route of this bottom current are still unknown. The LADCP observed currents in the deep layer are in agreement with the previously identified boundary current that transports Atlantic waters into the Arctic [35]. According to hydrographical and tracer studies, Woodgate et al. [20,30,36] proposed that the Atlantic water that constitutes the bottom current of the Arctic Circumpolar Boundary Current may flow along the southern slope of the Chukchi Basin after crossing the Mendeleev Ridge and then flow eastward to the Chukchi Borderland. This point is also supported by numerical simulation results [19,37]. The Arctic Circumpolar Boundary Current is roughly distributed along the continental slope in the Chukchi Basin, and the center of the current is located between 1000 and 2000 m in depth [30,36], which is essentially consistent with the depth range of the sediment waves observed in our study. Therefore, seemingly reasonable inference is that the formation of these sediment waves is related to the occurrence of the Arctic Circumpolar Boundary Current. However, this hypothesis is still far from being confirmed, and more hydrological observations will be necessary.

5.2. Implication for the Palaeoceanographic Environment

Sediment waves are often formed by long-term interactions between the bottom current and the seabed [4]. Kim et al. [17] interpreted the sediment waves on the slope of the western spur as “buried”, meaning that they formed before the hemipelagic drape was deposited. The sediment waves developed in the study area are obvious on the seabed topography map and affect the distribution of surficial deposits, which might indicate that they are still active. A statistical analysis of modern sediment waves reveals that the two parameters of wavelength and wave height offer a good reflection on the formation environment of sediment waves [7]. A logarithmic plot of the wavelength versus the wave height of the sediment waves in the study area (Figure 6) reveals that they belong to the nominal large-scale sediment waves with mixed relief, corresponding to the unconfined continental slope environment and fine-grained sediment formed by the weak contour current with linear stratification [7]. According to the bedform–velocity matrix [6], these mud waves correspond to a flow rate of approximately 0.1–0.2 m/s, a little lower than the sea water velocity at site 10M14 within same depth range measured by LADCP (Figure 5). The reason might be that the wave field is located more than 15 km away from site 10M14, and that the bottom current velocity is variable laterally.
Because of the limited penetration of sub-bottom profiling, the maximum strata thickness affected by sediment waves cannot be captured. Within the discernible depth of the sub-bottom profile, the sedimentary layers show continuous wave-like curvature from top to bottom, indicating that the bottom currents forming the sediment wave field have long-term effects on the sedimentary environment of the continental slope. The subparallel characteristics of internal reflectors also imply that the velocity and direction of the bottom current have been relatively stable for many years. The thickness of the strata affected by the sediment wave is over 50 m on the sub-bottom profile (Figure 4). The existing drilling cores in the adjacent Chukchi Basin (such as core 03M03 [31] in Figure 1b) reveal that the sedimentation rate is approximately several centimeters per thousand years since marine oxygen isotope stage 5 (MIS5) [27,29,32,34]. Therefore, we can infer that this set of sedimentary layers was formed over hundreds of thousands of years, indicating that sediment wave formation seems to date back to the Middle Pleistocene, when the glaciation began on the edge of the East Siberian Shelf as proposed by Niessen et al. [24].

6. Conclusions

A sediment wave field that developed on the western slope of the Chukchi Rise was identified using high-resolution multibeam bathymetry and shallow sub-bottom profile data obtained during China’s 10th Arctic Scientific Expedition. By analyzing the planar and sectional characteristics of the sediment wave field, the following conclusions were drawn:
(1)
These sediment waves are formed by contour currents and result from the interaction between continental slope bottom currents and the seabed;
(2)
The sediment waves are still active, and their formation seems to date back to the Middle Pleistocene;
(3)
Sediment waves are formed by a bottom current, which may be genetically related to the Arctic Circumpolar Boundary Current flowing through the study area.

Author Contributions

Conceptualization, G.L. and B.L.; methodology, Q.Z. and Q.H.; validation, G.L., Q.H. and T.X.; formal analysis, S.L.; investigation, G.L., Q.Z., T.X. and H.C.; resources, T.X.; data curation, H.C.; writing—original draft preparation, Q.H.; writing—review and editing, G.L., S.L. and B.L.; visualization, Q.Z. and T.X.; supervision, B.L.; project administration, B.L.; funding acquisition, G.L. All authors have read and agreed to the published version of the manuscript.

Funding

This study was supported by the Wenhai Program of the S&T Fund of Shandong Province for Pilot National Laboratory for Marine Science and Technology (Qingdao) (No. 2021 WHZZB0702), the National Natural Science Foundation of China under contract Nos. 42076082 and 42176191, National Key R&D Program of China (2021YFF0501200 and 2021YFF05012001), and the Taishan Scholar Project Funding under contract No. tspd20161007.

Institutional Review Board Statement

Not applicable.

Informed Consent Statement

Not applicable.

Data Availability Statement

Not applicable.

Acknowledgments

Data acquisition was supported by the China’s 10th Arctic Scientific Expedition Cruise. The authors thank Zexun Wei and crew of R/V Xiangyanghong 01 for their assistance in field data acquisition. The authors also thank three anonymous reviewers, whose comments greatly improved this manuscript.

Conflicts of Interest

The authors declare no conflict of interest.

References

  1. Wynn, R.B.; Stow, D.A.V. Classification and characterisation of deep-water sediment waves. Mar. Geol. 2002, 192, 7–22. [Google Scholar] [CrossRef]
  2. Wynn, R.B.; Weaver, P.P.E.; Ercilla, G.; Stow, D.A.V.; Masson, D.G. Sedimentary processes in the Selvage sediment-wave field, NE Atlantic: New insights into the formation of sediment waves by turbidity currents. Sedimentology 2000, 47, 1181–1197. [Google Scholar] [CrossRef]
  3. Rebesco, M.; Hernández-Molina, F.J.; Rooij, D.V.; Wáhlin, A. Contourites and associated sediments controlled by deep-water circulation processes: State-of-the-art and future considerations. Mar. Geol. 2014, 352, 111–154. [Google Scholar] [CrossRef] [Green Version]
  4. Flood, R.; Shor, A. Mud waves in the argentine basin and their relationship to regional bottom circulation patterns. Deep Sea Res. Part A Oceanogr. Res. Pap. 1988, 35, 943–971. [Google Scholar] [CrossRef]
  5. Gong, C.; Wang, Y.; Peng, X.; Li, W.; Qiu, Y.; Xu, S. Sediment waves on the South China Sea Slope off southwestern Taiwan: Implications for the intrusion of the Northern Pacific deep water into the South China Sea. Mar. Pet. Geol. 2012, 32, 95–109. [Google Scholar] [CrossRef]
  6. Stow, D.A.V.; Hernández-Molina, F.J.; Llave, E.; Sayago-Gil, M.; Diaz-del Rio, V.; Branson, A. Bedform-velocity matrix: The estimation of bottom current velocity from bedform observations. Geology 2009, 37, 327–330. [Google Scholar] [CrossRef]
  7. Symons, W.O.; Sumner, E.J.; Talling, P.J.; Cartigny, M.J.B.; Clare, M.A. Large-scale sediment waves and scours on the modern seafloor and their implications for the prevalence of supercritical flows. Mar. Geol. 2016, 371, 130–148. [Google Scholar] [CrossRef]
  8. Maldonaldo, A.; Barnolas, A.; Bohoyo, F.; Galindo-Zaldivar, A.; Hernandez-Molina, F.J.; Lobo, F.; Rodriguez-Femandez, J.; Somoza, L.; Vazquez, J.T. Contourite deposits in the central Scotia Sea: The importance of the Antarctic Circumpolar Current and the Weddell Gyre flows. Palaeogeogr. Palaeoclimatol. Palaeoecol. 2003, 198, 187–221. [Google Scholar] [CrossRef]
  9. Maldonado, A.; Bohoyo, F.; Galindo-Zaldívar, J.; Hernández-Molina, F.J.; Jabaloy, A.; Lobo, F.J.; Rodríguez-Femández, J.; Suríñach, E.; Vázquez, J.T. Ocean basins near the Scotia-Antarctic plate boundary: Influence of tectonics and paleoceanography on the Cenozoic deposits. Mar. Geophys. Res. 2006, 27, 83–107. [Google Scholar] [CrossRef]
  10. Koenitz, D.; White, N.; McCave, I.N.; Hobbs, R. Internal structure of a contourite drift generated by the Antarctic Circumpolar Current. Geochem. Geophy. Geosy. 2008, 9, Q06012. [Google Scholar] [CrossRef]
  11. Laberg, J.S.; Baeten, N.J.; Forwick, M.; Wiberg, D.H. Ocean-current controlled sedimentation: The Lofoten Contourite Drift, Norwegian Sea. In Atlas of Submarine Glacial Landforms: Modern, Quaternary and Ancient; Dowdeswell, J.A., Canals, M., Jakobsson, M., Todd, B.J., Dowdeswell, E.K., Hogan, K.A., Eds.; Geological Society: London, UK, 2016; Volume 46, pp. 395–396. [Google Scholar]
  12. Masson, D.G.; Plets, R.M.K.; Huvenne, V.A.L.; Wynn, R.B.; Bett, B.J. Sedimentology and depositional history of Holocene sandy contourites on the lower slope of the Faroe-Shetland Channel, northwest of the UK. Mar. Geol. 2010, 268, 85–96. [Google Scholar] [CrossRef]
  13. Masson, D.G.; Howe, J.A.; Stoker, M.S. Bottom current sediment waves, sediment drifts and contourites in the northern Rockall Trough. Mar. Geol. 2002, 192, 215–237. [Google Scholar] [CrossRef]
  14. Garciá, M.; Batchelor, C.L.; Dowdeswell, J.A.; Hogan, K.A.; Cofoigh, C.Ó. A glacier-influenced turbidite system and associated landform assemblage in the Greenland Basin and adjacent continental slope. In Atlas of Submarine Glacial Landforms: Moder, Quaternary and Ancient; Dowdeswell, J.A., Canals, M., Jakobsson, M., Todd, B.J., Dowdeswell, E.K., Hogan, K.A., Eds.; Geological Society: London, UK, 2016; Volume 46, pp. 461–468. [Google Scholar]
  15. Mosher, D.C.; Boggild, K. Impactof bottom currents on deep water sedimentary processes of Canada Basin, Arctic Ocean. Earth Planet. Sci. Lett. 2021, 569, 117067. [Google Scholar] [CrossRef]
  16. Li, G.B.; Zhou, Q.J.; Hua, Q.F.; Wang, J.Q.; Liu, C.G.; Liu, B.H. Characteristics of the shallow strata structure on the northern margin of the Chukchi Sea and its significance on palaeo-glaciation. Adv. Mar. Sci. 2021, 39, 393–402. (In Chinese) [Google Scholar]
  17. Kim, S.; Polyak, L.; Joe, Y.J.; Niessen, F.; Kim, H.J.; Choi, Y.; Kang, S.-G.; Hong, J.K.; Nam, S.-I.; Jin, Y.K. Seismostratigraphic and geomorphic evidence for the glacial history of the northwestern Chukchi margin, Arctic Ocean. J. Geophys. Res. Earth Surf. 2021, 126, e2020JF006030. [Google Scholar] [CrossRef]
  18. Rudels, B.; Friedrich, H.J.; Quadfasel, D. The Arctic circumpolar boundary current. Deep-Sea Res. II Top. Stud. Oceanogr. 1999, 46, 1023–1062. [Google Scholar] [CrossRef]
  19. Aksenov, Y.; Ivanov, V.V.; Nurser, A.J.G.; Bacon, S.; Polyakov, I.V.; Coward, A.C.; Naveira-Garabato, A.C.; Beszczynska-Moeller, A. The Arctic circumpolar boundary current. J. Geophy. Res. Oceans. 2011, 116, C09017. [Google Scholar] [CrossRef] [Green Version]
  20. Woodgate, R.A. Arctic Ocean circulation: Going around at the top of the world. Nat. Educ. Knowl. 2013, 4, 1–15. [Google Scholar]
  21. Jakobsson, M.; Mayer, L.; Coakley, B.; Dowdeswell, J.A.; Forbes, S.; Fridman, B.; Hodnesdal, H.; Noormets, R.; Pedersen, R.; Rebesco, M.; et al. The International Bathymetric Chart of the Arctic Ocean Version 4.0. Sci. Data 2020, 7, 176. [Google Scholar] [CrossRef]
  22. Hegewald, A.; Jokat, W. Tectonic and sedimentary structures in the northern Chukchi region, Arctic Ocean. J. Geophys. Res. Solid Earth 2013, 118, 3285–3296. [Google Scholar] [CrossRef]
  23. Hegewald, A.; Jokat, W. Relative sea level variations in the Chukchi region—Arctic Ocean—Since the late Eocene. Geophys. Res. Lett. 2013, 40, 803–807. [Google Scholar] [CrossRef]
  24. Niessen, F.; Hong, J.K.; Hegewald, A.; Matthiessen, J.; Stein, R.; Kim, H.; Kim, S.; Jensen, L.; Jokat, W.; Nam, S.-I.; et al. Repeated Pleistocene glaciation of the East Siberian continental margin. Nat. Geosci. 2013, 6, 842–846. [Google Scholar] [CrossRef]
  25. Dove, D.; Polyak, L.; Coakley, B. Widespread, multi-source glacial erosion on the Chukchi margin, Arctic Ocean. Quat. Sci. Rev. 2014, 92, 112–122. [Google Scholar] [CrossRef] [Green Version]
  26. Jakobsson, M.; Andreassen, K.; Bjarnadóttir, L.R.; Dove, D.; Dowdeswell, J.A.; England, J.H.; Funder, S.; Hogan, K.; Ingólfsson, ó.; Jennings, A.; et al. Arctic Ocean glacial history. Quat. Sci. Rev. 2014, 92, 40–67. [Google Scholar] [CrossRef]
  27. Schreck, M.; Nam, S.-I.; Polyak, L.; Vogt, C.; Kong, G.-S.; Stein, R.; Matthiessen, J.; Niessen, F. Improved Pleistocene sediment stratigraphy and paleoenvironmental implications for the western Arctic Ocean off the East Siberian and Chukchi margins. Arktos 2018, 4, 1–20. [Google Scholar] [CrossRef]
  28. O’Regan, M.; Backman, J.; Barrientos, N.; Cronin, T.M.; Gemery, L.; Kirchner, N.; Mayer, L.A.; Nilsson, J.; Noormets, R.; Pearce, C.; et al. The De Long Trough: A newly discovered glacial trough on the East Siberian continental margin. Clim. Past 2017, 13, 1269–1284. [Google Scholar] [CrossRef] [Green Version]
  29. Stein, R.; Matthiessen, J.; Niessen, F.; Krylov, R.; Nam, S.; Bazhenova, E. Towards a better (Litho-) stratigraphy and reconstruction of Quaternary Paleoenvironment in the Amerasian Basin (Arctic Ocean). Polarforschung 2010, 79, 97–121. [Google Scholar]
  30. Woodgate, R.A.; Aagaard, K.; Swift, J.H.; Smethie, W.M., Jr.; Falkner, K.K. Atlantic water circulation over the Mendeleev Ridge and Chukchi Borderland from thermohaline intrusions and water mass properties. J. Geophy. Res. 2007, 112, C02005. [Google Scholar] [CrossRef] [Green Version]
  31. Visbeck, M. Deep velocity profiling using lowered acoustic Doppler current profilers: Bottom track and inverse solutions. J. Atmos. Ocean. Tech. 2002, 19, 794–807. [Google Scholar] [CrossRef]
  32. Wang, R.; Xiao, W.; März, C.; Li, Q. Late Quaternary paleoenvironmental changes revealed by multi-proxy records from the Chukchi Abyssal Plain, western Arctic Ocean. Glob. Planet. Chang. 2013, 108, 100–118. [Google Scholar] [CrossRef]
  33. Joe, Y.J.; Polyak, L.; Schreck, M.; Niessen, F.; Yoon, S.H.; Kong, G.S.; Nam, S.-I. Late Quaternary depositional and glacial history of the Arliss Plateau off the East Siberian margin in the western Arctic Ocean. Quaternary. Sci. Rev. 2020, 228, 106099. [Google Scholar] [CrossRef]
  34. Zhang, W.; Yu, X.; Liu, Y.; Jin, L.; Ye, L.; Xu, D.; Bian, Y.; Zhang, D.; Yao, X.; Zhang, F. Paleoenvironmental record of core M04 in the Chukchi Sea Basin during Late Pleistocene. Acta Oceanol. Sin. 2015, 37, 85–96. (In Chinese) [Google Scholar]
  35. Corlett, W.B.; Pickart, R.S. The Chukchi slope current. Prog. Oceanogr. 2017, 153, 50–65. [Google Scholar] [CrossRef] [Green Version]
  36. Woodgate, R.A.; Aagaard, K.; Muench, R.D.; Gunn, J.; Bjork, G.; Rudels, B.; Roach, A.T.; Schauer, U. The Arctic Ocean Boundary Current along the Eurasian slope and the adjacent Lomonosov Ridge: Water mass properties, transports and transformations from moored instruments. Deep Sea Res. Part I Oceanogr. Res. Pap. 2001, 48, 1757–1792. [Google Scholar] [CrossRef]
  37. Mauldin, A.; Schlosser, P.; Newton, R.; Smethie, W.M.; Bayer, R., Jr.; Rhein, M.; Jones, E.P. The velocity and mixing time scale of the Arctic Ocean Boundary Current estimated with transient tracers. J. Geophy. Res. Oceans 2010, 115, C08002. [Google Scholar] [CrossRef]
Figure 1. Bathymetric chart of the Chukchi Borderland and its neighboring areas (a) and a zoomed-in image of the study area (within the yellow box in Figure 1a) (b). The inset indicates the location (black box) of Figure 1a in the Arctic region. Pink dotted lines with arrows represent the speculated pathway of the Arctic Circumpolar Boundary Current (according to [19,20]). White solid lines mark the research vessel’s track during China’s 10th Arctic Scientific Expedition in 2019. The blue solid line indicates the location of Figure 2, and the red shaded area identifies the location of Figure 3a, where the sediment waves were found. The green star (10M14) and red point (03M03) mark the locations of the lowered ADCP site and gravity sediment core, respectively, which are mentioned below.
Jmse 10 01586 g001
Figure 2. Sub-bottom profile across the western slope of the Chukchi Rise (see Figure 1b for its location). The vertical axis is the two-way travel time (TWT) in miliseconds, and the depth scale in meters is estimated at a sound speed of 1500 m/s. The location of Figure 4 is also shown.
Jmse 10 01586 g002
Figure 3. Sediment waves on the multibeam bathymetric map and the locations of the water depth sections used to measure the wavelengths and the wave heights (a). Water depth changes (solid lines) along the three sections identified in (a); the dotted lines represent water depths obtained by polynomial fitting, which indicate the trend of the water depth changes along the continental slope (b). The real undulations of the sediment waves along the sections, i.e., the differences between water depths and their fitting values (c).
Jmse 10 01586 g003
Figure 4. Sediment wave field shown on the sub-bottom profile (a) and a zoomed-in image of the rectangular area (b). The location is shown in Figure 2. The red dashed lines show the connecting lines of the wave crest for each internal reflector. The vertical axis is the two-way travel time (TWT) in miliseconds, and the depth scale in meters is estimated at 1500 m/s sound speed.
Jmse 10 01586 g004
Figure 5. The vertical profile of sea water velocity measured by LADCP at site 10M14 (see Figure 1b for its location). The upward and rightward vectors indicate northward and eastward currents, respectively. The length of each vector gives the magnitude of the current.
Jmse 10 01586 g005
Figure 6. Logarithmic plot of wavelength versus wave height for the bedforms in Figure 3a. The red dots represent the waves used for statistics in Figure 3c. The two areas indicating the sediment wave types were obtained from [7].
Jmse 10 01586 g006
Publisher’s Note: MDPI stays neutral with regard to jurisdictional claims in published maps and institutional affiliations.

