Article

Influence of Dynamic Woody Debris Jam on Single Bridge Pier Scour and Induced Hydraulic Head

1
Civil Engineering Department, University of Ottawa, Ottawa, ON K1N 6N5, Canada
2
National Research Council, Ottawa, ON K1A 0R6, Canada
*
Author to whom correspondence should be addressed.
J. Mar. Sci. Eng. 2022, 10(10), 1421; https://doi.org/10.3390/jmse10101421
Submission received: 31 August 2022 / Revised: 27 September 2022 / Accepted: 29 September 2022 / Published: 3 October 2022

Abstract

:
A woody debris jam around a bridge pier causes a change in flow structure and results in additional scour and an increase in the hydraulic head upstream of the pier, threatening its stability and safety. In the present paper, the spatio-temporal formation of a dynamic woody debris jam formed piece by piece of debris wood was used to investigate the influence of woody debris jams from a life-cycle perspective which included the processes of its formation, growth, failure, and rebirth. Several debris jams were formed in sequence during each experimental test. The results showed that the additional scour generated by the first woody debris jam compared with the scour depth without debris was a function of blockage ratio of the first debris jam, while the influence of the subsequent woody debris jams depended on their dimensions compared with the previous jam. When the subsequent debris jam’s dimensions were larger than the previous one, the scour further increased; otherwise, the scour remained constant and equal to the previous one. In addition, the debris-induced hydraulic head was analyzed and found to be correlated with the Froude number and the debris jam dimensions.

1. Introduction

Woody debris from the upstream watershed attached to bridge piers often results in the formation of woody debris jams. The presence of woody debris jams leads to the reduction of cross-sectional flow area and strengthens downward flow close to the pier, which enhances the scour process at the base of bridge piers. This can induce greater scour depth than design guidelines prescribe. In addition, woody debris jams can also result in an extra load on the bridge such as the impact loads on the piers which occurred in the initial contact of debris with the pier [1,2,3] or on the superstructure [4], and the damming load on superstructure [5,6] in the extreme fluvial events. Thus, the presence of woody debris jams affects the stability of bridges and threatens their safety. Some documented failure examples were mentioned in [7].
Beyond the adverse influence on bridge infrastructure, wood logs or debris play an important role in river systems. Studies related to woody debris have involved many aspects such as the process of debris entering the river [8,9], debris volume estimation [10,11,12] and their influence on river morphology [13]. The dynamics of wood debris involves entrainment [14], motion [15], and deposition [16] processes. Gravity force, dragging force, and friction force determine the movement of logs in the river, and critical conditions have been investigated in previous studies [14,17,18,19,20]. The transport process of debris was another important issue that determined how far the debris can travel [15] and where it might accumulate [21]. A debris motion model was also proposed to describe the transport of woody debris [22]. In addition, the presence of debris significantly increased the possibility of bridge failures as clarified by Diehl [23].
Scour is the engineering term for the erosion of bed material caused by water around the base of the bridge pier [24], and related studies have been going on for several decades. Basing on the critical shear stress velocity of a given sediment d 50 , the critical mean velocity could be obtained [25], and if U / U c < 1 , clear water scour occurs whereas for U / U c > 1 , it is live bed scour. In clearwater scour conditions the spatio-temporal evolution of scour depth continues until it reaches a value independent of time called the equilibrium scour depth. Kothyari et al. [26] proposed a mathematical method to calculate time-dependent scour depth considering the influence of the growth of a vortex on bed shear stress. This method was further developed for live bed scour [27], nonuniform circular piers [28], and continual development by modeling the vortex which initiated scour [29]. Yanmaz and Altinbilek [30] employed a sediment transport model using a sediment pick-up model to derive a mathematical method to predict the temporal evolution of scour depth. Dey [31] and Yanmaz [32] continued this idea of using different sediment pick-up models to develop a new model. Some studies applied this idea to different objects like bridge abutments [33] or dual bridge piers [34].
On the other hand, empirical functions have also been widely used and developed based on experiments using non-dimensional analysis [35,36,37,38]. As for equilibrium scour depth or maximum scour depth, Melville [39] investigated the influence of the flow intensity, water depth, sediment size and gradation, and pier shapes on equilibrium scour depth, and an empirical formula was proposed to predict scour depth. A design method, HEC-18, proposed by the US Federal Highway Administration (FHWA), is widely used to estimate maximum scour depth.
Woody debris significantly changes the flow field and causes additional scour depth. The presence of a woody debris jam obstructs the cross-section of water flow, and the reduction of the flow area leads to the increase of velocity and downward flow [40,41]. Melville and Dongol [42] applied a model of steady woody debris to investigate its influence on scouring; an effective diameter of bridge piers was proposed to include the influence of accumulated debris.
D e p = 0.52 h d w d h 0.52 h d D p h
where D e p was the effective width or diameter of the pier; h d was the height of the woody debris jam from the bottom of the debris jam to the water surface; w d was the width of the woody debris jam normal to the flow; h was the approach flow depth; D p was the width or diameter of the pier without the debris jam.
Lagasse et al. [40] continued this idea and further investigated the different geometry of debris and improved Equation (1) to include the influence of the length of debris jam:
D e p = α h d w d l d / h β h α h d D p h
where α was 0.79 for rectangular debris and 0.21 for triangular debris; β was −0.79 for rectangular debris and −0.17 for triangular debris, β was 0 when l d / h 1 ; l d was the length of the woody debris jam.
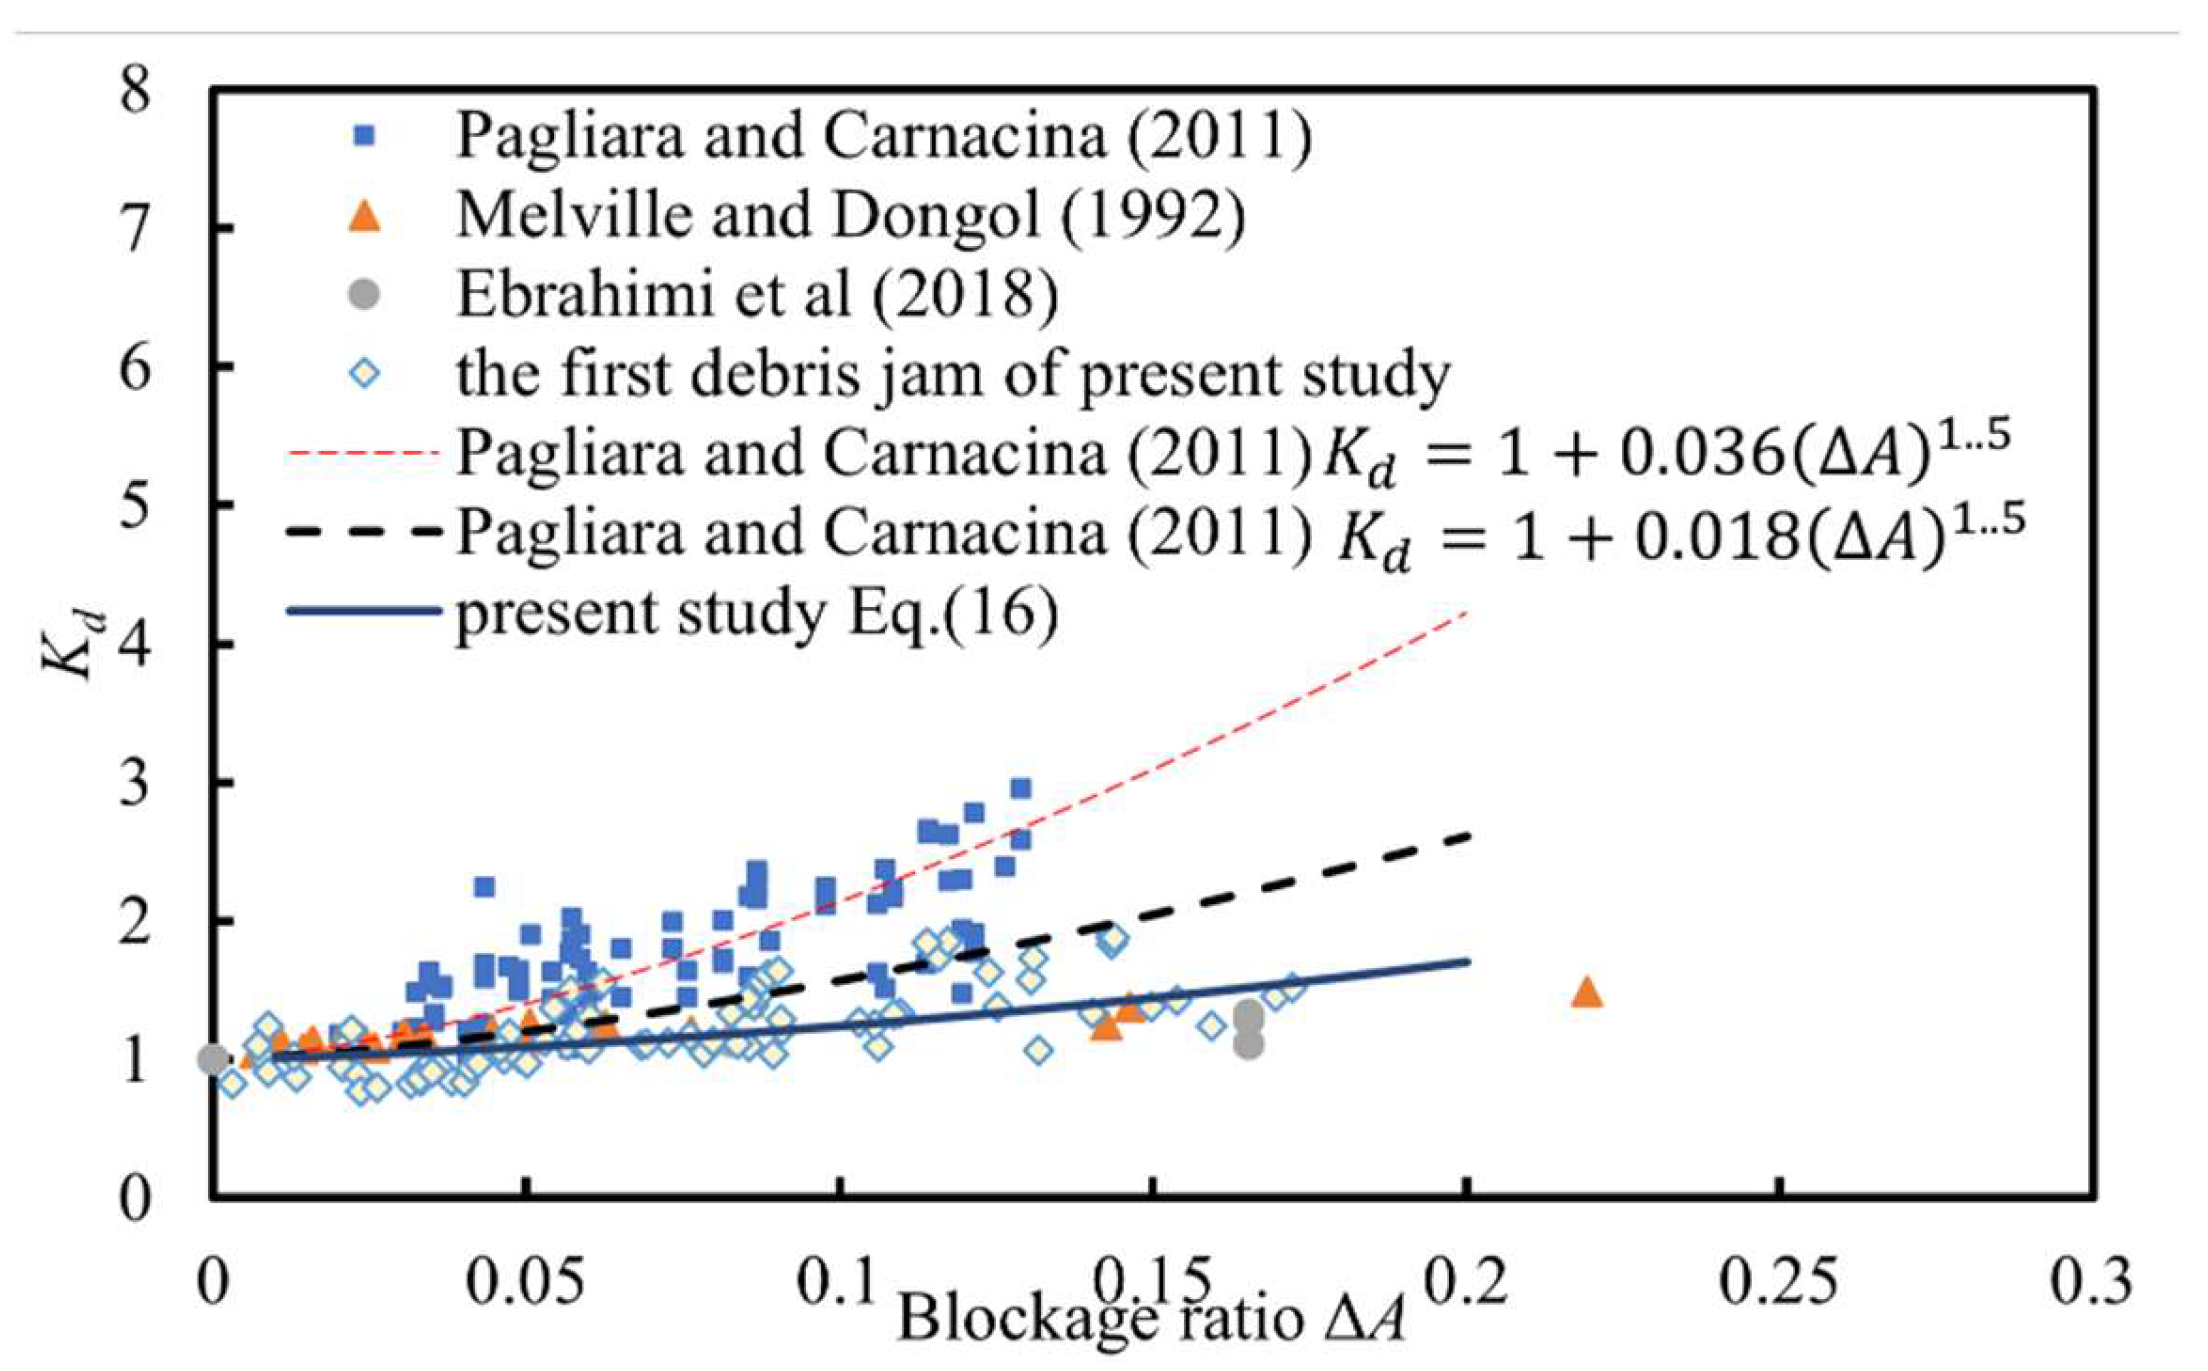
Lagasse et al. [43] and Pagliara and Carnacina [7] investigated rectangular, triangular, and cylindrical shapes of debris accumulation, as well as the roughness and porosity of debris jams [44] and countermeasures for the scour depth [45]. Their research showed that the blockage ratio caused by the debris jam mainly determines its impact on scour, and the flow contraction caused the debris jam accelerated the scour process increased the bridge failure possibility.
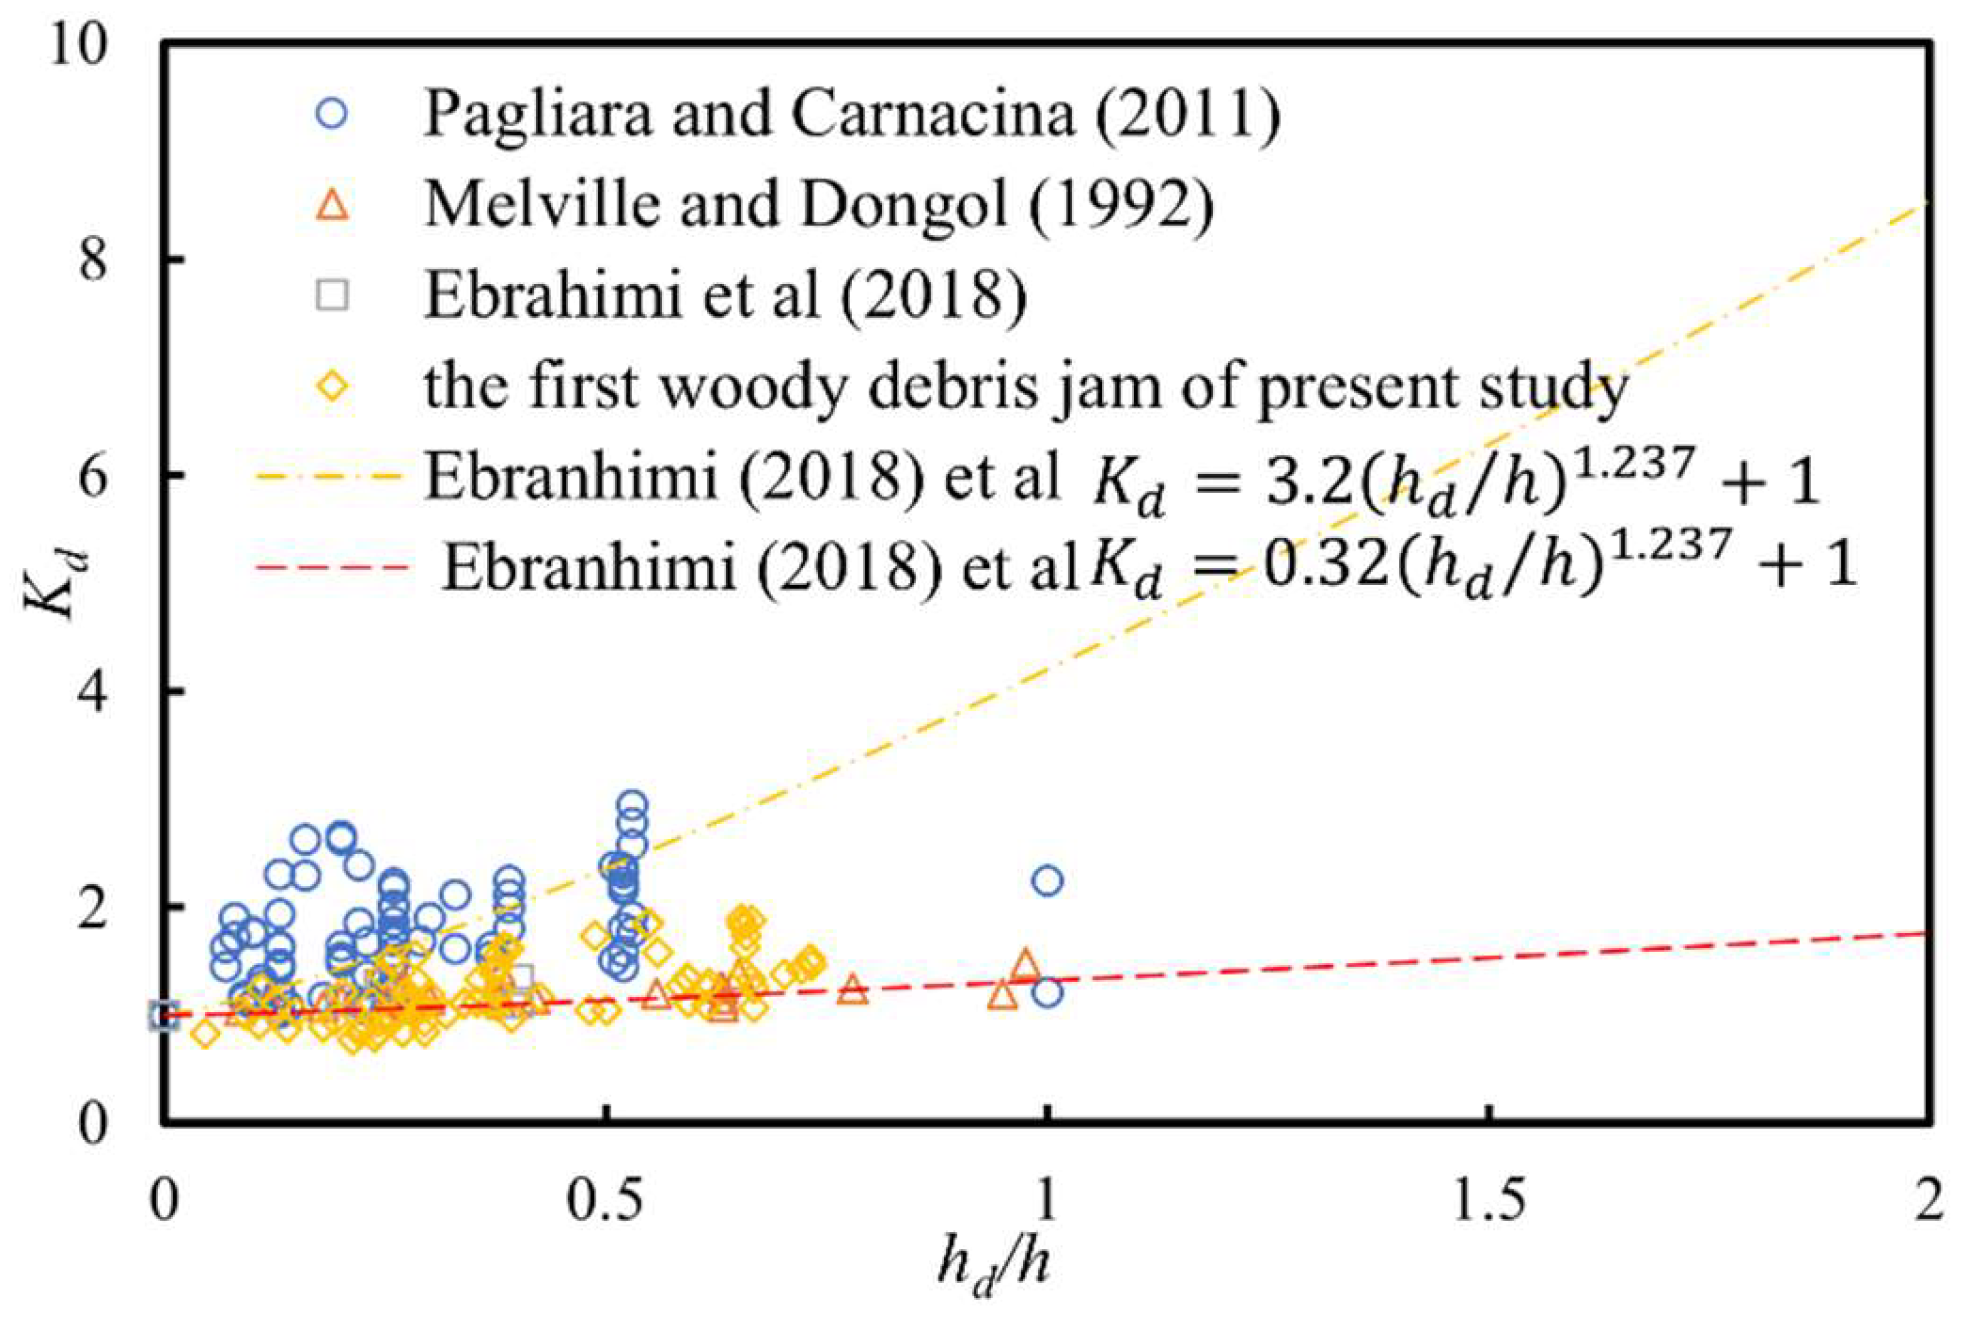
Furthermore, Pagliara and Carnacina [46] also considered the effects of the length of debris jam on scour depth, and they highlighted the influence of the downstream extension of the debris jam. In addition, Ebrahimi et al. [47] used various dimensions of the debris block to investigate its influence on sharp nose-pier scour. They found that the height of the debris jam determined the effects on scour depth.
d s d s 0 = 1 + χ h d / h 1.237
where d s was the equilibrium scour depth in the presence of a woody debris jam; d s 0 was the equilibrium scour depth without the presence of a debris jam; χ was 0.32 or 3.2 depending upon the experimental source data.
A static debris jam, which meant that the debris jam was shaped like a block (rectangular or triangular) and was quasi-independent of the flow condition, was widely used in the mentioned studies. Static debris jams might not realistically reflect the characteristics of woody debris jams. Moreover, the dimensions of debris were assumed constant while the realistic formation of the debris jam normally includes entrainment, growth, and failure.
A dynamic debris jam, in which the debris jam is formed piece by piece of woody debris and adapted to flow conditions, can directly reflect the process of formation and characteristics of debris jams. Panici and de Almeida [48] investigated the formation, growth, and failure process of debris jams via dynamic debris jams. In that study, the debris Froude number was used as the key factor to illustrate the critical dimensions of woody debris jams. Schalko et al. [49] also used dynamic woody debris pieces to investigate the accumulation probability of debris.
Few studies have examined the influence of dynamic woody jams on bridge pier scour. A static debris jam in the form of a manual debris block cannot properly represent the debris jam formed in reality as it has no relation to flow conditions and the process of debris formation and growth. In order to bridge this gap, the present study applied a dynamic debris jam to investigate its influence on single bridge pier scour in clear water conditions, and the hydraulic head induced by the woody debris jam was also inspected.

2. Materials and Methods

2.1. Experiment Setup

A comprehensive experimental program was developed to investigate the influence of a dynamic woody debris jam on single bridge pier scour. The physical model tests were conducted in a flume in the Hydraulic Laboratory of the University of Ottawa, Canada. The flume was 30 m long, 1.5 m wide, and 0.7 m deep (Figure 1). Two flow straighteners were set up close to the inlet of water flow to ensure the uniformity required for the flow. A 0.3 m high false plate was set downstream in the flume and was used as a test area for the experimental setting.
A pier with a diameter D p 0.09 m was placed in the sand bed at the test area and the d 50 for the sand was 1.16 mm with a gradation σ of 1.22. Woody dowels were used to represent woody debris; these were cut into 30 cm sections with the same diameter of 1.27 cm as Figure 2a was shown. In total, 792 woody pieces were prepared for the tests.
Various instruments were applied to monitor and record the necessary data for analysis, and the arrangement of instruments was shown in Figure 2b. Two HERO5 Black GoPro cameras (https://gopro.com/en/us/update/hero5, accessed on 29 September 2022) were set up to capture the dimensions of the woody debris jam, and a Linear model with a sampling rate of 60 fps was applied. One GoPro camera was fixed at the top of the flume at a height of 1.74 m above the sand bed while the other one was placed underwater in a transversal direction near the sidewall from upstream of the pier. Three endoscope cameras (5.0 MP USB Endoscope, NIDAGE 50FT Inspection Camera) were used and set inside the bridge pier as Figure 2c was shown, and the sampling rate of 20 fps with an image size of 2592 × 1944. One endoscope camera was installed at the top and positioned near the water surface of each test while the other two endoscope cameras were placed at an angle to obtain a wider view with one of the heights of about 5 cm above the sand bed and another one of 6 cm below the sand bed to capture the scour depth. A ruler was installed along the center line inside of the pier to facilitate observing the vertical development of the scour hole close to the pier. In addition, two MassaSonic PulStar ultrasonic distance sensors (https://www.massa.com/industrial/ultrasonic-sensors/pulstar, accessed on 29 September 2022) were applied to record the time history of the water level around the woody debris jam with a sampling rate of 5 Hz. One was fixed upstream of the pier at a distance of 0.5 m close to the centerline, and another one was fixed at 0.2 m behind the pier. A Vectrino Acoustic Doppler velocimeter (ADV) (https://www.nortekgroup.com/products, accessed on 29 September 2022) was applied to measure the vertical distribution of velocity at 0.7 m upstream of the pier. Each ADV point measurement had a duration of 2 min with a sampling rate of 100 Hz. A filter developed by Rennie and Hay (2010) [50] was applied to remove the noise of ADV data, and time-average velocity was obtained for each point.

2.2. Instrument Calibration and Error Evaluation

The accuracy of the MassaSonic PulStar ultrasonic distance sensors was 0.25 mm. The sensors were calibrated using different known water levels such that a relation between the electronic signal and water level was derived. The go-pro cameras were also calibrated and found that the linear model was able to capture the dimensions of the debris jam at a linear error of 0.673%. The endoscope cameras placed inside the pier directly read the scour depth by recording the time-varying reading of the sand bed level during each test. A wide-angle was used to monitor the range of scour depths, and the endoscope cameras were calibrated with an average error of 4.38% due to angular perspective.

2.3. Experiment Matrix

Uniform and steady flow were applied to investigate scour depth under various flow conditions in the presence of the woody debris jam. A vertical distance of 2 cm was set as the flow velocity measuring space interval close to the water’s surface while 1 cm was used closer to the sand bed. As a down-looking ADV was utilized, a log law formula [51] for vertical velocity distribution was obtained by linear regression and was then used to calculate the velocity magnitude close to the water’s surface.
u = u * κ l n z + u * κ 30 k s
where u was the local velocity at height z ; z was water level elevation; u * was the shear velocity; κ was the von Karman constant (0.41), and k s was the bed roughness. Fitted velocity profiles are shown in Figure 3, from which the depth-averaged velocities for each test were calculated by integration (Table 1).
The mean flow velocity was in the range of 0.223 to 0.311 m/s and the water depth varied between 0.185 and 0.326 m. The detailed information for the hydraulic conditions of each test is presented in Table 1. It was noticeable that the flow intensity U / U c was smaller than 1.0 to ensure that only clear water scour occurred for all tests.

2.4. Scale Effects

The relation between prototype object and model object was described by the parameter
λ = P r o t o t y p e   v a l u e M o d e l   v a l u e
Based on Froude similitude, a value of λ = 30 would mean the length of the prototype log was 9 m while the pier diameter was 2.7 m. Based on the scale factor of λ , the length of the prototype log would be 9 m while the pier diameter would be 2.7 m. Debris length of 9 m is typical in prototype debris jams on bridge piers, although even longer pieces have also been observed in the field (Diehl) [23]. Prototype flow conditions were at a range of 1.15–1.71 m/s for mean velocity and 5.53–9.78 m for water depth. In addition, Reynolds number Re in present tests was in the range of 47,104~86,458, and the flow was fully developed. Based on the Hjulström diagram values of U c for given particle sizes, and equivalent U / U c ratio in lab and prototype, the prototype sediment size would be approximately 20 mm (i.e., coarse gravel). Note that the sediment scale factor deviates somewhat from λ .

2.5. Procedures

For each test case, a base case test without debris was studied under the same flow condition. Firstly, the pump valve was opened with a small discharge to slowly increase the water level in the flume to first wet and submerge the sand bed to avoid scour from occurring before the designed flow condition was achieved. Prior to the flow condition reaching the prescribed valve position, the endoscope video camera was turned on to monitor the scour depth in front of the pier. Then, the time was recorded when the designated test flow rate was applied. The ADV was used during the base case bank tests (without debris) to measure the vertical distribution of mean velocity with a sampling rate of 100 Hz. The test flow rate was then used for the experimental run. The same procedures were used for the test in the presence of a woody debris jam to reach the set flow conditions. The endoscope video cameras with a sampling rate of 20 fps and GoPro camera with a sampling rate of 60 fps as well as ultrasonic distance sensor (US gauge) operating at a sampling rate of 5 Hz were also turned on before the set flow rate condition was achieved. Then, debris pieces were released 3.0 m upstream of the pier at a frequency of 12 pieces per minute (average of one piece every 5 s) after the steady flow condition was reached. There were some unavoidable unstable flow conditions that occurred when the flow rate reached its set value for each test. Thus, a 2-min time interval was used for the stable flow conditions to occur; the time ending of the interval was then used as the scour initiated. Some light scours occurred for some sets prior to this time origin, but as shown by the endoscope video camera had already been turned on and had recorded the video images of the scour, this had a minimal influence on the scour results. The duration of all the tests was one hour, and it might not reach an equilibrium scour. The reason for selecting one hour was considering the feasibility and respect the fact that the initial one hour could cover the rapid change period of scour depth. A retention mesh and collection box located behind the flume end weir were used to capture the woody debris.

3. Results

3.1. Scour Depth

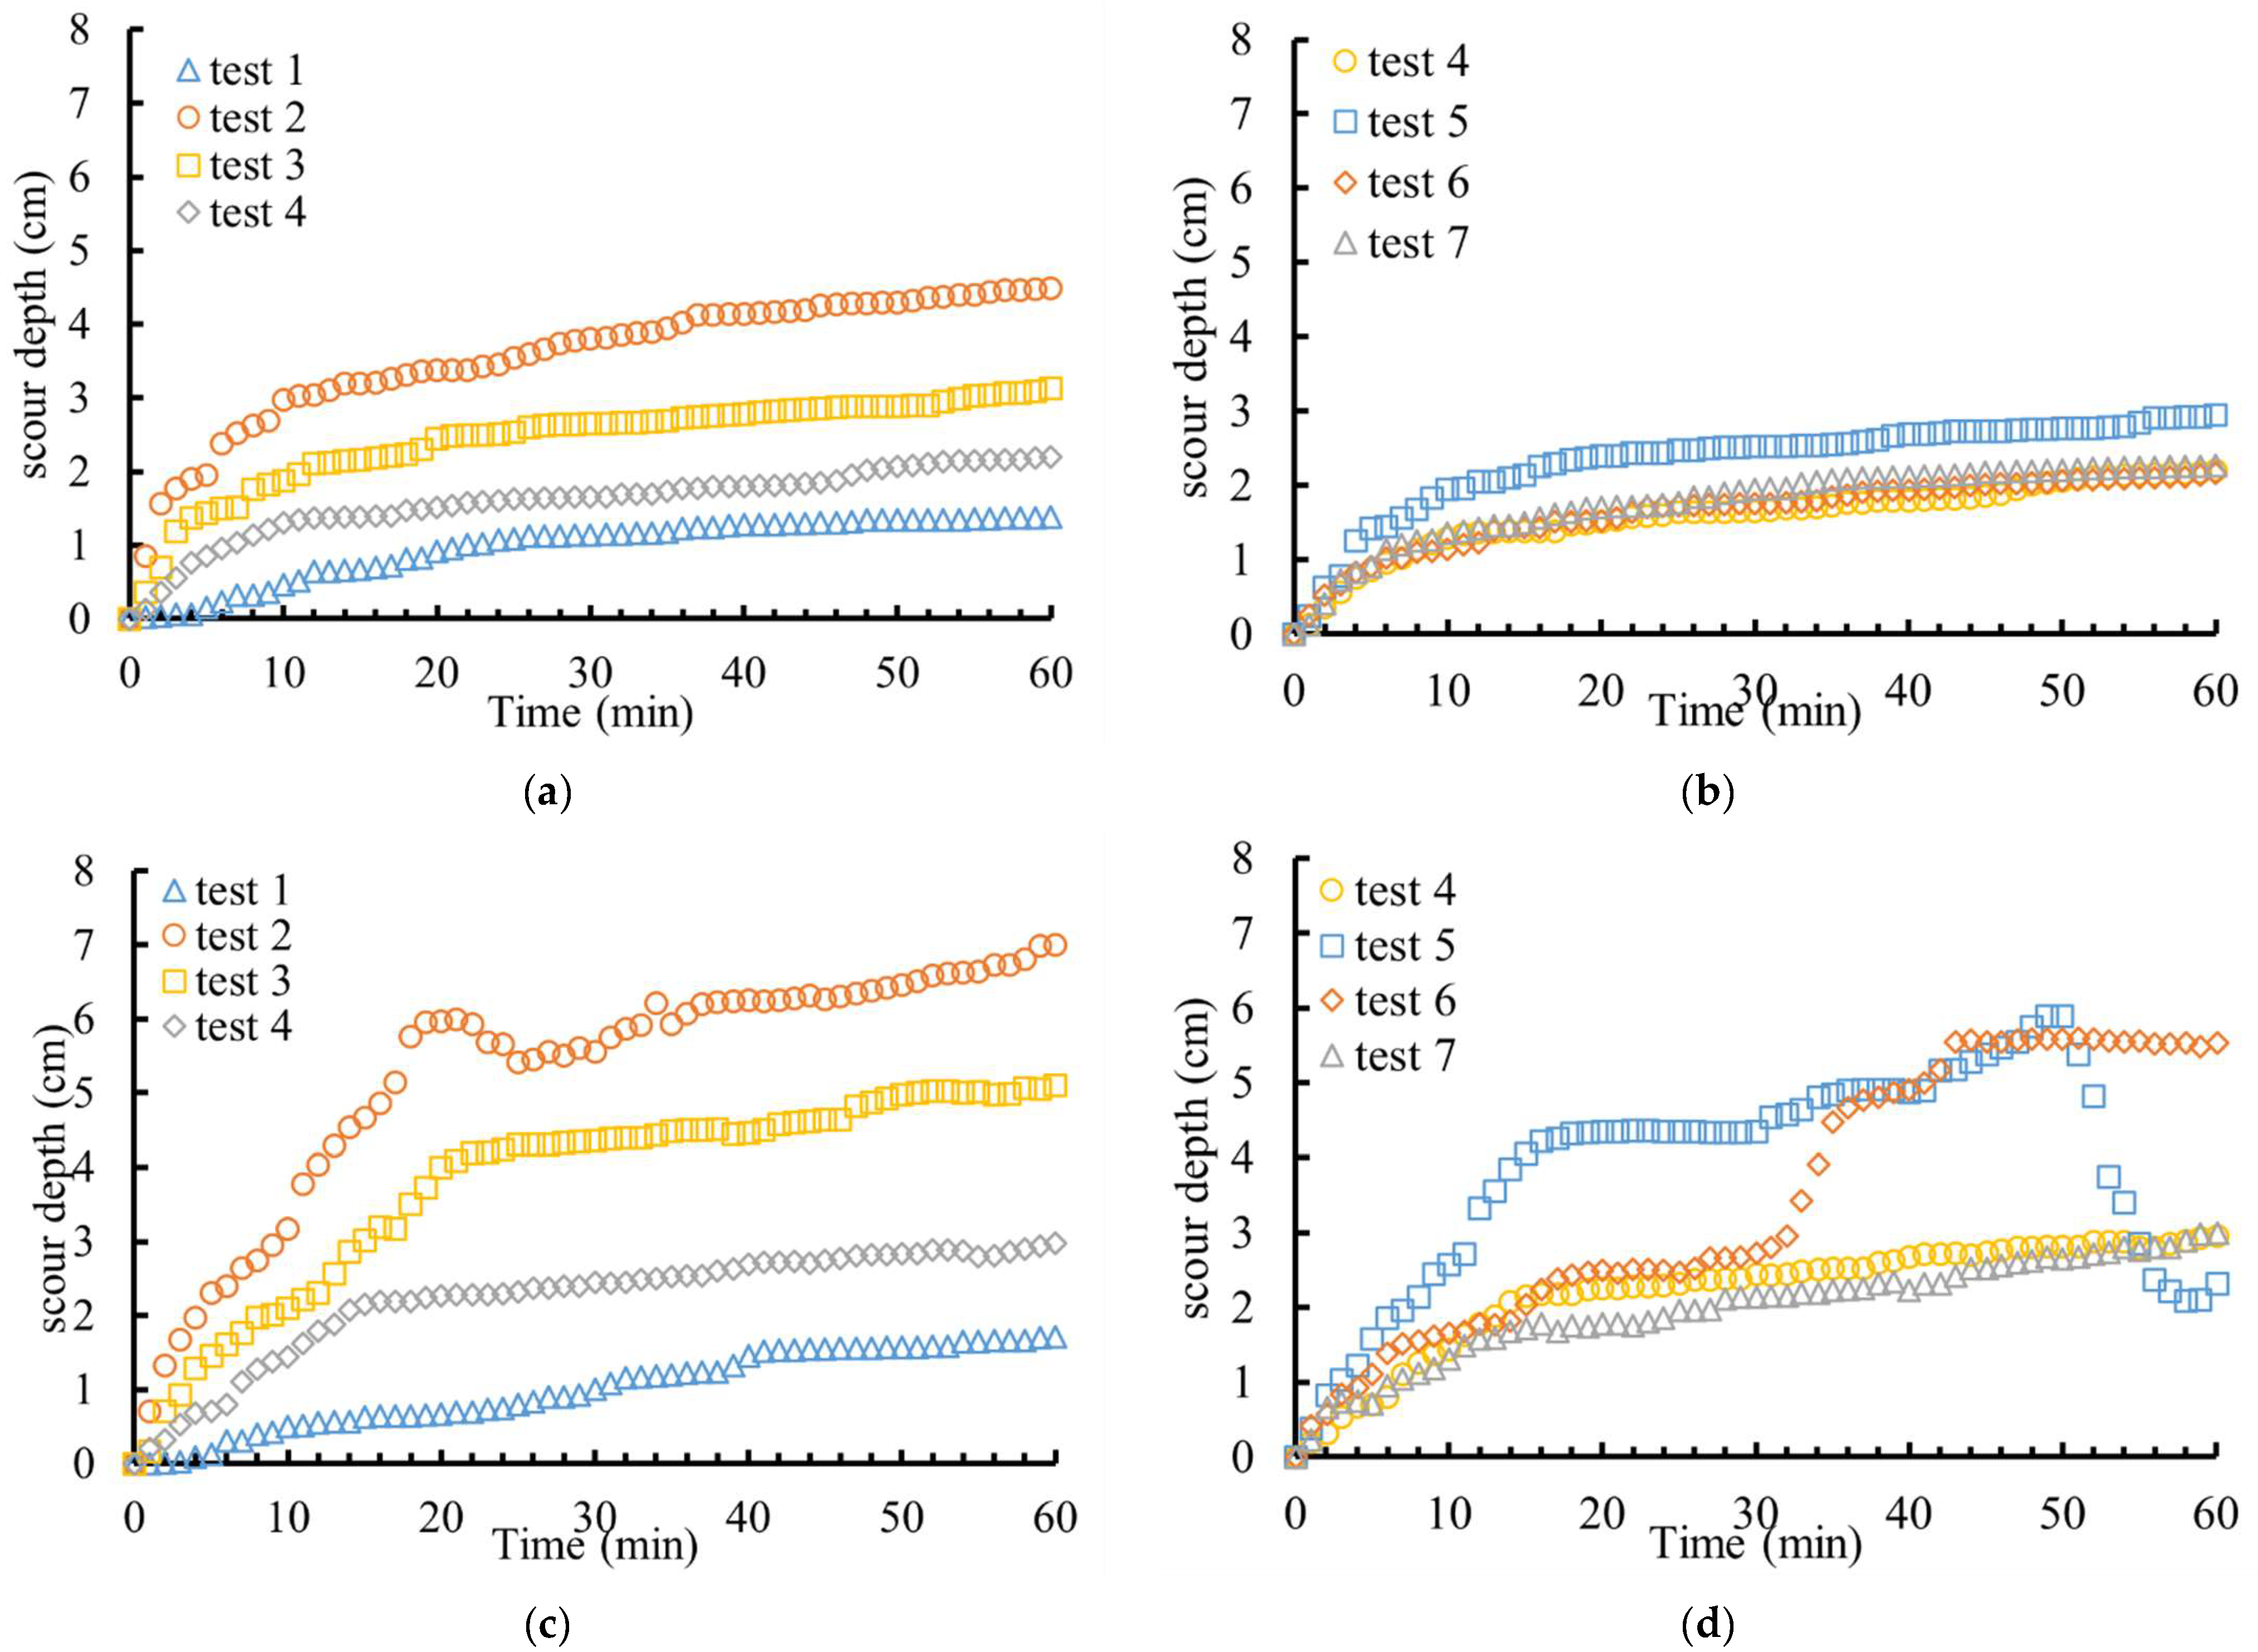
The time evolution of the scour depth was determined using the video capture by the endoscope camera. The time evolution of the scour depth of all tests in the presence or not of the debris jam is shown in Figure 4.
Blank tests, with no debris involved, are presented in Figure 4a,b. The tests shown in Figure 4a have the same water depth but varied mean velocity; the results clearly indicated that the increase of mean velocity results in greater scour depth. This has already been clarified in previous studies [39,52], as U / U c was used as a variable to compute the equilibrium scour depth in their studies. In addition, the evolution of scour depth in the presence of woody debris is shown in Figure 4c,d, demonstrating that scour depth was substantially increased compared to the test without debris: generally, 1.2–2.5 times greater scour depth. On the other hand, the process of scour depth development in the presence of woody debris was much more irregular due to the irregular flow caused by the woody debris jam. Further analysis of the influence of woody debris on scour depth is provided in the following sections.

3.2. Woody Debris Jam

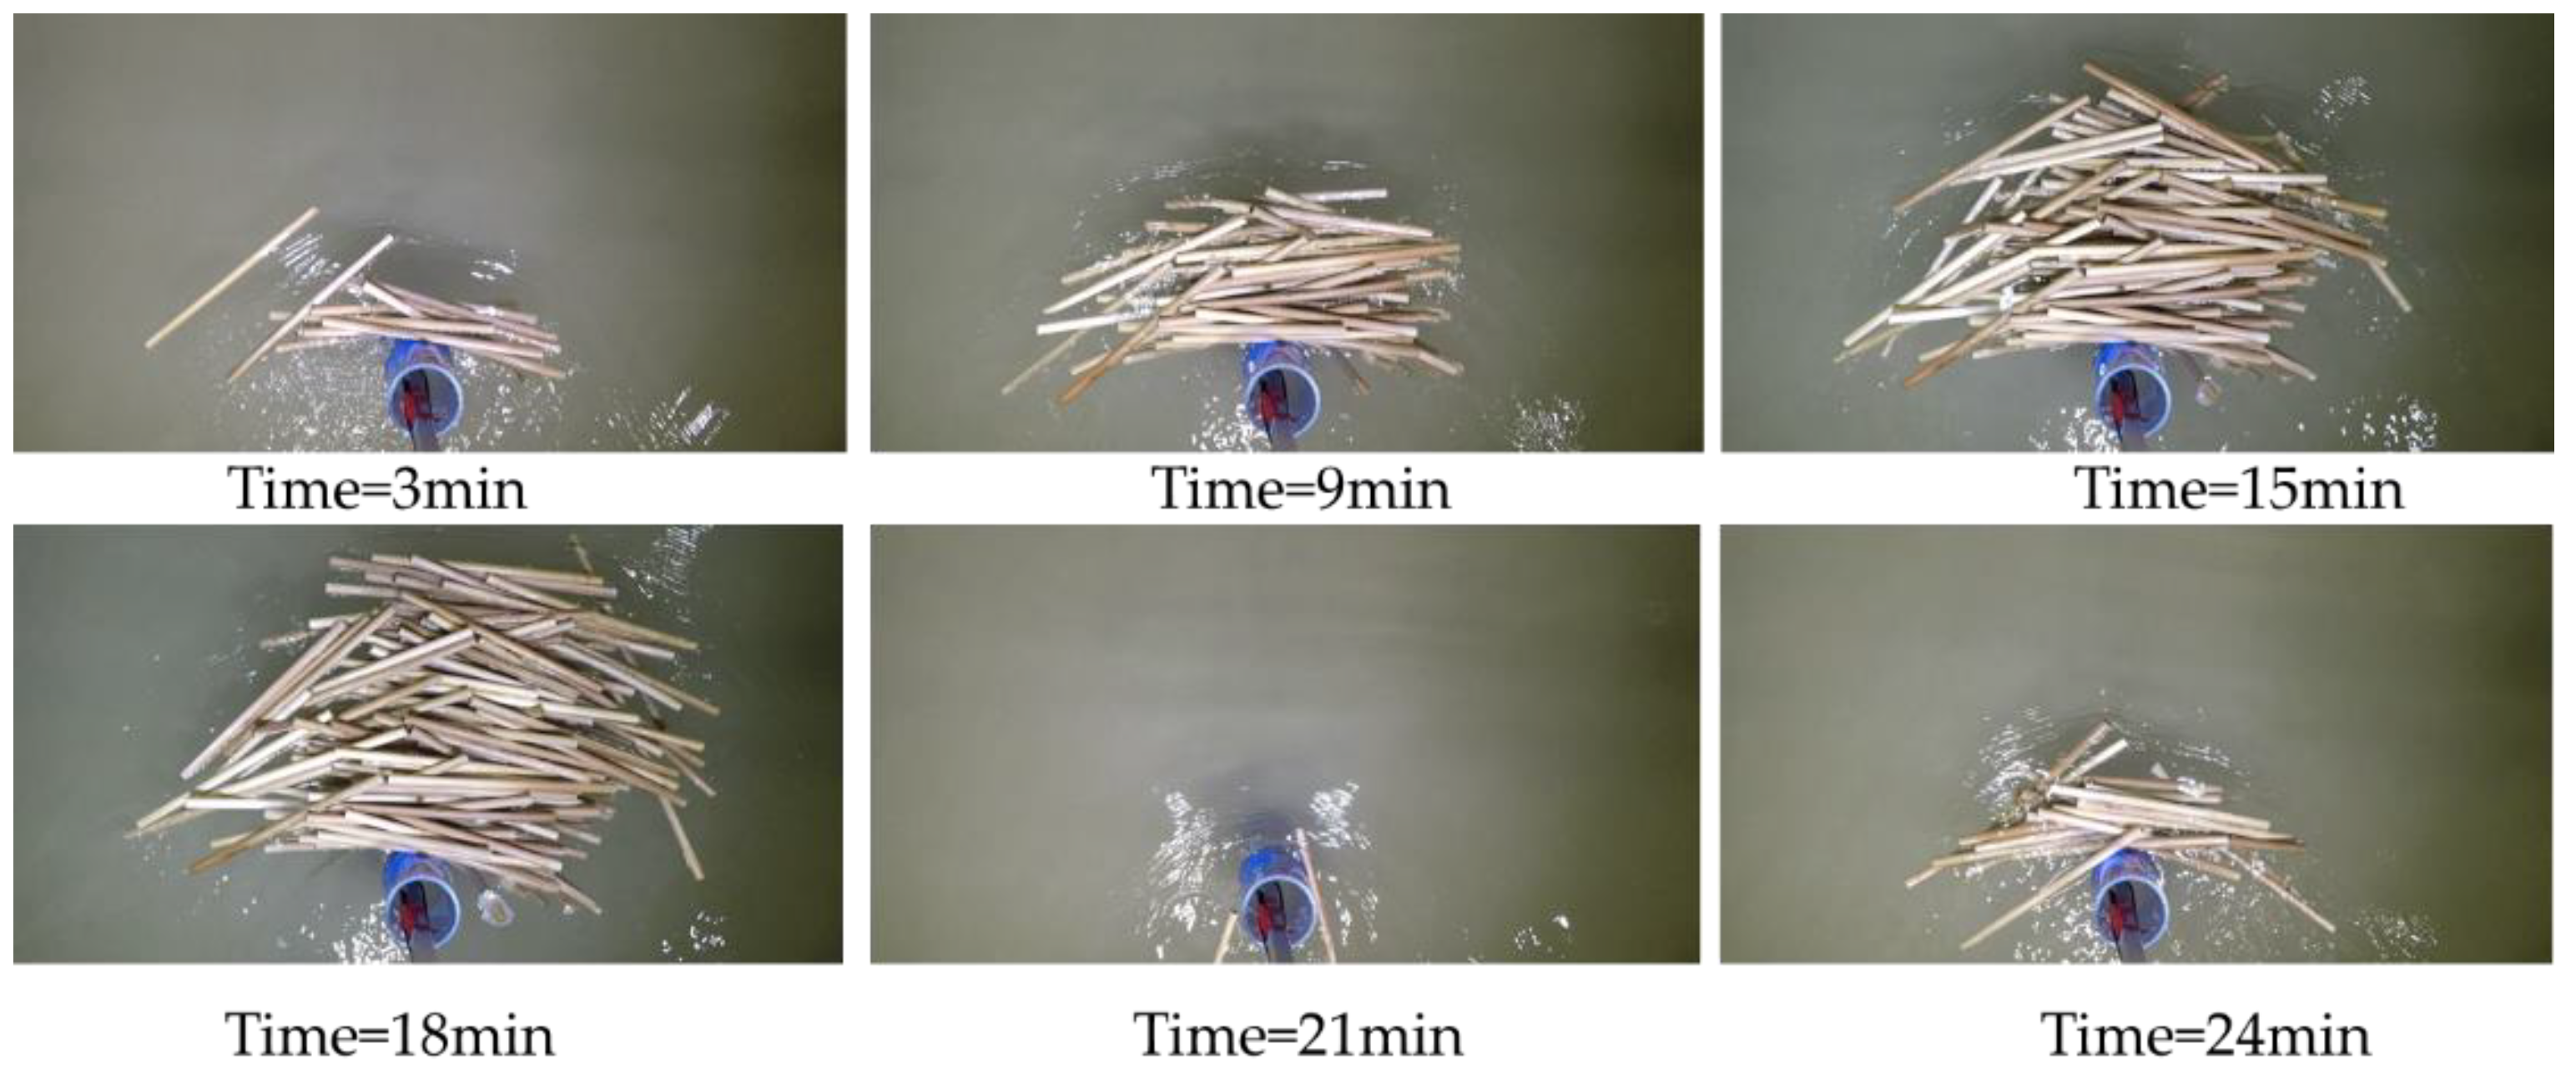
The formation of the woody debris jam was initiated by one or several woody debris pieces, which is defined in the literature as the key debris or log as Manners and Doyle [53] defined. The first key debris or several key debris pieces formed a stable structure in front of the pier, Then, the woody debris jam continued to grow as more debris pieces were captured by the key debris. It is also noted that when the debris jam exceeded a certain critical size, the woody debris jam failed. This has already been clarified by [48,54]. In the present tests, the duration of a woody debris jam from formation to failure was on average 15–20 min, and at least 3 woody debris jams were formed for tests 2–7 during a one-hour duration. A typical case (test 1) for the growth, failure, and rebirth was shown in Figure 5.
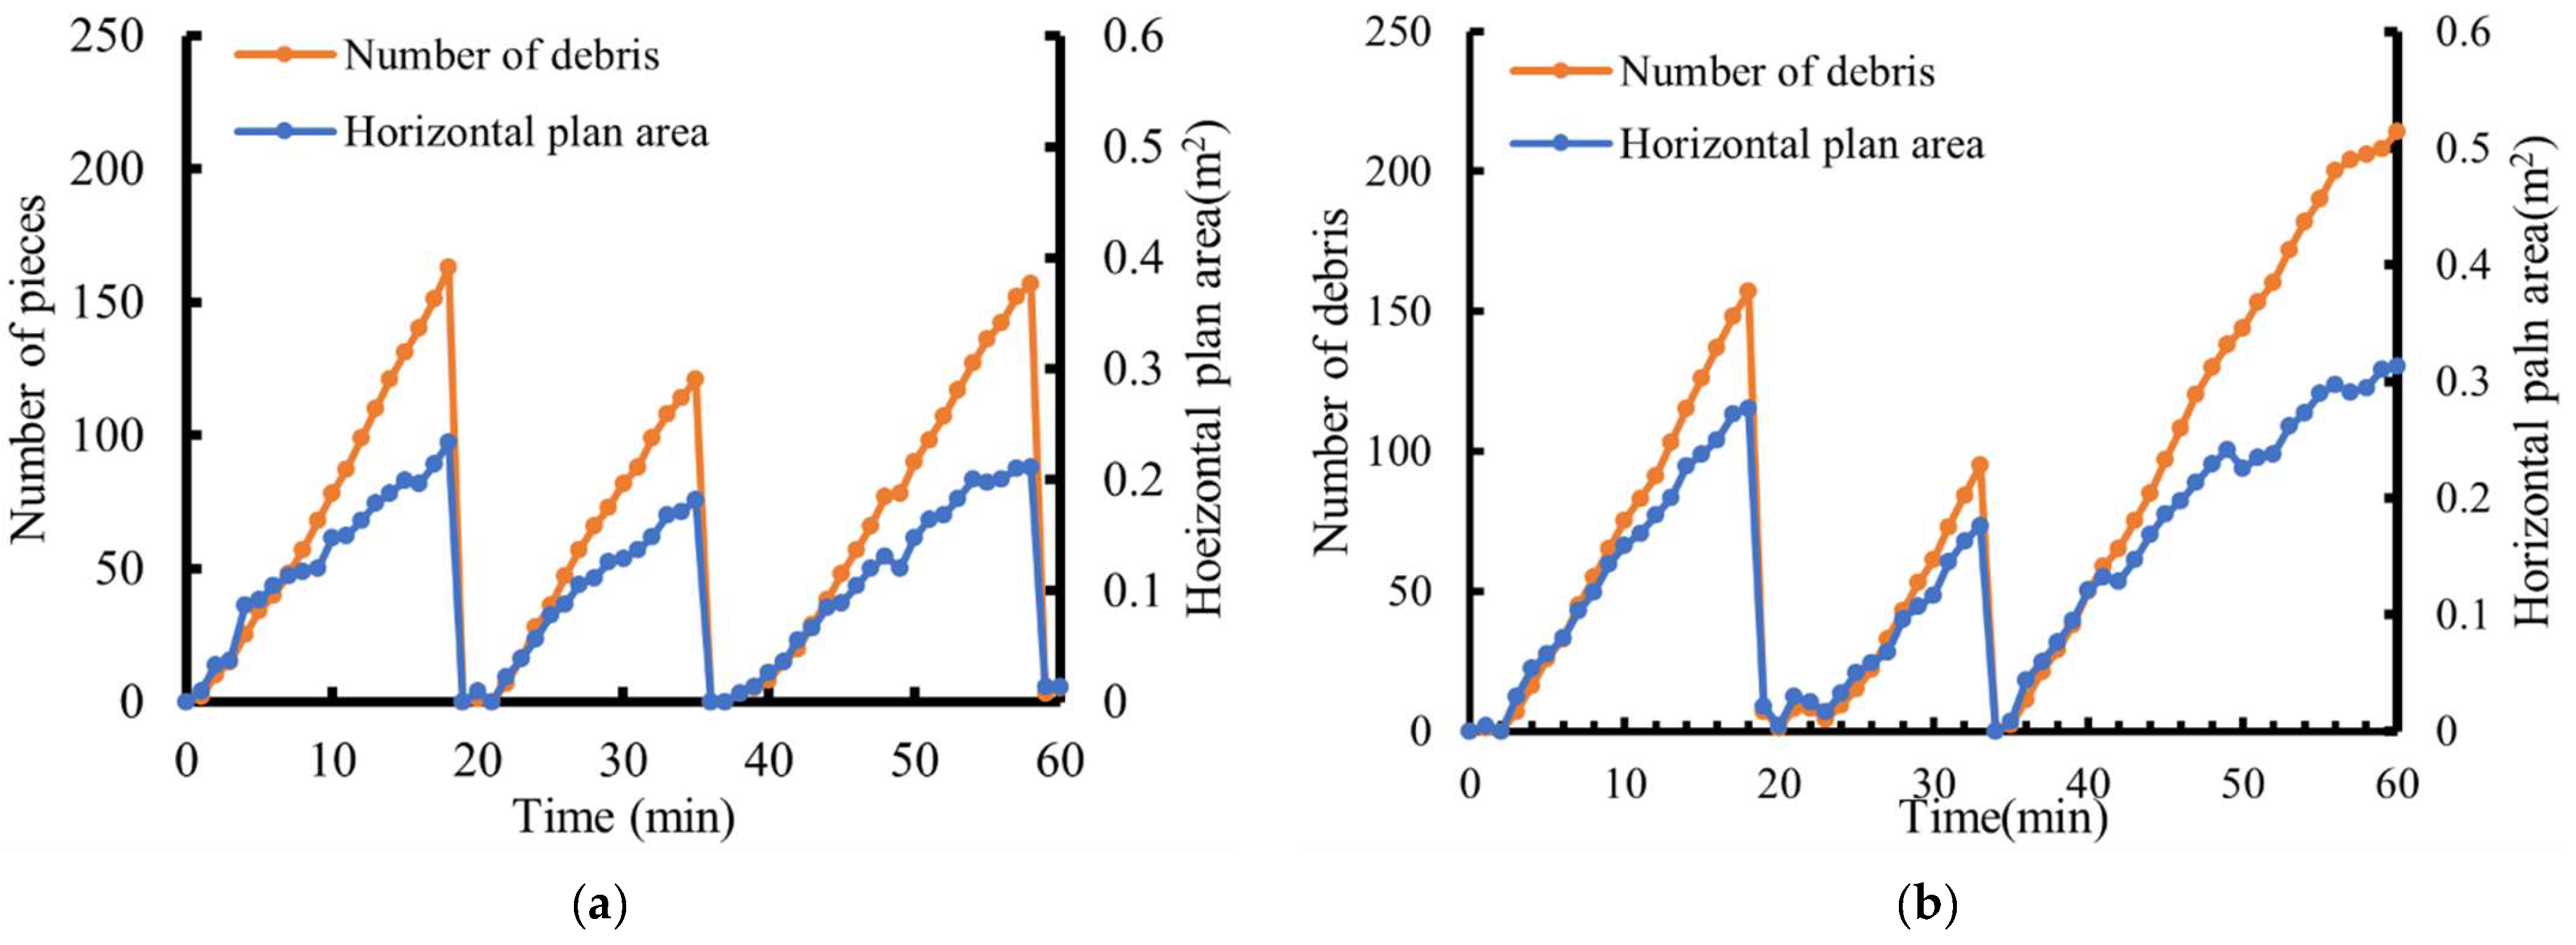
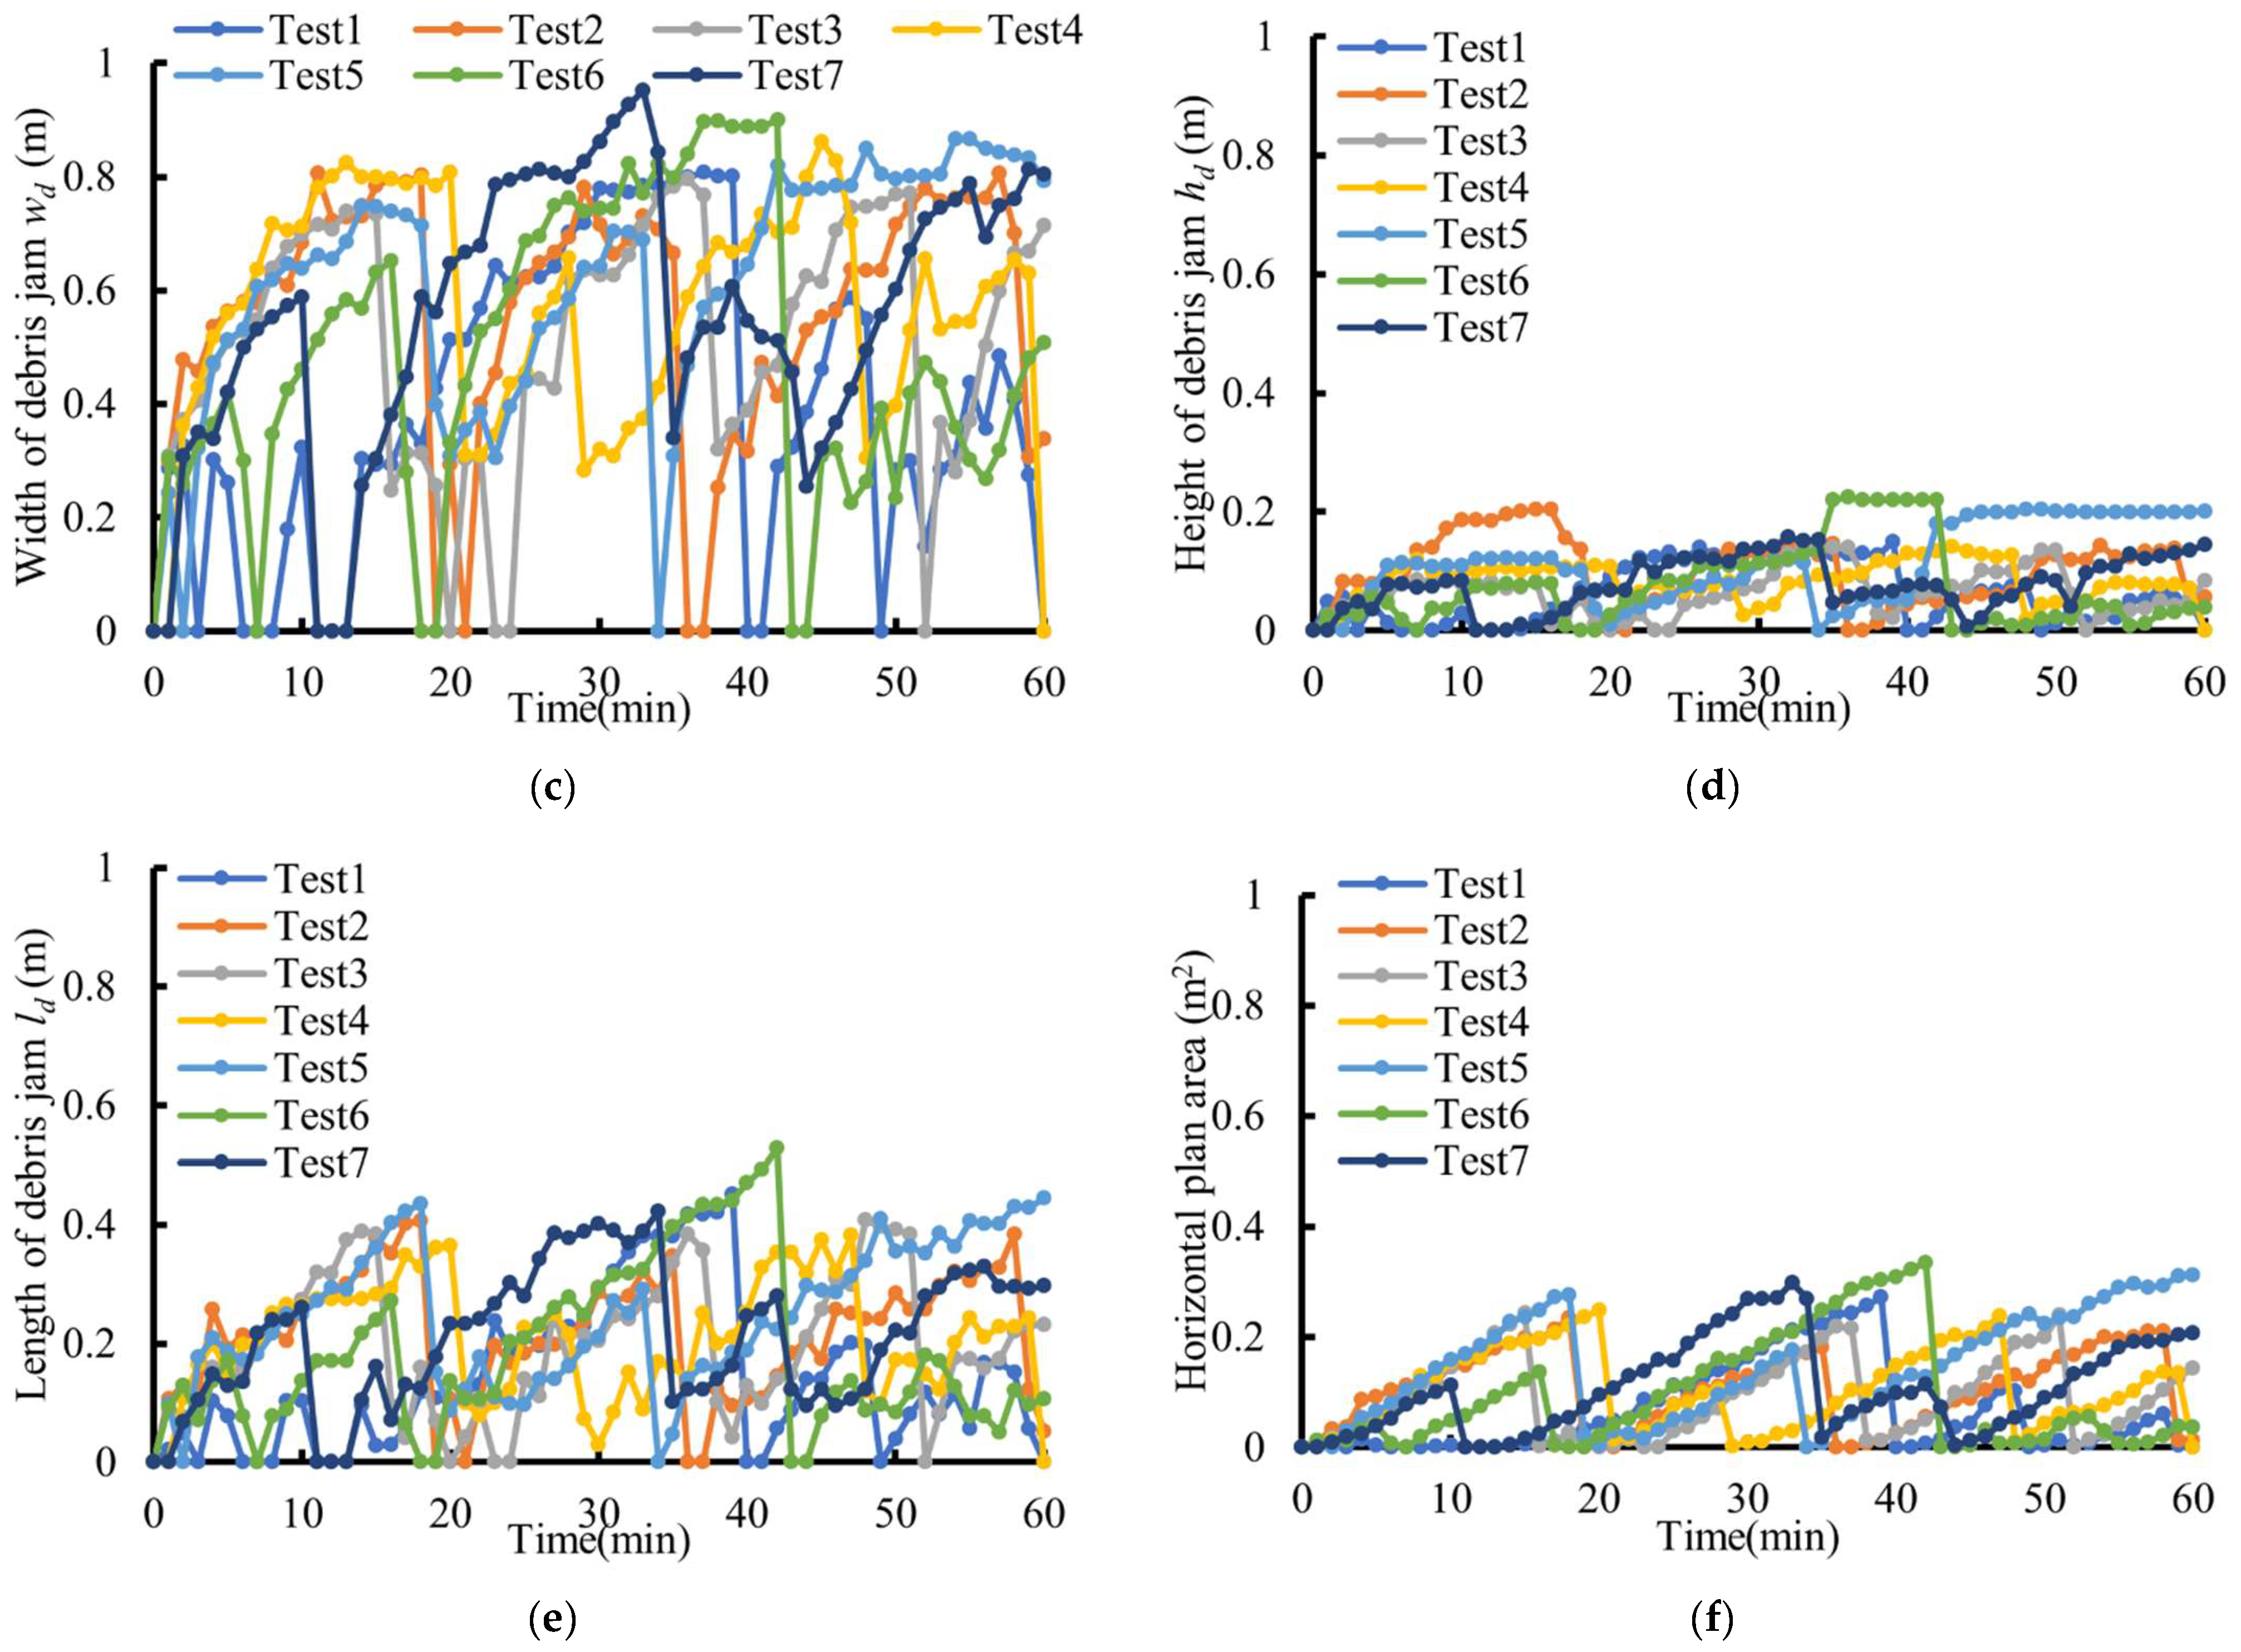
The time evolution of the dimensions of the woody debris jam was recorded by the GoPro video camera. The plane area of the woody debris jam was obtained by employing an open-source software, ImageJ (https://imagej.nih.gov/ij/, accessed on 29 September 2022). ImageJ was based on Java programming language and is used to analyze the information on video images and was developed by the National Institutes of Health and the Laboratory for Optical and Computational. ImageJ helps deal with the irregular geometry of woody debris jams and can provide the plane area of the debris jam by outlining its geometric boundary. The number of woody debris pieces was also analyzed by counting how many pieces were captured and remained attached to the front of the pier; meanwhile, the number of debris pieces left in the debris jam was also counted by analyzing the video recordings every second. The results of tests 2 and 4 are shown in Figure 6a,b. The temporal evolution of the dimensions of debris jam as well as the horizontal plan area was also presented in Figure 6c,d. The height of debris jam h d referred to the distance of the bottom of debris jam to water surface in front of the pier. The length of debris jam l d referred to the maximum longitudinal distance of the debris jam along the centerline in the water surface, and the width of debris jam w d referred to maximum width of debris jam in lateral direction in front of the pier.

3.3. Time-History of the Water Level

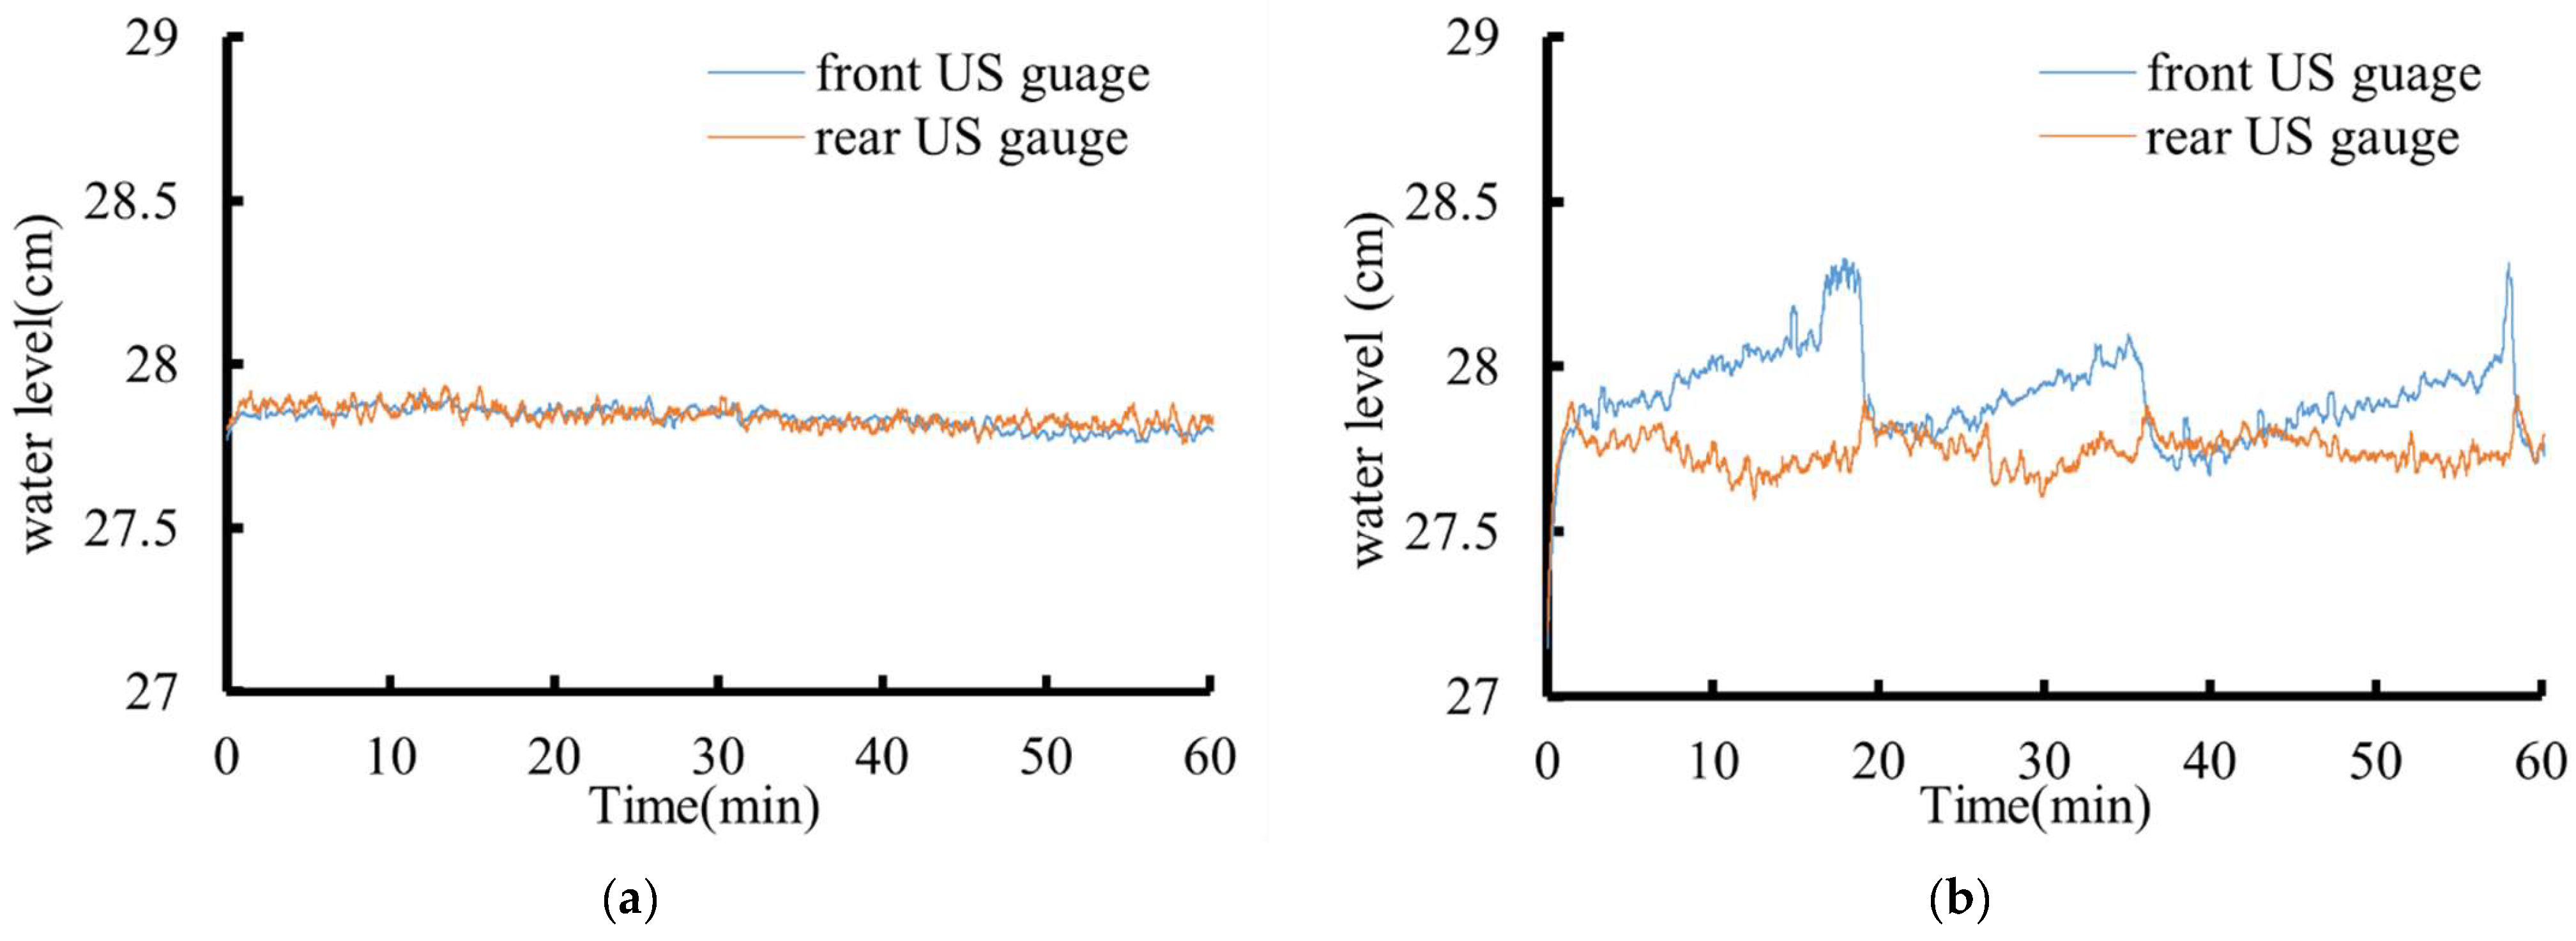
Ultrasonic distance sensors (US Gauge) were used in the present study to record the time history of the elevation of the water surface and the results are shown in Figure 6. Two ultrasonic distance sensors were used: one of them was set up in front of the bridge pier while the other one was set up behind the pier. A fitting curve app in MATLAB was also applied to smooth the water level fluctuations. The difference in the water surface elevation with and without the pier was small in the absence of the woody debris jam as shown in Figure 7a. It was observed that the difference between the two ultrasonic distance sensors significantly increased in the presence of the woody debris jam at the face of the pier (Figure 7b). In order to quantify the water rise caused by the woody debris jam, the hydraulic head induced by the woody debris jam of one set was used and defined as:
Δ h = Δ h h Δ h n h
where Δ h h was the difference in the water surface elevation between the front ultrasonic distance sensor and the one behind the pier in the presence of woody debris; Δ h n h was the difference in water surface elevation between the front ultrasonic distance sensor (US gauge) and the one behind the pier without the presence of woody debris.
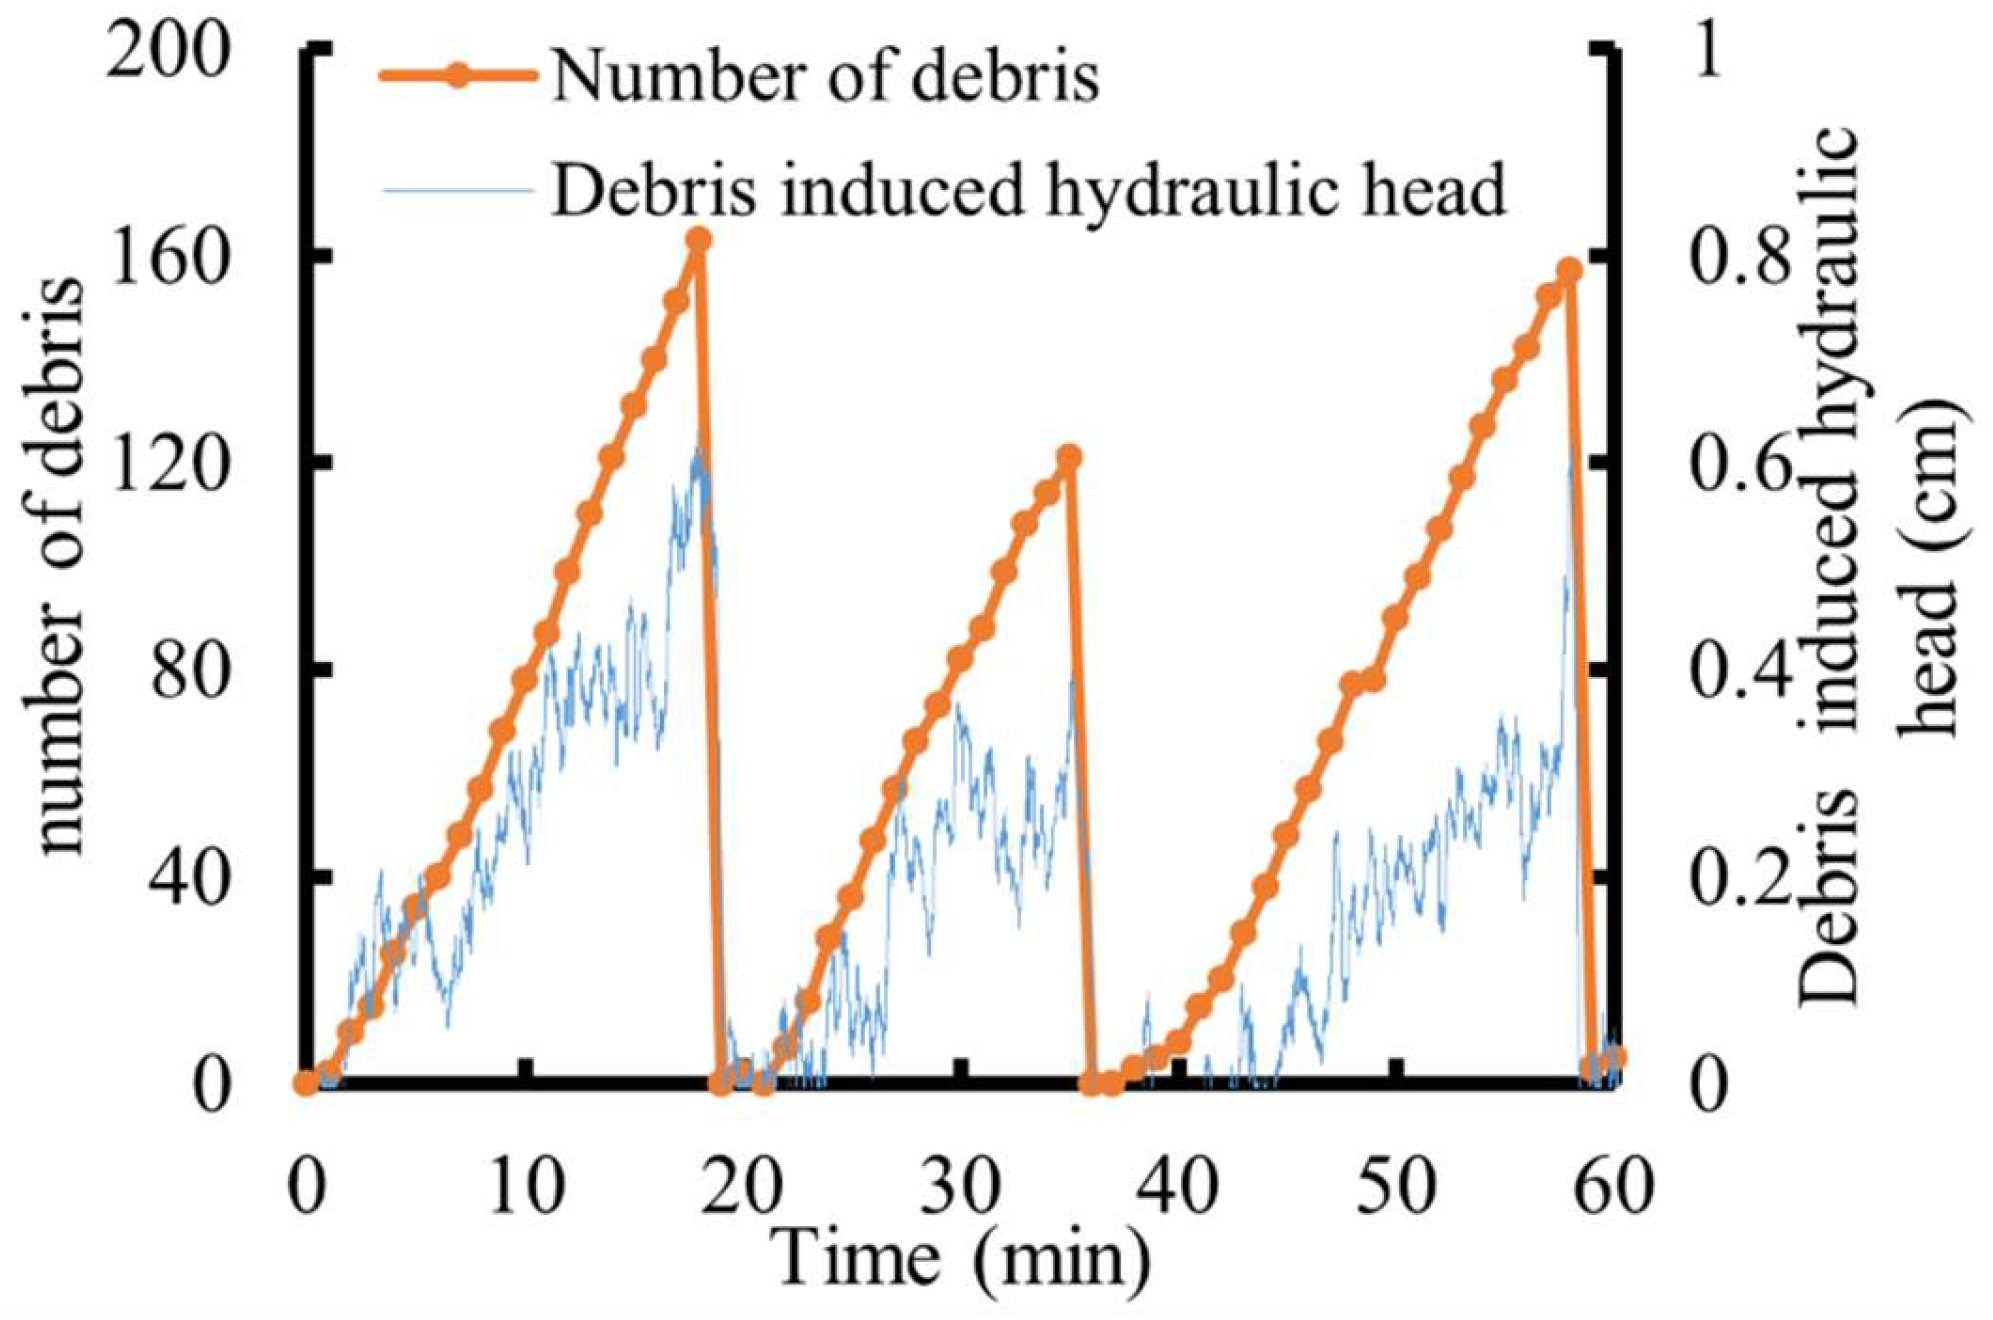
Based on Equation (6), the debris-induced hydraulic head was computed and presented in Figure 8, as a function of the number of woody debris pieces, for test 2. It was observed that the woody debris jam debris induced hydraulic head was directly correlated with the number of woody debris pieces accumulating in the debris jam—as such, a larger number of woody debris pieces accumulated into the formed jam generated a larger hydraulic head.

4. Analysis

Debris-induced hydraulic head or scour depth were correlated to the flow parameters h , u , F r , R e , u * , debris characteristics l , d d , dimensions of the woody debris jam l d , w d , h d , and the pier size D p and sediment characteristics d 50 , σ .
Δ h = h , u , F r , u * , R e , l , d d , l d , w d , h d , d 50 , σ , D p
where F r was the Froude number; Re was the Reynold number; l was the length of the debris piece.

4.1. Debris Jam-Induced Hydraulic Head

As the woody debris pieces accumulated at the front of the pier, the water surface level was not consistent in front and behind the pier. The hydraulic head was influenced by the number of woody debris pieces accumulated in front of the pier.
Nondimensional analysis was applied though using the flow depth approach, while the debris characteristic was not changed, such that the relative hydraulic head caused by the woody debris jam was mainly related to the hydraulic condition and the dimensions of the woody debris jam:
Δ h h = h , u , F r , u * , R e , l d , w d , h d , D p
Various approaches have been tried before to find the correlation between woody debris jams and debris-induced hydraulic heads. According to experimental observations in this study, as the woody debris jam was growing through an increase in the number of woody debris pieces captured, its various dimensions grew commensurably. Thus, it was not appropriate to apply only one dimension like the height or width to quantify the influence caused by the woody debris jam. Finally, the results indicated that the blockage ratio, which was referred to the ratio of the flow opening blocked by the maximum debris jam (vertical projected area) in stream cross-section consistent with [55], can generally be considered to quantify the effects of a woody debris jam on the hydraulic head:
Δ A = 0.5 h d w d b h
where Δ A was the blockage ratio while the geometry of the woody debris jam is approximated to be triangular, b was the width of the flume; h was the approach flow depth before the debris jam formation.
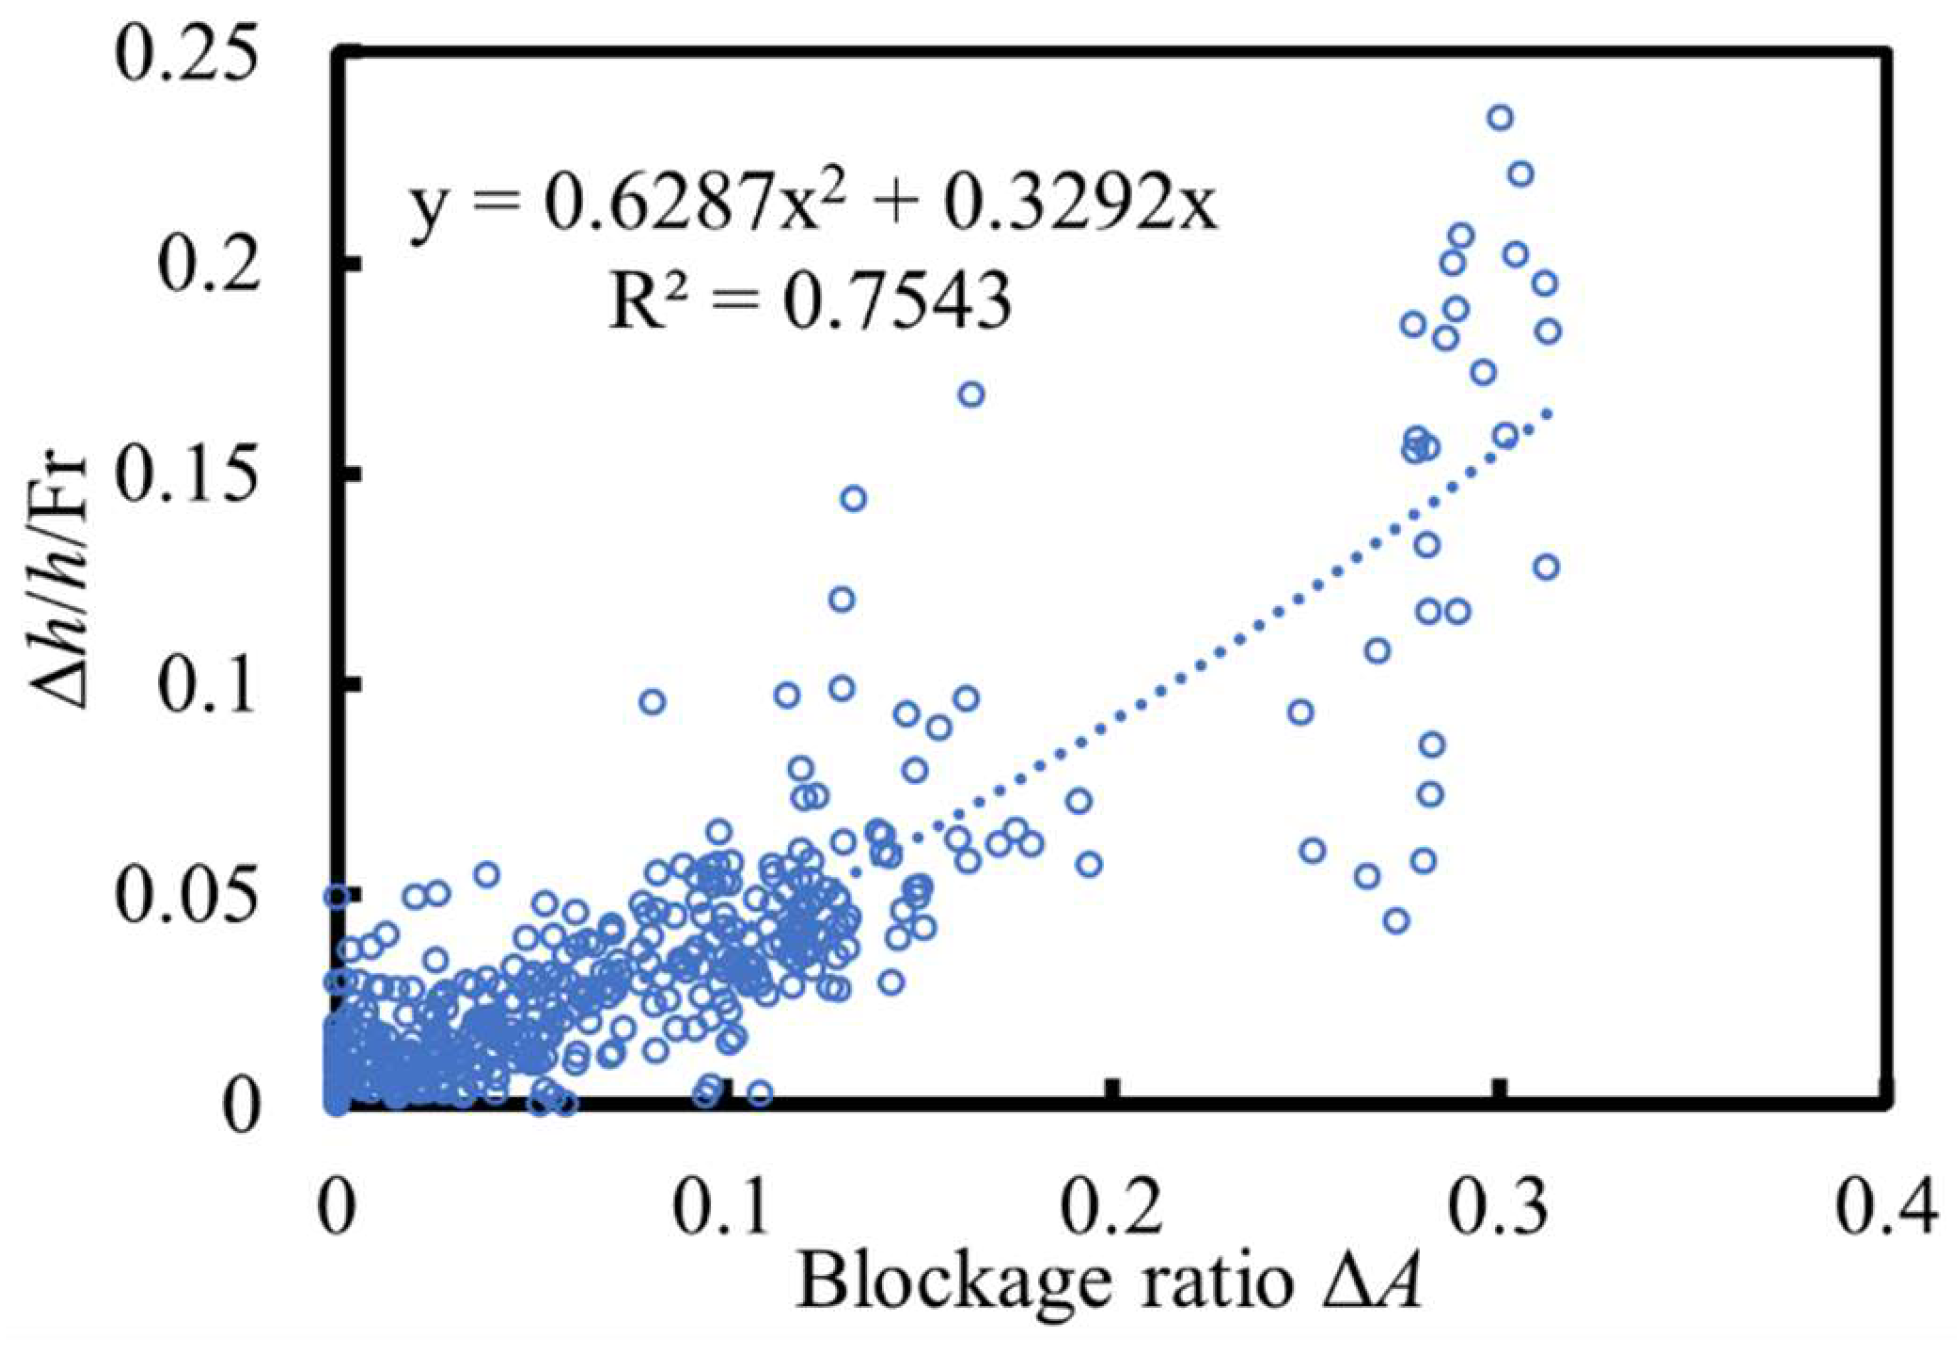
The Froude number F r , a non-dimensional parameter characterizing the flow, was used as a common denominator. Thus, results from all tests can be plotted together to investigate the possible relation between the blockage ratio generated by the debris jam and the relative hydraulic head as a function of the Froude number as shown in Figure 9. When more debris pieces were captured in front of the bridge pier and thus formed a larger debris jam, this caused an increase of blockage ratio, and the relative hydraulic head was also larger.
The height of woody debris jams h d , referred to as the distance from the bottom of the debris jam to the water surface, was obtained by the endoscope video camera placed inside the pier—only the maximum height closest to the pier was obtained. Considering the fact that the height of the woody debris jam is difficult to obtain, especially during a natural flood event, the plane (horizontal) area of the woody debris jam was then used to determine the relationship between the woody debris jam and the debris-induced hydraulic head. The correlation between the horizontal plane area of woody debris jam and the projected vertical area of woody debris jam is shown in Figure 10a. These results showed that the plane area of the woody debris jam was well correlated with the vertical debris jam area; thus, one should consider both the plan and vertical dimensions of the debris jam to quantify its influence. The coefficient α was defined to relate the plane area of woody debris jam with the vertical area:
α = 0.5 h d w d A r e a p l a n
where α was 0.266; A r e a p l a n was the horizontal plane area of woody debris obtained by Image J analysis.
The horizontal plane area of the woody debris jam can be feasibly captured in practice as several approaches can be used to take photos of the woody debris jam in a safe way, especially during flood events. Thus, applying the horizontal plane area of the woody debris approach instead of the vertical area is more feasible to represent the area of woody debris jam as its boundary can be outlined no matter how irregular it is. Thus, the equilibrium blockage ratio Δ A * was defined as
Δ A * = α A r e a p l a n b h
where Δ A * was the equilibrium blockage ratio.
The relation between the equilibrium blockage ratio with the relative hydraulic head is presented in Figure 10b. The equilibrium blockage ratio can achieve an even better correlation than the blockage ratio. This also implied that the geometry of the woody debris jam was irregular, and one could obtain a better correlation if the area of the woody debris jam can be better described. Finally, the debris-induced hydraulic head can be related to the blockage ratio and equilibrium blockage ratio:
Δ h h = F r 0.629 Δ A 2 + 0.329 Δ A
Δ h h = F r ( 1.58 Δ A * 2 + 0.206 Δ A * )
Generally, the volume taken up by the woody debris in front of the pier blocked the flow and led to the occurrence of water level increase upstream, inducing hydraulic head, which indicated the increase of flood risk. It also needed to point out the Froude number of current study was limited, and more experiments data required to support the effects on Fr number on hydraulic head.

4.2. Scour Depth Influenced by Woody Debris Jam

The spatio-temporal evolution of a woody debris jam leads to additional scour and can lead to unexpected failure of bridge piers during flood events. The influence due to woody debris jams on scour needs to be quantified for the purpose of safe design. Non-dimensional parameter K d was defined to represent the change in scour depth caused by woody debris jams:
K d = d s t / d s 0 t
where d s t was the scour depth in the presence of a woody debris jam at time t; d s 0 t was the scour depth without the presence of a woody debris jam at time t.
The change in scour depth was generated by the presence and evolution of a woody debris jam as the flow conditions remained unchanged. Therefore, K d was considered to be correlated to the evolution of a woody debris jam:
K d = l d , w d , h d , Δ A , Δ A *
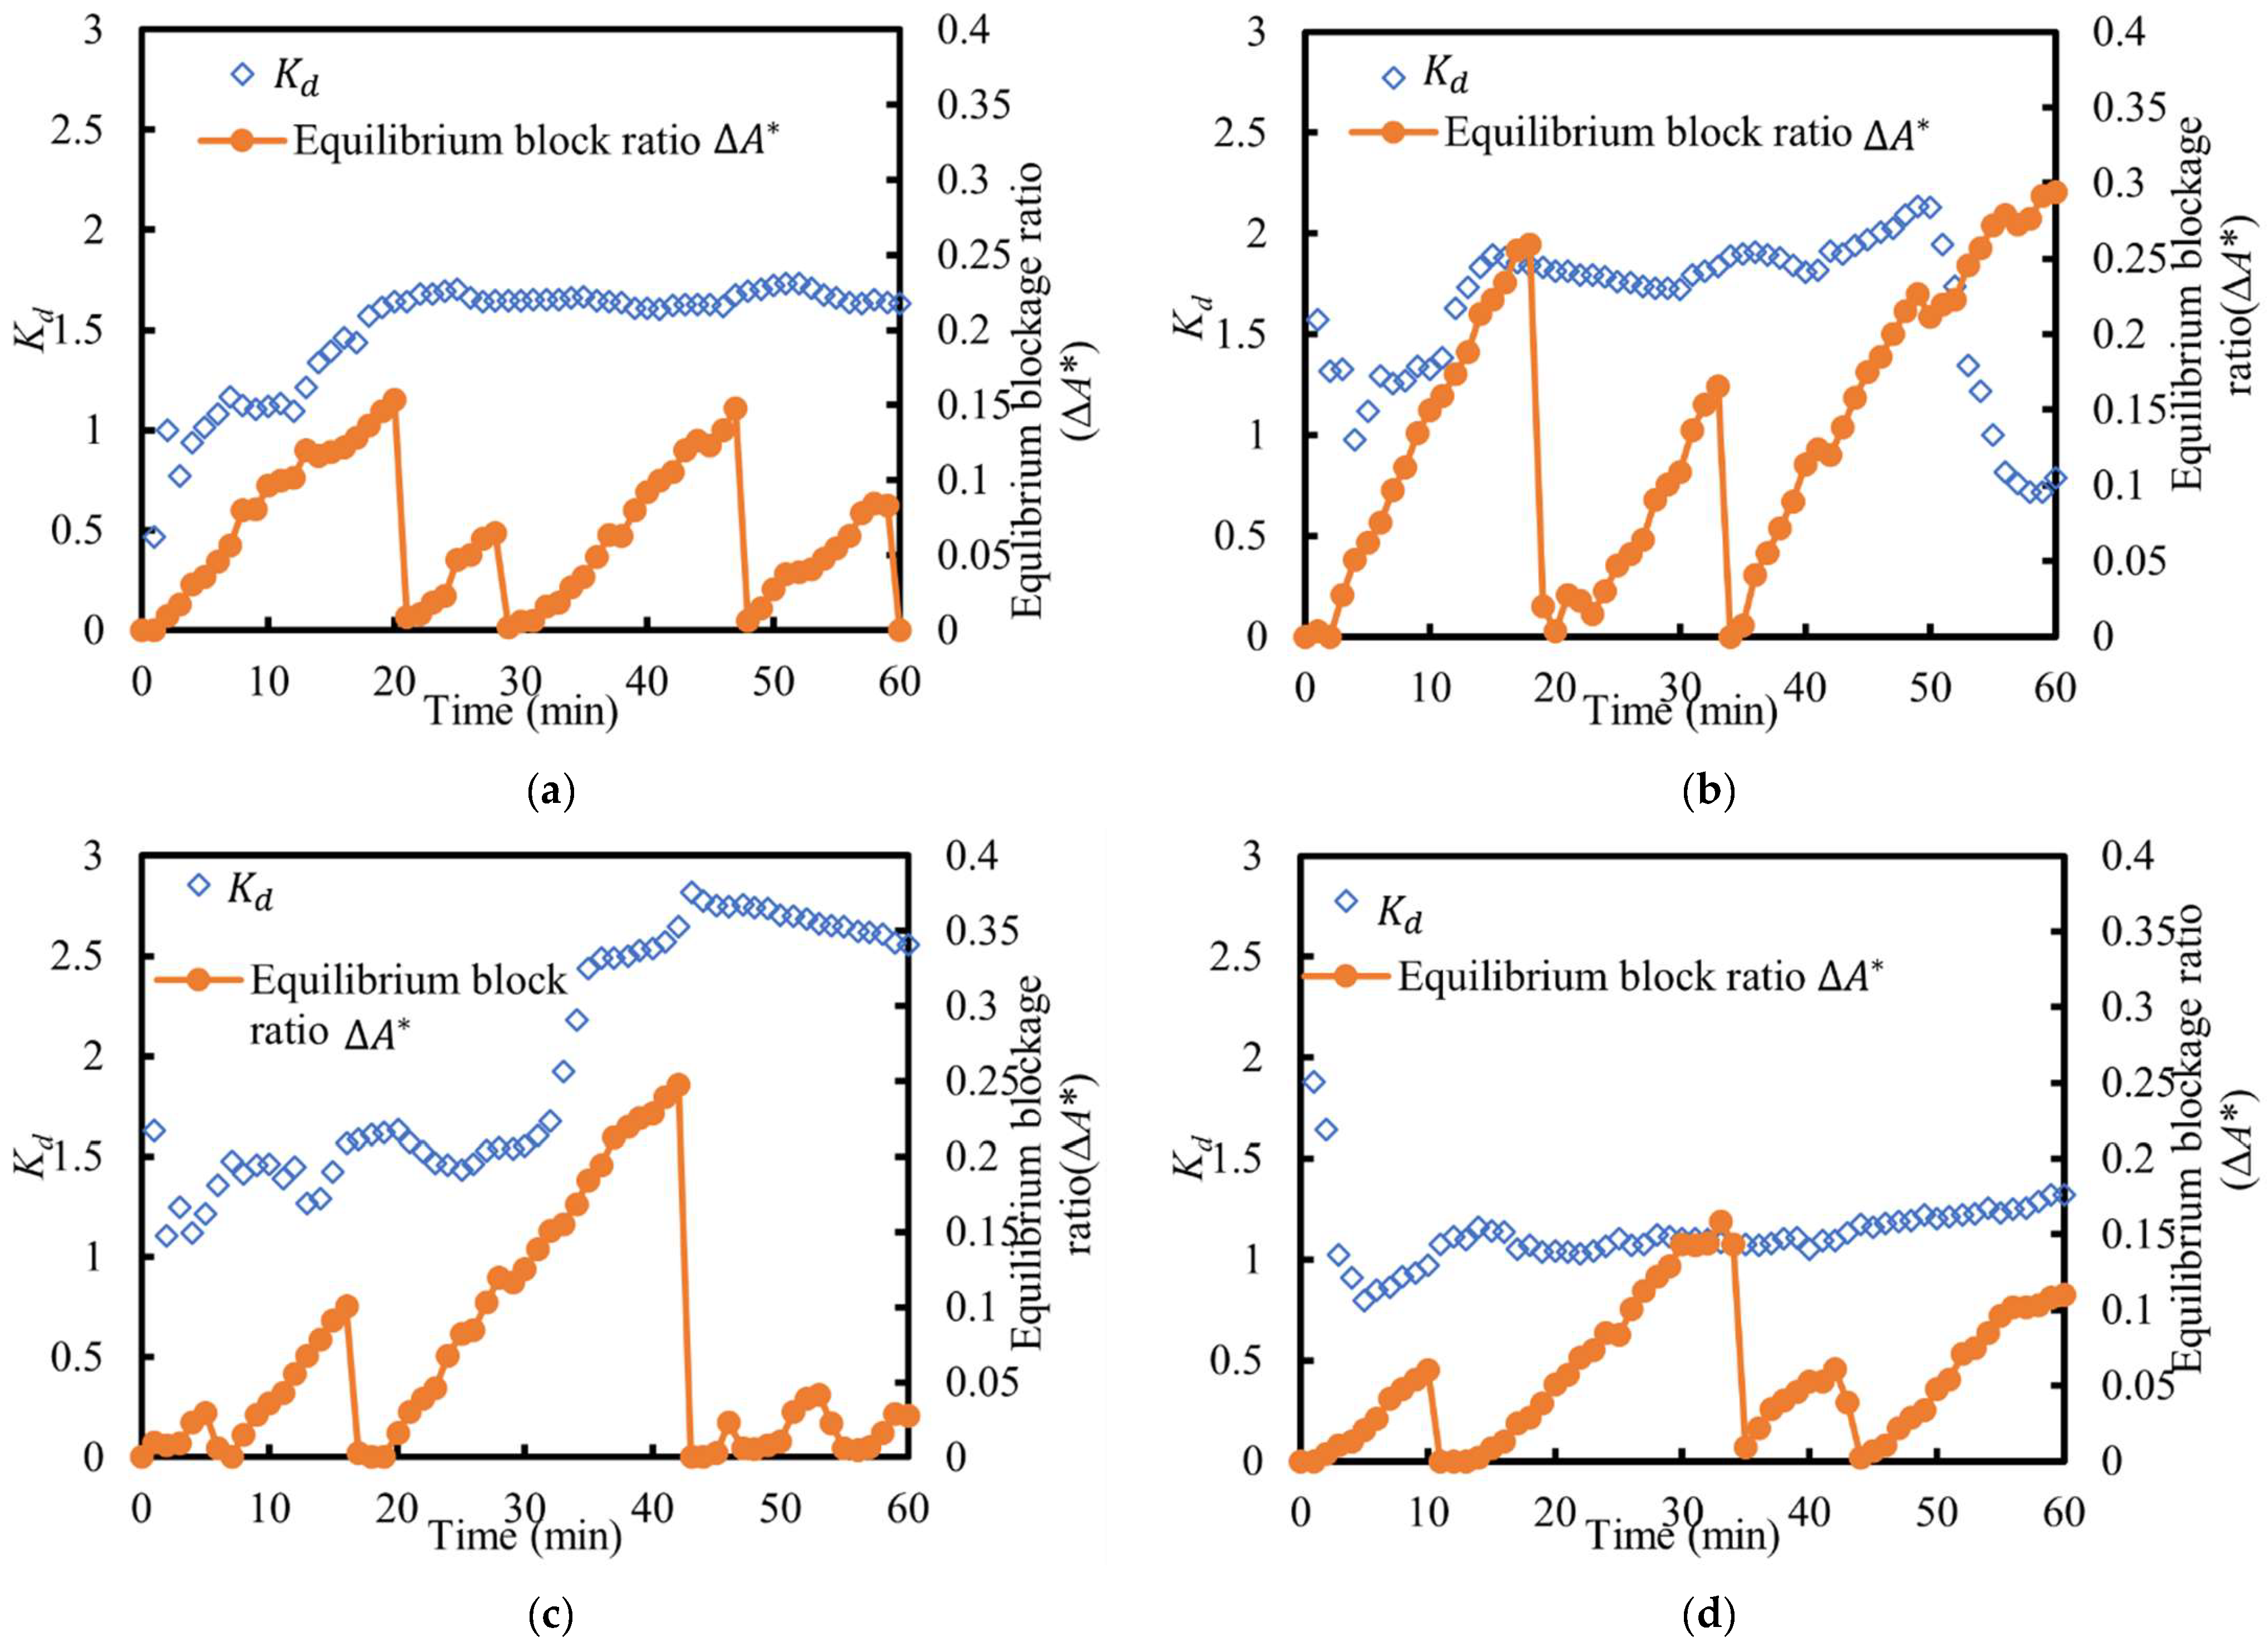
Several physically meaningful variables were considered to derive K d . Finally, the equilibrium blockage ratio was applied to better reflect the evolution of the woody debris jam. The temporal evolution of K d and of the equilibrium blockage ratio Δ A * was shown in Figure 11 and Figure 12. Tests 1 to 4 had a similar approach flow depth but varying mean velocity and it was observed that K d   increased with the growth of the woody debris jam for the first peak. However, K d changed little in the subsequently forming woody debris jams as their dimensions generally did not exceed the peak size of the first debris jam. The K d value was close to constant after the first woody debris jam provided that the subsequent woody debris jams were smaller or close to the first one. This could first be explained by the scour hole remaining constant, such that the additional scour depth caused by the first debris jam will remain the same and would lead to a greater value of K d , irrespective of the size of the subsequent woody jam. Secondly, for the first peak of a woody debris jam, the respective base case scour hole was relatively small such that the effects of the woody debris jam were more apparent, and the good agreement with K d was clear. However, following the first peak, since the scour hole has already formed, the effects of scour depth from the subsequent small woody debris were less significant.
The development of K d and the equilibrium blockage ratio for tests 4 to 7 is presented in Figure 12. The mean velocity of these tests was relatively similar, but the approach flow depth varied. Following the formation of the first woody jam, the K d value also had a small change if the subsequent woody debris jams did not exceed the first one. However, it was also observed that if the subsequent woody debris jams were larger than the first or one of the previous ones, the value K d further increased as shown in Figure 12b,c. As for the decrease of K d , as shown in Figure 12b, it was recorded by the endoscope camera that the woody debris jam grew significantly and expanded very close to the sand bed, even filling in the scour hole in front of the pier.
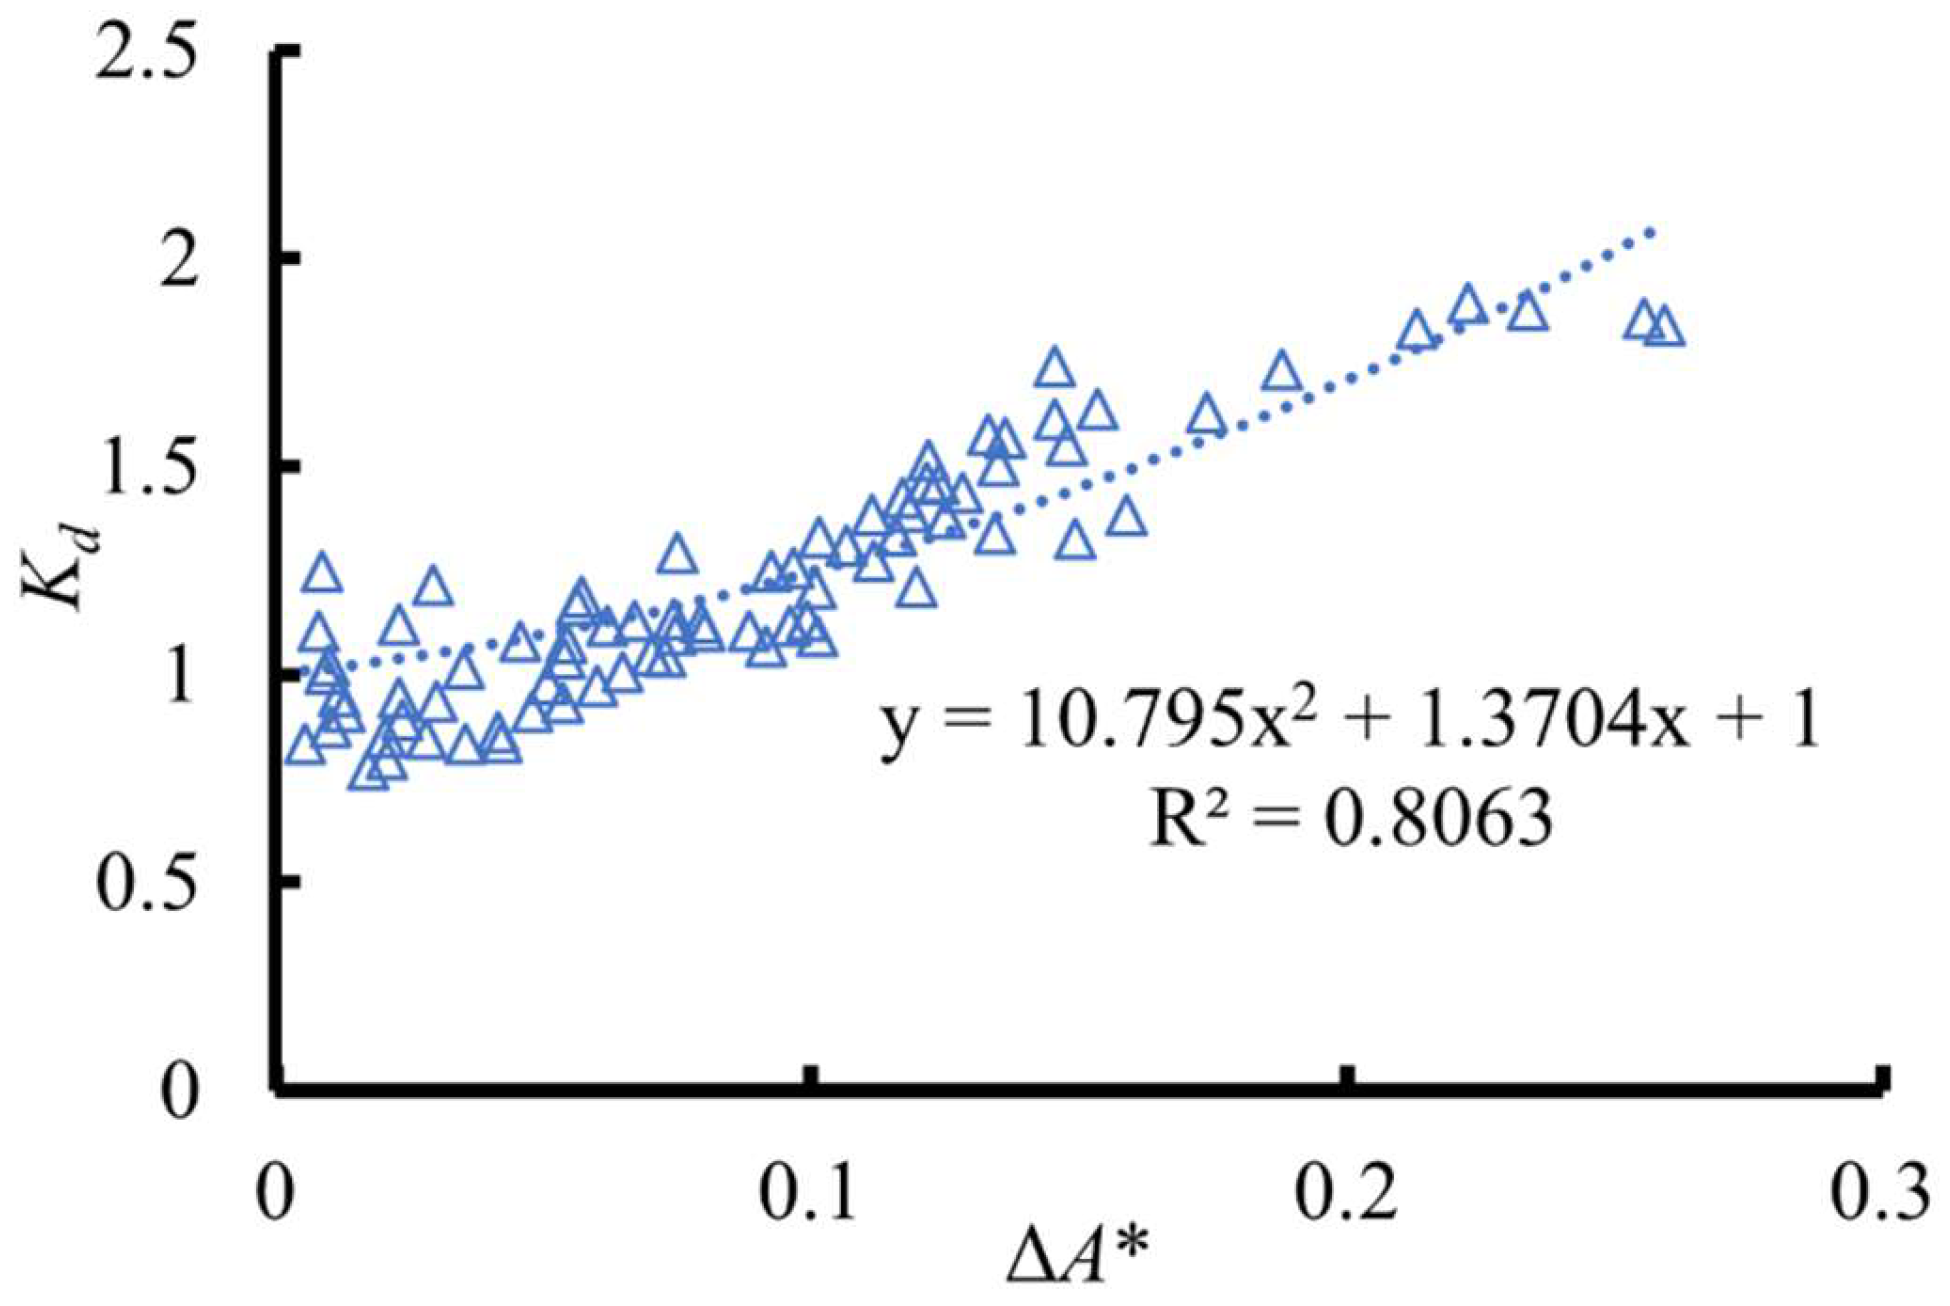
Based on the analysis above, the first debris jam had a clear relation to the development of additional scour depth. The subsequent woody debris jam had a small influence on the scour depth when its dimensions did not exceed the previous one. All test data related to the first debris jam were integrated and presented in Figure 13.
Thus, the relation between K d and the equilibrium blockage ratio, Δ A * was described as:
K d 1 = f 1 = 10.8 Δ A 1 * 2 + 1.37 Δ A 1 * + 1
K d 2 = ε K d 1 m a x , Δ A 2 * Δ A 1 m a x * f 2 , Δ A 2 * > Δ A 1 m a x *
where K d 1 is the non-dimensional parameter for the first woody debris jam; K d 2 is for the subsequent woody debris jam; K d 1 m a x is the maximum value of K d for the first woody debris jam; ε is a coefficient to connect parameter K d of the first or previous woody debris jam, averaging close to 1.0; f 2 is the relation of subsequent K d with the equilibrium blockage ratio that exceeded the dimensions of the previous debris jam.
It should also be pointed out that K d 1 was used to quantify the influence due to the woody debris jam during the initial stage of scour in clear water conditions. If the scour occurred after the first woody debris jam, then the growth of the woody debris jam may have a comparably small effect on scour depth provided that its dimensions were smaller than those of the previous one. However, if the subsequent woody debris jam continued to grow and exceeded the size of the previous one, then the scour depth further increased, as it was affected by the development of the woody debris jam and described by the parameter f 2 . An explicit function for f 2 is not given here, as it is believed that more tests with debris jams, which exceeded the previous one, should be included. It is however recommended to apply f 2 = f 1 in order to estimate K d and the authors argue for using ε = 2.0 for a conservative design purpose.

5. Discussion

The debris jam forming in front of a bridge pier can occur in various shapes and different types of woody debris jams cause various effects on piers. Applying a steady size-uniform woody block [7,41,44,46,47] to represent a woody debris jam is an idealized approach to investigate the influence caused by debris jams, and it may be reasonable if the woody debris jam was built before being captured by the pier or if the debris jam was stably formed in a short period. However, this type of steady, size-uniform woody debris jam ignores the processes of formation and failure of woody debris jams, particularly if the debris jam formed and developed over a longer period during natural flood events, as observed in [23]. The investigation of dynamic woody debris jams, formed by woody pieces can provide more realistic insight into the life cycle of woody debris jams (their formation, growth, and failure) as well as their characteristics and effects. In addition, the dimensions of dynamic woody debris jams exhibited a certain correlation between their vertical areas and plane areas as shown in Figure 10a. This is an important difference between the steady, size-set woody block and the dynamic woody debris jam, as the dimensions of the steady, size-set woody debris jam may be independent of each other as well as with respect to flow conditions. The use of dynamic woody debris jams may have a substantial advantage over the use of size-set woody debris jams.
As seen in test 5, a reduction in the scour depth in front of a pier may occur when the woody debris jam becomes significantly large, and its lower limit reaches close to the sand bed, exceeding the scour hole. In test 5, scour depth was observed to decrease when the woody debris jam further developed starting from t = 50 min. The woody debris jam grew, and some debris pieces reached very close to the bottom of scour hole while the debris jam continued growing, as determined by analyzing the video captured by the endoscope camera as Figure 14a was shown. Then, scour occurred in front of the woody debris jam (as shown in Figure 14b) while the approach flow which moved close to the bed entrained sand to fill in the initial scour hole which had formed in front of the pier as the debris jam formed. This results in a decrease of scour depth right in front of the pier.
Few studies have investigated the effect of dynamic woody debris jams on scour depth, so the results from steady, size-set woody debris jams will be compared and discussed. Ebrahimi et al. [47] applied a set height of woody debris over the water depth to estimate the influence due to the woody debris jams on scour and derived two empirical formulas. In the present study, these formulas were applied to compare the relation between h d / h and the scour depth. Additionally, data collected from several previous researchers [7,42,47] were also included. As shown in Figure 15, the empirical formula based on the height of woody debris jams could provide the range to estimate the influence of the woody debris jams on scour, but without adequate correlation, and this could attribute to the shape’s difference of the debris jam.
The blockage ratio was also applied to the results from the study by [7], and it demonstrated a good agreement with their experimental data (shown in Figure 16). As scour occurred in front of single bridge piers, it was reasonable to introduce the blockage ratio to quantify the influence due to woody debris jams as the decrease of flow cross-sectional area caused by woody debris jams further increased flow velocity and enhanced the downward flow which finally resulted in additional scour. Thus, the blockage ratio was also introduced in the present study to incorporate the effects of a woody debris jam; the proposed formula also showed good agreement with experimental data. It can also be seen in Figure 16 that the current study showed less scour due to debris compared to the equations of Pagliara and Carnaica. This was firstly attributed to less flow intensity of current study. The minimum flow intensity of Pagliara and Carnaica (2011) was 0.75 which was higher the max one of current study. In addition, Pagliara and Carnaica (2011)’s experiments had already implied that the geometry of debris jam might affect the results as the rectangular or triangular debris jam has a greater influence on the scour depth compared to the cylindrical debris jam. The geometry of dynamic debris jam was near to half-cone even though the shape was not smooth or regular. Furthermore, the size of our dynamic debris jams gradually increased during the scour process while the static block debris jam in Pagliara and Carnaica had a constant size during the whole scour process.

6. Conclusions

A new approach to determine the influence of dynamic woody debris jam formation, growth, and decay on scour and its associated hydraulic head was introduced in this study. The life cycle of formation, growth, and failure of woody debris jams provided new insights into their effects. Several characteristics which had not been investigated in previous studies which mostly involved steady, size-set woody debris jams were investigated in this study: (1) the spatio-temporal variation of the dimensions of woody debris jam; (2) the processes of formation, growth, and decay of the dynamic woody debris jams; (3) the space and time progression and influence of the series of dynamic woody debris jams over a longer period.
As the debris-induced hydraulic head was non-dimensionalized by the approach flow depth, it is found that the Froude number can represent the influence of the flow condition on the dynamic debris jams. A blockage ratio was derived to quantify the effects of the dynamic woody debris jams, and it was correlated with the hydraulic head generated by the presence of the debris jams. In addition, as the vertical area and plane area of woody debris jams were found to be correlated, the plane area was shown to be more accurately captured for an irregular woody debris jam. It also should point out that this approach to estimate the vertical projected area might be a limitation of the present study. However, using adequate engineering judgment, this could provide a potential convenient method to estimate the blockage ratio—fully validating it may require further studies to prove its reliability.
The presence of dynamic woody debris jams generally leads to a deeper scour depth than in their absence. The defined blockage ratio was found to be a useful parameter to quantify their influence. An empirical relation between the equilibrium blockage ratio and ds/ds0 of the first debris jam was derived and even further compared with experimental data from previous studies. Over a period, the influence of the sequence of woody debris jams varies depending on their individual size. Several limitations of the present study are acknowledged by the authors: (1) wooden dowels are applied to model real debris; however, they do not completely reflect the complex geometry and properties of real debris; (2) the duration of each experimental test was approximately one hour due to the limitation of the experimental facilities and the total number of debris pieces released.

Author Contributions

Conceptualization, W.Z., I.N., C.D.R. and H.A.; methodology, W.Z.; formal analysis, W.Z.; resources, I.N. and C.D.R.; writing—original draft preparation, W.Z.; writing—review and editing, I.N. and C.D.R.; visualization, W.Z.; supervision, I.N. and C.D.R.; project administration, I.N. and C.D.R.; funding acquisition, I.N., C.D.R. and H.A. All authors have read and agreed to the published version of the manuscript.

Funding

This research was funded by the National Research Council of Canada, grant number 908339. W.Z. was supported by the Chinese Scholarship Council.

Institutional Review Board Statement

Not applicable.

Informed Consent Statement

Not applicable.

Data Availability Statement

Upon request, all data are available from the corresponding author.

Acknowledgments

The authors thank Mark Lapointe, Technical Officer for the uOttawa Hydraulic Laboratory, for his technical assistance.

Conflicts of Interest

The authors declare no conflict of interest.

Abbreviations

Δ A blockage ratio by the projected vertical area of debris jam;
Δ A * blockage ratio by the horizontal plan area of debris jam;
b width of flume;
D e p effective width or diameter of the pier;
D p width or diameter of the pier.
d 50 median size distribution of particles;
d s equilibrium scour depth in the presence of woody debris jam at time t;
d s 0 equilibrium scour depth without the presence of debris jam at time t;
FrFroude number;
Δ h the debris induced hydraulic head;
Δ h h the difference in water surface elevation between the front ultrasonic distance sensor and the posterior one in the presence of woody debris;
Δ h n h difference of water surface elevation between the front ultrasonic distance sensor and the posterior one without woody debris;
h approach flow depth;
h d the height of woody debris jam from the bottom of debris jam to water surface;
l d length of woody debris jam in streamwise direction.
K d the influence of debris jam on scour d s / d s 0 ;
K d 1 for initial woody debris jam;
K d 2 for the subsequent woody debris jam;
K d 1 m a x the maximum value of K d in the first woody debris jam;
ε a coefficient to connect parameter K d the first or previous woody debris jam, averaging close to 1.0;
k s the bed roughness;
R e the Reynold number;
t the time moment;
w d width of woody debris jam normal to flow;
U mean velocity of approach flow
u local velocity at height z above the mean bed elevation;
u * shear velocity;
α 0.79 for rectangular debris and 0.21 for triangular debris;
β −0.79 for rectangular debris and −0.17 for triangular debris, 0 when l d / h 1.0 ;
χ parameter 0.32 or 3.2.
κ von Karman constant (0.41);
σ sediment gradation;
λ scale factor

References

  1. Haehnel, R.B.; Daly, S.F. Maximum Impact Force of Woody Debris on Floodplain Structures. J. Hydraul. Eng. 2004, 130, 112–120. [Google Scholar] [CrossRef]
  2. Stolle, J.; Derschum, C.; Goseberg, N.; Nistor, I.; Petriu, E. Debris impact under extreme hydrodynamic conditions part 2: Impact force responses for non-rigid debris collisions. Coast. Eng. 2018, 141, 107–118. [Google Scholar] [CrossRef]
  3. Hasanpour, A.; Istrati, D.; Buckle, I. Coupled SPH–FEM Modeling of Tsunami-Borne Large Debris Flow and Impact on Coastal Structures. J. Mar. Sci. Eng. 2021, 9, 1068. [Google Scholar] [CrossRef]
  4. Hasanpour, A.; Istrati, D.; Buckle, I.G. Multi-Physics Modeling of Tsunami Debris Impact on Bridge Decks. In Proceedings of the 3rd International Conference on Natural Hazards & Infrastructure, Athens, Greece, 5–7 July 2022; pp. 5–7. [Google Scholar]
  5. Oudenbroek, K.; Naderi, N.; Bricker, J.D.; Yang, Y.; Van der Veen, C.; Uijttewaal, W.; Moriguchi, S.; Jonkman, S.N. Hydrodynamic and Debris-Damming Failure of Bridge Decks and Piers in Steady Flow. Geosciences 2018, 8, 409. [Google Scholar] [CrossRef] [Green Version]
  6. Istrati, D.; Hasanpour, A.; Buckle, I. Numerical investigation of tsunami-borne debris damming loads on a coastal bridge. In Proceedings of the 17 World Conference on Earthquake Engineering, Sendai, Japan, 13–18 September 2020. [Google Scholar]
  7. Pagliara, S.; Carnacina, I. Influence of Wood Debris Accumulation on Bridge Pier Scour. J. Hydraul. Eng. 2011, 137, 254–261. [Google Scholar] [CrossRef]
  8. Mazzorana, B.; Zischg, A.P.; Largiader, A.; Hübl, J. Hazard index maps for woody material recruitment and transport in alpine catchments. Nat. Hazards Earth Syst. Sci. 2009, 9, 197–209. [Google Scholar] [CrossRef] [Green Version]
  9. Mazzorana, B.; Hübl, J.; Zischg, A.; Largiader, A.J.N.H. Modelling woody material transport and deposition in alpine rivers. Nat. Hazards 2011, 56, 425–449. [Google Scholar] [CrossRef] [Green Version]
  10. Comiti, F.; Lucía, A.; Rickenmann, D. Large wood recruitment and transport during large floods: A review. Geomorphology 2016, 269, 23–39. [Google Scholar] [CrossRef]
  11. Ruiz-Villanueva, V.; Piégay, H.; Gurnell, A.M.; Marston, R.A.; Stoffel, M. Recent advances quantifying the large wood dynamics in river basins: New methods and remaining challenges. Rev. Geophys. 2016, 54, 611–652. [Google Scholar] [CrossRef] [Green Version]
  12. Tonon, A.; Picco, L.; Rainato, R. Test of methodology for developing a large wood budget: A 1-year example from a regulated gravel bed river following ordinary floods. CATENA 2018, 165, 115–124. [Google Scholar] [CrossRef]
  13. Klaar, M.J.; Hill, D.F.; Maddock, I.; Milner, A.M. Interactions between instream wood and hydrogeomorphic development within recently deglaciated streams in Glacier Bay National Park, Alaska. Geomorphology 2011, 130, 208–220. [Google Scholar] [CrossRef]
  14. Braudrick, C.A.; Grant, G.E. When do logs move in rivers? Water Resour. Res. 2000, 36, 571–583. [Google Scholar] [CrossRef] [Green Version]
  15. Braudrick, C.A.; Grant, G.E.; Ishikawa, Y.; Ikeda, H. Dynamics of Wood Transport in Streams: A Flume Experiment. Earth Surf. Process. Landf. 1997, 22, 669–683. [Google Scholar] [CrossRef]
  16. Braudrick, C.A.; Grant, G.E. Transport and deposition of large woody debris in streams: A flume experiment. Geomorphology 2001, 41, 263–283. [Google Scholar] [CrossRef]
  17. Bocchiola, D.; Rulli, M.C.; Rosso, R. Transport of large woody debris in the presence of obstacles. Geomorphology 2006, 76, 166–178. [Google Scholar] [CrossRef]
  18. Chen, S.-C.; Tfwala, S.S.; Wang, C.-R.; Kuo, Y.-M.; Chao, Y.-C. Incipient motion of large wood in river channels considering log density and orientation. J. Hydraul. Res. 2019, 58, 489–502. [Google Scholar] [CrossRef]
  19. Crosato, A.; Rajbhandari, N.; Comiti, F.; Cherradi, X.; Uijttewaal, W. Flume experiments on entrainment of large wood in low-land rivers. J. Hydraul. Res. 2013, 51, 581–588. [Google Scholar] [CrossRef]
  20. Haga, H.; Kumagai, T.o.; Otsuki, K.; Ogawa, S. Transport and retention of coarse woody debris in mountain streams: An in situ field experiment of log transport and a field survey of coarse woody debris distribution. Water Resour. Res. 2002, 38, 1–16. [Google Scholar] [CrossRef]
  21. Davidson, S.L.; MacKenzie, L.G.; Eaton, B.C. Large wood transport and jam formation in a series of flume experiments. Water Resour. Res. 2015, 51, 10065–10077. [Google Scholar] [CrossRef]
  22. Persi, E.; Petaccia, G.; Sibilla, S.J.N.H. Large wood transport modelling by a coupled Eulerian–Lagrangian approach. Nat. Hazards 2018, 91, 59–74. [Google Scholar] [CrossRef]
  23. Diehl, T.H. Potential Drift Accumulation at Bridges; US Department of Transportation, Federal Highway Administration, Research and Development, Turner-Fairbank Highway Research Center: Washington, DC, USA, 1997.
  24. Arneson, L.; Zevenbergen, L.; Lagasse, P.; Clopper, P. Evaluating Scour at Bridges; National Highway Institute: Arlington, VA, USA, 2012. [Google Scholar]
  25. Melville, B.W. Local Scour at Bridge Abutments. J. Hydraul. Eng. 1992, 118, 615–631. [Google Scholar] [CrossRef]
  26. Kothyari, U.C.; Garde, R.C.J.; Raju, K.G.R. Temporal Variation of Scour Around Circular Bridge Piers. J. Hydraul. Eng. 1992, 118, 1091–1106. [Google Scholar] [CrossRef]
  27. Kothyari, U.C.; Ranga Raju, K.G.; Garde, R.J. Live-bed scour around cylindrical bridge piers. J. Hydraul. Res. 1992, 30, 701–715. [Google Scholar] [CrossRef]
  28. Lu, J.-Y.; Shi, Z.-Z.; Hong, J.-H.; Lee, J.-J.; Raikar, R.V. Temporal Variation of Scour Depth at Nonuniform Cylindrical Piers. J. Hydraul. Eng. 2011, 137, 45–56. [Google Scholar] [CrossRef] [Green Version]
  29. Mia, M.F.; Nago, H. Design Method of Time-Dependent Local Scour at Circular Bridge Pier. J. Hydraul. Eng. 2003, 129, 420–427. [Google Scholar] [CrossRef]
  30. Yanmaz, A.M.; Altinbilek, H.D.a. Study of Time-Depenbent Local Scour around Bridge Piers. J. Hydraul. Eng. 1991, 117, 1247–1268. [Google Scholar] [CrossRef]
  31. Dey, S. Time-variation of scour in the vicinity of circular piers. Proc. Inst. Civ. Eng. 1999, 136, 67–75. [Google Scholar] [CrossRef]
  32. Yanmaz, A.M. Temporal variation of clear water scour at cylindrical bridge piers. Can. J. Civ. Eng. 2006, 33, 1098–1102. [Google Scholar] [CrossRef]
  33. Yanmaz, A.M.; Kose, O. A semi-empirical model for clear-water scour evolution at bridge abutments. J. Hydraul. Res. 2009, 47, 110–118. [Google Scholar] [CrossRef]
  34. Yilmaz, M.; Yanmaz, A.M.; Koken, M. Clear-water scour evolution at dual bridge piers. Can. J. Civ. Eng. 2017, 44, 298–307. [Google Scholar] [CrossRef]
  35. Aksoy, A.O.; Bombar, G.; Arkis, T.; Guney, M.S. Study of the time-dependent clear water scour around circular bridge piers. J. Hydrol. Hydromech. 2017, 65, 26–34. [Google Scholar] [CrossRef] [Green Version]
  36. Chang, W.-Y.; Lai, J.-S.; Yen, C.-L. Evolution of Scour Depth at Circular Bridge Piers. J. Hydraul. Eng. 2004, 130, 905–913. [Google Scholar] [CrossRef]
  37. Melville, B.W.; Chiew, Y.-M. Time Scale for Local Scour at Bridge Piers. J. Hydraul. Eng. 1999, 125, 59–65. [Google Scholar] [CrossRef]
  38. Oliveto, G.; Hager, W.H. Temporal Evolution of Clear-Water Pier and Abutment Scour. J. Hydraul. Eng. 2002, 128, 811–820. [Google Scholar] [CrossRef]
  39. Melville, B.W. Pier and Abutment Scour: Integrated Approach. J. Hydraul. Eng. 1997, 123, 125–136. [Google Scholar] [CrossRef]
  40. Lagasse, P.F.; Clopper, P.E.; Zevenbergen, L.W.; Spitz, W.J.; Girard, L.G. Effects of Debris on Bridge Pier Scour; Transportation Research Board: Washington, DC, USA, 2010; p. 0309118344. [Google Scholar]
  41. Pagliara, S.; Carnacina, I. Bridge pier flow field in the presence of debris accumulation. Proc. Inst. Civ. Eng. Water Manag. 2013, 166, 187–198. [Google Scholar] [CrossRef]
  42. Melville, B.W.; Dongol, D.M. Bridge pier scour with debris accumulation. J. Hydraul. Eng. 1992, 118, 1306. [Google Scholar] [CrossRef]
  43. Lagasse, P.F.; Zevenbergen, L.W.; Clopper, P.E. Impacts of debris on bridge pier scour. In Proceedings of the 5th International Conference on Scour and Erosion (ICSE-5), San Francisco, CA, USA, 7–10 November 2010; pp. 854–863. [Google Scholar]
  44. Pagliara, S.; Carnacina, I. Temporal scour evolution at bridge piers: Effect of wood debris roughness and porosity. J. Hydraul. Res. 2010, 48, 3–13. [Google Scholar] [CrossRef]
  45. Pagliara, S.; Carnacina, I.; Cigni, F. Sills and gabions as countermeasures at bridge pier in presence of debris accumulations. J. Hydraul. Res. 2010, 48, 764–774. [Google Scholar] [CrossRef]
  46. Pagliara, S.; Carnacina, I. Influence of large woody debris on sediment scour at bridge piers. Int. J. Sediment Res. 2011, 26, 121–136. [Google Scholar] [CrossRef]
  47. Ebrahimi, M.; Kripakaran, P.; Prodanović, D.M.; Kahraman, R.; Riella, M.; Tabor, G.; Arthur, S.; Djordjević, S. Experimental Study on Scour at a Sharp-Nose Bridge Pier with Debris Blockage. J. Hydraul. Eng. 2018, 144, 04018071. [Google Scholar] [CrossRef] [Green Version]
  48. Panici, D.; de Almeida, G.A.M. Formation, Growth, and Failure of Debris Jams at Bridge Piers. Water Resour. Res. 2018, 54, 6226–6241. [Google Scholar] [CrossRef]
  49. Schalko, I.; Schmocker, L.; Weitbrecht, V.; Boes, R.M. Laboratory study on wood accumulation probability at bridge piers. J. Hydraul. Res. 2019, 58, 566–581. [Google Scholar] [CrossRef]
  50. Rennie, C.D.; Hay, A. Reynolds Stress Estimates in a Tidal Channel from Phase-Wrapped ADV Data. J. Coast. Res. 2010, 2010, 157–166. [Google Scholar] [CrossRef]
  51. Rennie, C.D.; Church, M. Mapping spatial distributions and uncertainty of water and sediment flux in a large gravel bed river reach using an acoustic Doppler current profiler. J. Geophys. Res. Earth Surf. 2010, 115. [Google Scholar] [CrossRef] [Green Version]
  52. Melville, B.W.; Sutherland, A.J. Design Method for Local Scour at Bridge Piers. J. Hydraul. Eng. 1988, 114, 1210–1226. [Google Scholar] [CrossRef]
  53. Manners, R.B.; Doyle, M.W. A mechanistic model of woody debris jam evolution and its application to wood-based restoration and management. River Res. Appl. 2008, 24, 1104–1123. [Google Scholar] [CrossRef]
  54. Panici, D.; de Almeida, G.A.M. A theoretical analysis of the fluid–solid interactions governing the removal of woody debris jams from cylindrical bridge piers. J. Fluid Mech. 2020, 886, A19. [Google Scholar] [CrossRef]
  55. Parola, A.C.; Apelt, C.J.; Jempson, M.A. Debris Forces on Highway Bridges; Transportation Research Board: Washington, DC, USA, 2000. [Google Scholar]
Figure 1. Experimental setting (not at scale).
Jmse 10 01421 g001
Figure 2. (a) Dowel with length 30 cm and diameter 1.27 cm compared with various diameters dowels (b) instruments set up (c) location of the highest located endoscopic camera.
Jmse 10 01421 g002
Figure 3. U component normalized by the water depth h (a) with an approximately water depth (b) with an approximately mean velocity.
Jmse 10 01421 g003
Figure 4. Temporal evolution of scour depth in front of the pier every minute: (a,b) tests without debris jam, (c,d) equivalent tests in the presence of debris jam.
Jmse 10 01421 g004
Figure 5. A typical case for the growth, failure, and rebirth of dynamic debris jam (test 1).
Jmse 10 01421 g005
Figure 6. Temporal evolution of woody debris pieces in front of the pier as well as the corresponding plane area of the woody debris jam (a) test 2; (b) test 4, and (cf) referred to the temporal evolution of width, height, length, and horizontal plan area of dynamic debris jam.
Jmse 10 01421 g006aJmse 10 01421 g006b
Figure 7. Time history of the water level captured by the ultrasonic distance sensors (a) without the presence of woody debris in test 2; (b) in the presence of woody debris in test 2.
Jmse 10 01421 g007
Figure 8. Time-history of the hydraulic head and the number of debris pieces in front of the pier test 2.
Jmse 10 01421 g008
Figure 9. Correlation between the debris-induced hydraulic head and blockage ratio Δ A .
Jmse 10 01421 g009
Figure 10. (a) Correlation between the horizontal plane area of woody debris jam with the projected vertical area of woody debris jam; (b) Correlation between the equilibrium blockage ratio with the hydraulic head.
Jmse 10 01421 g010
Figure 11. Time-history of the evolution of the relative scour depth K d and equilibrium blockage ratio Δ A * (a) test 1; (b) test 2; (c) test 3; (d) test 4.
Jmse 10 01421 g011
Figure 12. Time-history of the evolution of the relative scour depth K d and equilibrium blockage ratio Δ A * (a) test 4; (b) test 5; (c) test 6; (d) test 7.
Jmse 10 01421 g012
Figure 13. Correlation between the equilibrium blockage ratio, Δ A * , and K d .
Jmse 10 01421 g013
Figure 14. The debris jam reached the bed near the scour hole in test 5.
Jmse 10 01421 g014
Figure 15. Comparison of the experimental data from [7,42,47] with the results from the present study.
Jmse 10 01421 g015
Figure 16. Formula by [7] against experimental data from [7,42,47]; Pagliara and Carnacina [7] K d = 1 + 0.036 Δ A 1.5 for rectangular and triangular debris jam and K d = 1 + 0.018 Δ A 1.5 for cylindrical debris jam, blockage ratio here was consistent with the [7].
Jmse 10 01421 g016
Table 1. Experiment matrix.
Test NumberWater Depth h (m)Mean Velocity
U (m/s)
Shear Velocity u *
(m/s)
Froude Number, Fr U / U c Dowel Size Applied
10.2840.2230.01290.1570.50630 cm in length and 1.27 cm for diameter
20.2780.3110.01500.2210.707
30.2810.2730.01190.1930.620
40.2860.2500.009590.1750.566
50.1840.2560.01120.2140.617
60.2340.2460.01050.1860.573
70.3260.2570.01060.1720.572
Note: Hydraulic radius was used for the reference length for Froude number, U c was calculated according to the reference [35].
Publisher’s Note: MDPI stays neutral with regard to jurisdictional claims in published maps and institutional affiliations.