
Performance Optimization and Knock Investigation of Marine Two-Stroke Pre-Mixed Dual-Fuel Engine Based on RSM and MOPSO


Abstract
:1. Introduction
2. Modeling Methodology
2.1. The Theory of Simulation Model
2.2. Establishment and Calibration of DF Engine Simulation Model
2.3. RSM Parameters Prediction Model
3. Results and Discussion
3.1. Response Surface Parameter Analysis
3.2. Multi-Objective Parameter Optimization with MOPSO
4. Conclusions
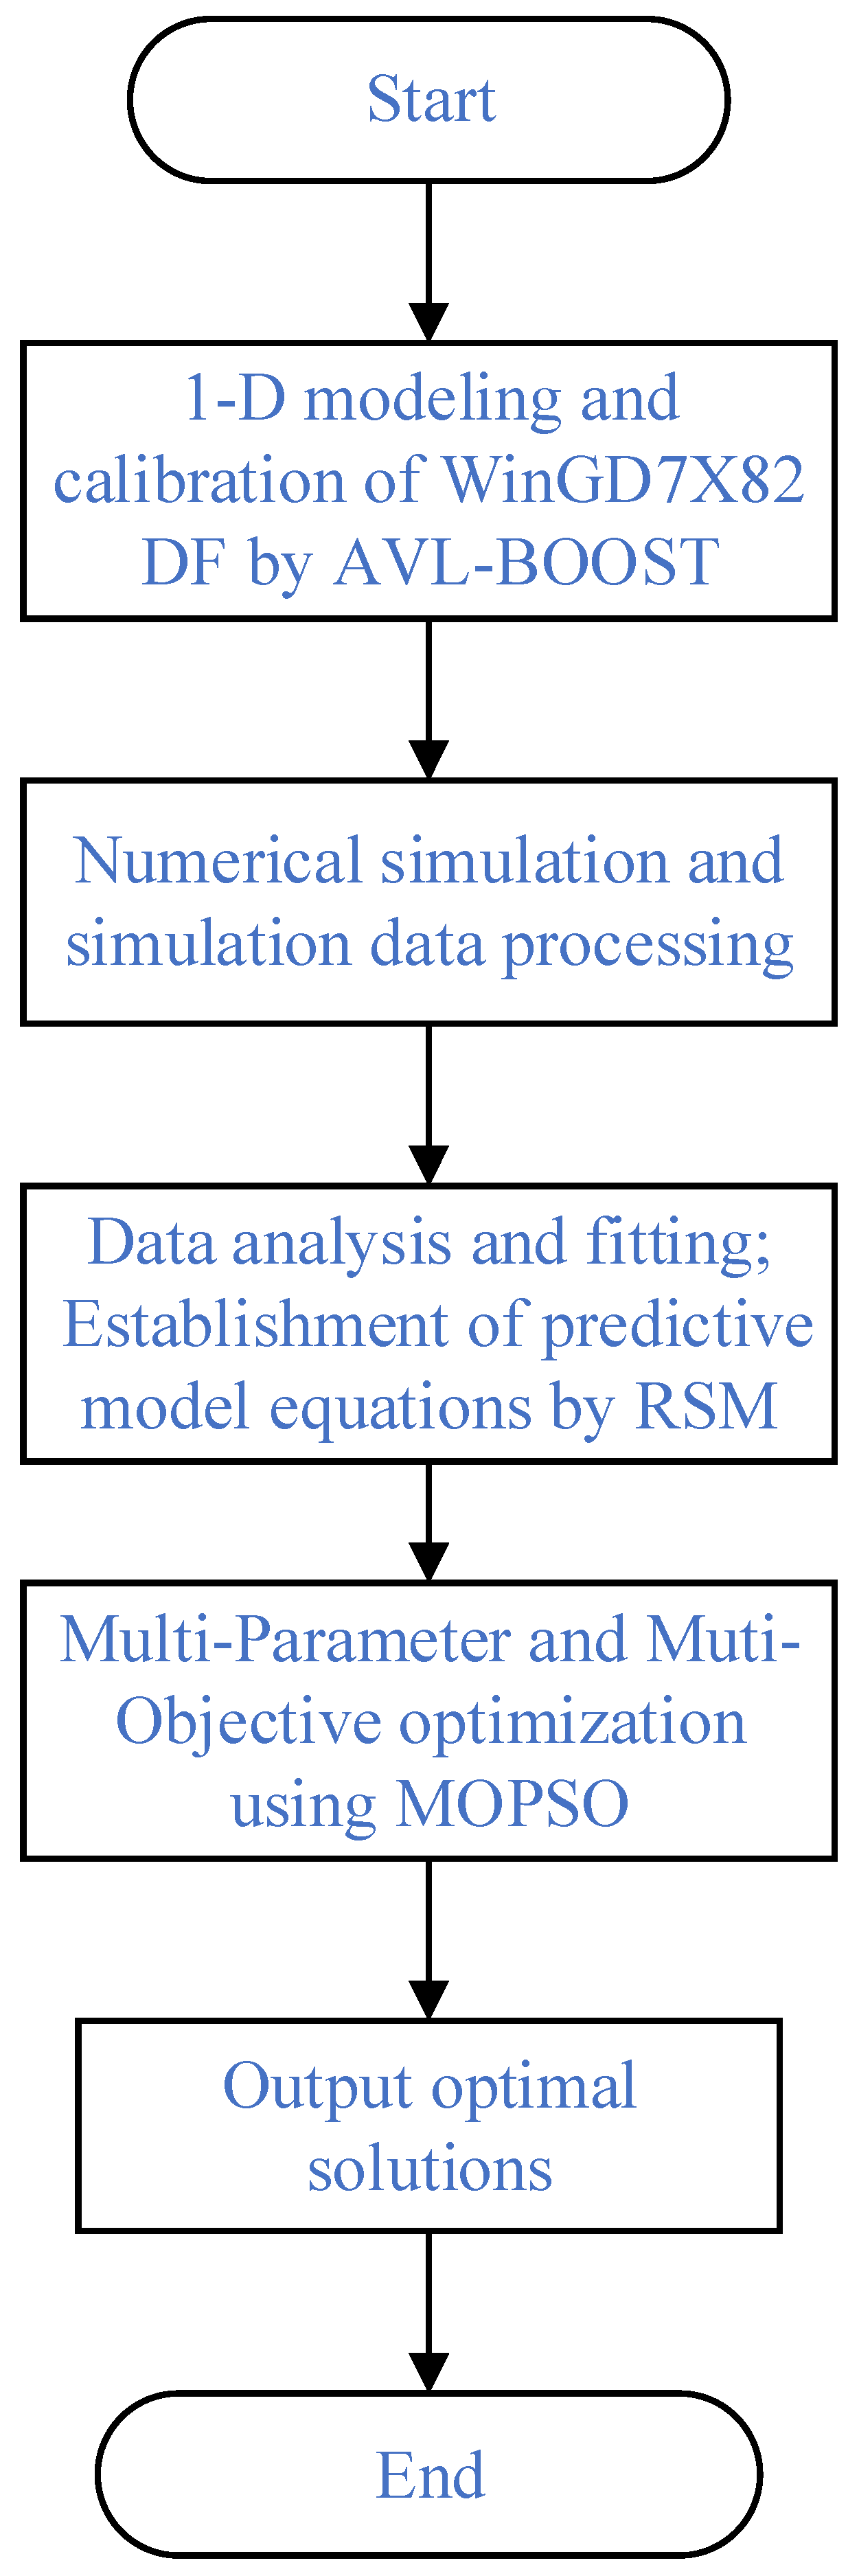
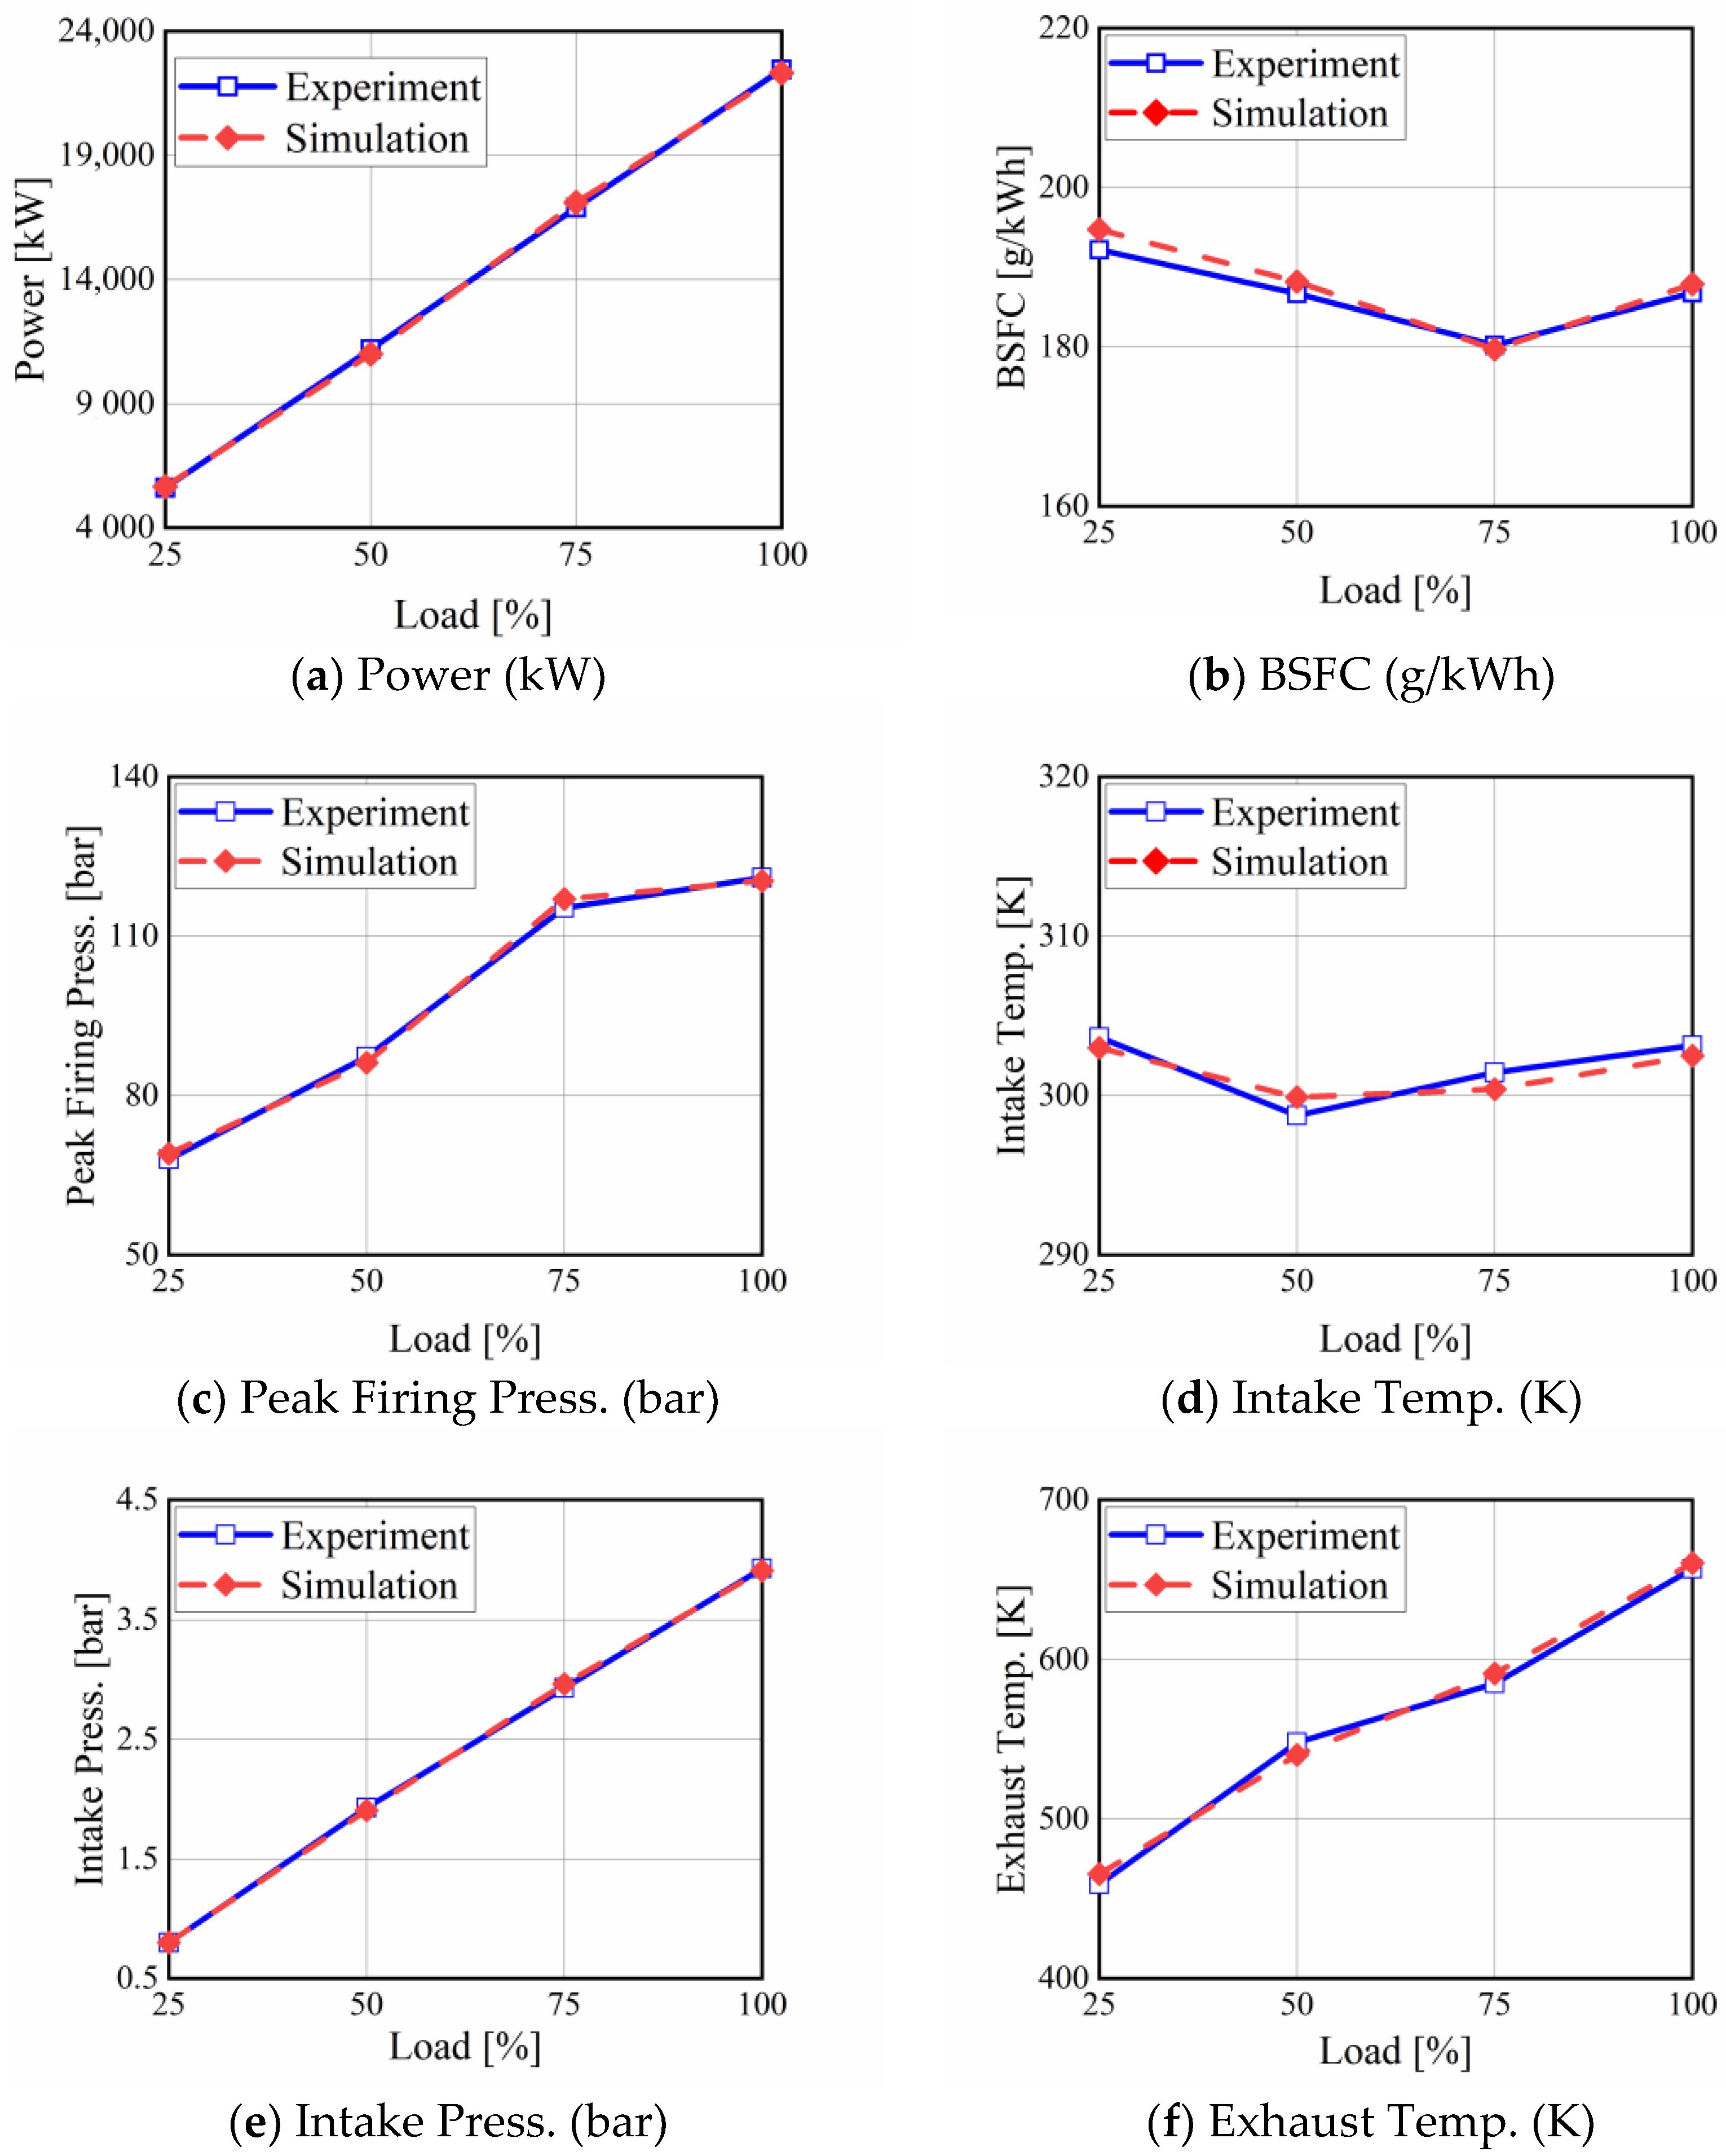
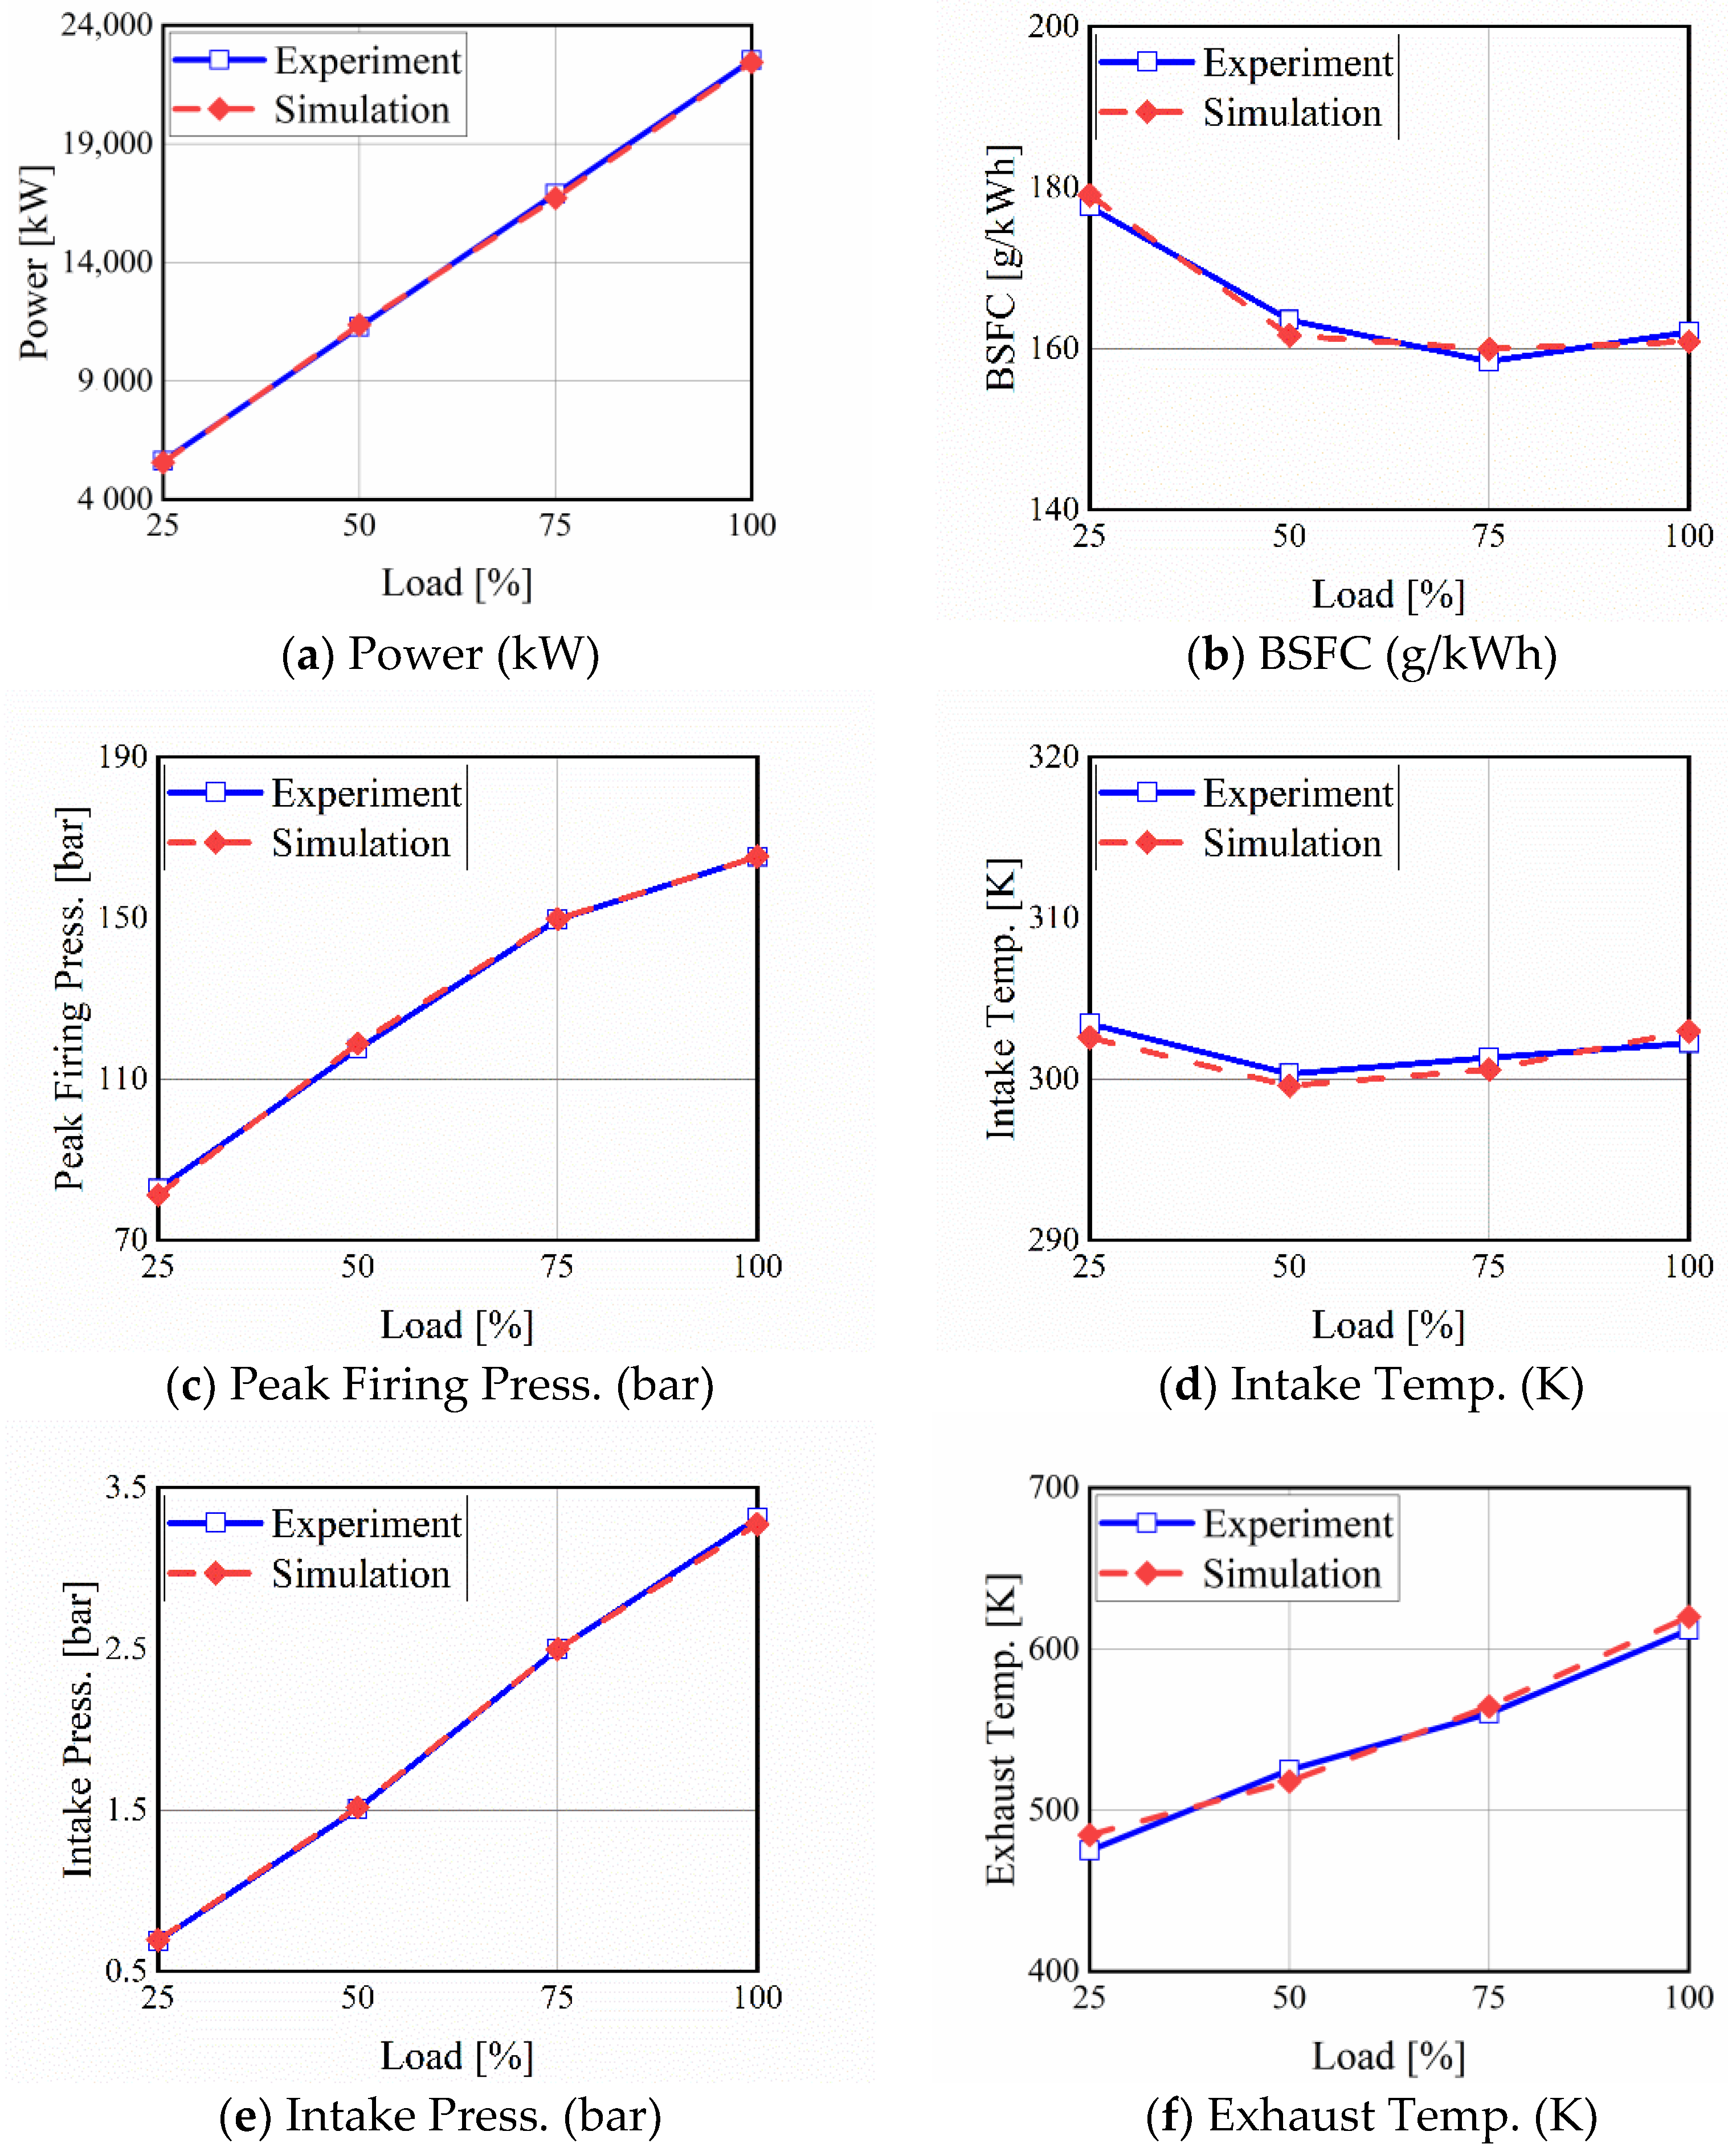
- A 1D simulation model was established by using the AVL-BOOST software, including diesel mode and gas mode of the 7X82DF engine. Combined with the bench reports provided by the shipyard, the main parameters of diesel mode and gas mode were calibrated and verified respectively, and the errors are all within 3%, which confirmed the accuracy of the simulation model and can be used for future research. Taking the pilot fuel start of combustion timing, gas injection pressure, and mass of diesel in dual-fuel mode as the independent variable parameters, 125 sets of different simulation samples were designed and calculated by using the verified AVL-BOOST model.
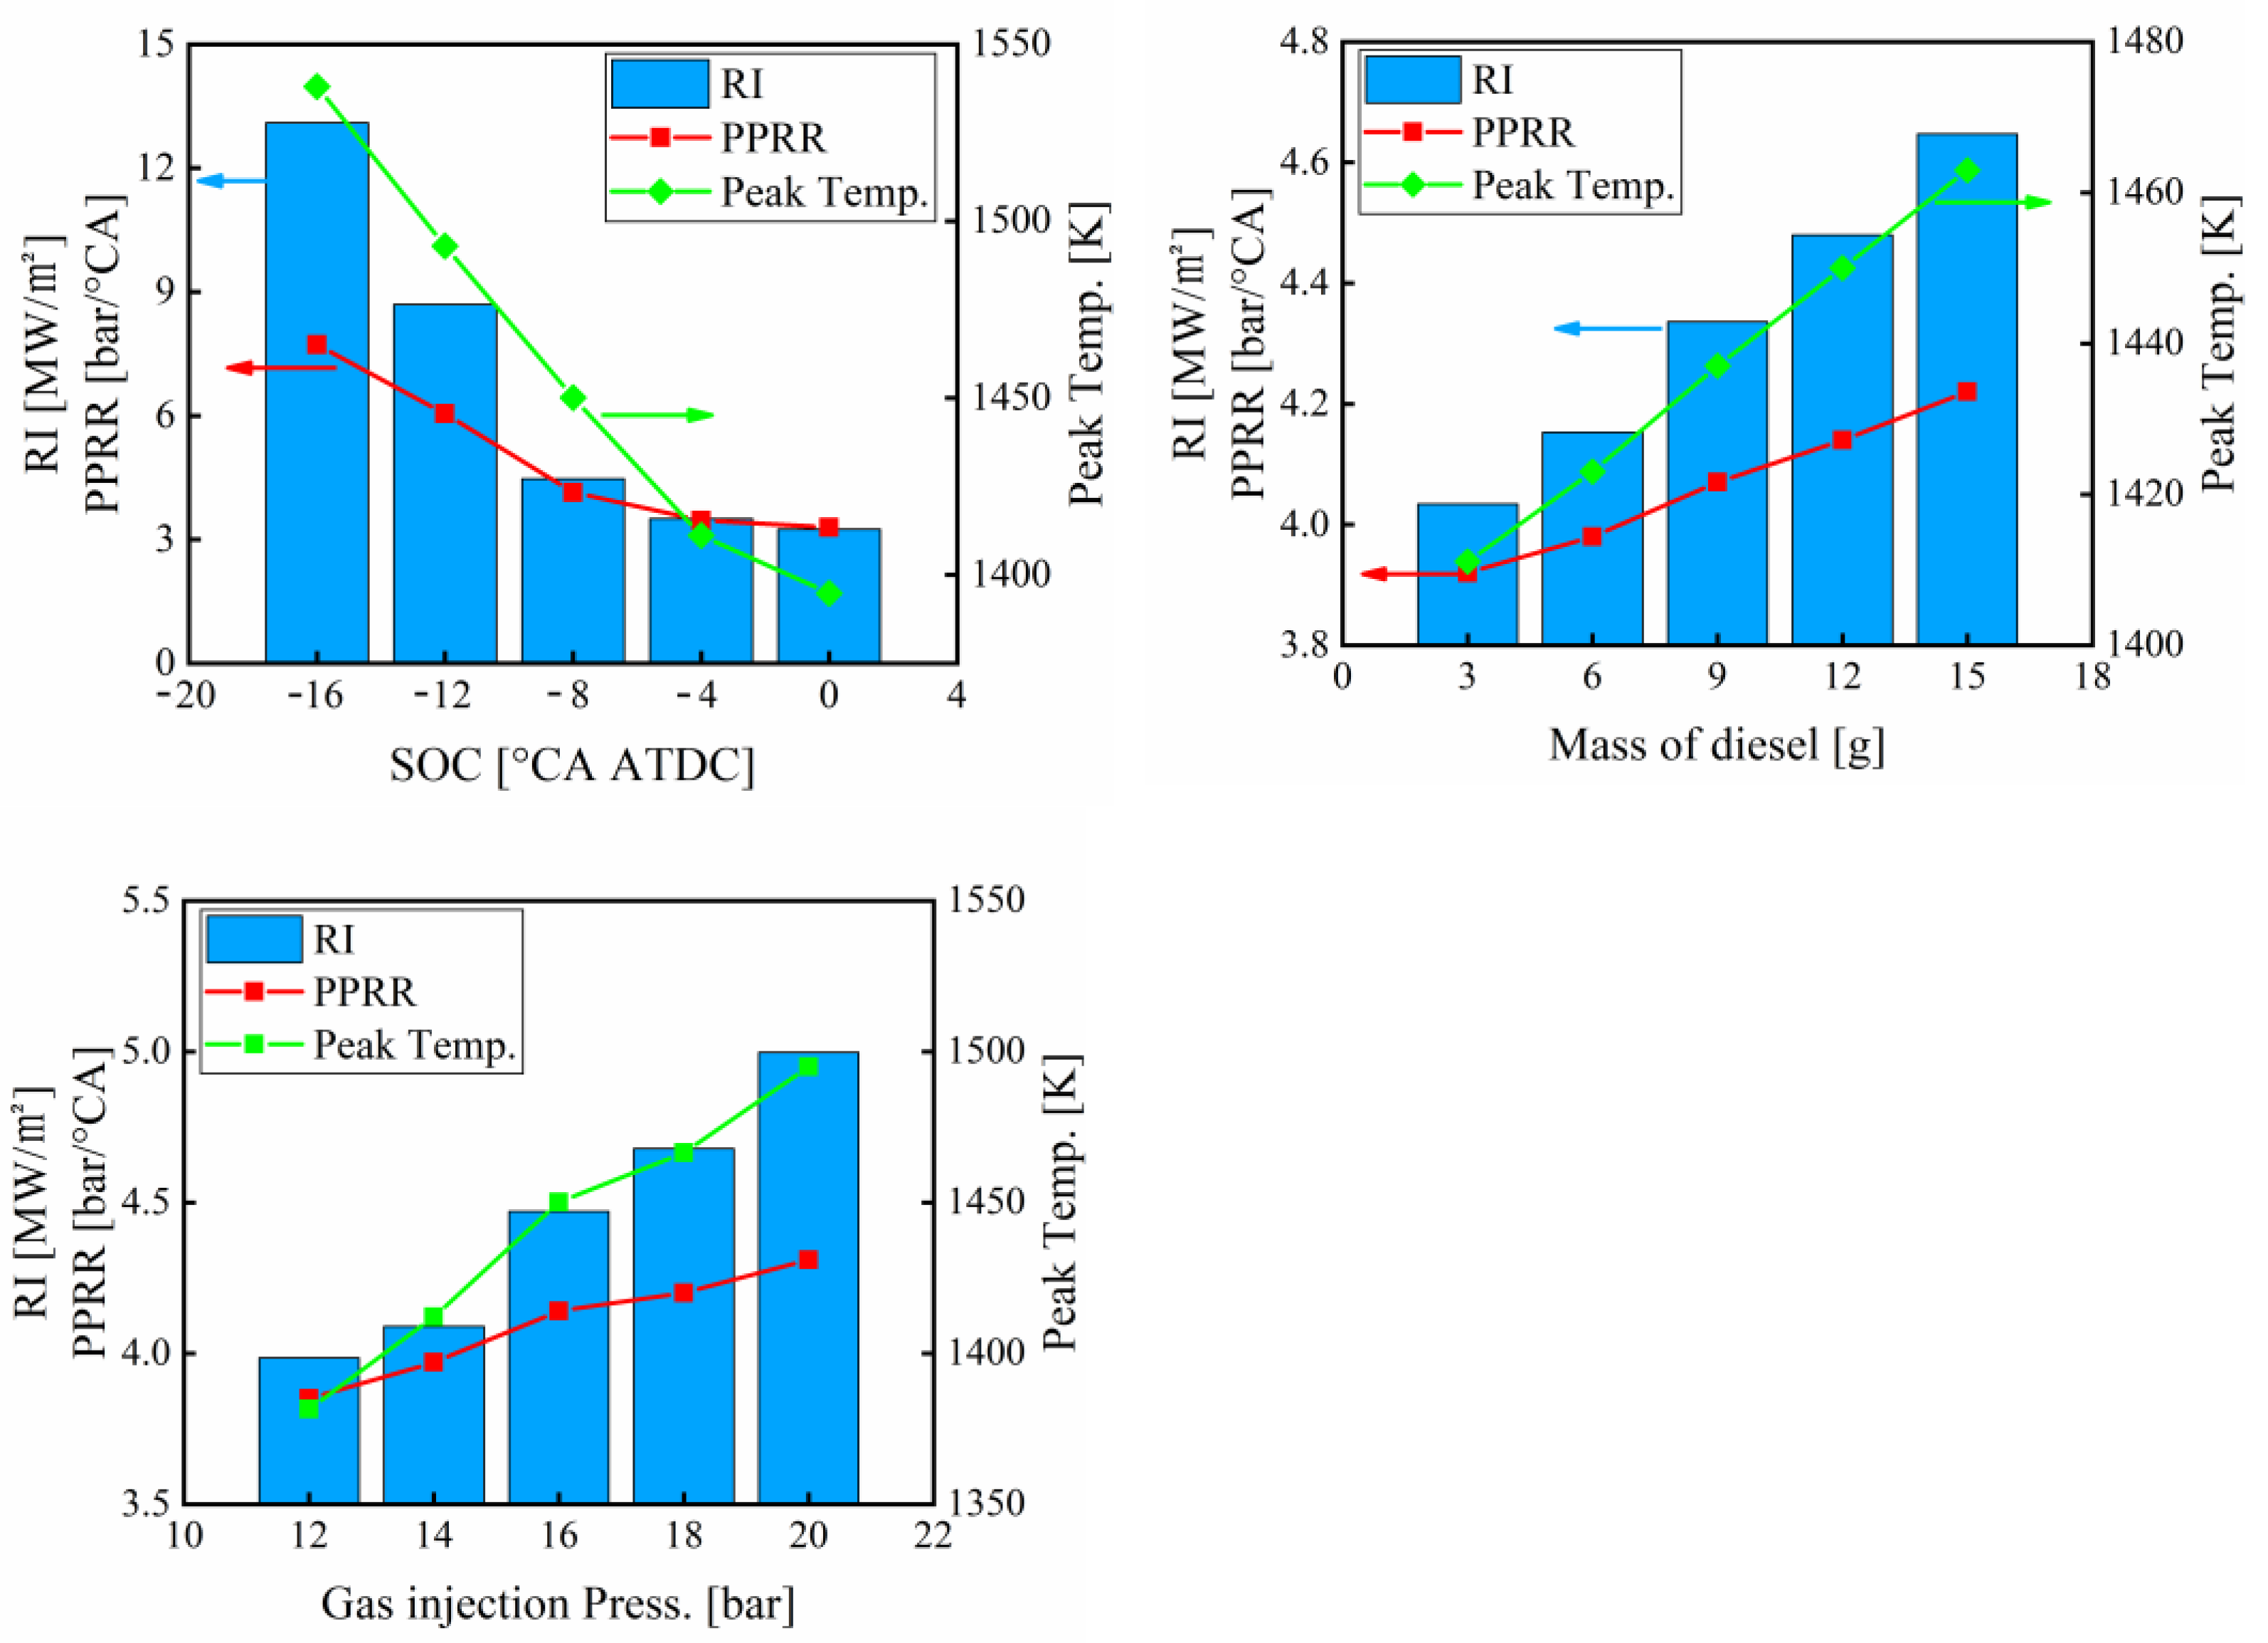
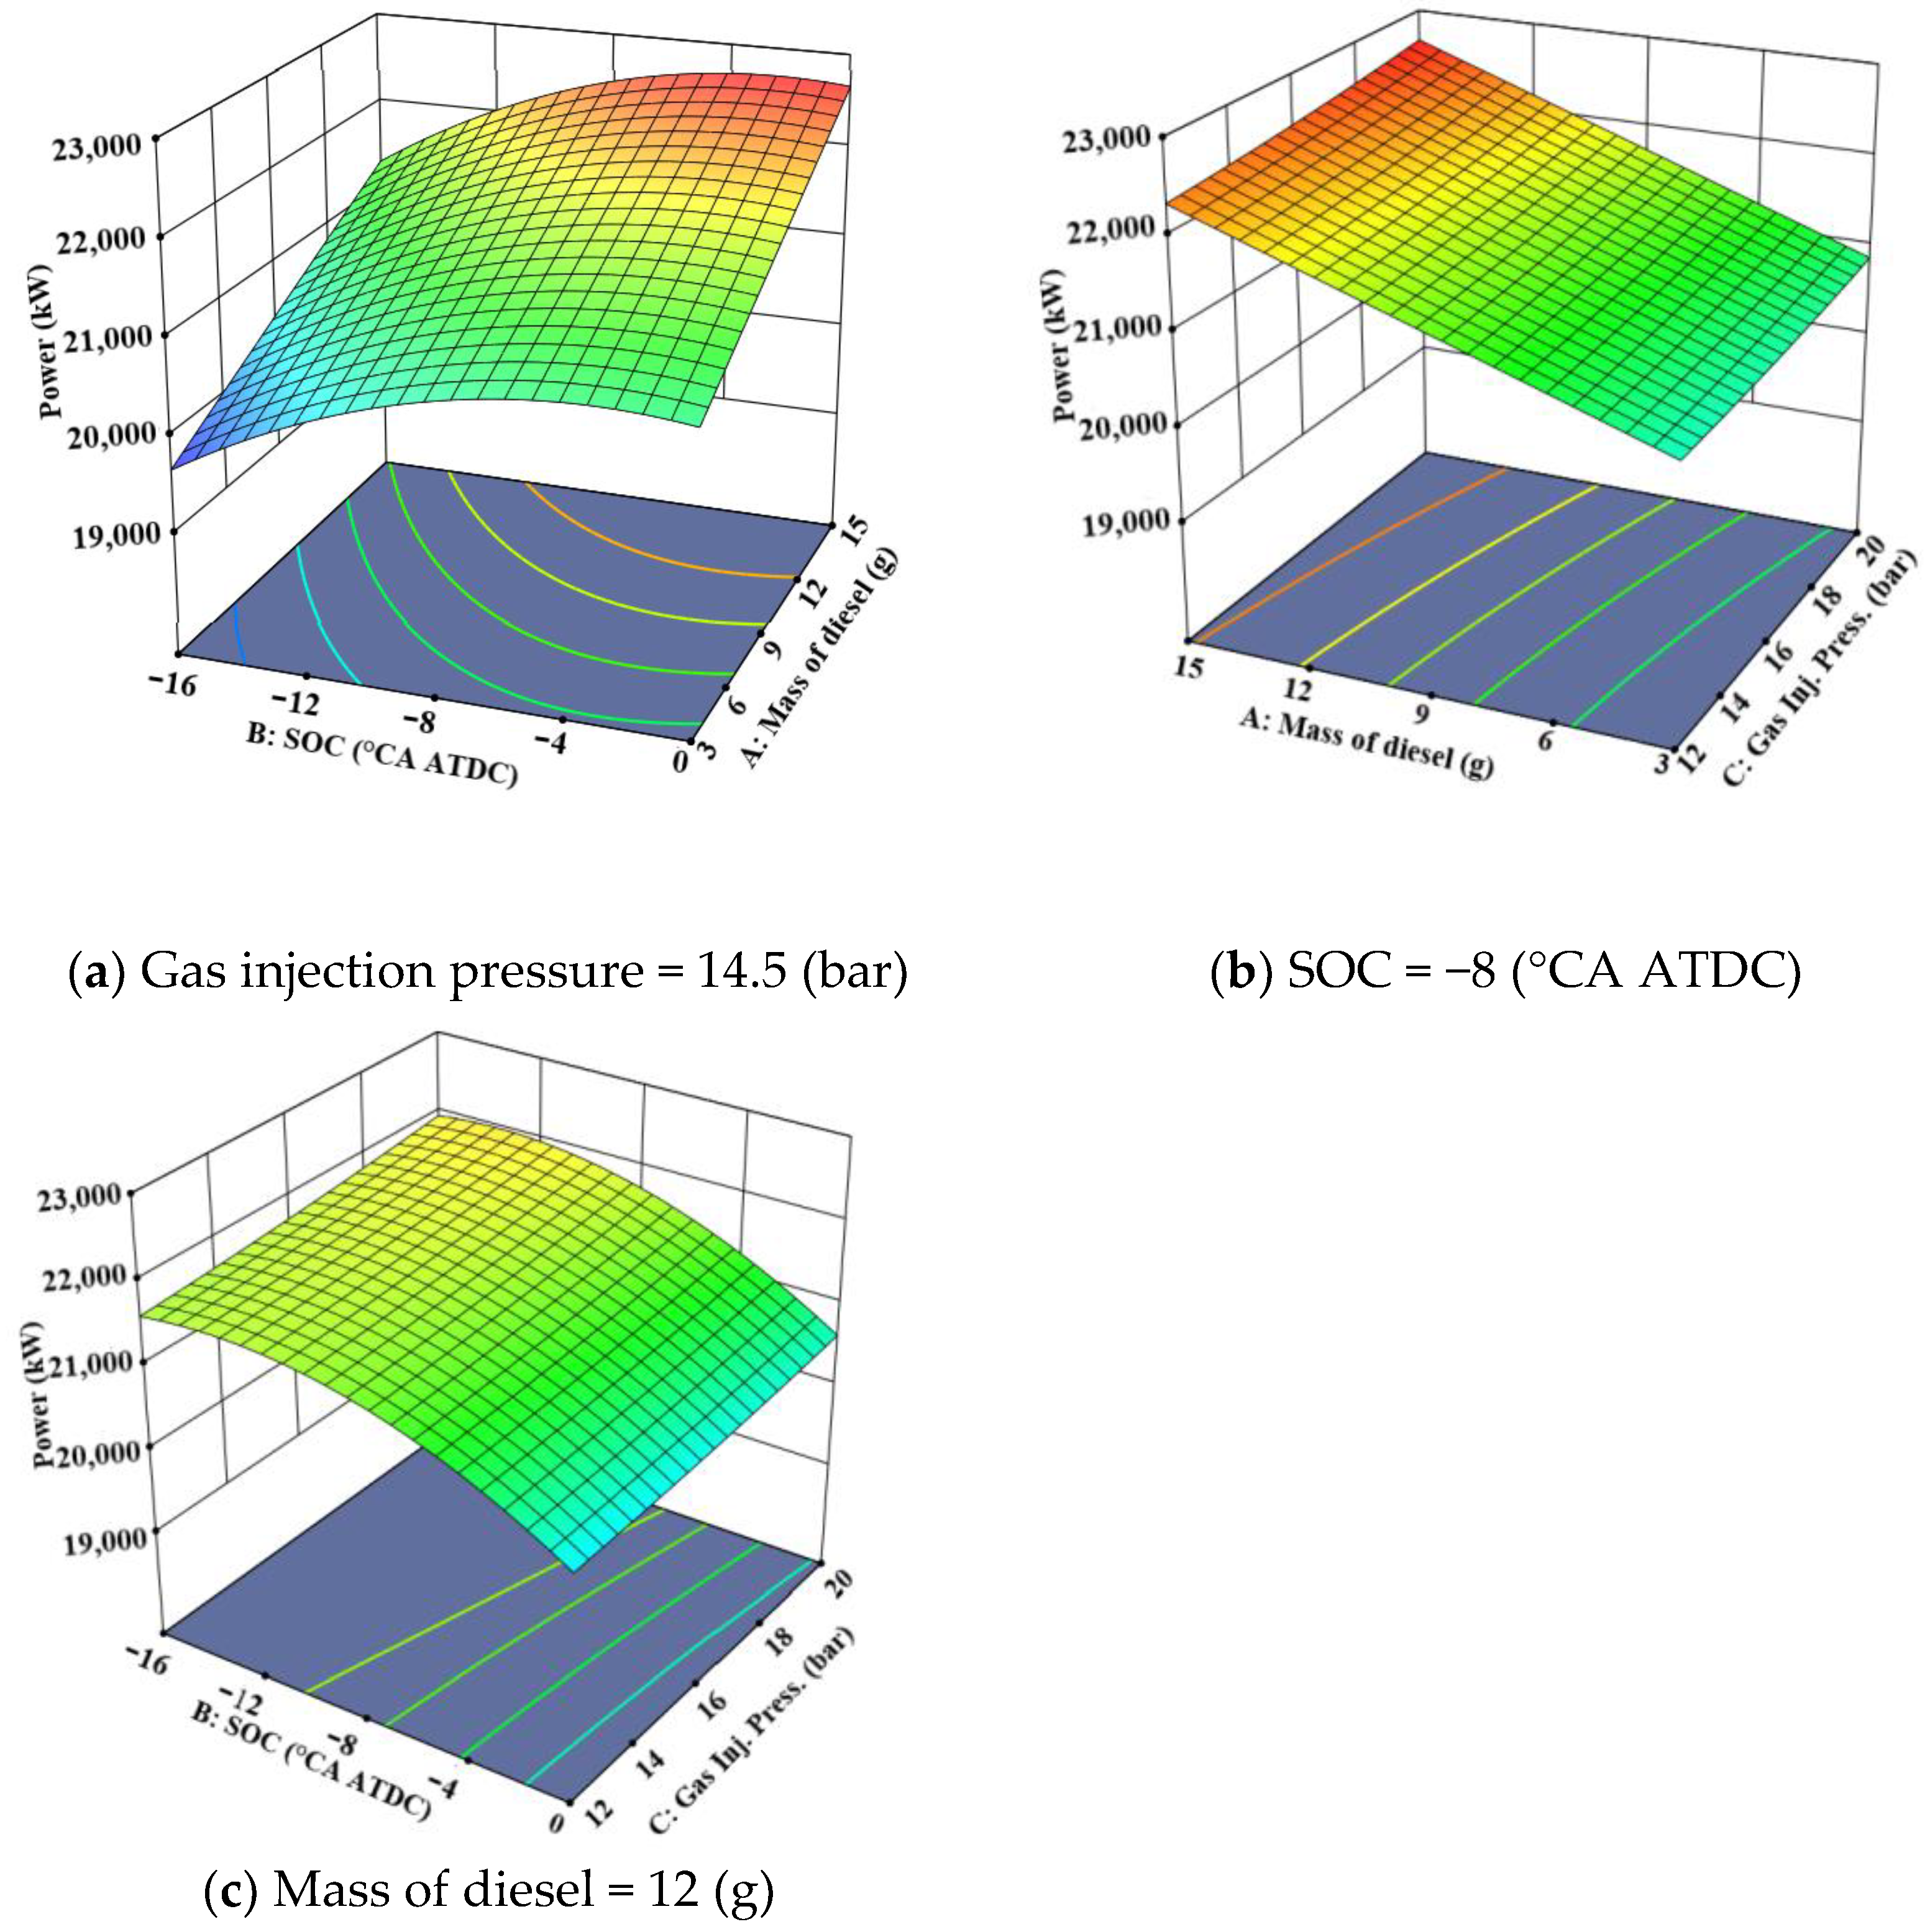
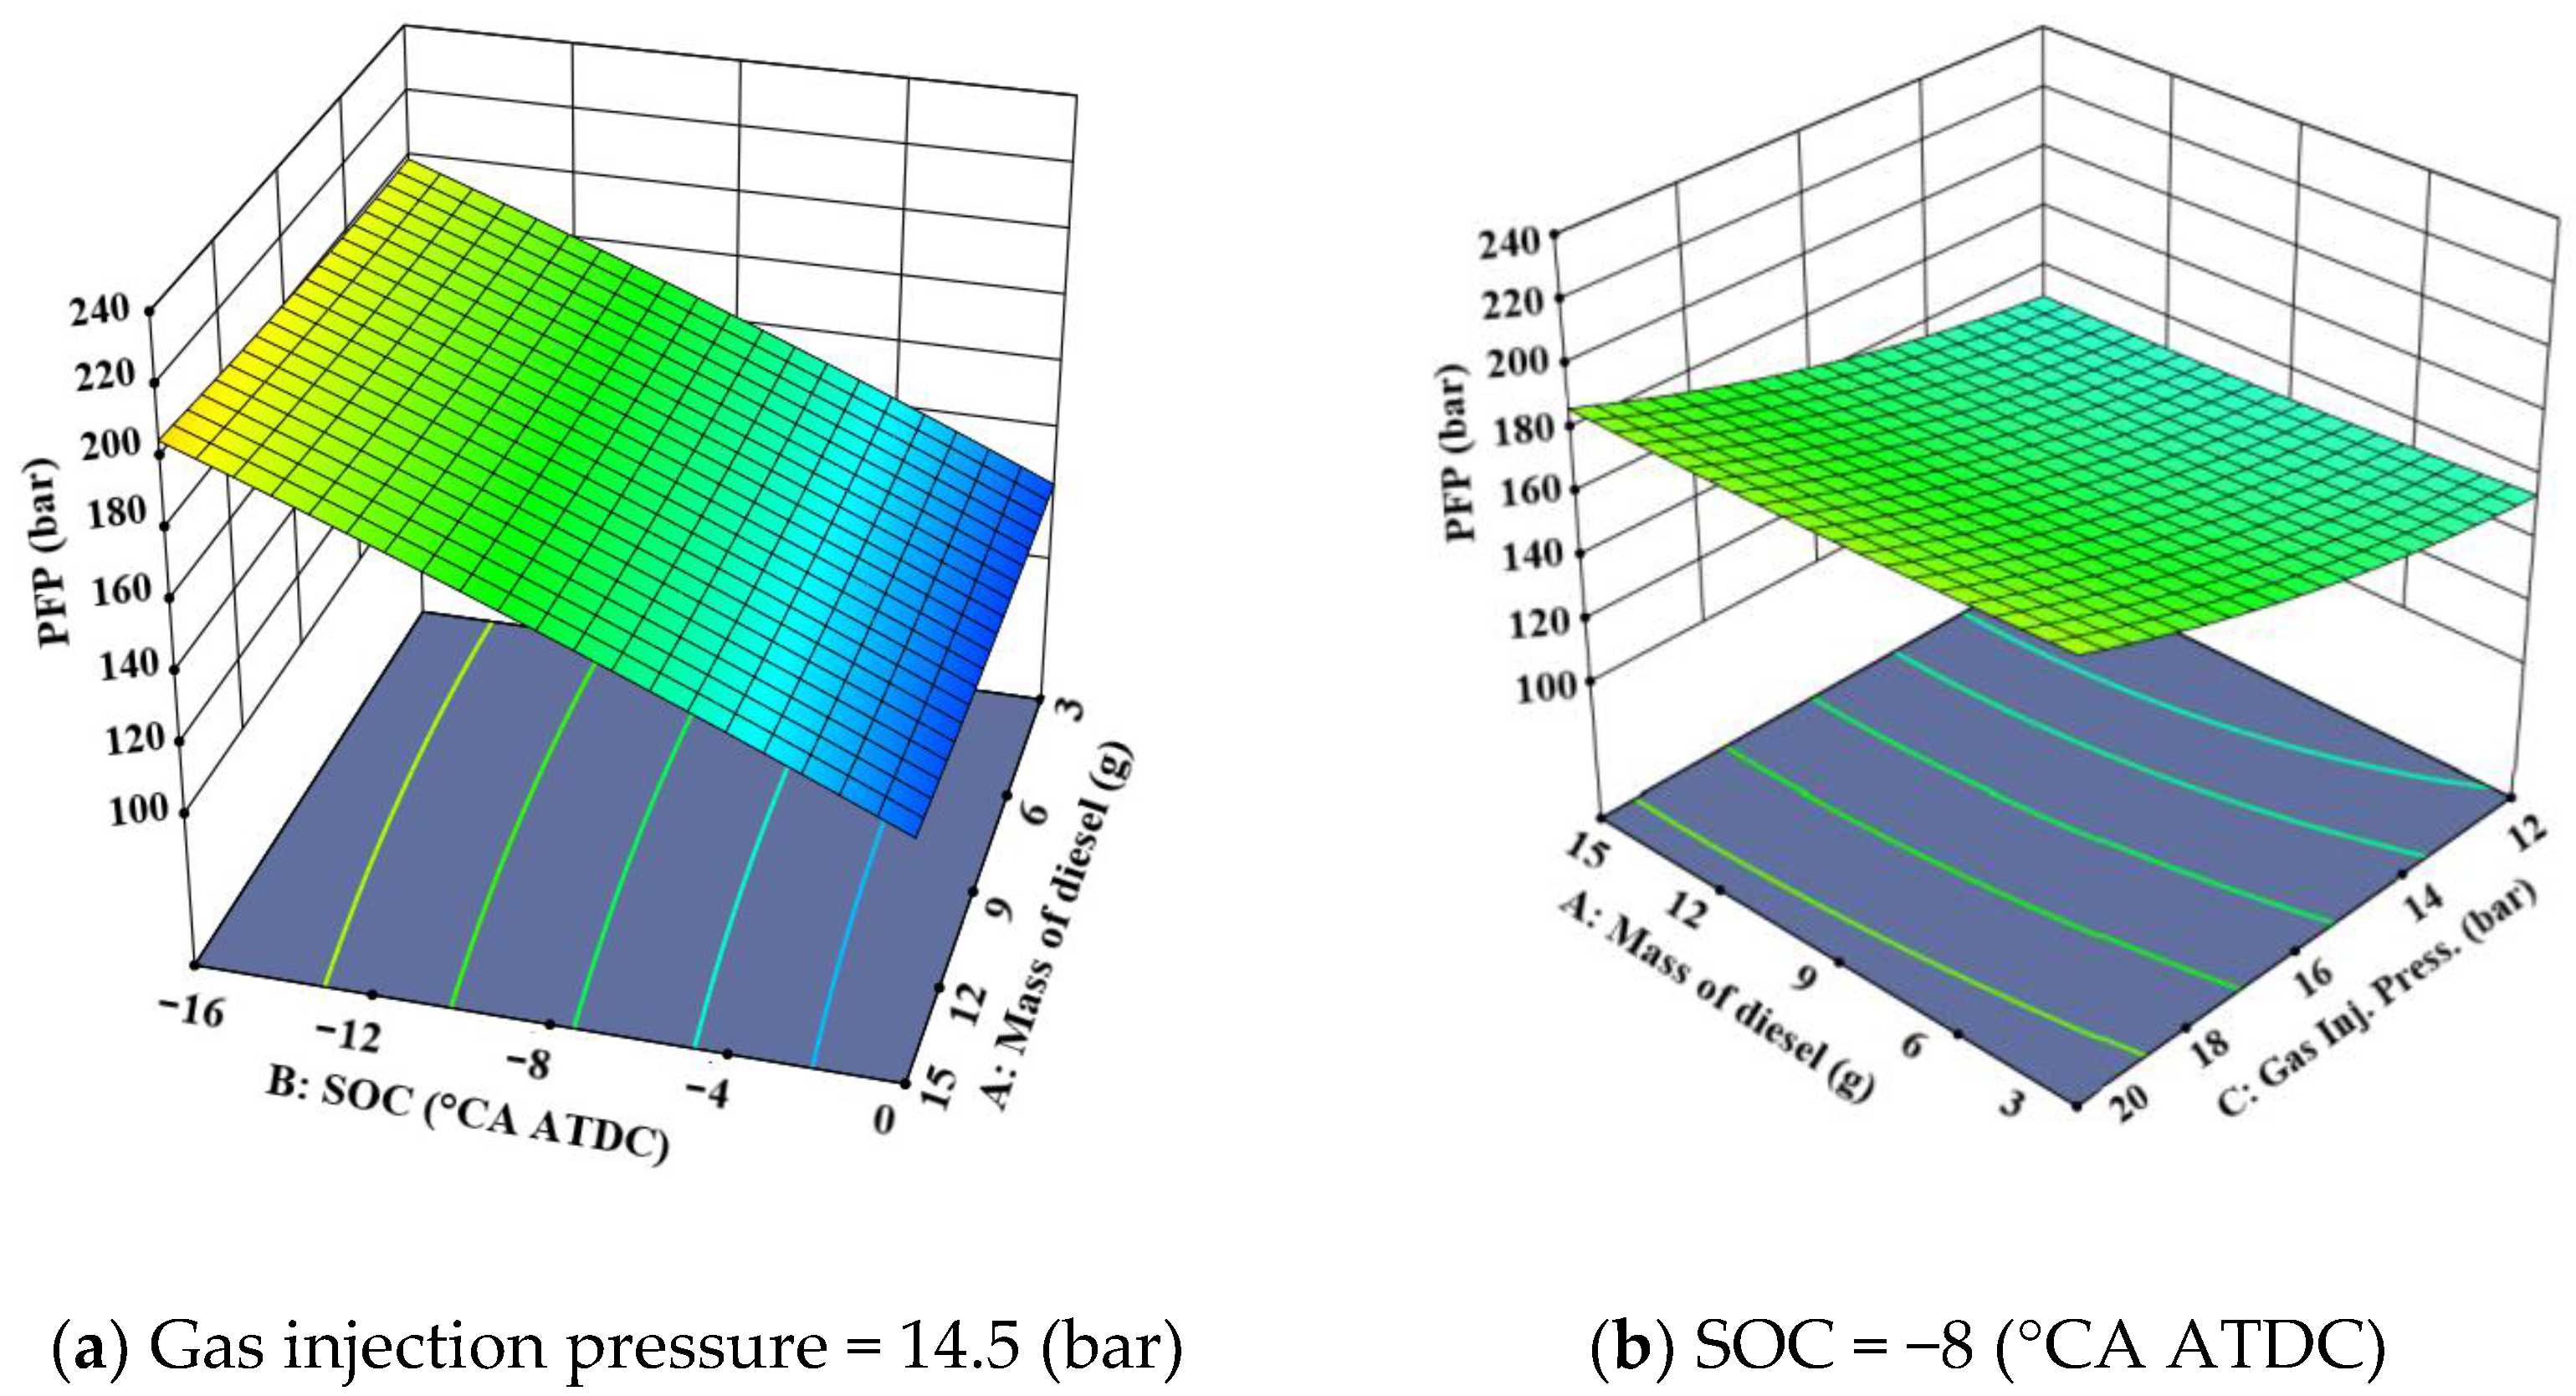
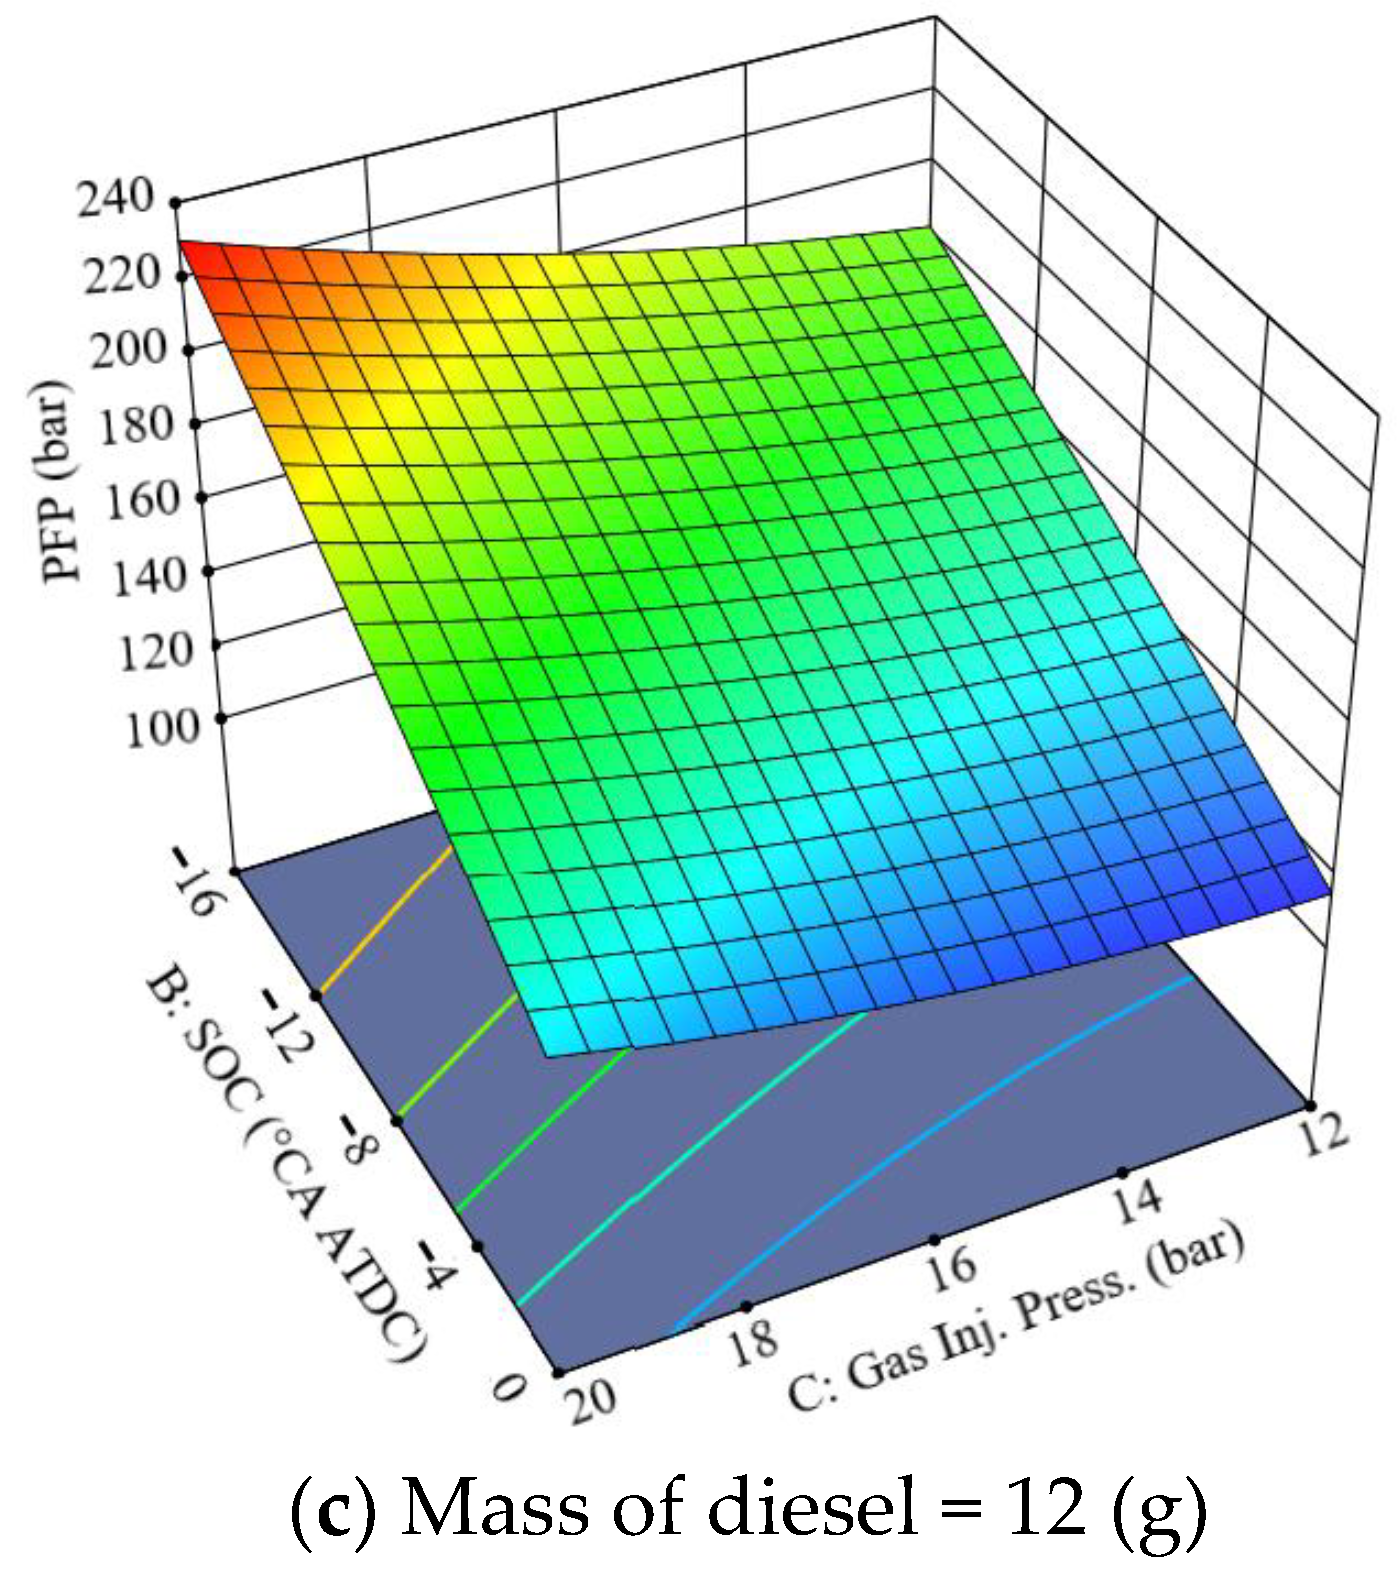
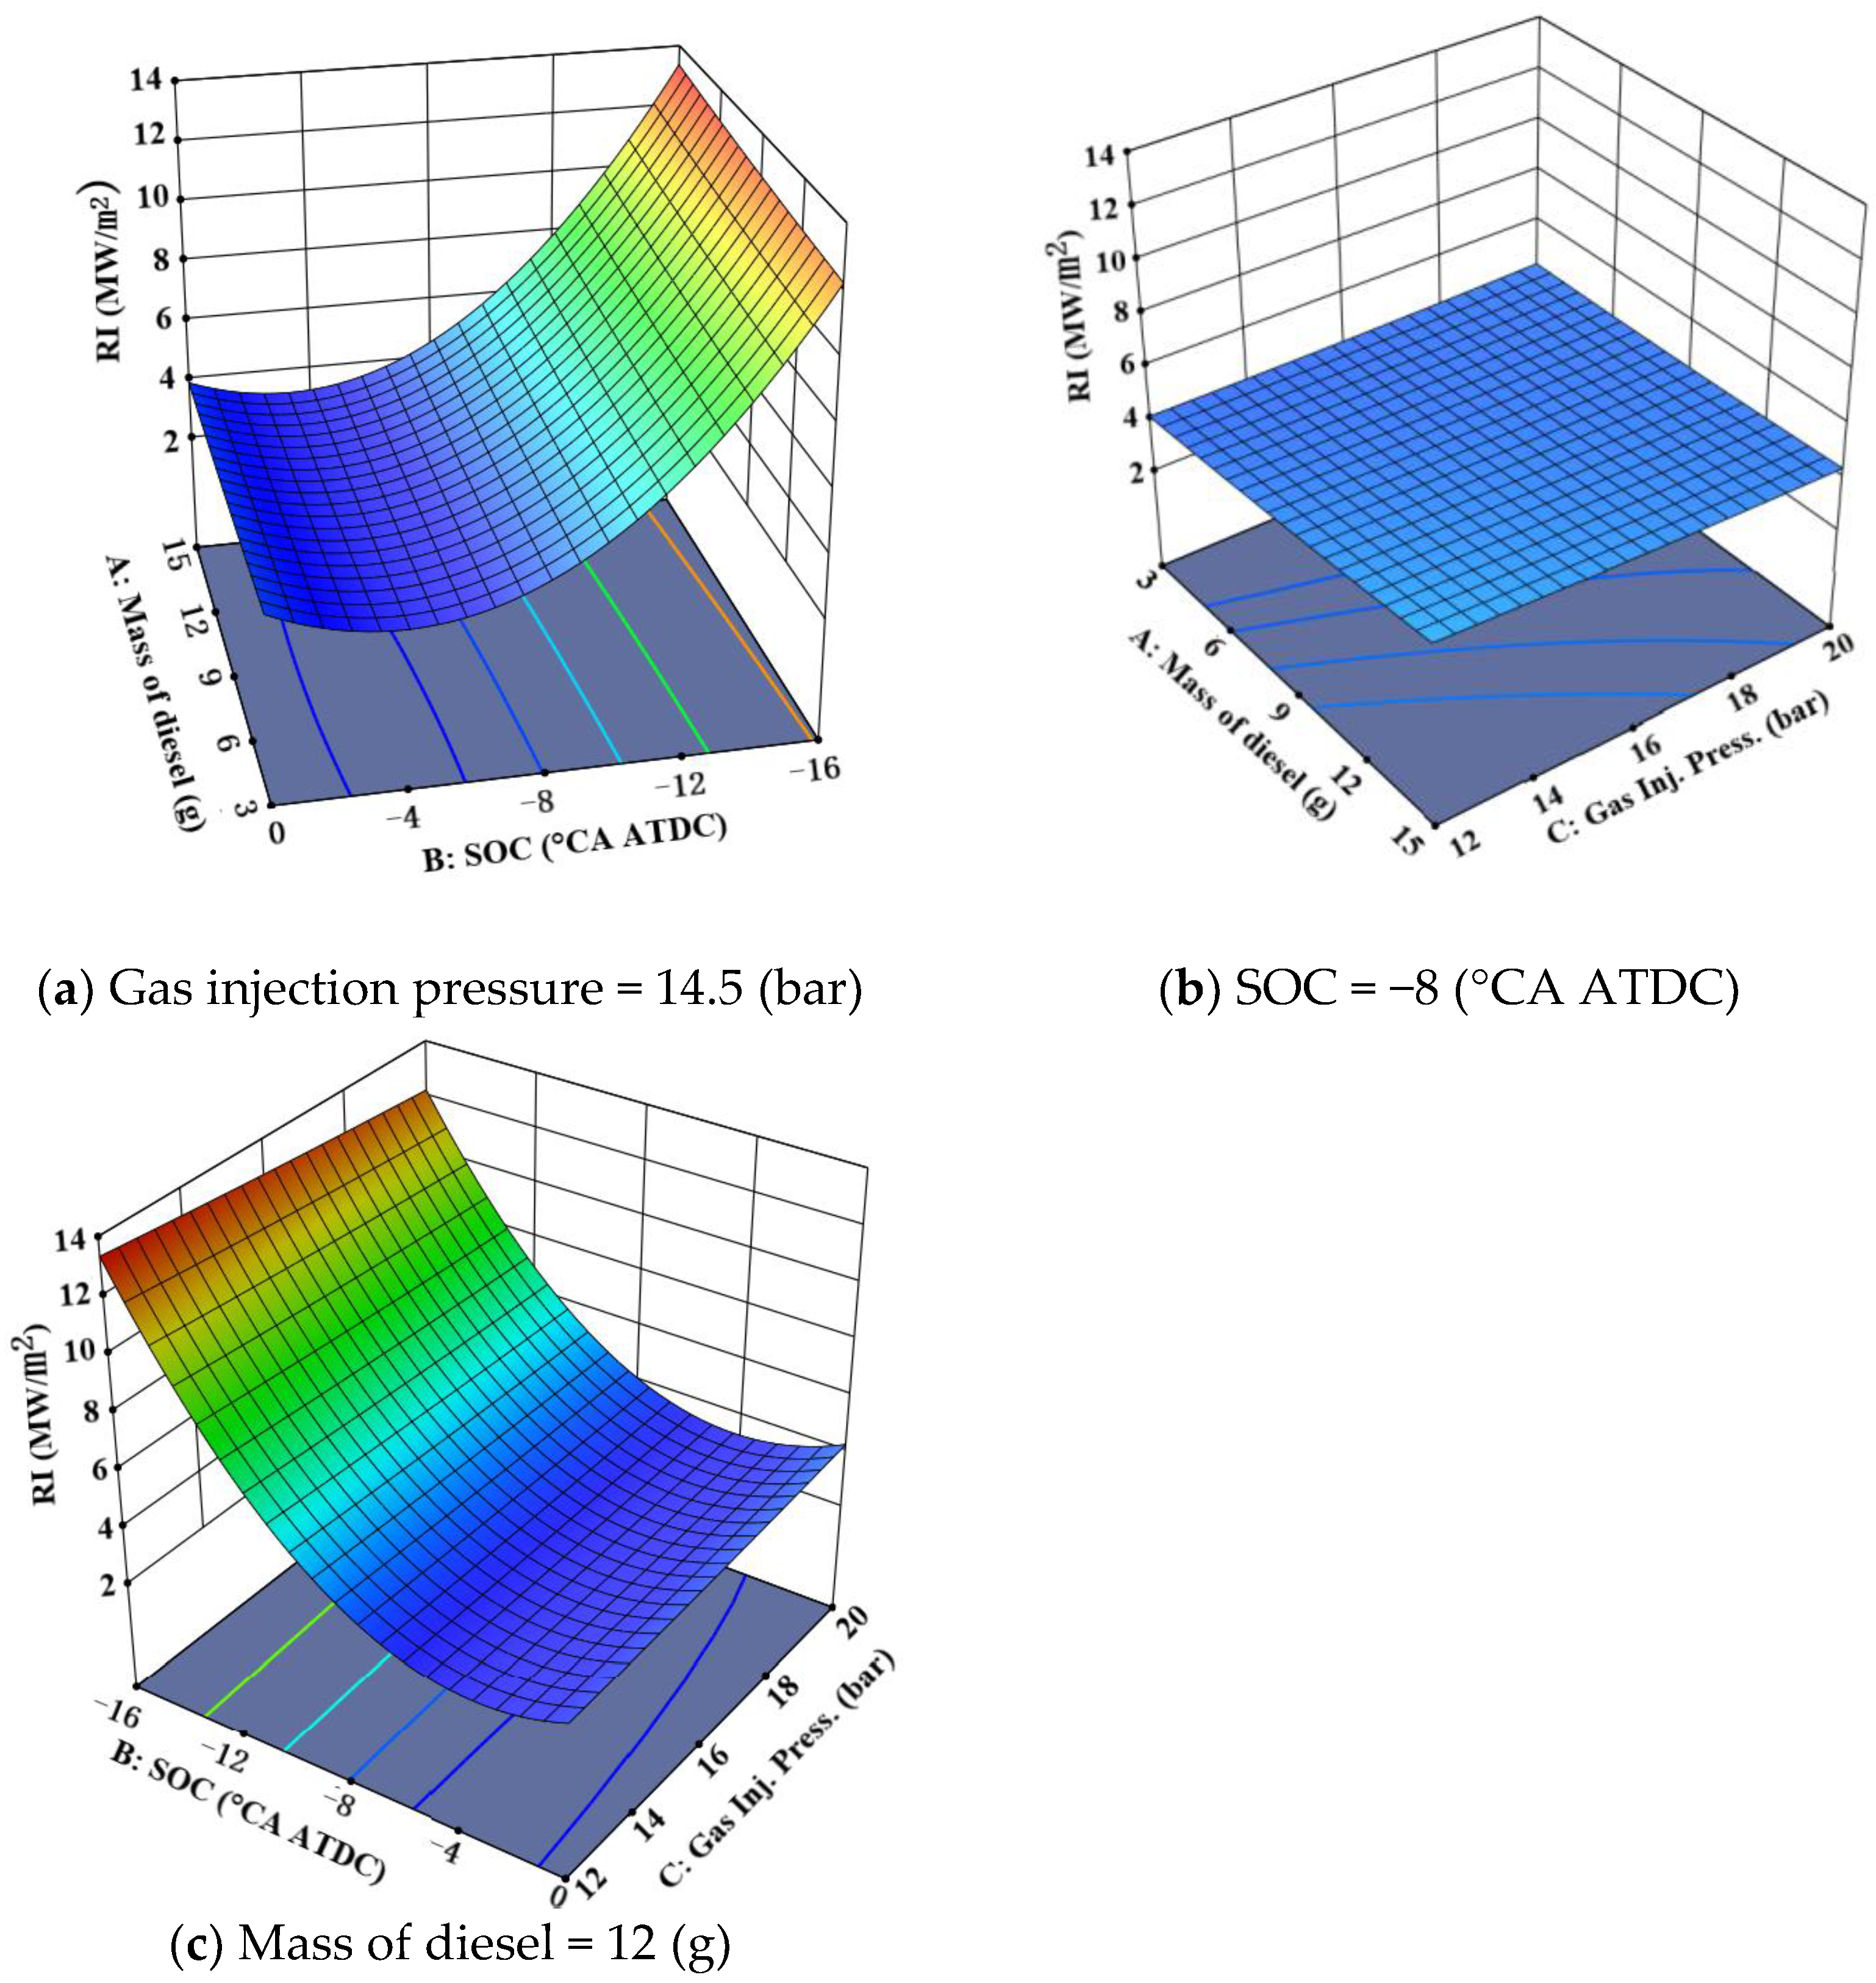
- The 125 sets of simulation data were imported into the experimental design software Design-Expert for analysis, and the response surface models of the dependent variable parameters the power, BSFC, PFP, and RI were established, as well as the prediction model equation of each parameter was obtained. Through the response surface prediction model, we can conclude that with the advance of the SOC, the power of the DF engine first increased and then decreased, the BSFC first decreased and then increased, and the PFP gradually increased, and the RI had the same changing trend as the BSFC. With the increase in the gas injection pressure, the power, PFP, and RI increased gradually, and the BSFC decreased. With the increase in mass of diesel, the power, BSFC, PFP, and RI of the DF engine increased.
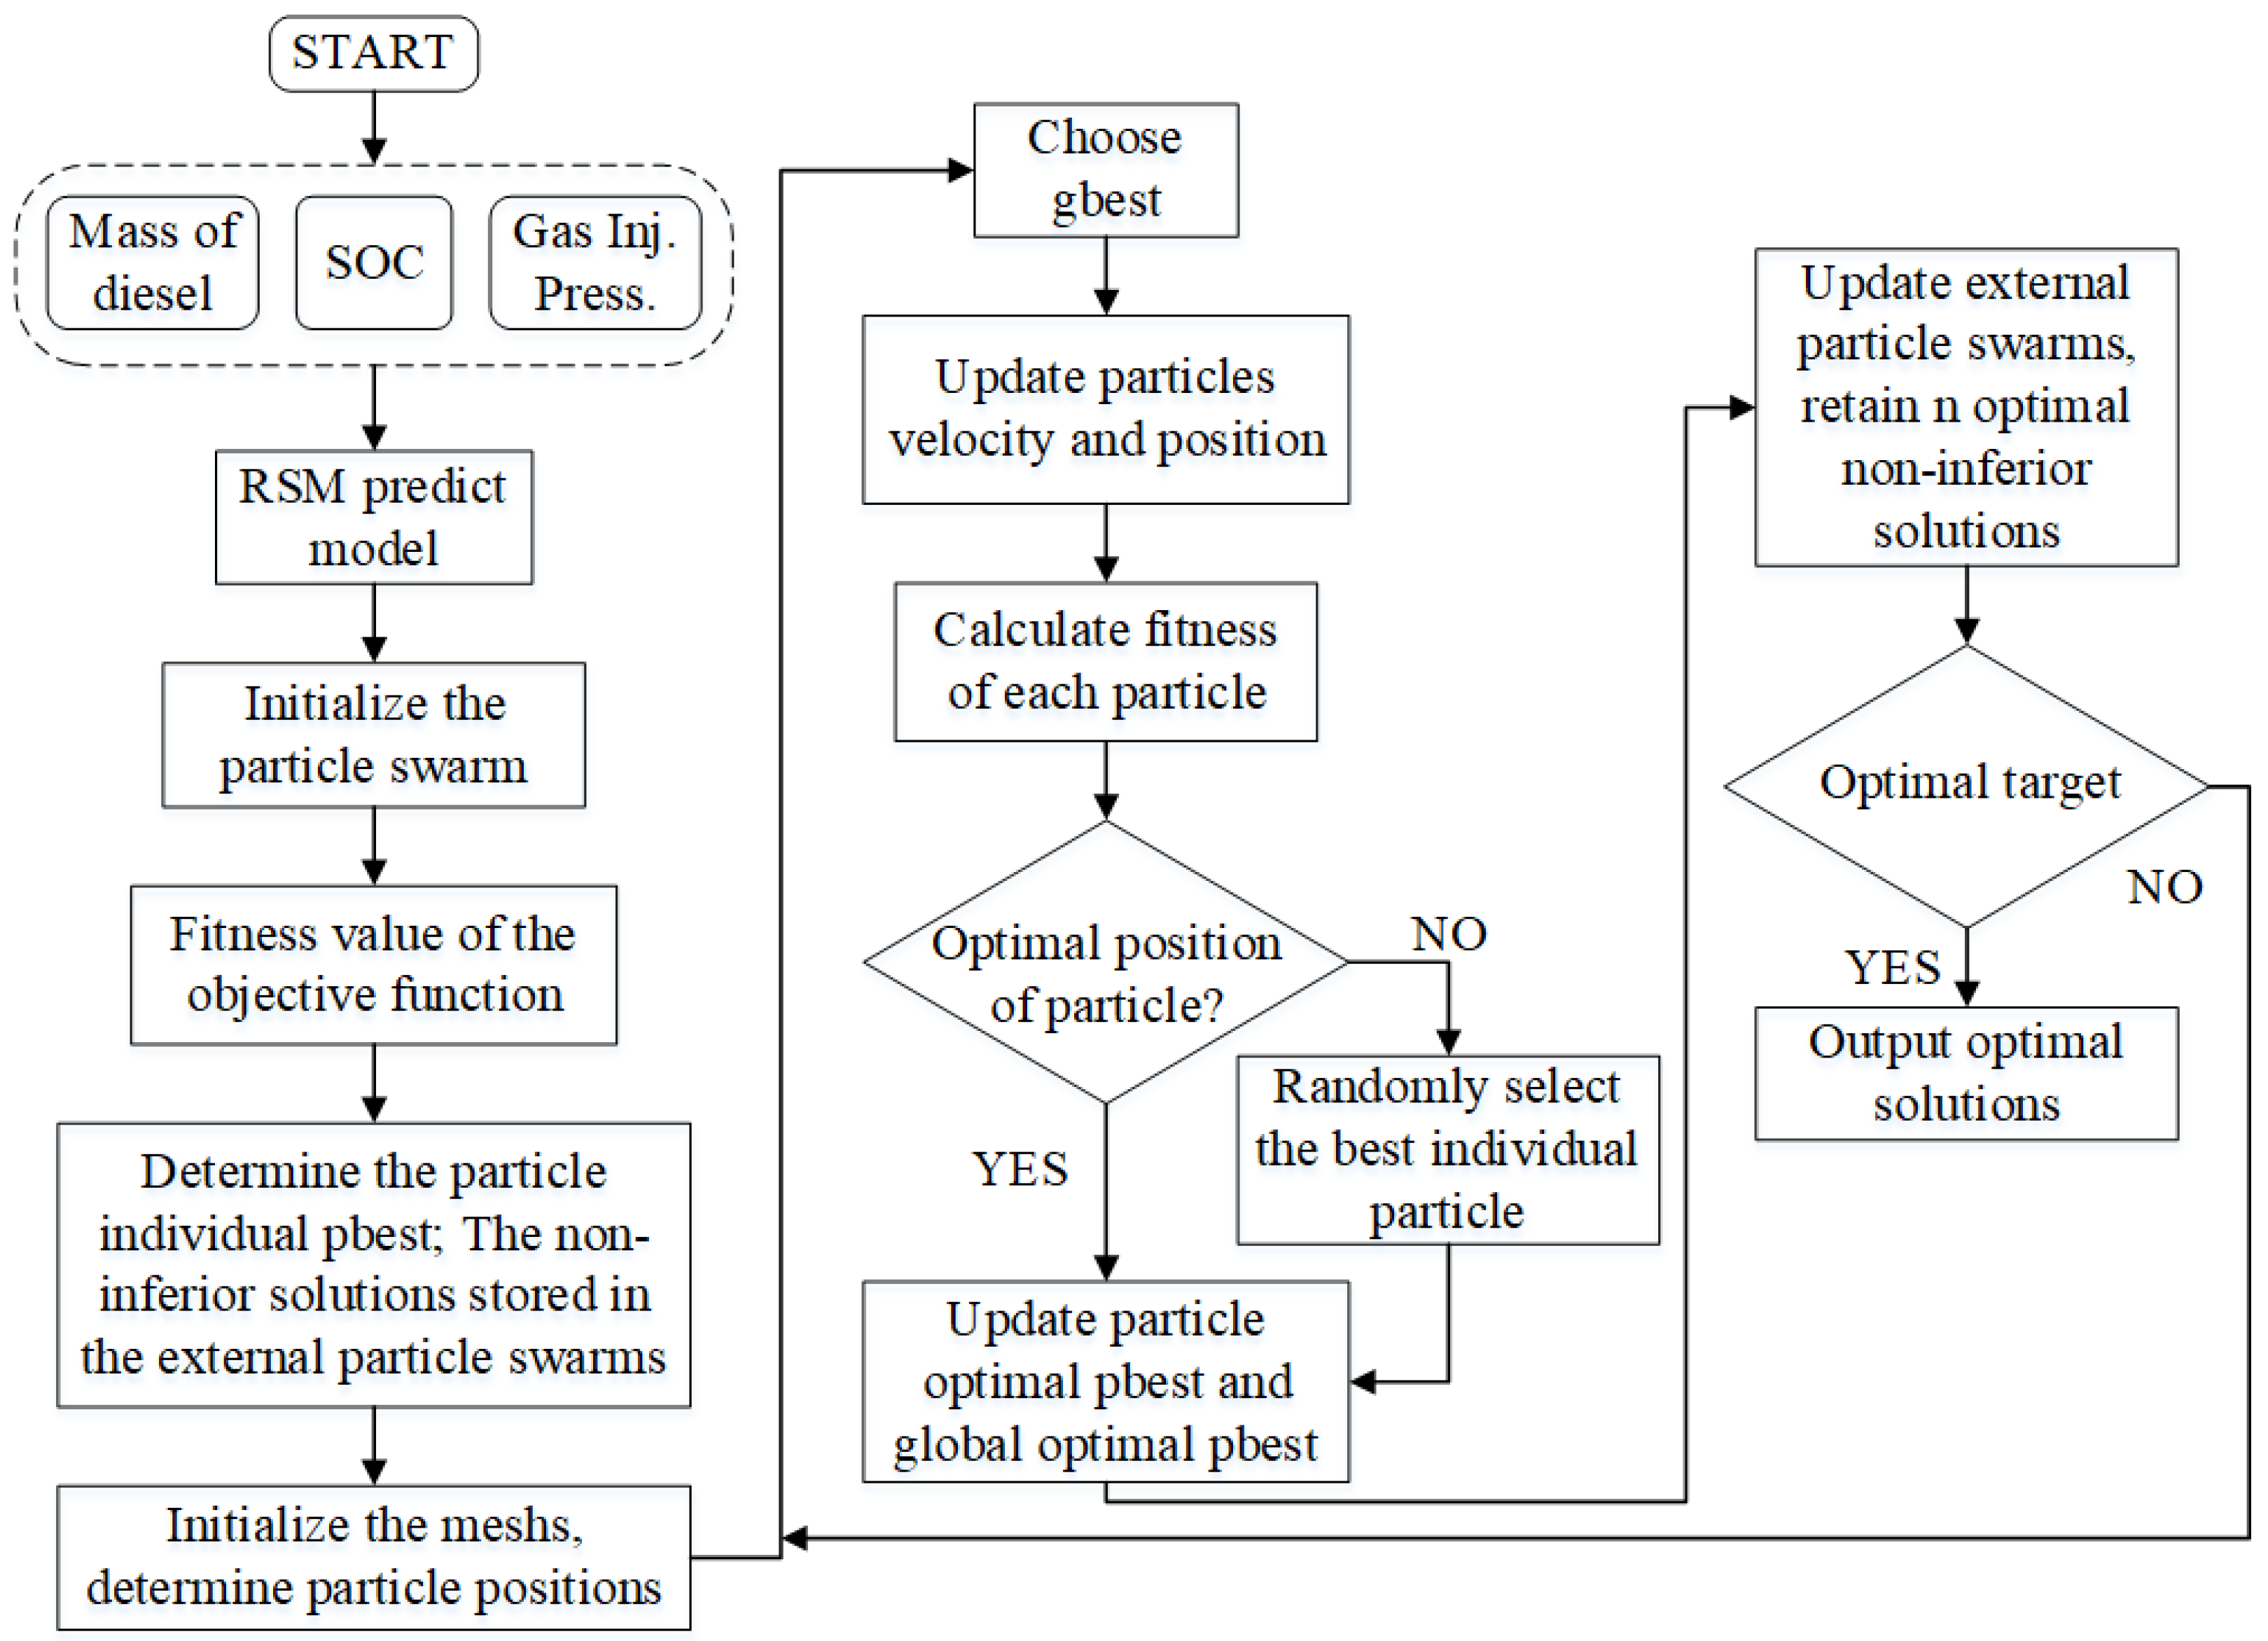
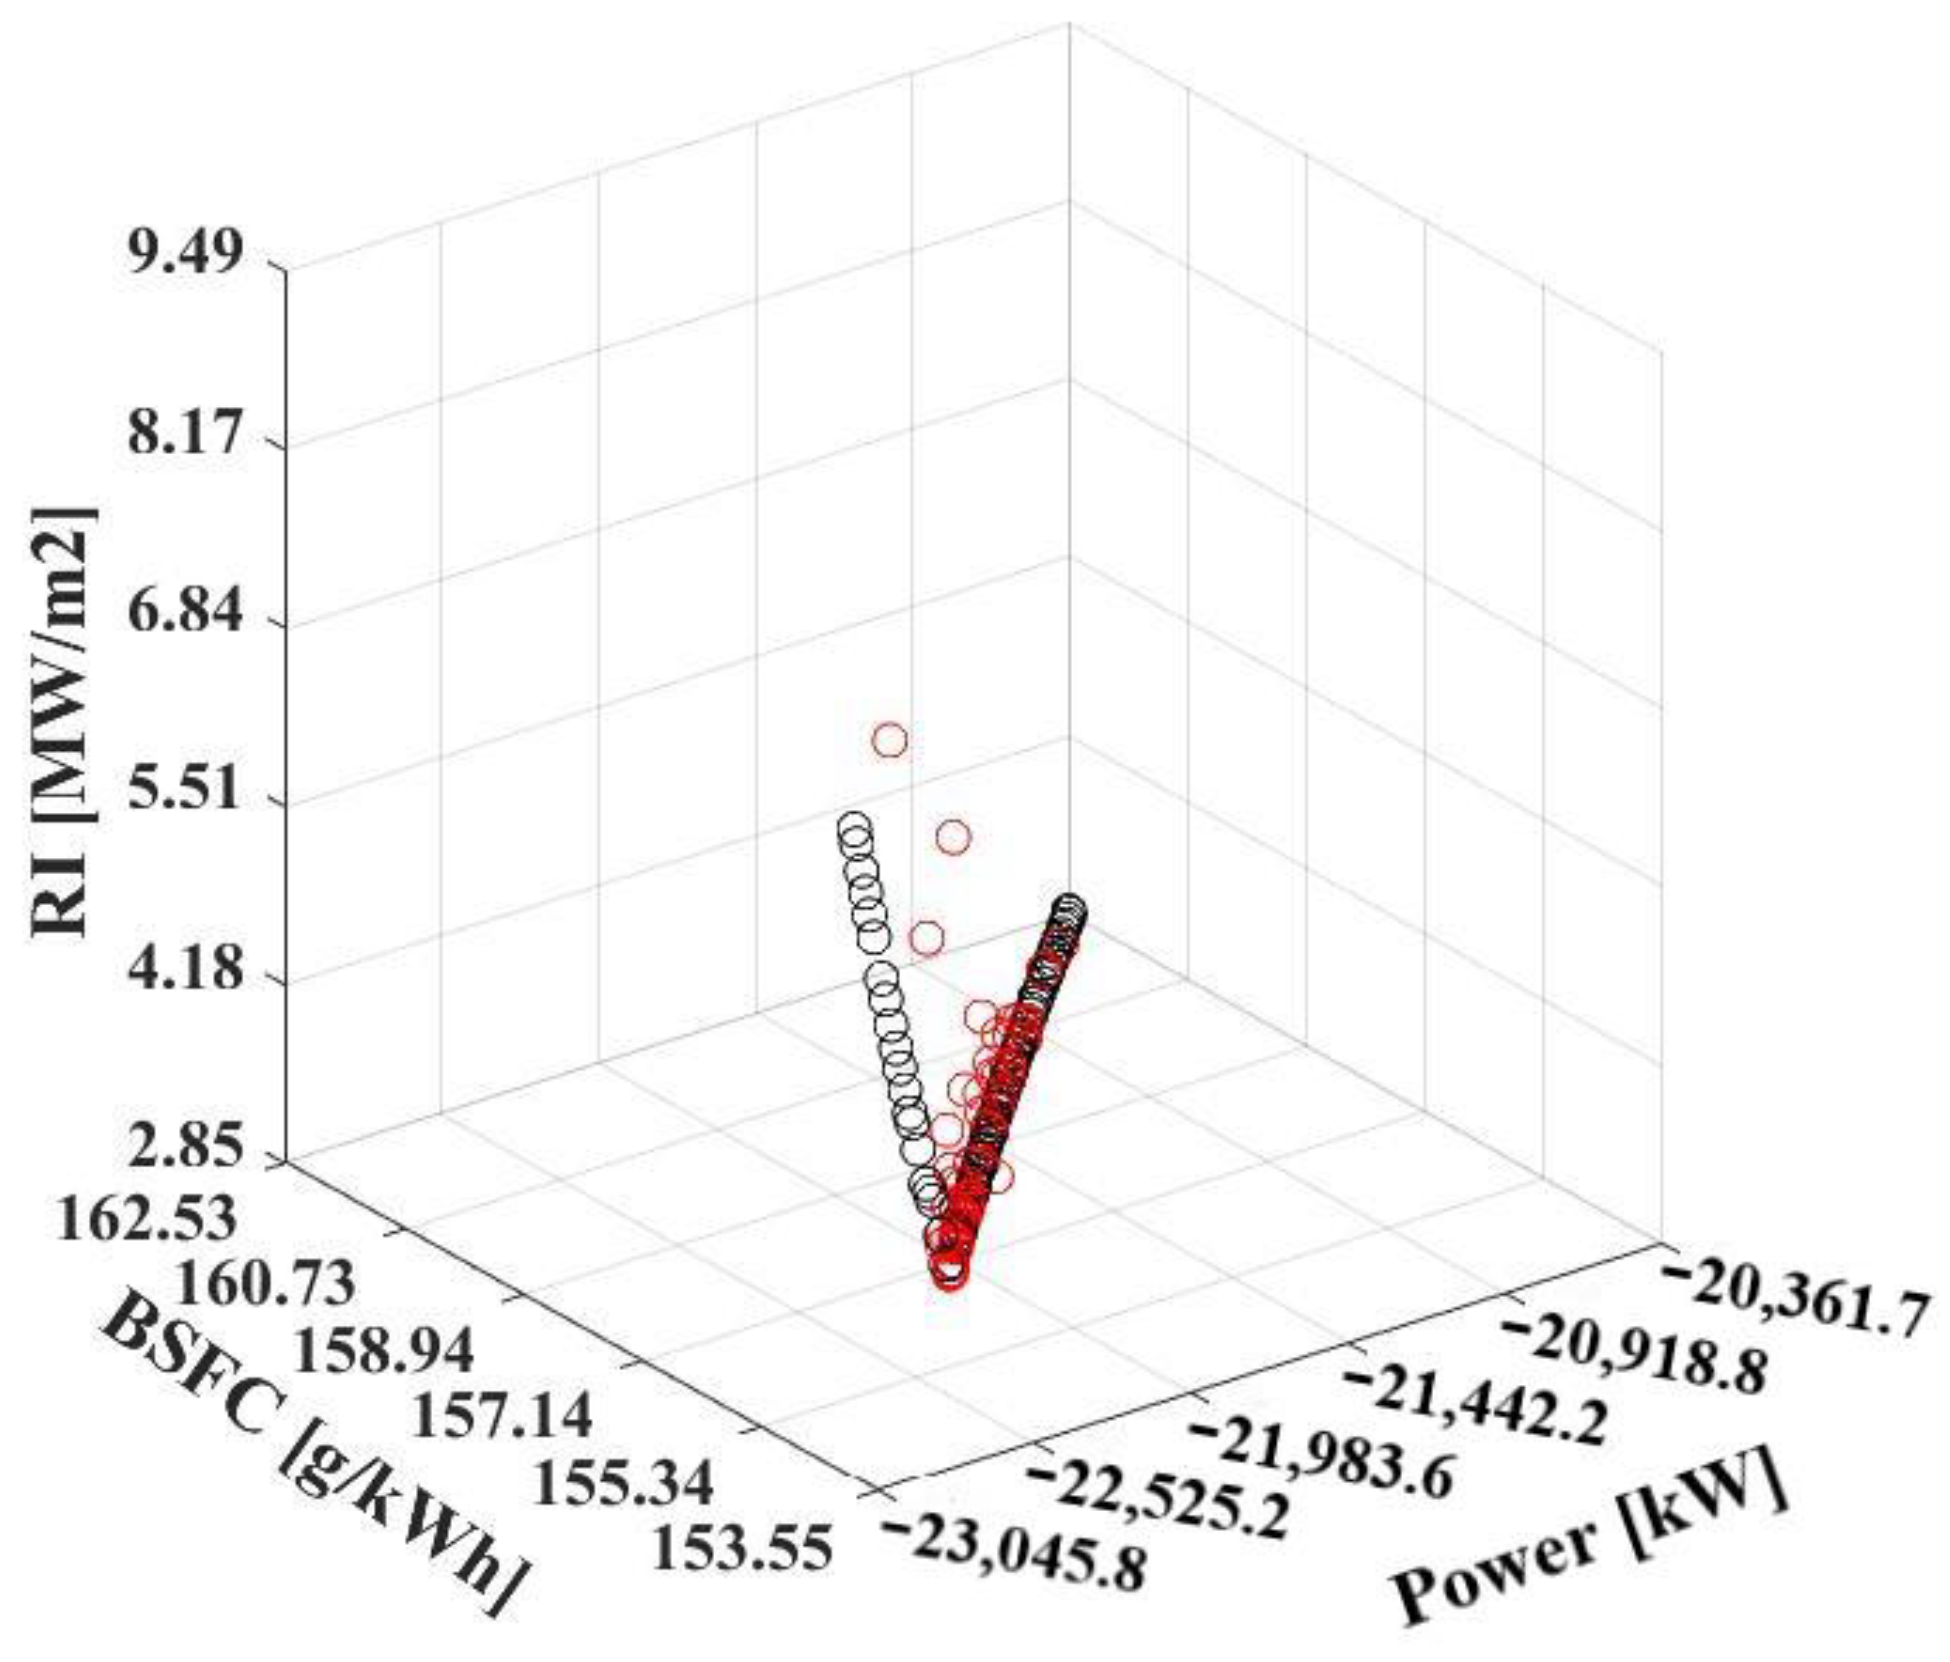
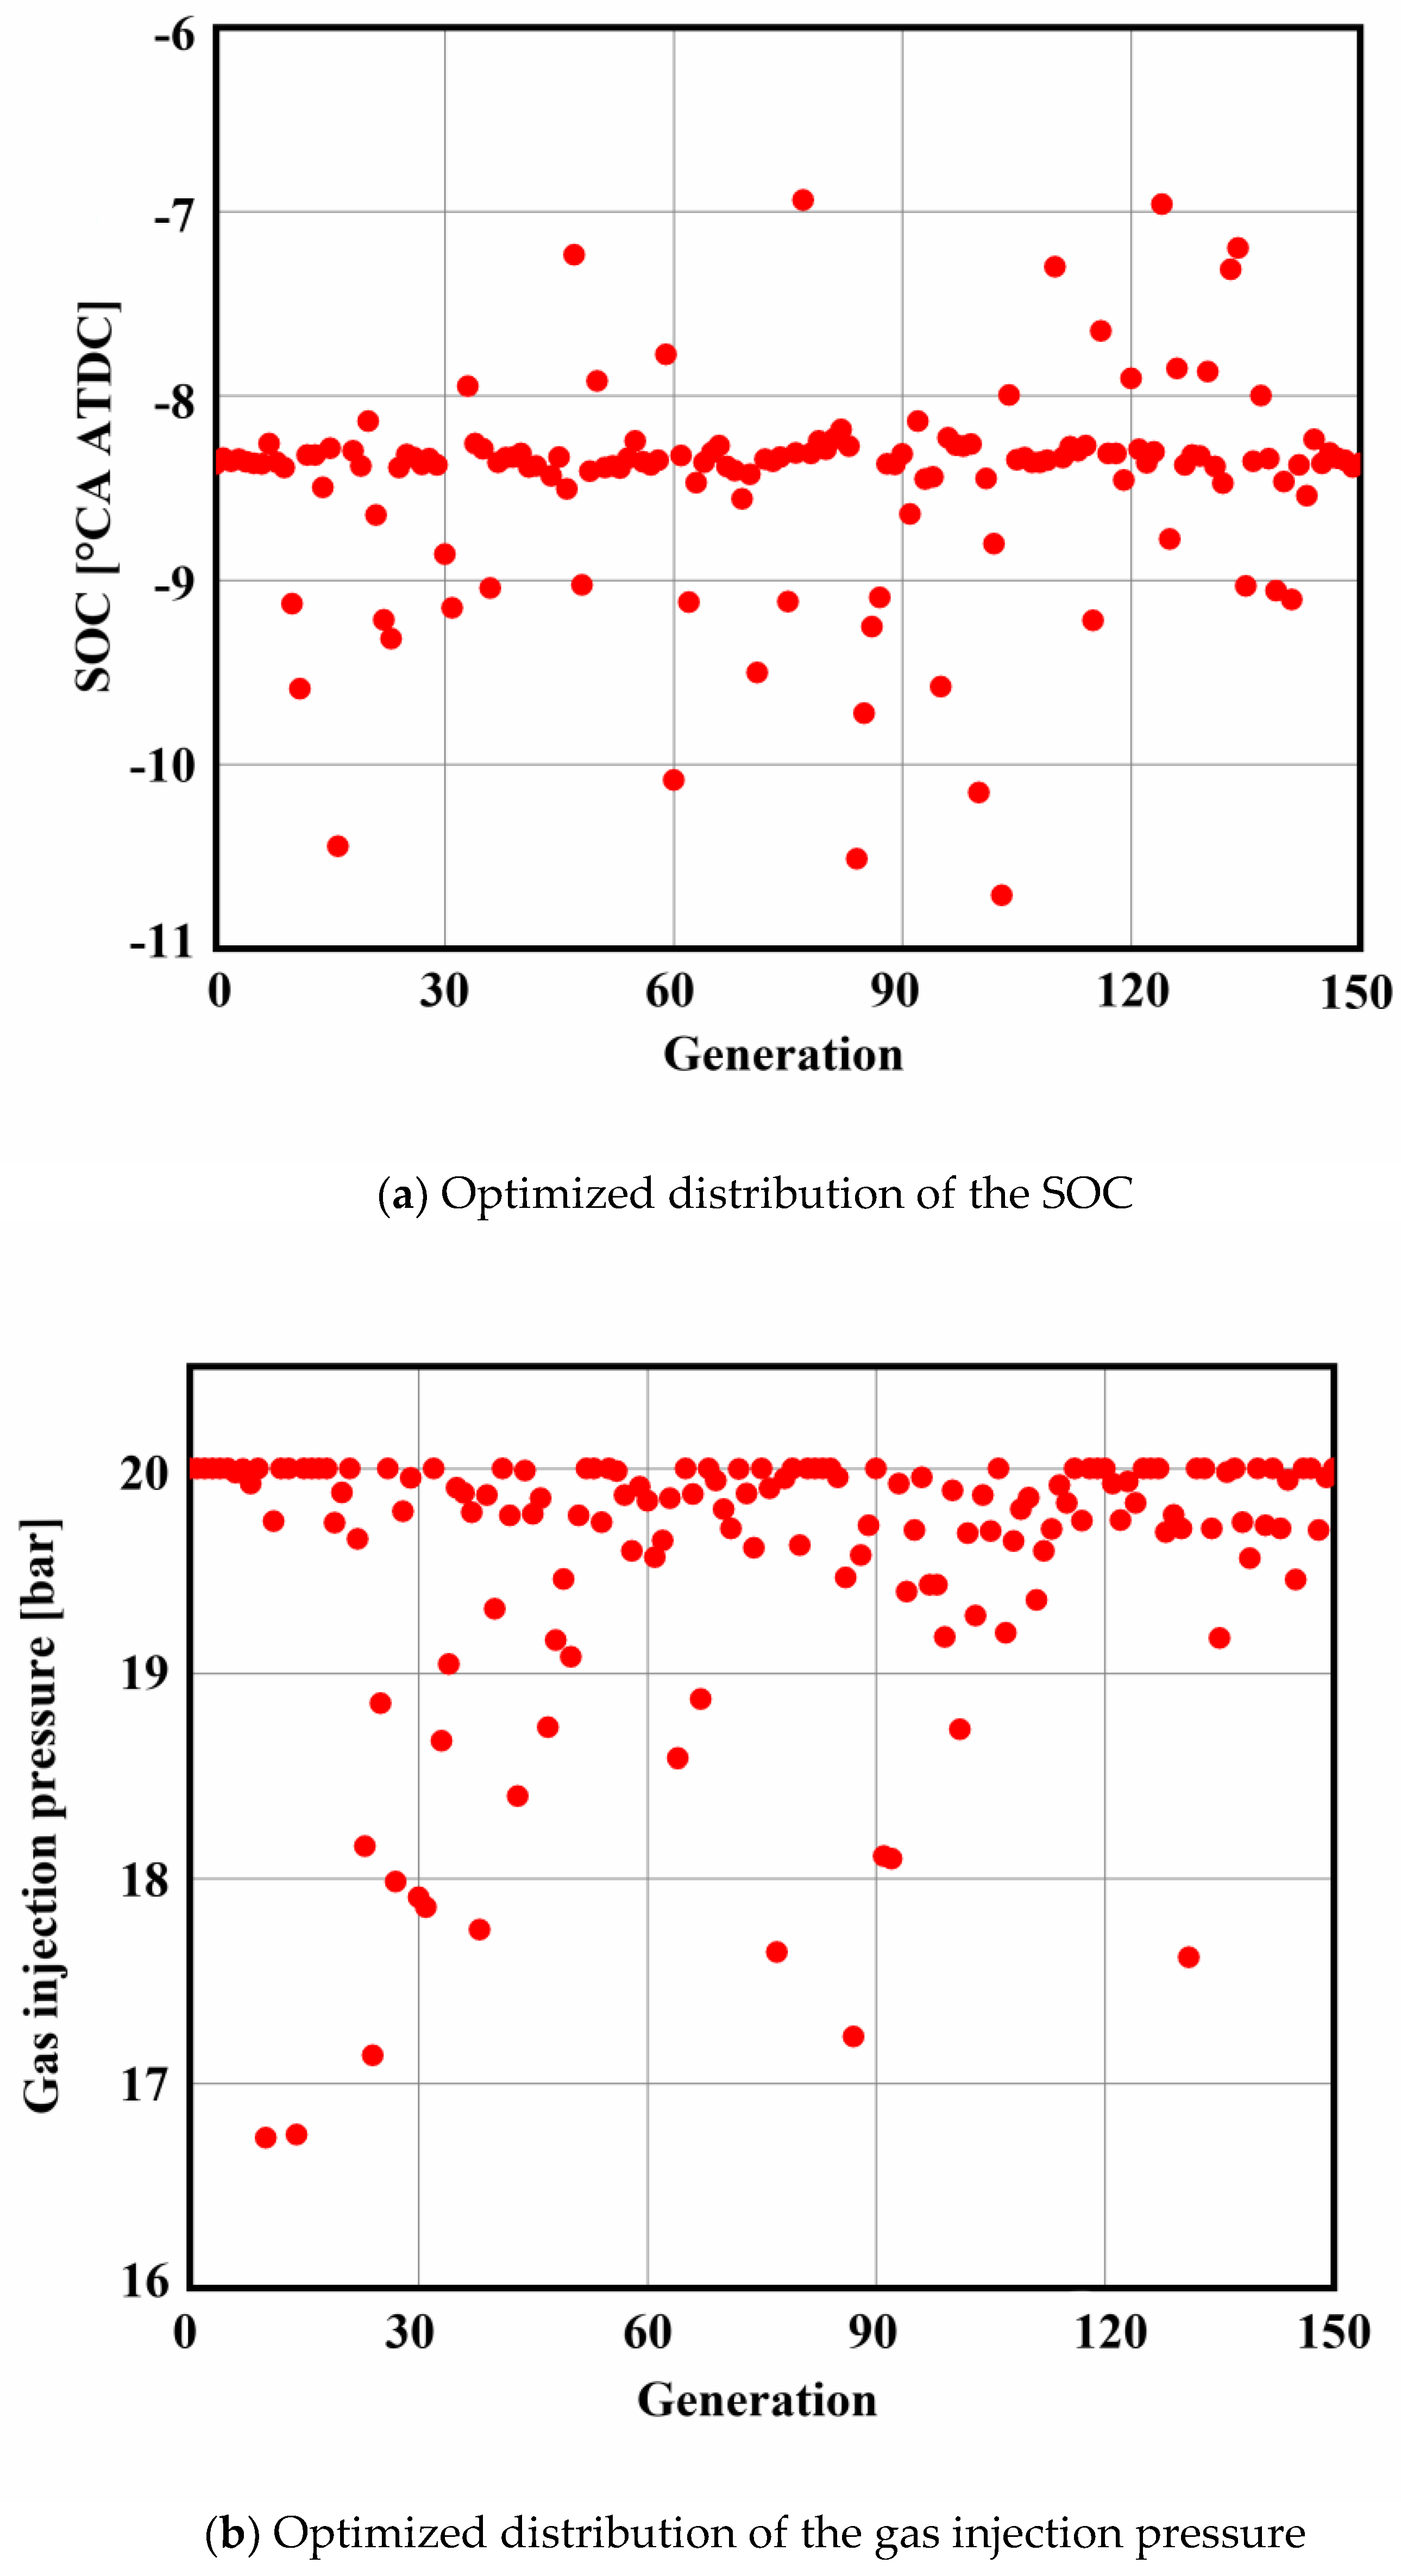
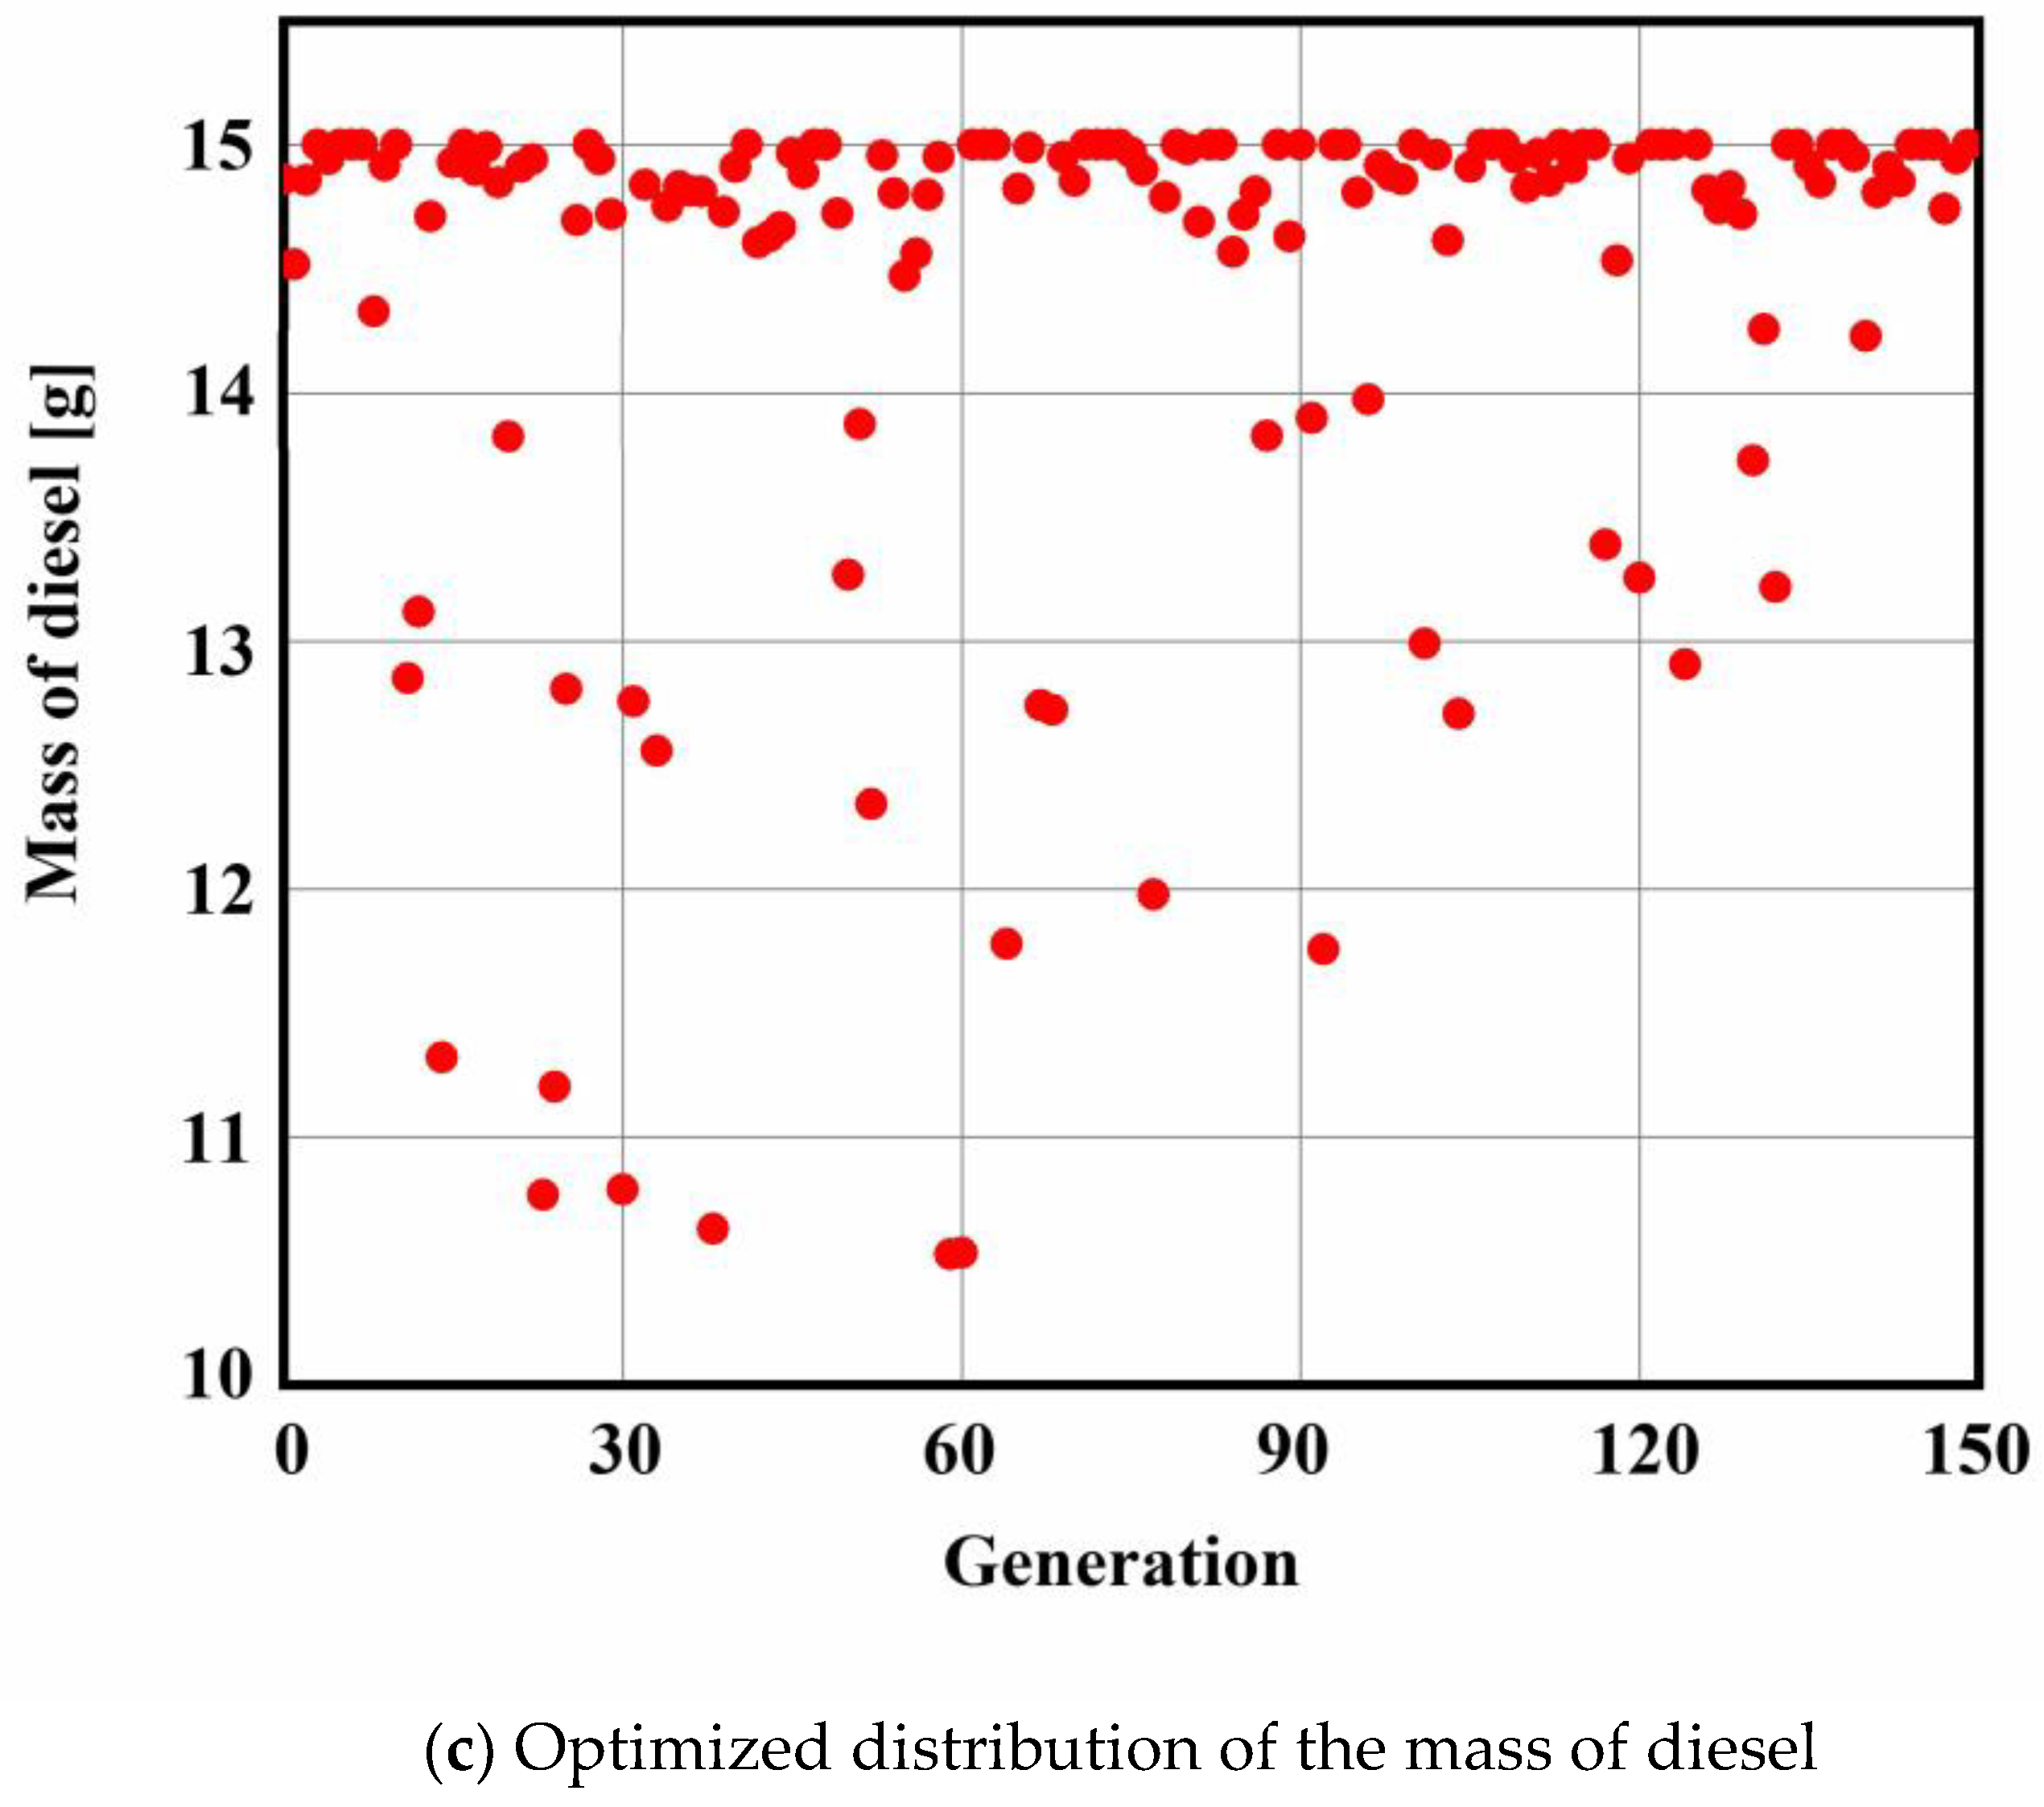
- Combined with the RSM prediction model and the MOPSO algorithm to perform multi-objective optimization of the above engine independent variable parameters. The optimization results showed that the optimal range of the SOC was −9 to −8 °CA ATDC, the range of the gas injection pressure was 19 to 20 bar, and the mass of diesel ranged from 14 to 15 g. With the limitation of suppressing the knocking tendency in the combustion process, the optimal solution sets were screened manually, and the parameter solution set was finally determined as −8.36 °CA ATDC (SOC), 20.00 bar (gas injection pressure), and 14.96 g (mass of diesel). Compared with the bench test data, the optimized power was increased by 0.61%, the BSFC was reduced by 3.58%, and the RI was reduced by 6.49%, which better suppressed the trend of knocking.
Author Contributions
Funding
Institutional Review Board Statement
Informed Consent Statement
Data Availability Statement
Acknowledgments
Conflicts of Interest
References
- Mueller, L.; Jakobi, G.; Czech, H.; Stengel, B.; Orasche, J.; Arteaga-Salas, J.M.; Karg, E.; Elsasser, M.; Sippula, O.; Streibel, T.; et al. Characteristics and temporal evolution of particulate emissions from a ship diesel engine. Appl. Energy 2015, 155, 204–217. [Google Scholar] [CrossRef]
- Yu, H.; Duan, S.; Sun, P. Comparative analysis between natural gas/diesel (dual fuel) and pure diesel on the marine diesel engine. J. Eng. Res. 2015, 3, 111–125. [Google Scholar] [CrossRef]
- Karimi, M.; Wang, X.; Hamilton, J.; Negnevitsky, M.; Lyden, S. Challenges and opportunities of dual fuel hybrid approaches-a review. Int. J. Hydrog. Energy 2021, 46, 34924–34957. [Google Scholar] [CrossRef]
- Tozzi, L.; Emmanuella, S.; Greg, B. Novel pre-combustion chamber technology for large bore natural gas engines. In Proceedings of the CIMAC Congress, Helsinki, Finland, 16 June 2016. [Google Scholar]
- Stoumpos, S.; Theotokatos, G.; Boulougouris, E.; Vassalos, D.; Lazakis, I.; Livanos, G. Marine dual fuel engine modelling and parametric investigation of engine settings effect on performance-emissions trade-offs. Ocean. Eng. 2018, 157, 376–386. [Google Scholar] [CrossRef] [Green Version]
- Mavrelos, C.; Theotokatos, G. Numerical investigation of a premixed combustion large marine two-stroke dual fuel engine for optimising engine settings via parametric runs. Energy Convers. Manag. 2018, 160, 48–59. [Google Scholar] [CrossRef] [Green Version]
- Zou, F.-K.; Zeng, H.; Wang, H.-Y.; Wang, X.-X.; Xu, Z.-X. Implementation and Parameter Analysis of the Knock Phenomenon of a Marine Dual-Fuel Engine Based on a Two-Zone Combustion Model. Processes 2021, 9, 602. [Google Scholar] [CrossRef]
- Lounici, M.; Benbellil, M.; Loubar, K.; Niculescu, D.; Tazerout, M. Knock characterization and development of a new knock indicator for dual-fuel engines. Energy 2017, 141, 2351–2361. [Google Scholar] [CrossRef]
- Wei, H.Q.; Qi, J.Y.; Zhou, L.; Zhao, W.H.; Shu, G.Q. Ignition Characteristics of Methane/n-Heptane Fuel Blends under Engine-like Conditions. Energy Fuels 2018, 32, 6264–6277. [Google Scholar] [CrossRef]
- Guo, H.; Zhou, S.; Zou, J.; Shreka, M. A Numerical Study on the Pilot Injection Conditions of a Marine 2-Stroke Lean-Burn Dual Fuel Engine. Processes 2020, 8, 1396. [Google Scholar] [CrossRef]
- Wang, X.; Zhang, X.; Wang, M.; Han, Y.; Chen, H. Numerical Simulation of Knock Combustion in a Downsizing Turbocharged Gasoline Direct Injection Engine. Appl. Sci. 2019, 9, 4133. [Google Scholar] [CrossRef]
- Li, A.; Zheng, Z. Effect of spark ignition timing and water injection temperature on the knock combustion of a GDI engine. Energies 2020, 13, 4931. [Google Scholar] [CrossRef]
- Liu, L.; Wu, Y.; Wang, Y. Numerical investigation on knock characteristics and mechanism of large-bore natural gas dual-fuel marine engine. Fuel 2022, 310, 122298. [Google Scholar] [CrossRef]
- Guo, H.; Zhou, S.; Shreka, M.; Feng, Y.M. Effect of Pre-Combustion Chamber Nozzle Parameters on the Performance of a Marine 2-Stroke Dual Fuel Engine. Processes 2019, 7, 876. [Google Scholar] [CrossRef] [Green Version]
- Dong, S.; Yang, C.; Ou, B.; Lu, H.; Cheng, X. Experimental investigation on the effects of nozzle-hole number on combustion and emission characteristics of ethanol/diesel dual-fuel engine. Fuel 2018, 217, 1–10. [Google Scholar] [CrossRef]
- Li, Z.; Wang, Y.; Yin, Z.; Gao, Z.; Wang, Y.; Zhen, X. An exploratory numerical study of a diesel/methanol dual-fuel injector: Effects of nozzle number, nozzle diameter and spray spacial angle on a diesel/methanol dual-fuel direct injection engine. Fuel 2022, 318, 123700. [Google Scholar] [CrossRef]
- Mousavi, S.M.; Saray, R.K.; Bahlouli, K.; Poorghasemi, K.; Maghbouli, A.; Sadeghlu, A. Effects of pilot diesel injection strategies on combustion and emission characteristics of dual-fuel engines at part load conditions. Fuel 2019, 258, 116153. [Google Scholar] [CrossRef]
- CIMAC. Simulation Study on the Influence of Natural Gas and Diesel Injector Position on Combustion and Emission of a Marine Dual-Fuel Engine. In Proceedings of the 29th CIMAC World Congress, Vancouver, BC, Canada, 14 June 2019. [Google Scholar]
- Temizer, I.; Cihan, O. Analysis of different combustion chamber geometries using hydrogen/diesel fuel in a diesel engine. Energy Sources Part A-Recovery Util. Environ. Eff. 2021, 43, 17–34. [Google Scholar] [CrossRef]
- Jatoth, R.; Gugulothu, S.K.; Sastry, G.R.K. Experimental study of using biodiesel and low cetane alcohol as the pilot fuel on the performance and emission trade-off study in the diesel/compressed natural gas dual fuel combustion mode. Energy 2021, 225, 120218. [Google Scholar] [CrossRef]
- Paul, A.; Panua, R.; Debroy, D.; Bose, P.K. A performance-emission tradeoff study of a CI engine fueled by compressed natural gas (CNG)/diesel-ethanol-PPME blend combination. Environ. Prog. Sustain. Energy 2016, 35, 517–530. [Google Scholar] [CrossRef]
- Sezer, I. A review study on using diethyl ether in diesel engines: Effects on fuel properties, injection, and combustion characteristics. Energy Environ. 2020, 31, 179–214. [Google Scholar] [CrossRef]
- Hissa, M.; Niemi, S.; Sirvio, K.; Niemi, A.; Ovaska, T. Combustion Studies of a Non-Road Diesel Engine with Several Alternative Liquid Fuels. Energies 2019, 12, 2447. [Google Scholar] [CrossRef] [Green Version]
- Li, P.; Jin, Q.; Gong, H. The Research of the Intelligent Fault Diagnosis System Optimized by GA for Marine Diesel Engine. In Proceedings of the 2nd International Symposium on Intelligent Information Technology Application, Shanghai, China, 20–22 December 2008. [Google Scholar]
- Chen, X.; Liu, L.; Du, J.; Liu, D.; Huang, L.; Li, X. Intelligent Optimization Based on a Virtual Marine Diesel Engine Using GA-ICSO Hybrid Algorithm. Machines 2022, 10, 227. [Google Scholar] [CrossRef]
- Wang, H.Y.; Gan, H.B.; Theotokatos, G. Parametric investigation of pre-injection on the combustion, knocking and emissions behaviour of a large marine four-stroke dual-fuel engine. Fuel 2020, 281, 118744. [Google Scholar] [CrossRef]
- Stratsianis, V.; Kontoulis, P.; Kaiktsis, L. Effects of Fuel Post-Injection on the Performance and Pollutant Emissions of a Large Marine Engine. J. Energy Eng. 2016, 142, E4016001. [Google Scholar] [CrossRef]
- Ogren, R.M.; Kong, S.C. Optimization of diesel fuel injection strategies through applications of cooperative particle swarm optimization and artificial bee colony algorithms. Int. J. Engine Res. 2021, 22, 3030–3041. [Google Scholar] [CrossRef]
- Tang, J.; Pal, A.; Dai, W.; Archer, C.; Yi, J.; Zhu, G. Stochastic Bayesian optimization for predicting borderline knock. Int. J. Engine Res. 2021, 14680874211065237. [Google Scholar] [CrossRef]
- Cong, Y.; Gan, H.; Wang, H.; Hu, G.; Liu, Y. Multiobjective Optimization of the Performance and Emissions of a Large Low-Speed Dual-Fuel Marine Engine Based on MNLR-MOPSO. J. Mar. Sci. Eng. 2021, 9, 1170. [Google Scholar] [CrossRef]
- Jiang, X.; Wei, H.; Zhou, L.; Chen, R. Numerical Study on the Effects of Multiple-Injection Coupled with EGR on Combustion and NOx Emissions in a Marine Diesel Engine. In Proceedings of the 10th International Conference on Applied Energy (ICAE), Hong Kong, China, 22–25 August 2018. [Google Scholar]
- Gharehghani, A. Load limits of an HCCI engine fueled with natural gas, ethanol, and methanol. Fuel 2019, 239, 1001–1014. [Google Scholar] [CrossRef]
- McTaggart-Cowan, G.P.; Jones, H.L.; Rogak, S.N.; Bushe, W.K.; Hill, P.G. The effects of high-pressure injection on a compression-ignition, direct injection of natural gas engine. J. Eng. Gas Turbines Power-Trans. Asme 2007, 129, 579–588. [Google Scholar] [CrossRef]
- Wang, Z.S.; Du, G.Z.; Li, Z.J.; Wang, X.Y.; Wang, D. Study on the combustion characteristics of a high compression ratio HCCI engine fueled with natural gas. Fuel 2019, 255, 115701. [Google Scholar] [CrossRef]
- Cho, J.; Park, S.; Song, S. The effects of the air-fuel ratio on a stationary diesel engine under dual-fuel conditions and multi-objective optimization. Energy 2019, 187, 115884. [Google Scholar] [CrossRef]
- Jung, J.; Song, S.; Hur, K.B. Numerical study on the effects of intake valve timing on performance of a natural gas-diesel dual-fuel engine and multi-objective Pareto optimization. Appl. Therm. Eng. 2017, 121, 604–616. [Google Scholar] [CrossRef]
- Mahla, S.K.; Ardebili, S.M.S.; Mostafaei, M.; Dhir, A.; Goga, G.; Chauhan, B.S. Multi-objective optimization of performance and emissions characteristics of a variable compression ratio diesel engine running with biogas-diesel fuel using response surface techniques. Energy Sources Part A-Recovery Util. Environ. Eff. 2020, 1–18. [Google Scholar] [CrossRef]
- List, A. AVL BOOST Users’ Guides; AVL List GmbH: Graz, Austria, 2016. [Google Scholar]
- Woschni, G. A Universally Applicable Equation for the Instantaneous Heat Transfer Coefficient in the Internal Combustion Engine; SAE Technical Paper; SAE International: Warrendale, PA, USA, 1967. [Google Scholar]
- Eng, J. Characterization of Pressure Waves in HCCI Combustion; SAE Technical Paper; SAE International: Warrendale, PA, USA, 2002. [Google Scholar]
- Wang, H.Y.; Gan, H.B.; Wang, G.J.; Zhong, G.Q. Emission and Performance Optimization of Marine Four-Stroke Dual-Fuel Engine Based on Response Surface Methodology. Math. Probl. Eng. 2020, 2020, 1–9. [Google Scholar] [CrossRef]
- Aydin, M.; Uslu, S.; Celik, M.B. Performance and emission prediction of a compression ignition engine fueled with biodiesel-diesel blends: A combined application of ANN and RSM based optimization. Fuel 2020, 269, 117472. [Google Scholar] [CrossRef]
- Khuri, A.I.; Mukhopadhyay, S. Response surface methodology. Wiley Interdiscip. Rev. Comput. Stat. 2010, 2, 128–149. [Google Scholar] [CrossRef]
- Coello, C.C.; Lechuga, M.S. MOPSO: A proposal for multiple objective particle swarm optimization. In Proceedings of the 2002 Congress on Evolutionary Computation, CEC’02 (Cat. No. 02TH8600), Honolulu, HI, USA, 12–17 May 2003; IEEE: Piscataway, NJ, USA. [Google Scholar]
- Qian, F.; Qing, L.; Wei, Q.; Xuan-Mo, P. Overview of multiobjective particle swarm optimization algorithm. Chin. J. Eng. 2021, 43, 745–753. [Google Scholar] [CrossRef]
- Martinez-Morales, J.D.; Palacios-Hernandez, E.R.; Velazquez-Carrillo, G.A. Velazquez-Carrillo, Modeling and multi-objective optimization of a gasoline engine using neural networks and evolutionary algorithms. J. Zhejiang Univ.-Sci. A 2013, 14, 657–670. [Google Scholar] [CrossRef] [Green Version]
- Taghavifar, H.; Mazari, F. 1D diesel engine cycle modeling integrated with MOPSO optimization for improved NOx control and pressure boost. Energy 2022, 247, 123517. [Google Scholar] [CrossRef]
- Pang, L.-P.; Ng, S.-C. Improved efficiency of mopso with adaptive inertia weight and dynamic search space. In Proceedings of the Genetic and Evolutionary Computation Conference Companion, Kyoto, Japan, 15–19 July 2018. [Google Scholar]
- Tuppadung, Y.; Kurutach, W. Comparing nonlinear inertia weights and constriction factors in particle swarm optimization. Int. J. Knowl.-Based Intell. Eng. Syst. 2011, 15, 65–70. [Google Scholar] [CrossRef]
- Van den Bergh, F.; Engelbrecht, A.P. A study of particle swarm optimization particle trajectories. Inf. Sci. 2006, 176, 937–971. [Google Scholar] [CrossRef]
- Gao, Y.; Li, X.X.; Li, J.; Zhang, L.; Li, S.H. Numerical simulations of natural gas injection pressure effects on a direct injected, pilot ignited, natural gas engine. Appl. Mech. Mater. 2014, 510, 179–184. [Google Scholar] [CrossRef]
- Liu, L.; Wu, Y.; Xiong, Q.; Liu, T. Analysis on Flow Motion and Combustion Process in Pre-Chamber and Main Chamber for Low-Speed Two-Stroke Dual-Fuel Engine; SAE Technical Paper; SAE International: Warrendale, PA, USA, 2019. [Google Scholar]
- Wang, Z.; Du, G.; Wang, D.; Xu, Y.; Shao, M. Combustion process decoupling of a diesel/natural gas dual-fuel engine at low loads. Fuel 2018, 232, 550–561. [Google Scholar] [CrossRef]


| Engine Parameters | Unit | Values |
|---|---|---|
| Cylinder | - | 7 |
| Bore | mm | 820 |
| Stroke | mm | 3375 |
| Compression ratio | - | 12.4 |
| Power | kW | 22,531 |
| Speed | rpm | 62.5 |
| BSGC | g/kWh | 132.5 |
| BMEP | bar | 17.2 |
| Firing order | - | 1-6-3-4-5-2-7 |
| Pilot injection pressure | bar | 755 |
| gas injection pressure | bar | 14.8 |
| Pilot timing | °CA ATDC | −8.5 |
| Gas valve timing | °CA ATDC | 224 |
| Pilot injection duration | ms | 1.1 |
| gas injection duration | ms | 26.9 |
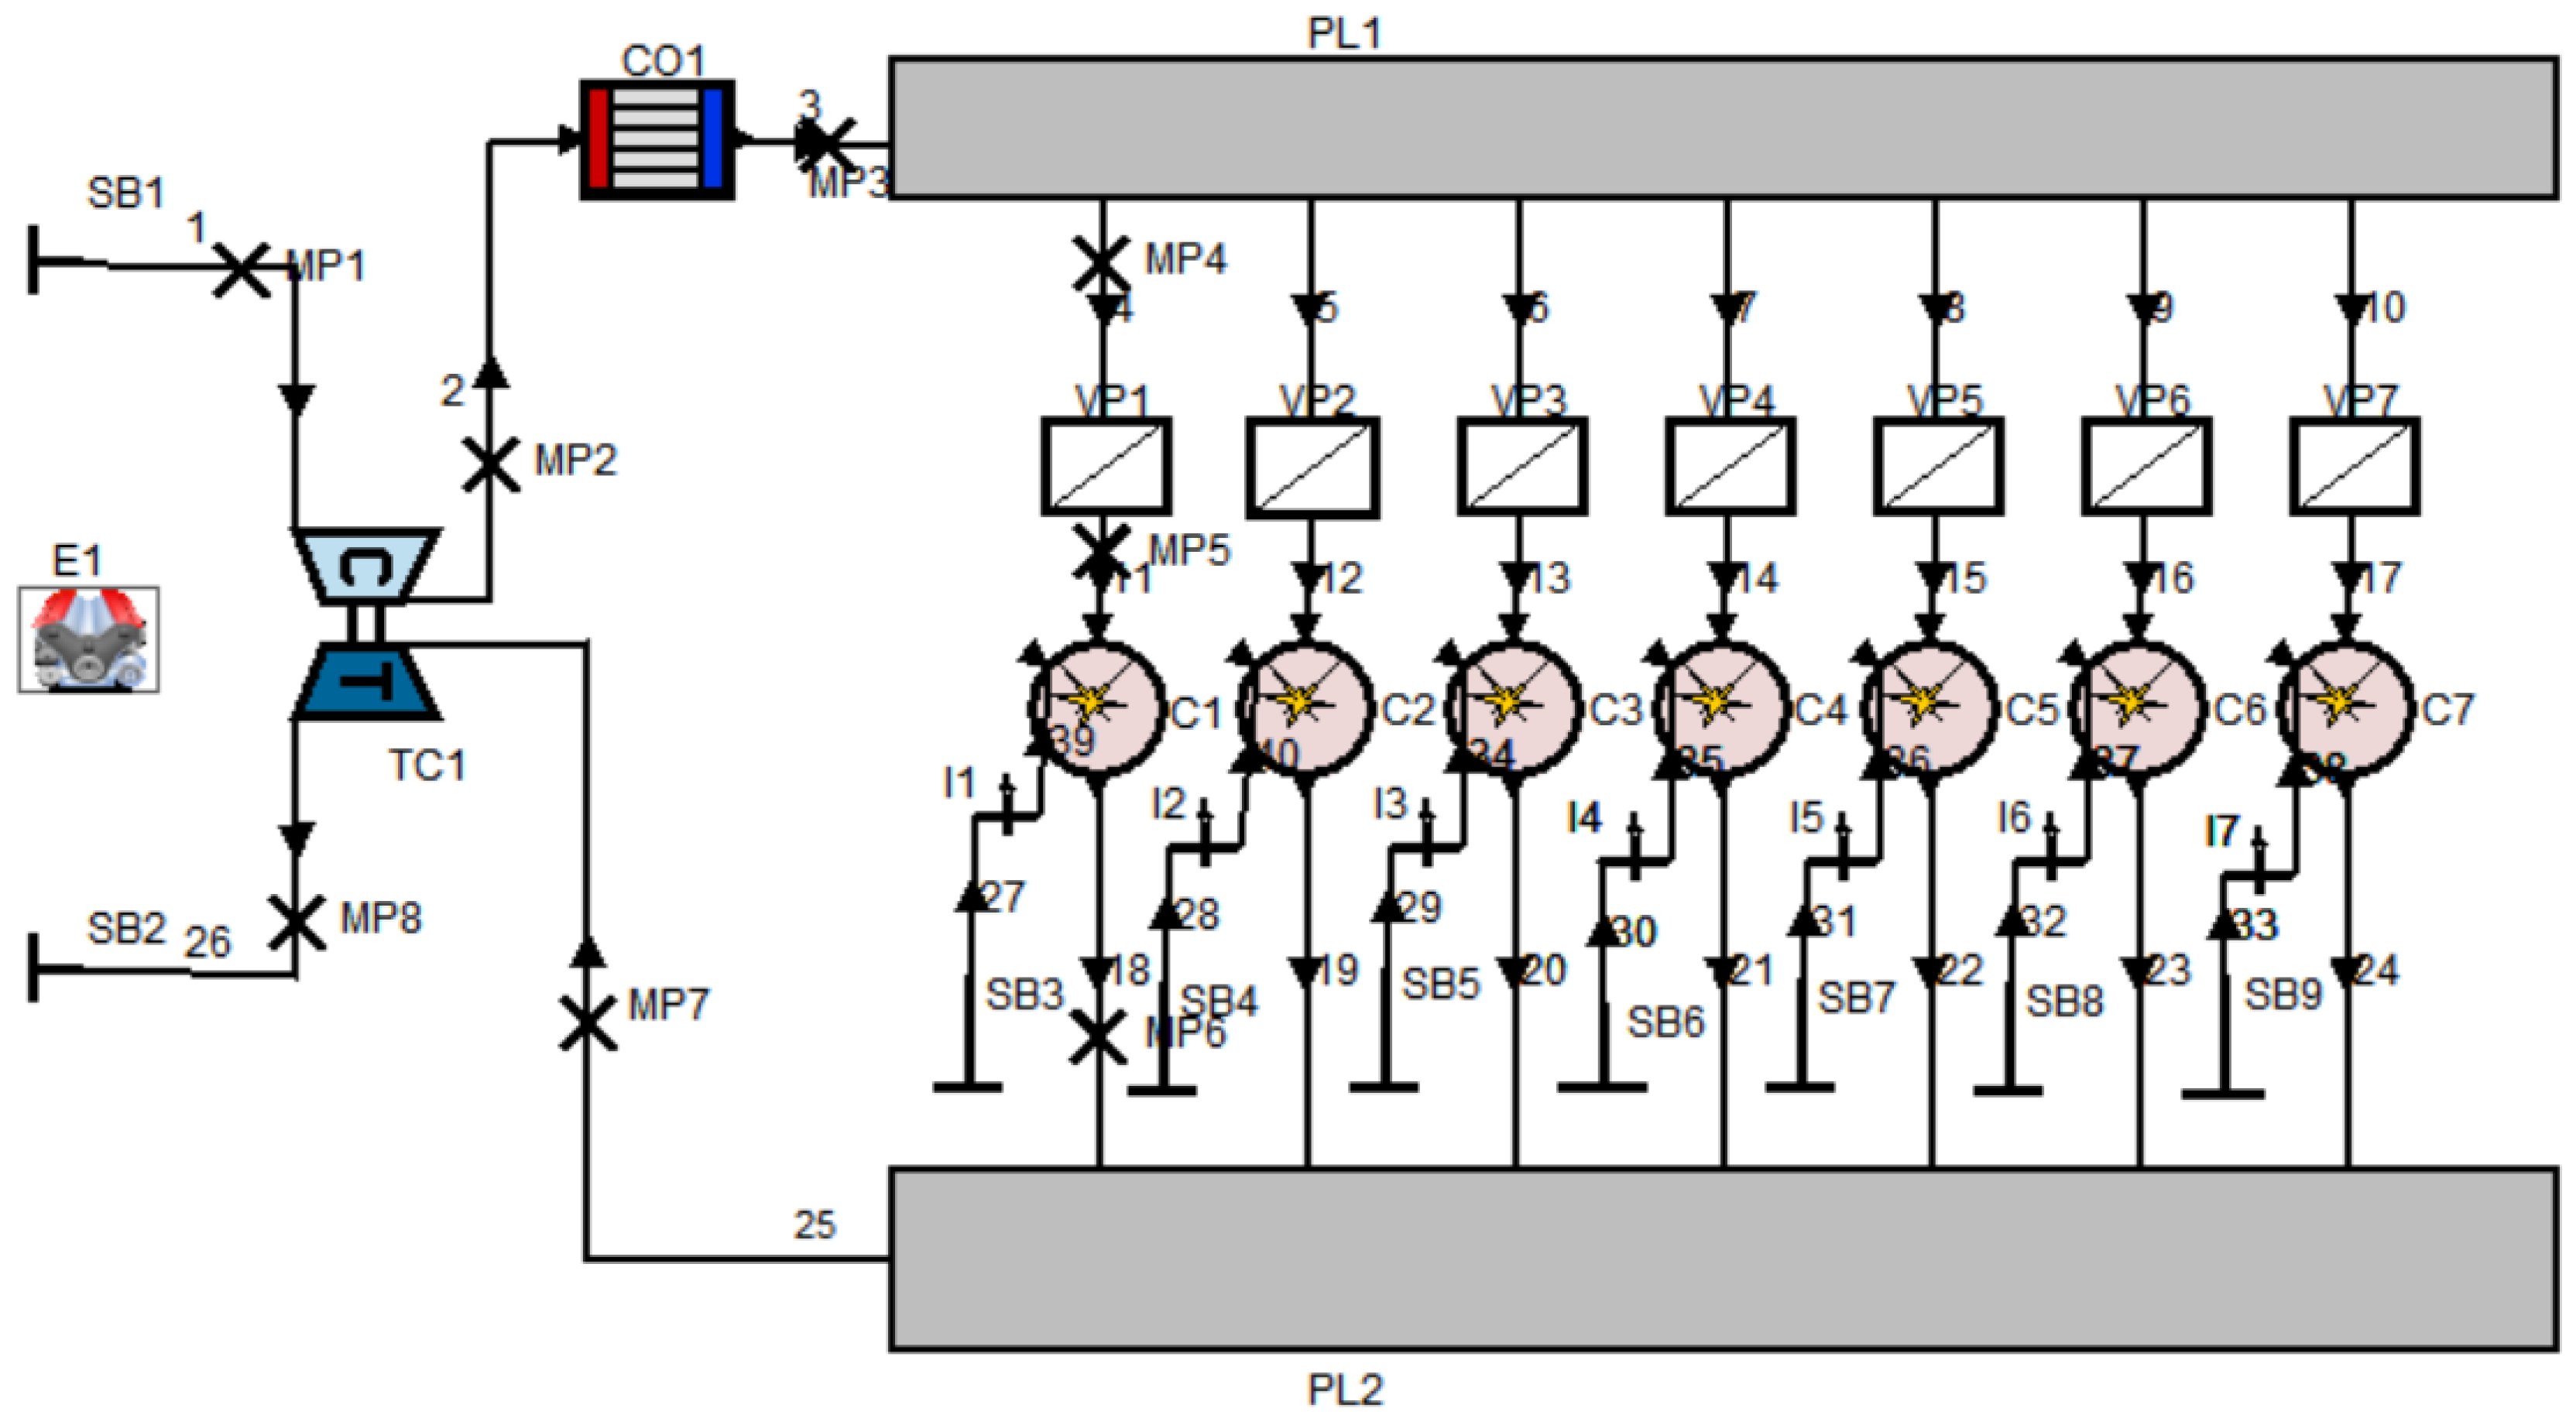
| No. | Symbols | Details |
|---|---|---|
| 1 | SB1 | System intake boundary |
| 2 | SB2 | System exhaust boundary |
| 3 | SB3-9 | Natural gas intake boundary |
| 4 | E1 | Engine |
| 5 | TC1 | Turbocharger |
| 6 | CO1 | Air cooler |
| 7 | PL1 | Intake manifold |
| 8 | PL2 | Exhaust manifold |
| 9 | VP1-7 | Scavenge plenum |
| 10 | C1-7 | Cylinder |
| 11 | I1-7 | Gas injector |
| 12 | MP1-8 | Measuring point |
| 13 | 1–38 | Pipe |
| Engine Load (%) | 25 | 50 | 75 | 100 |
|---|---|---|---|---|
| Mode | Diesel Mode Error (%) | |||
| Power (kW) | 0.33 | −1.74 | 1.16 | −0.63 |
| BSFC (g/kWh) | 1.32 | 0.79 | −0.27 | 0.58 |
| Peak Firing Press. (bar) | 1.57 | −1.14 | 1.46 | −0.48 |
| Intake Temp. (K) | 0.22 | −1.27 | 1.09 | −0.43 |
| Intake Press. (bar) | −0.21 | 0.38 | −0.35 | −0.21 |
| Exhaust Temp. (K) | 1.38 | −1.45 | 1.05 | 0.53 |
| Engine Load (%) | 25 | 50 | 75 | 100 |
|---|---|---|---|---|
| Mode | Gas Mode Error (%) | |||
| Power (kW) | −1.20 | 0.82 | −1.06 | −0.41 |
| BSFC (g/kWh) | 0.83 | −1.16 | 0.96 | −0.73 |
| Peak Firing Press. (bar) | −1.82 | 1.20 | 0.08 | 0.29 |
| Intake Temp. (K) | 1.04 | 0.61 | −0.09 | −1.07 |
| Intake Press. (bar) | −0.28 | −0.25 | −0.25 | 0.24 |
| Exhaust Temp. (K) | 2.04 | −1.35 | 0.78 | 1.32 |
| Source | Power (kW) | BSFC (g/kWh) | PFP (bar) | RI (MW/m2) |
|---|---|---|---|---|
| Type | Quadratic | Quadratic | Quadratic | Quadratic |
| p-Value | p-Value | p-Value | p-Value | |
| Mode | <0.0001 | <0.0001 | <0.0001 | <0.0001 |
| x | <0.0001 | <0.0001 | 0.0345 | 0.0483 |
| y | <0.0001 | <0.0001 | <0.0001 | <0.0001 |
| z | <0.0001 | <0.0001 | <0.0001 | <0.0001 |
| xy | 0.0107 | 0.6079 | 0.4787 | 0.0599 |
| xz | 0.1136 | 0.2268 | 0.2352 | 0.2262 |
| yz | 0.0326 | 0.0342 | 0.0033 | 0.0163 |
| x2 | 0.8172 | 0.1137 | 0.2885 | 0.6216 |
| y2 | <0.0001 | <0.0001 | 0.0915 | <0.0001 |
| z2 | 0.0248 | 0.0008 | 0.0022 | 0.7016 |
| SOC (°CA ATDC) | Gas Intake Pressure (bar) | Mass of Diesel (g) | Power (kW) | BSFC (g/kWh) | RI (MW/m2) |
|---|---|---|---|---|---|
| −7.61 | 20 | 14.03 | 22,434.8 | 156.443 | 4.1779 |
| Parameters | Value |
|---|---|
| Population size | 150 |
| Repository size | 150 |
| Maximum number of generations | 150 |
| Inertia weight | 0.7298 |
| Individual confidence factor | 1.5 |
| Swarm confidence factor | 1.5 |
| Number of grids in each dimension | 5 |
| Maximum vel in percentage | 5 |
| Uniform mutation percentage | 0.5 |
| SOC (°CA ATDC) | Gas Intake Pressure (bar) | Mass of Diesel (g) | Power (kW]) | BSFC (g/kWh) | RI (MW/m2) |
|---|---|---|---|---|---|
| −6.97 | 19.96 | 14.35 | 22,514.9 | 157.385 | 3.8464 |
| −7.84 | 19.83 | 14.26 | 22,540.5 | 157.167 | 3.8267 |
| −7.08 | 20.00 | 15.00 | 22,574.5 | 156.923 | 3.9567 |
| −7.60 | 19.71 | 14.63 | 22,593.2 | 156.713 | 4.0793 |
| −7.64 | 20.00 | 14.32 | 22,520.4 | 156.449 | 4.1967 |
| −7.91 | 19.92 | 15.00 | 22,612.4 | 156.67 | 4.2093 |
| −9.21 | 19.83 | 13.98 | 22,589.1 | 156.536 | 4.2362 |
| −8.36 | 20.00 | 14.96 | 22,668.0 | 156.256 | 4.4326 |
| −8.54 | 19.95 | 15.00 | 22,683.4 | 156.146 | 4.5325 |
| −8.61 | 19.61 | 14.98 | 22,691.7 | 156.116 | 4.7761 |
| −8.70 | 19.92 | 15.00 | 22,716.2 | 155.921 | 4.8125 |
| Type | Power (kW) | BSFC (g/kWh) | RI (MW/m2) |
|---|---|---|---|
| Bench test | 22,531 | 162.066 | 4.74 |
| MOPSO | 22,668 | 156.256 | 4.4326 |
| Optimization | +0.61% | −3.58% | −6.49% |
Publisher’s Note: MDPI stays neutral with regard to jurisdictional claims in published maps and institutional affiliations. |
© 2022 by the authors. Licensee MDPI, Basel, Switzerland. This article is an open access article distributed under the terms and conditions of the Creative Commons Attribution (CC BY) license (https://creativecommons.org/licenses/by/4.0/).
Share and Cite
Jin, W.; Gan, H.; Cong, Y.; Li, G. Performance Optimization and Knock Investigation of Marine Two-Stroke Pre-Mixed Dual-Fuel Engine Based on RSM and MOPSO. J. Mar. Sci. Eng. 2022, 10, 1409. https://doi.org/10.3390/jmse10101409
Jin W, Gan H, Cong Y, Li G. Performance Optimization and Knock Investigation of Marine Two-Stroke Pre-Mixed Dual-Fuel Engine Based on RSM and MOPSO. Journal of Marine Science and Engineering. 2022; 10(10):1409. https://doi.org/10.3390/jmse10101409
Chicago/Turabian StyleJin, Weijie, Huibing Gan, Yujin Cong, and Guozhong Li. 2022. "Performance Optimization and Knock Investigation of Marine Two-Stroke Pre-Mixed Dual-Fuel Engine Based on RSM and MOPSO" Journal of Marine Science and Engineering 10, no. 10: 1409. https://doi.org/10.3390/jmse10101409
APA StyleJin, W., Gan, H., Cong, Y., & Li, G. (2022). Performance Optimization and Knock Investigation of Marine Two-Stroke Pre-Mixed Dual-Fuel Engine Based on RSM and MOPSO. Journal of Marine Science and Engineering, 10(10), 1409. https://doi.org/10.3390/jmse10101409