


Origin and Implications of Pollution in Coastal Groundwater of the Guangdong Province

 , , , ,
Abstract
:1. Introduction
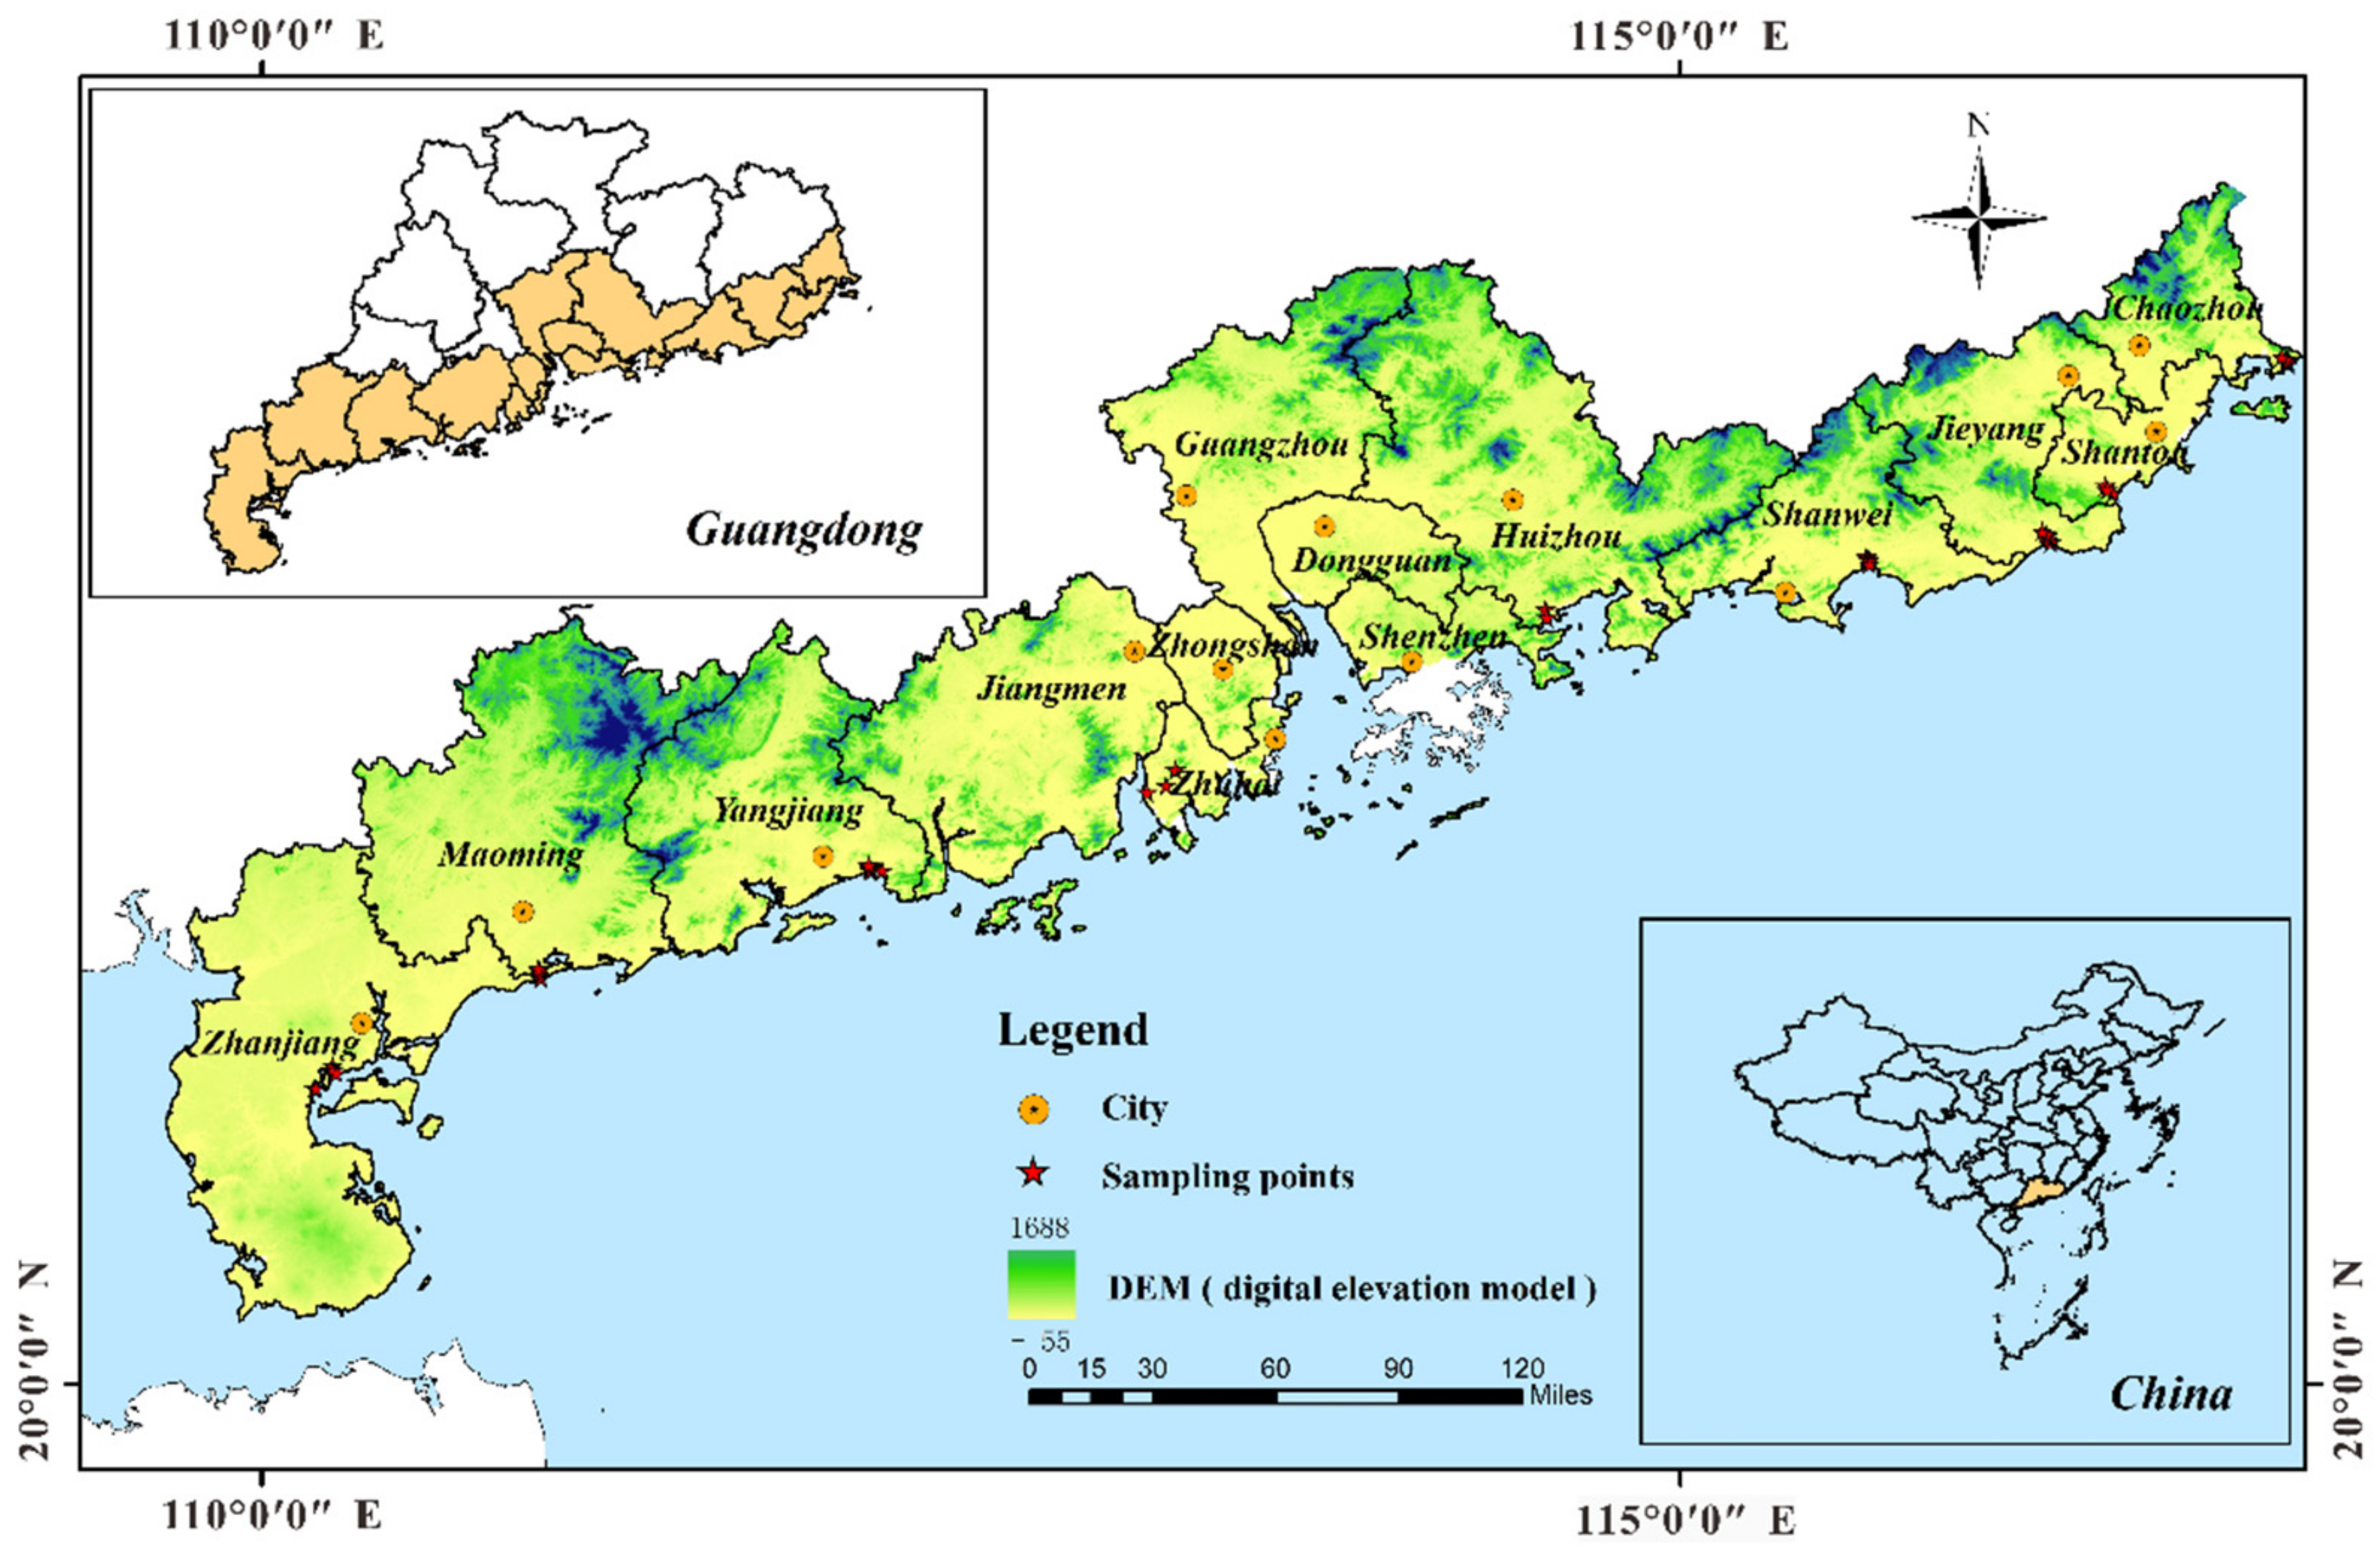
2. Study Area
3. Materials and Methods
3.1. Sampling and Test
3.2. Multivariate Statistical Analysis
3.3. Analytical Method
4. Results and Discussion
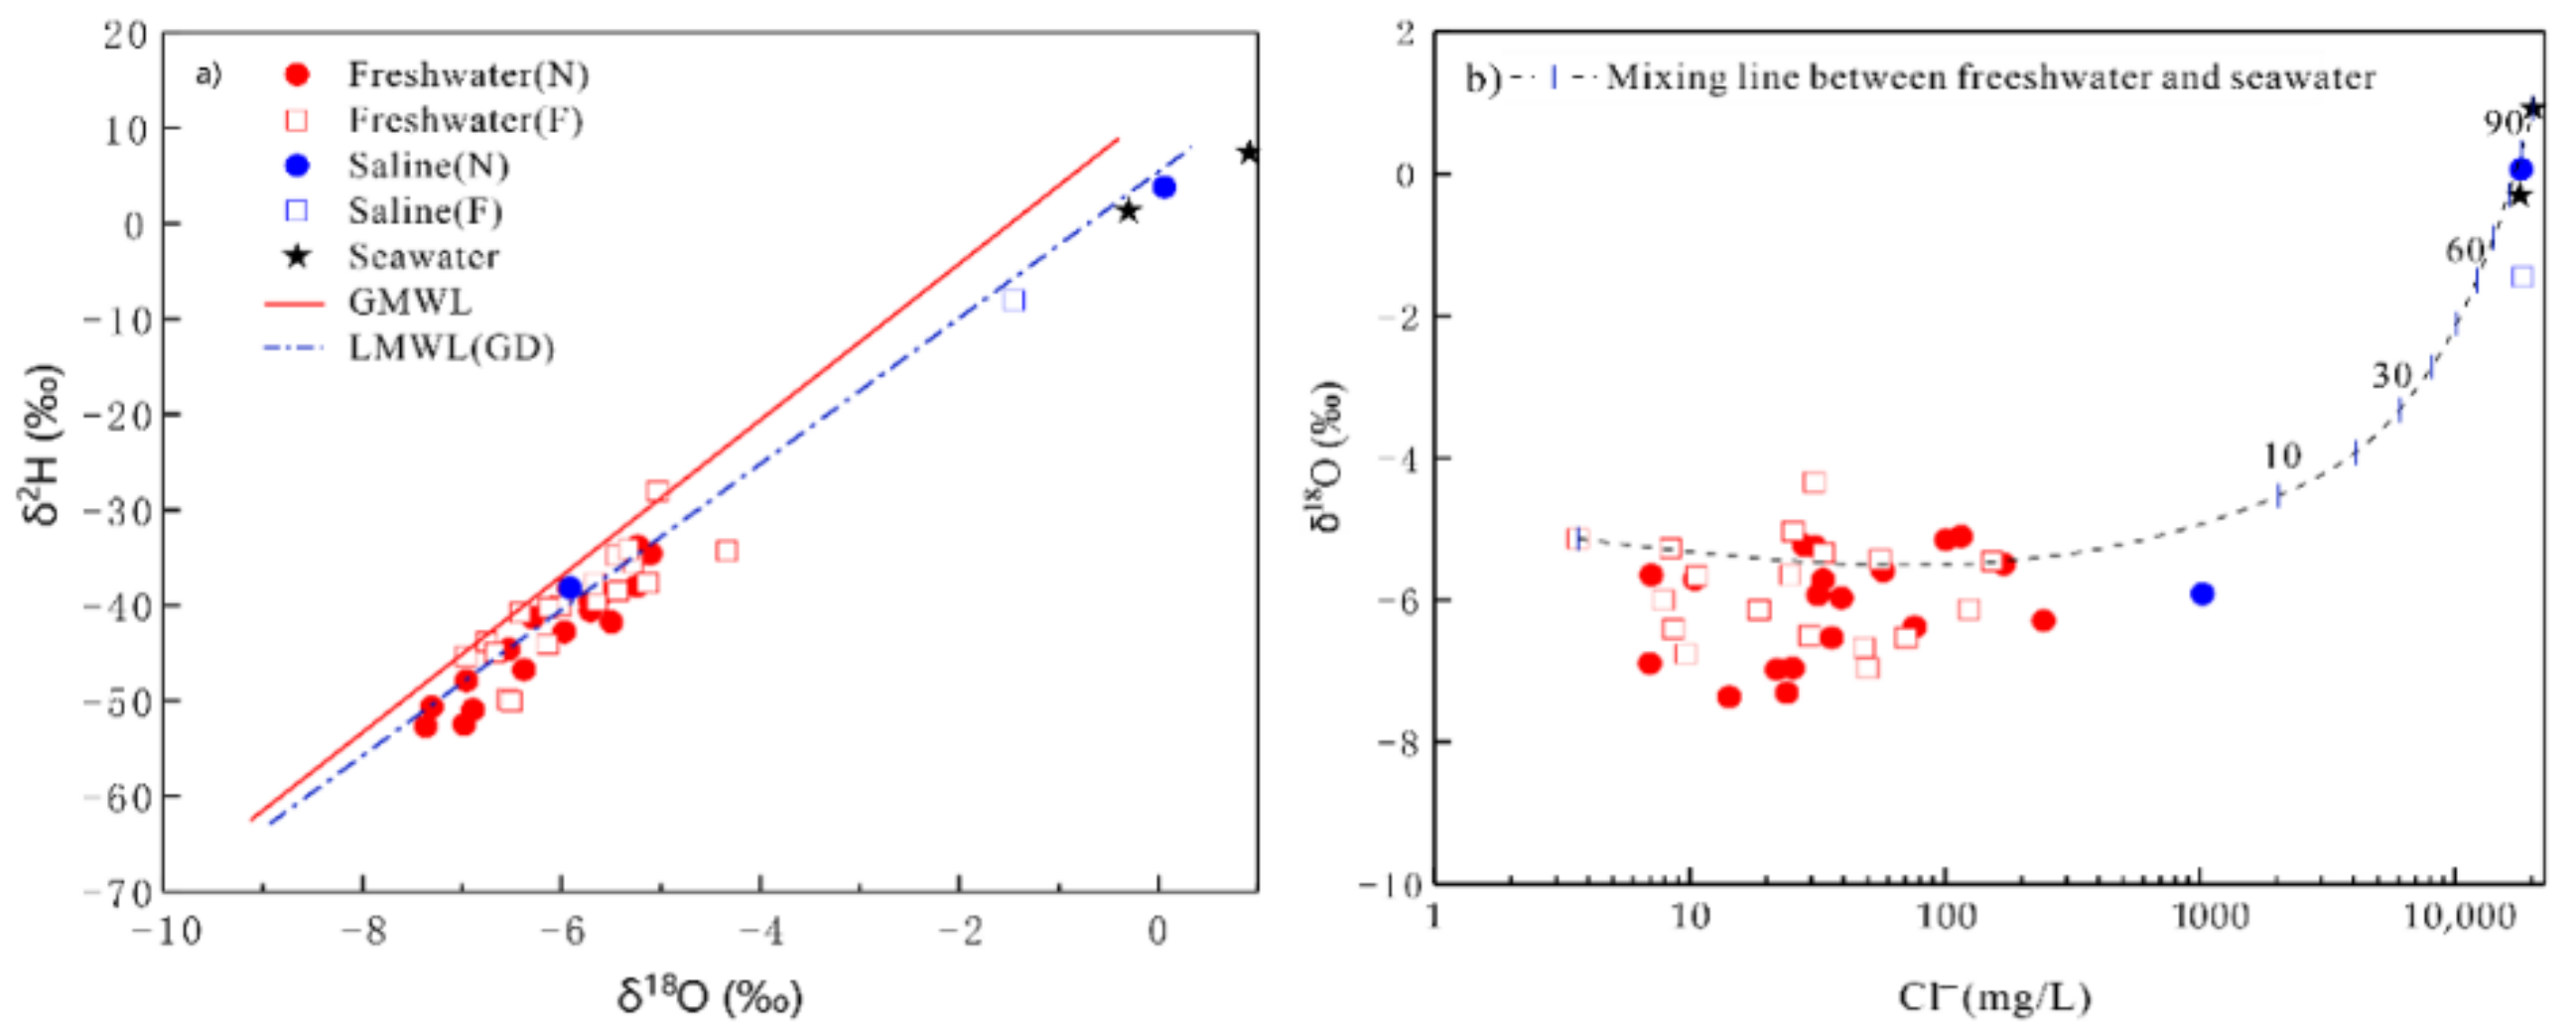
4.1. Hydrochemical Compositions
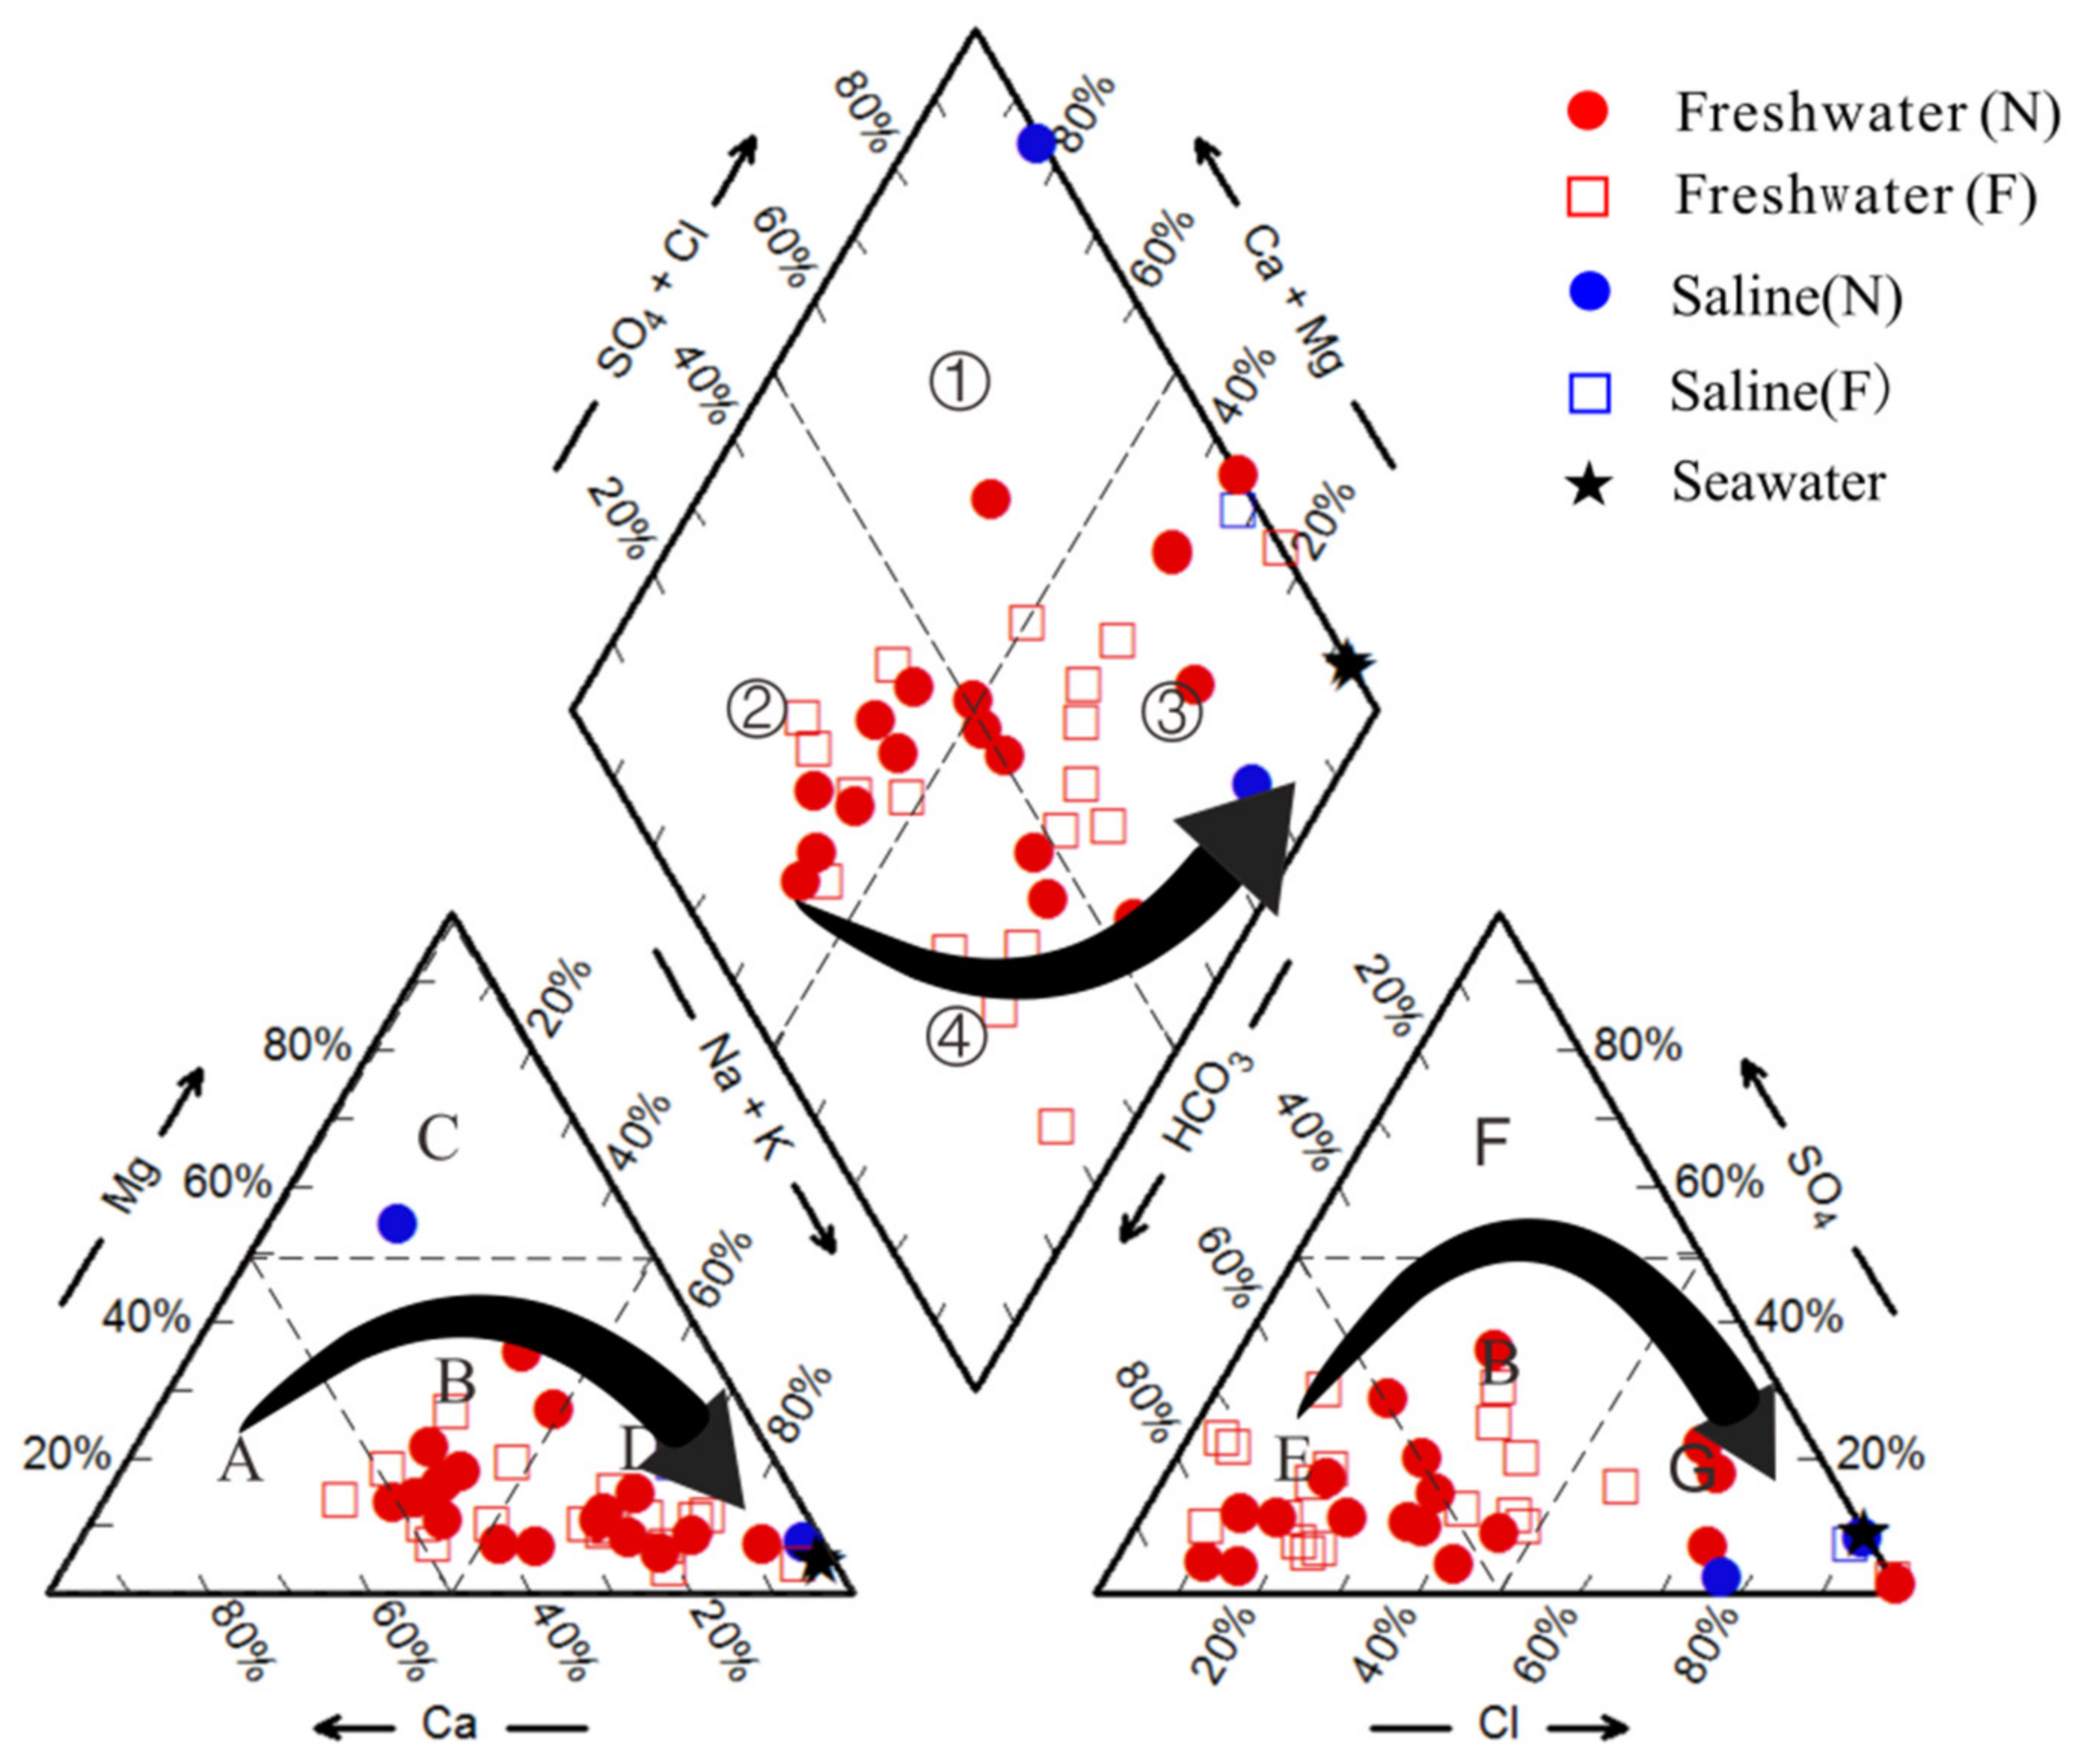
4.2. Hydrochemical Type
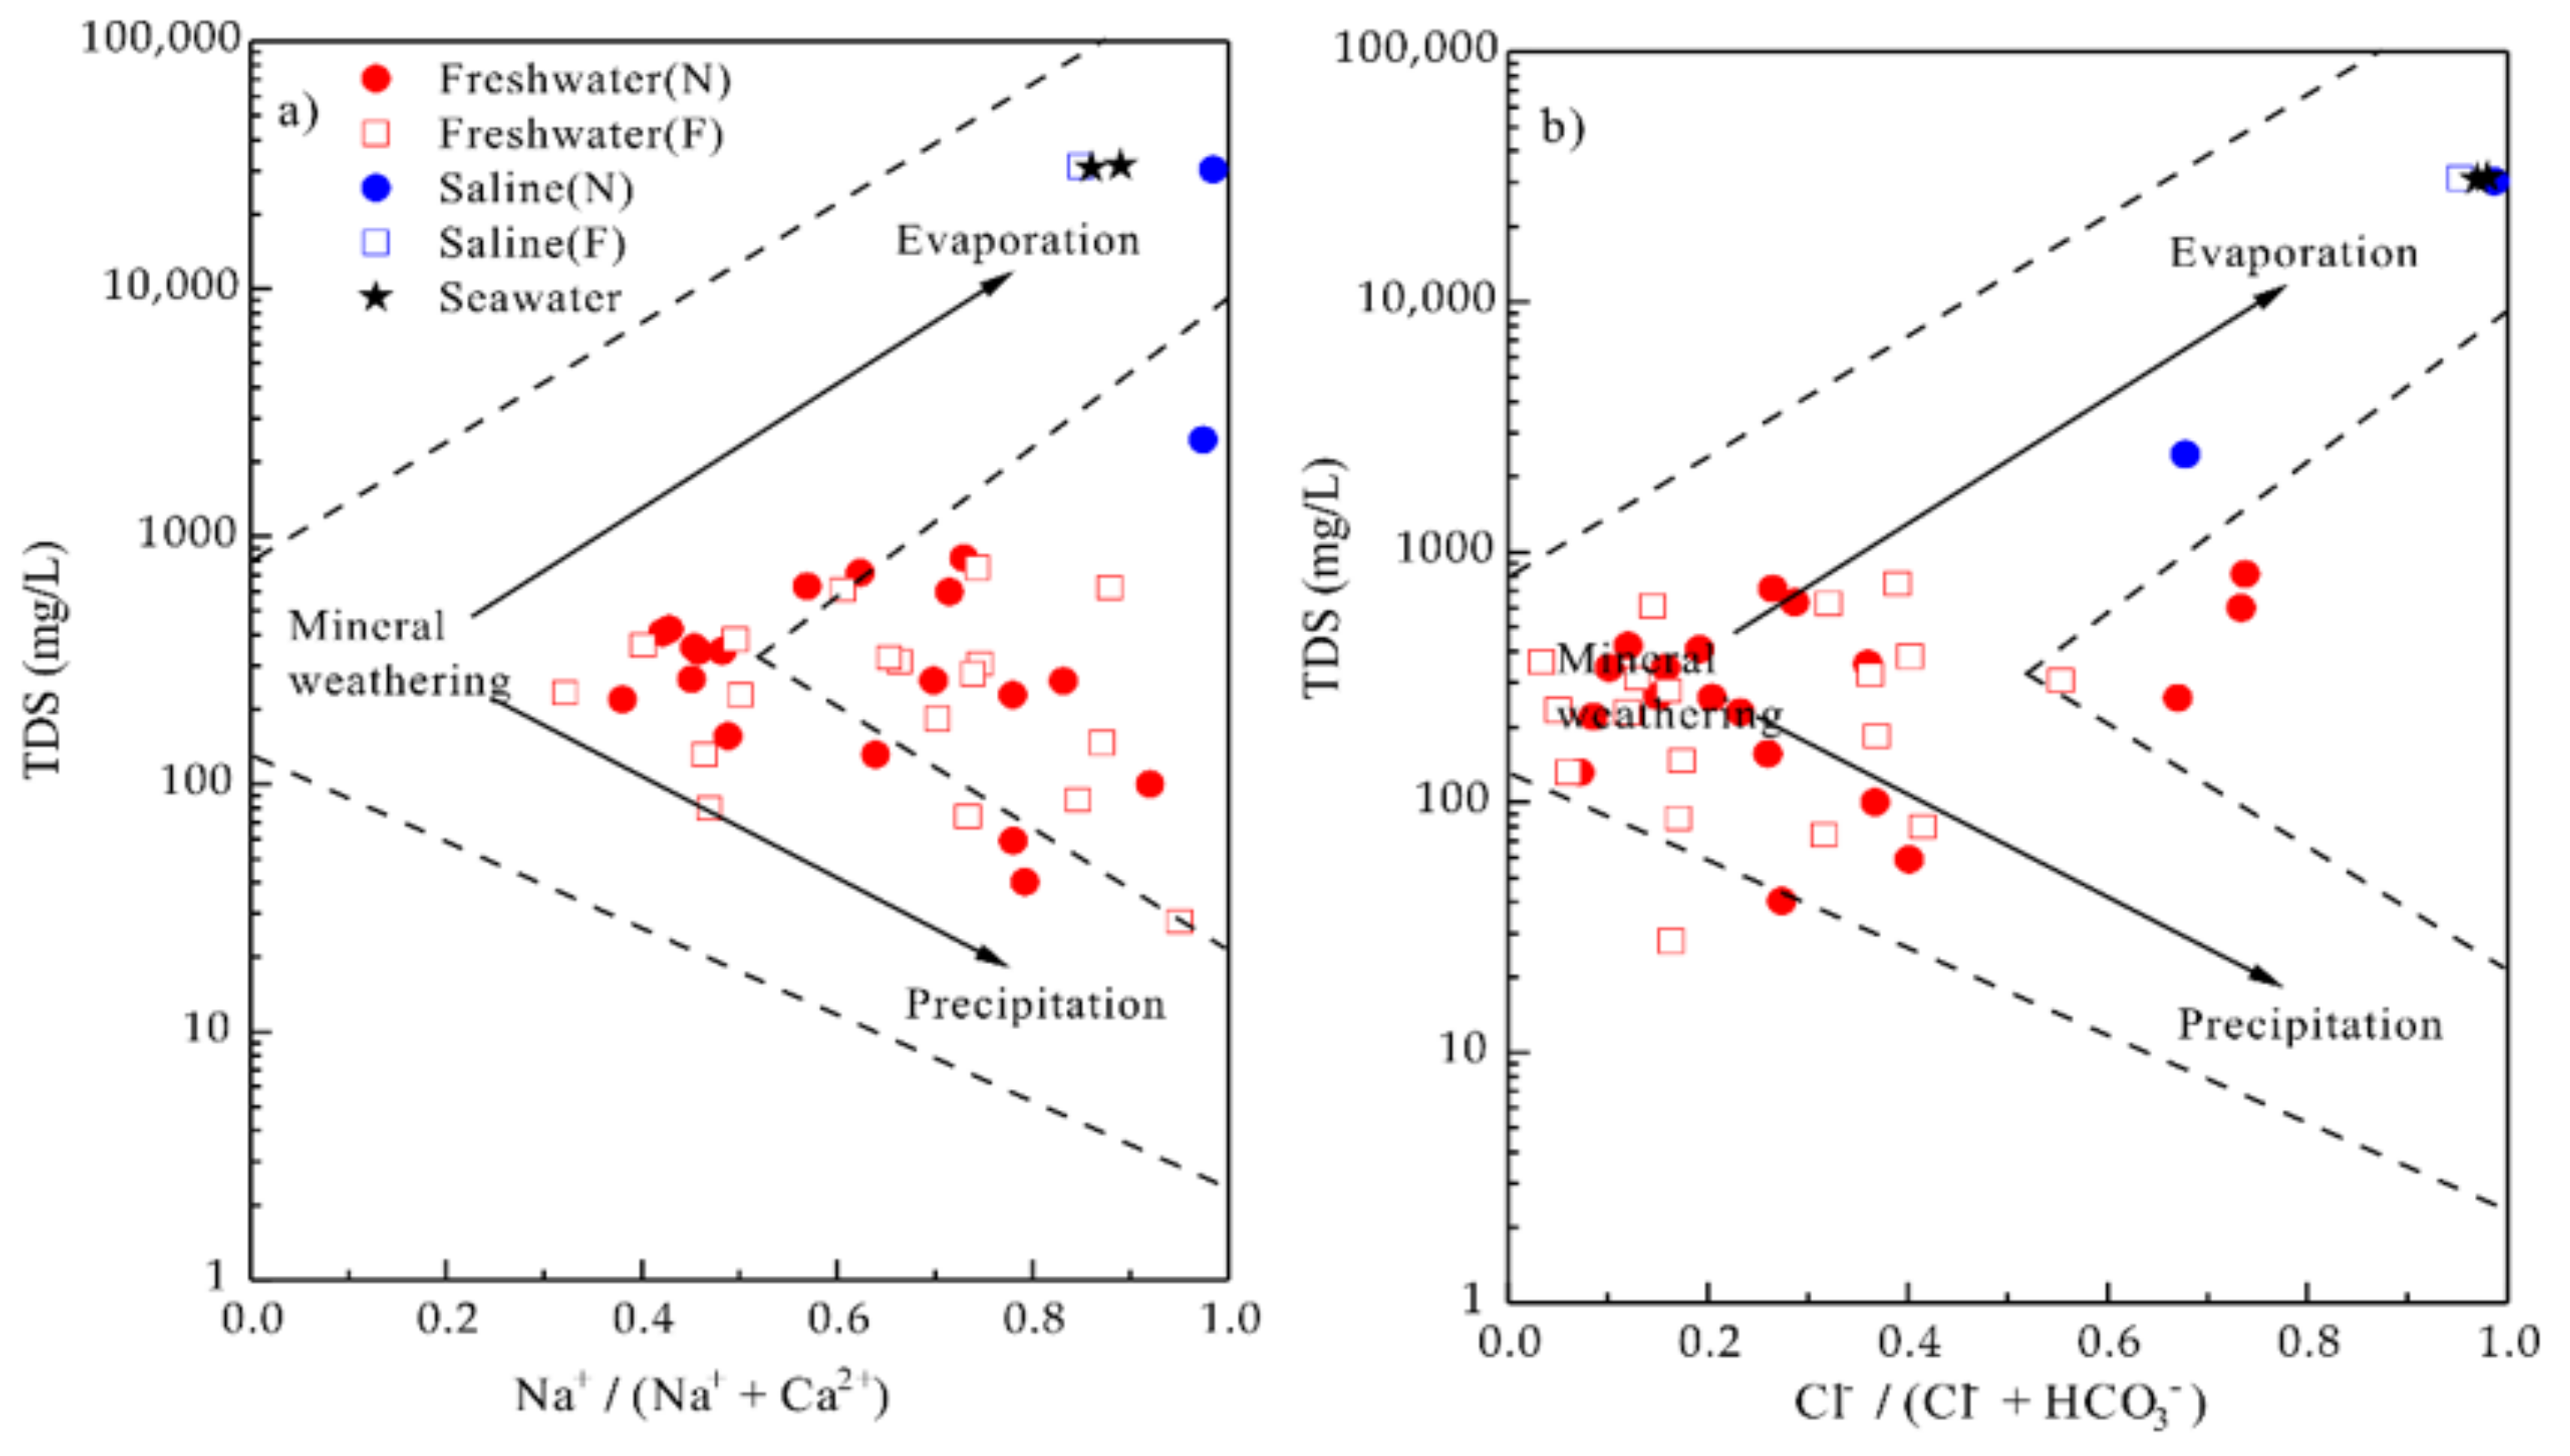
4.3. Factors Controlling the Hydrochemical Characteristics of Groundwater of the Guangdong
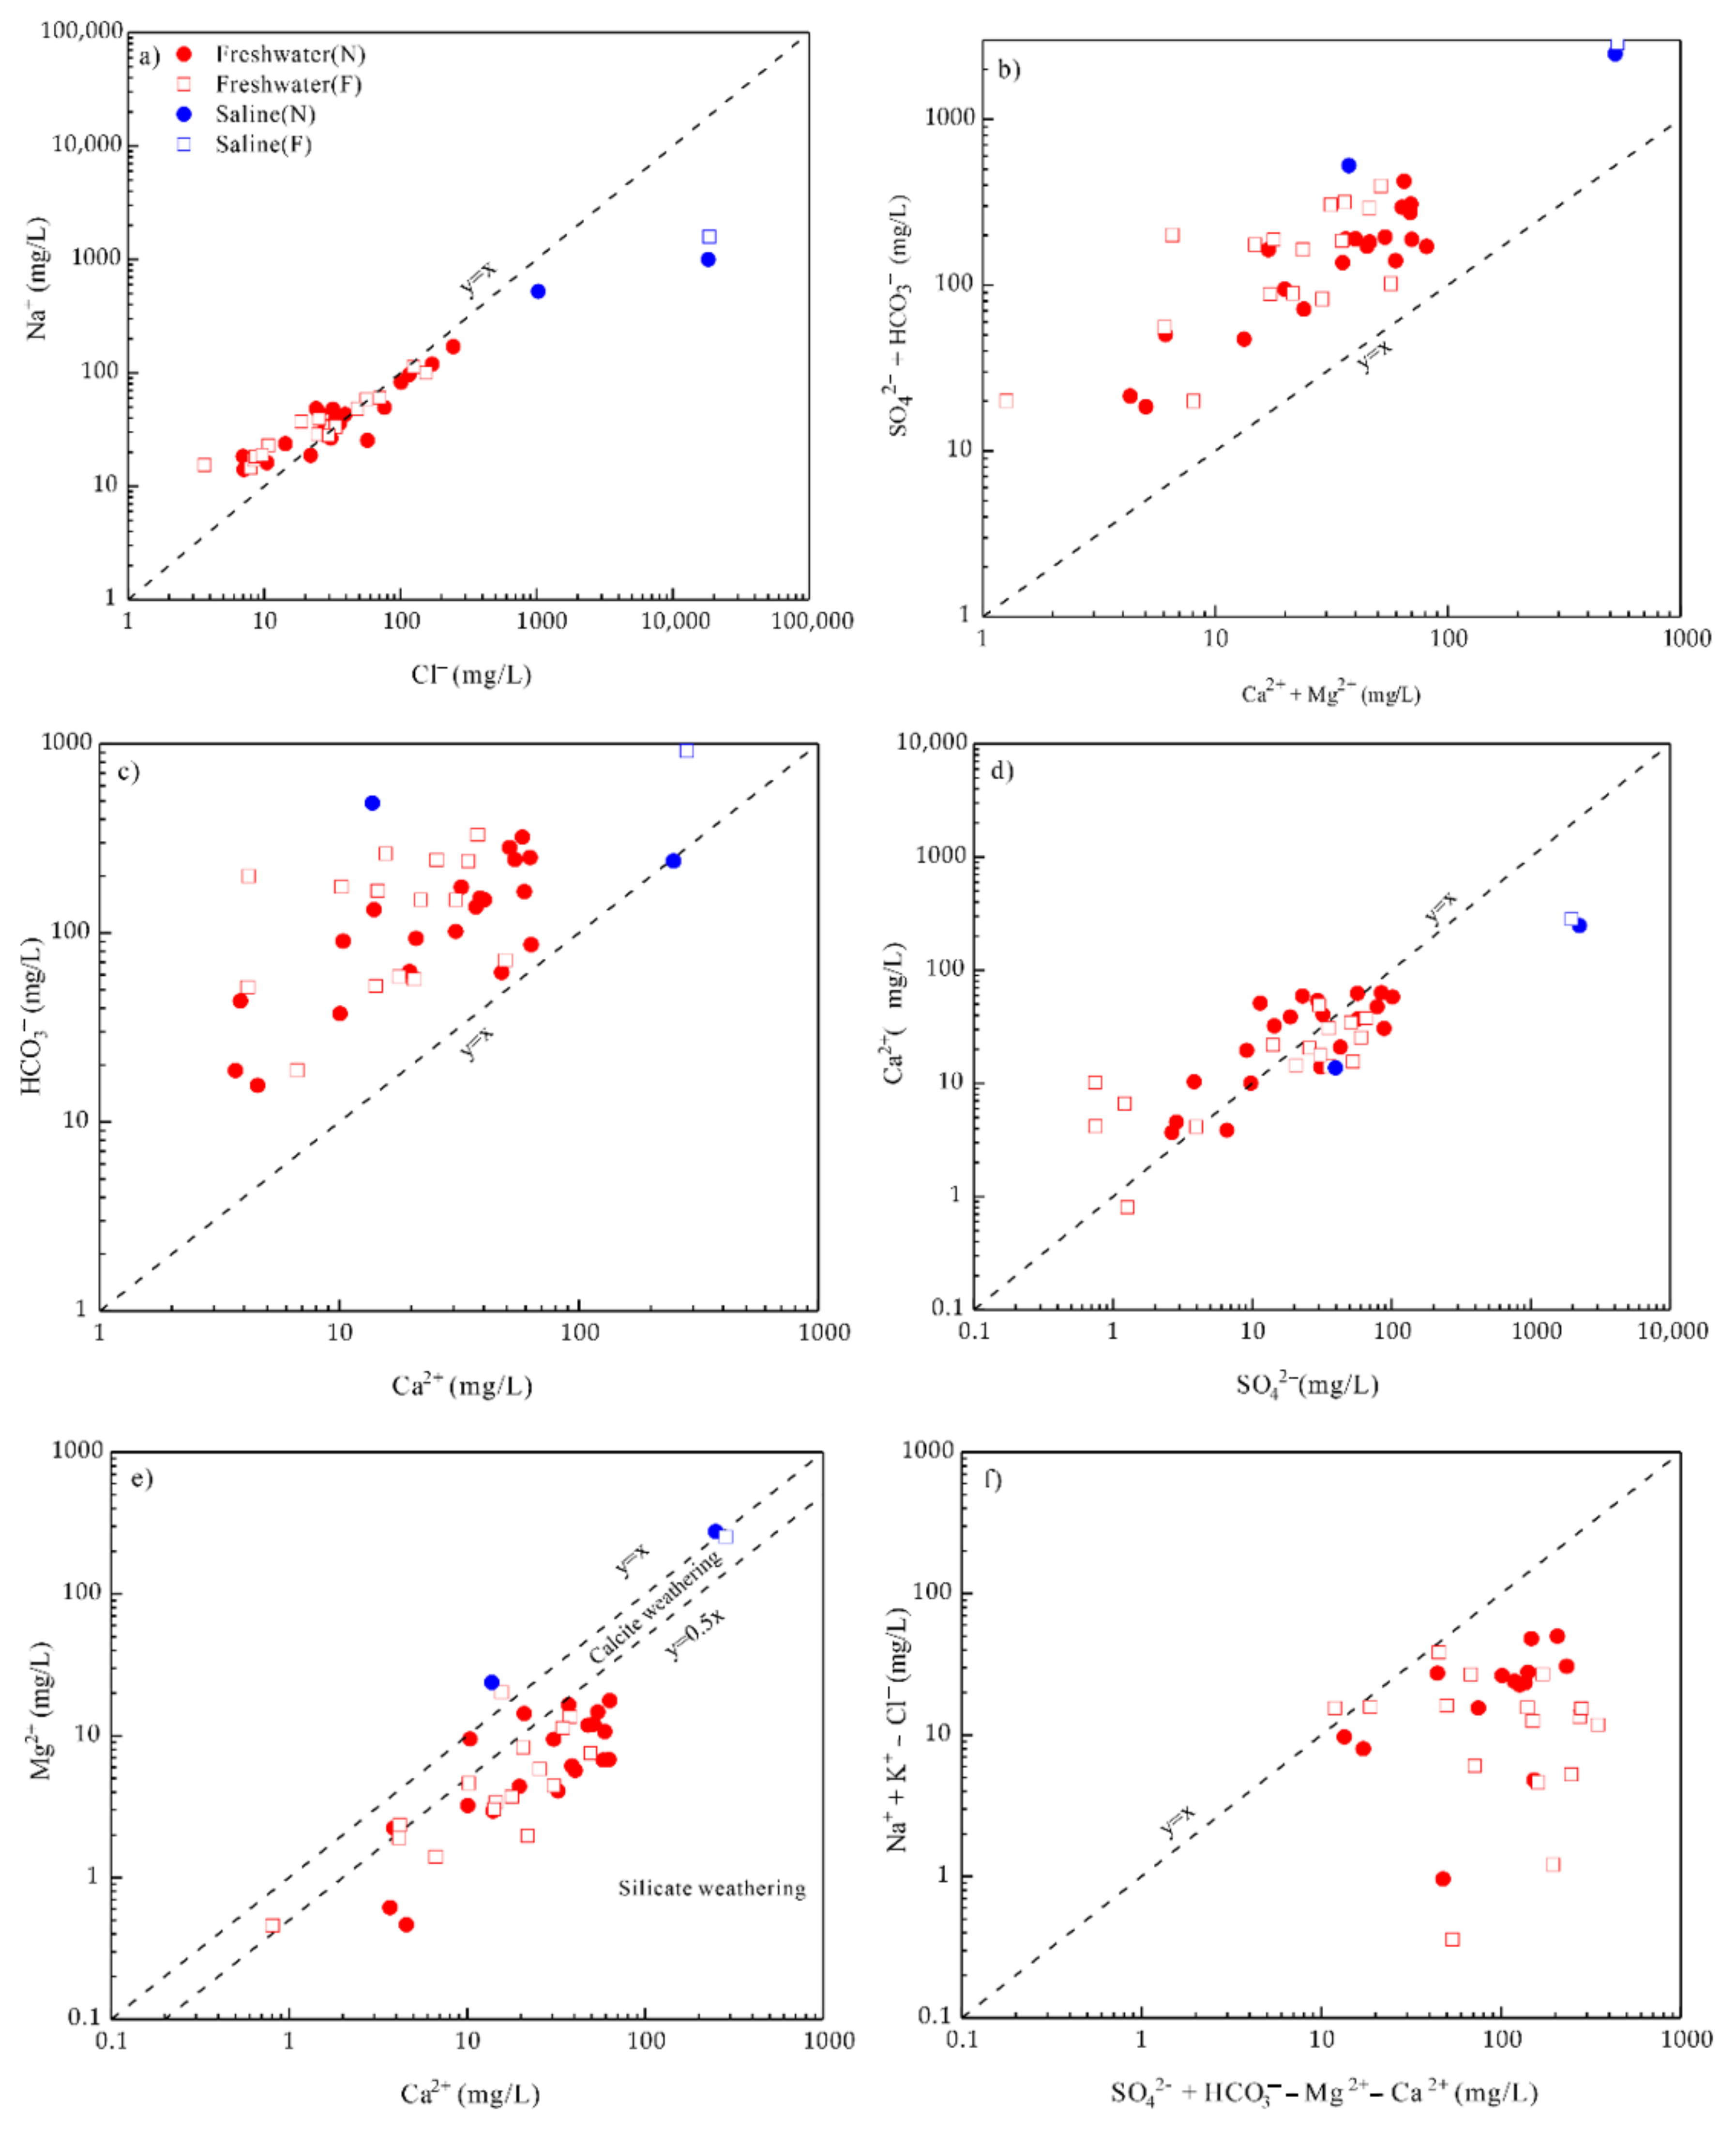
4.4. Possible Sources of Chemical Composition
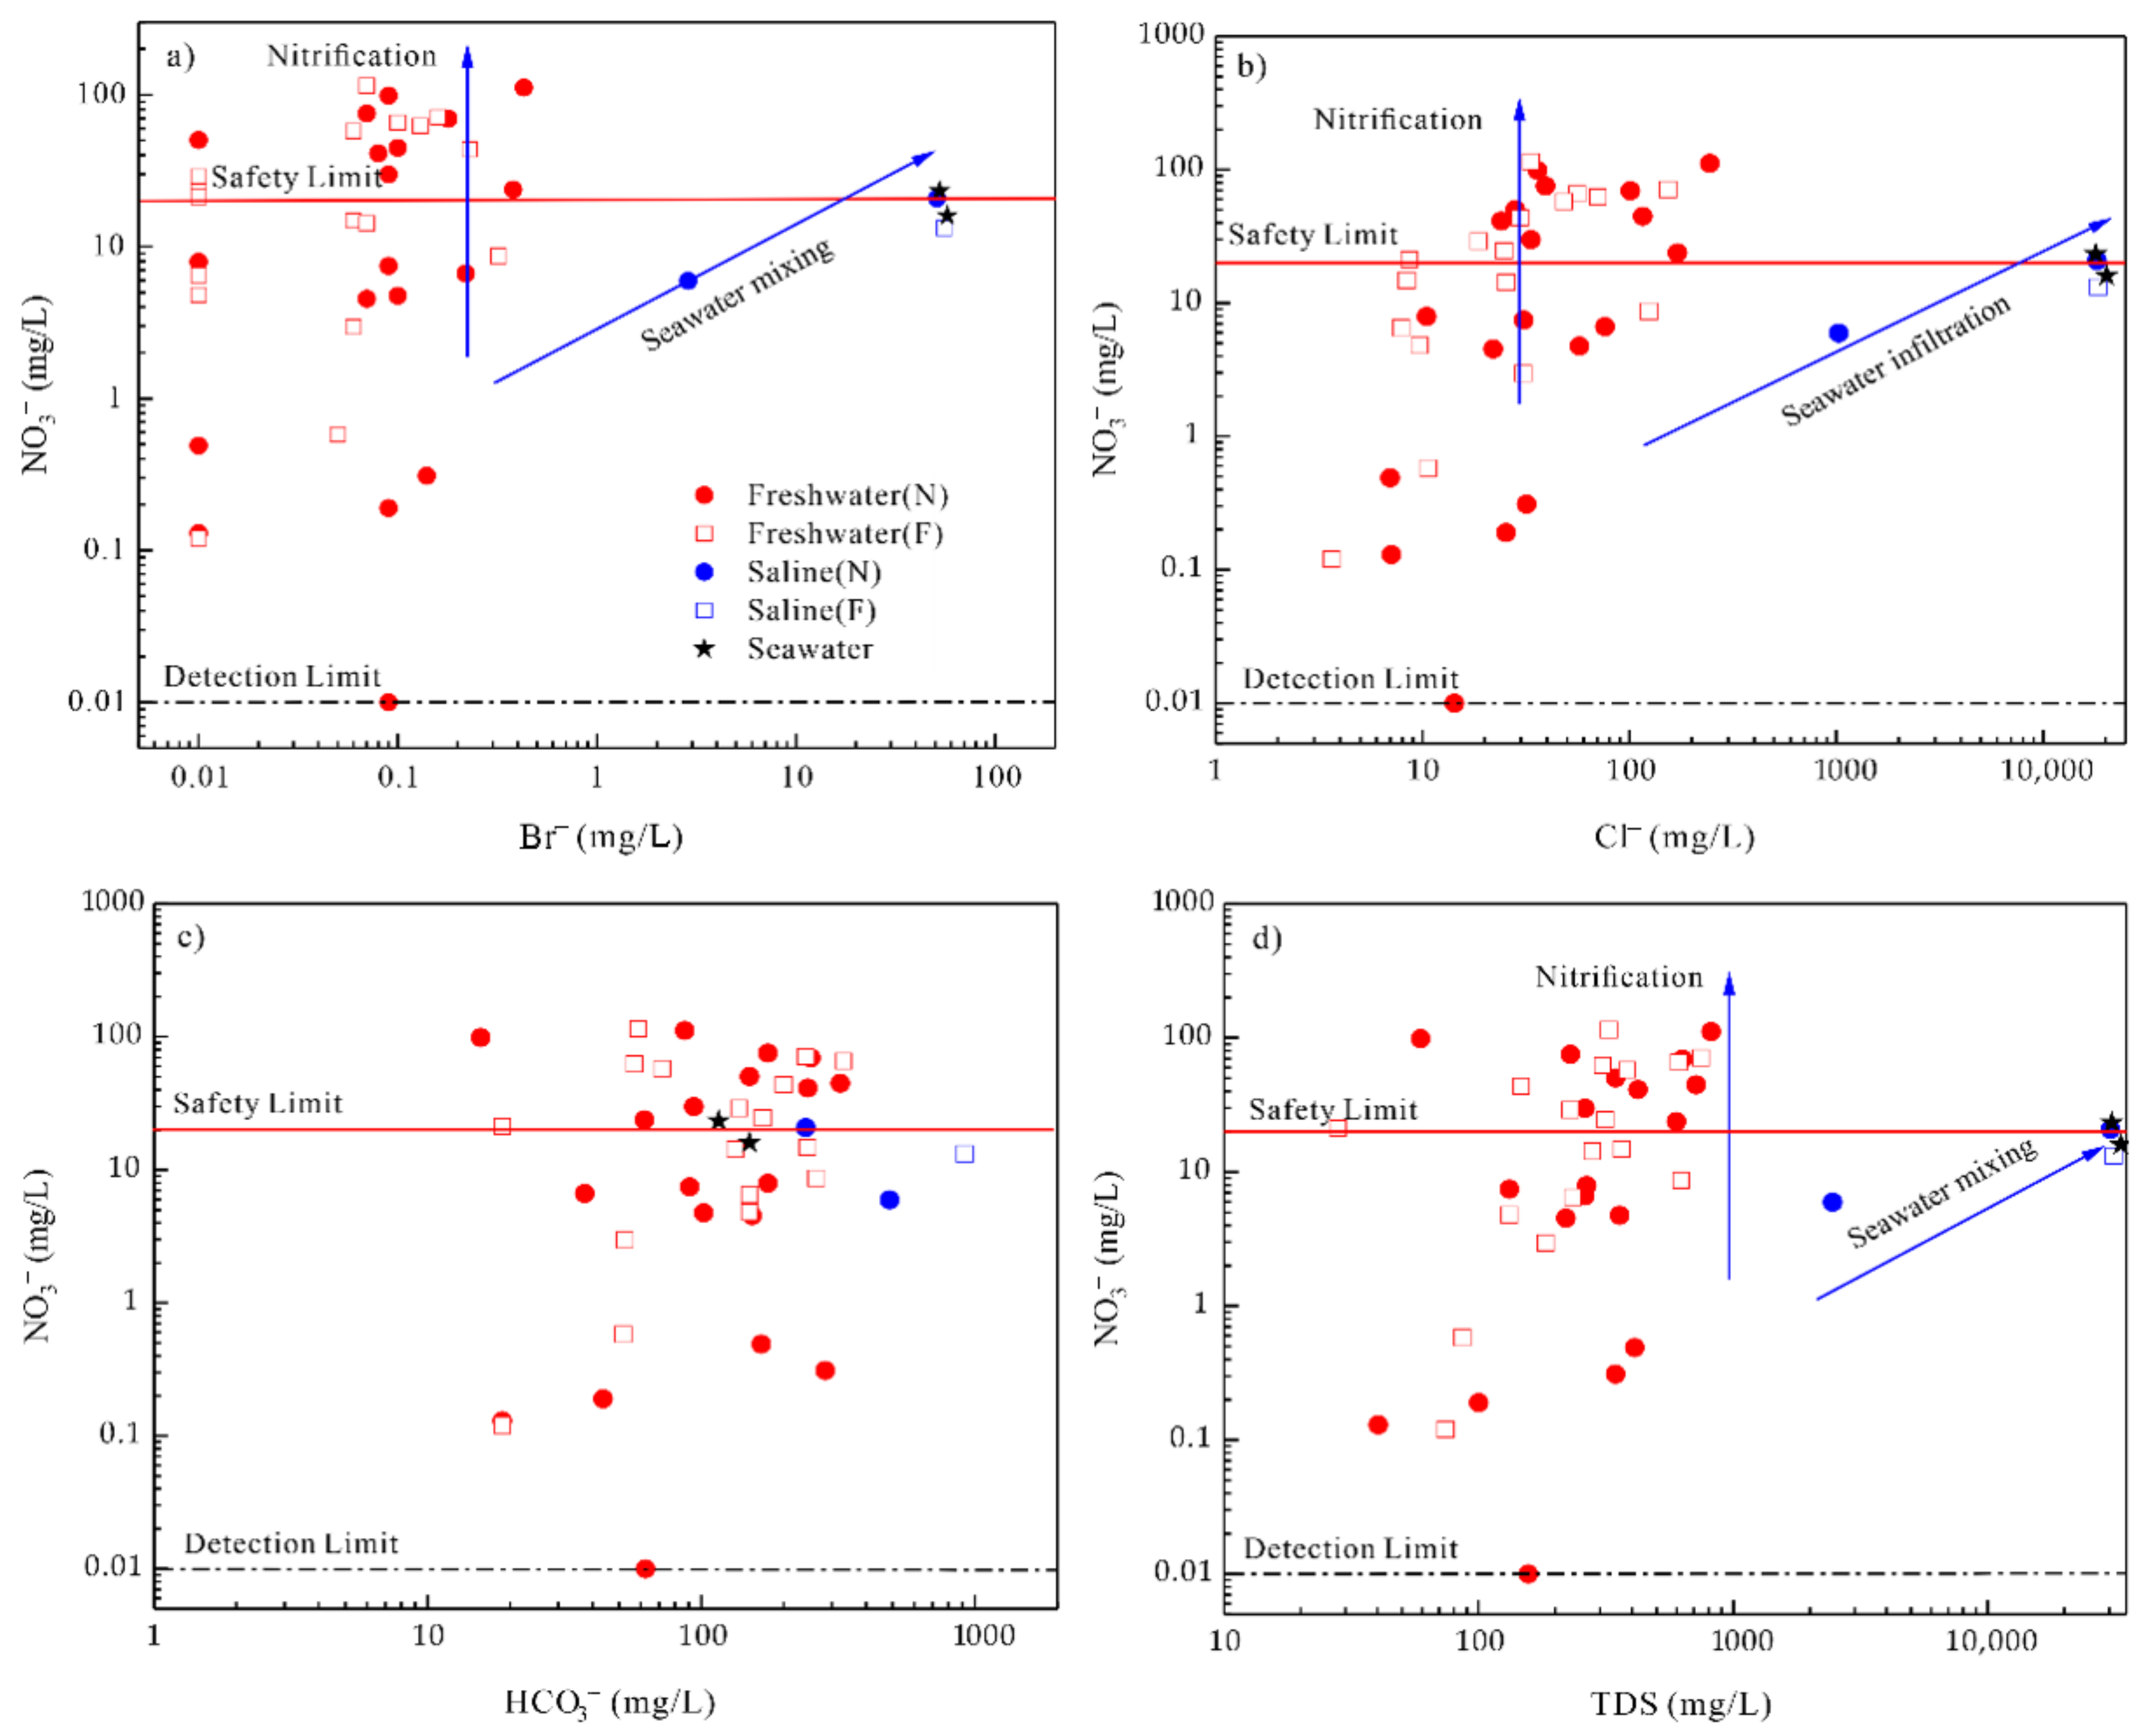
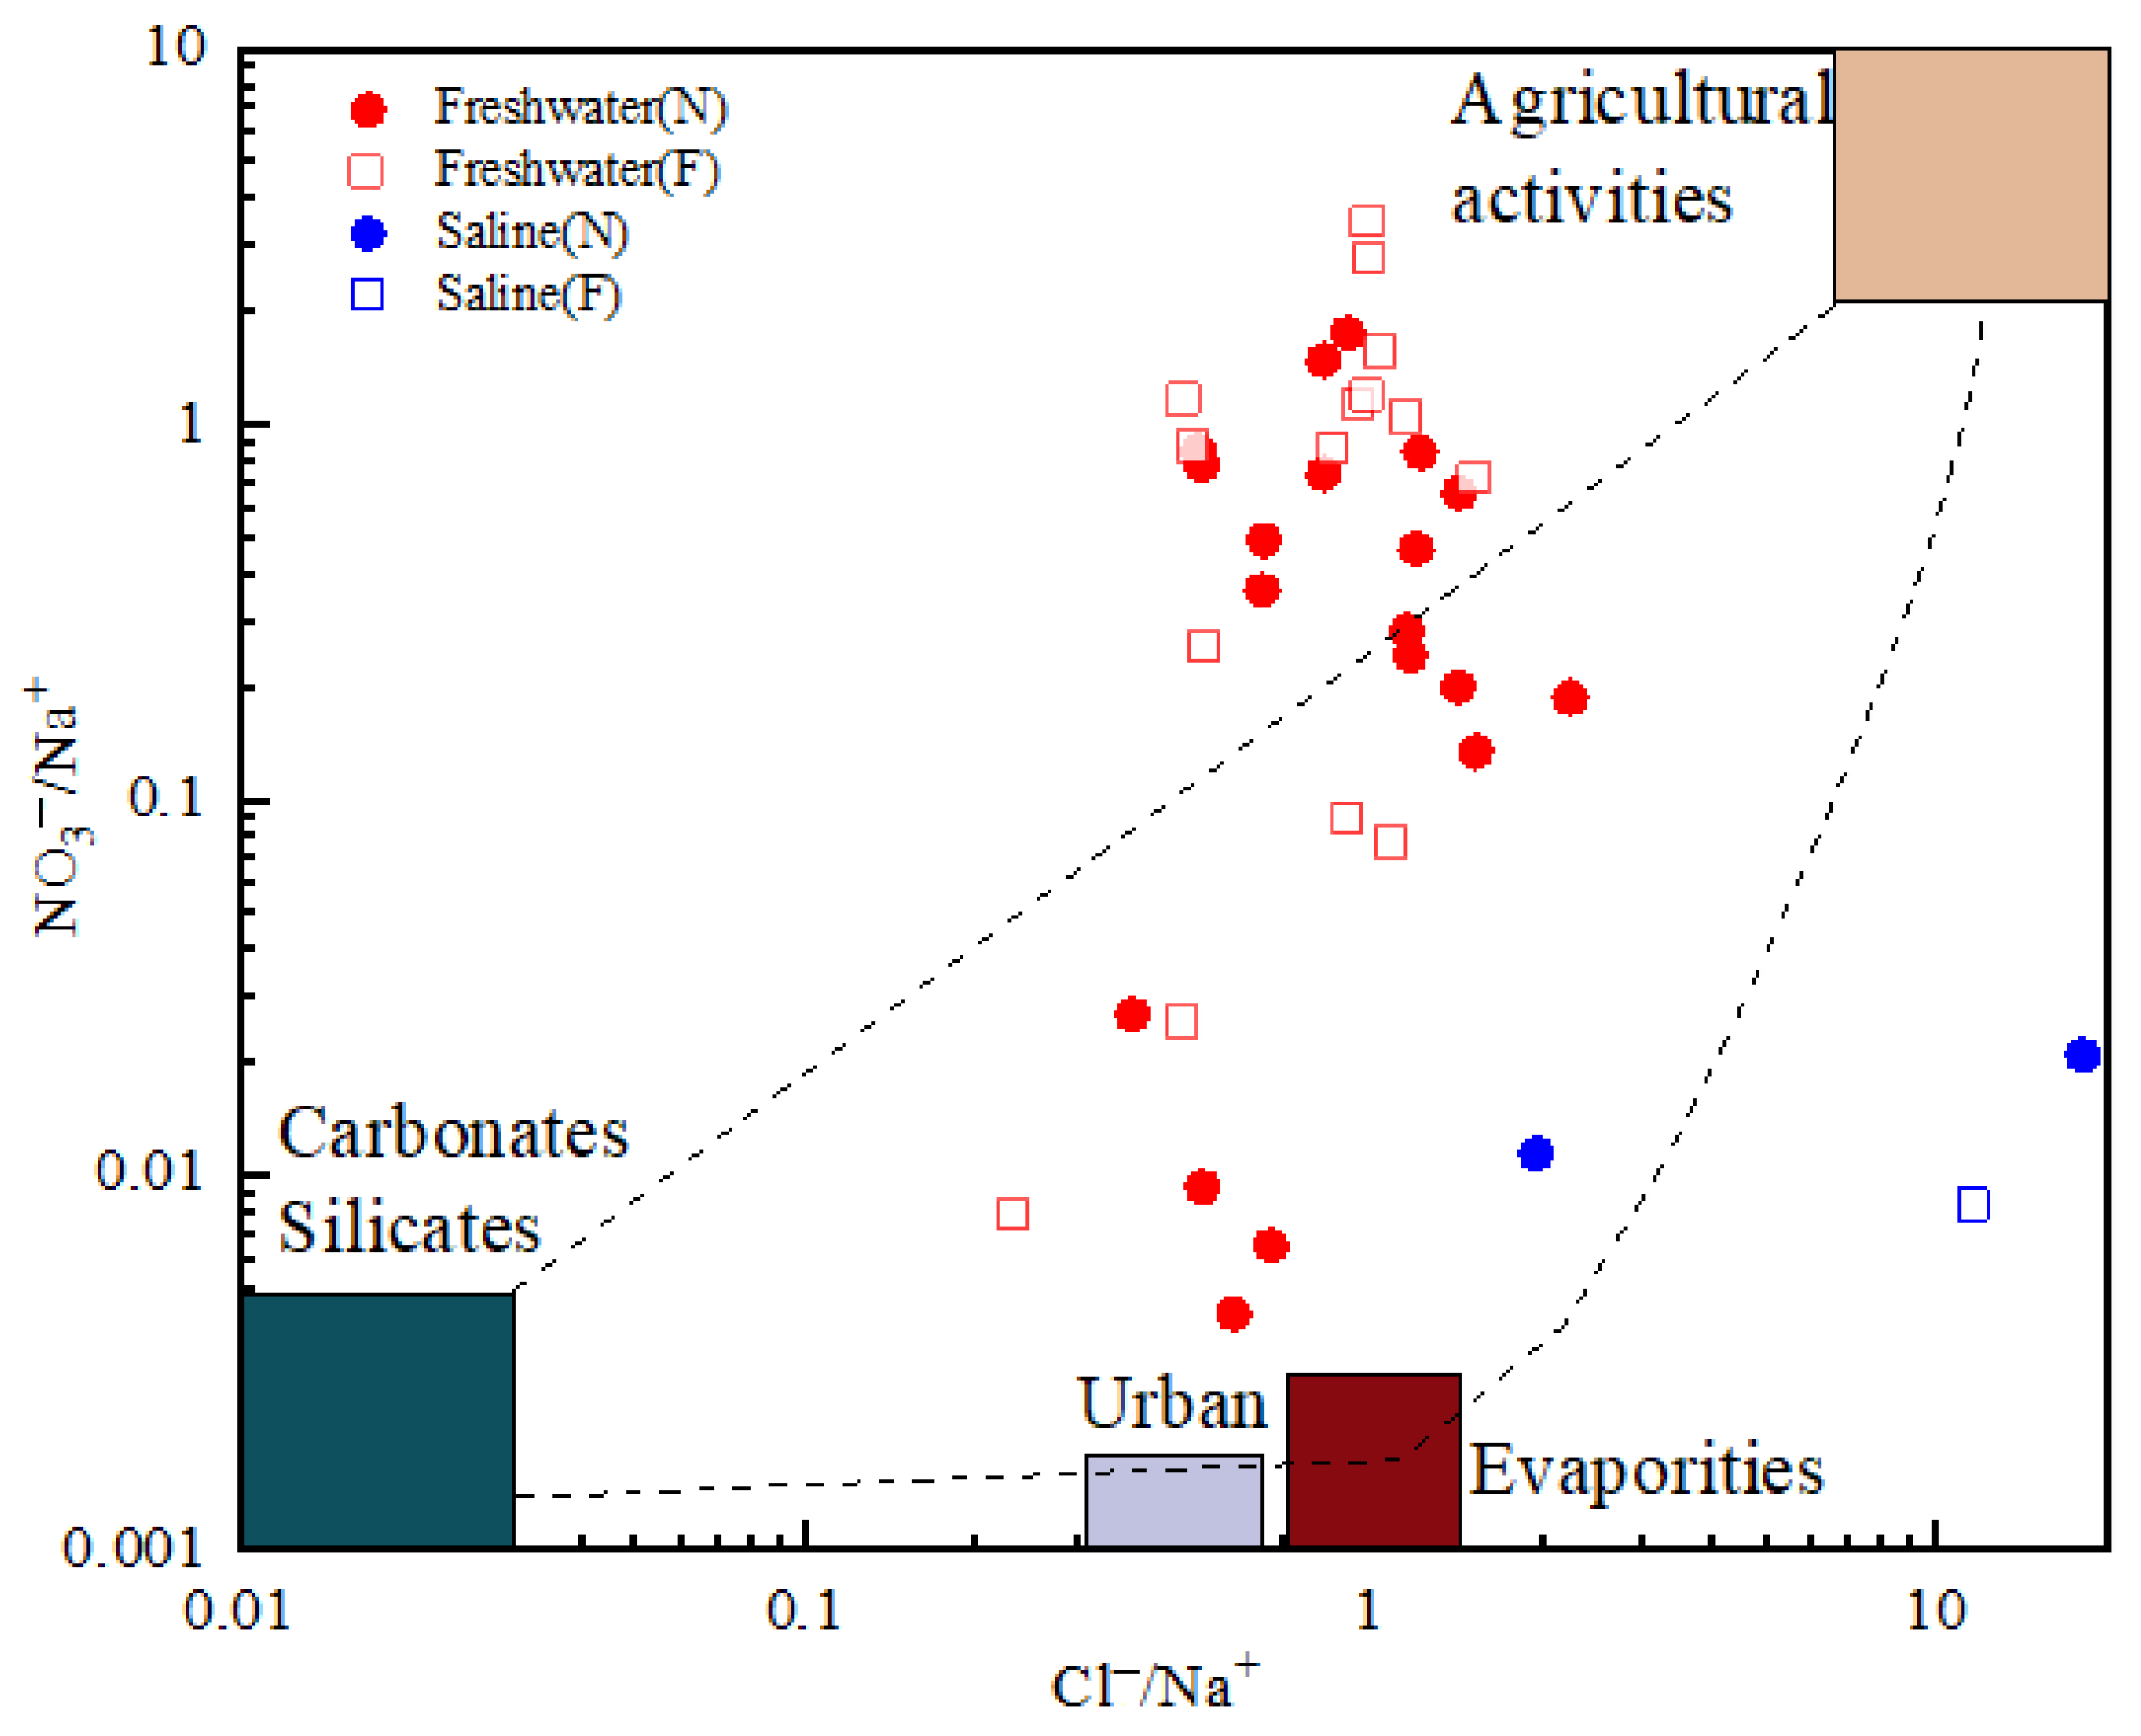
4.5. Anthropogenic Inputs
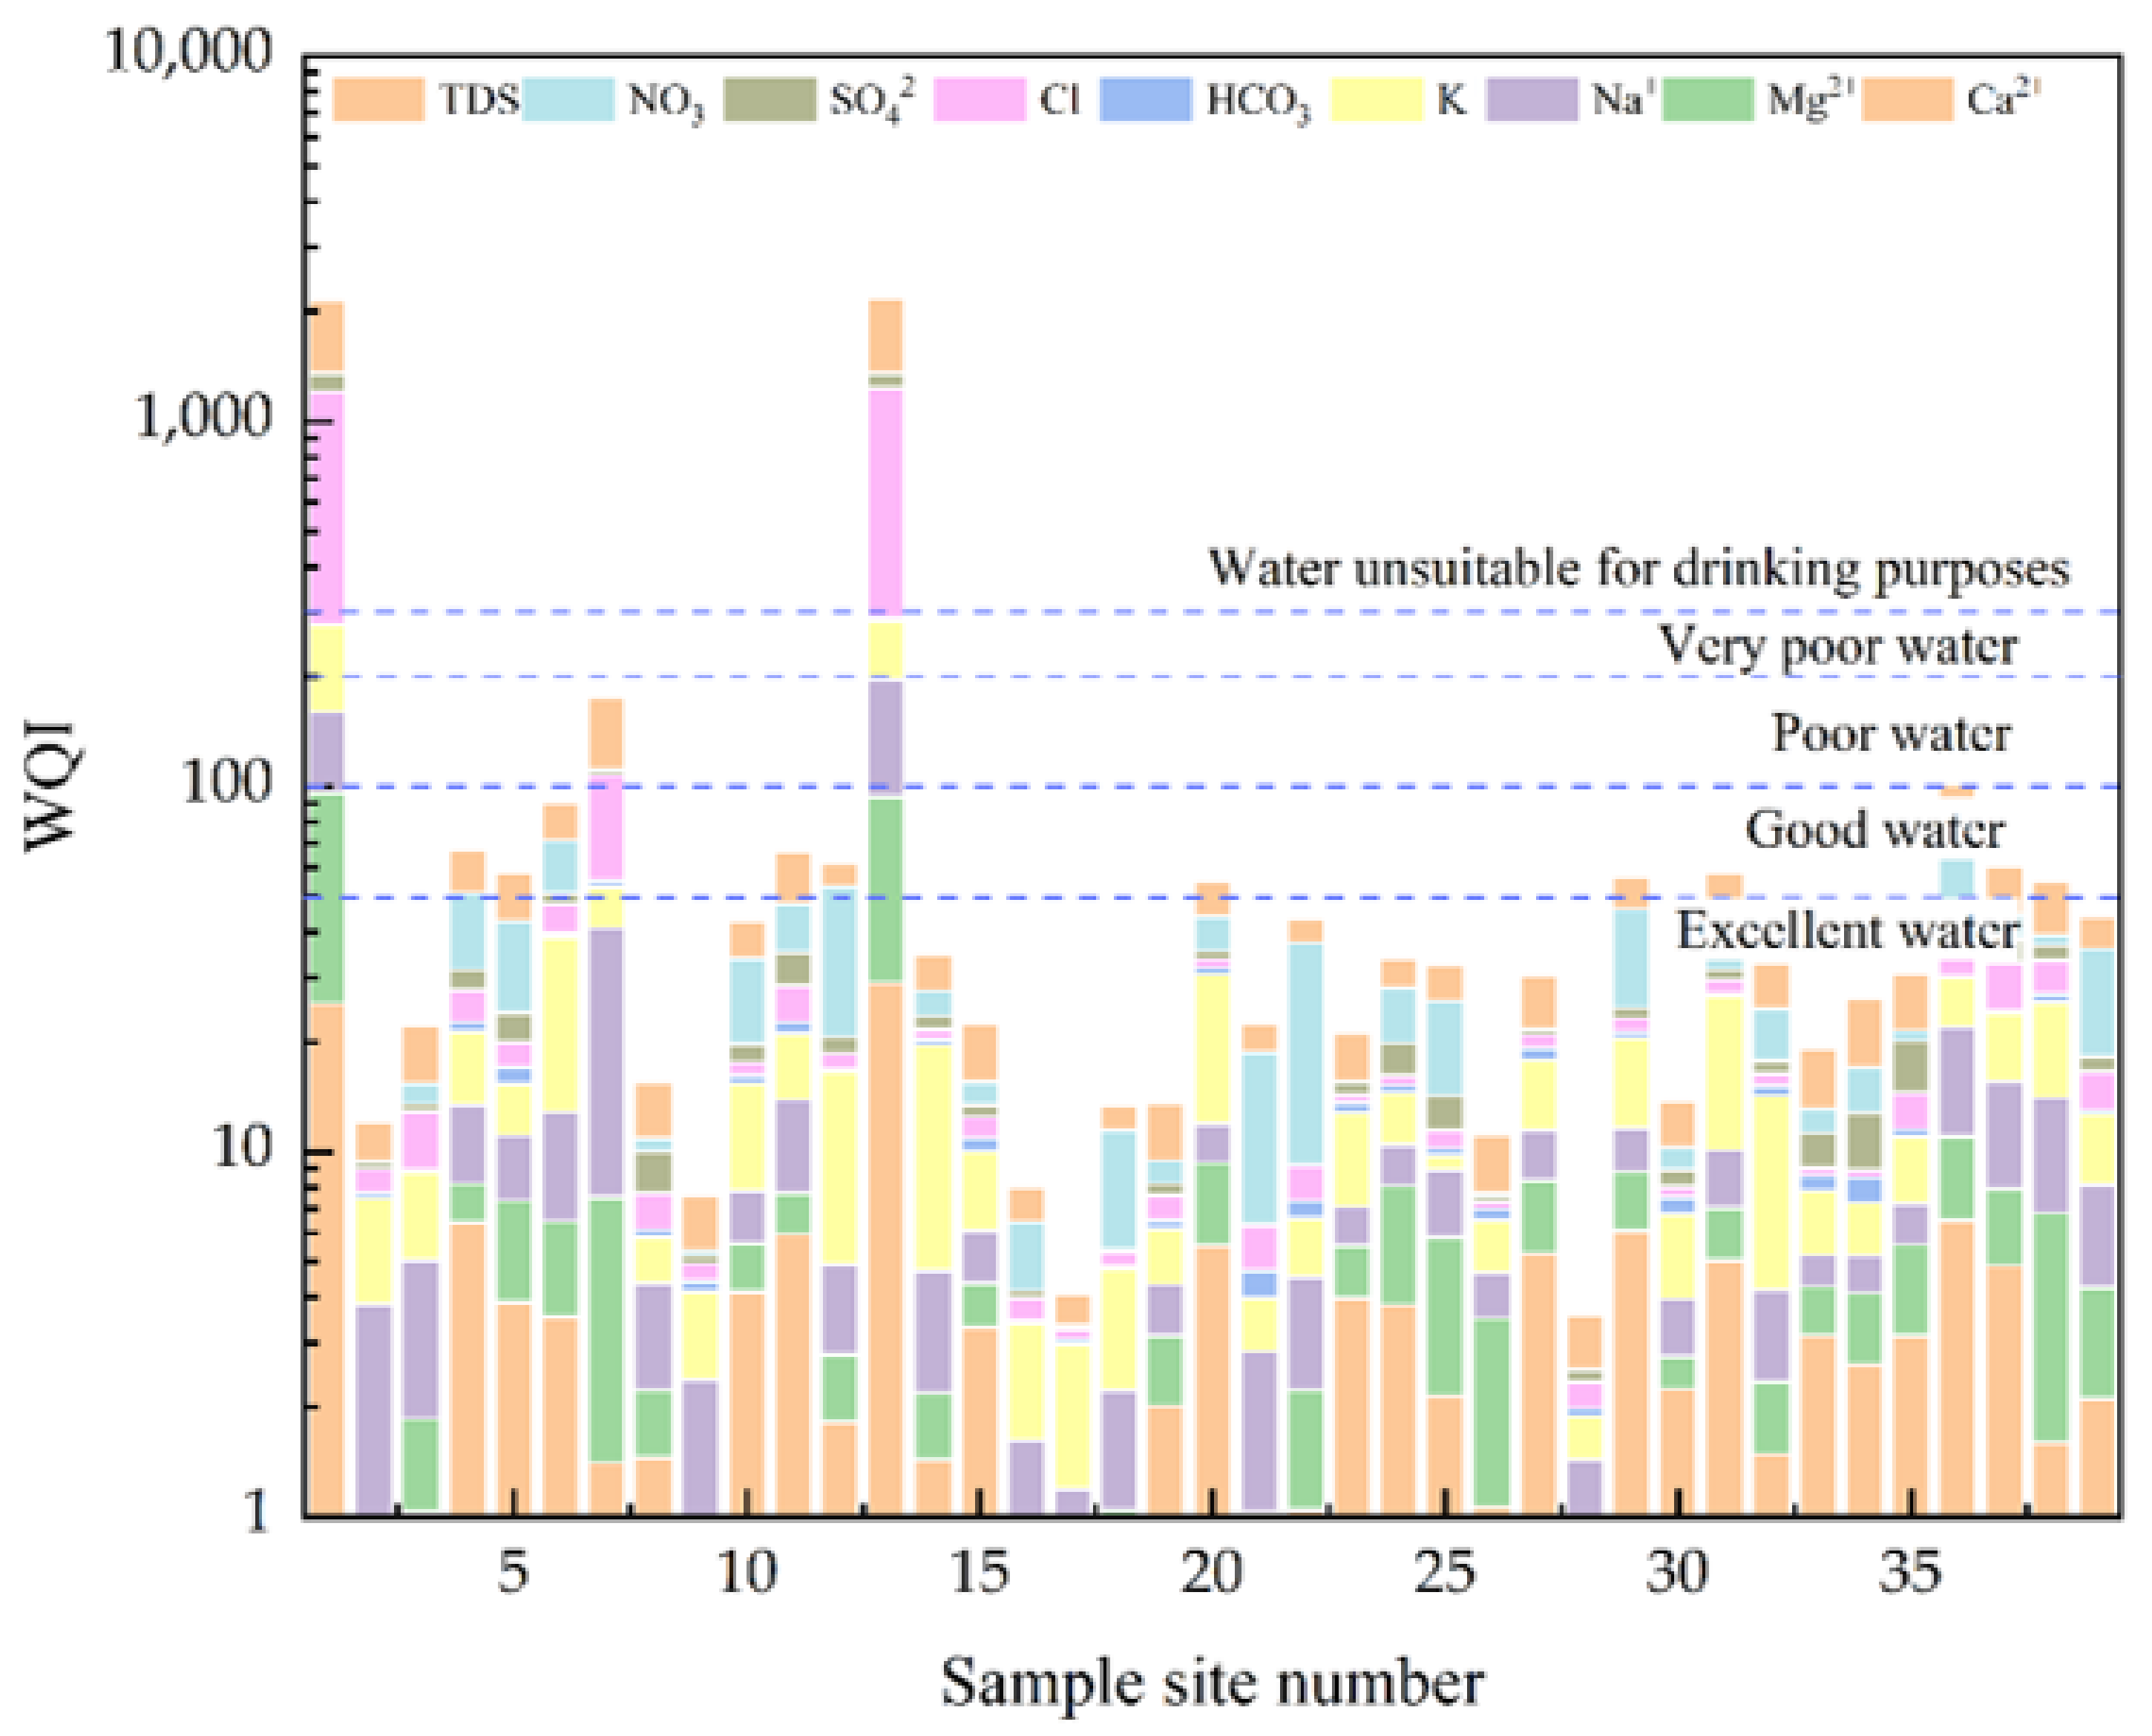
4.6. Drinking Water Quality
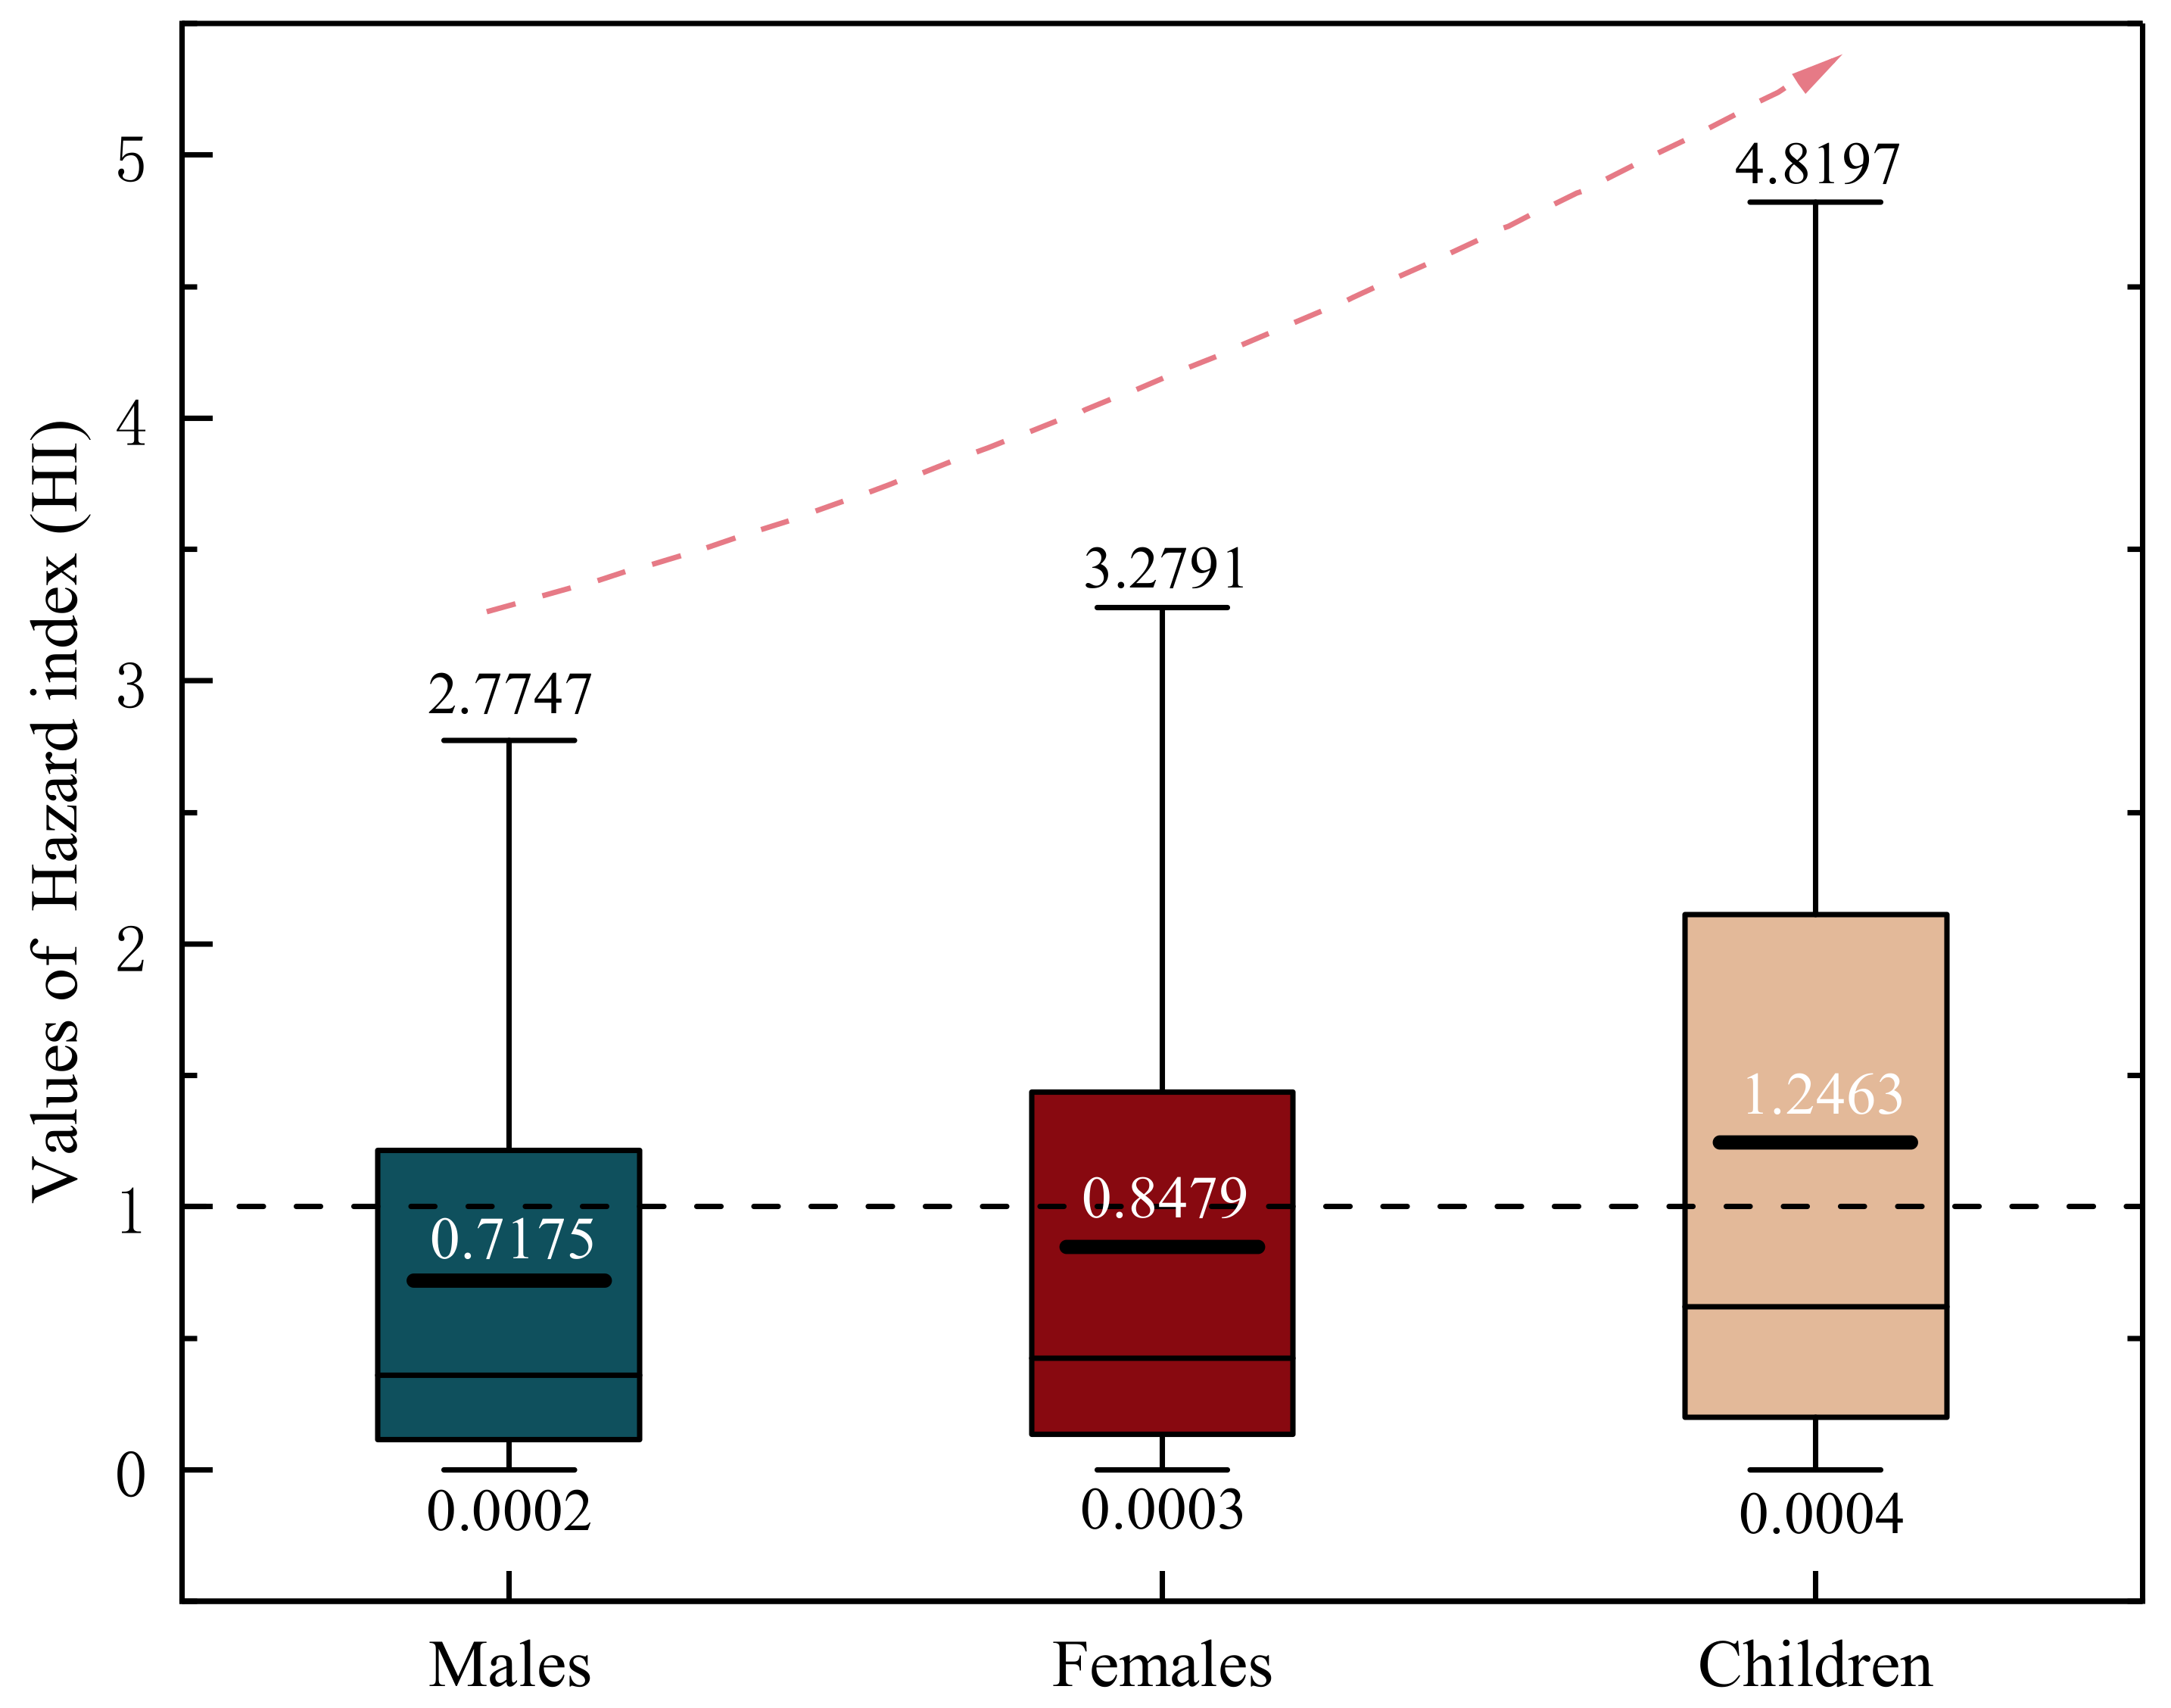
4.7. Human Health Risk Assessment
5. Conclusions
Author Contributions
Funding
Institutional Review Board Statement
Informed Consent Statement
Data Availability Statement
Acknowledgments
Conflicts of Interest
Appendix A

| Non-Carcinogenic Risk | |||||||||
|---|---|---|---|---|---|---|---|---|---|
| Samples | HQOral | HQDermal | HItotal | ||||||
| Males | Females | Children | Males | Females | Children | Males | Females | Children | |
| HY 1-1 | 0.0075 | 0.0088 | 0.0129 | 0.0000 | 0.0000 | 0.0001 | 0.0075 | 0.0088 | 0.0130 |
| HY 1-3 | 0.0031 | 0.0037 | 0.0054 | 0.0000 | 0.0000 | 0.0000 | 0.0031 | 0.0037 | 0.0054 |
| LF1-1 | 0.5901 | 0.6974 | 1.0229 | 0.0016 | 0.0019 | 0.0049 | 0.5917 | 0.6993 | 1.0278 |
| LF1-2 | 0.1563 | 0.1847 | 0.2708 | 0.0004 | 0.0005 | 0.0013 | 0.1567 | 0.1851 | 0.2721 |
| LF1-3 | 0.3567 | 0.4216 | 0.6183 | 0.0009 | 0.0011 | 0.0030 | 0.3577 | 0.4227 | 0.6213 |
| LF1-4 | 0.1142 | 0.1349 | 0.1979 | 0.0003 | 0.0004 | 0.0010 | 0.1145 | 0.1353 | 0.1989 |
| MM 1-1 | 2.6817 | 3.1693 | 4.6483 | 0.0071 | 0.0084 | 0.0223 | 2.6889 | 3.1777 | 4.6706 |
| MM 1-2 | 0.5724 | 0.6764 | 0.9921 | 0.0015 | 0.0018 | 0.0048 | 0.5739 | 0.6782 | 0.9968 |
| MM 1-3 | 0.2084 | 0.2463 | 0.3613 | 0.0006 | 0.0007 | 0.0017 | 0.2090 | 0.2470 | 0.3630 |
| MM 1-4 | 1.4993 | 1.7719 | 2.5988 | 0.0040 | 0.0047 | 0.0125 | 1.5033 | 1.7766 | 2.6112 |
| ST1-1 | 0.5007 | 0.5918 | 0.8679 | 0.0013 | 0.0016 | 0.0042 | 0.5021 | 0.5933 | 0.8721 |
| ST1-2 | 0.0046 | 0.0054 | 0.0079 | 0.0000 | 0.0000 | 0.0000 | 0.0046 | 0.0054 | 0.0080 |
| ST1-3 | 0.1601 | 0.1892 | 0.2775 | 0.0004 | 0.0005 | 0.0013 | 0.1605 | 0.1897 | 0.2788 |
| ST1-4 | 1.6700 | 1.9736 | 2.8946 | 0.0044 | 0.0052 | 0.0139 | 1.6744 | 1.9788 | 2.9085 |
| ST1-5 | 1.5776 | 1.8645 | 2.7346 | 0.0042 | 0.0050 | 0.0131 | 1.5818 | 1.8694 | 2.7477 |
| ST1-6 | 1.7130 | 2.0244 | 2.9692 | 0.0045 | 0.0054 | 0.0143 | 1.7175 | 2.0298 | 2.9834 |
| ST2-1 | 0.1430 | 0.1690 | 0.2479 | 0.0004 | 0.0004 | 0.0012 | 0.1434 | 0.1695 | 0.2491 |
| ST2-2 | 0.0712 | 0.0841 | 0.1233 | 0.0002 | 0.0002 | 0.0006 | 0.0713 | 0.0843 | 0.1239 |
| ST2-3 | 0.0139 | 0.0165 | 0.0242 | 0.0000 | 0.0000 | 0.0001 | 0.0140 | 0.0165 | 0.0243 |
| ST3-1 | 1.2113 | 1.4315 | 2.0996 | 0.0032 | 0.0038 | 0.0101 | 1.2145 | 1.4353 | 2.1097 |
| ST3-2 | 1.0750 | 1.2705 | 1.8633 | 0.0029 | 0.0034 | 0.0089 | 1.0779 | 1.2738 | 1.8723 |
| ST3-3 | 2.7673 | 3.2705 | 4.7967 | 0.0073 | 0.0087 | 0.0230 | 2.7747 | 3.2791 | 4.8197 |
| ST3-4 | 0.3183 | 0.3761 | 0.5517 | 0.0008 | 0.0010 | 0.0026 | 0.3191 | 0.3771 | 0.5543 |
| ST3-5 | 0.3425 | 0.4048 | 0.5938 | 0.0009 | 0.0011 | 0.0029 | 0.3435 | 0.4059 | 0.5966 |
| YJ 1-4 | 0.5103 | 0.6031 | 0.8846 | 0.0014 | 0.0016 | 0.0042 | 0.5117 | 0.6047 | 0.8888 |
| YJ 2-1 | 0.1089 | 0.1287 | 0.1888 | 0.0003 | 0.0003 | 0.0009 | 0.1092 | 0.1290 | 0.1897 |
| YJ 2-2 | 0.7180 | 0.8486 | 1.2446 | 0.0019 | 0.0023 | 0.0060 | 0.7199 | 0.8508 | 1.2506 |
| YJ1-1 | 0.1793 | 0.2119 | 0.3108 | 0.0005 | 0.0006 | 0.0015 | 0.1798 | 0.2125 | 0.3123 |
| YJ1-2 | 0.1909 | 0.2256 | 0.3308 | 0.0005 | 0.0006 | 0.0016 | 0.1914 | 0.2262 | 0.3324 |
| YJ1-3 | 0.0029 | 0.0034 | 0.0050 | 0.0000 | 0.0000 | 0.0000 | 0.0029 | 0.0034 | 0.0050 |
| ZH 1-1 | 1.8115 | 2.1409 | 3.1400 | 0.0048 | 0.0057 | 0.0151 | 1.8163 | 2.1466 | 3.1551 |
| ZH 1-2 | 0.1154 | 0.1364 | 0.2000 | 0.0003 | 0.0004 | 0.0010 | 0.1157 | 0.1367 | 0.2010 |
| ZH 1-3 | 1.3877 | 1.6401 | 2.4054 | 0.0037 | 0.0044 | 0.0115 | 1.3914 | 1.6444 | 2.4170 |
| ZJ 1-1 | 1.0505 | 1.2415 | 1.8208 | 0.0028 | 0.0033 | 0.0087 | 1.0533 | 1.2448 | 1.8296 |
| ZJ 1-2 | 2.3743 | 2.8060 | 4.1154 | 0.0063 | 0.0075 | 0.0198 | 2.3806 | 2.8134 | 4.1352 |
| ZJ 1-3 | 0.0002 | 0.0003 | 0.0004 | 0.0000 | 0.0000 | 0.0000 | 0.0002 | 0.0003 | 0.0004 |
| ZJ 2-1 | 0.6988 | 0.8259 | 1.2113 | 0.0019 | 0.0022 | 0.0058 | 0.7007 | 0.8280 | 1.2171 |
| ZJ 2-2 | 0.9894 | 1.1693 | 1.7150 | 0.0026 | 0.0031 | 0.0082 | 0.9921 | 1.1724 | 1.7232 |
| ZJ 2-3 | 0.0118 | 0.0139 | 0.0204 | 0.0000 | 0.0000 | 0.0001 | 0.0118 | 0.0140 | 0.0205 |
| Min | 0.0002 | 0.0003 | 0.0004 | 0.0000 | 0.0000 | 0.0000 | 0.0002 | 0.0003 | 0.0004 |
| Max | 2.7673 | 3.2705 | 4.7967 | 0.0073 | 0.0087 | 0.0230 | 2.7747 | 3.2791 | 4.8197 |
| Mean | 0.7156 | 0.8457 | 1.2404 | 0.0019 | 0.0022 | 0.0060 | 0.7175 | 0.8479 | 1.2463 |
References
- Wang, Z.; Su, Q.; Wang, S.; Gao, Z.; Liu, J. Spatial distribution and health risk assessment of dissolved heavy metals in groundwater of eastern China coastal zone. Environ. Pollut. 2021, 290, 118016. [Google Scholar] [CrossRef] [PubMed]
- Zou, L.; Yao, X.; Yamaguchi, H.; Guo, X.; Gao, X.; Wang, K.; Sun, M. Seasonal and Spatial Variations of Macro Benthos in the Intertidal Mudflat of Southern Yellow River Delta, China in 2007/2008. J. Ocean Univ. China 2018, 17, 233–240. [Google Scholar] [CrossRef]
- Wu, Z.; Wang, X.; Chen, Y.; Cai, Y.; Deng, J. Assessing river water quality using water quality index in Lake Taihu Basin, China. Sci. Total Environ. 2018, 612, 914–922. [Google Scholar] [CrossRef] [PubMed]
- World Health Organization. Guidelines for Drinking-Water Quality, 4th ed.; WHO: Geneva, Switzerland, 2022.
- Han, D.; Song, X.; Matthew, J.; Yang, J.; Xiao, G. Chemical and isotopic constraints on the evolution of groundwater salinization in the coastal plain aquifer of Laizhou Bay, China. J. Hydrol. 2014, 508, 12–27. [Google Scholar] [CrossRef]
- Giri, A.; Bharti, V.; Kalia, S.; Kumar, K.; Khansu, M. Hydrochemical and quality assessment of irrigation water at the trans-himalayan high-altitude regions of Leh, Ladakh, India. Appl. Water Sci. 2022, 12, 197. [Google Scholar] [CrossRef]
- Liu, J.; Gao, Z.; Wang, M.; Li, Y.; Ma, Y.; Shi, M.; Zhang, H. Study on the dynamic characteristics of groundwater in the valley plain of Lhasa City. Environ. Earth Sci. 2018, 77, 646. [Google Scholar] [CrossRef]
- Zhang, T.; Cai, W.; Li, Y.; Geng, T.; Zhang, Z.; Lv, Y.; Miao, Z.; Liu, J. Ion chemistry of groundwater and the possible controls within Lhasa River Basin, SW Tibetan Plateau. Arab. J. Geosci. 2018, 11, 510. [Google Scholar] [CrossRef]
- Xiao, J.; Jin, Z.; Ding, H.; Wang, J.; Zhang, F. Geochemistry and solute sources of surface waters of the Tarim River Basin in the extreme arid region, NW Tibetan Plateau. J. Asian Earth Sci. 2012, 54, 162–173. [Google Scholar] [CrossRef]
- Yang, K.; Liu, W.; Xu, X.; Chen, G.; Liu, Y.; Fu, T.; Wang, C.; Fu, Y. Evaluation of seawater intrusion in typical coastal zones of Hainan Province. Mar. Sci. 2019, 43, 57–60. [Google Scholar]
- Zereg, S.; Boudoukha, A.; Benaabidate, L. Impacts of natural conditions and anthropogenic activities on groundwater quality in Tebessa plain, Algeria. Sustain. Environ. Res. 2018, 28, 340–349. [Google Scholar] [CrossRef]
- Huang, G.; Sun, J.; Zhang, Y.; Chen, Z.; Liu, F. Impact of anthropogenic and natural processes on the evolution of groundwater chemistry in a rapidly urbanized coastal area, South China. Sci. Total Environ. 2013, 463, 209–221. [Google Scholar] [CrossRef] [PubMed]
- Huang, G.; Liu, C.; Li, L.; Zhang, F.; Chen, Z. Spatial distribution and origin of shallow groundwater iodide in a rapidly urbanized delta: A case study of the Pearl River Delta. J. Hydrol. 2020, 585, 124860. [Google Scholar] [CrossRef]
- Tiwari, A.; Ghione, R.; Maio, M.; Lavy, M. Evaluation of hydrogeochemical processes and groundwater quality for suitability of drinking and irrigation purposes: A case study in the Aosta Valley region, Italy. Arab. J. Geosci. 2017, 10, 264. [Google Scholar] [CrossRef]
- Han, Z.; Ma, H.; Shi, G.; He, L.; Wei, L.; Shi, Q. A review of groundwater contamination near municipal solid waste landfill sites in China. Sci. Total Environ. 2016, 569, 1255–1264. [Google Scholar] [CrossRef]
- Hou, Q.; Zhang, Q.; Huang, G.; Liu, C.; Zhang, Y. Elevated manganese concentrations in shallow groundwater of various aquifers in a rapidly urbanized delta, south China. Sci. Total Environ. 2020, 701, 134777. [Google Scholar] [CrossRef]
- Shi, G.; Chen, Z.; Bi, C.; Wang, L.; Teng, J.; Li, Y.; Xu, S. A comparative study of health risk of potentially toxic metals in urban and suburban road dust in the most populated city of China. Atmos. Environ. 2011, 45, 764–771. [Google Scholar] [CrossRef]
- Li, J.; Zhou, H.; Qian, K.; Xie, X.; Xue, X.; Yang, Y.; Wang, Y. Fluoride and iodine enrichment in groundwater of North China Plain: Evidences from speciation analysis and geochemical modeling. Sci. Total Environ. 2017, 598, 239–248. [Google Scholar] [CrossRef]
- Rao, N.; Dinakar, A.; Kumari, B. Appraisal of vulnerable zones of non-cancer-causing health risks associated with exposure of nitrate and fluoride in groundwater from a rural part of India. Environ. Res. 2021, 202, 111674. [Google Scholar] [CrossRef]
- Rao, N.; Dinakar, A.; Sun, L. Estimation of groundwater pollution levels and specific ionic sources in the groundwater, using a comprehensive approach of geochemical ratios, pollution index of groundwater, unmix model and land use/land cover—A case study. J. Contam. Hydrol. 2022, 248, 103990. [Google Scholar]
- Rao, N.; Sunitha, B.; Sun, L.; Spandana, B.; Chaudhary, M. Mechanisms controlling groundwater chemistry and assessment of potential health risk: A case study from South India. Geochemistry 2019, 80, 125568. [Google Scholar]
- Wang, Y.; Jiao, J.; Cherry, J. Occurrence and geochemical behavior of arsenic in a coastal aquifer–aquitard system of the Pearl River Delta, China. Sci. Total Environ. 2012, 427, 286–297. [Google Scholar] [CrossRef] [PubMed]
- Maharana, C.; Gautam, S.; Singh, A.; Tripathi, J. Major ion chemistry of the Son River, India: Weathering processes, dissolved fluxes and water quality assessment. J. Earth Syst. Sci. 2015, 124, 1293–1309. [Google Scholar] [CrossRef]
- Marghade, D.; Malpe, D.; Rao, N. Identification of controlling processes of groundwater quality in a developing urban area using principal component analysis. Environ. Earth Sci. 2015, 74, 5919–5933. [Google Scholar] [CrossRef]
- Xiao, J.; Jin, Z.; Wang, J.; Zhang, F. Hydrochemical characteristics, controlling factors and solute sources of groundwater within the Tarim River Basin in the extreme arid region, NW Tibetan Plateau. Quat. Int. 2020, 380, 237–246. [Google Scholar] [CrossRef]
- Li, P.; Zhang, Y.; Yang, N.; Jing, L.; Yu, P. Major ion chemistry and quality assessment of groundwater in and around a mountainous tourist town of China. Water Qual. Expo. Health 2016, 8, 239–252. [Google Scholar] [CrossRef]
- Xing, L.; Huang, L.; Hou, X.; Yang, L.; Chi, G.; Xu, J.; Zhu, H. Groundwater Hydrochemical Zoning in Inland Plains and its Genetic Mechanisms. Water 2018, 10, 752. [Google Scholar] [CrossRef]
- Kamtchueng, B.; Antong.; Wirmvem, M.; Tiodjio, R.; Takounjou, A.; Ngoupayou, J.; Kusakabe, M.; Zhang, J.; Ohba, T.; Tanyileke, G.; et al. Hydrogeochemistry and quality of surface water and groundwater in the vicinity of Lake Monoun, West Cameroon: Approach from multivariate statistical analysis and stable isotopic characterization. Environ. Monit. Assess. 2016, 188, 524. [Google Scholar] [CrossRef]
- Flexer, V.; Fernando, C.; Ines, C. Lithium recovery from brines: A vital raw material for green energies with a potential environmental impact in its mining and processing. Sci. Total Environ. 2018, 639, 1188–1204. [Google Scholar] [CrossRef]
- Wang, G.; Zeng, C.; Zhang, F.; Zhang, Y.; Scott, C.; Yan, X. Traffic related trace elements in soils along six highway segments on the Tibetan Plateau: Influence factors and spatial variation. Sci. Total Environ. 2017, 581, 811–821. [Google Scholar] [CrossRef]
- Tamasi, G.; Cini, R. Heavy metals in drinking waters from Mount Amiata (Tuscany, Italy). Possible risks from arsenic for public health in the Province of Siena. Sci. Total Environ. 2004, 327, 41–51. [Google Scholar] [CrossRef]
- Krishna, K.; Hari, B.; Eswar, R.; Selvakumar, S.; Thivya, C.; Muralidharan, S.; Jeyabal, G. Evaluation of water quality and hydrogeochemistry of surface and groundwater, Tiruvallur District, Tamil Nadu, India. Appl Water Sci. 2016, 7, 2533–2544. [Google Scholar] [CrossRef]
- Mgbenu, C.; Egbueri, J. The hydrogeochemical signatures, quality indices and health risk assessment of water resources in Umunya district, Southeast Nigeria. Appl Water Sci. 2019, 9, 22. [Google Scholar] [CrossRef]
- Chen, J.; Qian, H.; Wu, H. Nitrogen contamination in groundwater in an agricultural region along the New Silk Road, northwest China: Distribution and factors controlling its fate. Environ. Sci. Pollut. Res. 2017, 24, 13154–13167. [Google Scholar] [CrossRef] [PubMed]
- Rajas, A.; Pacheco, J.; Esteller, M.; Cabrera, S.; Camargo, M. Spatial distribution of nitrate health risk associated with groundwater use as drinking water in Merida, Mexico. Appl. Geogr. 2015, 65, 49–57. [Google Scholar] [CrossRef]
- Singh, G.; Rishi, M.S.; Herojeet, R.; Kaur, L.; Sharma, K. Evaluation of groundwater quality and human health risks from fluoride and nitrate in the semi-arid region of northern India. Environ. Geochem. Health 2020, 42, 1833–1862. [Google Scholar] [CrossRef]
- Liu, T.; Xu, S.; Lu, S.Y.; Qin, P.; Bi, B.; Ding, H.; Liu, Y.; Guo, X.; Liu, X. A review on removal of organophosphorus pesticides in constructed wetland: Performance, mechanism and influencing factors. Sci. Total. Environ. 2019, 651, 2247–2268. [Google Scholar] [CrossRef]
- Huang, G.; Liu, C.; Sun, J.; Zhang, M.; Jing, J.; Li, L. A regional scale investigation on factors controlling the groundwater chemistry of various aquifers in a rapidly urbanized area: A case study of the Pearl River Delta. Sci. Total Environ. 2018, 625, 510–518. [Google Scholar] [CrossRef]
- Rao, N. Nitrate pollution and its distribution in the groundwater of Srikakulam district, Andhra Pradesh, India. Environ. Geol. 2006, 51, 631–645. [Google Scholar] [CrossRef]
- Gou, L.; Jin, Z.; Galy, A.; Gong, Y.; Nan, X.; Jin, C.; Wang, X.; Bouchez, J.; Cai, H.; Chen, J.; et al. Seasonal riverine barium isotopic variation in the middle Yellow River: Sources and fractionation. Earth Planet. Sci. 2020, 531, 115990. [Google Scholar] [CrossRef]
- Adimalla, N.; Qian, H. Groundwater quality evaluation using water quality index (WQI) for drinking purposes and human health risk (HHR) assessment in an agricultural region of Nanganur, south India. Ecotoxicol. Environ. Saf. 2019, 176, 153–161. [Google Scholar] [CrossRef]
- Fan, B.; Zhao, Z.; Tao, F.; Liu, B.; Tao, Z.; Gao, S.; Zhang, L. Characteristics of carbonate, evaporite and silicate weathering in Huanghe River basin: A comparison among the upstream, midstream and downstream. J. Asian Earth Sci. 2014, 96, 17–26. [Google Scholar] [CrossRef]
- Huan, H.; Zhang, B.; Kong, H.; Li, M.; Wang, W.; Xi, B.; Wang, G. Comprehensive assessment of groundwater pollution risk based on HVF model: A case study in Jilin City of northeast China. Sci. Total Environ. 2018, 628, 1518–1530. [Google Scholar] [CrossRef] [PubMed]
- Ahmed, N.; Bodrud, M.; Islam, A.; Hossain, S.; Moniruzzaman, M.; Deb, N.; Bhuiyan, M. Appraising spatial variations of As, Fe, Mn and NO3 contaminations associated health risks of drinking water from Surma basin. Bangladesh. Chemosphere 2019, 218, 726–740. [Google Scholar] [CrossRef] [PubMed]
- Ustaoglu, F.; Tepe, Y.; Tas, B. Assessment of stream quality and health risk in a subtropical Turkey river system: A combined approach using statistical analysis and water quality index. Ecol. Indic. 2020, 113, 105815. [Google Scholar] [CrossRef]
- US EPA. Pesticide. United States Environmental Protection Agency, Integrated Risk Information System (IRIS); US EPA: Washington, DC, USA, 2017; pp. 200–300.
- Zhai, Y.; Zheng, F.; Zhao, X.; Xia, X.; Teng, Y. Identification of hydrochemical genesis and screening of typical groundwater pollutants impacting human health: A case study in Northeast China. Environ. Pollut. 2019, 252, 1202–1205. [Google Scholar] [CrossRef]
- Gao, Z.; Han, C.; Xu, Y.; Zhao, Z.; Luo, Z.; Liu, J. Assessment of the water quality of groundwater in Bohai Rim and the controlling factors—A case study of northern Shandong Peninsula, north China. Environ. Pollut. 2021, 285, 117482. [Google Scholar] [CrossRef]
- Liu, G.; Wang, J.; Zhang, E.; Jing, H.; Liu, X. Heavy metal speciation and risk assessment in dry land and paddy soils near mining areas at Southern China. Environ. Sci. Pollut. Res. 2016, 23, 8709–8720. [Google Scholar] [CrossRef]
- Xu, Y.; Dai, S.; Meng, K.; Wang, Y.; Ren, W.; Zhao, L.; Christie, P.; Teng, Y. Occurrence and risk assessment of potentially toxic elements and typical organic pollutants in contaminated rural soils. Sci. Total Environ. 2018, 630, 618–629. [Google Scholar] [CrossRef]
- Yang, Q.; Li, Z.; Ma, H.; Wang, L.; Martin, J. Identification of the hydrogeochemical processes and assessment of groundwater quality using classic integrated geochemical methods in the Southeastern part of Ordos basin, China. Environ. Pollut. 2016, 218, 879–888. [Google Scholar] [CrossRef]
- Yang, Y.; Meng, Z.; Jiao, W. Hydrological and pollution processes in mining area of Fenhe River Basin in China. Environ. Pollut. 2018, 234, 743–750. [Google Scholar] [CrossRef]
- Aiuppa, A.; D’Alessandro, W.; Federico, C. The aquatic geochemistry of arsenic in volcanic groundwaters from southern Italy. Appl. Geochem. 2003, 18, 1283–1296. [Google Scholar] [CrossRef]
- Güler, C.; Kurt, M.; Alpaslan, M.; Akbulut, C. Assessment of the impact of anthropogenic activities on the groundwater hydrology and chemistry in Tarsus coastal plain (Mersin, SE Turkey) using fuzzy clustering, multivariate statistics and GIS techniques. J. Hydrol. 2012, 414, 435–451. [Google Scholar] [CrossRef]
- Gao, Y.; Qian, H.; Ren, W.; Wang, H.; Liu, F.; Yang, F. Hydrogeochemical characterization and quality assessment of groundwater based on integrated-weight water quality index in a concentrated urban area. J. Clean. Prod. 2020, 260, 121006. [Google Scholar] [CrossRef]
- Piper, A. A graphic procedure in the geochemical interpretation of water analyses. Eos Trans. Am. Geophys. Union 1944, 25, 914–928. [Google Scholar] [CrossRef]
- Gibbs, R. Mechanisms controlling world water chemistry. Science 1970, 170, 1088–1090. [Google Scholar] [CrossRef] [PubMed]
- Gao, Y.; Qian, H.; Wang, H.; Chen, J.; Ren, W.; Yang, F. Assessment of background levels and pollution sources for arsenic and fluoride in the phreatic and confined groundwater of Xi’an city, Shaanxi, China. Environ. Sci. Pollut. Res. Int. 2020, 27, 34702–34714. [Google Scholar] [CrossRef] [PubMed]
- Li, P.; Wu, J.; Qian, H. Hydrochemical appraisal of groundwater quality for drinking and irrigation purposes and the major influencing factors: A case study in and around Hua County, China. Arab. J. Geosci. 2015, 9, 15. [Google Scholar] [CrossRef]
- Liu, J.; Gao, Z.; Wang, Z.; Xu, X.; Su, Q.; Wang, S.; Qu, W.; Xing, T. Hydrogeochemical processes and suitability assessment of groundwater in the Jiaodong Peninsula, China. Environ. Monit. Assess. 2020, 192, 384. [Google Scholar] [CrossRef]


| Parameters (mg/L) | WHO Standards (2022) | Relative Weight | |
|---|---|---|---|
| TDS | 500 | 5 | 0.128 |
| Bicarbonate | 500 | 1 | 0.0256 |
| Chloride | 250 | 5 | 0.128 |
| Sulphate | 200 | 5 | 0.128 |
| Nitrate | 45 | 5 | 0.128 |
| Calcium | 75 | 3 | 0.0769 |
| Magnesium | 30 | 3 | 0.0769 |
| Sodium | 200 | 5 | 0.128 |
| Potassium | 12 | 2 | 0.0523 |
| Fluoride | 1.5 | 5 | 0.128 |
| Parameters | Units | Minimum | Maximum | Mean | SD | CV | DWQI |
|---|---|---|---|---|---|---|---|
| Na+ | mg/L | 14.03 | 1590 | 121.97 | 296.47 | 2.43 | 200 |
| K+ | mg/L | 1.04 | 264.8 | 25.7 | 50.93 | 1.98 | 12 |
| Ca+ | mg/L | 0.8 | 282.7 | 38.87 | 56.67 | 1.46 | 75–200 |
| Mg2+ | mg/L | 0.46 | 275.6 | 20.7 | 57.77 | 2.79 | 30–100 |
| HCO3− | mg/L | 15.62 | 917.6 | 165.34 | 161.99 | 0.98 | - |
| Cl− | mg/L | 3.64 | 18,441.76 | 1009.5 | 4076.78 | 4.04 | 250–1000 |
| SO42- | mg/L | 0.74 | 2238.06 | 137.82 | 464.21 | 3.37 | 150–400 |
| NO3− | mg/L | 0.12 | 115.12 | 30.55 | 32.89 | 1.08 | 45 |
| TDS | mg/L | 27.95 | 31,245 | 1935.26 | 6808.76 | 3.52 | 500–2000 |
| EC | μs/cm | 0.04 | 48.16 | 2.98 | 10.48 | 3.52 | - |
| ORP | mv | −132.6 | −7.5 | −75.23 | 30.76 | −0.41 | - |
| pH | / | 5.51 | 8.2 | 7.18 | 0.58 | 0.08 | 6.5–8.5 |
| δD | ‰ | −52.68 | −27.99 | −39.26 | 10.61 | −0.27 | - |
| δ18O | ‰ | −7.36 | −4.33 | −5.97 | 0.67 | −0.11 | - |
| Component | Initial Eigenvalue | Extract the Sum of Load Squares | Component | ||||||
|---|---|---|---|---|---|---|---|---|---|
| Total | Variance Percentage | Cumulate % | Total | Variance Percentage | Cumulate % | 1 | 2 | ||
| 1 | 8.519 | 70.993 | 70.993 | 8.519 | 70.993 | 70.993 | Cl | 0.987 | 0.110 |
| 2 | 2.000 | 16.663 | 87.656 | 2.000 | 16.663 | 87.656 | NO3 | - | −0.722 |
| 3 | 0.684 | 5.698 | 93.354 | SO4 | 0.981 | 0.103 | |||
| 4 | 0.613 | 5.111 | 98.465 | HCO3 | 0.696 | - | |||
| 5 | 0.077 | 0.643 | 99.108 | Na | 0.959 | - | |||
| 6 | 0.057 | 0.473 | 99.581 | K | 0.956 | - | |||
| 7 | 0.029 | 0.244 | 99.825 | Ca | 0.960 | - | |||
| 8 | 0.015 | 0.128 | 99.953 | Mg | 0.989 | - | |||
| 9 | 0.004 | 0.035 | 99.988 | TDS | 0.990 | 0.107 | |||
| 10 | 0.001 | 0.012 | 100.000 | EC | 0.990 | 0.106 | |||
| 11 | 0 | 0 | 100.000 | ORP | 0.471 | −0.822 | |||
| 12 | 0 | 0 | 100.000 | PH | −0.430 | 0.854 | |||
Publisher’s Note: MDPI stays neutral with regard to jurisdictional claims in published maps and institutional affiliations. |
© 2022 by the authors. Licensee MDPI, Basel, Switzerland. This article is an open access article distributed under the terms and conditions of the Creative Commons Attribution (CC BY) license (https://creativecommons.org/licenses/by/4.0/).
Share and Cite
Li, C.; Fu, T.; Fu, Y.; Wang, Z.; Li, B.; Qi, C.; Chen, G.; Xu, X.; Yu, H. Origin and Implications of Pollution in Coastal Groundwater of the Guangdong Province. J. Mar. Sci. Eng. 2022, 10, 1394. https://doi.org/10.3390/jmse10101394
Li C, Fu T, Fu Y, Wang Z, Li B, Qi C, Chen G, Xu X, Yu H. Origin and Implications of Pollution in Coastal Groundwater of the Guangdong Province. Journal of Marine Science and Engineering. 2022; 10(10):1394. https://doi.org/10.3390/jmse10101394
Chicago/Turabian StyleLi, Chenzhe, Tengfei Fu, Yushan Fu, Zhenyan Wang, Bin Li, Chen Qi, Guangquan Chen, Xingyong Xu, and Hongjun Yu. 2022. "Origin and Implications of Pollution in Coastal Groundwater of the Guangdong Province" Journal of Marine Science and Engineering 10, no. 10: 1394. https://doi.org/10.3390/jmse10101394
APA StyleLi, C., Fu, T., Fu, Y., Wang, Z., Li, B., Qi, C., Chen, G., Xu, X., & Yu, H. (2022). Origin and Implications of Pollution in Coastal Groundwater of the Guangdong Province. Journal of Marine Science and Engineering, 10(10), 1394. https://doi.org/10.3390/jmse10101394