
Numerical Analysis for Performance and the Combustion Reactants of the Crankcase Explosion Relief Valve


Abstract
:1. Introduction
2. Methodology
3. Results

| Combustion Products | Value |
|---|---|
| CO2 | 44.01 kg/mol |
| H2O | 18.01 kg/mol |
| N2 | 28.01 kg/mol |
4. Conclusions
- (1)
- The results of numerical analysis for temperature, pressure, CH4 mass fraction, and combustion products inside the chamber after the explosion met the standards of IACS and the engine manufacturer MAN-ES.
- (2)
- After the combustion reaction of methane, the temperature was 2337 K and 2383 K at the measurement points P1 and P2, respectively. The maximum temperature inside the chamber was 2636 K. It was lower than the combustion temperature of 2823 K from the theoretical calculation, and the flame speed of 17.27 m/s could be calculated using the combustion temperature of the two points.
- (3)
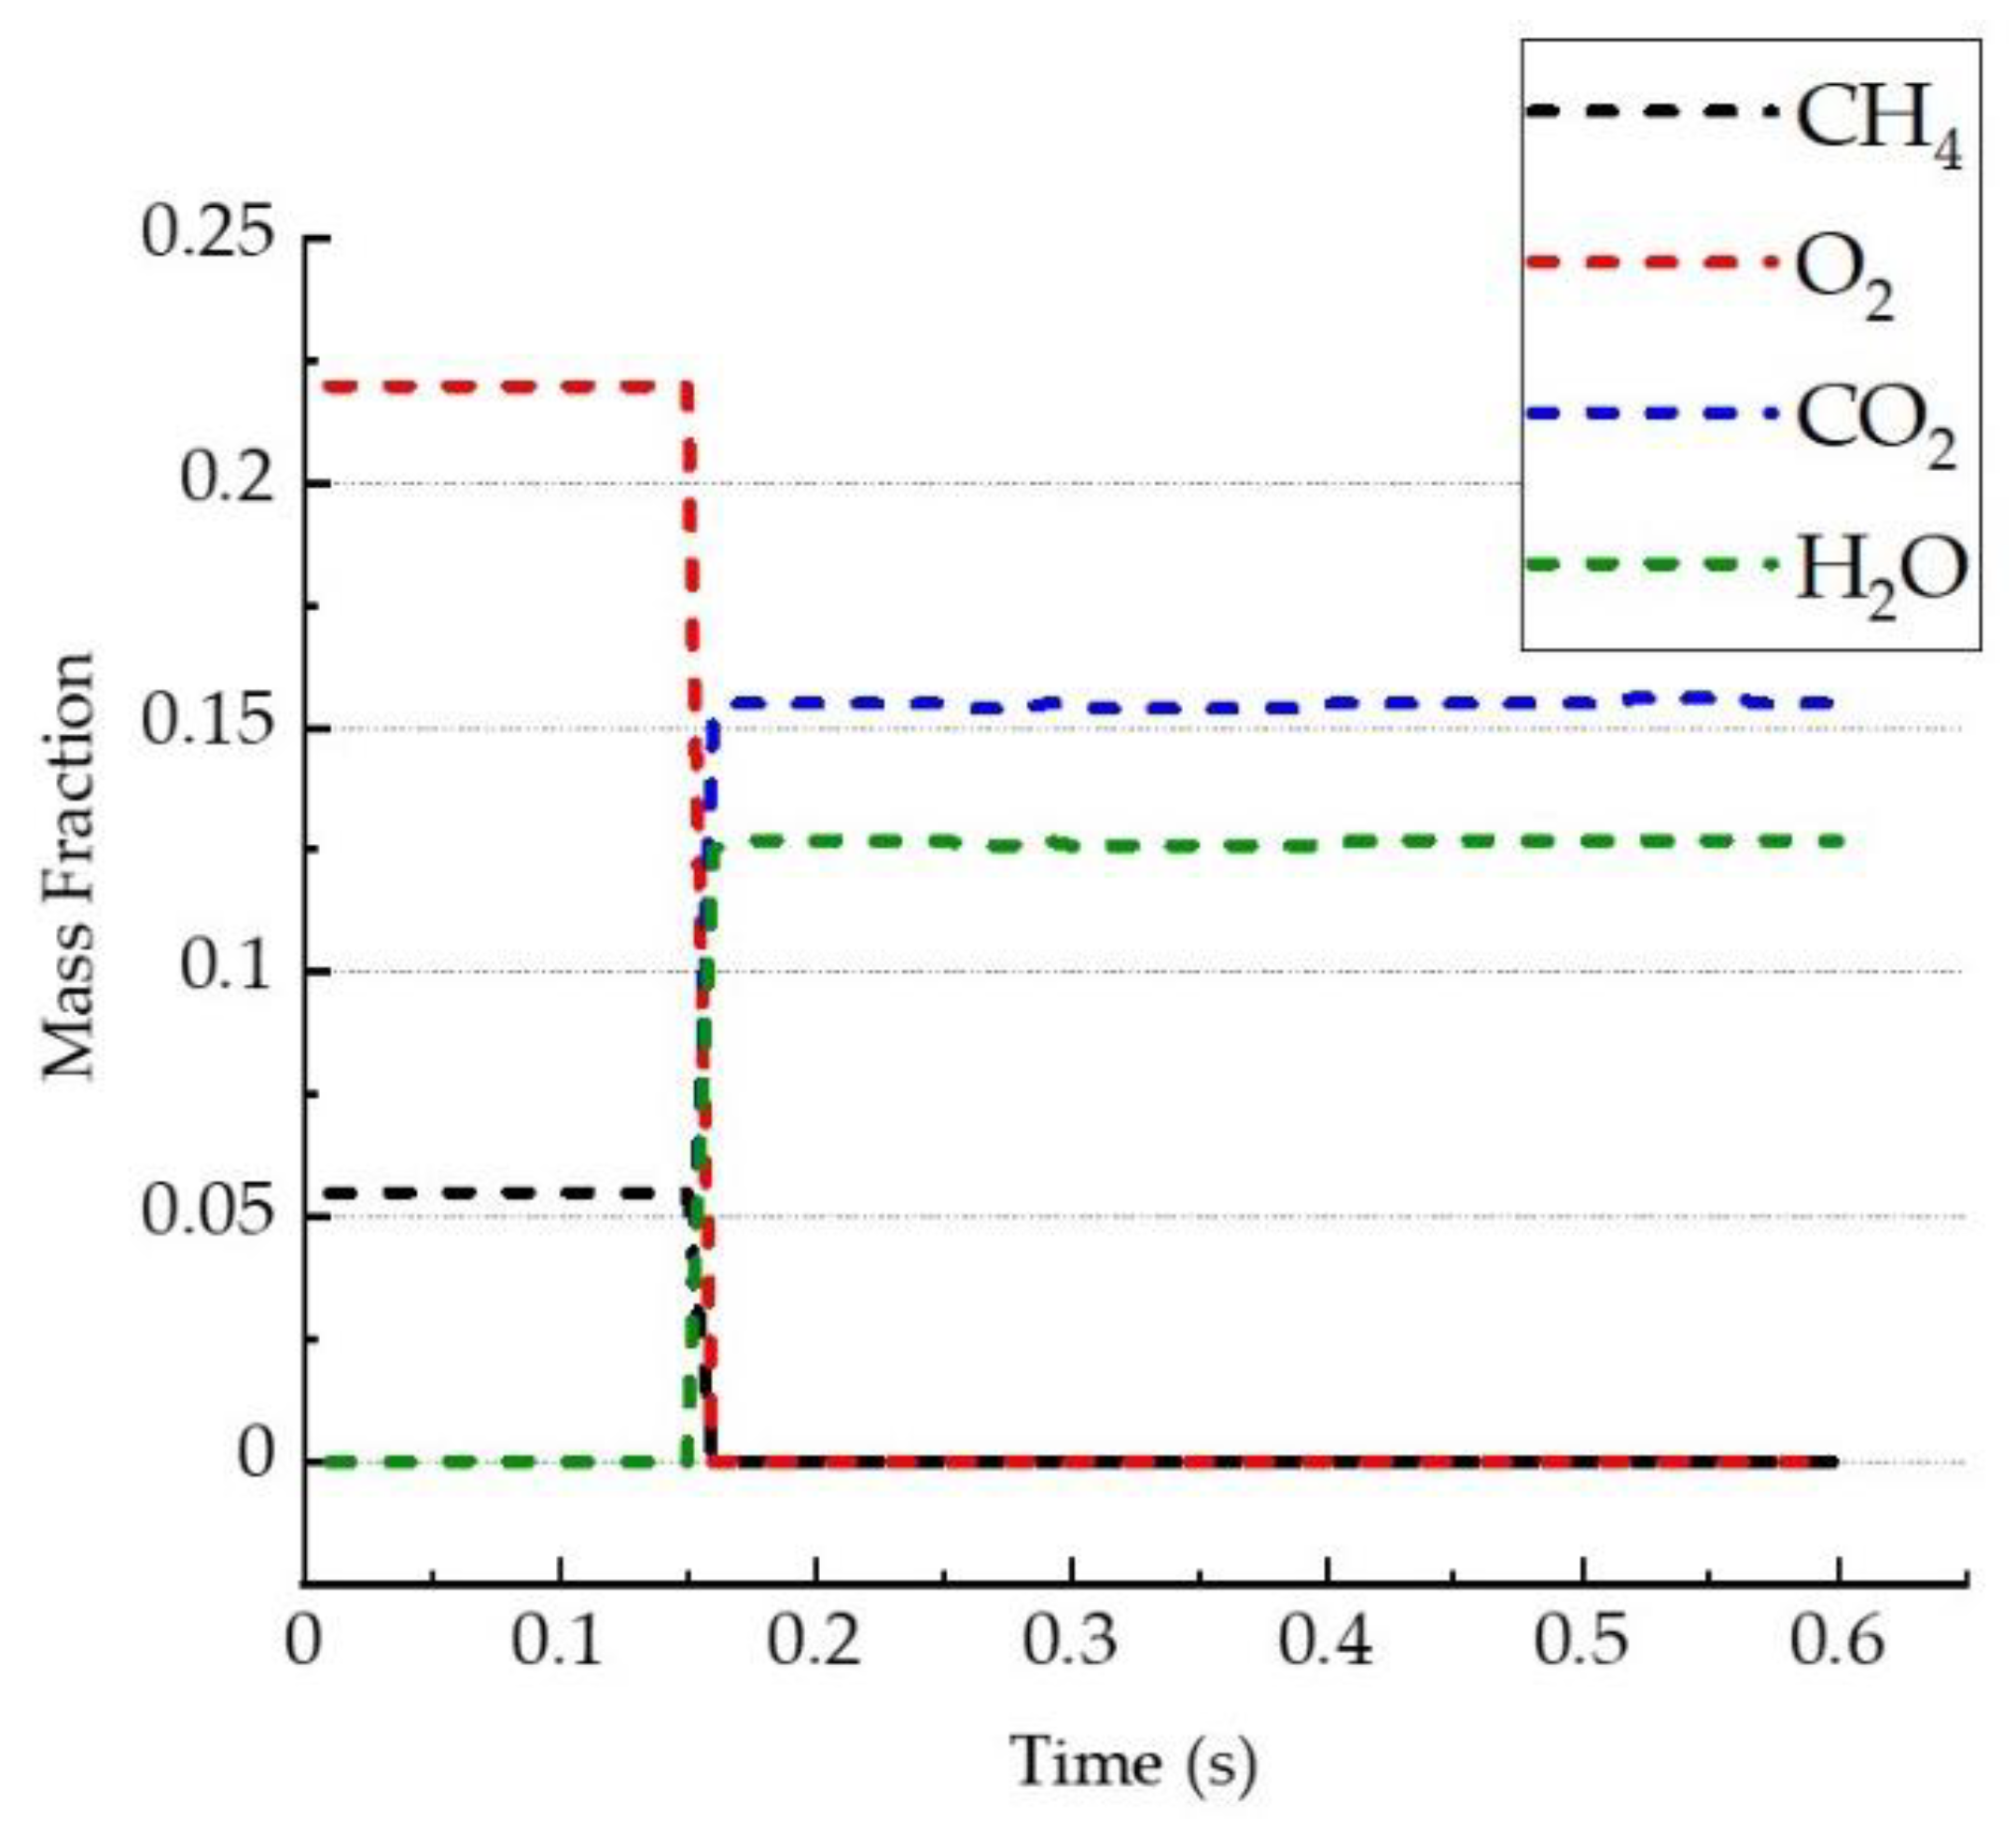
- The mass fractions of CO2 and H2O, i.e., combustion products, were 0.151 and 0.127, respectively, which were similar to the theoretical calculation using the chemical equation.
- (4)
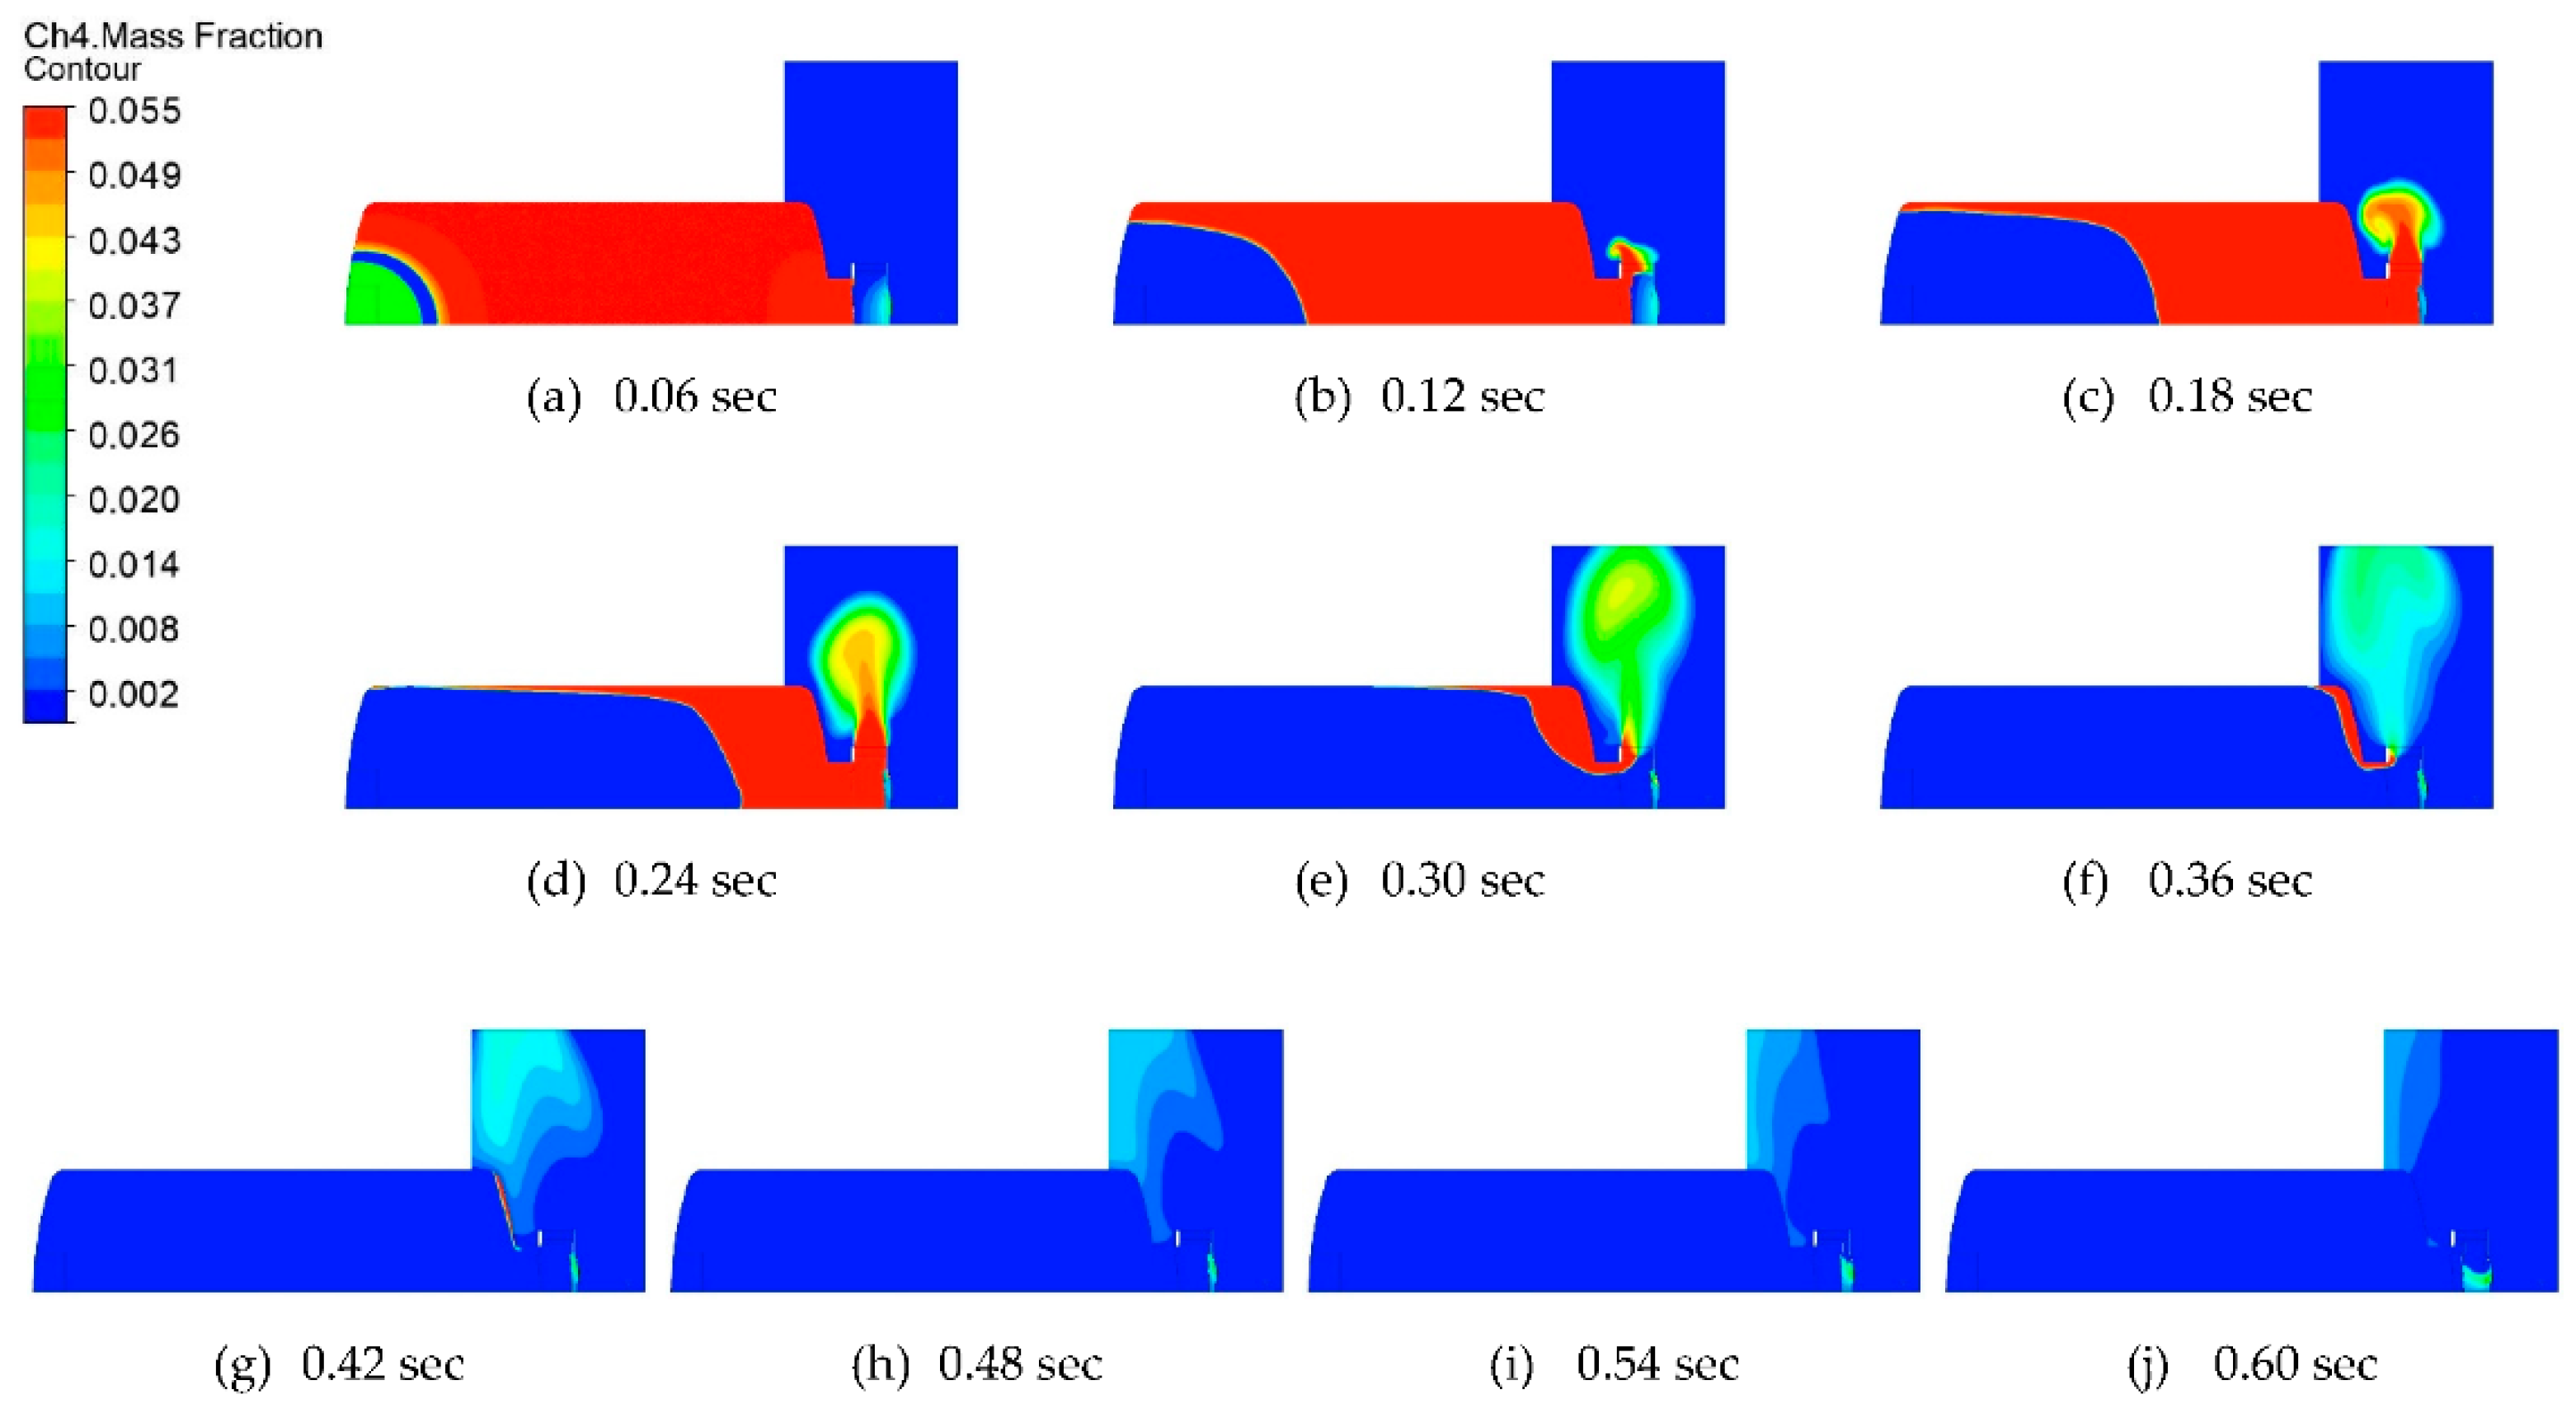
- The amount of CH4 remaining inside the chamber after the explosion was not enough to cause a secondary explosion, so the stability of CERV was verified.
- (5)
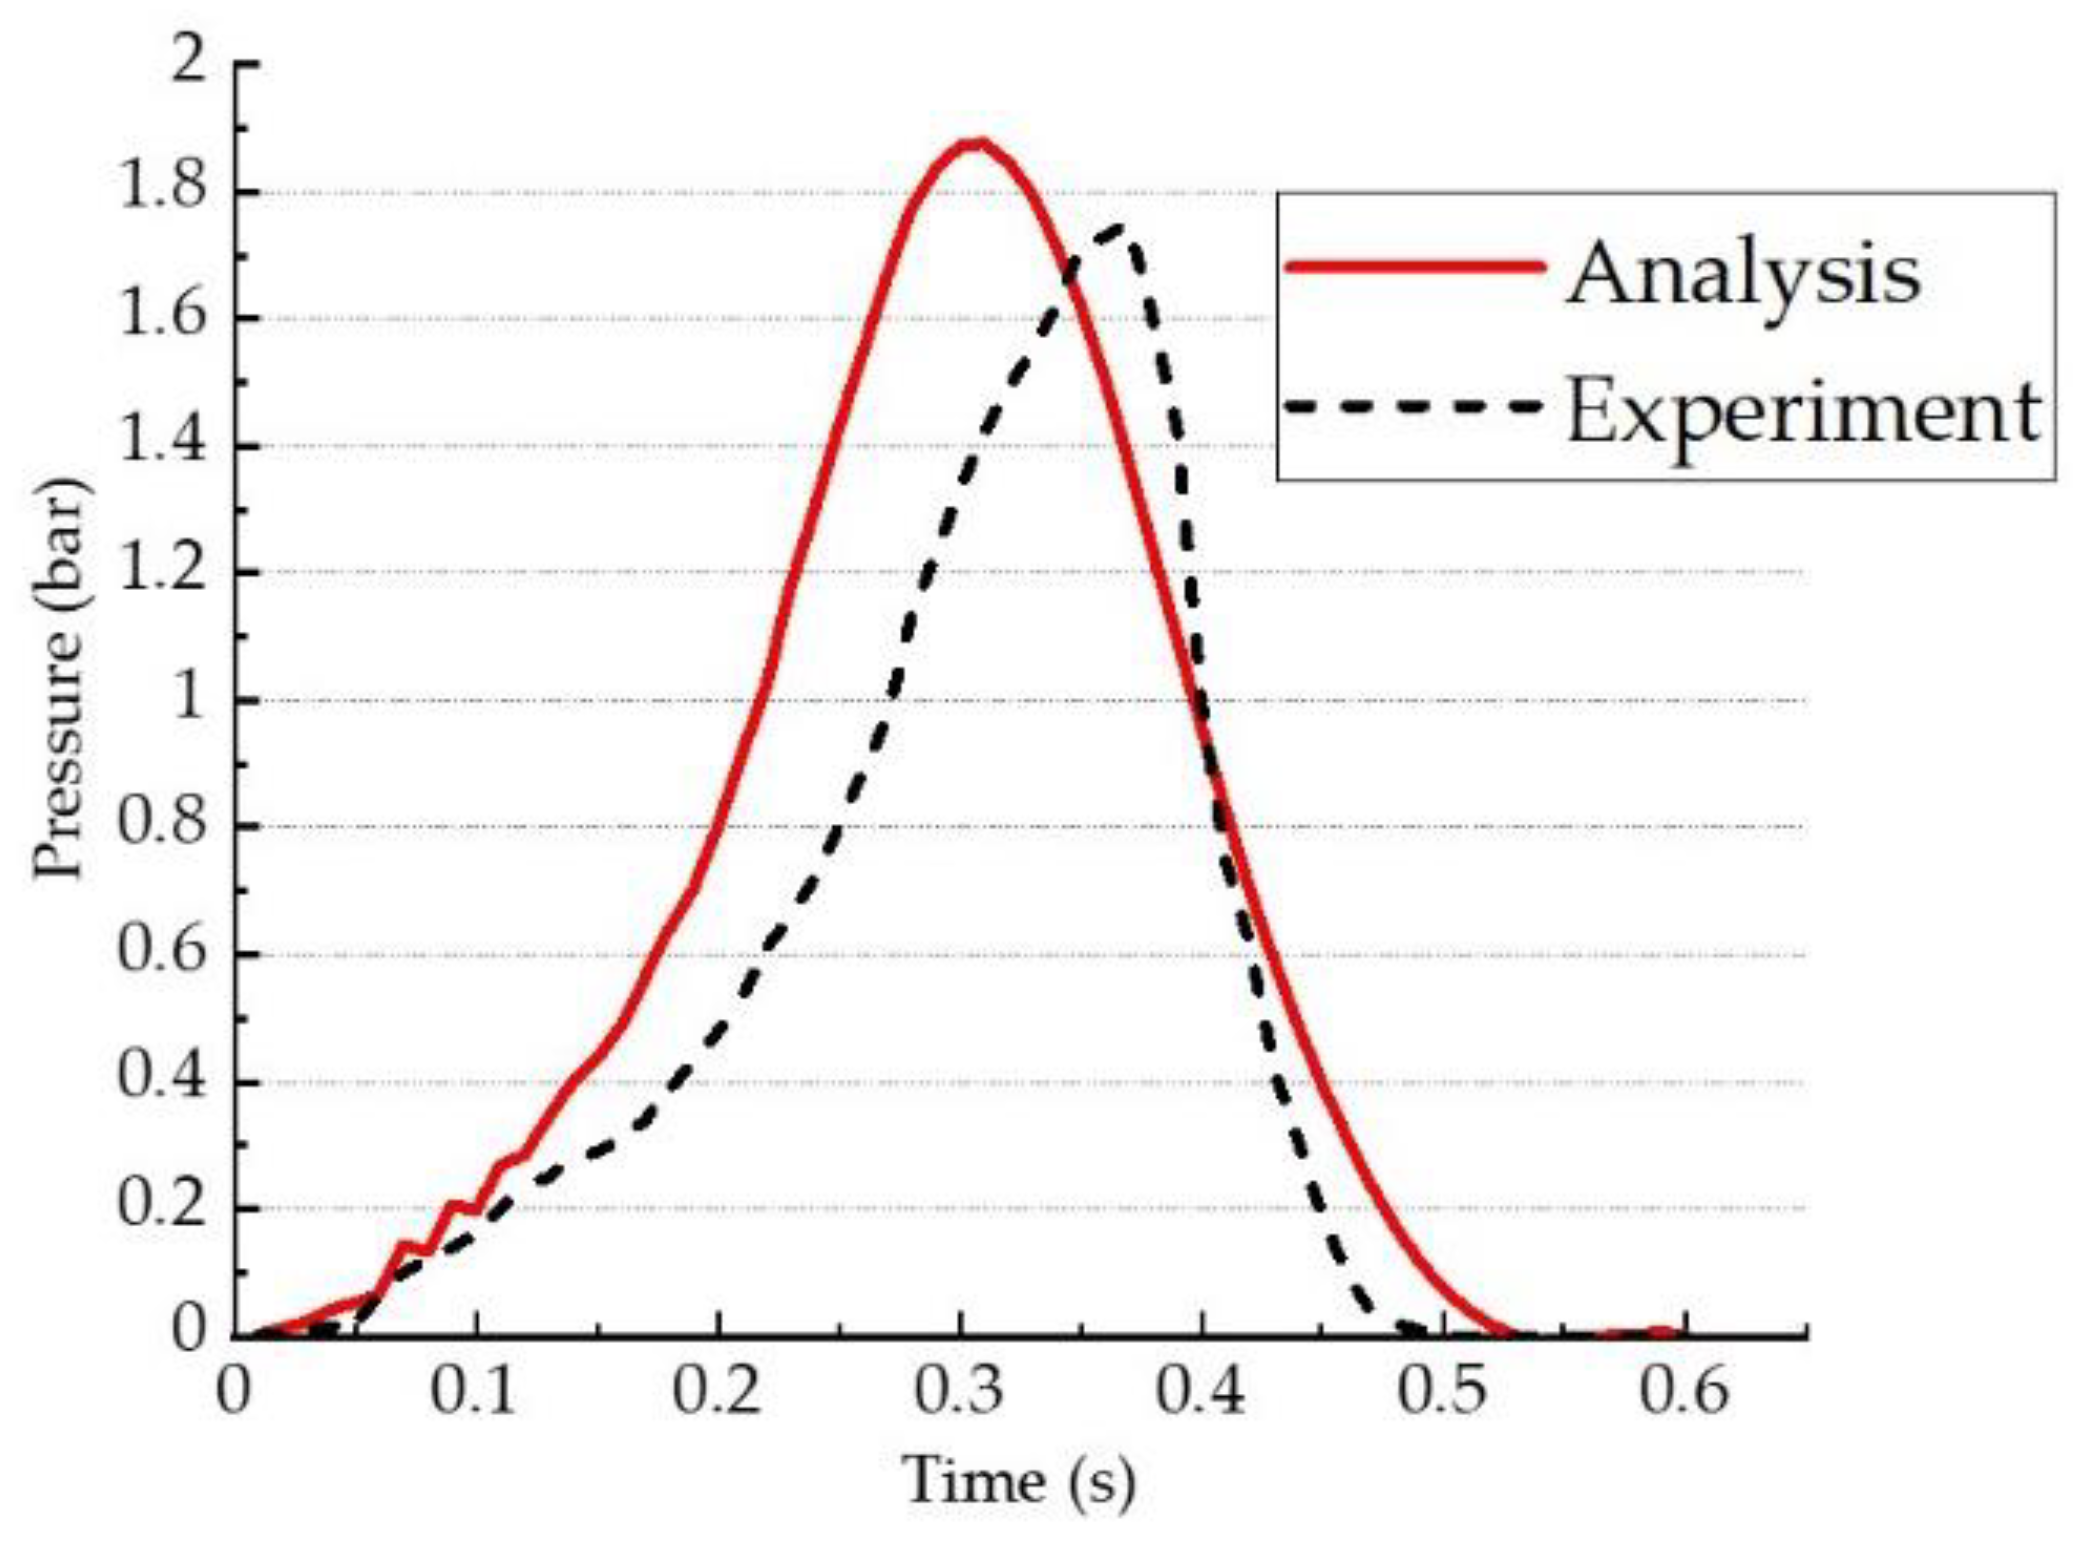
- From the numerical analysis results, the pressures at points P1 and P2 were 1.87 bar and 1.66 bar, with differences of 6.4% and 4.0% compared to the experimental results. Therefore, it is judged that the numerical analysis results have accuracy and reliability compared to the experimental results.
Author Contributions
Funding
Institutional Review Board Statement
Informed Consent Statement
Data Availability Statement
Conflicts of Interest
References
- Woodyard, D. Pounder’s Marine Diesel Engines and Gas Turbines, 9th ed.; Butterworth-Heinemann Elsevier Ltd.: Oxford, UK, 2009. [Google Scholar]
- International Association of Classification Societies. Crankcase Explosion Relief Valves for Crankcases of Internal Combustion Engines; IACS: Kolkata West Bengal, India, 2007; pp. 1–2. [Google Scholar]
- International Association of Classification Societies. Type Testing Procedure for Crankcase Explosion Relief Valves; IACS: Kolkata West Bengal, India, 2008; pp. 1–8. [Google Scholar]
- Prosave Co., Ltd. Explosion Relief Valve. KR Patent 10-1800799, 17 November 2017. [Google Scholar]
- MAN Energy Solutions. Crankcase Relief Valve Prevention and Damage Control. Service Letter No. SL09-512/CAA; MAN Energy Solutions: Augsburg, Germany, 2009. [Google Scholar]
- Cammarota, F.; Di Benedetto, A.; Russo, P.; Salzano, E. Experimental analysis of gas explosions at non-atmospheric initial conditions in cylindrical vessel. Process Saf. Environ. Prot. 2010, 88, 341–349. [Google Scholar] [CrossRef]
- Salzano, E.; Cammarota, F.; Di Benedetto, A.; Di Sarli, V. Explosion behavior of hydrogen–methane/air mixtures. J. Loss Prev. Process Ind. 2012, 25, 443–447. [Google Scholar] [CrossRef]
- Bartknecht, W. Explosions—Course, Prevention, Protection; Springer: Berlin, Germany, 1981. [Google Scholar]
- Cashdollar, K.L.; Zlochower, I.A.; Green, G.M.; Thomas, R.A.; Hertzberg, M. Flammability of methane, propane, and hydrogen gases. J. Loss Prev. Proc. 2000, 13, 327–340. [Google Scholar] [CrossRef]
- Wang, Q.; Sun, Y.; Li, X.; Shu, C.-M.; Wang, Z.; Jiang, J.; Zhang, M.; Cheng, F. Process of Natural Gas Explosion in Linked Vessels with Three Structures Obtained Using Numerical Simulation. Processes 2020, 8, 52. [Google Scholar] [CrossRef]
- Prodan, M.; Ghicioi, E.; Laszlo, R.; Nalboc, I.; Suvar, S.; Nicola, A. Experimental and Numerical Study of Ignition and Flame Propagation for Methane–Air Mixtures in Small Vessels. Processes 2021, 9, 998. [Google Scholar] [CrossRef]
- Maremonti, M.; Russo, G.; Salzano, E.; Tufano, V. Numerical simulation of gas explosions in linked vessels. J. Loss Prev. Process Ind. 1999, 12, 189–194. [Google Scholar] [CrossRef]
- Phylaktou, H.; Andrews, G.E. Gas explosions in linked vessels. J. Loss Prev. Process Ind. 1993, 6, 15–19. [Google Scholar] [CrossRef]
- Deng, J.; Cheng, F.; Song, Y.; Luo, Z.; Zhang, Y. Experimental and simulation studies on the influence of carbon monoxide on explosion characteristics of methane. J. Loss Prev. Process Ind. 2015, 36, 45–53. [Google Scholar] [CrossRef]
- Ferrara, G.; Willacy, S.K.; Phylaktou, H.N.; Andrews, G.E.; Di Benedetto, A.; Salzano, E.; Russo, G. Venting of gas explosion through relief ducts: Interaction between internal and external explosions. J. Hazard. Mater. 2008, 155, 358–368. [Google Scholar] [CrossRef] [PubMed]
- Di Sarli, V.; Di Benedetto, A.; Russo, G. Using Large Eddy Simulation for understanding vented gas explosions in the presence of obstacles. J. Hazard. Mater. 2009, 169, 435–442. [Google Scholar] [CrossRef] [PubMed]
- Kang, J.; Yuan, Z.; Tariq Sadiq, M. Numerical Simulation and Experimental Research on Flow Force and Pressure Stability in a Nozzle-Flapper Servo Valve. Processes 2020, 8, 1404. [Google Scholar] [CrossRef]
- Kim, J.H.; Kong, K.J.; Jeong, T.Y. Performance test of crankcase explosion relief valve for large ship diesel engines. Korean Soc. Fishries Sci. Educ. 2019, 31, 1380–1386. [Google Scholar]
- Kong, K.J.; Koh, D.K.; Mun, H.U.; Kim, J.H. Numerical analysis for methane explosion in closed spaces. J. Adv. Mar. Eng. Technol. 2021, 45, 174–180. [Google Scholar] [CrossRef]
- Kim, J.H.; Kang, S.W.; Kong, K.J. Structure modifications of crankcase explosion relief valve for cost savings in large ship engines. J. Adv. Mar. Eng. Technol. 2021, 45, 114–121. [Google Scholar] [CrossRef]
- Li, Z.; Wu, J.; Liu, M.; Li, Y.; Ma, Q. Numerical Analysis of the Characteristics of Gas Explosion Process in Natural Gas Compartment of Utility Tunnel Using FLACS. Sustainability 2019, 12, 153. [Google Scholar] [CrossRef] [Green Version]


| Test Condition | Value |
|---|---|
| Explosion Relief Valve Type | ERV-735 |
| Chamber Size | 10 m3 |
| Free area for Explosion Relief Valve | 3905 cm2 |
| Open pressure of Explosion Relief Valve | 0.05 bar ± 20% |
| Ignition Energy | Less than 100 J |
| Numerical Analysis Conditions | Value |
|---|---|
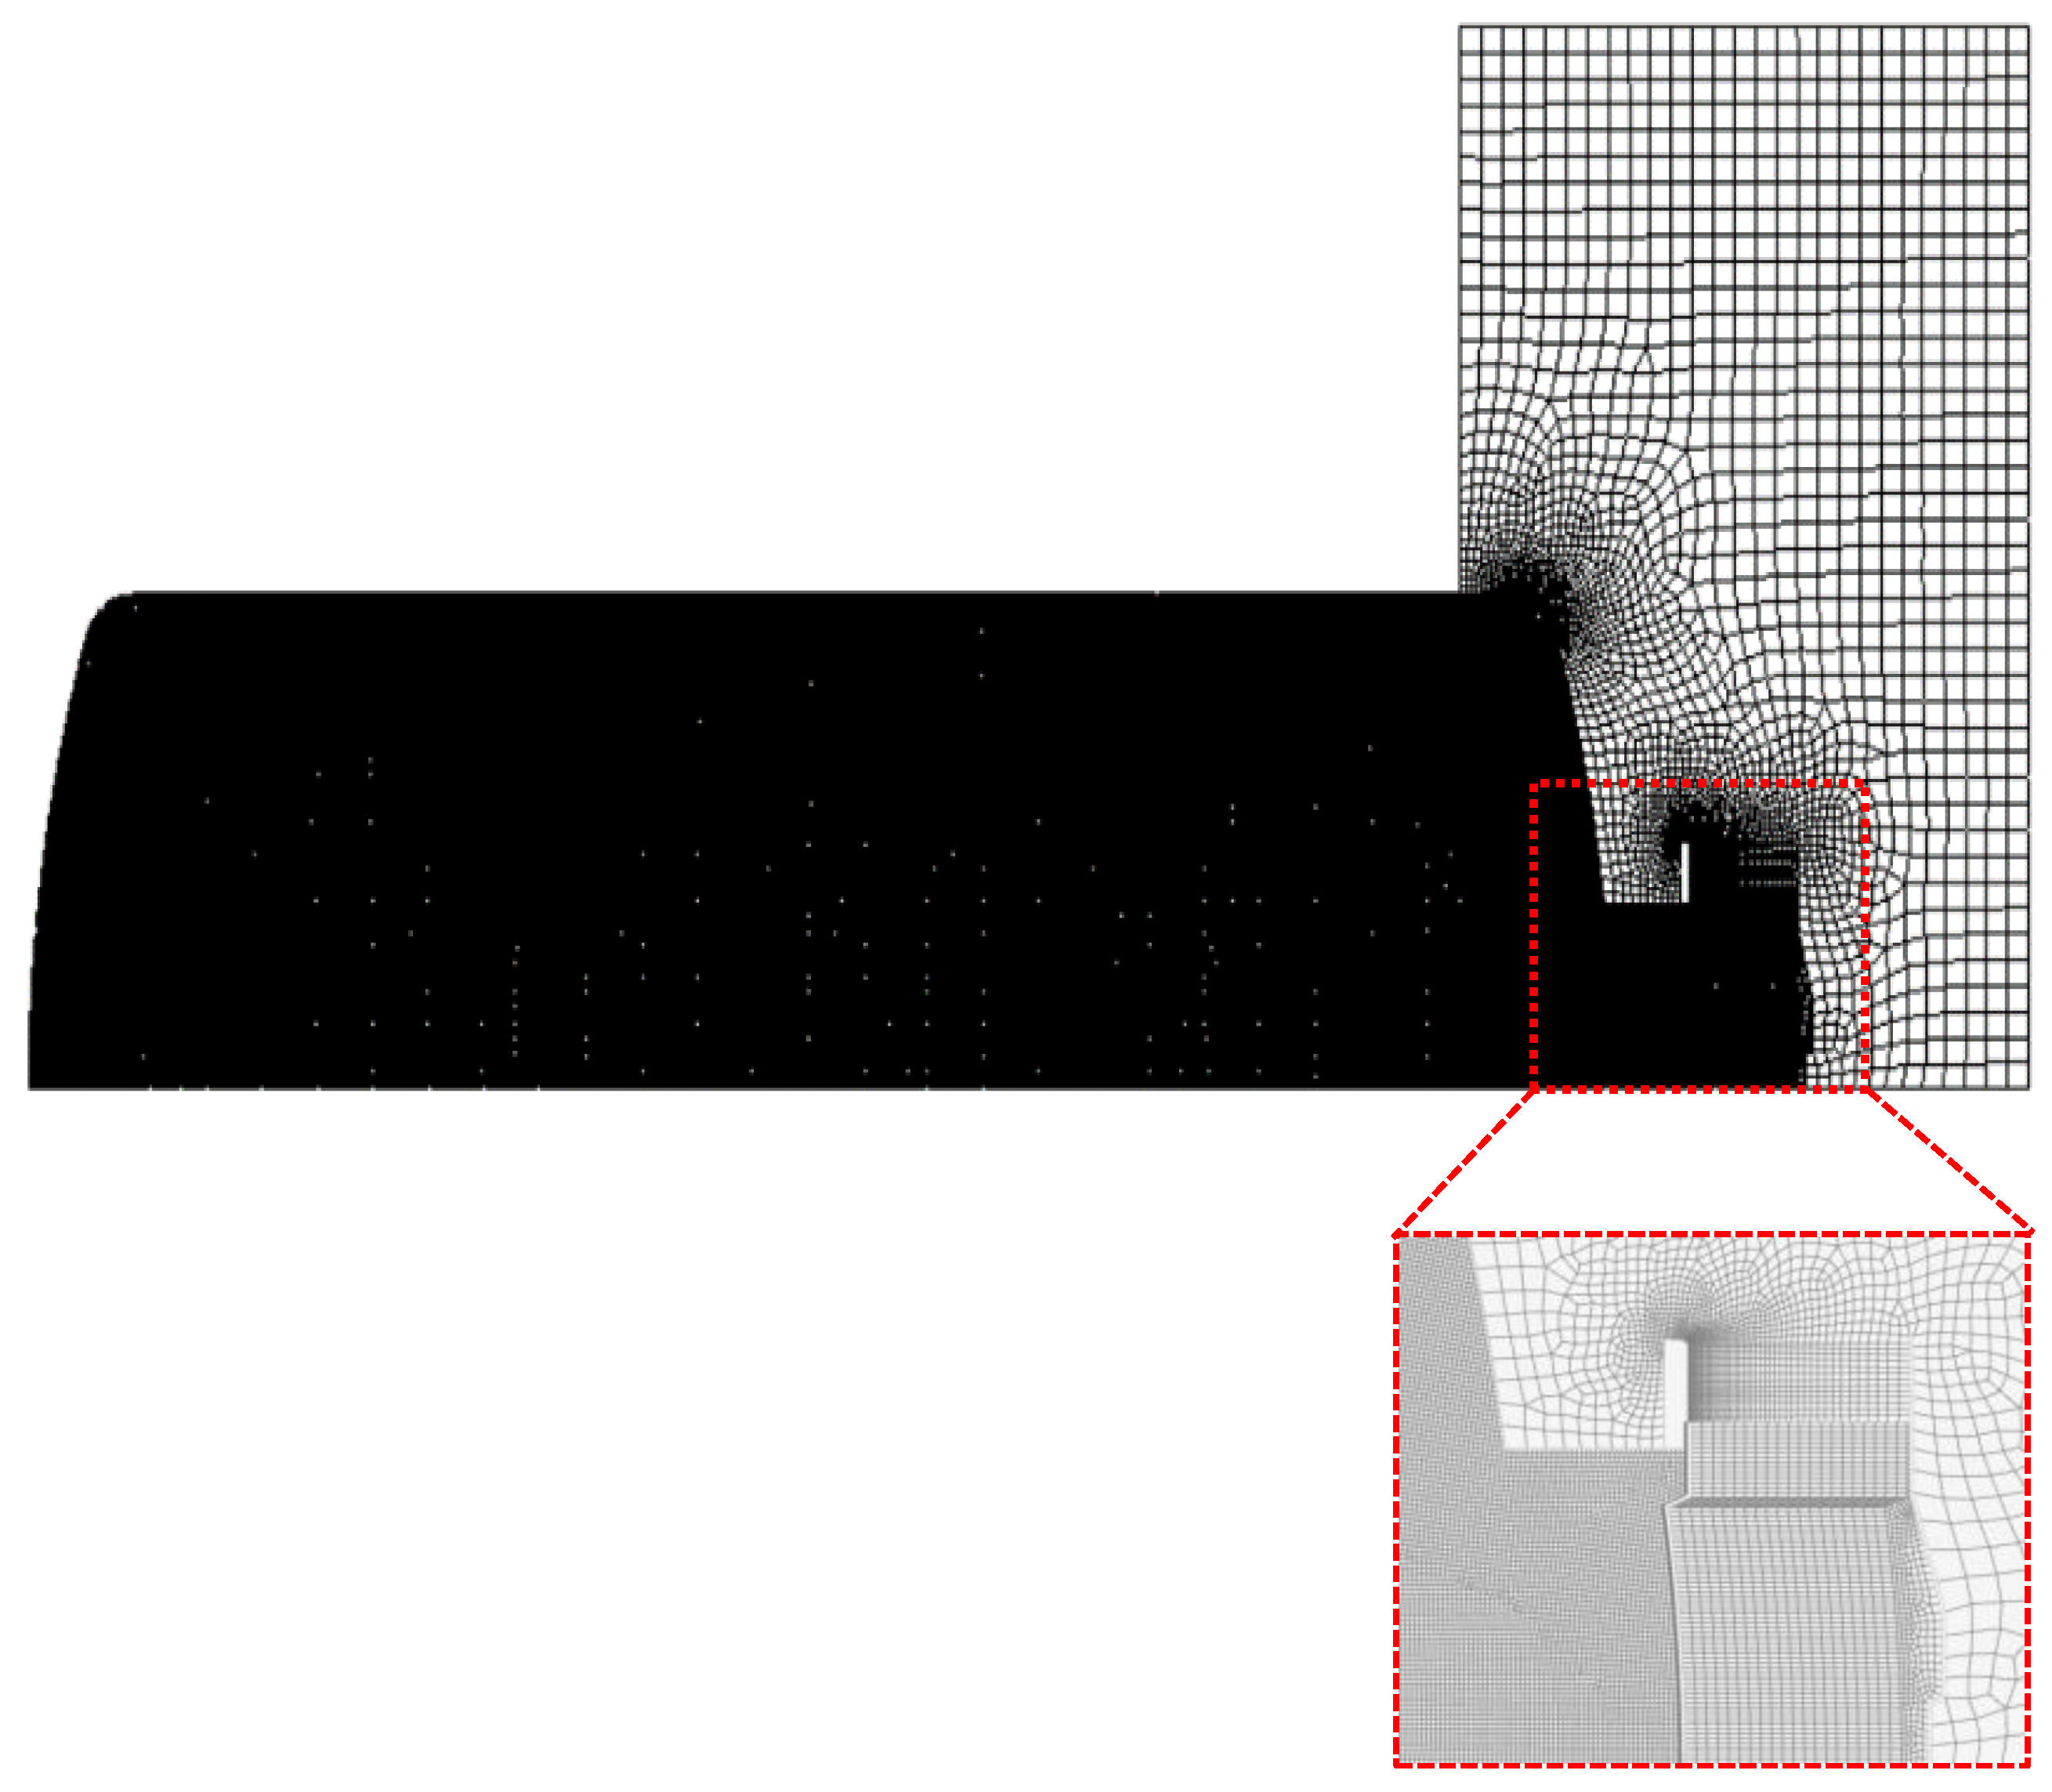
| Node | 141,530 |
| Element | 140,408 |
| Viscous Model | k-epsilon standard |
| Species Model | Species Transport |
| Mixture Properties | Methane-air-2step |
| Spark ignition Energy | 100 J |
| Dynamic Mesh Pressure | 0.05 bar |
| CH4 Mass Fraction | 0.05503 |
| O2 Mass Fraction | 0.22018 |
| Initial Temperature | 15 °C |
| Initial Pressure | Atmosphere |
| Time Step Size | 0.00005 s |
Publisher’s Note: MDPI stays neutral with regard to jurisdictional claims in published maps and institutional affiliations. |
© 2022 by the authors. Licensee MDPI, Basel, Switzerland. This article is an open access article distributed under the terms and conditions of the Creative Commons Attribution (CC BY) license (https://creativecommons.org/licenses/by/4.0/).
Share and Cite
Kong, K.-J.; Kang, S.-W.; Kim, J.-H.; Jang, H.-L. Numerical Analysis for Performance and the Combustion Reactants of the Crankcase Explosion Relief Valve. J. Mar. Sci. Eng. 2022, 10, 1340. https://doi.org/10.3390/jmse10101340
Kong K-J, Kang S-W, Kim J-H, Jang H-L. Numerical Analysis for Performance and the Combustion Reactants of the Crankcase Explosion Relief Valve. Journal of Marine Science and Engineering. 2022; 10(10):1340. https://doi.org/10.3390/jmse10101340
Chicago/Turabian StyleKong, Kyeong-Ju, Sung-Wook Kang, Jong-Hwan Kim, and Hong-Lae Jang. 2022. "Numerical Analysis for Performance and the Combustion Reactants of the Crankcase Explosion Relief Valve" Journal of Marine Science and Engineering 10, no. 10: 1340. https://doi.org/10.3390/jmse10101340
APA StyleKong, K.-J., Kang, S.-W., Kim, J.-H., & Jang, H.-L. (2022). Numerical Analysis for Performance and the Combustion Reactants of the Crankcase Explosion Relief Valve. Journal of Marine Science and Engineering, 10(10), 1340. https://doi.org/10.3390/jmse10101340