
Experimental Investigation on Behavior of Single-Helix Anchor in Sand Subjected to Uplift Cyclic Loading


Abstract
:1. Introduction
2. Materials and Methods
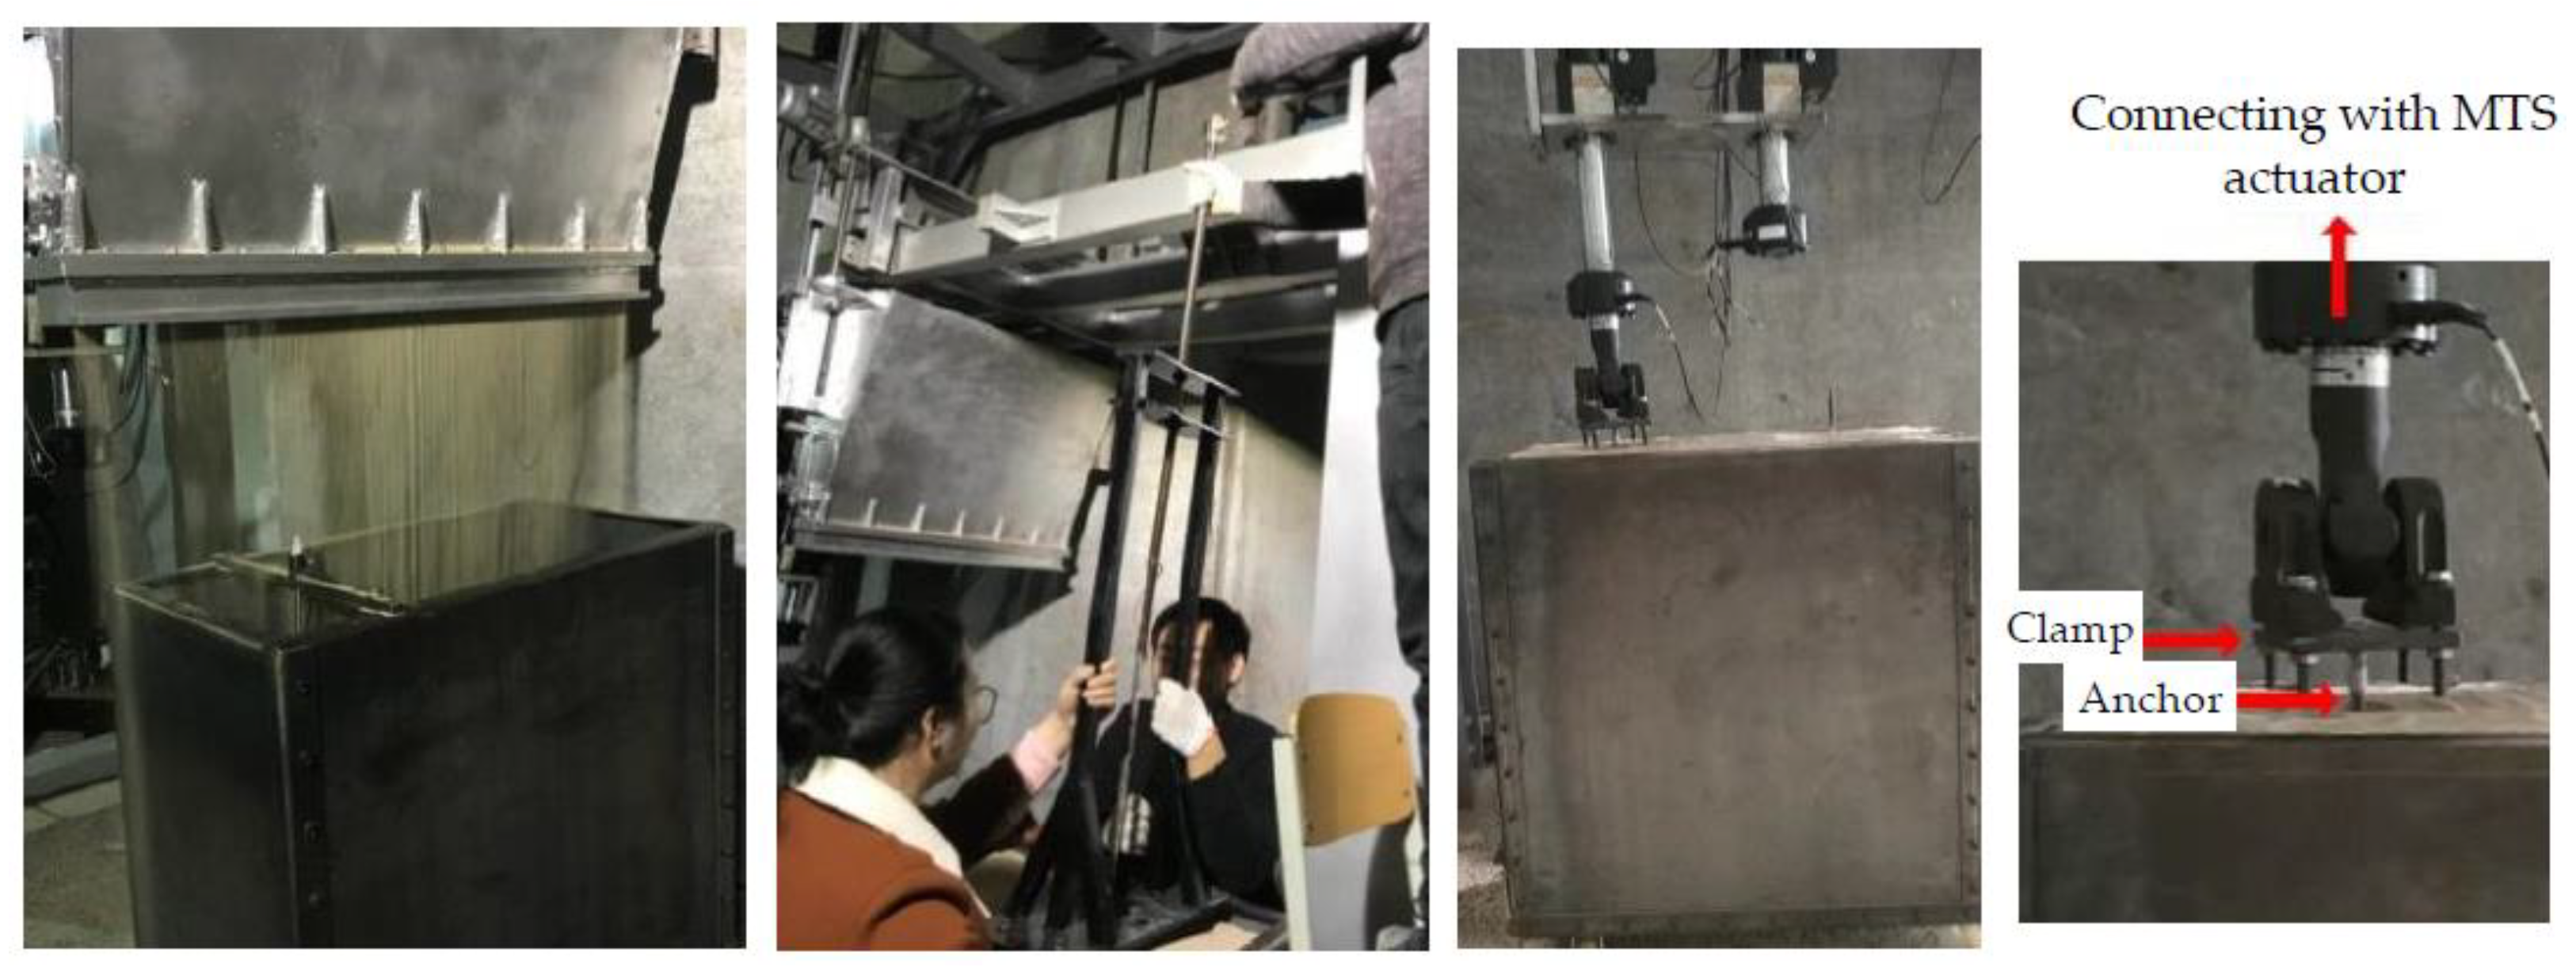
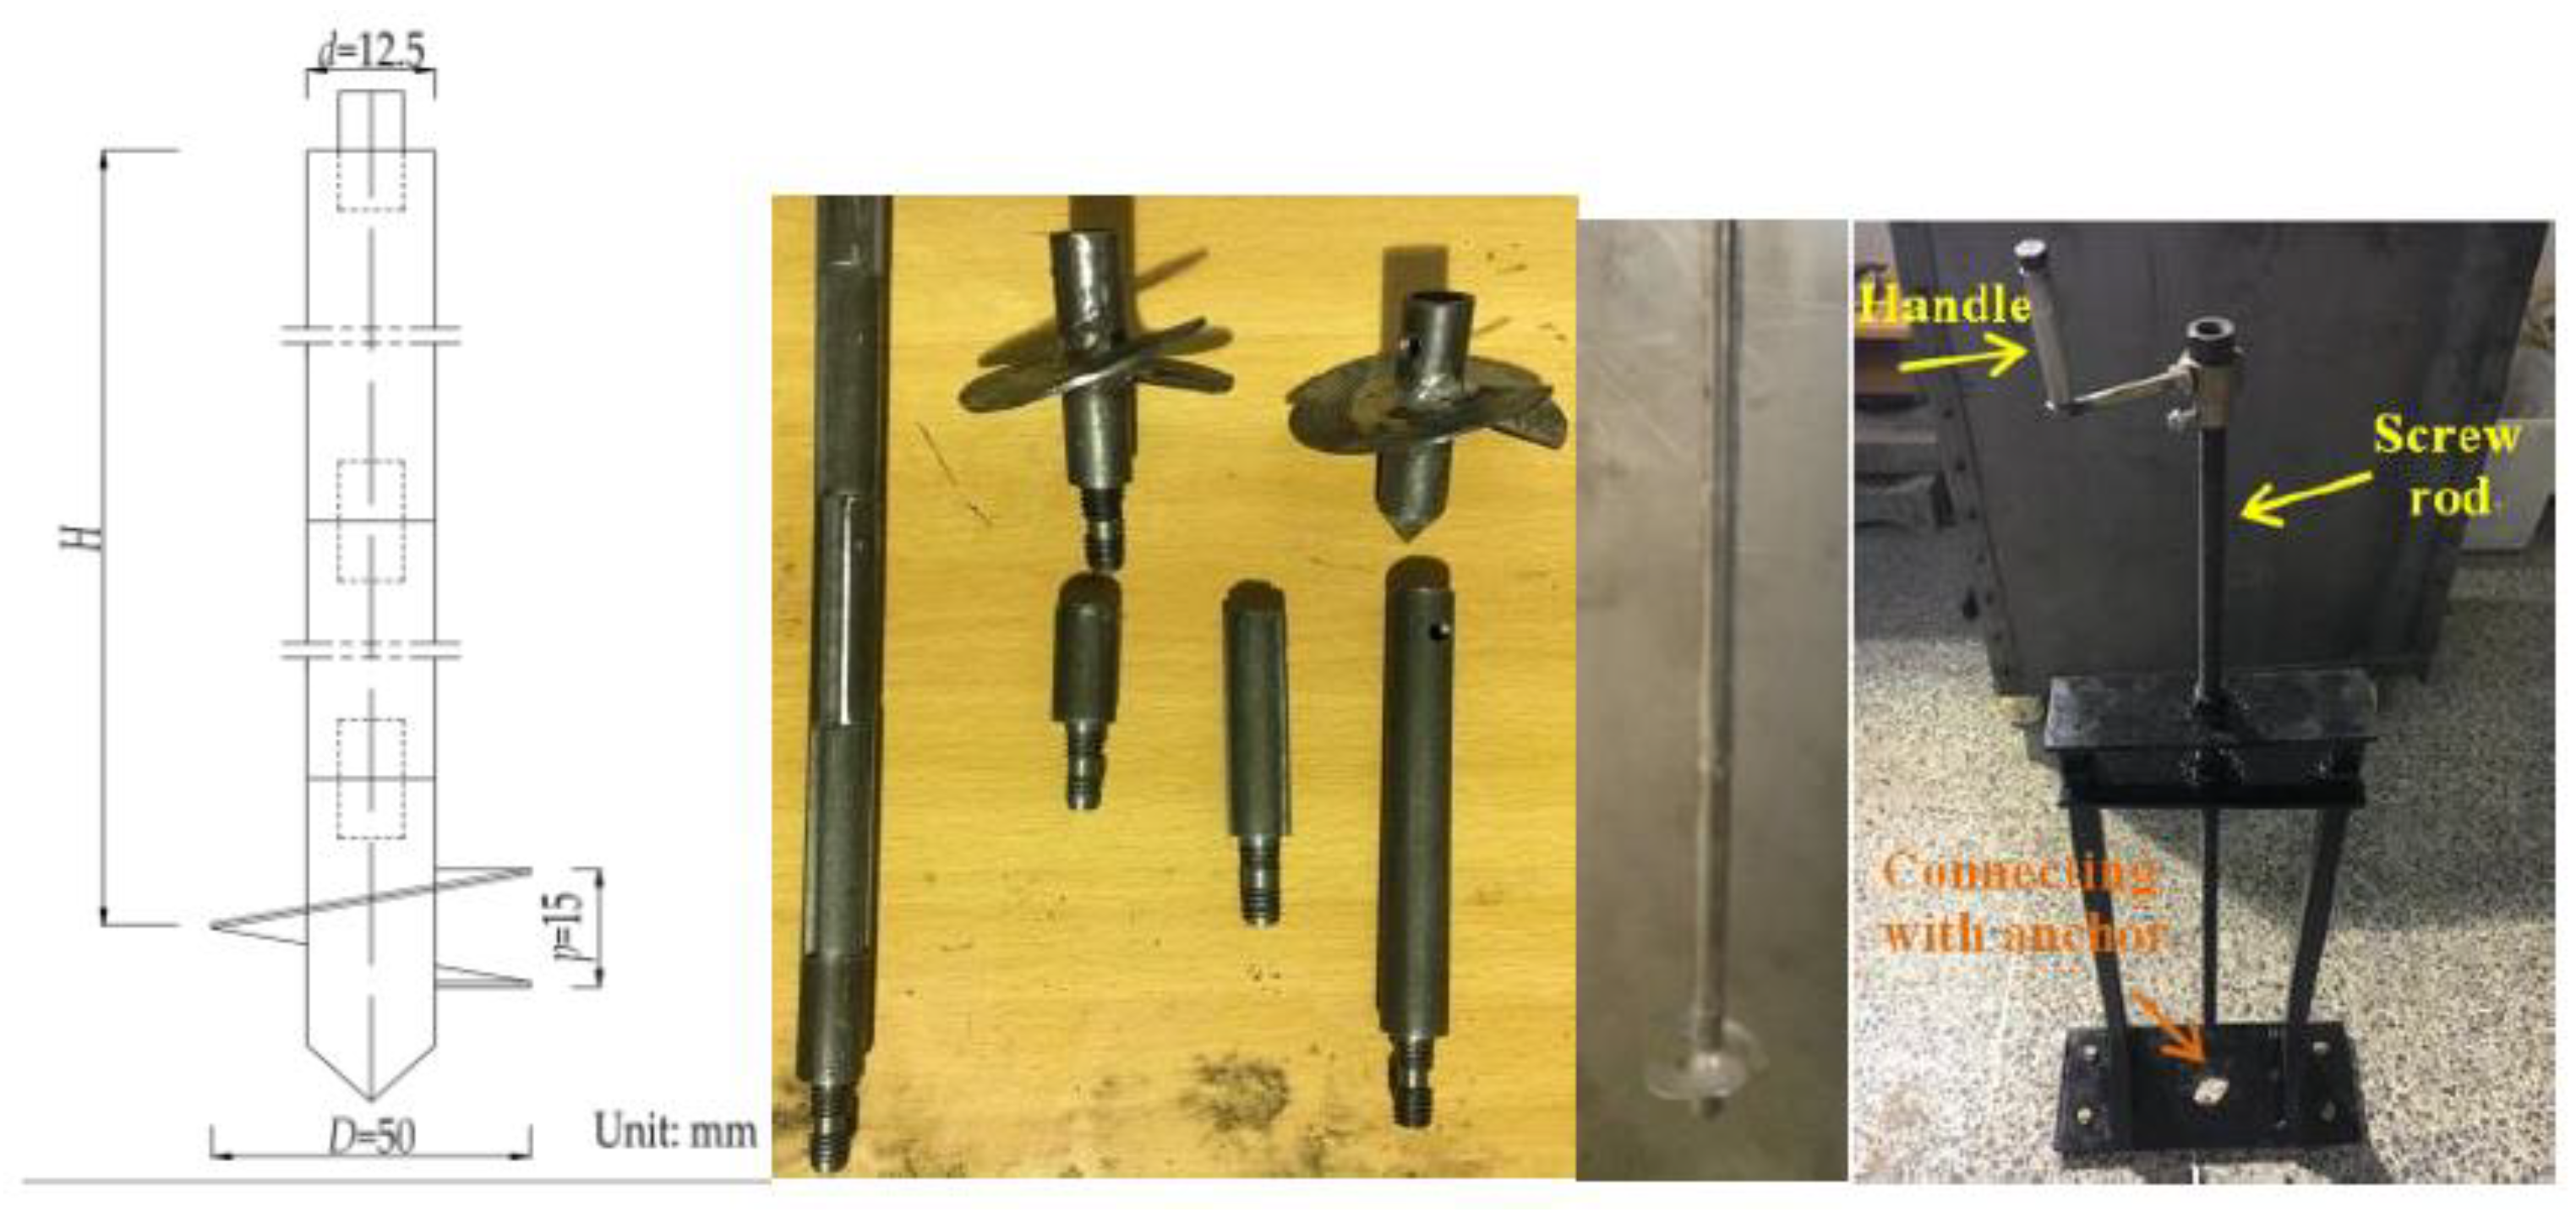
2.1. Sand Preparation and Installation of Anchors
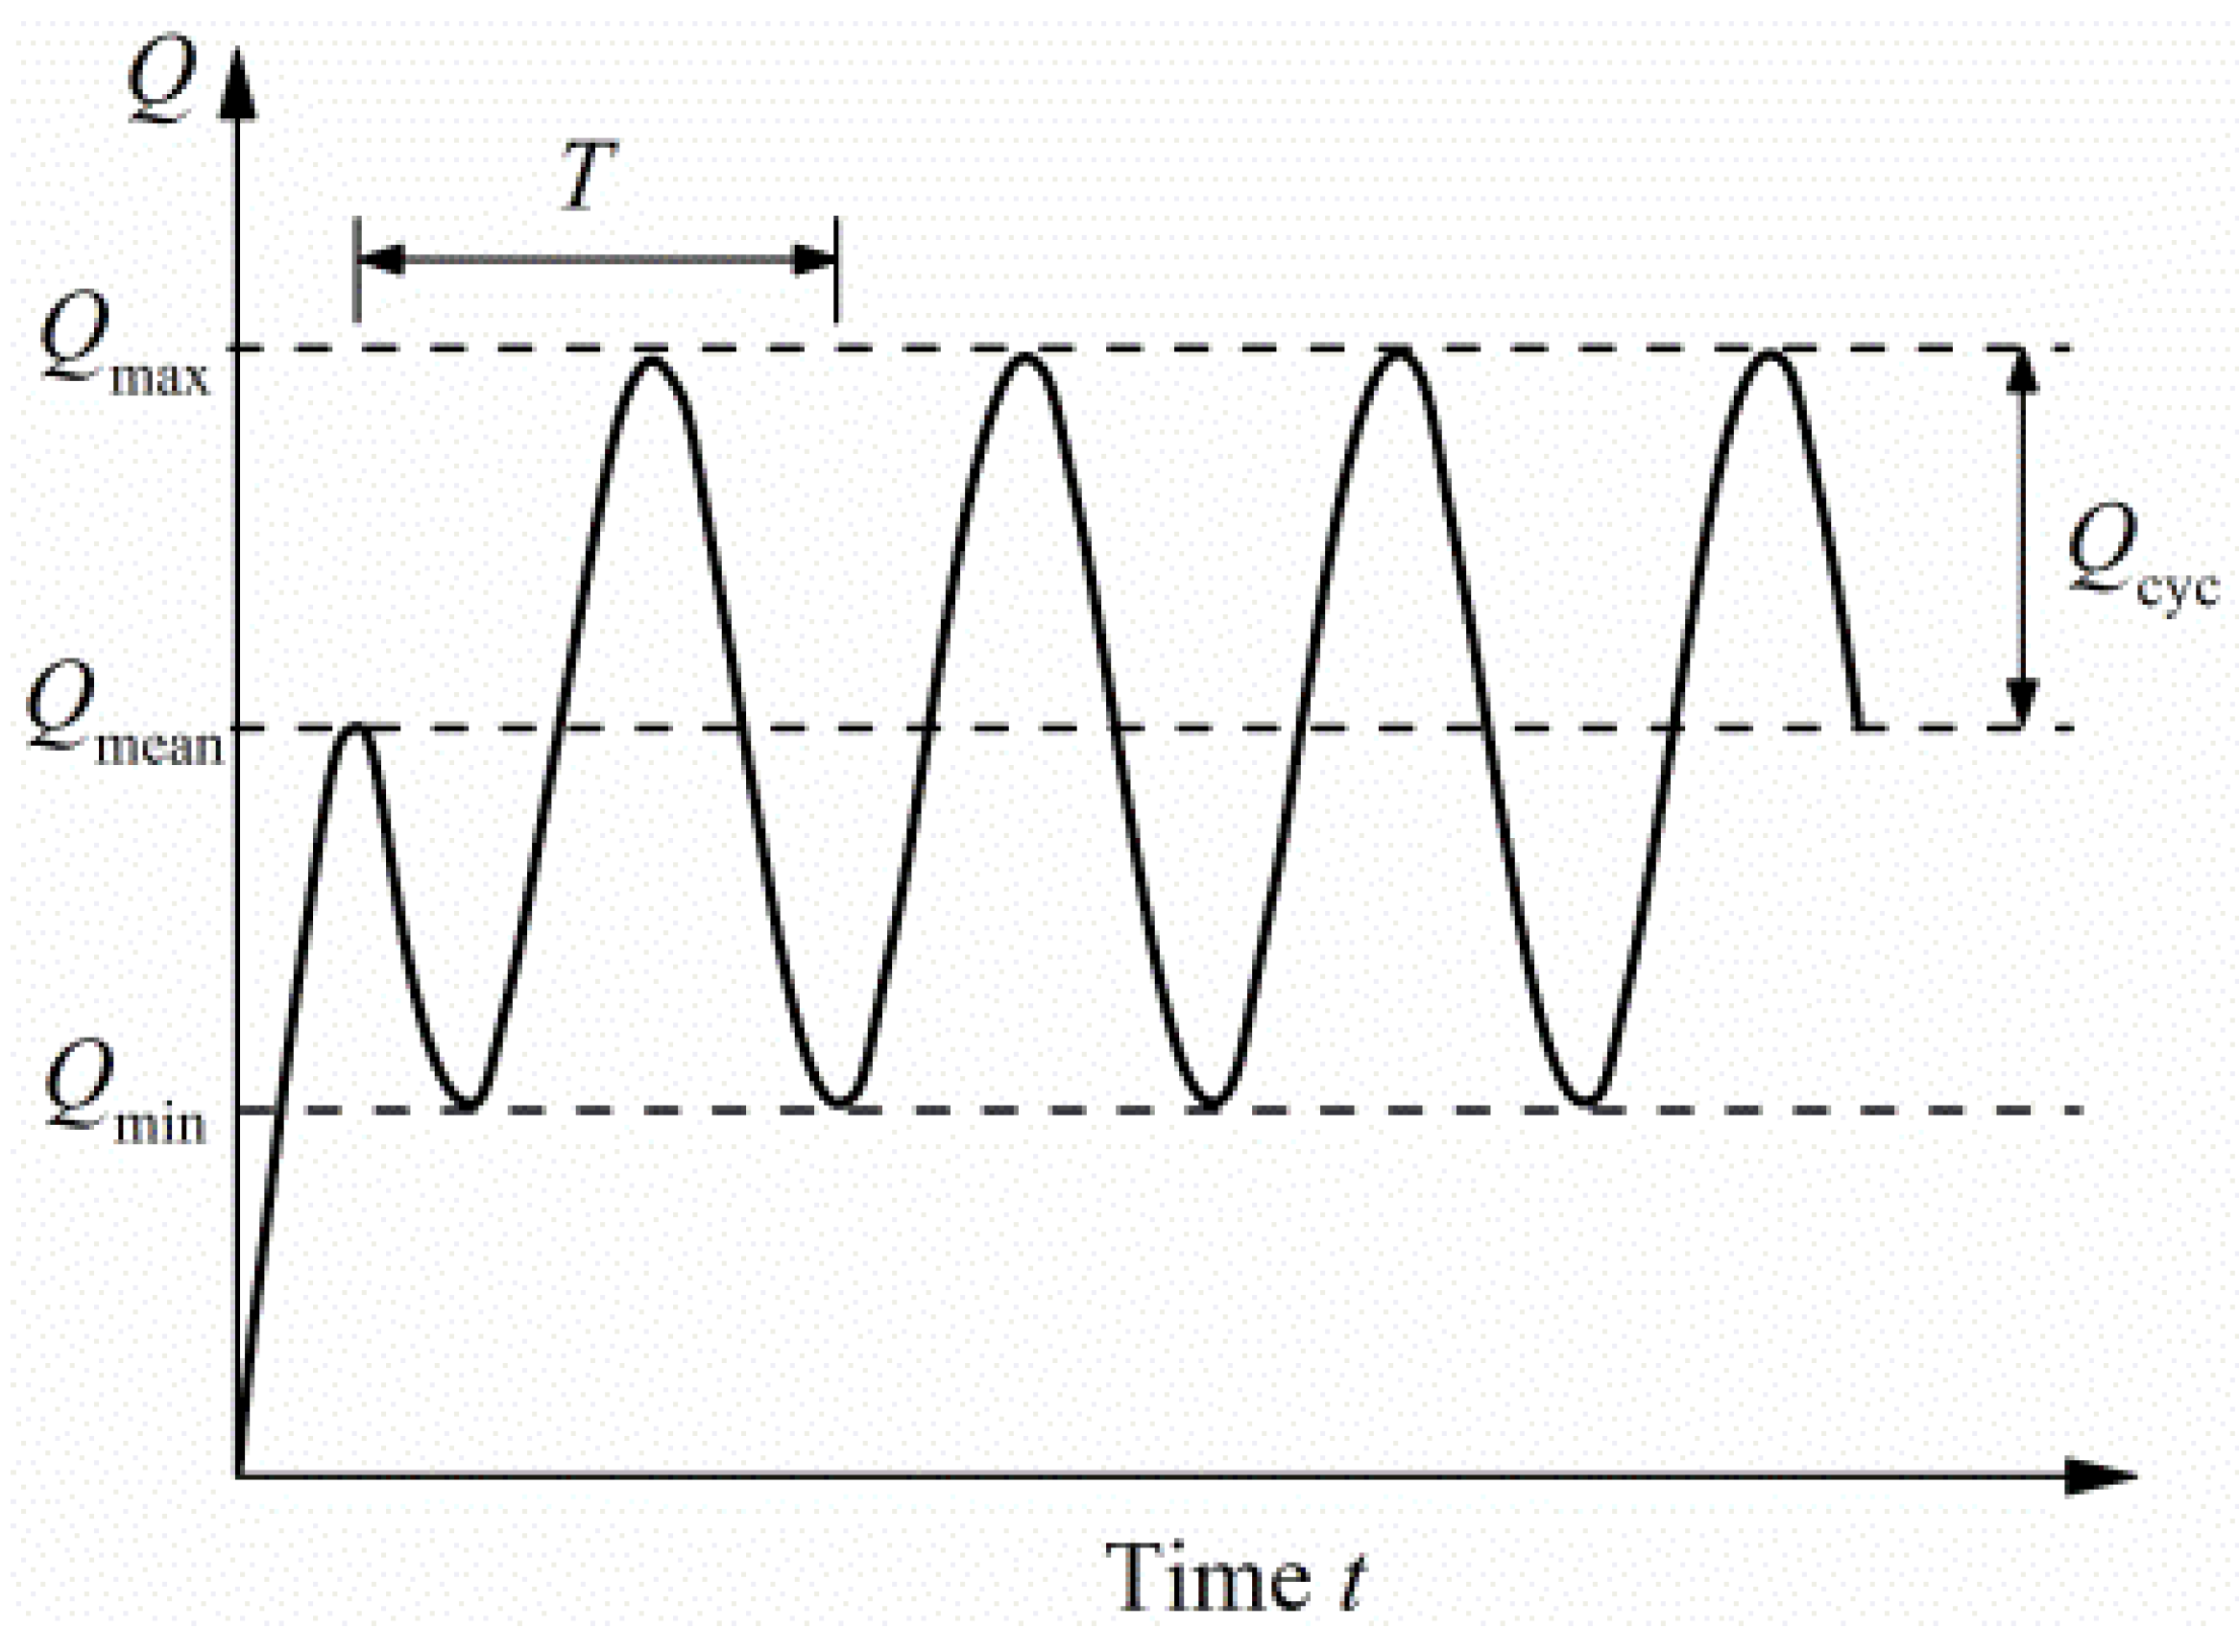
2.2. Test Program and Loading Mode
3. Results
3.1. Test Results in Dense Sand
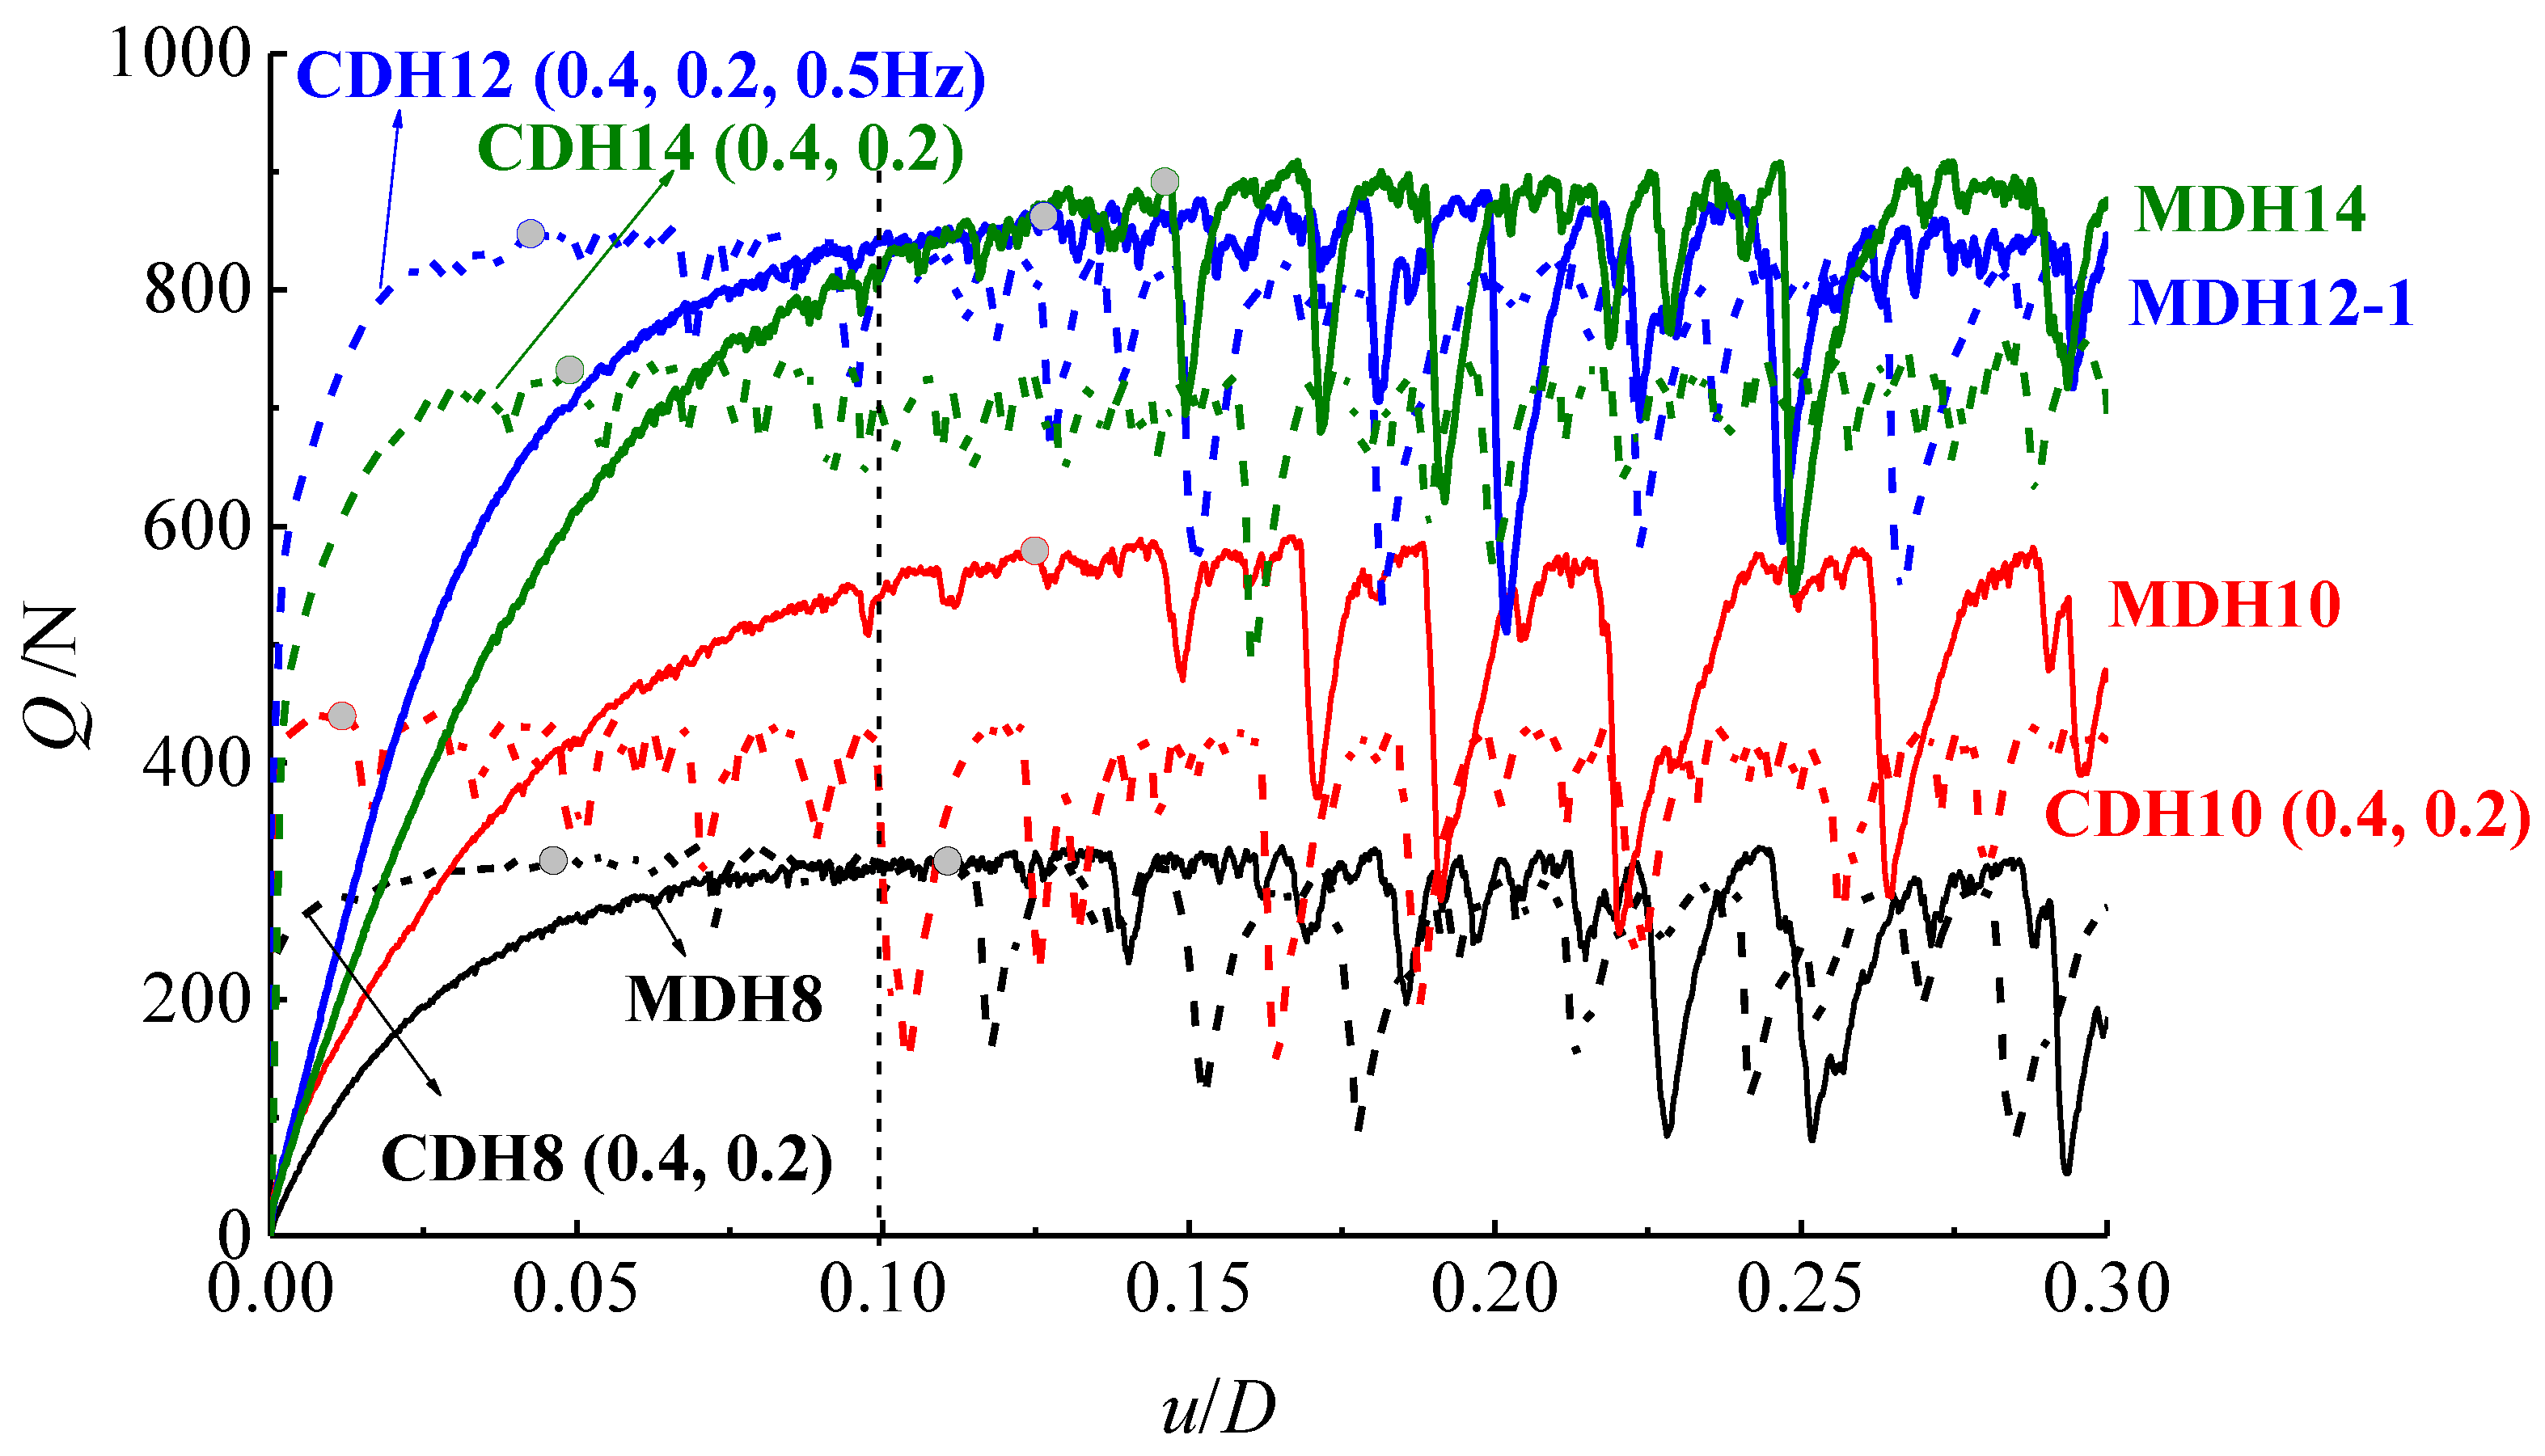
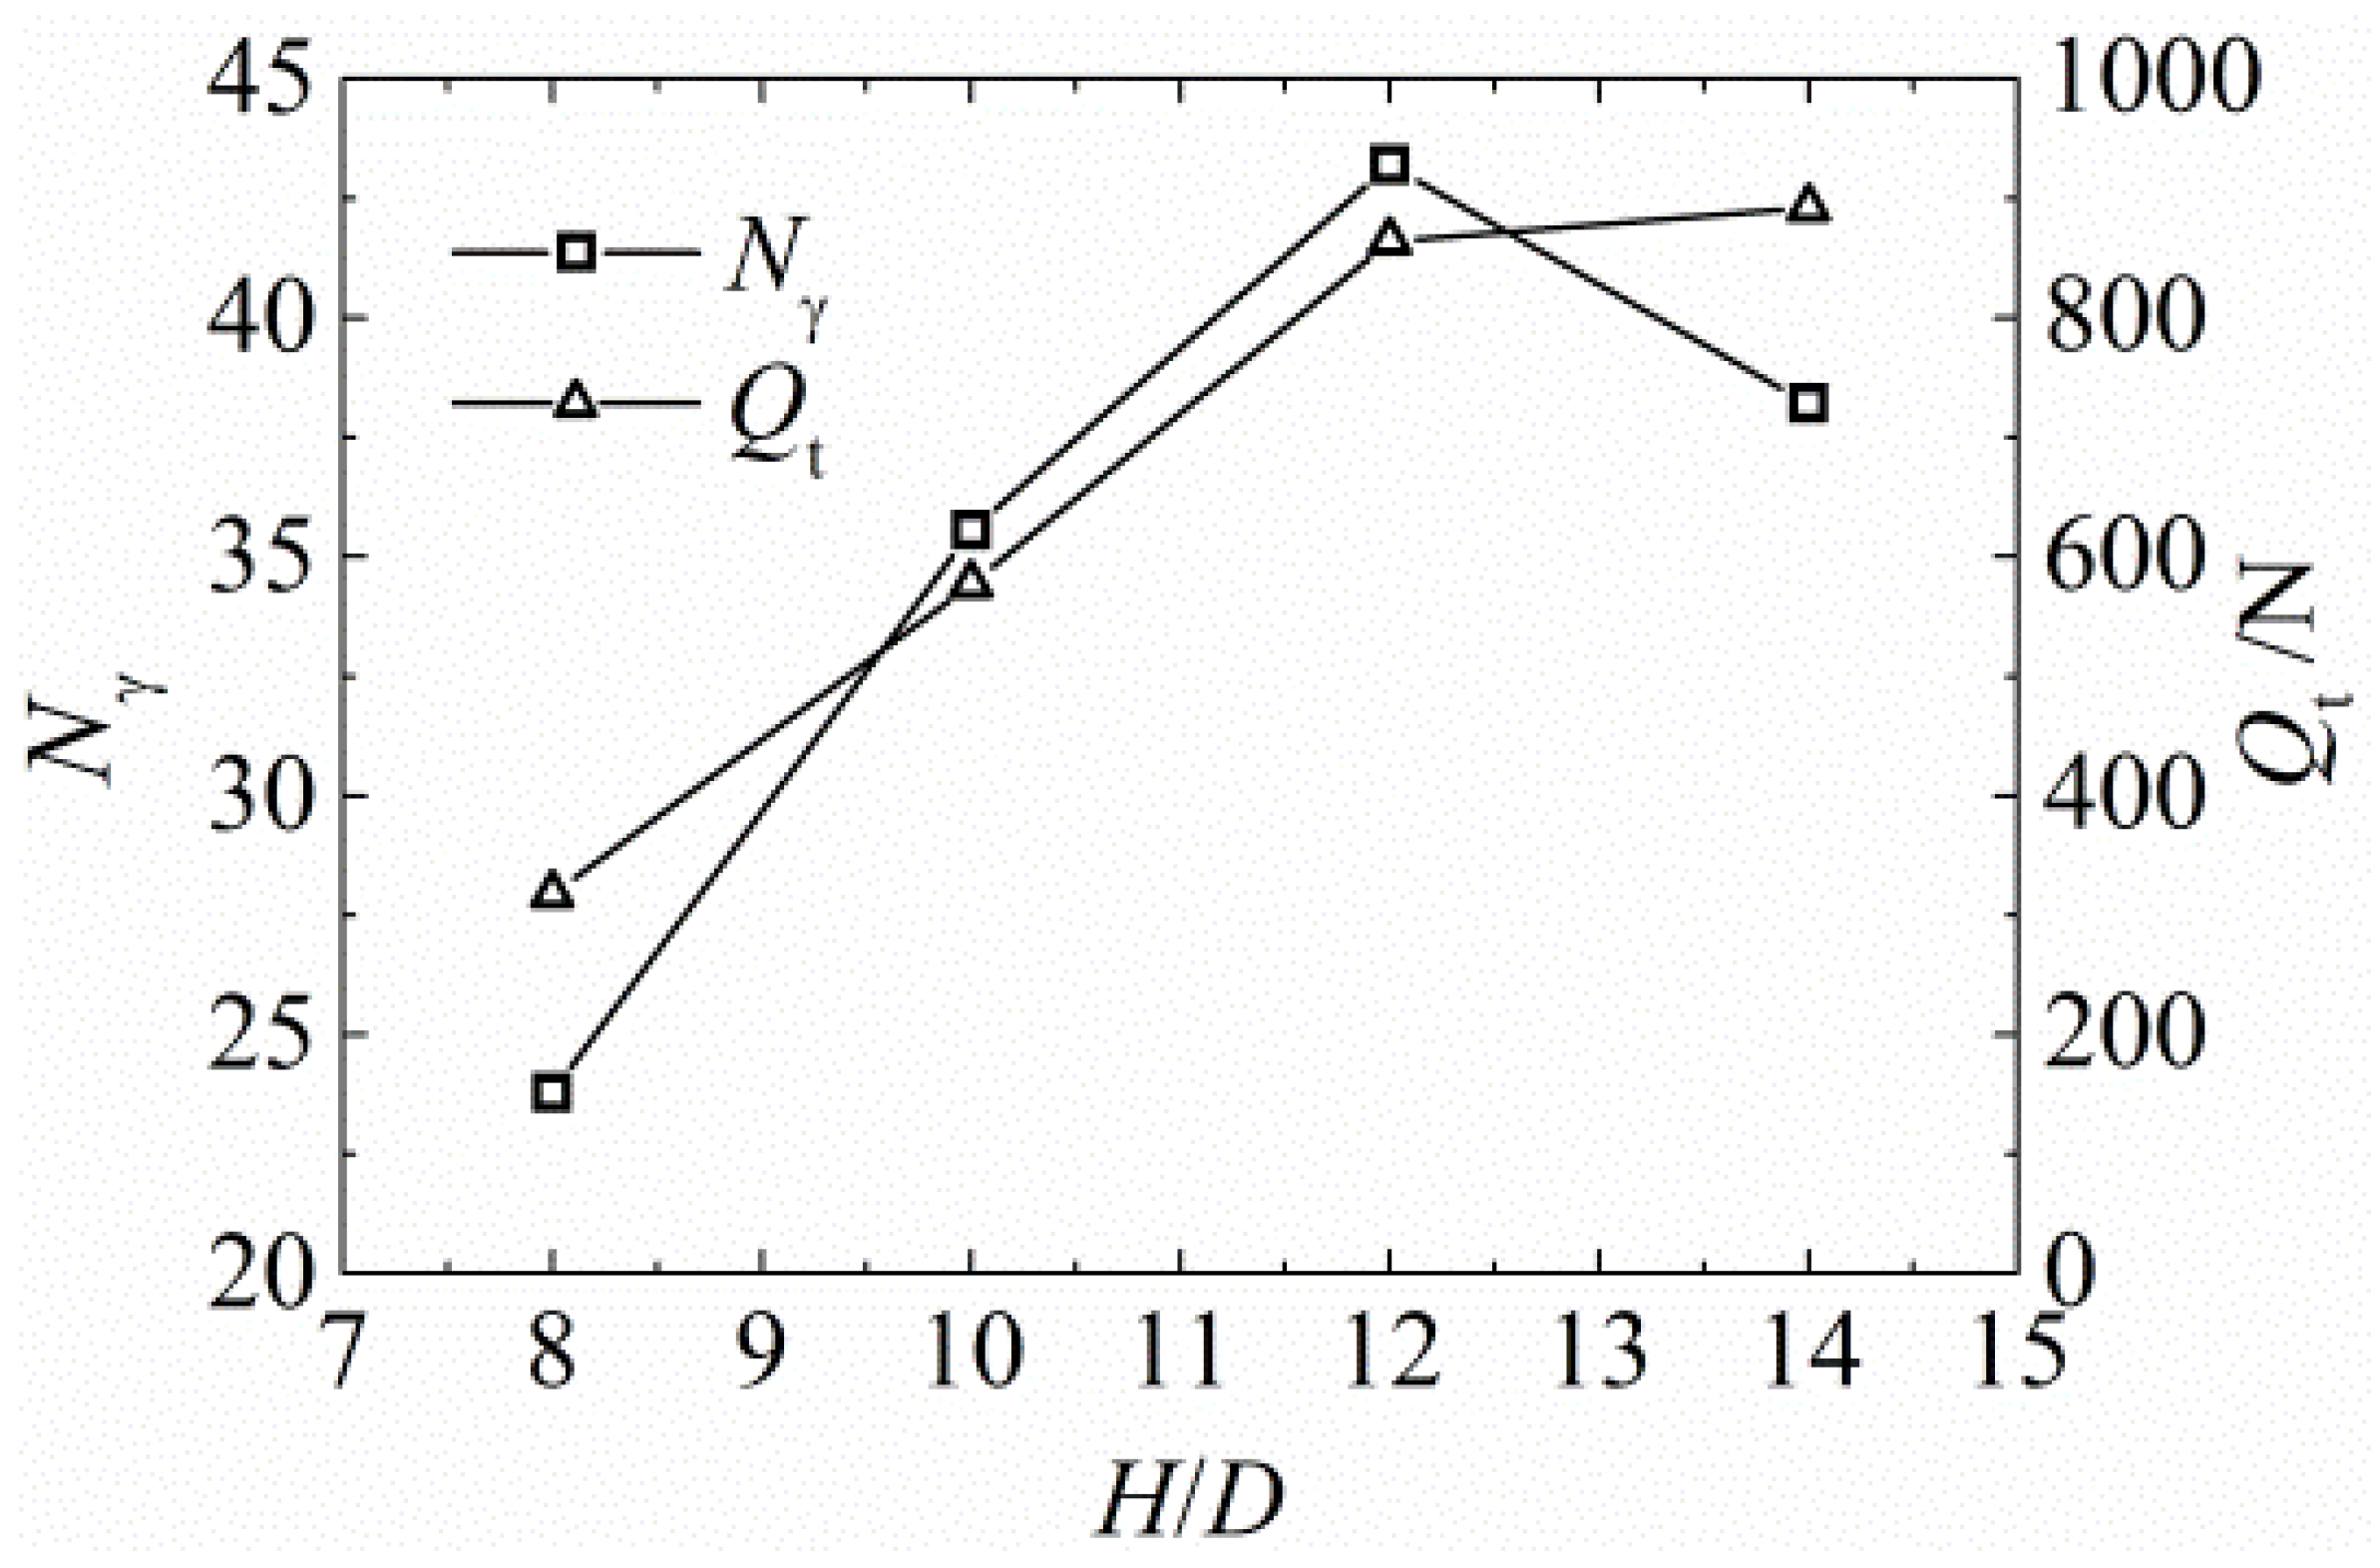
3.1.1. Results of Anchors with Different Embedment Ratios
- Ultimate uplift capacity of monotonic loading
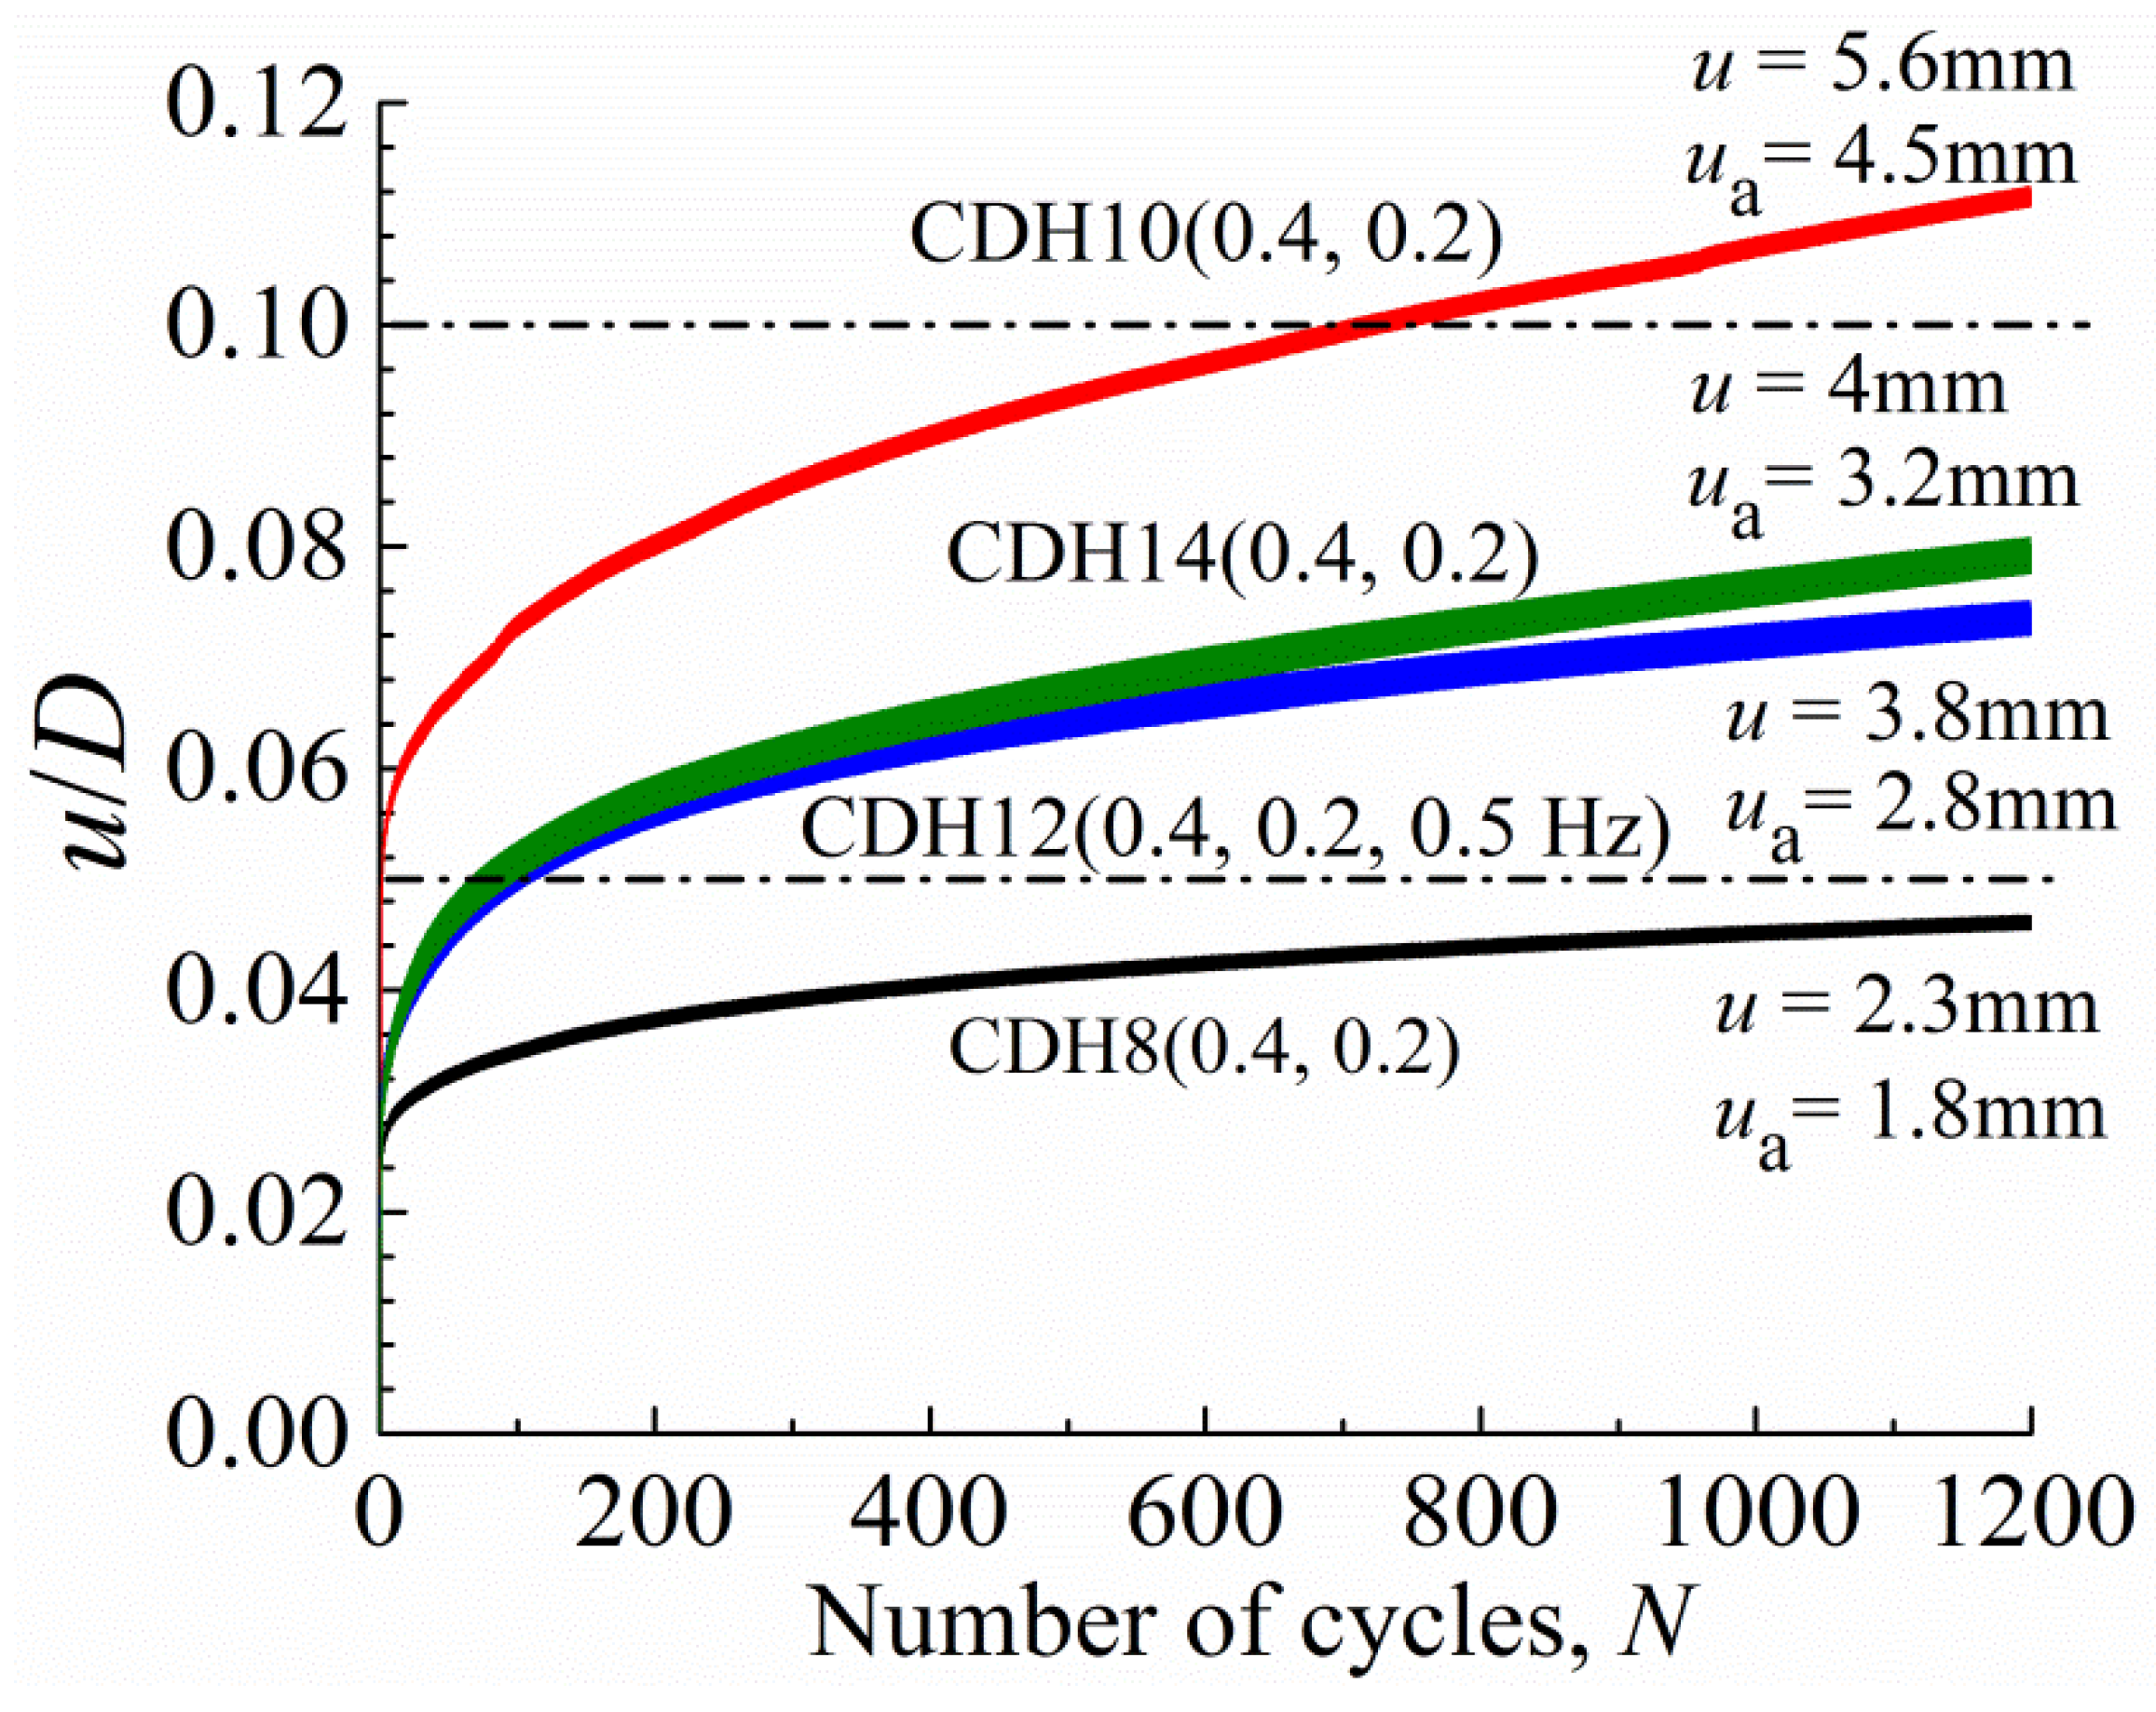
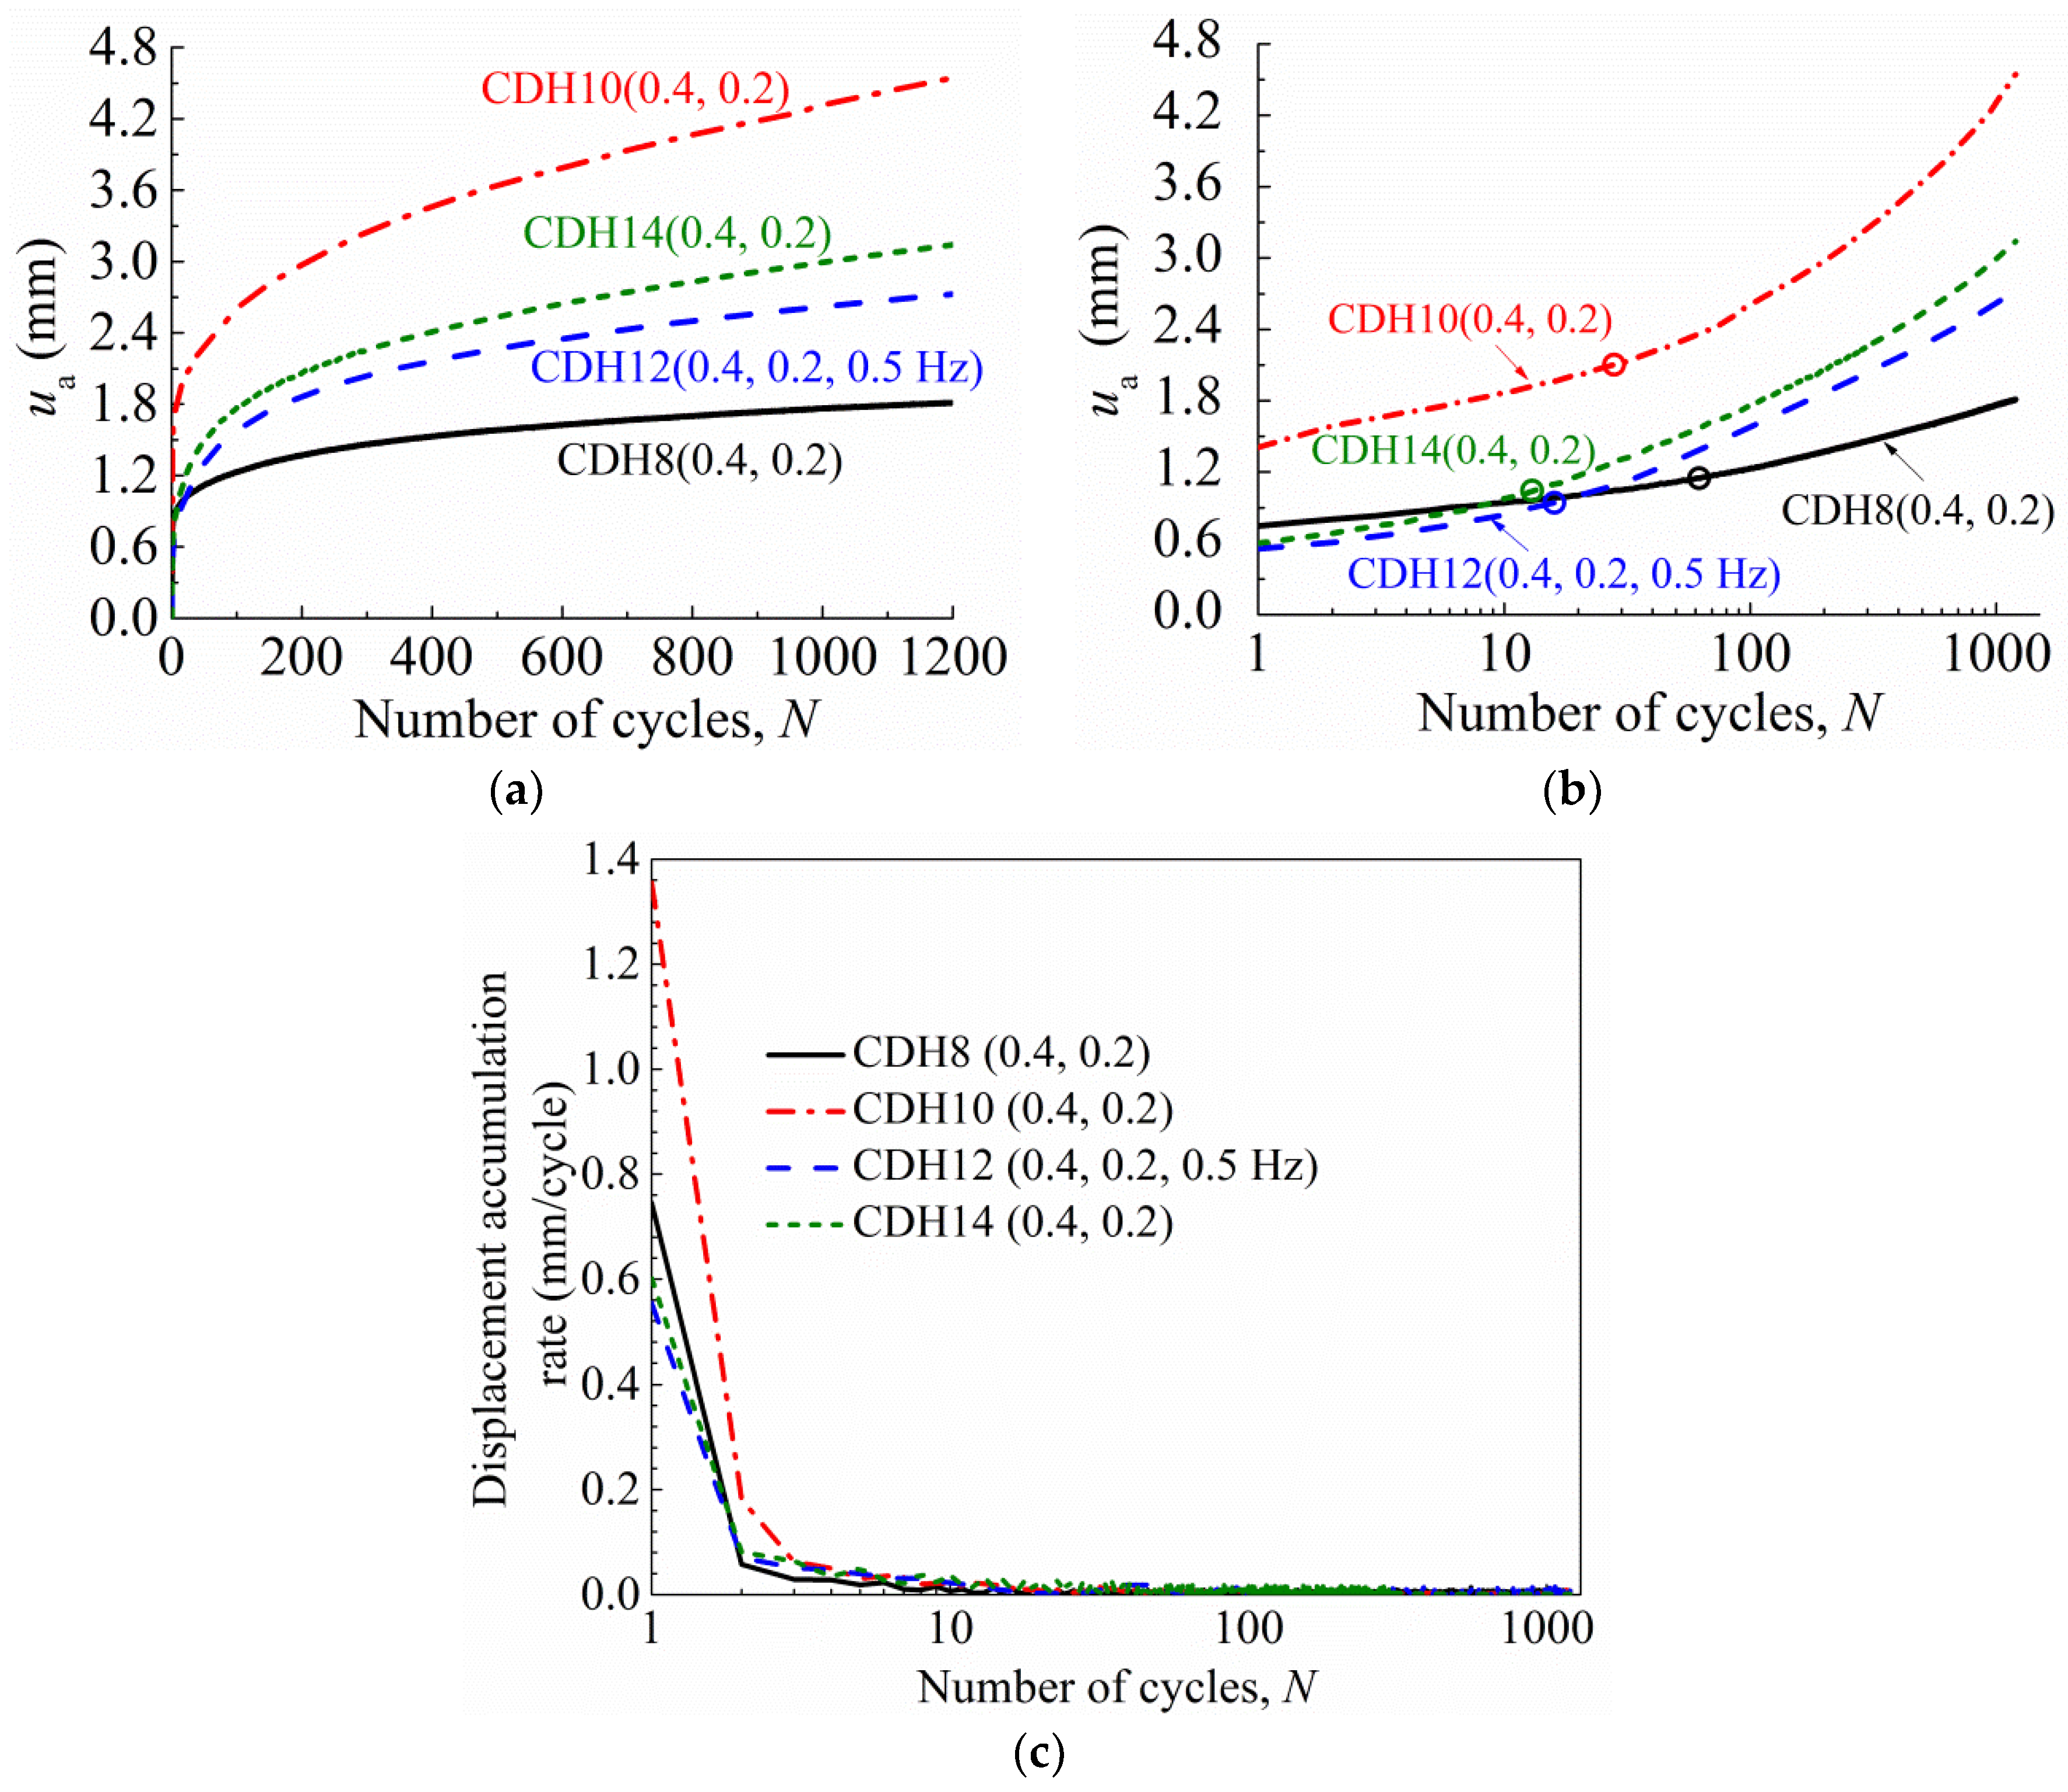
- Accumulated displacement
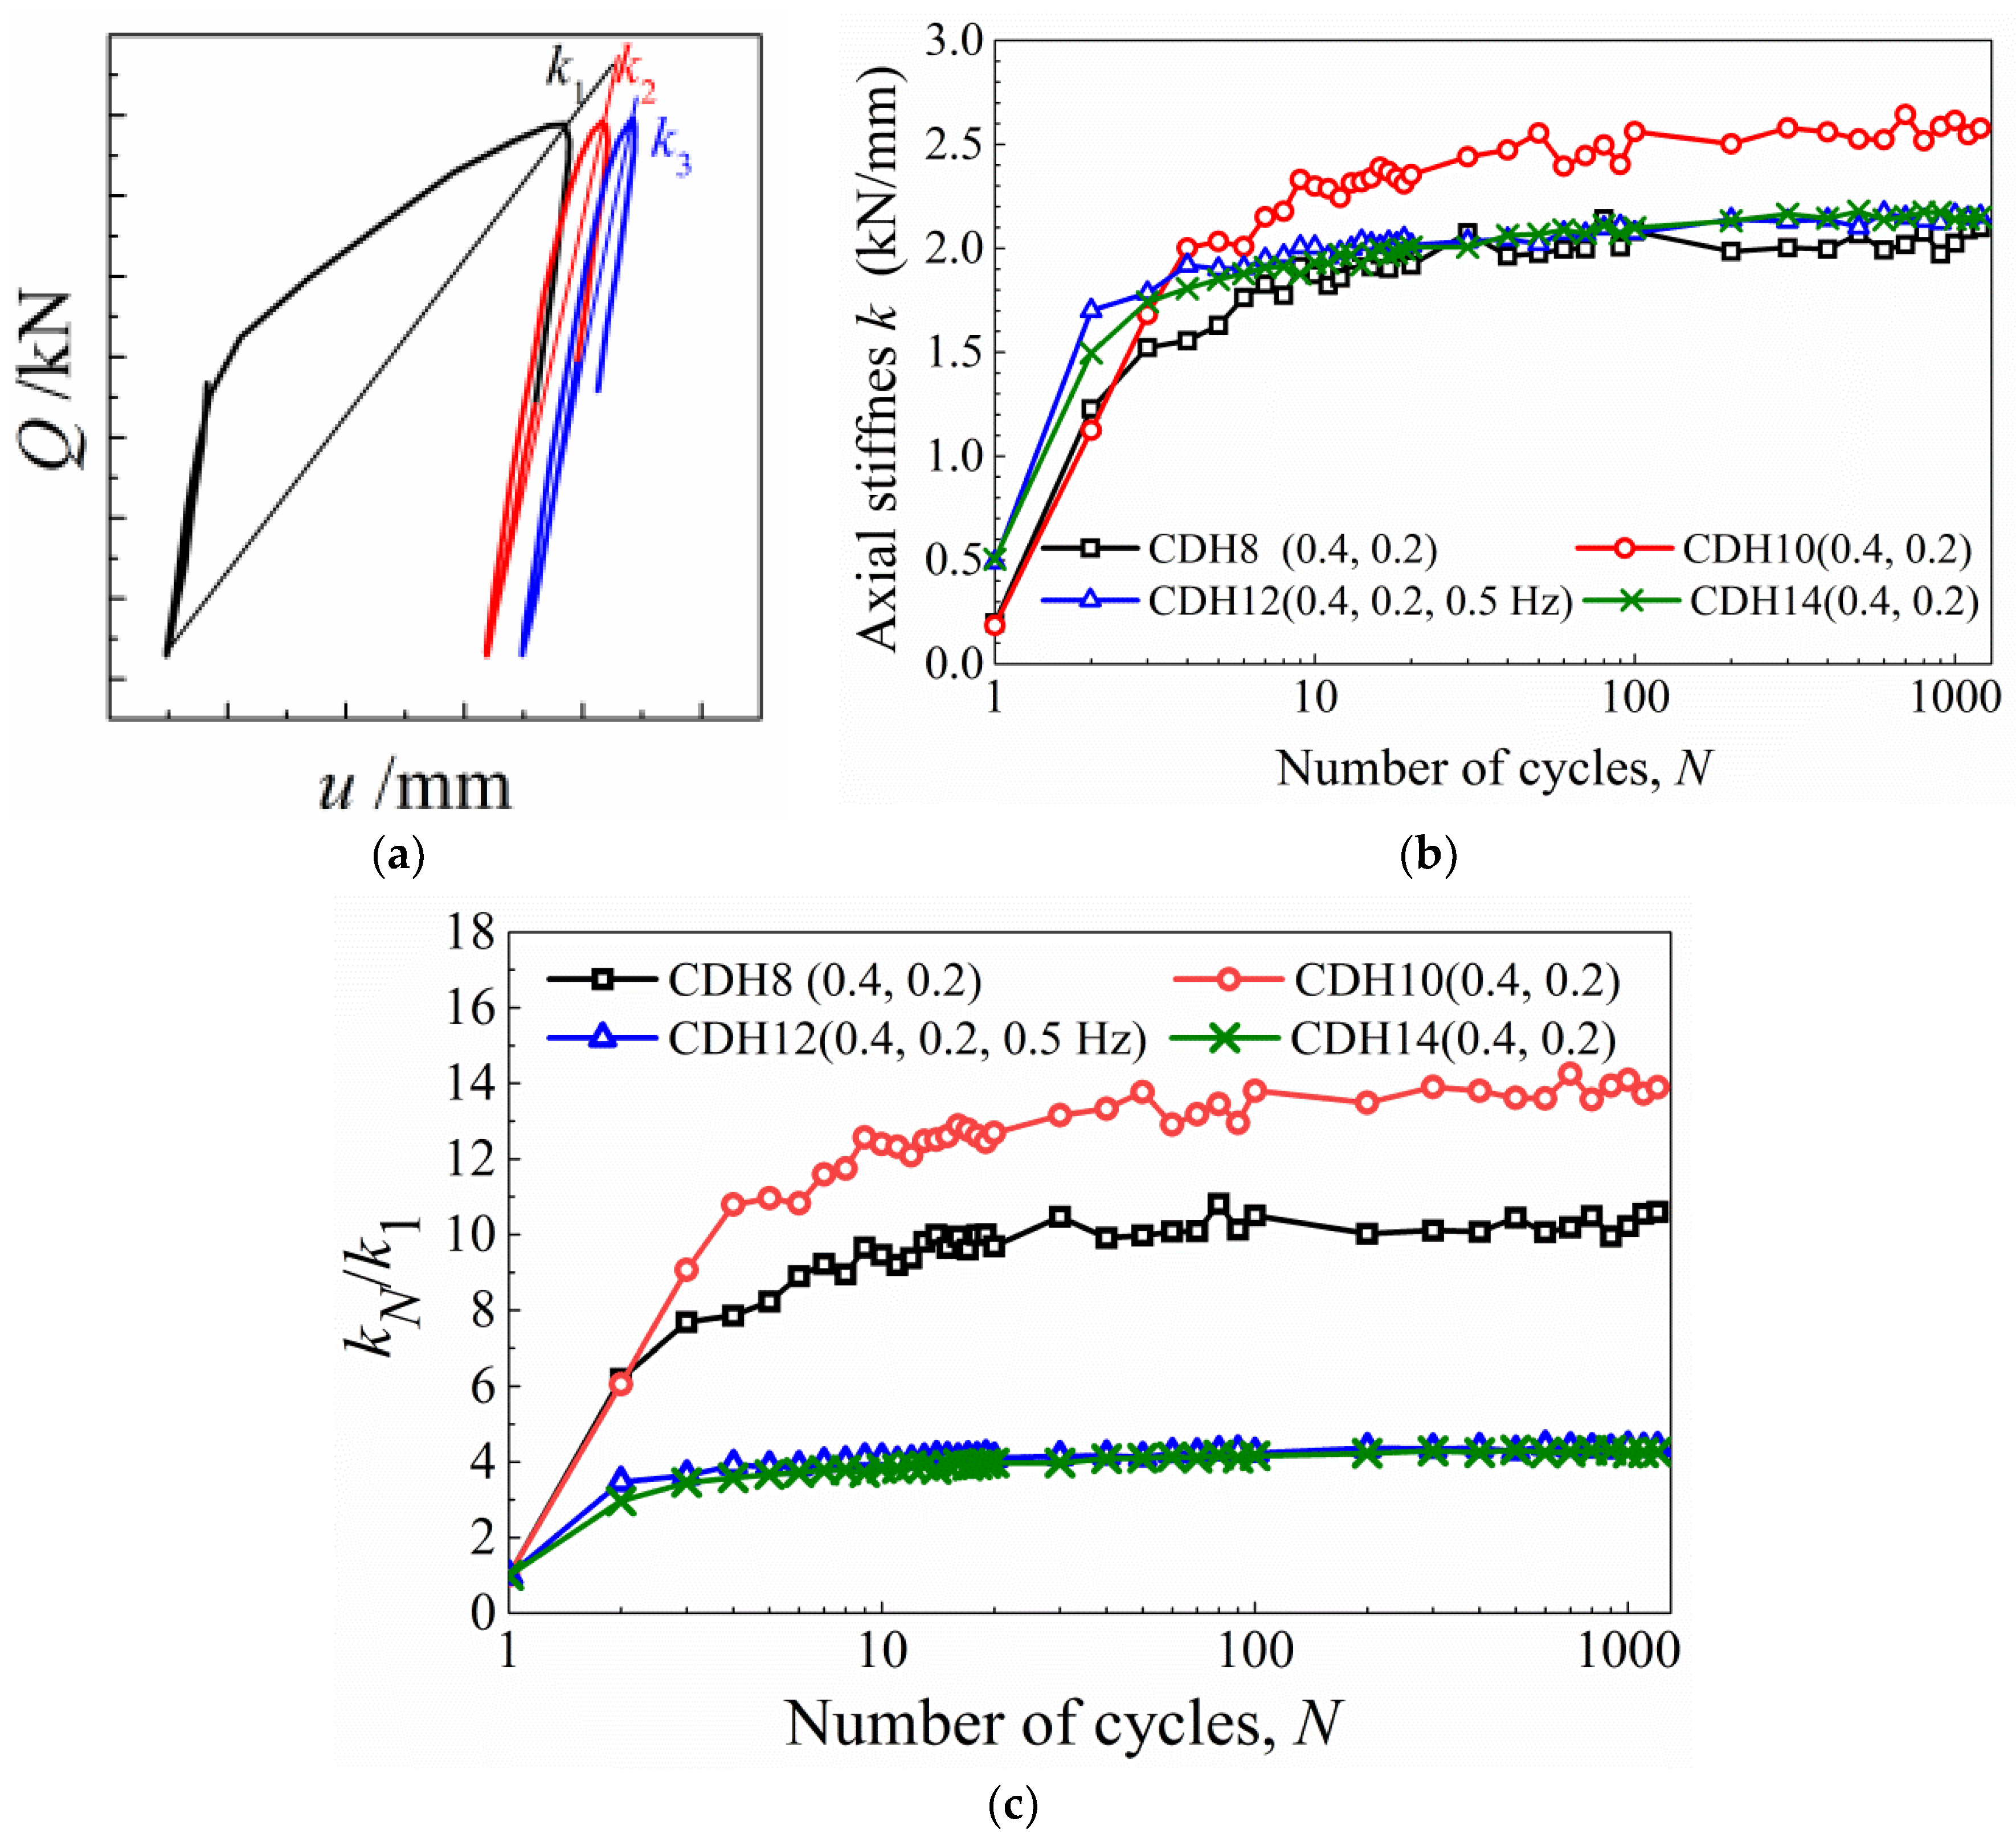
- Axial stiffness
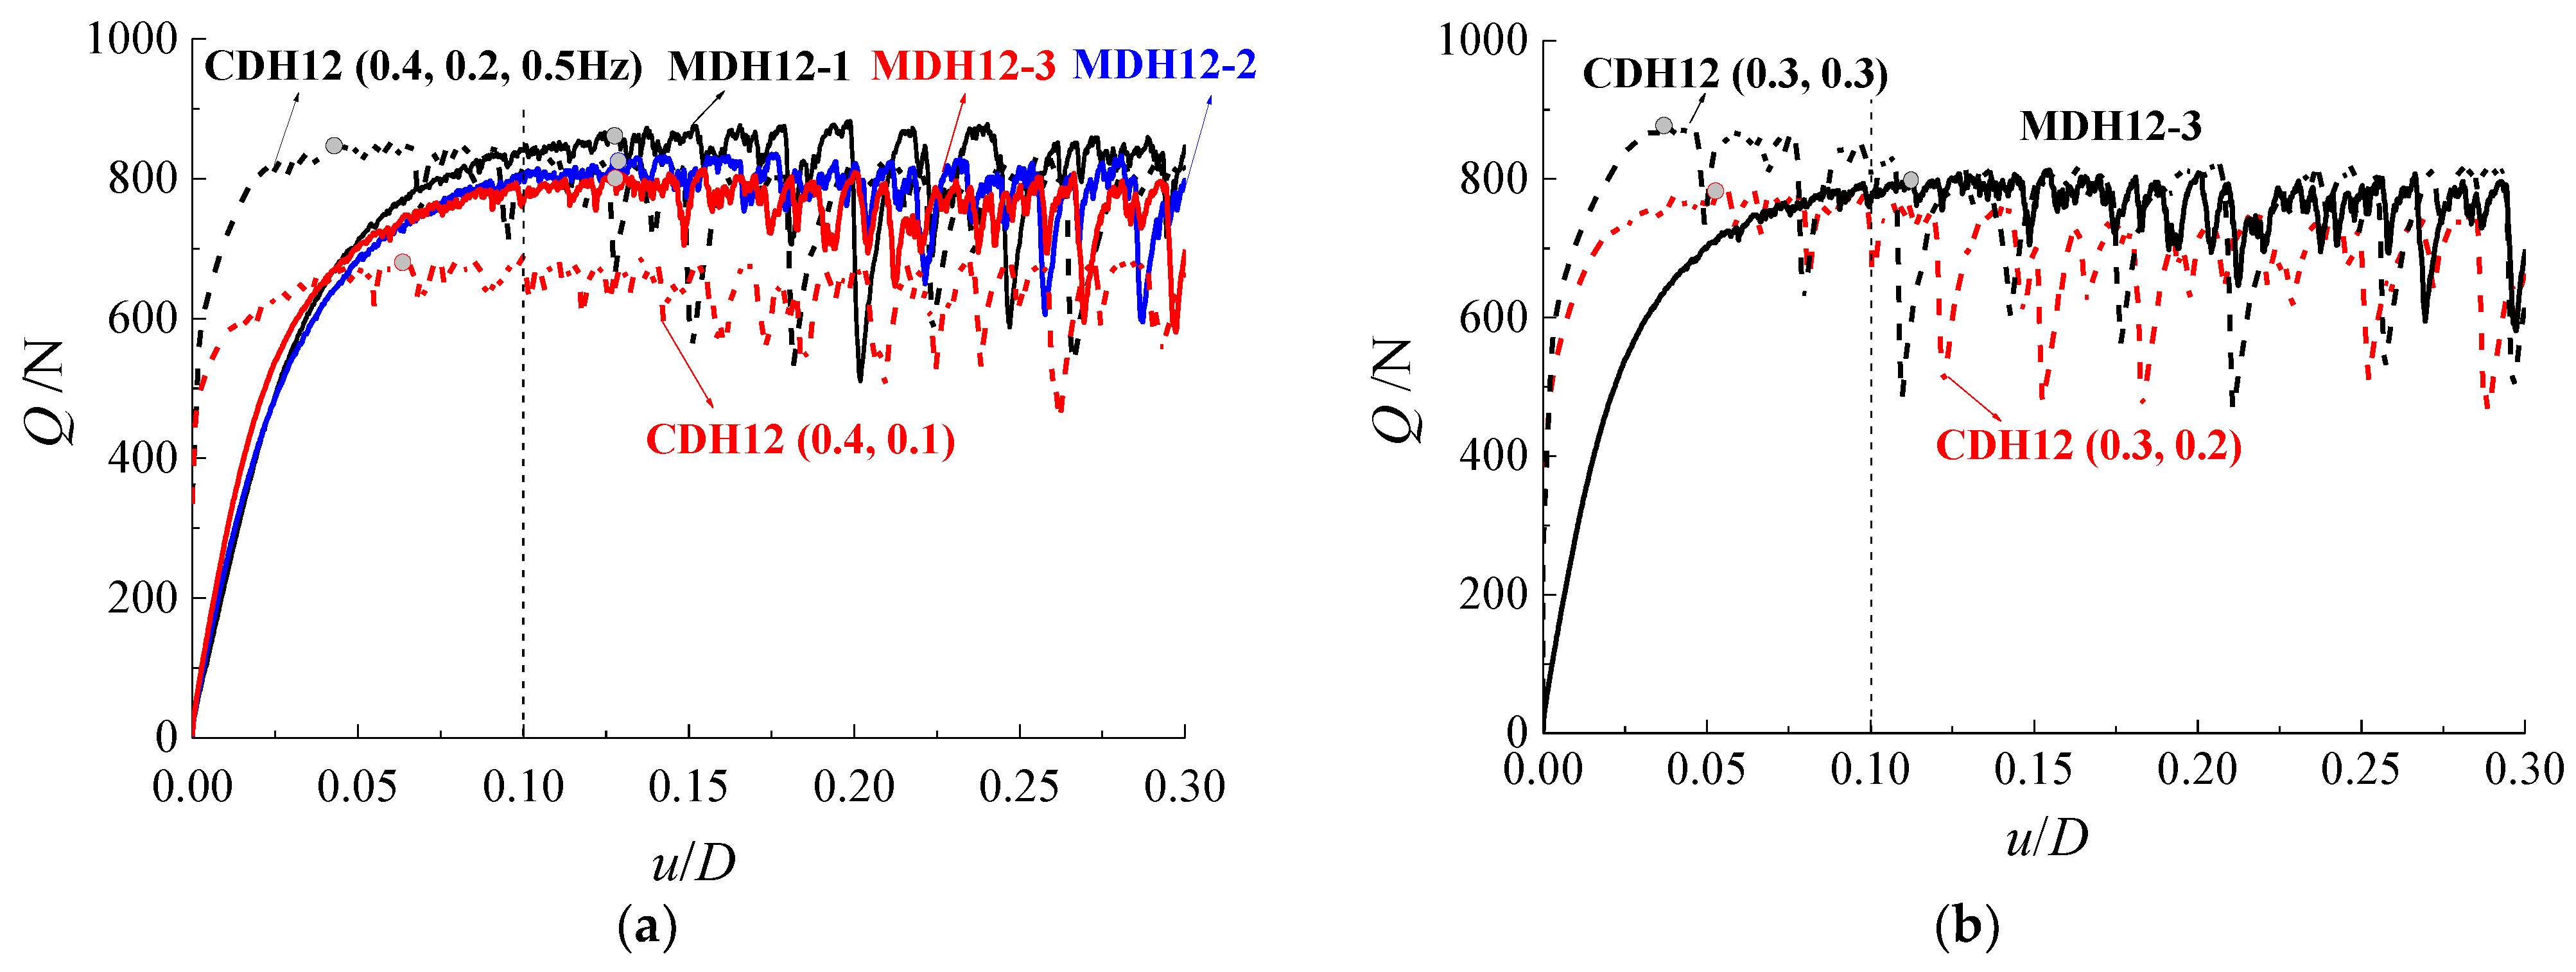
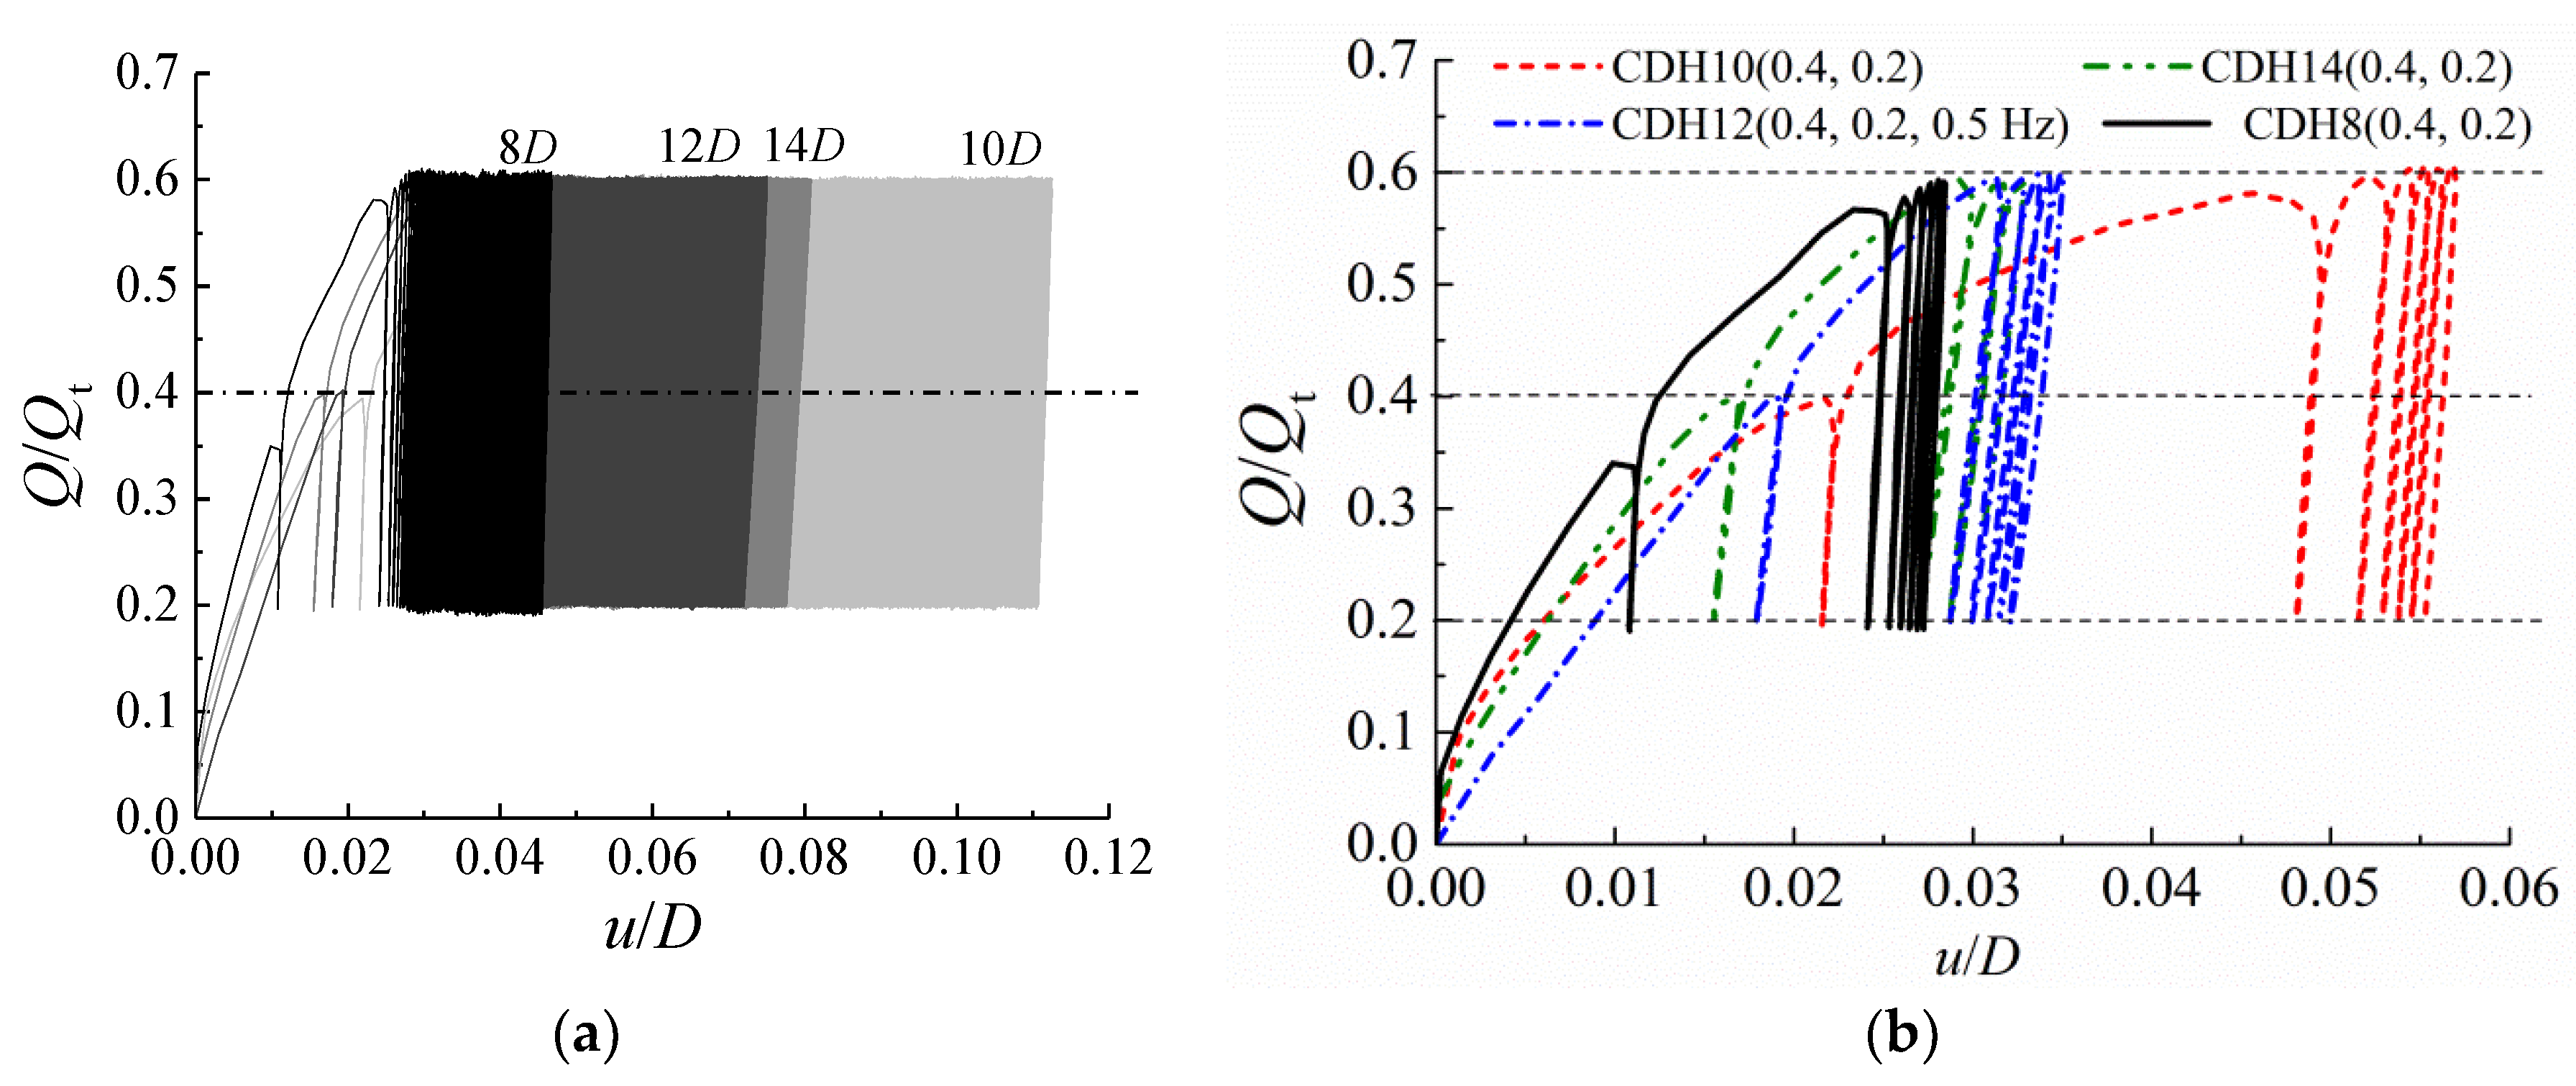
- Post-cyclic monotonic response and uplift capacity
3.1.2. Results for Different Amplitudes and Mean Cyclic Loads
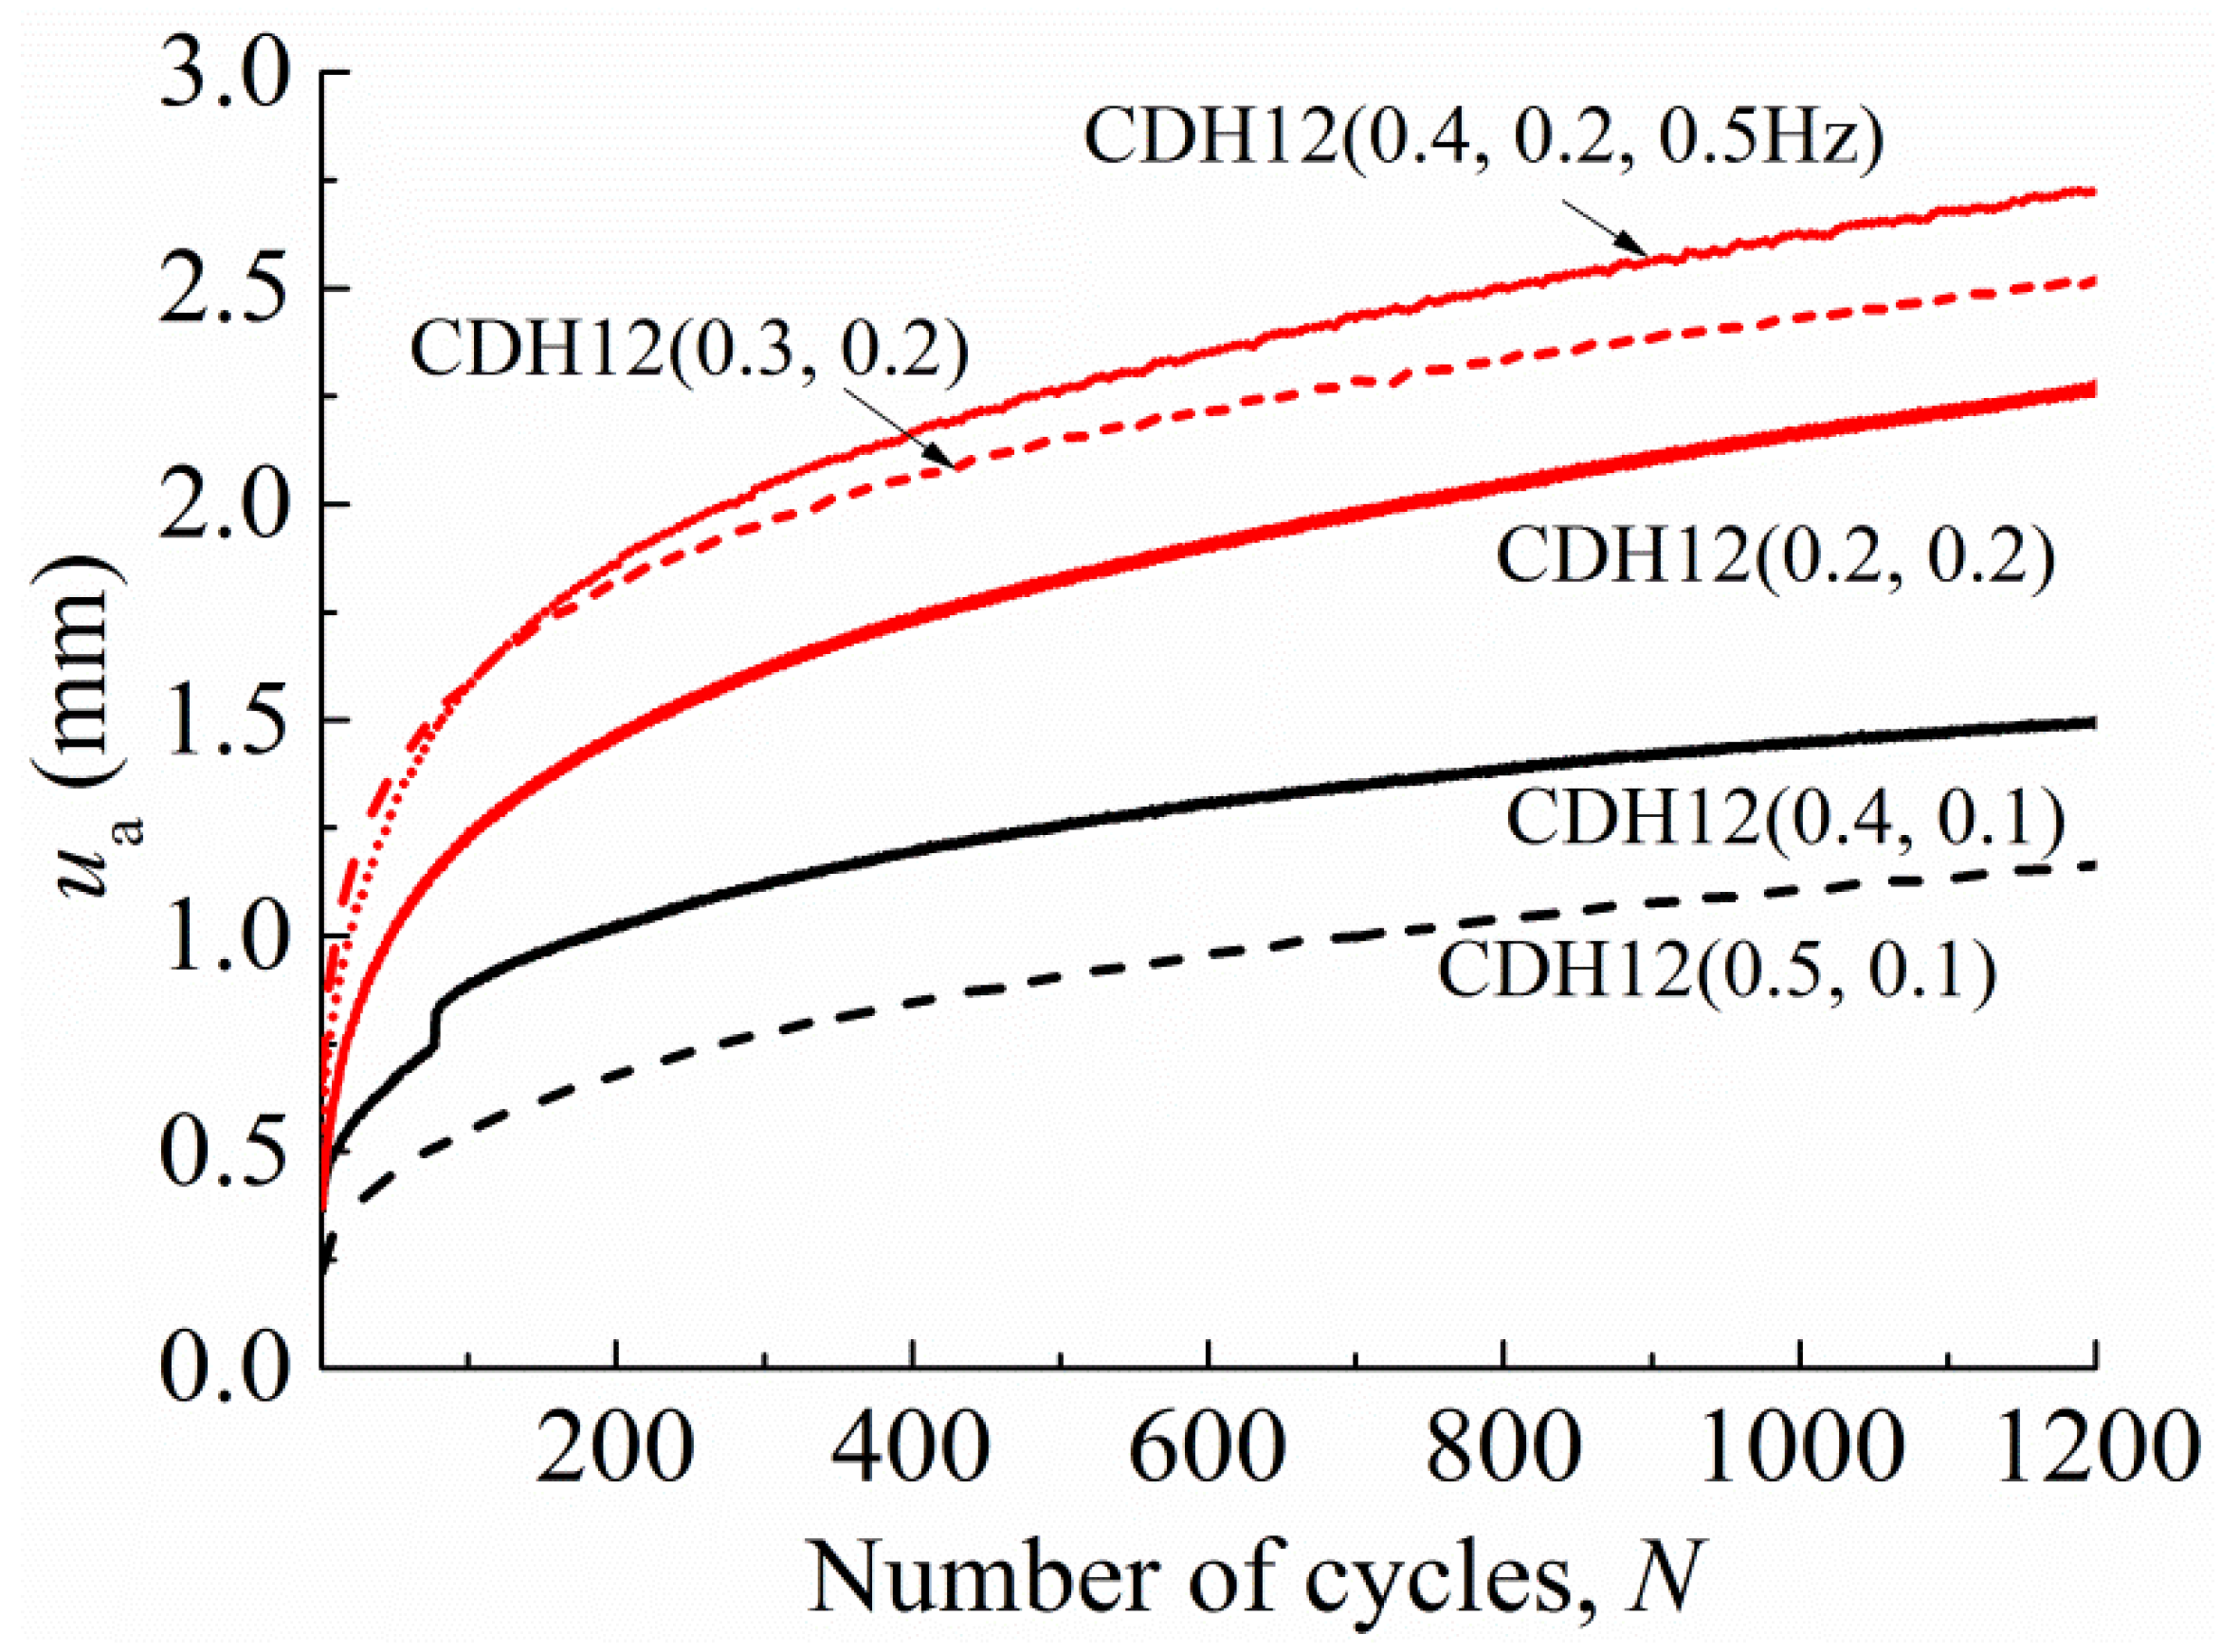
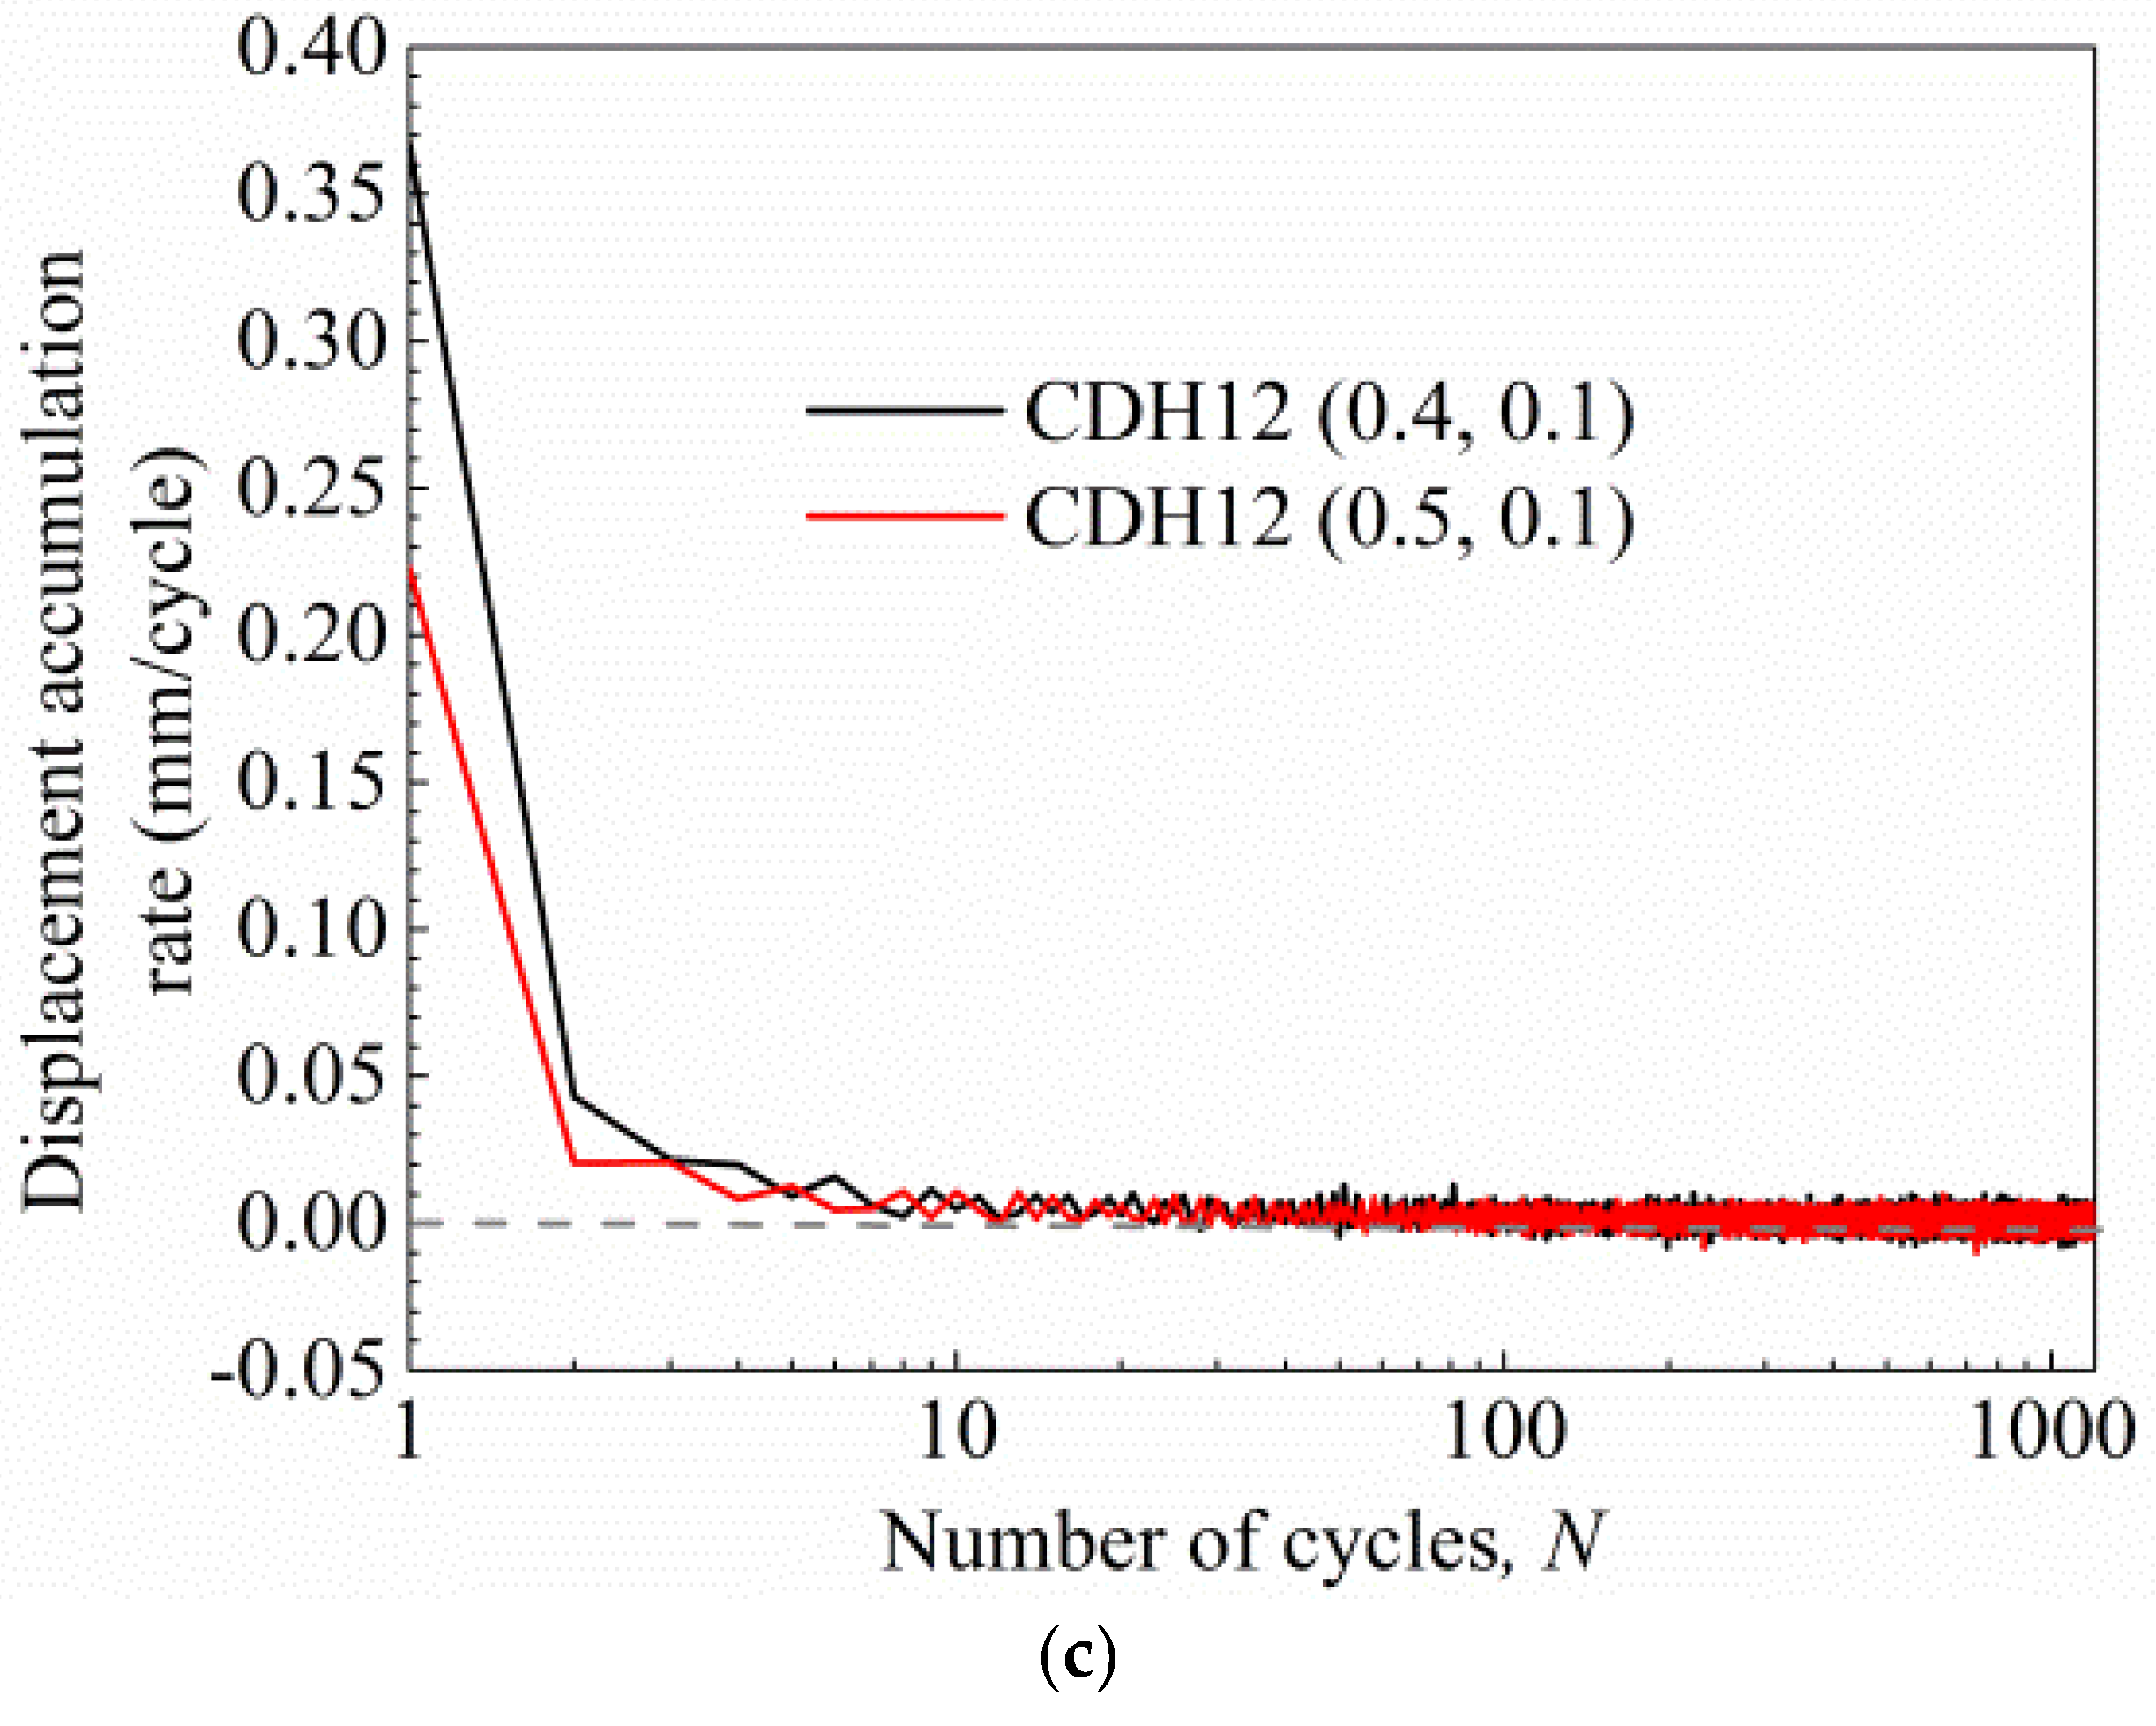
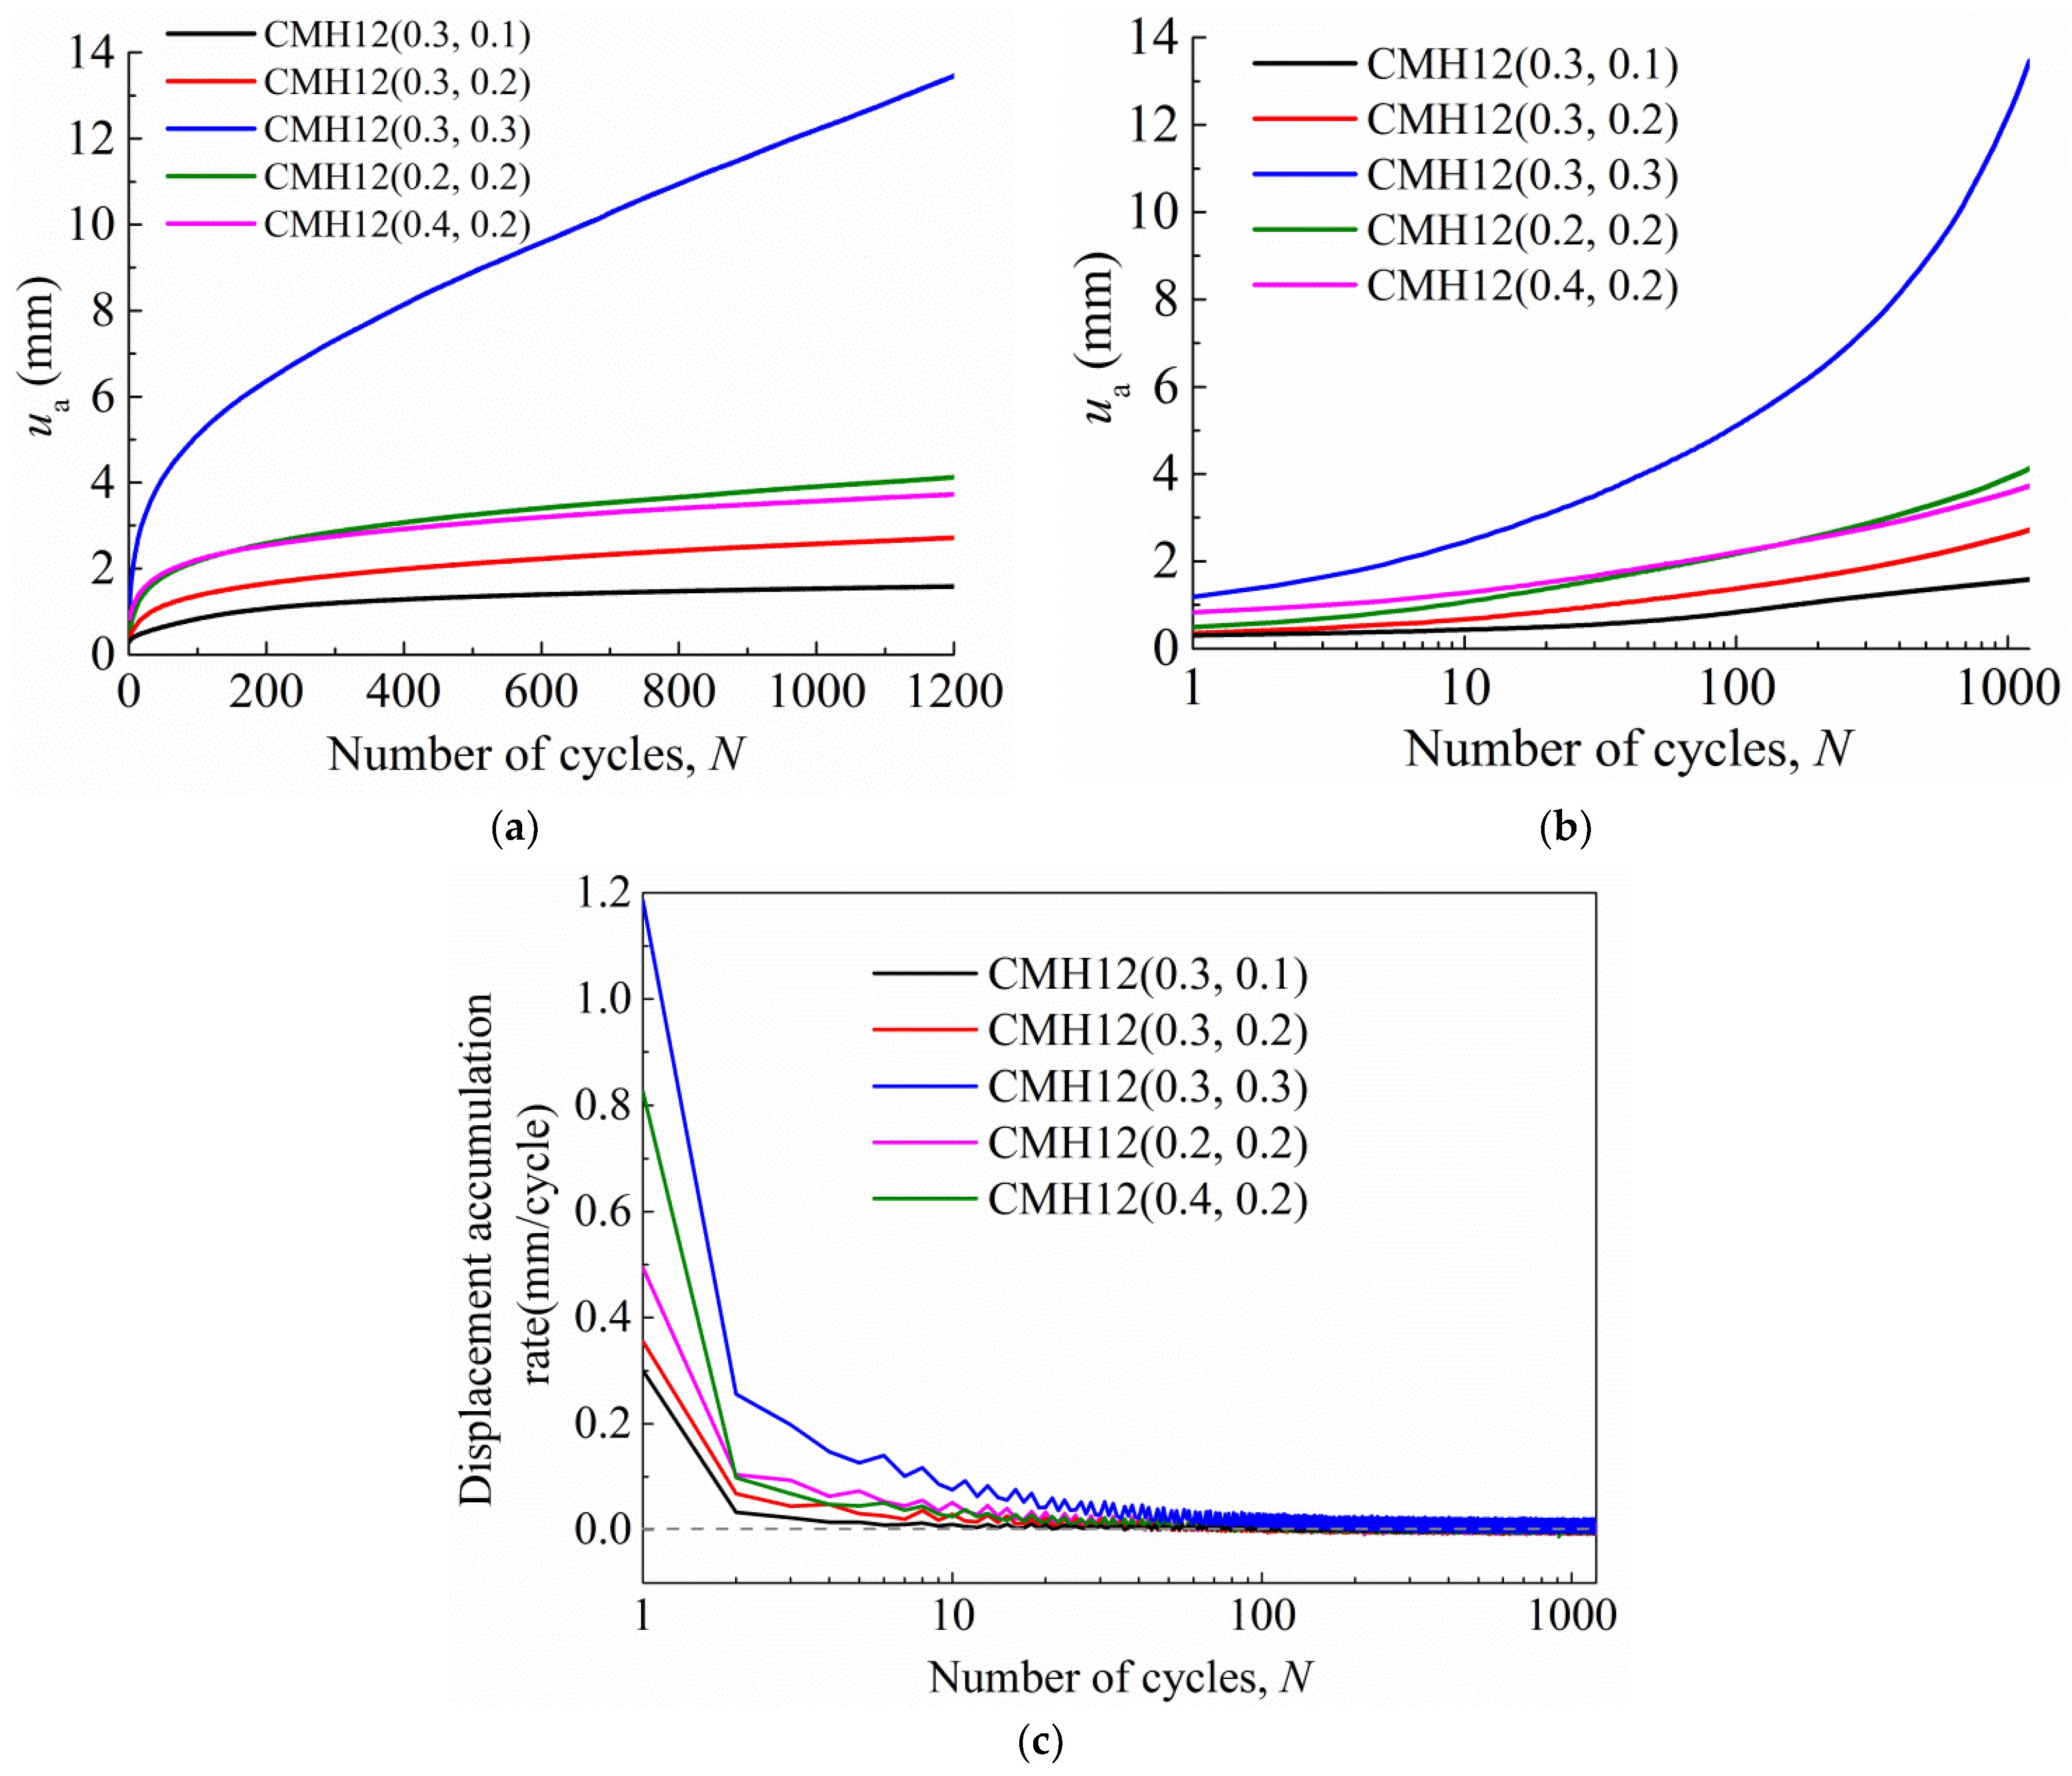
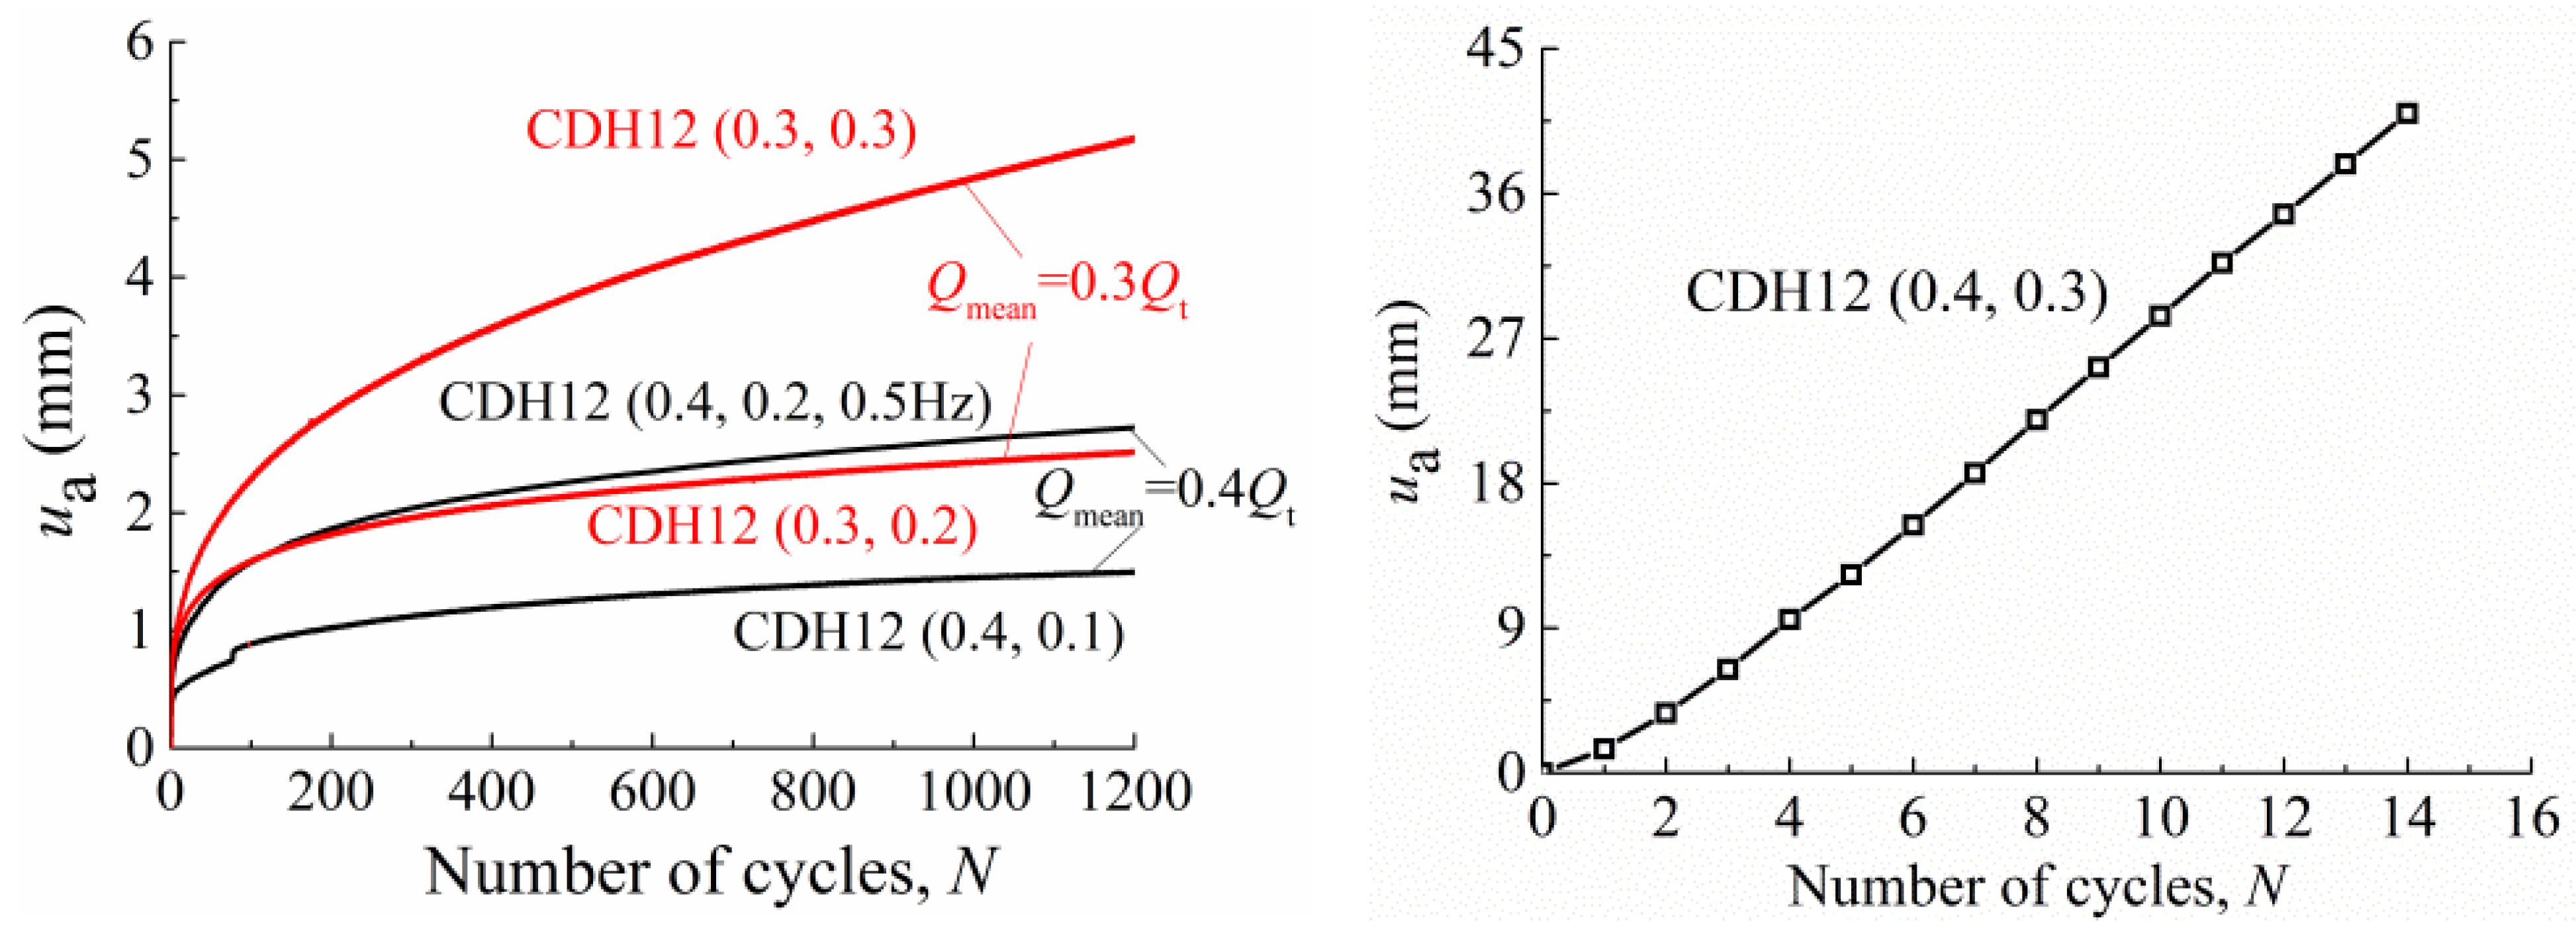
- Accumulated displacement
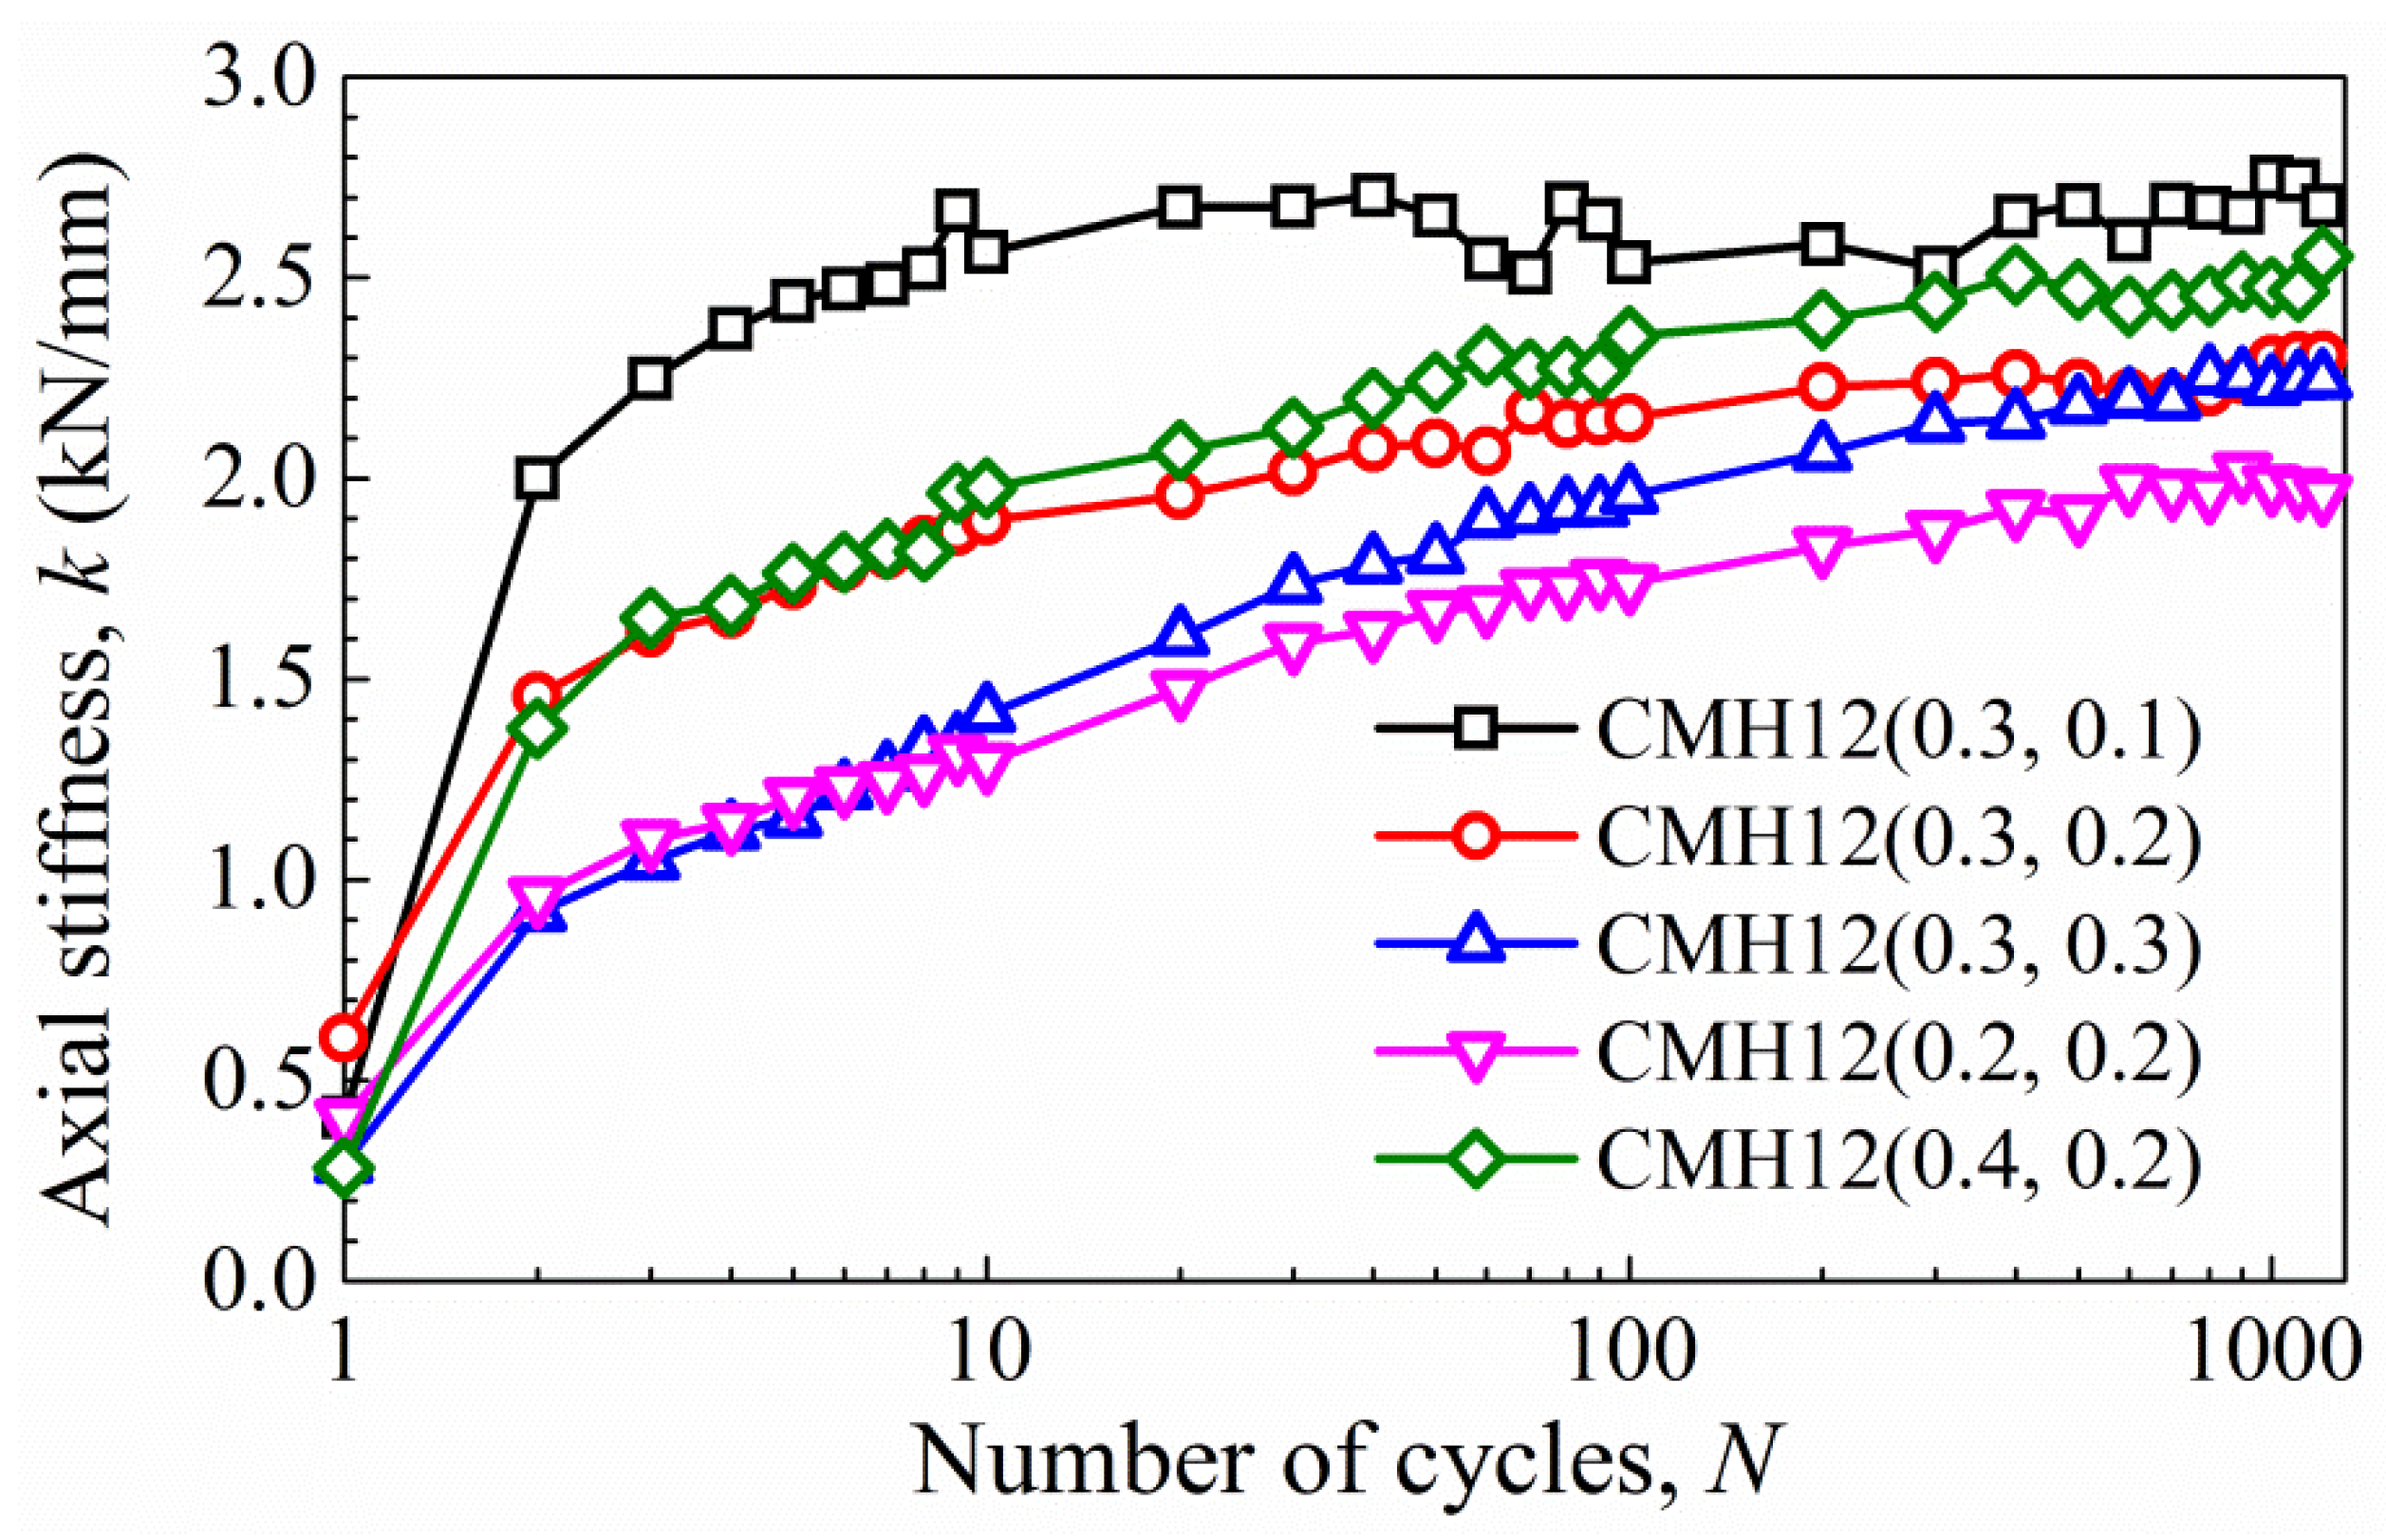
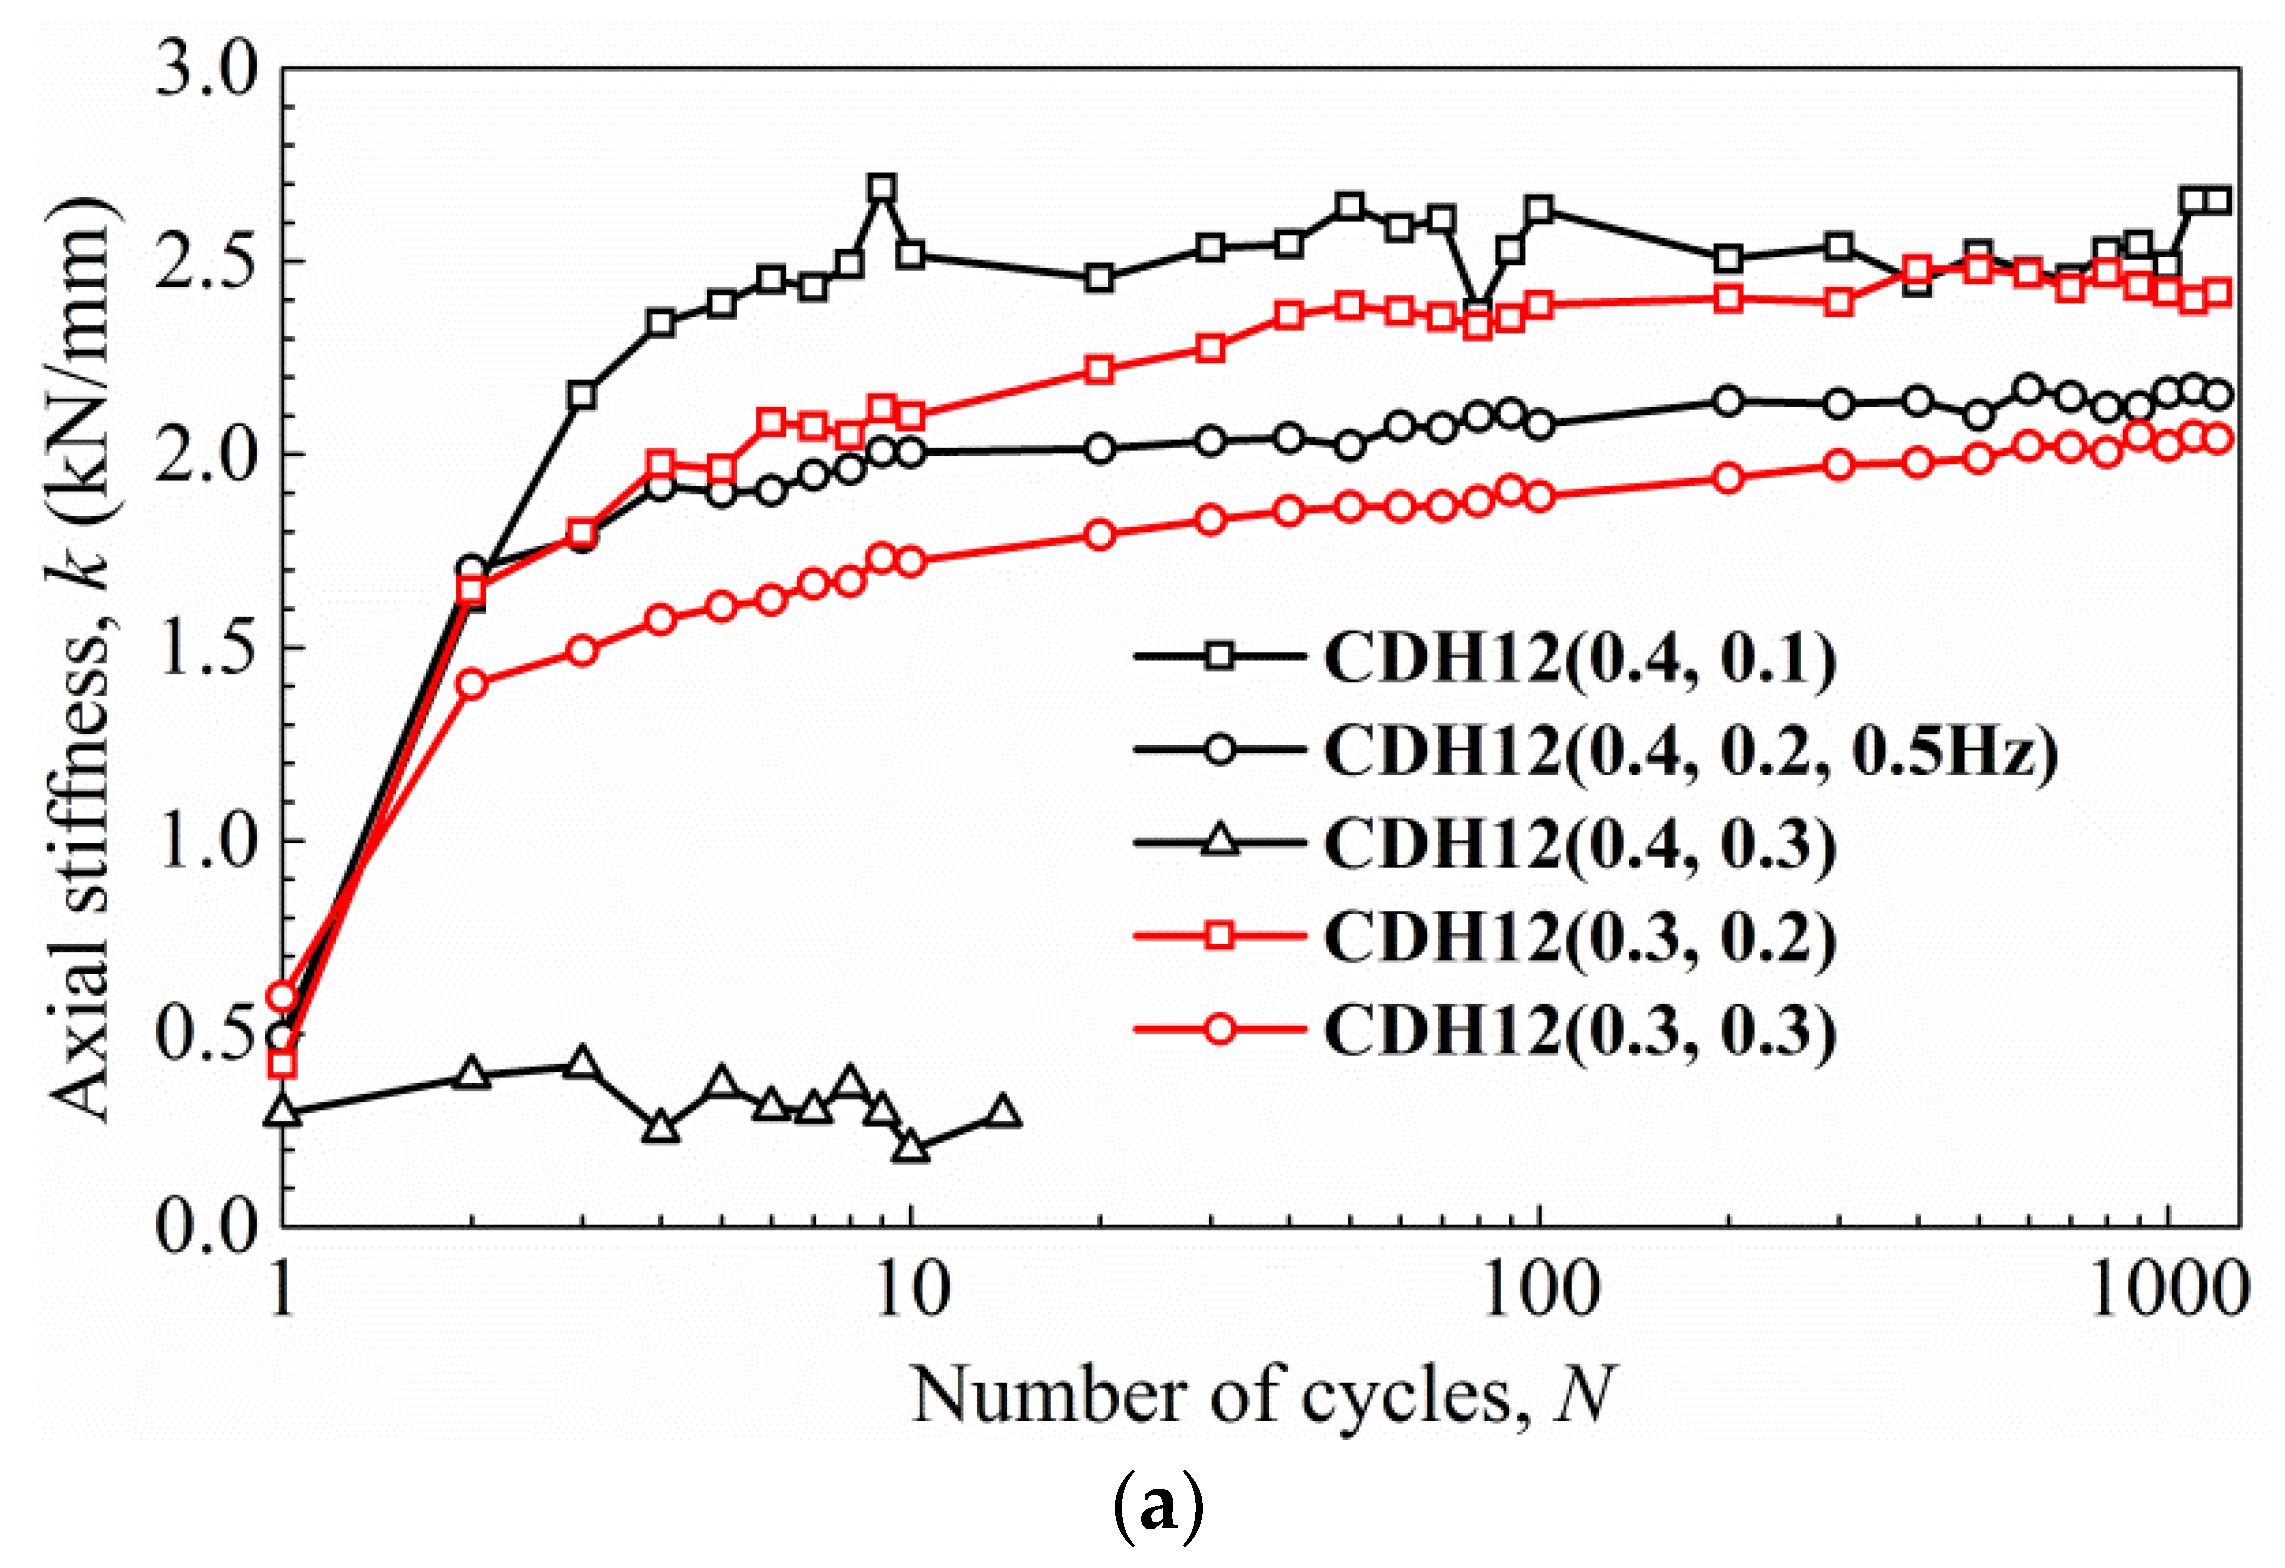
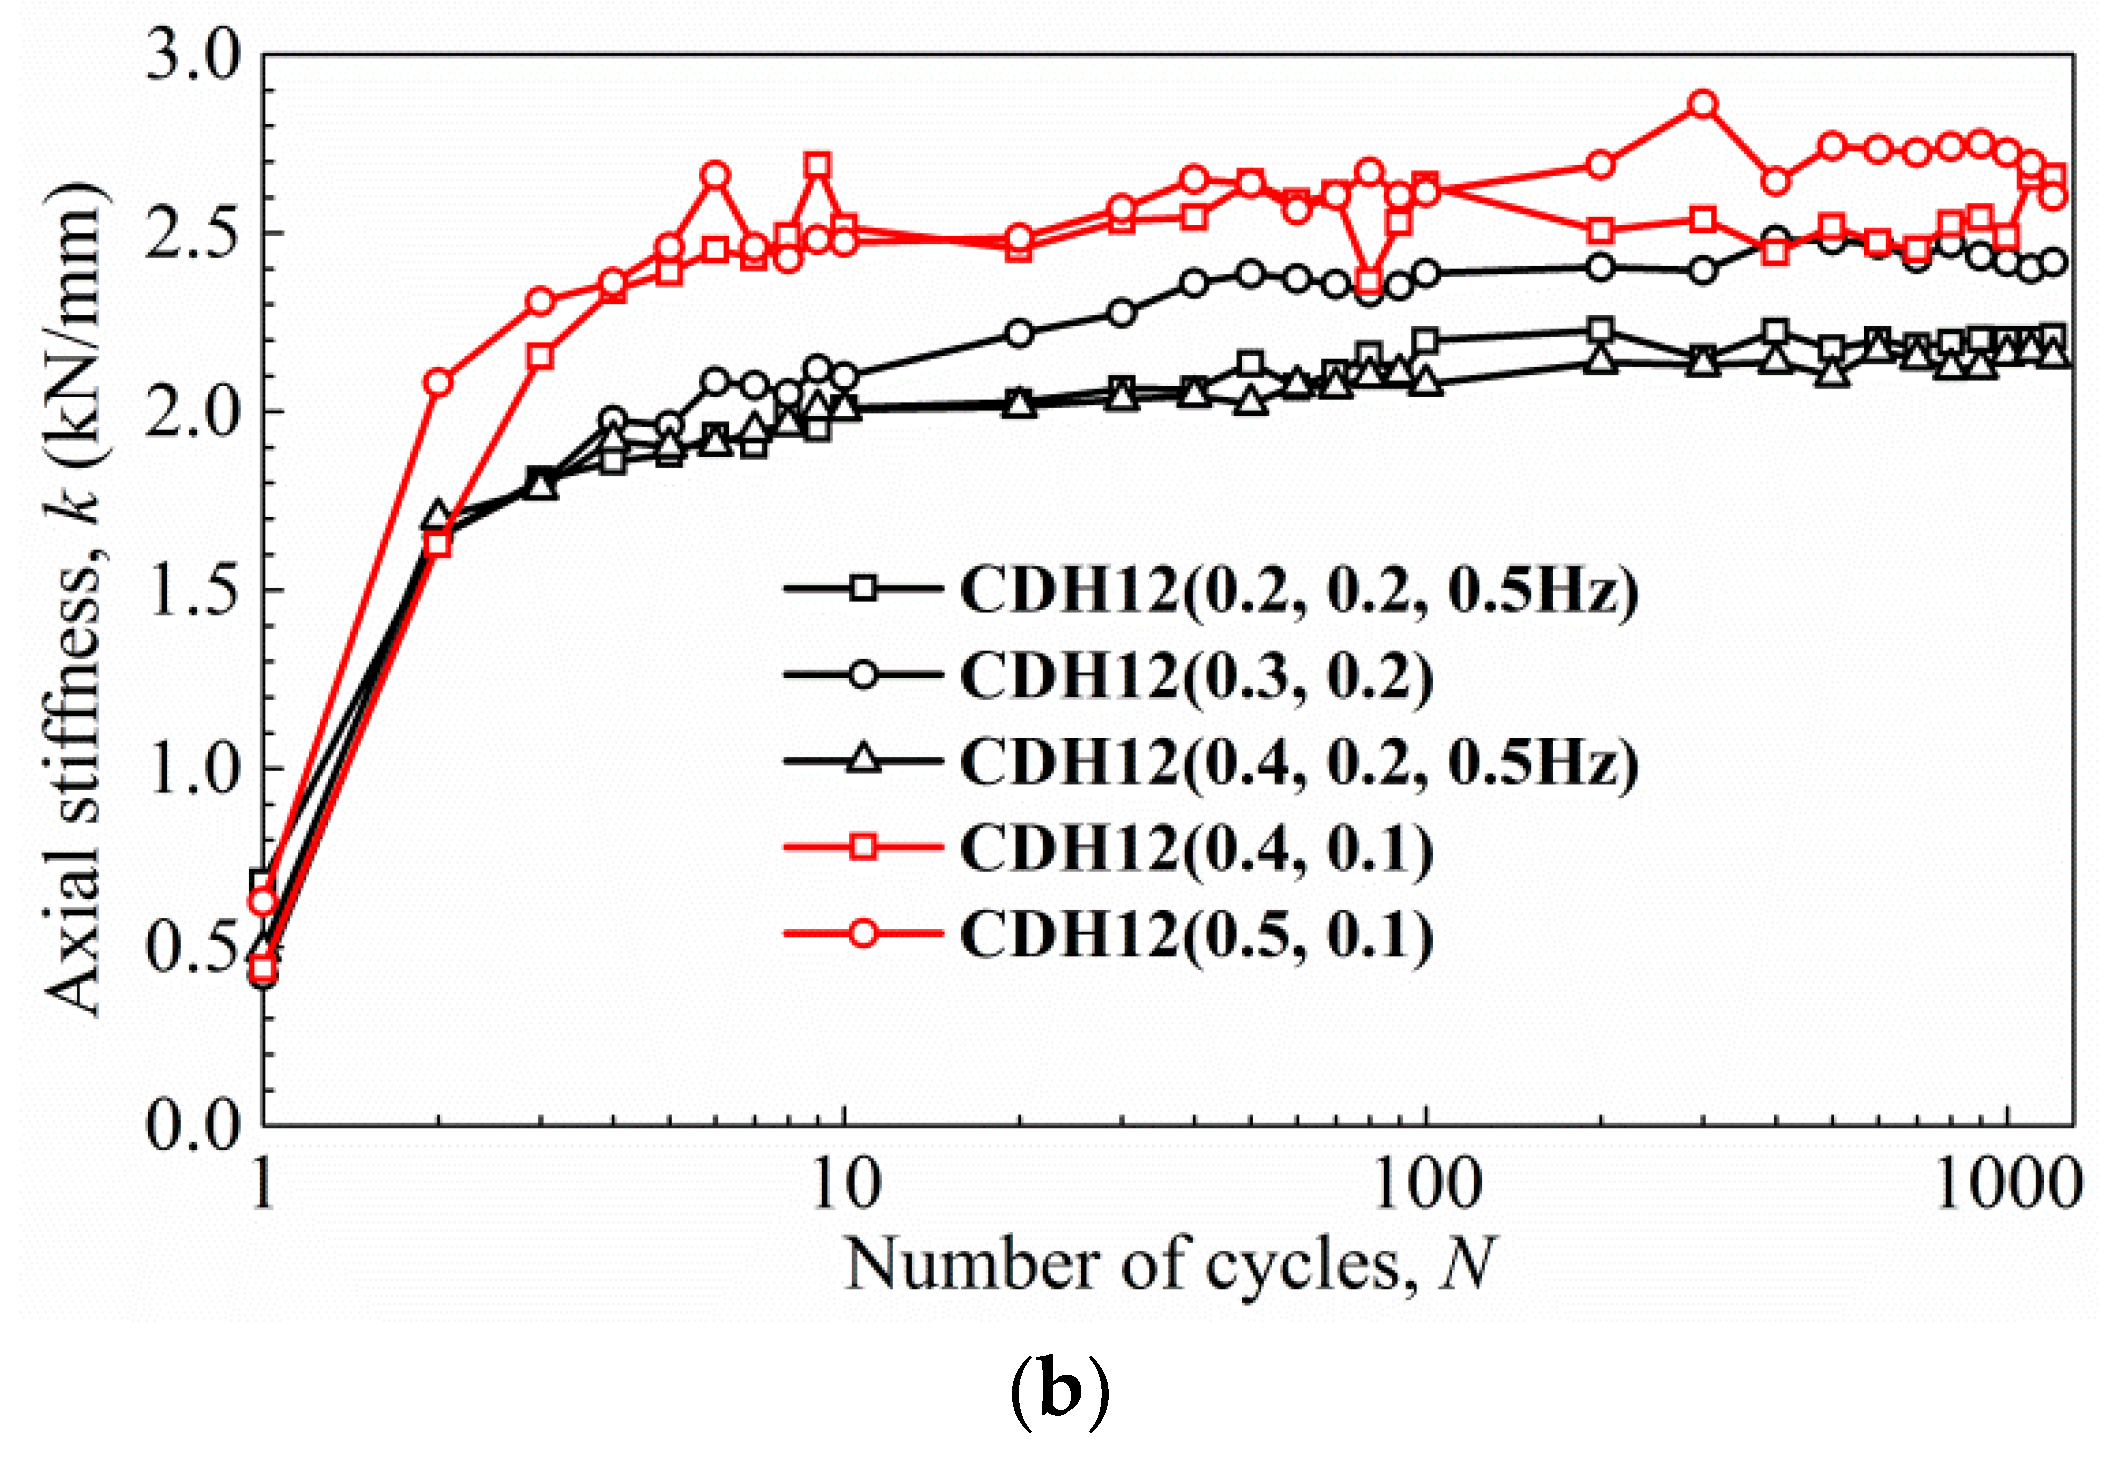
- Axial stiffness
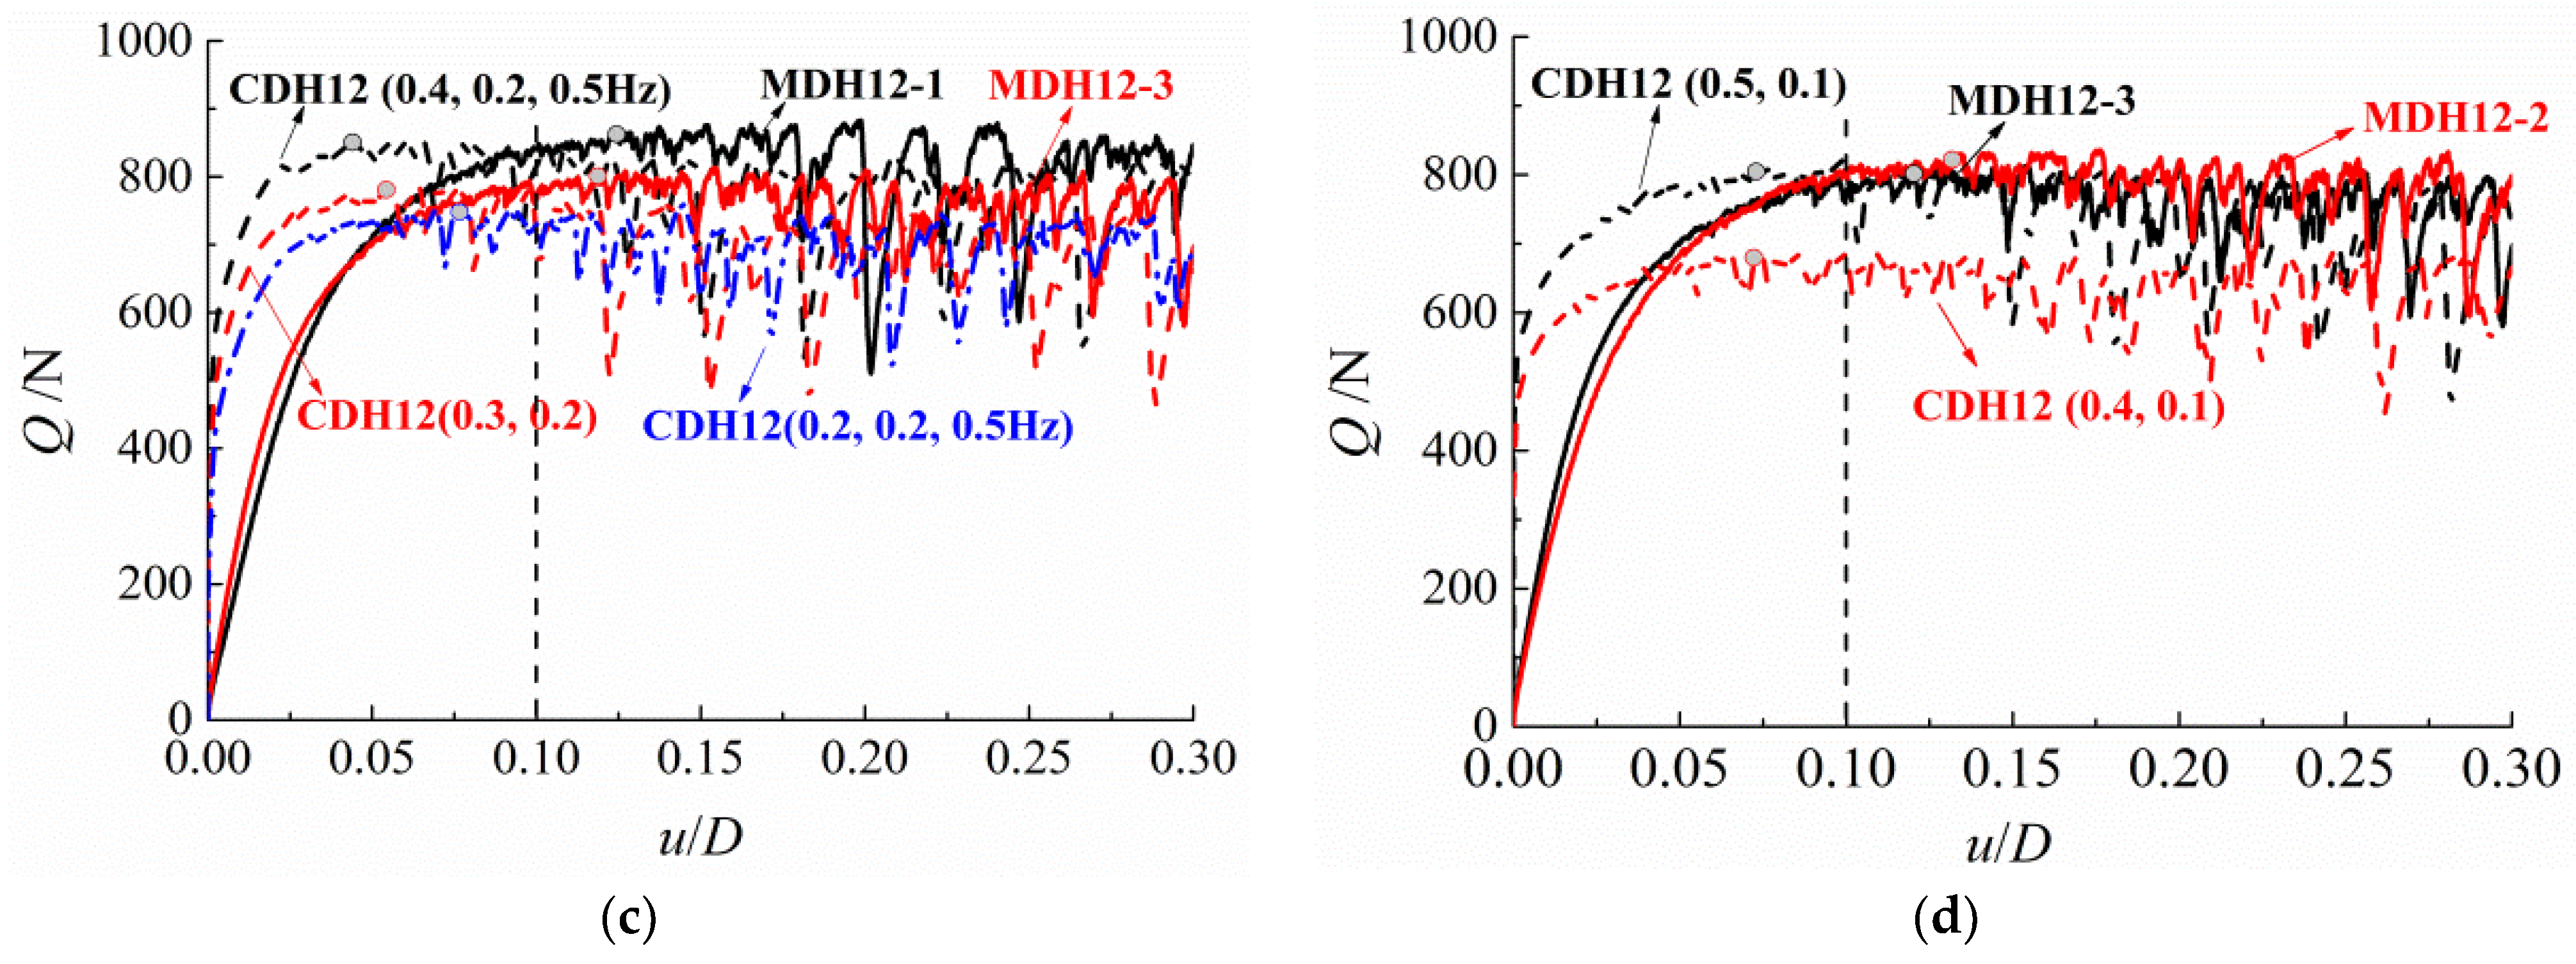
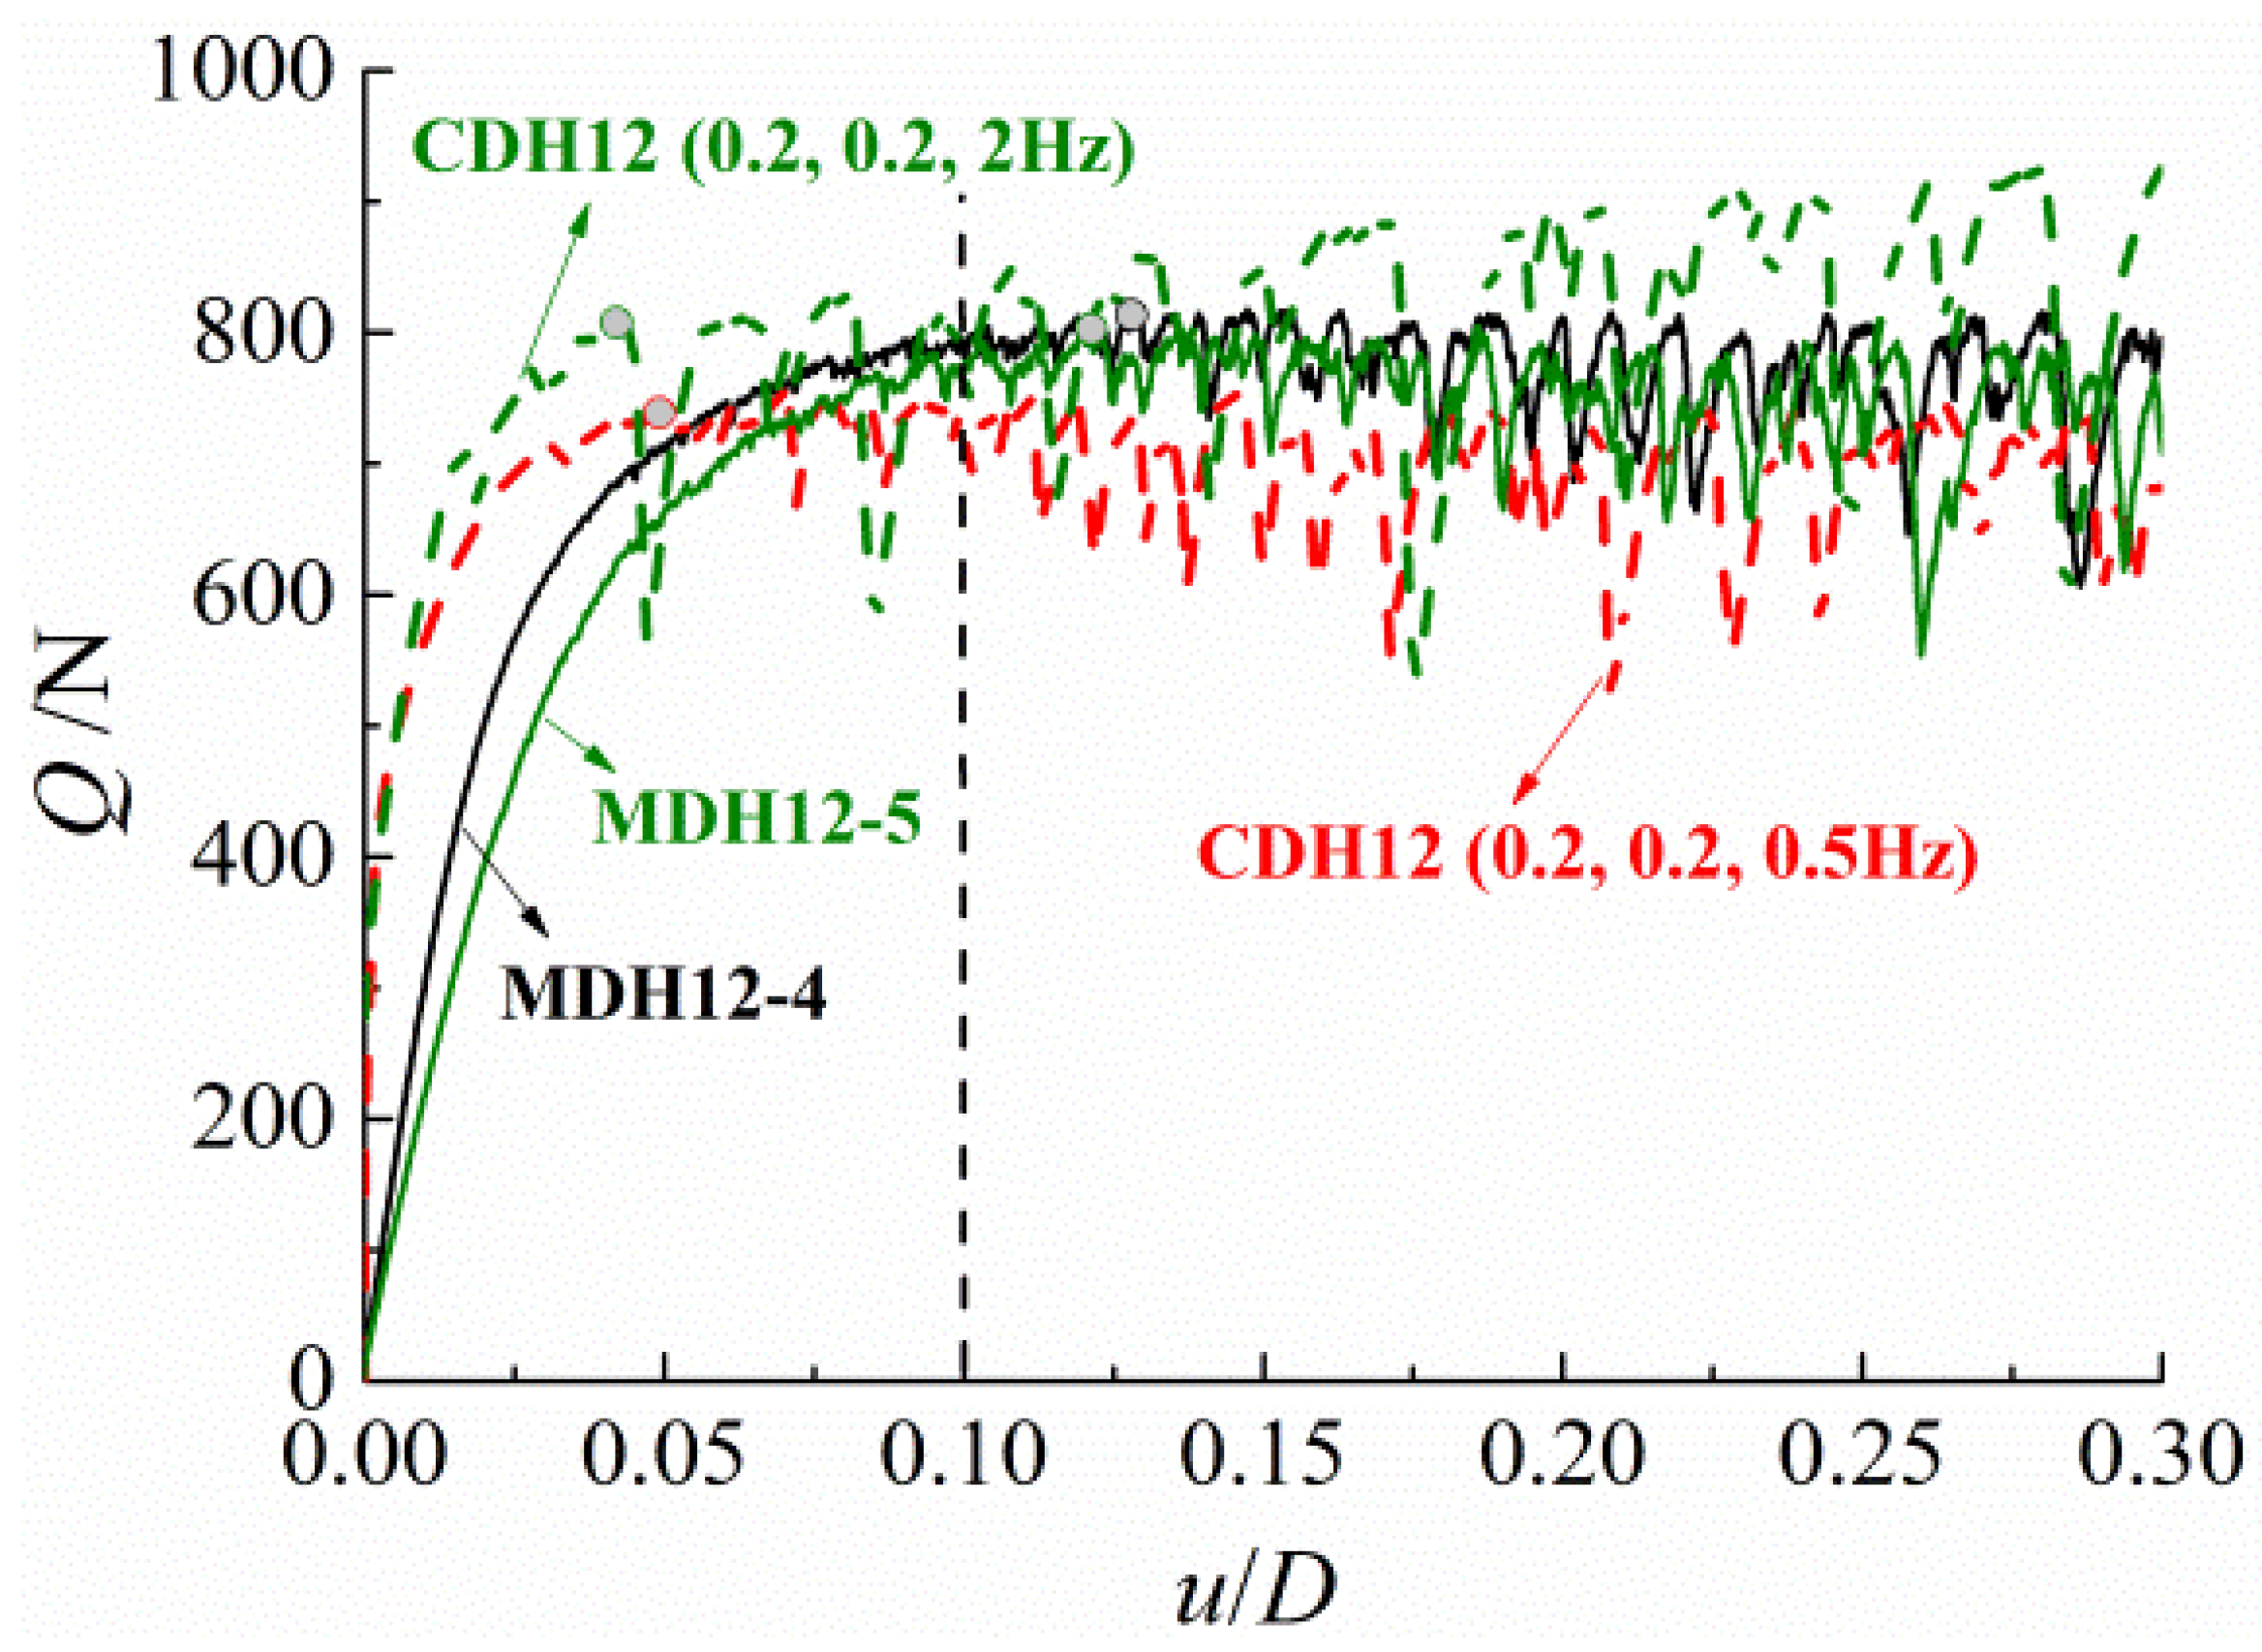
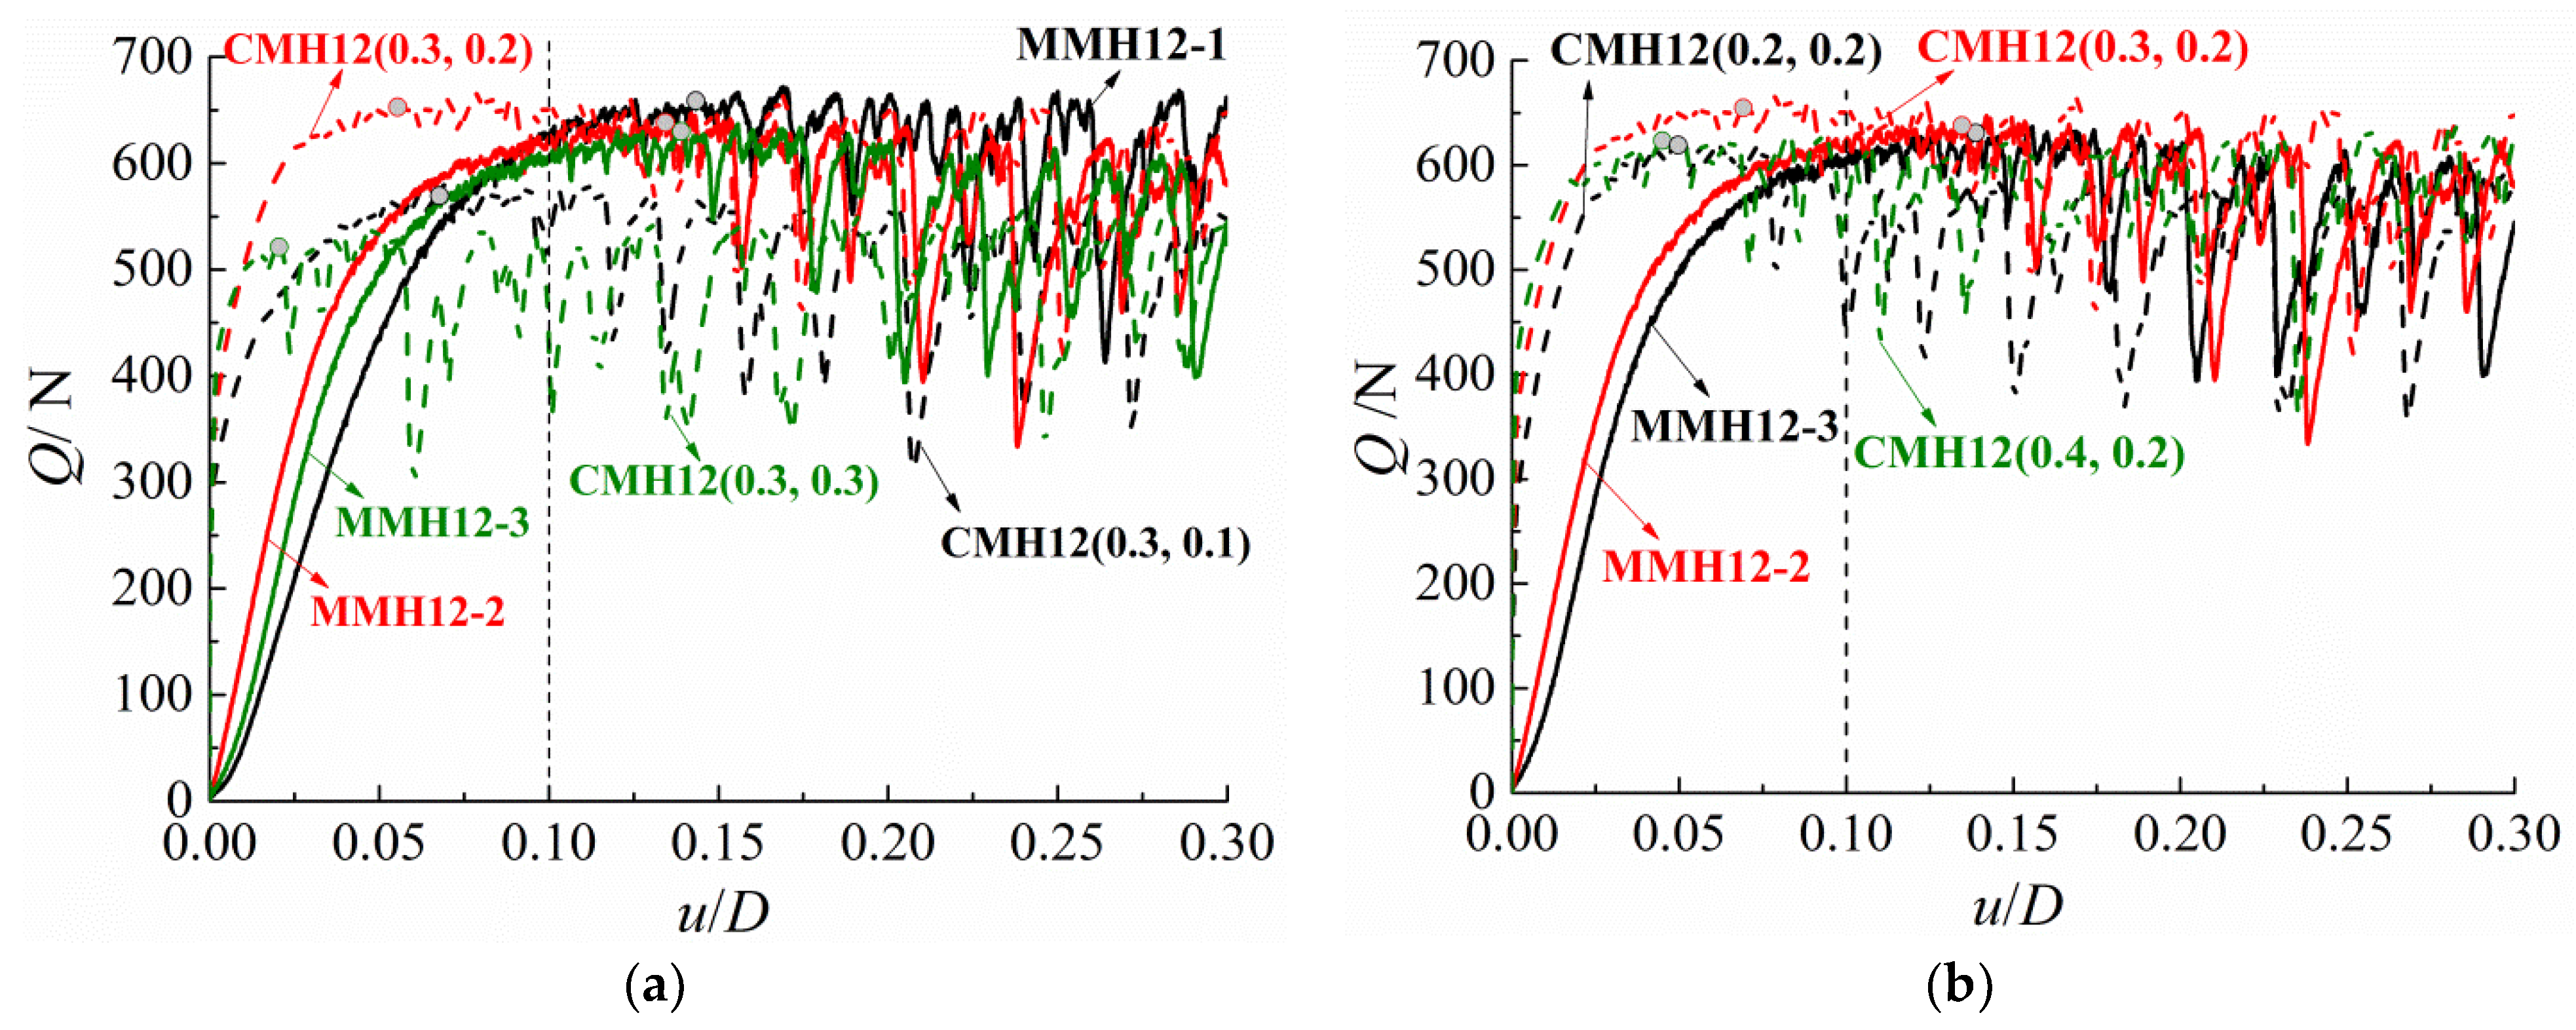
- Post-cyclic monotonic response and uplift capacity
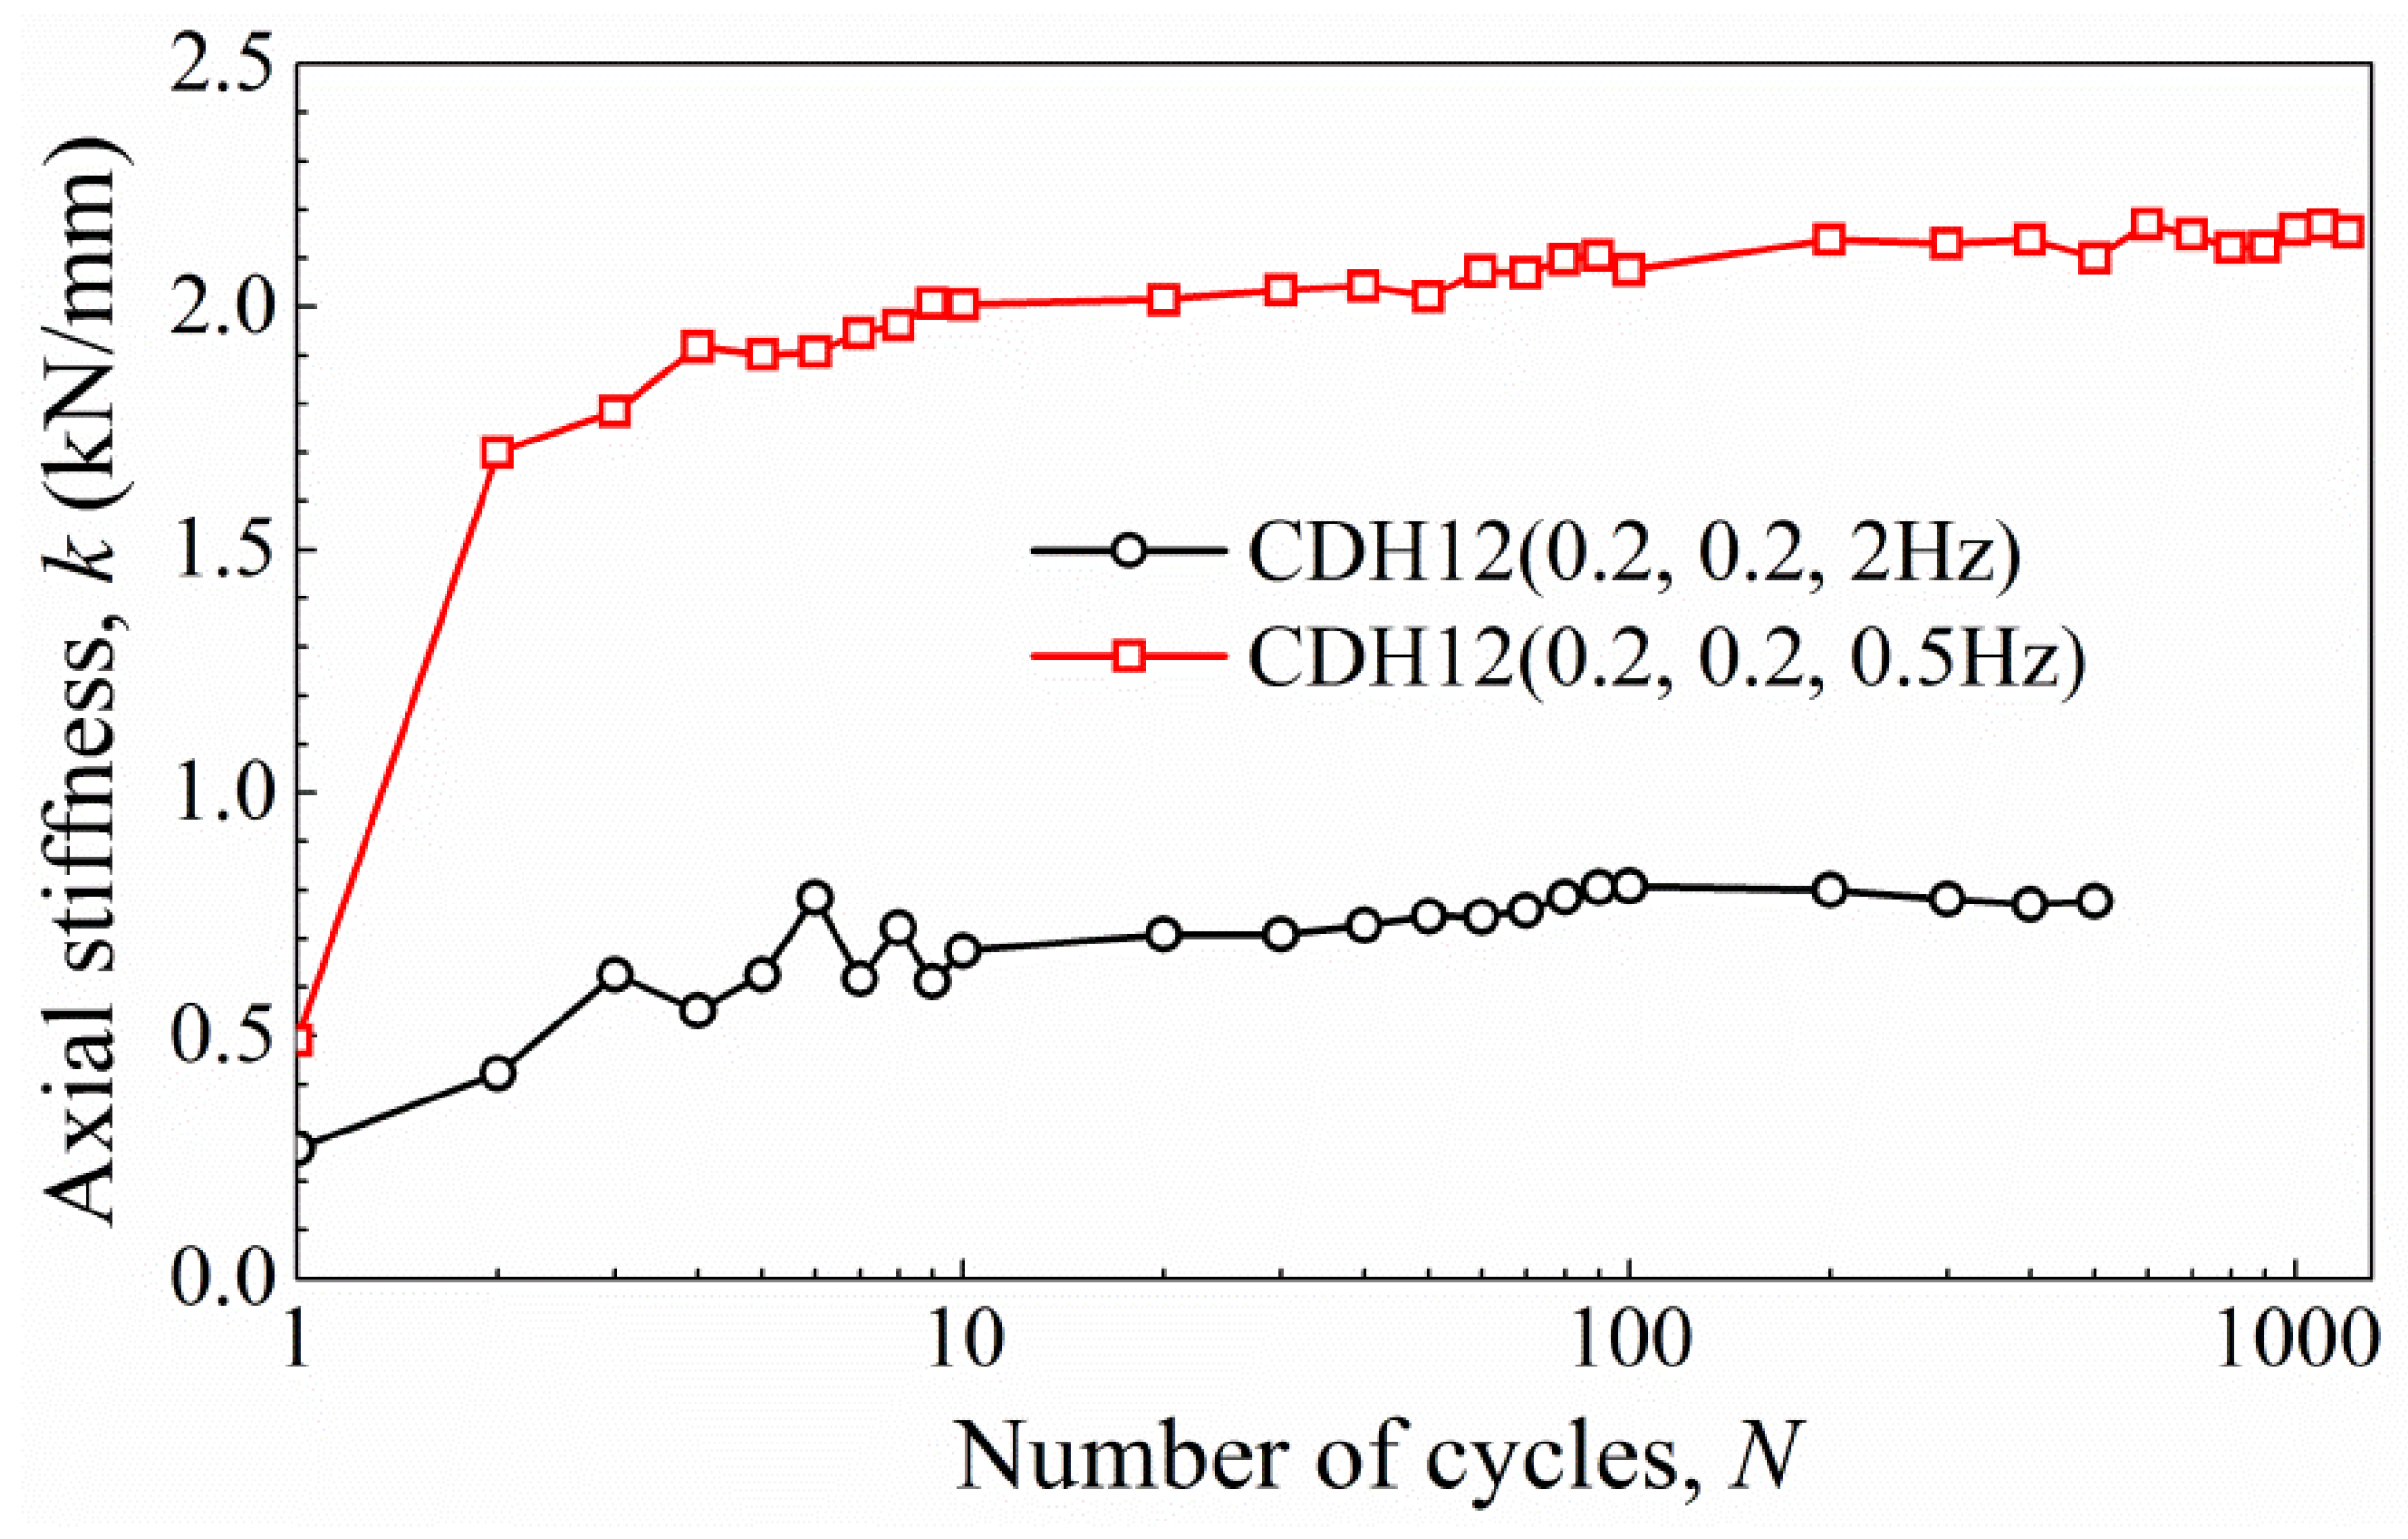
3.1.3. Results for Different Cyclic Loading Frequencies
3.2. Test Results in Medium–Dense Sand
- Accumulated displacement and axial stiffness
- Post-cyclic monotonic response and uplift capacity
4. Discussion
5. Conclusions
- The single-helix anchor in dense sand with an optimal embedment ratio that is determined according to the relationship between breakout factors and embedment ratio under monotonic loading still exhibits a relatively high uplift capacity after cyclic loading. The post-cyclic monotonic responses of all the anchors exhibit stiffer behaviors.
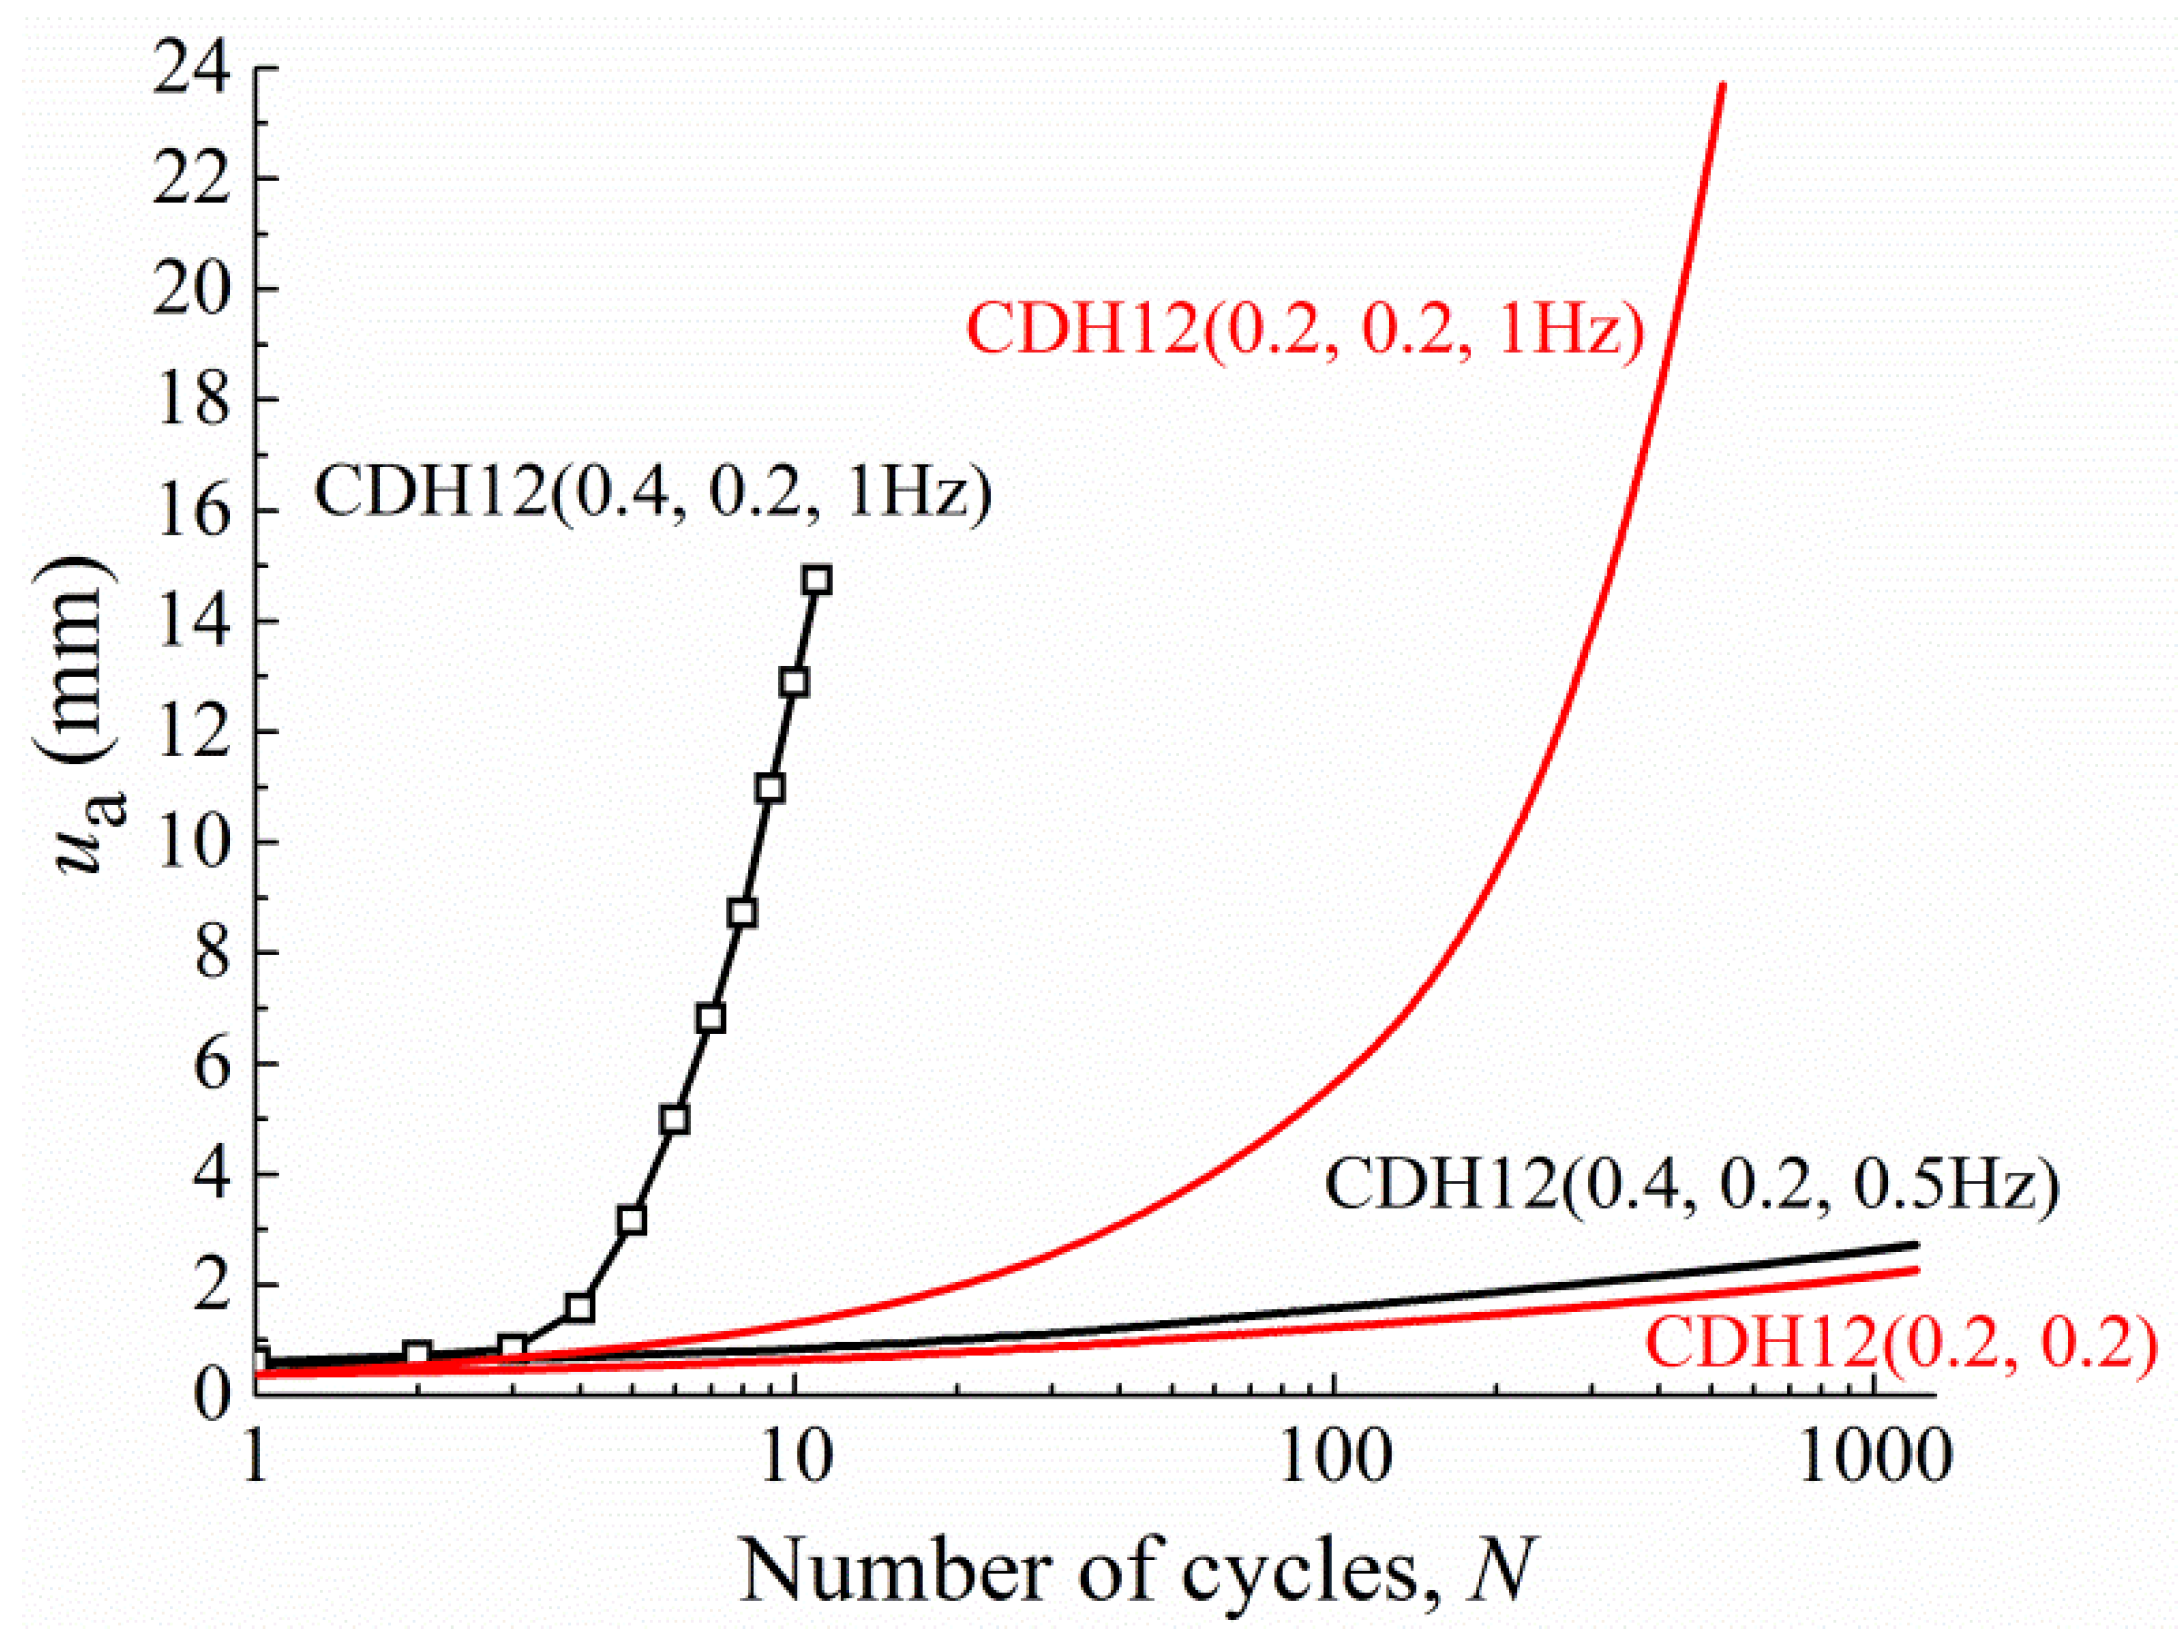
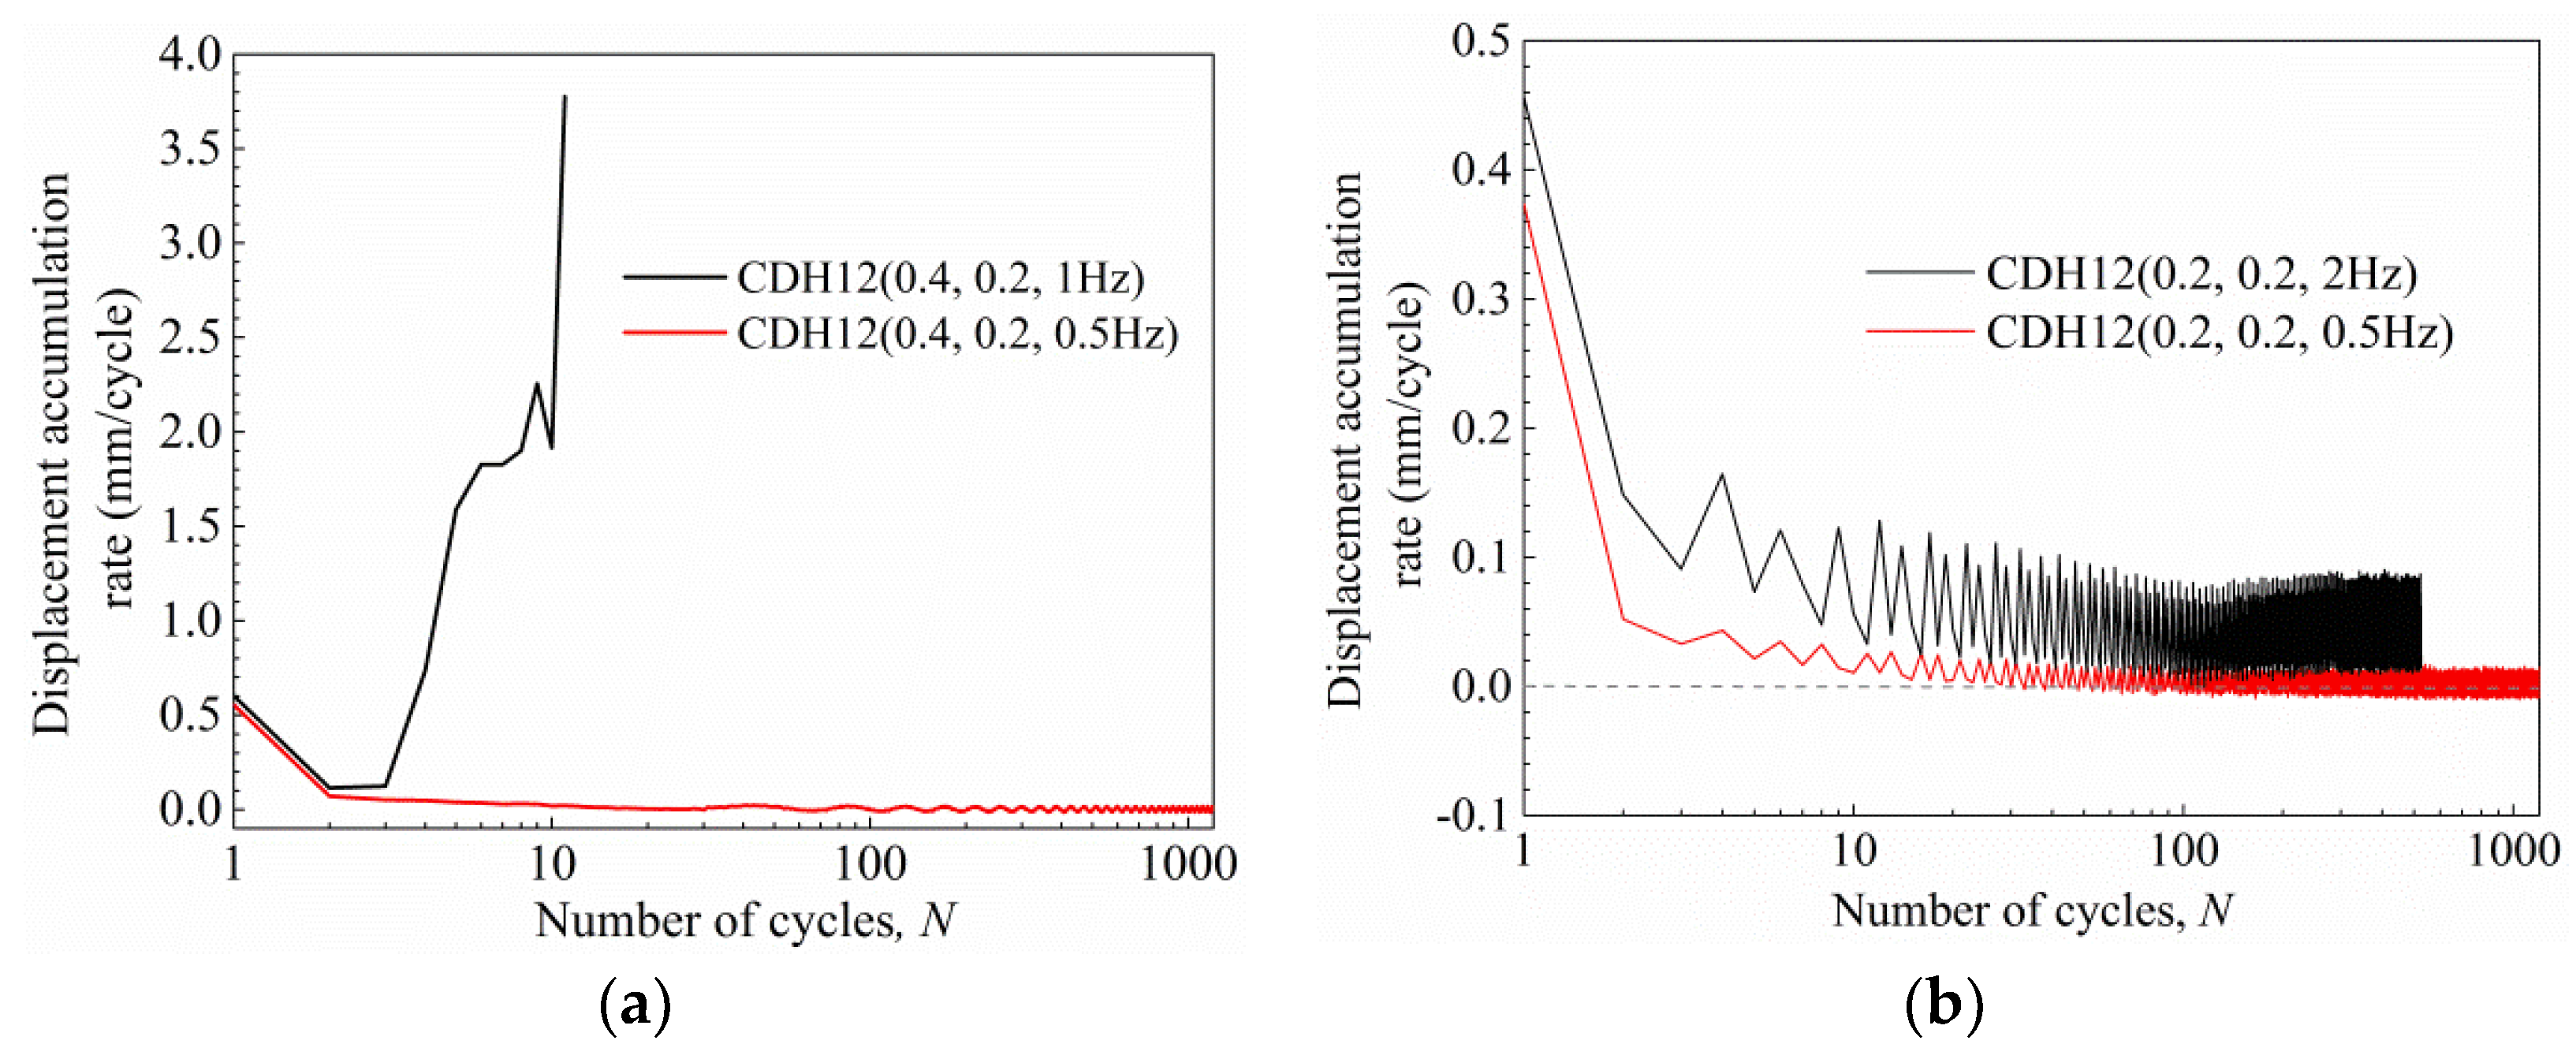
- The anchors in both dense sand and medium–dense sand subjected to greater amplitude ratios will produce greater accumulated displacement when the same frequency and mean cyclic load ratio are applied. The influence of the mean cyclic load ratio on the accumulated displacement of anchors in dense sand may be affected by the amplitude. Under the same medium amplitude ratio, the anchor in dense sand subjected to a greater mean cyclic load ratio will produce a larger accumulated displacement, which is similar to the anchor in medium–dense sand. Additionally, for the case of anchors with the same small amplitude in dense sand, the influence of the mean cyclic load ratio on the accumulated displacement is opposite. The cyclic frequency has the greatest influence on the accumulated displacement, and the influence of cyclic amplitude is relatively greater than that of the mean cyclic load ratio. For the anchors in both dense sand and medium–dense sand under the same maximum cyclic load ratio Qmax/Qt, the greater accumulated displacement is obtained when the anchors are subjected to a larger value of Qmean/Qt and a smaller value of Qcyc/Qt.
- There are some differences in the development of axial cyclic stiffness of single-helix anchors in medium–dense sand and dense sand. When the anchors in medium–dense sand are subjected to a small amplitude, the development between axial stiffness and cycle number is the same as that of dense sand, and axial stiffness tends to stabilize at 10 to 50 cycles. However, the axial stiffness of the anchors in medium–dense sand with a medium amplitude still rises slowly after 10 cycles, and becomes stable after 400 cycles. The ratio of stable axial stiffness and initial value of anchors in dense sand is between 3 and 6, and the ratio varies between 3.5 and 9 in medium–dense sand.
- The accumulated displacements at the first cycle and after cyclic loading in dense sand for the anchors under the same standardized cyclic load parameters are basically smaller than those in medium–dense dense sand, indicating that the anchor in dense sand has higher pullout resistance.
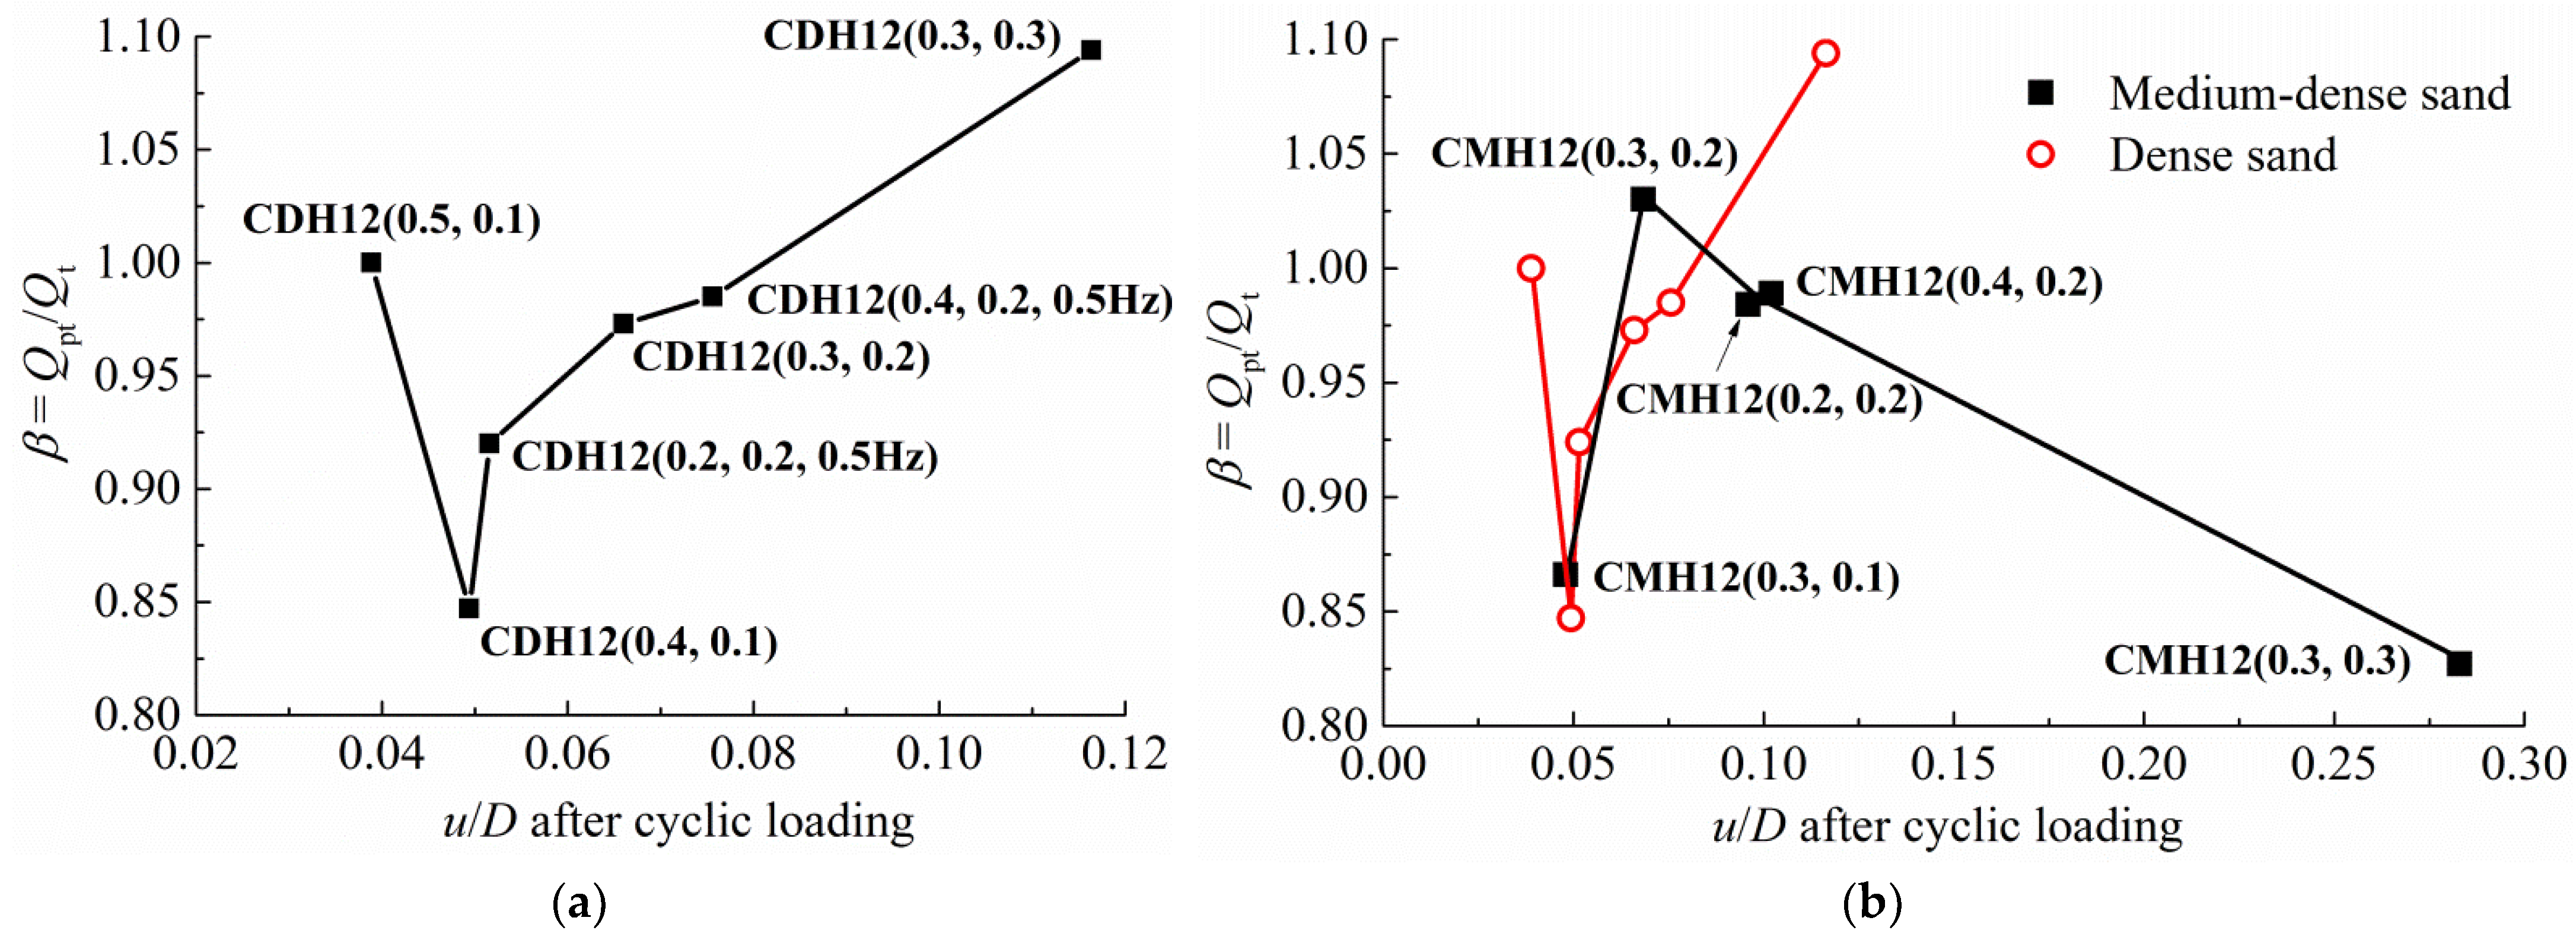
- The backflow of sand above the helix has been inferred by analyzing the relationship of post-cyclic uplift capacity ratio and uplift displacement after cyclic loading. The variation of the post-cyclic uplift capacity ratio in medium–dense sand with the standardized uplift displacement is different from that in dense sand. However, the compactness of sand above the helix both in medium–dense sand and dense sand will be much looser than that before cyclic loading at the uplift displacement of 0.05D after cyclic loading. This relationship of post-cyclic capacity with anchor upward movement in dense sand and medium–dense sand can provide the reference of evaluation of stability and bearing capacity of helical anchors.
Author Contributions
Funding
Institutional Review Board Statement
Informed Consent Statement
Conflicts of Interest
References
- Spagnoli, G.; Tsuha, C.D.C. A review on the behavior of helical piles as a potential offshore foundation system. Mar. Georesources Geotechnol. 2020, 38, 1013–1036. [Google Scholar] [CrossRef]
- Tsuha, C.H.C.; Aoki, N.; Rault, G.; Thorel, L.; Garnier, J. Evaluation of the efficiencies of helical anchor plates in sand by centrifuge model tests. Can. Geotech. J. 2012, 49, 1102–1114. [Google Scholar] [CrossRef]
- Merifield, R.S. Ultimate uplift capacity of multiplate helical type anchors in clay. J. Geotech. Geoenviron. Eng. 2011, 137, 704–716. [Google Scholar] [CrossRef]
- Lutenegger, A.J. Behavior of multi-helix screw anchors in sand. In Proceedings of the 2011 Pan-Am CGS Geotechnical Conference, Toronto, ON, Canada, 2–6 October 2011. [Google Scholar]
- Feng, S.J.; Fu, W.D.; Chen, H.X.; Li, H.X.; Li, J. Field tests of micro screw anchor piles under different loading conditions at three soil sites. Bull. Eng. Geol. Environ. 2021, 80, 127–144. [Google Scholar] [CrossRef]
- Cerfontaine, B.; Knappett, J.; Brown, M.; Davidson, C.; Sharif, Y. Screw Pile Design Optimisation under Tension in Sand. In Proceedings of the ECSMGE 2019, Reykjavik, Iceland, 1–6 September 2019. [Google Scholar]
- Ding, H.; Wang, L.; Zhang, P.; Liang, Y.; Tian, Y.; Qi, X. The recycling torque of a single-plate helical pile for offshore wind turbines in dense sand. Appl. Sci. 2019, 19, 4105. [Google Scholar] [CrossRef]
- Clemence, S.P.; Smithling, A.P. Dynamic uplift capacity of helical anchors in sand. In Proceedings of the 4th Australia–New Zealand Conference on Geomechanics, Perth, WA, Australia, 14–18 May 1984. [Google Scholar]
- Cerato, A.B.; Victor, R. Effects of helical anchor geometry on long-term performance of small wind tower foundations subject to dynamic loads. J. Deep. Found. Inst. 2008, 2, 30–41. [Google Scholar] [CrossRef]
- Cerato, A.B.; Victor, R. Effects of long-term dynamic loading and fluctuating water table on helical anchor performance for small wind tower foundations. J. Perform. Constr. Facil. 2009, 23, 251–261. [Google Scholar] [CrossRef]
- Buhler, R.; Cerato, A.B. Design of dynamically wind-loaded helical piers for small wind turbines. J. Perform. Constr. Facil. 2010, 24, 417–426. [Google Scholar] [CrossRef]
- Sharnouby, M.M.E.; Naggar, M.H.E. Field investigation of axial monotonic and cyclic performance of reinforced helical pulldown micropiles. Can. Geotech. J. 2012, 49, 560–573. [Google Scholar] [CrossRef]
- Sharnouby, M.M.E.; Naggar, M.H.E. Axial monotonic and cyclic performance of fibre-reinforced polymer (FRP)—Steel fibre-einforced helical pulldown micropiles (FRP-RHPM). Can. Geotech. J. 2012, 49, 1378–1392. [Google Scholar] [CrossRef]
- Newgard, J.T.; Schneider, J.A.; Thompson, D. Cyclic response of shallow helical anchors in a medium dense sand. In Proceedings of the 3rd Conference on Frontiers in Offshore Geotechnics, Oslo, Norway, 10–12 June 2015. [Google Scholar]
- Wada, M.; Tokimatsu, K.; Maruyama, S.; Sawaishi, M. Effects of cyclic vertical loading on bearing and pullout capacities of piles with continuous helix wing. Soils Found. 2017, 57, 141–153. [Google Scholar] [CrossRef]
- Schiavon, J.A.; Tsuha, C.H.C.; Thorel, L. Cyclic and post-cyclic monotonic response of a single-helix anchor in sand. Géotechnique Lett. 2017, 7, 11–17. [Google Scholar] [CrossRef]
- Schiavon, J.A.; Tsuha, C.H.C.; Neel, A.; Thorel, L. Centrifuge modelling of a helical anchor under different cyclic loading conditions in sand. Int. J. Phys. Model. Geotech. 2019, 19, 72–88. [Google Scholar] [CrossRef]
- Schiavon, J.A.; Tsuha, C.; Thorel, L. Monotonic, cyclic and post-cyclic performances of single-helix anchor in residual soil of sandstone. J. Rock Mech. Geotech. Eng. 2019, 11, 824–836. [Google Scholar] [CrossRef]
- Thorel, L.; Haffar, I.E.; Maatouk, S.; Schiavon, J.A.; Tsuha, C. Cyclic loading of helical pile as anchor for floating windturbines: Centrifuge tests. In Proceedings of the ISFOG2020, Austin, TX, USA, 28 August 2022. [Google Scholar]
- Hao, D.X.; Chen, R.; Yuan, C.; Kong, G.Q.; Shi, D.D. Centrifugal model tests on cyclic uplift performance of wished-in-place helical anchors in dense sand. Chin. J. Rock Mech. Eng. 2021, 40, 2896–2904. (In Chinese) [Google Scholar]
- Product drawings and ratings. In Technical Design Manual, 4th ed.; Hubbell Power Systems Inc.: Columbia, SC, USA, 2018; pp. 7-31–7-62.
- Hao, D.X.; Wang, D.; O’Loughlin, C.D.; Gaudin, C. Tensile monotonic capacity of helical anchors in sand: Interaction between helices. Can. Geotech. J. 2019, 56, 1534–1543. [Google Scholar] [CrossRef]
- Ilamparuthi, K.; Dickin, E.A.; Muthukrisnaiah, K. Experimental investigation on the uplift capacity of circular anchors in sand. Can. Geotech. J. 2002, 39, 648–664. [Google Scholar] [CrossRef]
- Hao, D.X.; Chen, R.; Fu, S.N. Experimental study on uplift capacity of multi-helix anchors in sand. Chin. J. Geotech. Eng. 2015, 37, 126–132. (In Chinese) [Google Scholar]
- Hanna, T.; Sivapalan, E.; Senturk, A. The behaviour of dead anchors subjected to repeated and alternating loads. Ground Eng. 1978, 11, 28–34. [Google Scholar] [CrossRef]
- Petereit, R. The Static and Cyclic Pullout Behavior of Plate Anchors in Fine Saturated Sand. Master’s Thesis, Oregon State University, Corvallis, OR, USA, 1987. [Google Scholar]
- Lumay, G.; Boschini, F.; Traina, K.; Bontempi, S.; Remy, J.C.; Cloots, R.; Vandewalle, N. Measuring the flowing properties of powders and grains. Powder Technol. 2012, 224, 19–27. [Google Scholar] [CrossRef]


| Property | Value |
|---|---|
| Specific gravity, Gs | 2.63 |
| Average grain size d50: mm | 0.35 |
| Coefficient of uniformity, Cu | 1.57 |
| Curvature coefficient, Cc | 0.96 |
| Maximum dry density, ρdmax (g/cm3) | 1.75 |
| Minimum dry density, ρdmin (g/cm3) | 1.55 |
| Critical friction angle, ϕcv (°) | 28 |
| Name | Sand Sample | Influence Factor | Frequency f/Hz | H/D | Number of Cycles | Qt/N | Uplift Capacity Ratio, β | ||
|---|---|---|---|---|---|---|---|---|---|
| MDH8 | 1 | depth | — | 8 | — | — | — | 316.3 | — |
| CDH8 (0.4, 0.2) | 1 | 0.5 | 8 | 0.4 | 0.2 | 1200 | 318.5 | 1.007 | |
| MDH10 | 2 | — | 10 | — | — | — | 580.1 | — | |
| CDH10 (0.4, 0.2) | 2 | 0.5 | 10 | 0.4 | 0.2 | 1200 | 439.6 | 0.758 | |
| MDH12-1 | 3 | — | 12 | — | — | — | 863.3 | — | |
| CDH12 (0.4, 0.2, 0.5 Hz) | 3 | 0.5 | 12 | 0.4 | 0.2 | 1200 | 850.6 | 0.985 | |
| MDH14 | 4 | — | 14 | — | — | — | 890.3 | — | |
| CDH14 (0.4, 0.2) | 4 | 0.5 | 14 | 0.4 | 0.2 | 1200 | 733.9 | 0.824 | |
| MDH12-2 | 5 | cyclic amplitude and mean load | — | 12 | — | — | — | 822.3 | — |
| CDH12 (0.4, 0.3) | 5 | 0.5 | 12 | 0.4 | 0.3 | 14 | — | — | |
| MDH12-3 | 6 | — | 12 | — | — | — | 802.2 | — | |
| CDH12 (0.3, 0.3) | 6 | 0.5 | 12 | 0.3 | 0.3 | 1200 | 876.7 | 1.093 | |
| CDH12 (0.4, 0.1) | 7 | 0.5 | 12 | 0.4 | 0.1 | 1200 | 679.7 | 0.847 | |
| CDH12 (0.3, 0.2) | 7 | 0.5 | 12 | 0.3 | 0.2 | 1200 | 780.5 | 0.973 | |
| CDH12 (0.2, 0.2, 0.5 Hz) | 8 | 0.5 | 12 | 0.2 | 0.2 | 1200 | 738.3 | 0.920 | |
| CDH12 (0.5, 0.1) | 8 | 0.5 | 12 | 0.5 | 0.1 | 1200 | 805.8 | 1.004 | |
| MDH12-4 | 9 | frequency | — | 12 | — | — | — | 813.2 | — |
| CDH12 (0.4, 0.2, 1 Hz) | 9 | 1 | 12 | 0.4 | 0.2 | 12 | — | — | |
| MDH12-5 | 10 | - | 12 | - | - | - | 803.8 | — | |
| CDH12 (0.2, 0.2, 2 Hz) | 10 | 2 | 12 | 0.2 | 0.2 | 526 | 808.5 | 1.006 | |
| MMH12-1 | 11 | compactness | — | 12 | — | — | — | 658.8 | — |
| CMH12 (0.3, 0.1) | 11 | 0.5 | 12 | 0.3 | 0.1 | 1200 | 570.7 | 0.866 | |
| MMH12-2 | 12 | — | 12 | — | — | — | 638.4 | ||
| CMH12 (0.3, 0.2) | 13 | 0.5 | 12 | 0.3 | 0.2 | 1200 | 655.0 | 1.026 | |
| MMH12-3 | 14 | — | 12 | — | — | — | 630.4 | ||
| CMH12 (0.3, 0.3) | 14 | 0.5 | 12 | 0.3 | 0.3 | 1200 | 521.3 | 0.827 | |
| CMH12 (0.2, 0.2) | 15 | 0.5 | 12 | 0.2 | 0.2 | 1200 | 620.5 | 0.984 | |
| CMH12 (0.4, 0.2) | 15 | 0.5 | 12 | 0.4 | 0.2 | 1200 | 623.6 | 0.989 |
| Cyclic Loading Qmean ± Qcyc | Sand Compactness | |||||
|---|---|---|---|---|---|---|
| Medium–Dense Sand | Dense Sand | |||||
| ua(N = 1) /mm | ua(N = 1200) /mm | β | ua(N = 1) /mm | ua(N = 1200) /mm | β | |
| (0.3 ± 0.3) Qt | 0.65 | 13.46 | 0.827 | 0.60 | 5.19 | 1.094 |
| (0.4 ± 0.2) Qt | 0.83 | 3.73 | 0.989 | 0.55 | 2.72 | 0.985 |
| (0.3 ± 0.2) Qt | 0.36 | 2.72 | 1.026 | 0.66 | 2.52 | 0.973 |
| (0.2 ± 0.2) Qt | 0.49 | 4.13 | 0.984 | 0.37 | 2.28 | 0.920 |
Publisher’s Note: MDPI stays neutral with regard to jurisdictional claims in published maps and institutional affiliations. |
© 2022 by the authors. Licensee MDPI, Basel, Switzerland. This article is an open access article distributed under the terms and conditions of the Creative Commons Attribution (CC BY) license (https://creativecommons.org/licenses/by/4.0/).
Share and Cite
Hao, D.; Che, J.; Chen, R.; Zhang, X.; Yuan, C.; Chen, X. Experimental Investigation on Behavior of Single-Helix Anchor in Sand Subjected to Uplift Cyclic Loading. J. Mar. Sci. Eng. 2022, 10, 1338. https://doi.org/10.3390/jmse10101338
Hao D, Che J, Chen R, Zhang X, Yuan C, Chen X. Experimental Investigation on Behavior of Single-Helix Anchor in Sand Subjected to Uplift Cyclic Loading. Journal of Marine Science and Engineering. 2022; 10(10):1338. https://doi.org/10.3390/jmse10101338
Chicago/Turabian StyleHao, Dongxue, Jianyi Che, Rong Chen, Xin Zhang, Chi Yuan, and Xichao Chen. 2022. "Experimental Investigation on Behavior of Single-Helix Anchor in Sand Subjected to Uplift Cyclic Loading" Journal of Marine Science and Engineering 10, no. 10: 1338. https://doi.org/10.3390/jmse10101338
APA StyleHao, D., Che, J., Chen, R., Zhang, X., Yuan, C., & Chen, X. (2022). Experimental Investigation on Behavior of Single-Helix Anchor in Sand Subjected to Uplift Cyclic Loading. Journal of Marine Science and Engineering, 10(10), 1338. https://doi.org/10.3390/jmse10101338