Article

Lateral Bearing Capacity of a Hybrid Monopile: Combined Effects of Wing Configuration and Local Scour

1
Institute of Mechanics, Chinese Academy of Sciences, Beijing 100190, China
2
School of Engineering Science, University of Chinese Academy of Sciences, Beijing 100049, China
3
Department of Infrastructure Engineering, Faculty of Engineering and Information Technology, The University of Melbourne, Melbourne 3010, Australia
*
Author to whom correspondence should be addressed.
J. Mar. Sci. Eng. 2022, 10(12), 1799; https://doi.org/10.3390/jmse10121799
Submission received: 22 October 2022 / Revised: 15 November 2022 / Accepted: 19 November 2022 / Published: 22 November 2022
(This article belongs to the Special Issue New Challenges in Offshore Geotechnical Engineering Developments)

Abstract

:
Pile foundations for offshore wind turbines are subjected to large lateral loads. By mounting wings on the perimeter of regular monopiles, winged monopiles have shown better performance in resisting deformation under horizontal loading. However, the hazardous effect of local scour on the lateral bearing capacity of winged monopiles installed in the sandy seabed has not been systematically evaluated. In this study, a modified Mohr–Coulomb model considering the pre-peak hardening and post-peak softening behavior of dense sand is adopted to simulate laterally loaded winged monopiles in the locally scoured sandy seabed, using three-dimensional finite element analyses. The effect of local scour depth on the lateral capacity of winged monopiles is examined and explained by soil failure mechanisms. The enhancement of lateral capacity with wings attached to the monopile is demonstrated to be more effective than extending pile embedment length. The effects of the relative density of sand and the wing load orientation are also discussed. Finally, the wing efficiency is evaluated to determine the optimal configuration of winged monopiles.

1. Introduction

The development and utilization of renewable energy play an indispensable role in the process of “carbon neutrality”. Offshore wind power has been attracting attention because of its abundant reserves, high energy density and minor disturbance to the surrounding environment. By the end of 2021, the global installed capacity of offshore wind power had reached 57.2 GW [1]. The offshore wind industry continues to grow rapidly, with the global installed capacity expected to reach 203 GW by 2030 [2].
Foundations account for approximately 35% of the total cost of an offshore wind project [3]. Monopiles are the most commonly used foundation solution for offshore wind turbines (OWTs) in shallow to medium water depths due to their ease of design, manufacture and installation [4]. To improve energy harvesting efficiency, the offshore energy industry is currently making intense efforts to upscale offshore wind turbines and advance into deeper waters [5]. The bigger turbine size and deeper water depth bring out larger loads, which require more reliable and powerful foundations to resist them. Several new hybrid monopile foundations are proposed to support large-capacity wind turbines operating in deeper waters at a reasonable cost [6].
As innovative hybrid monopiles with wings welded orthogonally to the perimeter of regular monopiles, winged monopiles have shown excellent lateral bearing capacity in both field and centrifuge tests [7,8,9]. Existing studies on the lateral bearing capacity of winged monopiles mainly focus on the optimized arrangement of the wings. Considering the multidirectional loading in the marine environment, the wings are usually evenly attached to the pile perimeter. With the same height and width of wings, the numerical analysis of Babu and Viswanadham [10] showed that the star-wing monopiles (i.e., monopile with eight wings) exhibit a higher lateral bearing capacity than four-wing monopiles. Abongo [11] further found that the lateral bearing capacity of a four-wing monopile is slightly higher than that of a three-wing monopile by conducting numerical simulations and 1g model tests. Winged monopiles with three or four wings are commonly preferred because of the greater installation costs associated with an increased number of wings. In addition, the shape of wings has a significant influence on the lateral response of a hybrid monopile. Rectangular wings, compared with triangular or trapezoidal wings, demonstrate superior performance in reducing the lateral deformation of pile foundations [12,13]. Furthermore, the aspect ratio of the wings (i.e., the height-to-width ratio of the wing) and wing load orientation may affect the lateral bearing capacity of winged monopiles. Nasr [13] suggested that the ultimate lateral bearing capacity of winged monopiles depends on the height of the wings to a large extent. As the height of the wing approaches 0.4 times the embedded length of the monopile, the displacement of the pile head can be reduced by up to 70% compared with regular monopiles. Pei and Qiu [14] compared the effect of the wing width of winged monopiles on the wing efficiency with different embedded depths and identified that the optimal wing width was equal to the pile diameter for both long and short piles. Variations in wing load orientations can also alter the lateral bearing capacity, albeit some studies have shown that the difference is trivial [15,16].
The aforementioned studies have dealt with the case that the winged monopiles are fully embedded in a flat soil bed, showing that setting the wings near the mudline (or ground surface) mobilizes higher soil resistance against lateral pile deflection [10,11,15,16]. However, in marine environments, waves and/or currents can induce a local scour hole around piles without scour countermeasures [17,18]. Local scour could also develop, sometimes even with countermeasures, given that the countermeasures are not deployed in time or the protections fail during severe storms. It has been proven that flow structures such as horseshoe vortices and lee-wake vortices can affect the development of scour and equilibrium scour depth [19,20]. As a consequence, local scour would reduce the effective embedment of monopiles and, in turn, the lateral bearing capacity [21,22]. For winged monopiles, local scour may still exist and expose the wings out of the seabed, since the wings embedded near the mudline have no impact on the large-scale coherent flow structures (e.g., horseshoe vortex) for initiating the scour process [23]. Li et al.’s [24] scour tests in a water flume revealed that wings near the mudline can significantly enlarge the range of the scour hole and even the scour depth, which impedes the effectiveness of the wings. Therefore, the wings need to be installed below the estimated maximum scour depth to avoid the scour caused by the wings and ensure the wings are fully functioning.
This study investigates the combined effects of local scour and wing configuration on laterally loaded winged monopiles in the sandy seabed, using a series of three-dimensional (3D) finite element (FE) analyses. A modified MMC which can describe the pre-peak hardening and post-peak softening behavior of dense sand is adopted and implemented to represent the sandy soils. The model is validated against the database of triaxial element tests and centrifuge tests of regular monopiles in Fontainebleau sand. A parametric analysis is carried out to examine the effects of scour depth, wing usage, the relative density of sand, wing load orientation, as well as aspect ratio of wings for three- and four-wing monopiles. The wing efficiency is quantitatively evaluated and the optimal arrangement of wings is proposed to aid the engineering design of winged monopile foundations for applications in offshore wind energy.

2. Numerical Modelling

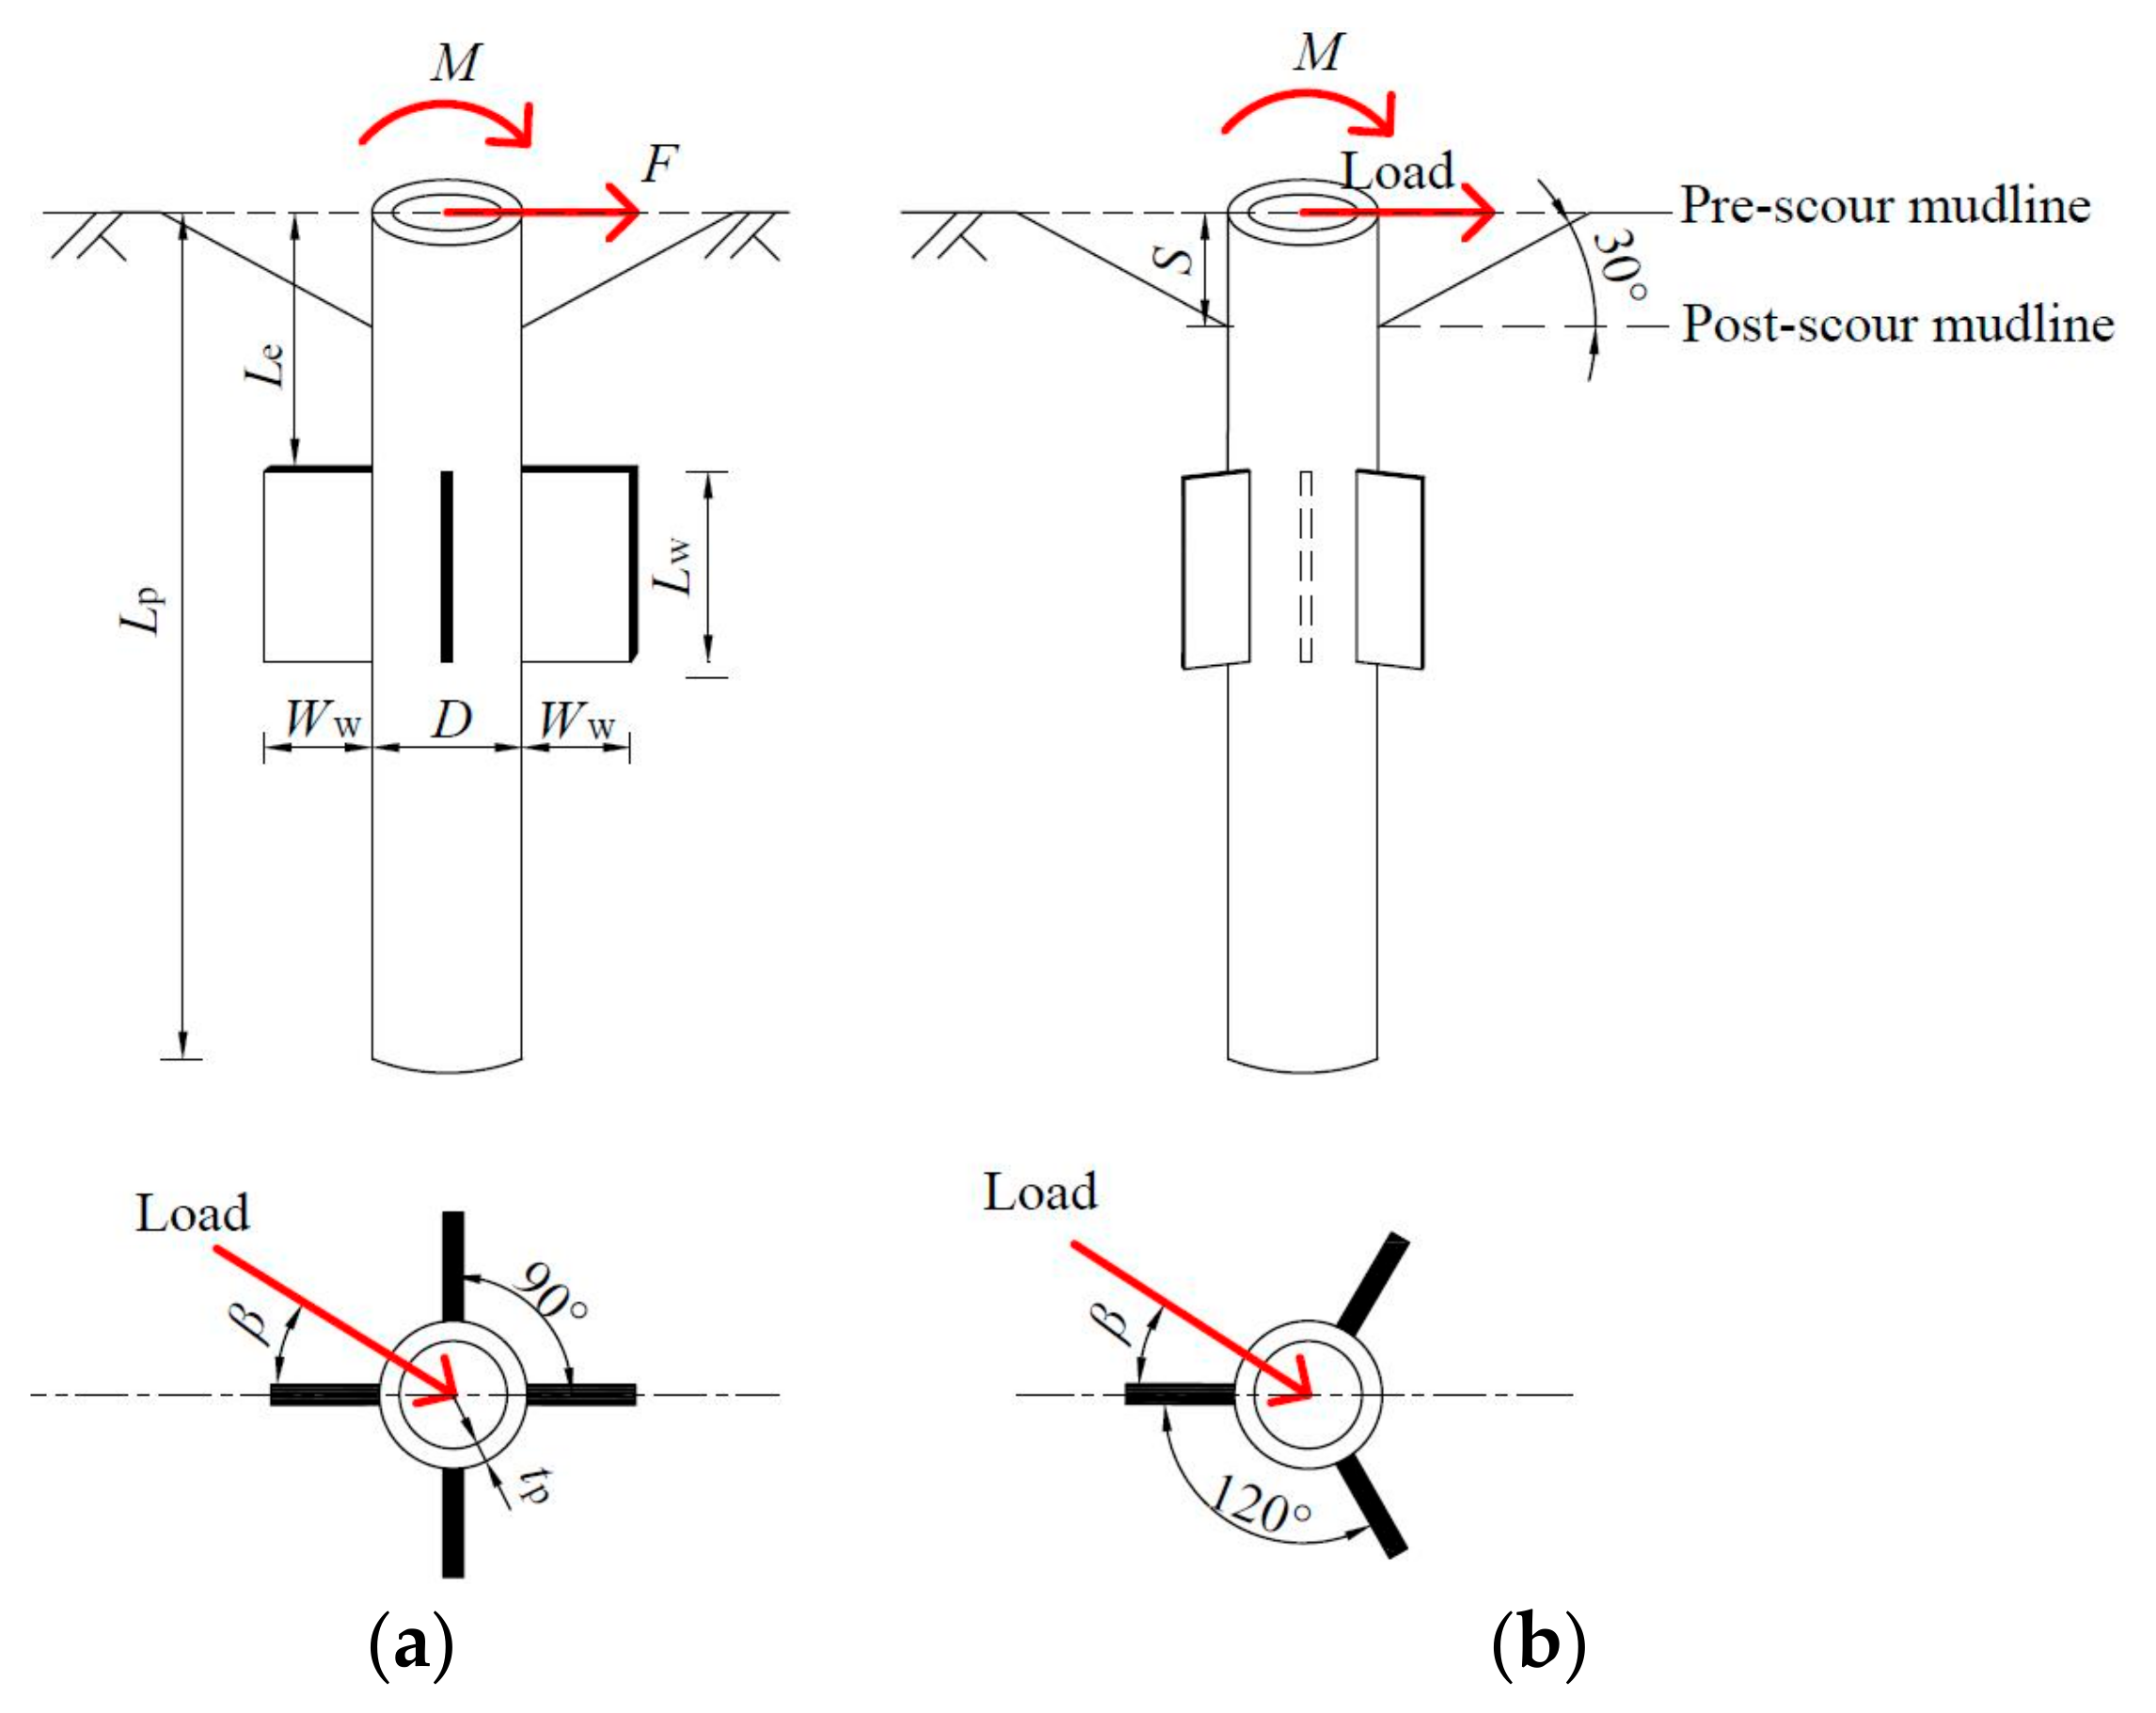
2.1. Geometry and FE Mesh

The 3D FE model of laterally loaded winged monopiles embedded in the sandy seabed was established using the software Abaqus [25], as shown schematically in Figure 1. The pile diameter D is set as 6 m, while the embedded depth Lp is 48 m (8D) and the wall thickness tp is 70 mm. Three or four wings are mounted evenly on the external surface of the pile at a vertical distance Le from the pile head. The wings have a width equal to D, a thickness equal to tp and a height varying between 0 and 1.75D. An inverted cone located at the center of the monopile with a slope angle of 30° is cut from the mudline to represent the local scour hole around the pile foundation in the marine environment [21]. The maximum scour depth S is conservatively assumed to be 1.9D, based on observed scour depths in field cases [5,26]. To avoid scour-induced wing outcropping, the distance from the top of the wing to the pre-scour mudline Le is set as 2D, which exceeds the assumed maximum scour depth. It is assumed that the forces in different wing load orientations (β) apply to the center of the pile head to model the marine environment.
Figure 2 shows a typical FE mesh used in the numerical analyses. The soil domain is divided into two zones to distinguish the scoured soil (colored brown) from the remaining soil (colored cyan). The diameter and thickness of the soil domain are set as 26D and 1.7Lp, respectively, which are sufficiently large to avoid boundary effects [13,14]. Both the soil and the pile are modelled with 3D eight-node reduced integration brick elements (C3D8R in Abaqus library). A total of more than 50,000 elements are generated in each model, with a finer mesh created in the vicinity of the pile. The present mesh size is selected based on trial mesh sensitivity analyses. The piles are assumed to be “wished-in-place” without considering the pile installation effect [27].

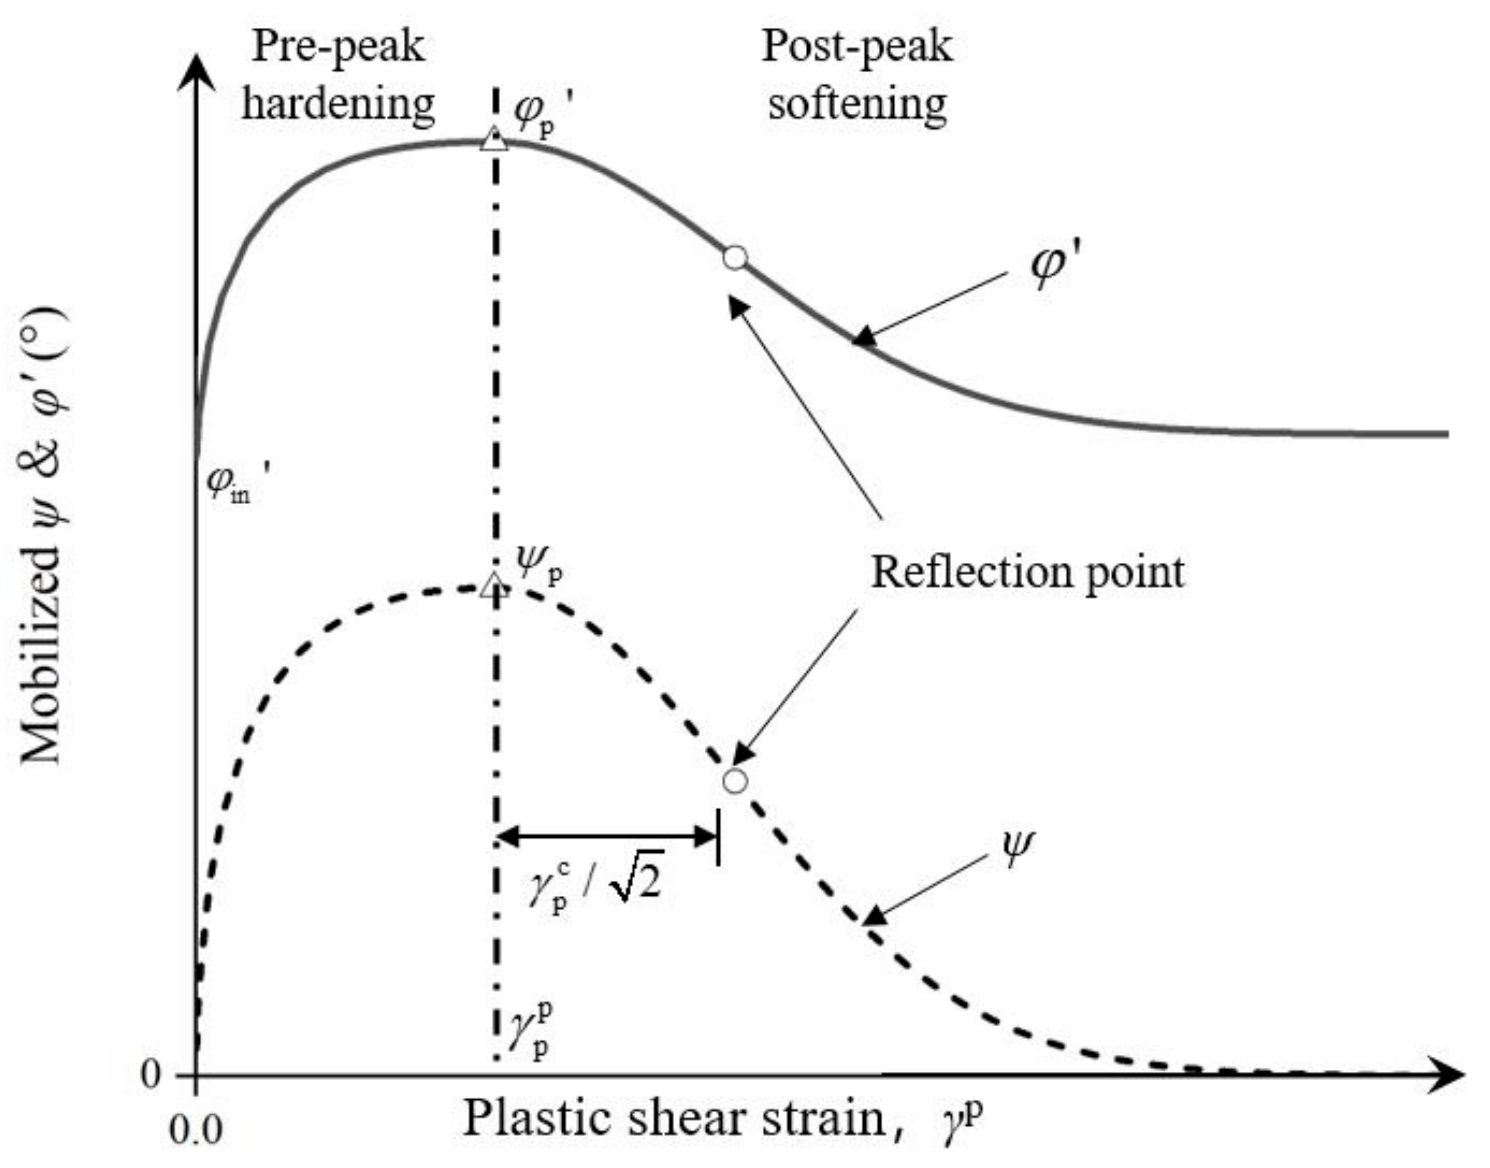
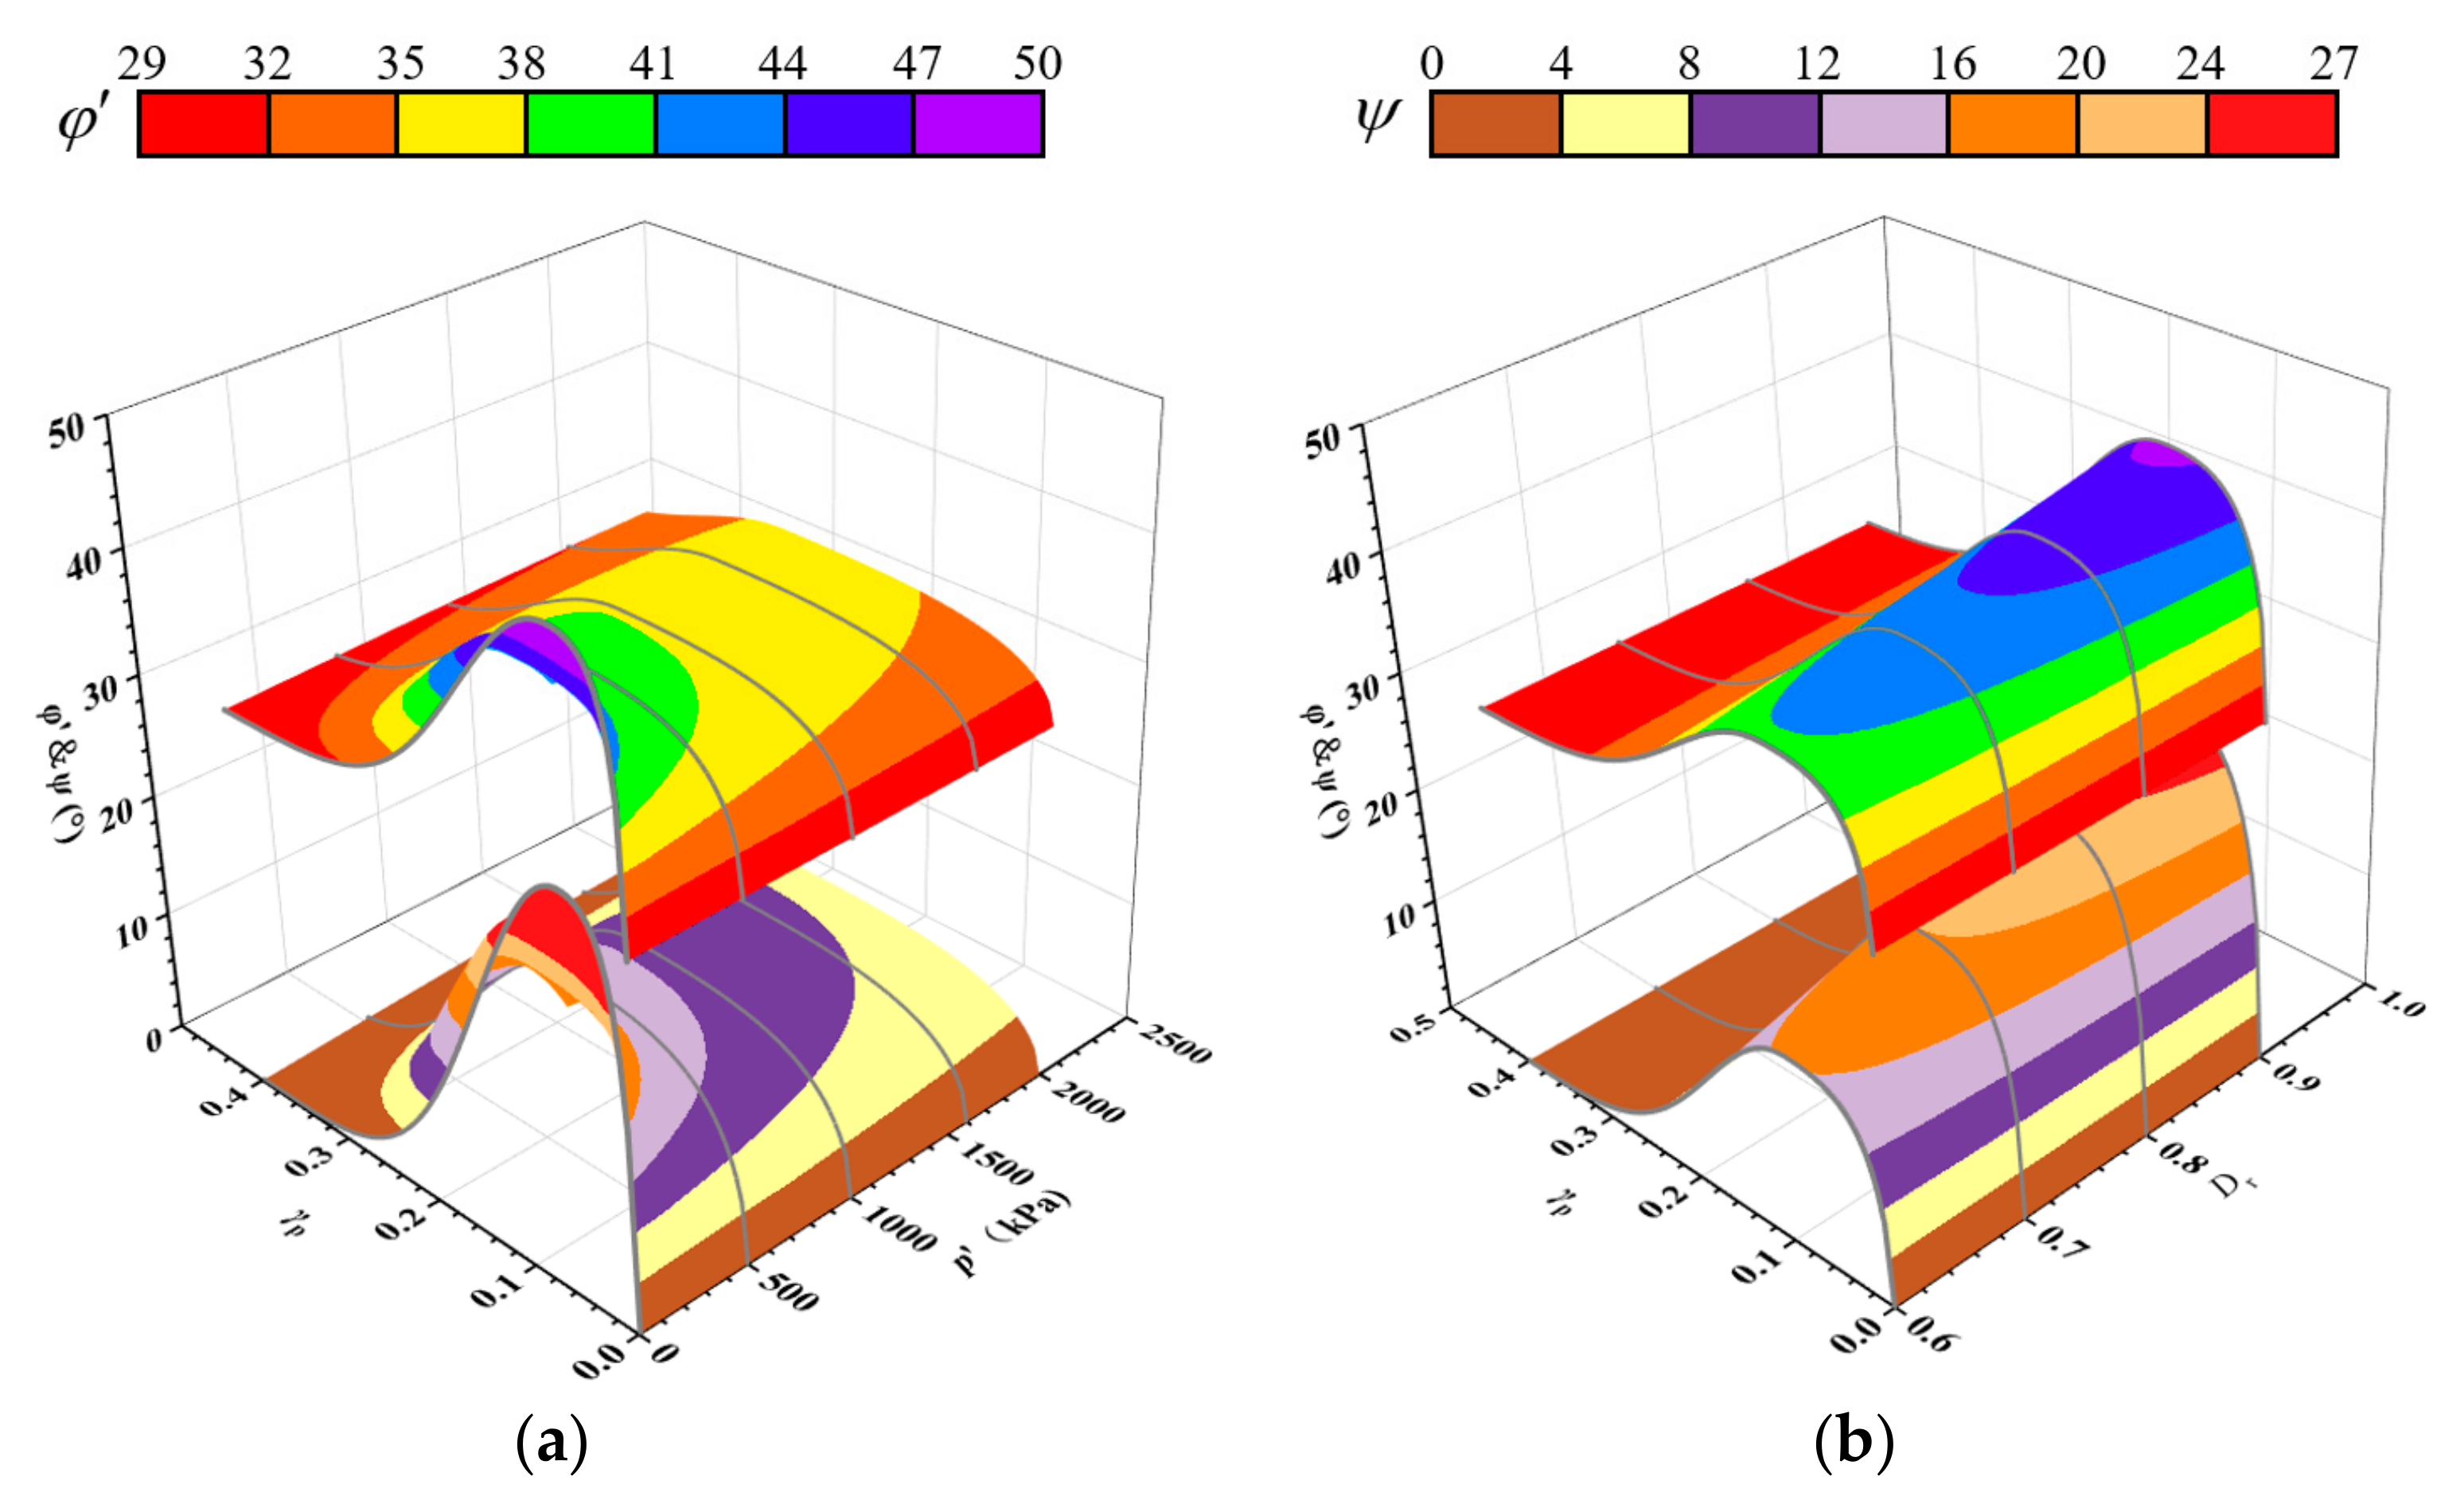
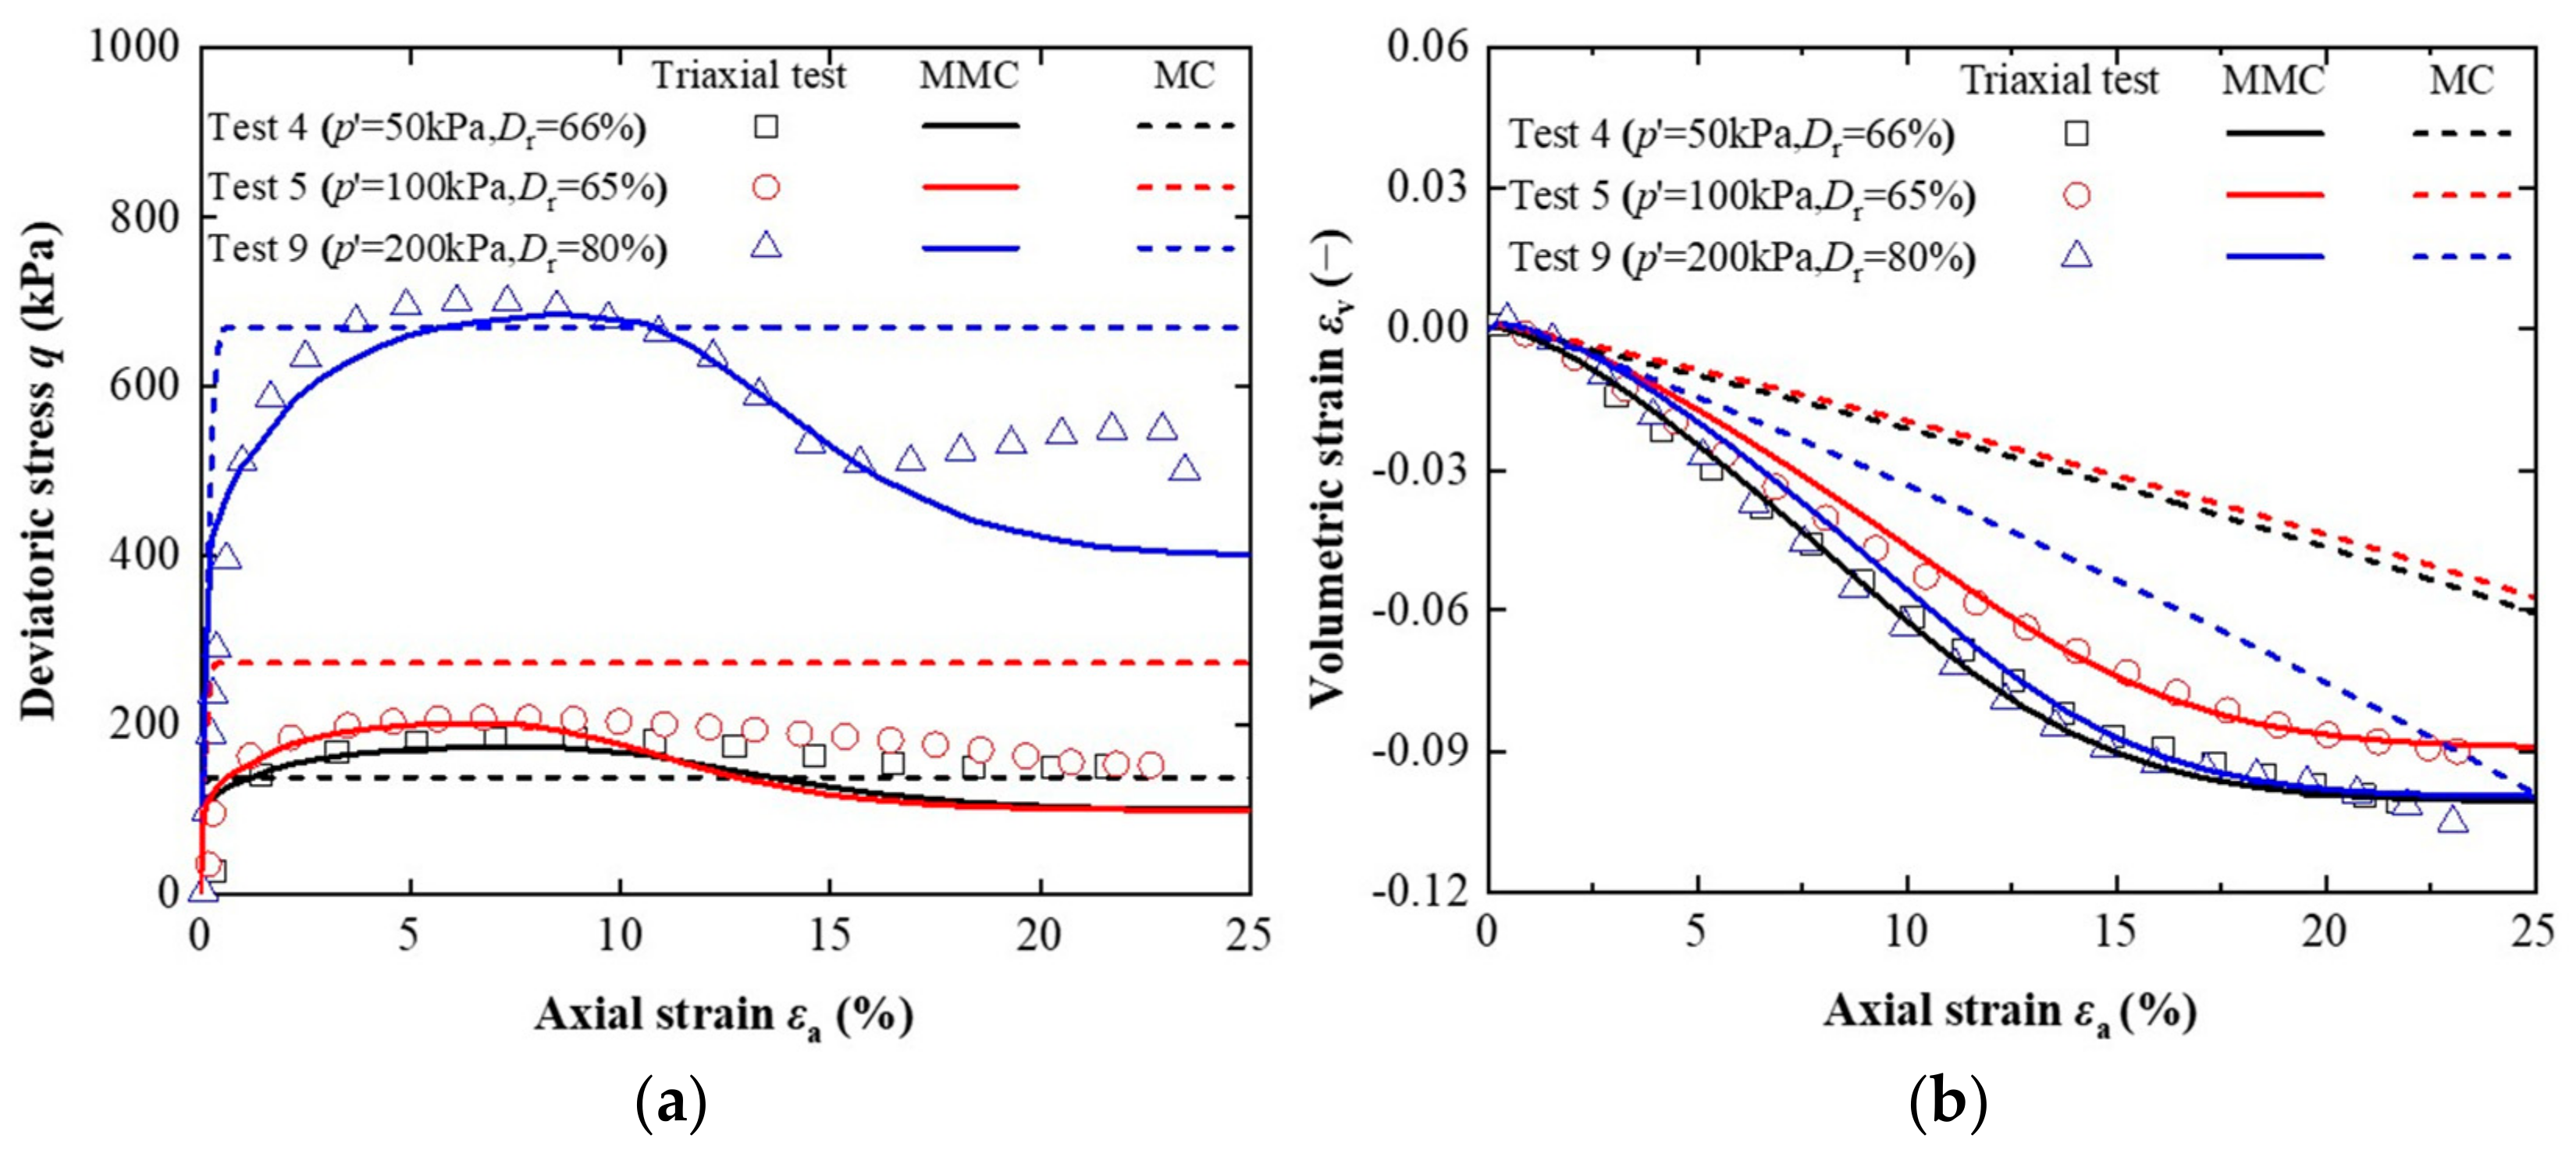
2.2. Constitutive Model

The steel winged monopiles are assumed to be linearly elastic with Young’s modulus Ep = 210 GPa and Poisson’s ratio νp = 0.3, similar to previous studies on pile foundations [27,28,29]. The Young’s modulus of sand Es for describing the elastic behavior is stress-dependent and increases with the earth pressure at rest [30]:
E s = κ p a σ 3 p a λ
in which pa is the atmospheric pressure (100 kPa), σ 3 is the confining stress, κ is the soil stiffness at the reference stress state and λ determines the stress dependence of the soil stiffness. The specific values of κ and λ for medium-dense, dense, and very dense sand are listed in Table 1 [31].
Though the Mohr–Coulomb (MC) model has been widely adopted to simulate the elastoplastic behavior of the sandy seabed under drained conditions due to its simplicity and acceptable accuracy [13,16,30,33,34,35,36], the plastic properties (e.g., friction angle φ , dilation angle ψ) of dense sand remain constant once the plastic state is reached. This is inconsistent with the stress–strain curves obtained from the triaxial test or the direct shear test for dense sand, which manifests evident pre-peak hardening and post-peak softening behaviors. Roy et al. [32] proposed a modified Mohr–Coulomb (MMC) model to analyze the pipe–soil interactions based on the stress–strain curves of dense sand, as indicated in Figure 3.
In the MMC model, the peak friction angle φ p and the peak dilation angle ψ p are governed by the relative density of sand Dr and the confining pressure p′ [37] (see Equations (2)–(4)):
φ p φ c = A ψ I R
φ p φ c = k ψ ψ p
I R = I D ( Q ln p ) R
where A ψ ,   k ψ = 3 , 0.5 for the triaxial condition and A ψ ,   k ψ = 5 , 0.8 for the plane strain condition, respectively. φ c is the critical friction angle. Chakraborty and Salgado [38] demonstrated that A ψ ,   k ψ = 3.8 , 0.6 are applicable to both triaxial and plane strain shear conditions for Toyoura sand. I R is the relative density index. I R = 0 4 is generally adopted as the acceptable range for modelling the interaction between structures and sands ([37,39]). ID (=Dr (%)/100) and Dr are both the relative density with different units. Q and R are taken as 10 and 1, respectively [37].
The friction angle φ and dilation angle ψ in the pre-peak hardening zone vary with the plastic shear strain γ p , employing the sine function as the backbone function (refer to Figure 3):
φ = φ in + sin 1 2 γ p γ p p γ p + γ p p sin ( φ p φ in )
ψ = sin 1 2 γ p γ p p γ p + γ p p sin ( ψ p )
where γ p p represents the γ p when φ and ψ reach the peak;
γ p p = γ p c ( p / p a ) m
where γ p c is the strain-softening factor, which determines the rate of softening with plastic shear strain. γ p c is calculated by
γ p c = C 1 C 2 I D
where the values of C 1 and C 2 are calibrated by triaxial tests or direct shear tests [32]. Based on the contributions of interparticle friction and soil fabric on the initial internal friction angle, φ in = 29° is assumed in this study [32].
The friction angle φ and dilation angle ψ in the post-peak softening zone vary as a function of the plastic shear strain ( γ p ), which can be represented by the exponential function as a backbone function:
φ = φ c + ( φ p φ c ) exp γ p γ p p γ c p 2
ψ = ψ p exp γ p γ p p γ p c 2
Figure 4 shows typical variations in the mobilized friction angle and dilation angle of dense sand with plastic shear strain, confining pressure, and relative density. It can be seen that a reduction in the confining pressure or an increase in the relative density amplifies the hardening and softening effects of dense sand. More detailed information on the MMC model can be found in Roy [40].
In Abaqus, the MMC model is not built-in and requires to be implemented using subroutines VUSDFLD in FORTRAN. First, the plastic strain tensor ( ε i j ) and the stress tensor ( σ i j ) at each integration point are called and updated in each time increment, then stored in the state variables in the subroutine. Next, the incremental plastic shear strain Δ γ p and the mean effective stress p’ are calculated for each time increment. Finally, the value of γ p (calculated as the sum of Δ γ p throughout the analysis) and p′ are assigned to two field variables (FV1, FV2), which are used to update the values of φ and ψ , accordingly. Ahmed and Hawlader [27] defined the incremental plastic shear strain as
Δ γ p = 3 2 Δ ε i j Δ ε j i d t
where Δ ε i j is the plastic strain increment tensor. In addition, Ahmed and Hawlader [27] verified the existence of both triaxial compression and plane strain shear conditions for the soil elements surrounding the pile under eccentric loading. Therefore, the values of A ψ ,   k ψ = 3.8 , 0.6 were used in this study. The properties of sand adopted in this study are summarized in Table 1. The maximum ( γ max ) and minimum ( γ min ) unit dry weight of the sand is assumed to be 17.58 kN/m3 and 14.65 kN/m3, respectively [41]. The unit weight of sand with different relative densities can be determined by
γ = γ s γ w = γ max γ min γ max ( 1 D r ) + γ min D r γ w
A small value of cohesion c (0.1 kPa) is used in this study to avoid numerical instability.
The pile–soil interface is modelled in Abaqus using the “contact pair” algorithm. The “hard contact” model allows separation in the normal direction, while the Coulomb friction model is adopted in the tangential direction. The interface friction angle δ is taken as 2/3φ0 to simulate the typical steel–sand contact property [29,42], where φ0 is the constant friction angle. The value of φ0 can be estimated according to the formula recommended by API [43]:
φ 0 = 16 D r 2 + 0.17 D r + 28.4

2.3. Loading Steps

Each FE analysis has four steps to simulate the formation of local scour and the subsequent lateral loading phase:
(1)
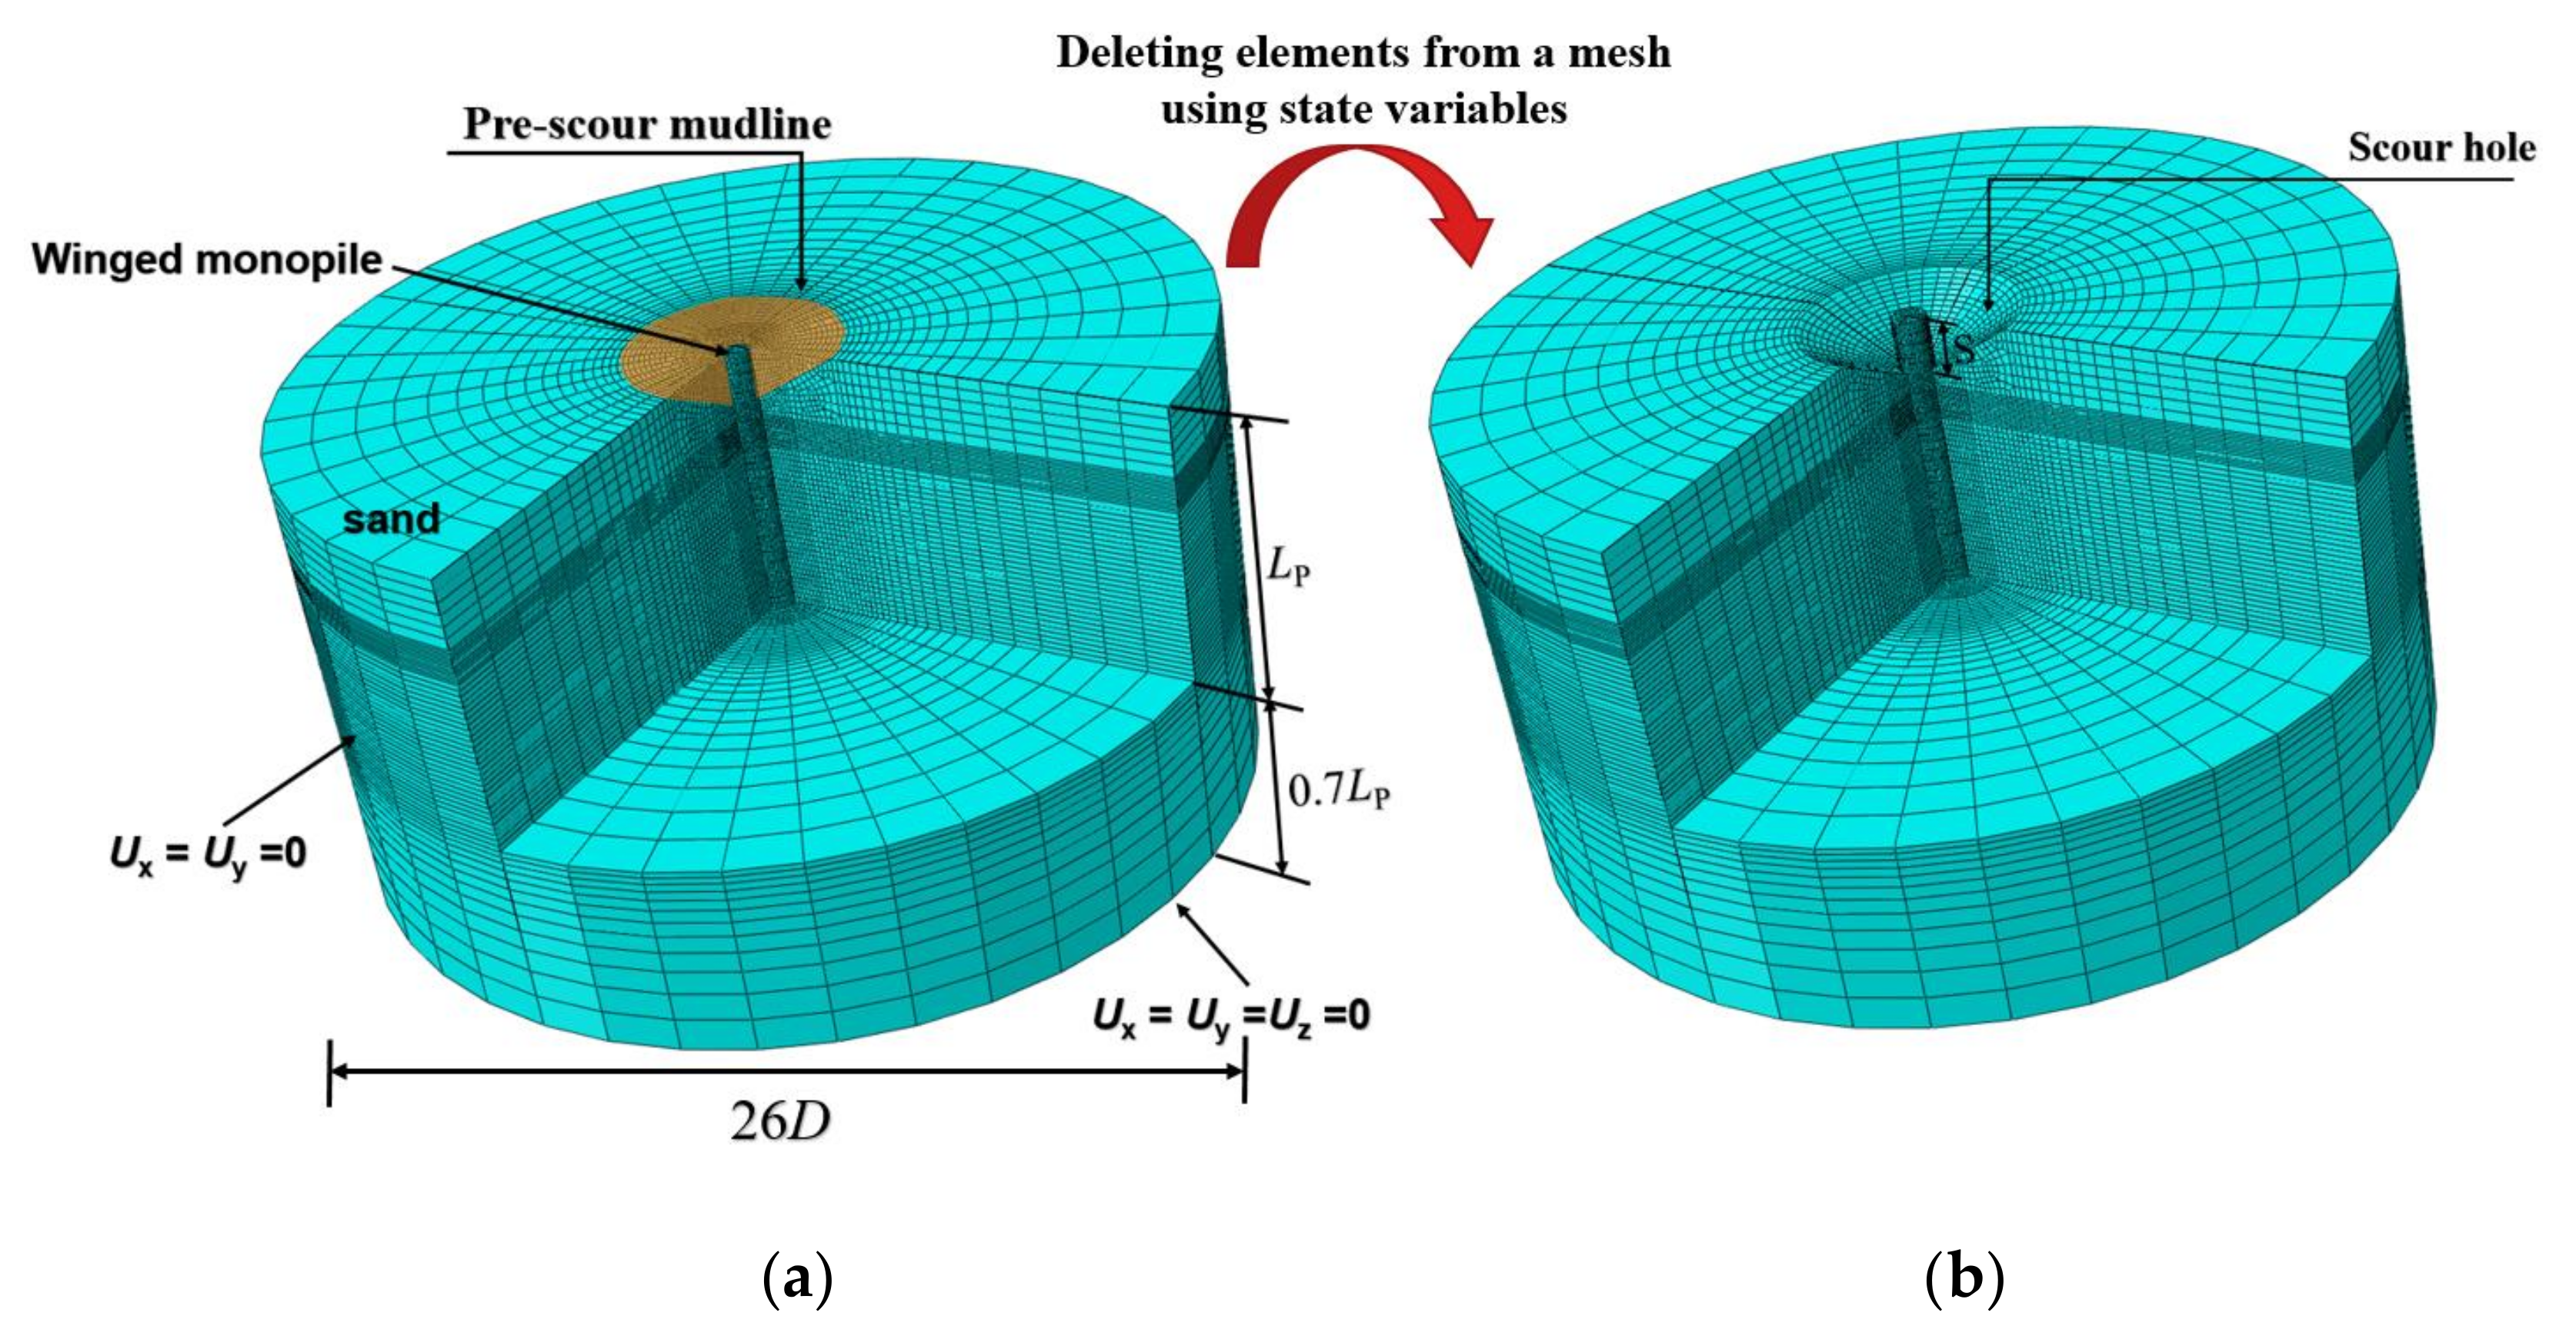
Initial step: As shown in Figure 2, the bottom of the soil domain is fixed in all three directions (Ux = 0, Uy = 0, Uz = 0), while the vertical boundary is supported by rollers to restrict the lateral displacements (Ux = 0, Uy = 0). The initial stress is applied to the whole domain by means of the “geostatic stress” function built into the initial predefined field;
(2)
Geostatic step: The uniform vertical body force is exerted on the whole domain to simulate the gravitational effect. During this step, the normal displacement of the pile–soil contact surface is restrained. At the end of this step, the model produces only a negligible deformation;
(3)
Scour step: As shown in Figure 2, the predefined set of scour elements is deleted through state variables to simulate the scour unloading effect. The deleted elements cannot carry stresses in the subsequent analysis and, hence, have no contribution to the stiffness of the model. The remaining soil domain redistributes the stresses to reach a new stress balance after the deletion of scoured soil elements;
(4)
Load step: After setting up the boundary conditions and stresses in the post-scour domain, the normal displacement restraint on the pile–soil contact surface is removed and replaced by the “contact pair” algorithm. A monotonic lateral load (F) and bending moment ( M = F · e , e the load eccentricity) are then applied at the geometric center of the pile head. For accuracy and efficiency, the quasi-static analysis is loaded using the smoothed step amplitude curve. During the rotation of the pile foundation, the load point couples to and moves with the pile head.

2.4. Simulation Cases

Table 2 summarizes the five series of simulation cases considered in this study. There are two aims in Series I: One is to compare the effects of scour depth on the lateral bearing capacity of winged monopiles, and the other is to compare the benefits of introducing wings and extending the embedment depth to improve the lateral bearing capacity of pile foundations with local scour. The relative density of sand, the configuration and the wing load orientation of hybrid monopiles are kept constant. Series II mainly compares the effects of load eccentricity on the lateral bearing capacity of pile foundations in the scoured sandy seabed. In Series III, the sandy seabed with various relative densities is examined to explore its effect on the lateral bearing capacity. Series IV aims to assess the effect of wing load orientation on the lateral bearing capacity of winged monopiles. The effect of aspect ratio on the lateral bearing capacity of hybrid monopiles with three or four wings is further investigated in Series V. In all simulations except Series II, the load eccentricity e = 8D is generally assumed, referring to Bhattacharya’s [5] report for typical wave and wind loads on OWTs, unless otherwise specified.

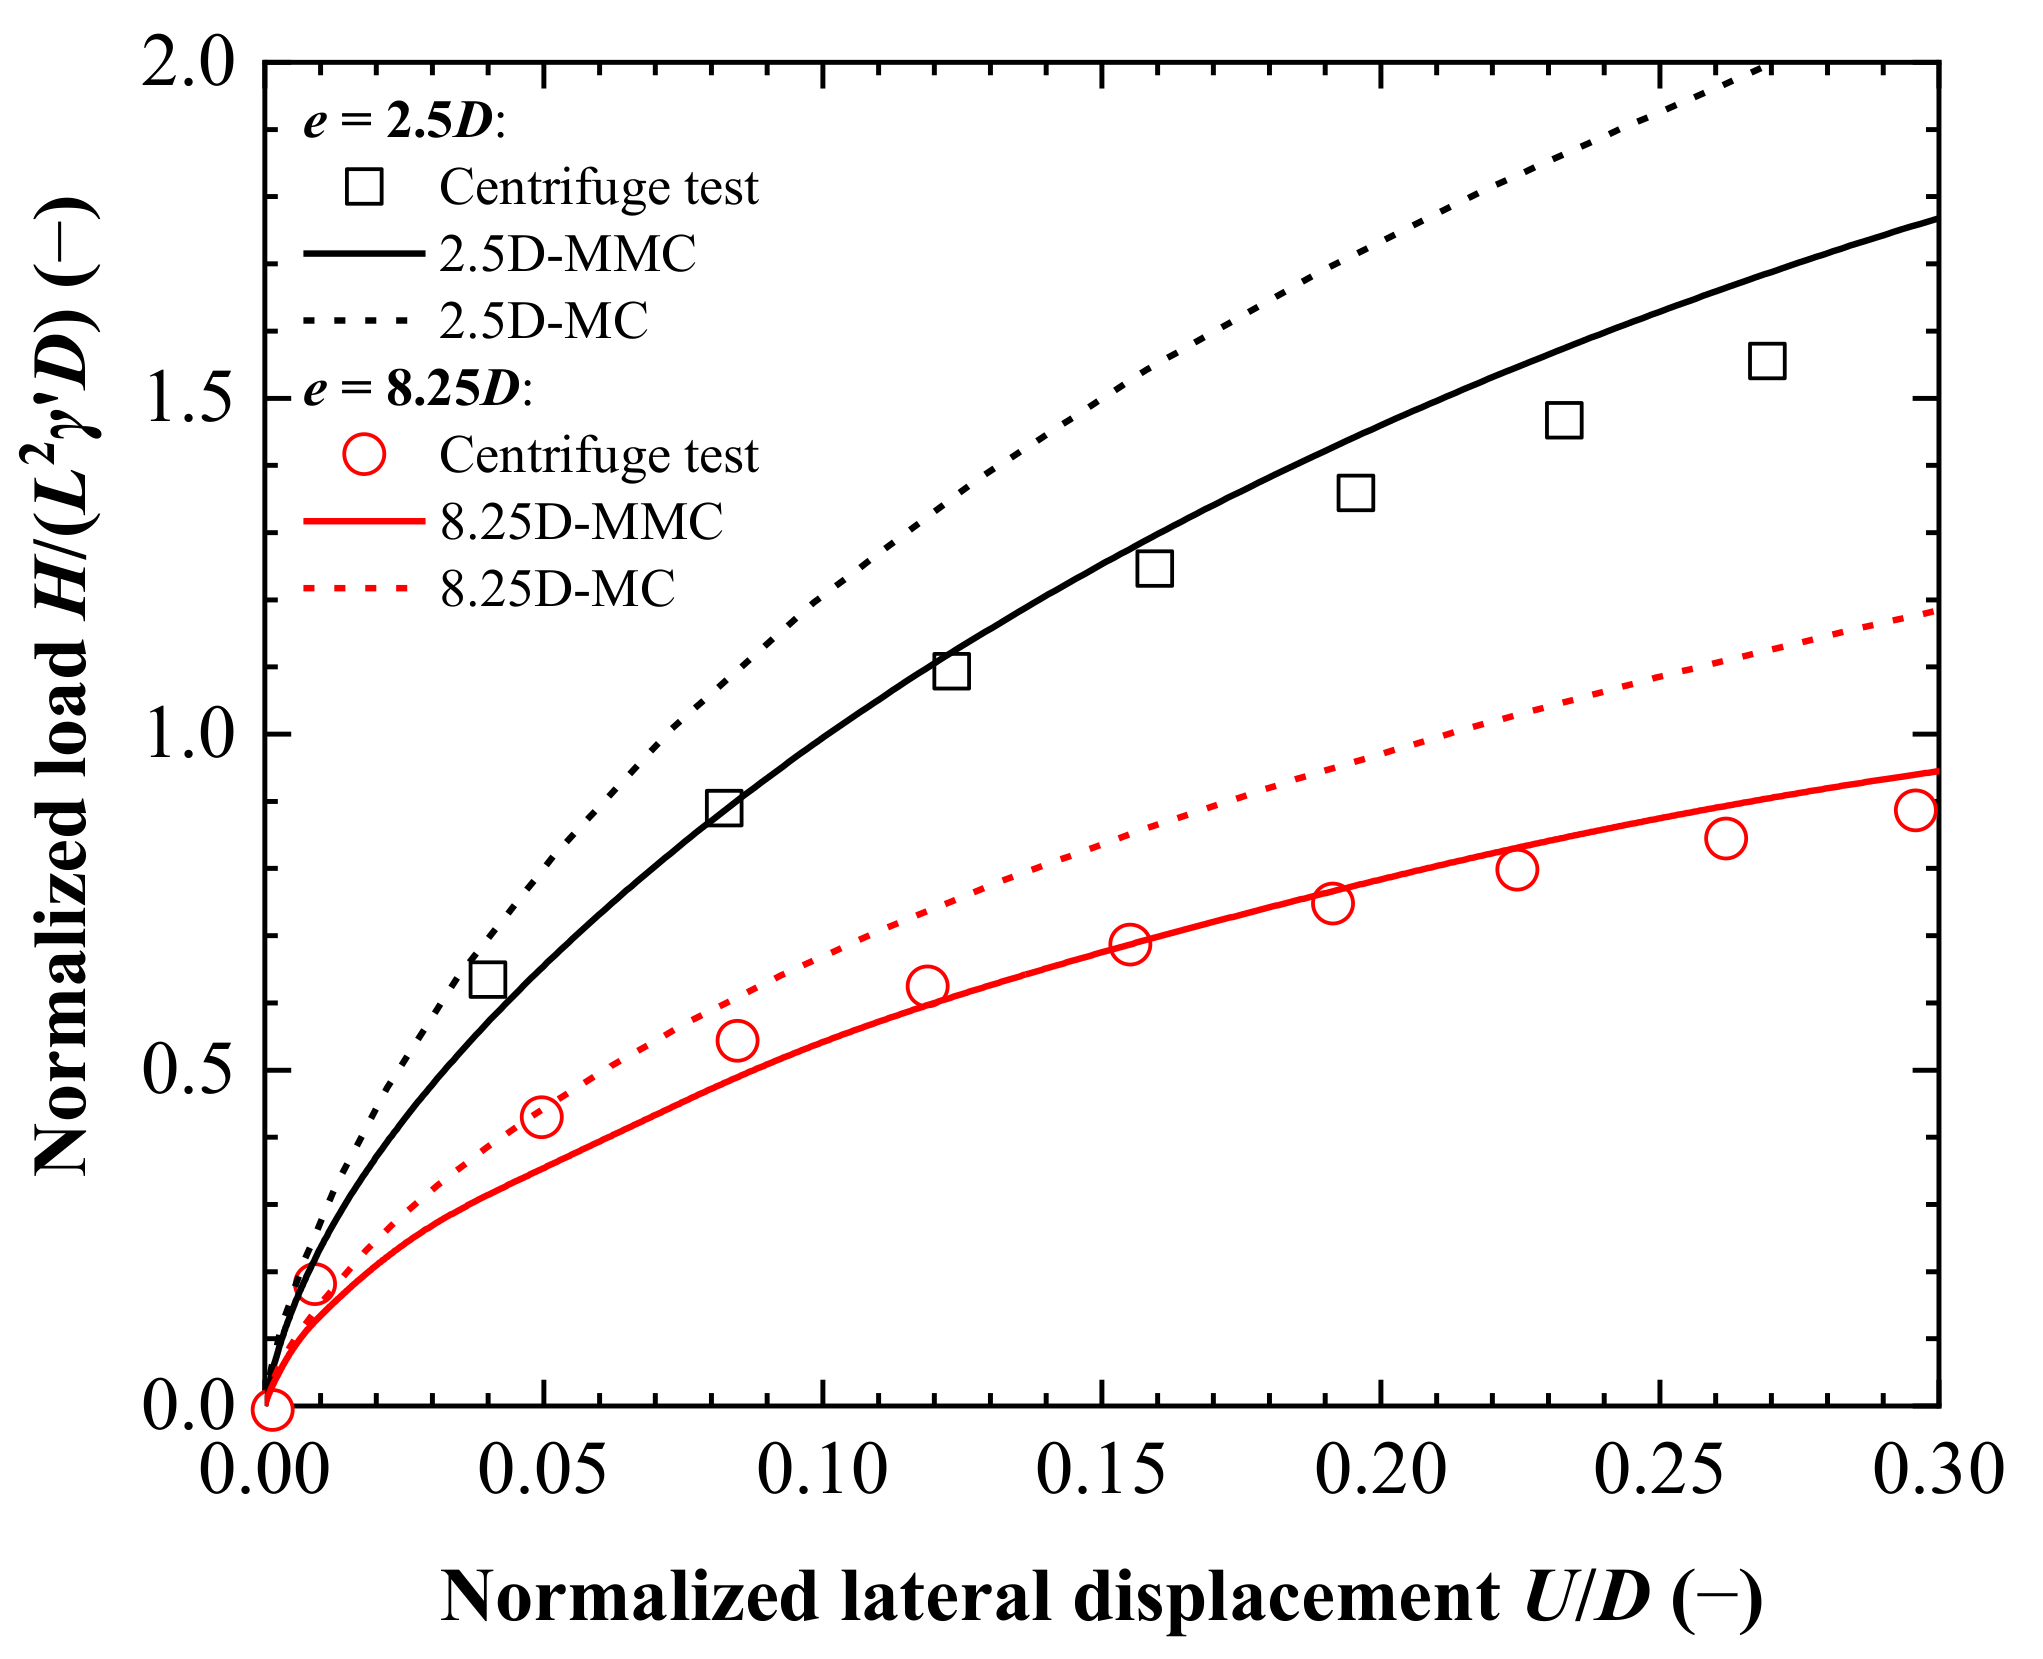
3. Validation by Centrifuge Tests

The numerical model was validated based on the results of a large-diameter monopile centrifuge test in dense sand reported by Klinkvort [44]. The prototype diameter D of the monopile is 3 m and the embedment depth L is 6D. The pile was modeled as linear elastic with Young’s modulus Ep = 210 GPa and Poisson’s ratio of 0.3. To simulate the offshore conditions in the North Sea, centrifuge tests were conducted in dense homogeneous Fontainebleau sand with a relative density of about 90%. Young’s modulus follows Equation (1) [45]. Setting the Mohr–Coulomb (MC) model as the reference group, the constant friction angle φ 0 was calculated by Equation (13) recommended by API [43]. The dilation angle in the MC model was calculated by Equation (14) proposed by Bolton [37]:
ψ = φ 0 φ c
The properties of Fontainebleau sand and the other model parameters are shown in Table 3.
Figure 5a shows the stress–strain behavior of Fontainebleau sand captured by MC and MMC, respectively, against the drained triaxial compression test from Latini and Zania [46]. It shows that the MMC model can accurately capture the hardening and softening effects during the deformation of dense sand. For the MC model, the shear stress of the dense sand increases with the axial strain εa to the peak and then remains constant because a fixed friction angle φ 0 is used in the analysis. As for Test 9 with a high relative density of Dr = 80%, the hardening and softening effects during the deformation of sand are salient, while the MC model is only capable of capturing the peak stress in the plastic zone. It is indicated that the MC model overestimates the load capacity of dense sand. Figure 5b compares the volumetric properties of the dense sand described by the MMC and MC models. By adopting the MMC model, the volumetric compression occurs initially, then the sand dilates until the volume approximately remains constant. In contrast, the MC model shows that dense sand dilates almost linearly after volumetric compression due to a fixed dilation angle ψ, deviating from the test results obviously.
Figure 6 compares the numerical results with the centrifuge test regarding the lateral response of a regular monopile under different load eccentricities. It can be seen that the normalized load–displacement curves obtained from the MMC model match the centrifuge test results well. In contrast, the MC model tends to overestimate the lateral bearing capacity. The difference between the MC and MMC models can be further explained by the formation of shear bands (accumulated plastic shear strain concentrated zones). The evolution of the plastic shear zone with a constant load eccentricity (e = 2.5D) between the MC and MMC models is compared in Figure 7. The plastic shear strain does not develop significantly when the displacement is small (θ = 0.5°). As the displacement increases, the plastic shear band f1 appears near the pile head first and then extends in a diagonally downward direction (θ = 2.0°). A second plastic shear band f2 appears as the displacement continues to increase and extends obliquely upward to the surface to form a damaging wedge (θ = 8.0°). As the displacement further increases, a plastic shear band f3 forms below the shear band f2 and extends similarly to the surface (θ = 10°). The contours from the MC model show that the failure wedge is developed by a simple shear band from beginning to end. Such a difference causes an increasing deviation in the simulated lateral bearing capacity as the pile deflection increases. These comparisons with soil element tests and centrifugal pile tests all demonstrate the reliability of the developed MMC model in estimating the lateral response of monopile foundations embedded in dense sand.

4. Parametric Study and Discussion

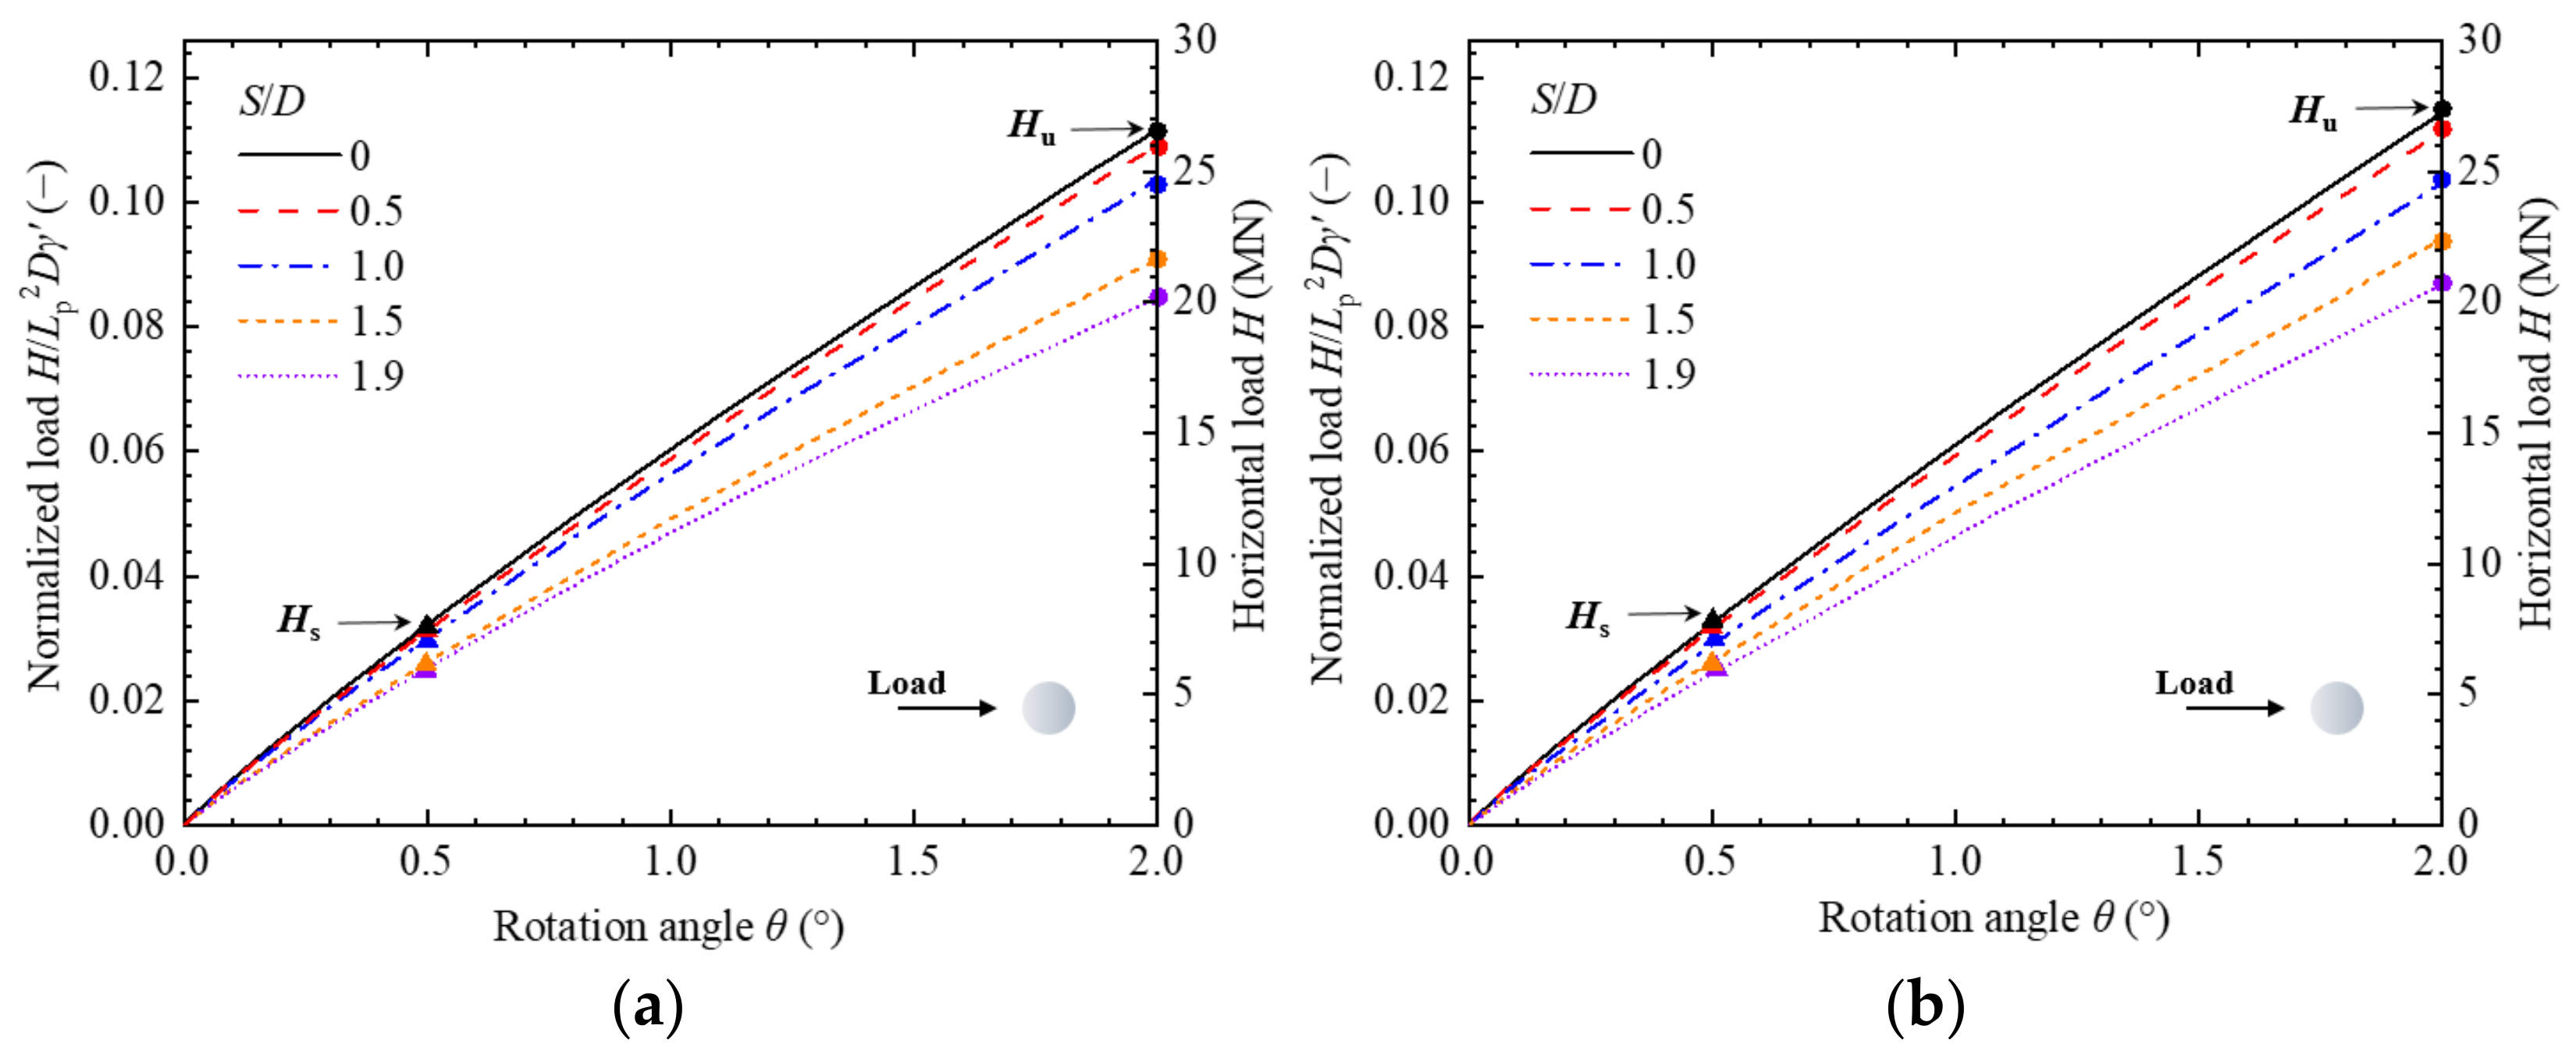
4.1. Effect of Scour Depth

4.1.1. Scour Effect on Four-Wing Monopiles

Cases with various scour depths were simulated to investigate the scour effect on the lateral bearing capacity of winged monopiles. In Series I (Table 2), four-wing monopiles (WP4) with Lw/Ww = 1 in the sand with relative density Dr = 90% were considered. Figure 8a compares the load–displacement curves at the head of the winged monopiles. The vertical axis represents the horizontal load H (expressed as the normalized load H/Lp2′). The horizontal axis represents the angle of rotation (θ) of the pile head at the mudline. As expected, the lateral bearing capacity of winged monopiles decreases with increasing scour depth. Two key design limits when designing pile foundations for OWTs are marked in Figure 8a, which are the serviceability limit state (SLS) and the ultimate limit state (ULS) [47]. The corresponding lateral loads are denoted as Hs and Hu, respectively. The corresponding moments are denoted as Ms and Mu, respectively. SLS failure refers to the tilt angle of OWT at the mudline exceeding the allowable value. This value is commonly set to 0.5°, which is generally small but sufficient to affect the normal operation of the turbine [48]. In contrast, the ULS criterion is characterized by the excessive rotation of piles as OWTs are typically supported by short piles with rigid behavior [49]. This larger tilt angle is set to 2° at ULS in the FE simulations performed in this study [50,51].
It can be seen from Figure 8a that the lateral bearing capacity at SLS and ULS of winged monopiles with maximum scour depth S = 1.9D are reduced by 20% compared to the case without local scour. Figure 8b compares the variation in the lateral bearing capacity ratio (K) with the rotation of winged monopiles for different scour depths. The lateral bearing capacity ratio K represents the ratio of the lateral load under the scoured condition to that of the unscoured condition. The value of K remains almost constant with the rotation for all the examined scour depths. This indicates that the effect of pile deformation on the lateral bearing capacity ratio of pile foundations under different scour depths is generally constant.
As shown in Figure 9, the discrepancy in the previous lateral responses can be attributed to the difference in failure mechanism due to scour. In Figure 9, profile AA′ is 12 m from the top of the pile (top of the wings); profile BB′ is 15 m from the head of the pile (middle of the wings); and profile CC′ is 18m from the top of the pile (bottom of the wings). When the pile is rotated clockwise under the load, the soil near the mudline follows the winged pile and the pile toe kicks back the sand. Profile AA′ shows that the scour hole reduces the width and length of mobilized soil at the top of the wings by 6%. This demonstrates that winged monopiles without local scour (Figure 9a) can mobilize a larger amount of soil in the shallow layer to obtain a higher lateral bearing capacity than winged monopiles with local scour (Figure 9b).
The effect of scour on soil–pile interaction can be further explained by the evolution of the plastic zone in dense sand. In Figure 10, γ p / γ p p > 1 indicates that the soil is in the post-peak region; conversely, the soil is in the pre-peak region when this condition is not met. As shown in Figure 10a, the soil in front of the pile head first enters the post-peak softening zone (θ = 0.5°) and gradually evolves downward with increasing rotation (θ = 2°). The plastic zone around the wing is mainly gathered above the rear wing and ahead of the front wing (θ = 2°). However, in Figure 10b, a large volume of soil is in the post-peak softening stage when the pile head displacement is small (θ = 0.5°). Nearly all of the soil around the wings enters the plastic zone after the formation of the local scour hole (θ = 2°), suggesting that the soil resistance mobilized by the wings acts as the main force to resist pile deformation. The γp above the front wing develops to the post-peak softening stage with pile rotation.
Figure 11 shows the modified friction angle φ′ and the modified dilation angle ψ of the sand for pile head rotation θ = 2° under unscoured and scoured (S = 1.5D) conditions, respectively. The soil elements that reach the critical state are highlighted in the figure. It is evident that more soil near the wings of the hybrid monopile is at the critical state for the scoured case, with a large accumulated plastic shear strain. The profiles show the wings perpendicular to the direction of the load dividing the soil around the wings into two parts: “front” and “rear”. The friction and dilation angles of the front area are generally smaller than those of the rear area. This is attributed to the relaxation of the restraint (lower stress level) in the rear zone due to the displacement of wings, which allows the soil to obtain a high friction angle (dilation angle) with only a small plastic strain.

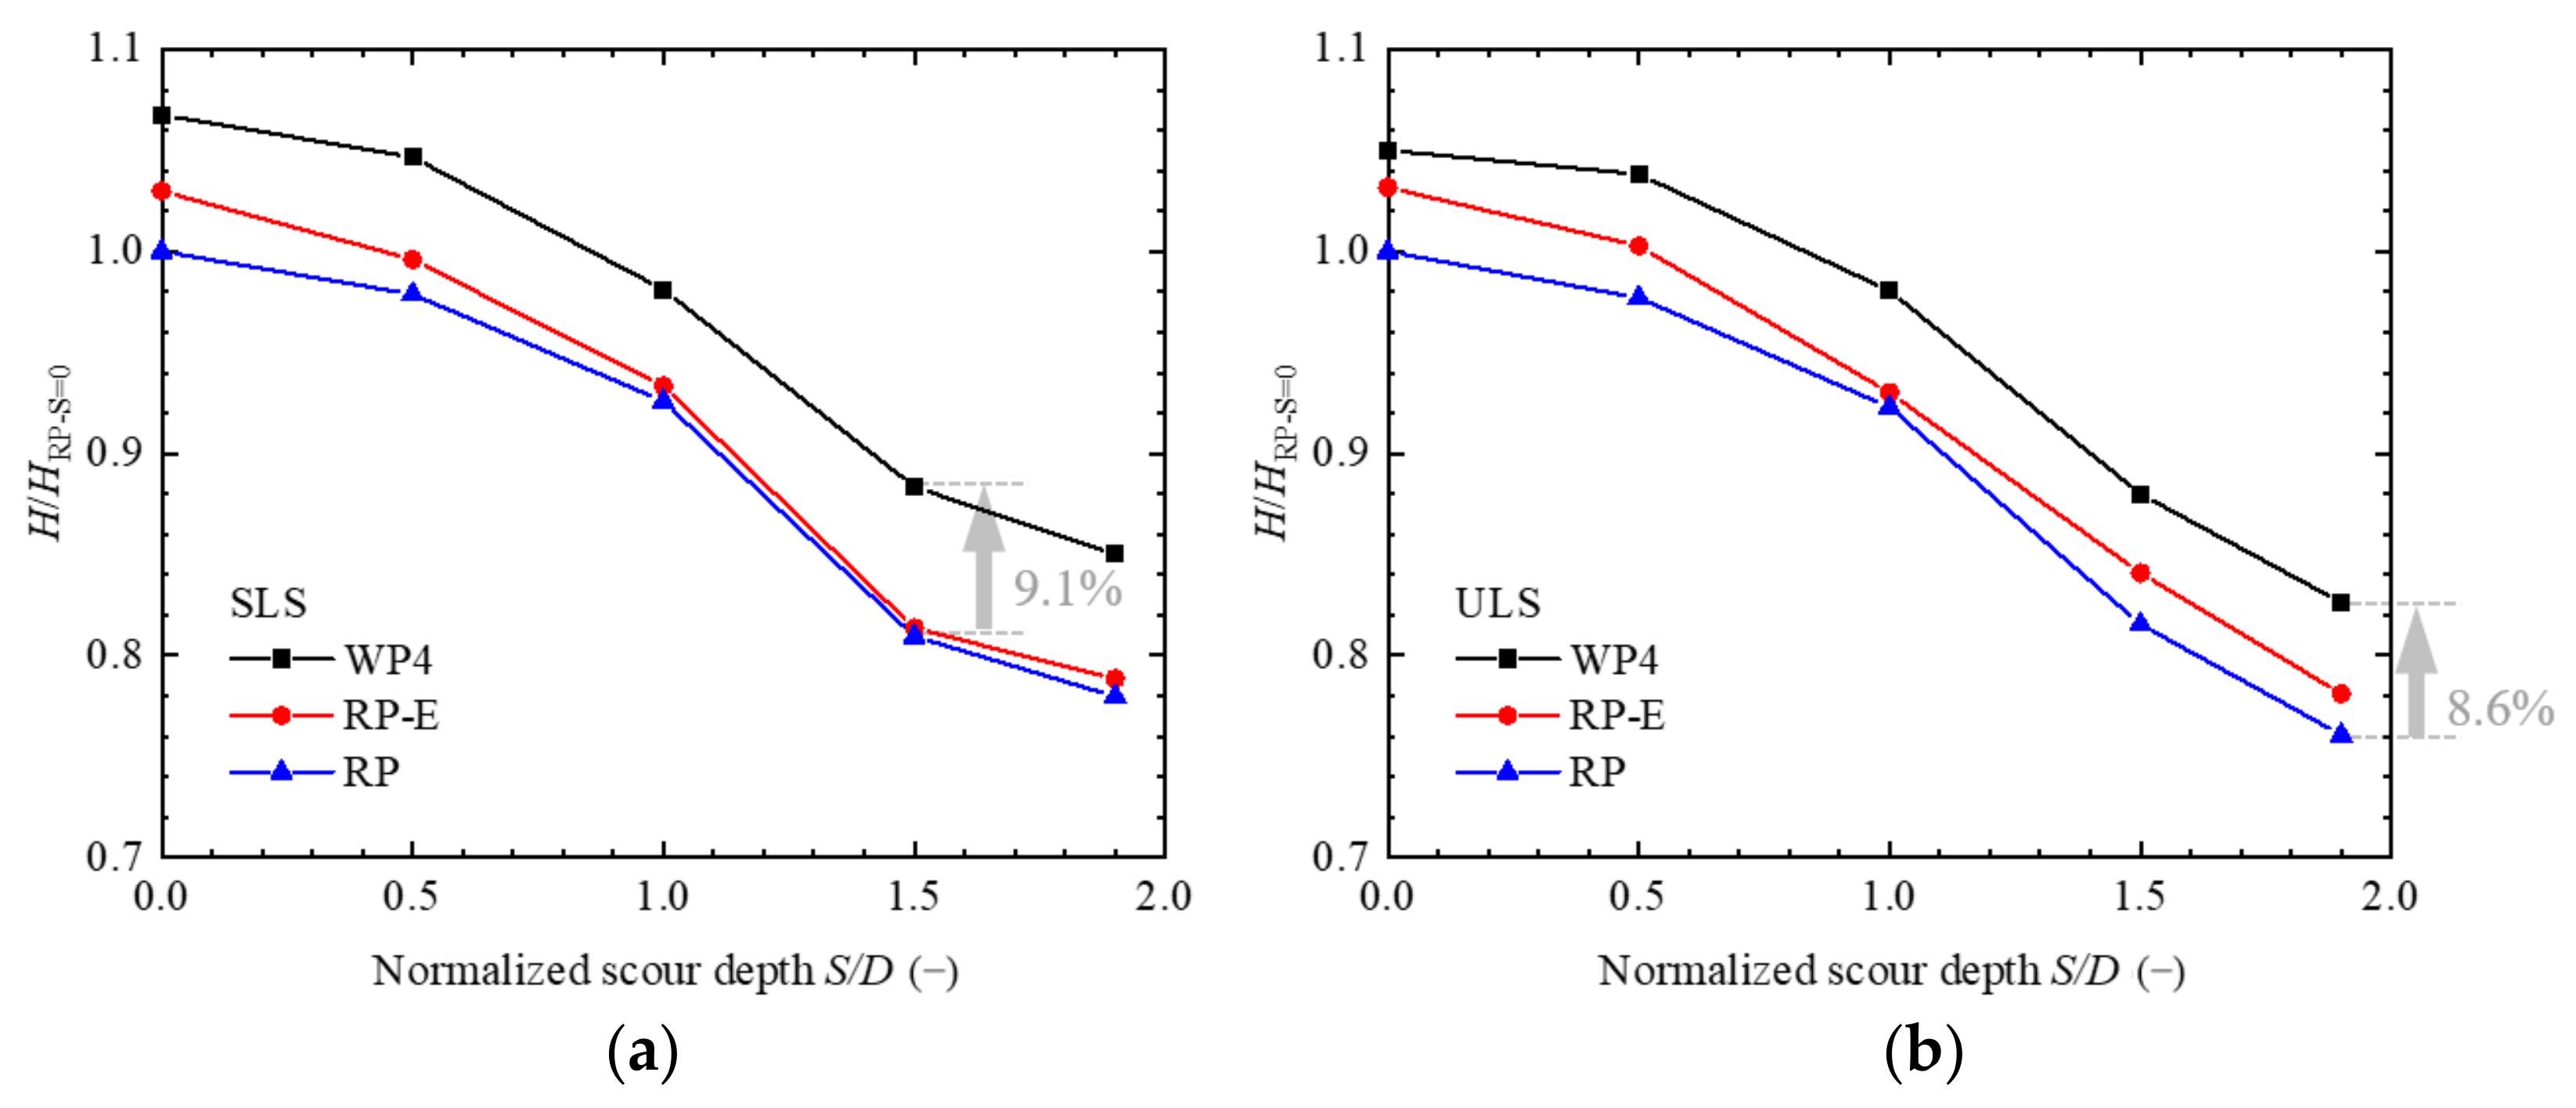
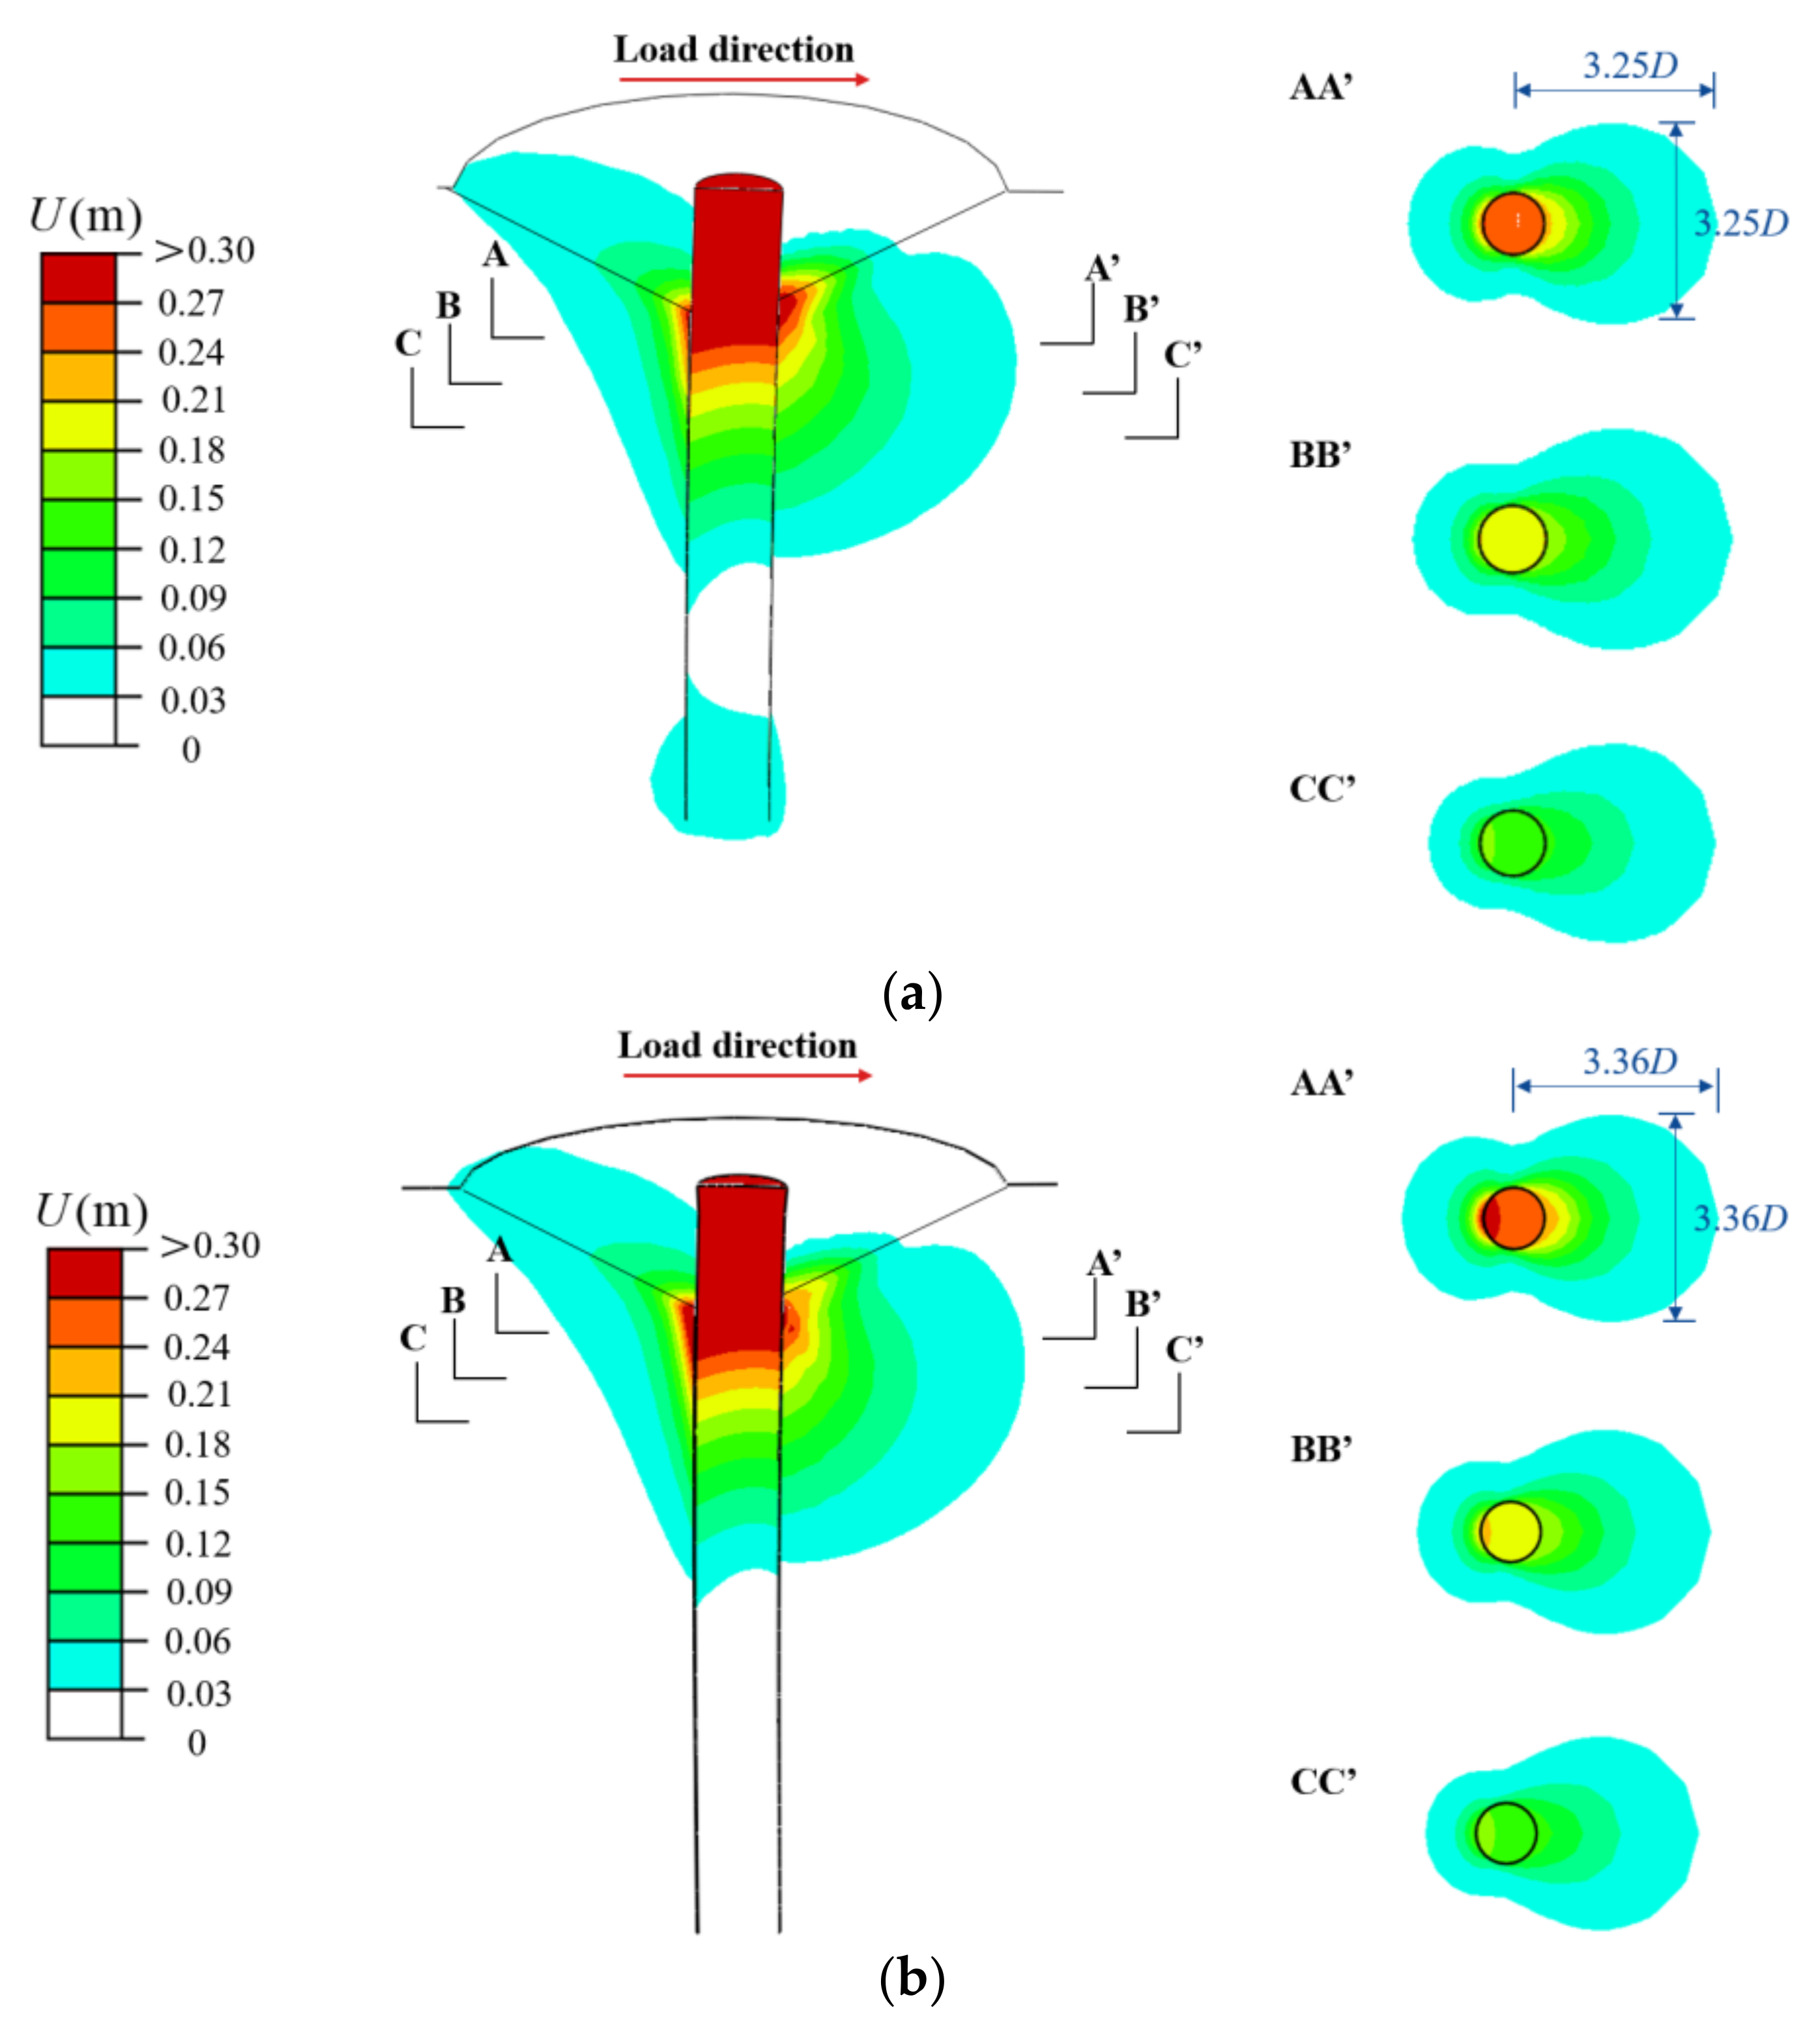
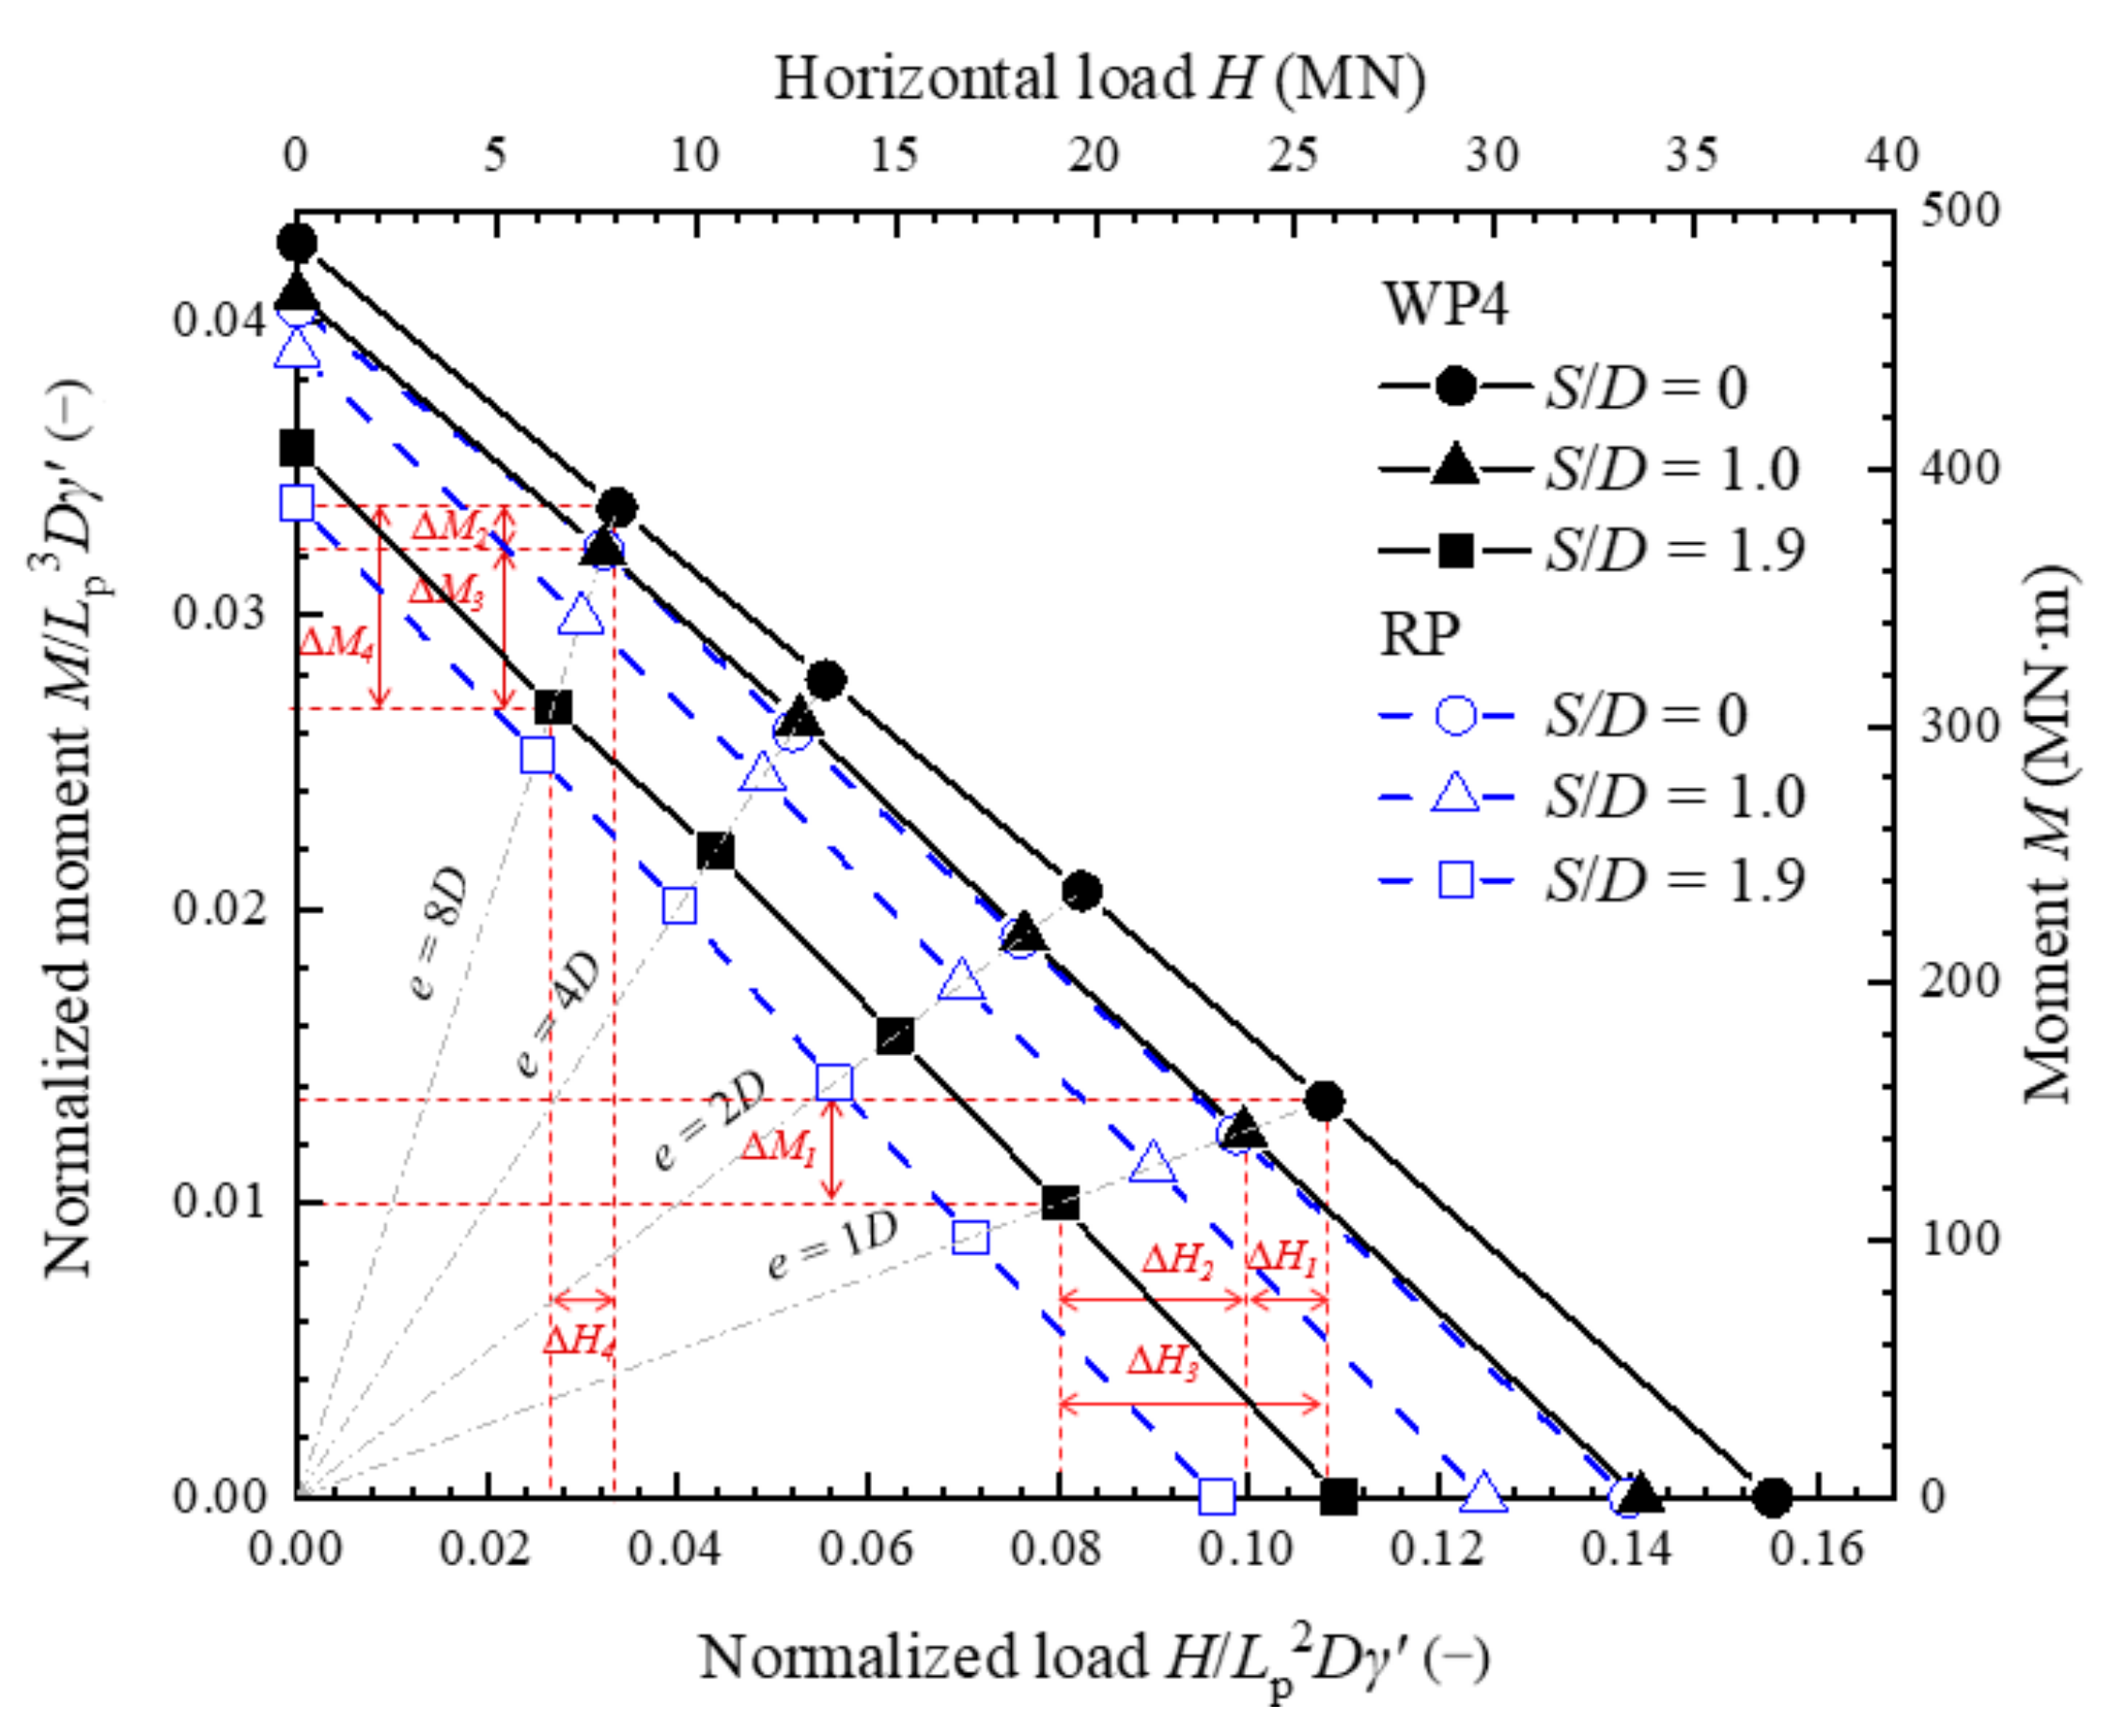
4.1.2. Comparison between Four-Wing Monopiles and Regular Monopiles

The lateral bearing capacity is usually improved by increasing the embedded depth of the pile foundation. A group of regular monopiles (RP) with the same embedment depth and a group of extended monopiles (RP-E) consuming the same material as WP4 were established as reference groups to examine the sensitivity of wings to the variation in scour depth. Figure 12 shows the load–displacement curves of regular monopiles (RP) and extended regular monopiles (RP-E) with different scour depths. Figure 13 shows the ratio of the lateral bearing capacity of the winged monopiles (WP4) and the extended regular monopiles (RP-E) to the regular monopiles (RPS = 0) without local scour at SLS and ULS. It can be seen that the lateral bearing capacity of the pile foundation can be enhanced by increasing the embedment depth and introducing wings, with the latter being more effective. The presence of wings can increase the lateral bearing capacity of the pile by up to 9.1% at SLS and 8.6% at ULS. It is favorable to have a slightly higher increase in the lateral bearing capacity at SLS as OWTs are more sensitive to deformation.
Figure 14 shows the soil displacement of regular monopiles with different embedment depths at ULS. It is found that extending the embedded length of a regular monopile hardly produces any displacement at the bottom of the pile. Nevertheless, profile AA′ reveals that slightly more soil at shallow depths can be mobilized to resist pile deformation with the increase in embedment depth. In addition, comparing Figure 14b and Figure 9b, the presence of the wings changes the pile circumferential displacement profile from “gourd-shaped” to “teardrop-shaped”, leading to higher lateral bearing capacity than extending the embedment depth of regular monopiles.
The lateral bearing capacity of piles can be better described by using moment–force interaction diagrams (Figure 15), which show an almost linear trend. As expected, the lateral bearing capacities (both Hs and Ms) of piles decrease with an increase in scour depth. In addition, the weakening of the lateral bearing capacity is more pronounced when the scour depth develops from 1D to 1.9D, compared with that from 0 to 1D (i.e., ∆H1 < ∆H2, ∆M2 < ∆M3). This implies that the detrimental effect of scour on the lateral bearing capacity of monopiles accelerates with the development of scour. Another observation from the interaction diagram is that at a small eccentricity (e = 1D), the lateral force weakened by scour is equivalent to four times as much as that with e = 8D (i.e., ∆H3 ≈ 4∆H4), while the bending moment variation is relatively small (i.e., ∆M1 ≈ 0.5∆M4). This indicates that the effect of scour on the lateral bearing capacity of piles shifts from lateral force to a bending moment with the increase in load eccentricity e. When the scour depth S = 1D, the envelope of the winged monopile (WP4) almost coincides with the regular monopile under the unscoured condition, demonstrating the effectiveness of the wings in improving the lateral bearing capacity of pile foundations.

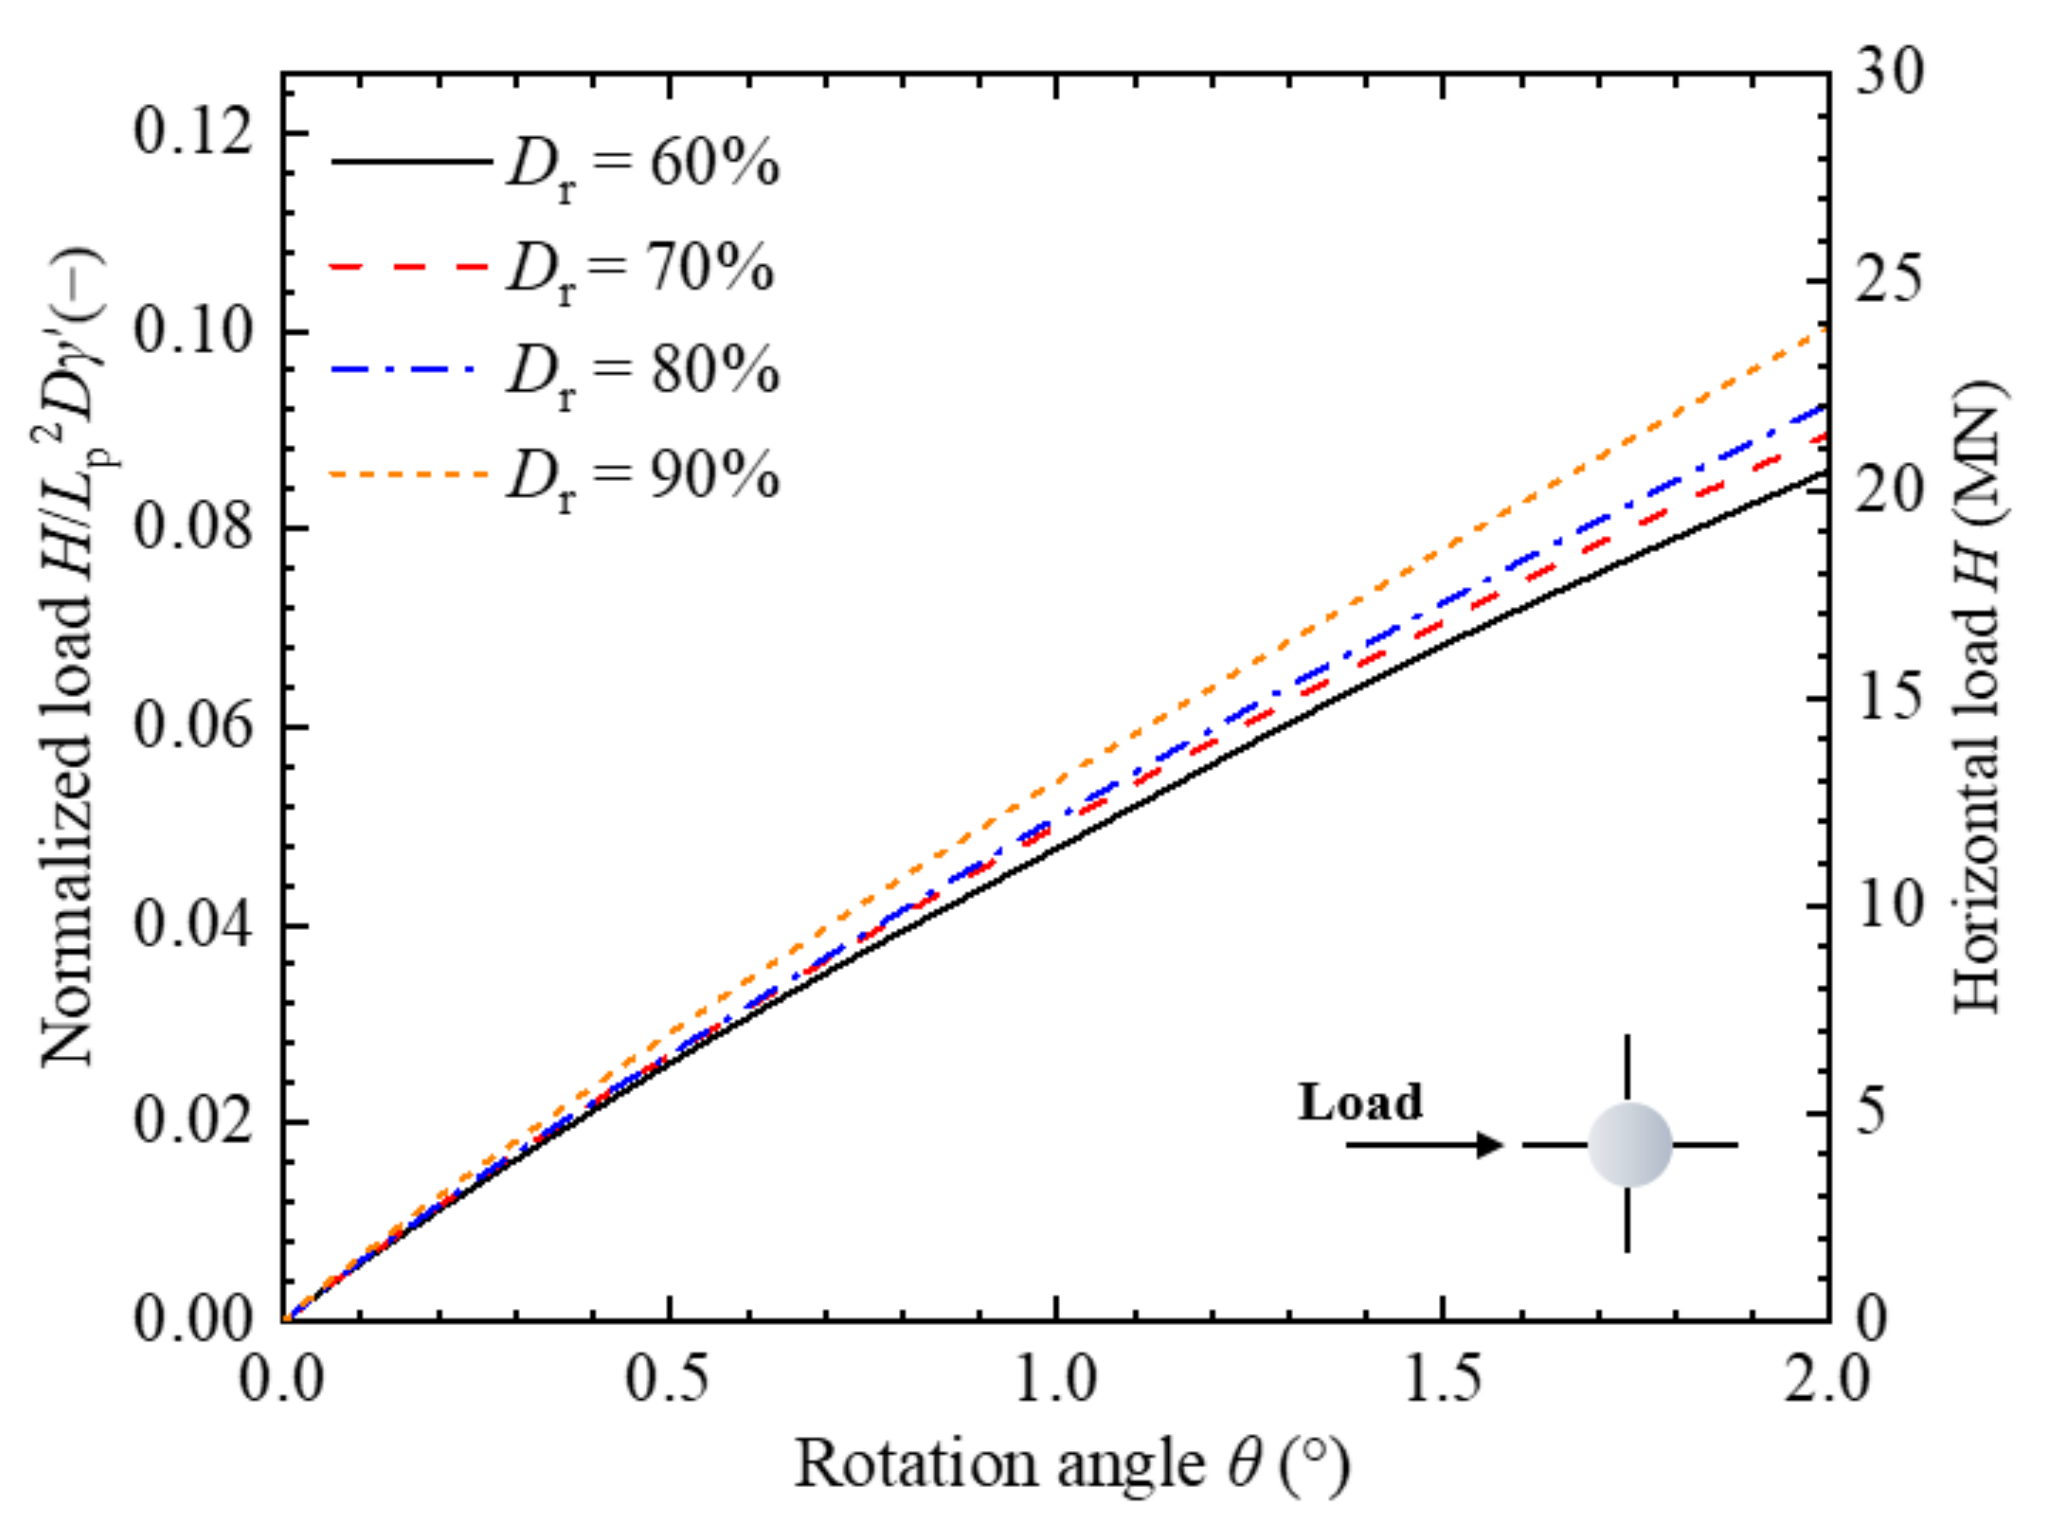
4.2. Effect of Relative Density of Sand

This section modelled three groups of sand with different relative densities (i.e., medium-dense sand: Dr = 60%; dense sand: Dr = 70%, 80%; and very dense: sand Dr = 90%) to analyze their effect on the lateral bearing capacity of pile foundations under scoured conditions (S = 1.5D). Note that the MMC model is not recommended to capture the mechanical behavior of loose sand [40]. It is also worth noting that the relative density influences both the elastic and plastic behaviors of the sand, as reflected in the model parameters (Table 1). The lateral bearing capacity curves of winged monopiles (Lw/Ww = 1) with different relative densities of sand are shown in Figure 16. Both the lateral load at SLS (Hs) and ULS (Hu) of winged monopiles increase with increasing relative density. Compared with medium-dense sand (Dr = 60%), the values of Hs and Hu of winged monopiles embedded in very dense sand (Dr = 90%) are increased by 12.4% and 16.7%, respectively. On the one hand, this is because the increased relative density magnifies the peak friction angle φp and the peak dilation angle ψp (Figure 4b), leading to a higher soil resistance. On the other hand, more soil reaches the critical state in the sand with lower relative density, with a lower shear strength level maintained at a large accumulated plastic shear strain (marked as dashed circles in Figure 17).

4.3. Evaluation of Wing Efficiency

OWT foundations in service bear loads in multiple directions. The effect of wing load orientation on the wings’ ability to mobilize soil resistance needs to be considered if the winged monopiles are to be applied in marine environments. Figure 18a,b shows the load–displacement curves for different wing load orientations (β). Considering the symmetry of the winged monopile itself, the load direction β acting on the pile head of the four-wing monopile (WP4) is set in the range of 0° to 45°. The load direction β on the head of the three-wing monopile (WP3) is set in the range of 0~60°. The results show that the effect of load direction on the load capacity of winged monopiles is marginal, implying the excellent adaptability of three- or four-wing monopiles to multi-directional loads in marine environments.
In terms of the wing geometry effect, Figure 19 shows the enhancement of lateral capacity with the larger wing height for both four-wing monopiles and three-wing monopiles with a fixed width of wings, with four wings providing a higher capacity. This is because less soil is mobilized by three wings at shallow soil depths, as shown in Figure 20 (compared with Figure 9b for four wings). Similarly, less soil is in the post-peak zone for three-wing monopiles (Figure 21), which can also explain the capacity difference. It should be noted that no solid conclusion can be drawn at this stage that four-wing monopiles perform better than three-wing monopiles. The compared results only apply to the conditions investigated in this study, including the scour depth and the geometry of wings.
The lateral capacity of winged monopiles can be quantified by the wing efficiency, which is defined as follows:
η = H w H RP A W / H RP A pr
where Hw and HRP are loads of winged monopiles and regular monopiles at the same rotation, respectively. Aw is the sum of the areas of the wings of the winged monopile (Aw = n × Lw × Ww). n is the number of wings mounted on the monopile. Apr is the external surface area of the regular monopile (Apr = π × D × Lp). η in Equation (15) is the ratio of the incremental magnitude of the lateral load of the hybrid monopile caused by the unit area of wings to the lateral load of the unit area of the monopile. This is a different definition regarding the wing efficiency compared with those in previous studies [13,14,33], which only considered load efficiency. Rather, the newly defined η is capable of evaluating both load and economic efficiency. As the wing thickness is identical to the pile wall thickness in this study, the areas Aw and Apr are used in Equation (15). If the difference between the wing and pile wall thicknesses needs to be considered, the volume of the consumed material can be used instead.
Figure 22 shows the trend of wing efficiency with various wing heights at SLS and ULS. The wing efficiency calculated by Equation (15) can take different wing numbers and wing heights into account. In the range of the aspect ratio (WL/WW) considered, the wing efficiencies for four-wing and three-wing monopiles decrease with increasing Lw/Ww, which is valid for both SLS and ULS. For four-wing monopiles with Lw/Ww = 1, the wing efficiency is nearly equal to 1, indicating that the soil resistance mobilized per unit area of the wings is the same as that of a regular monopile. Therefore, a wing efficiency η > 1 is recommended to fully utilize the potential of the wings for the enhancement of the lateral capacity of monopiles.

5. Conclusions

In this paper, the combined effects of wing configuration and local scour on the lateral capacity of a hybrid monopile (monopile with ”wings”) are investigated through finite element analyses. A modified Mohr–Coulomb model (MMC) for dense sand is used to capture the load–displacement behavior and the evolution of failure mechanisms for the pile–soil interaction. The following conclusions can be drawn from this study:
(1)
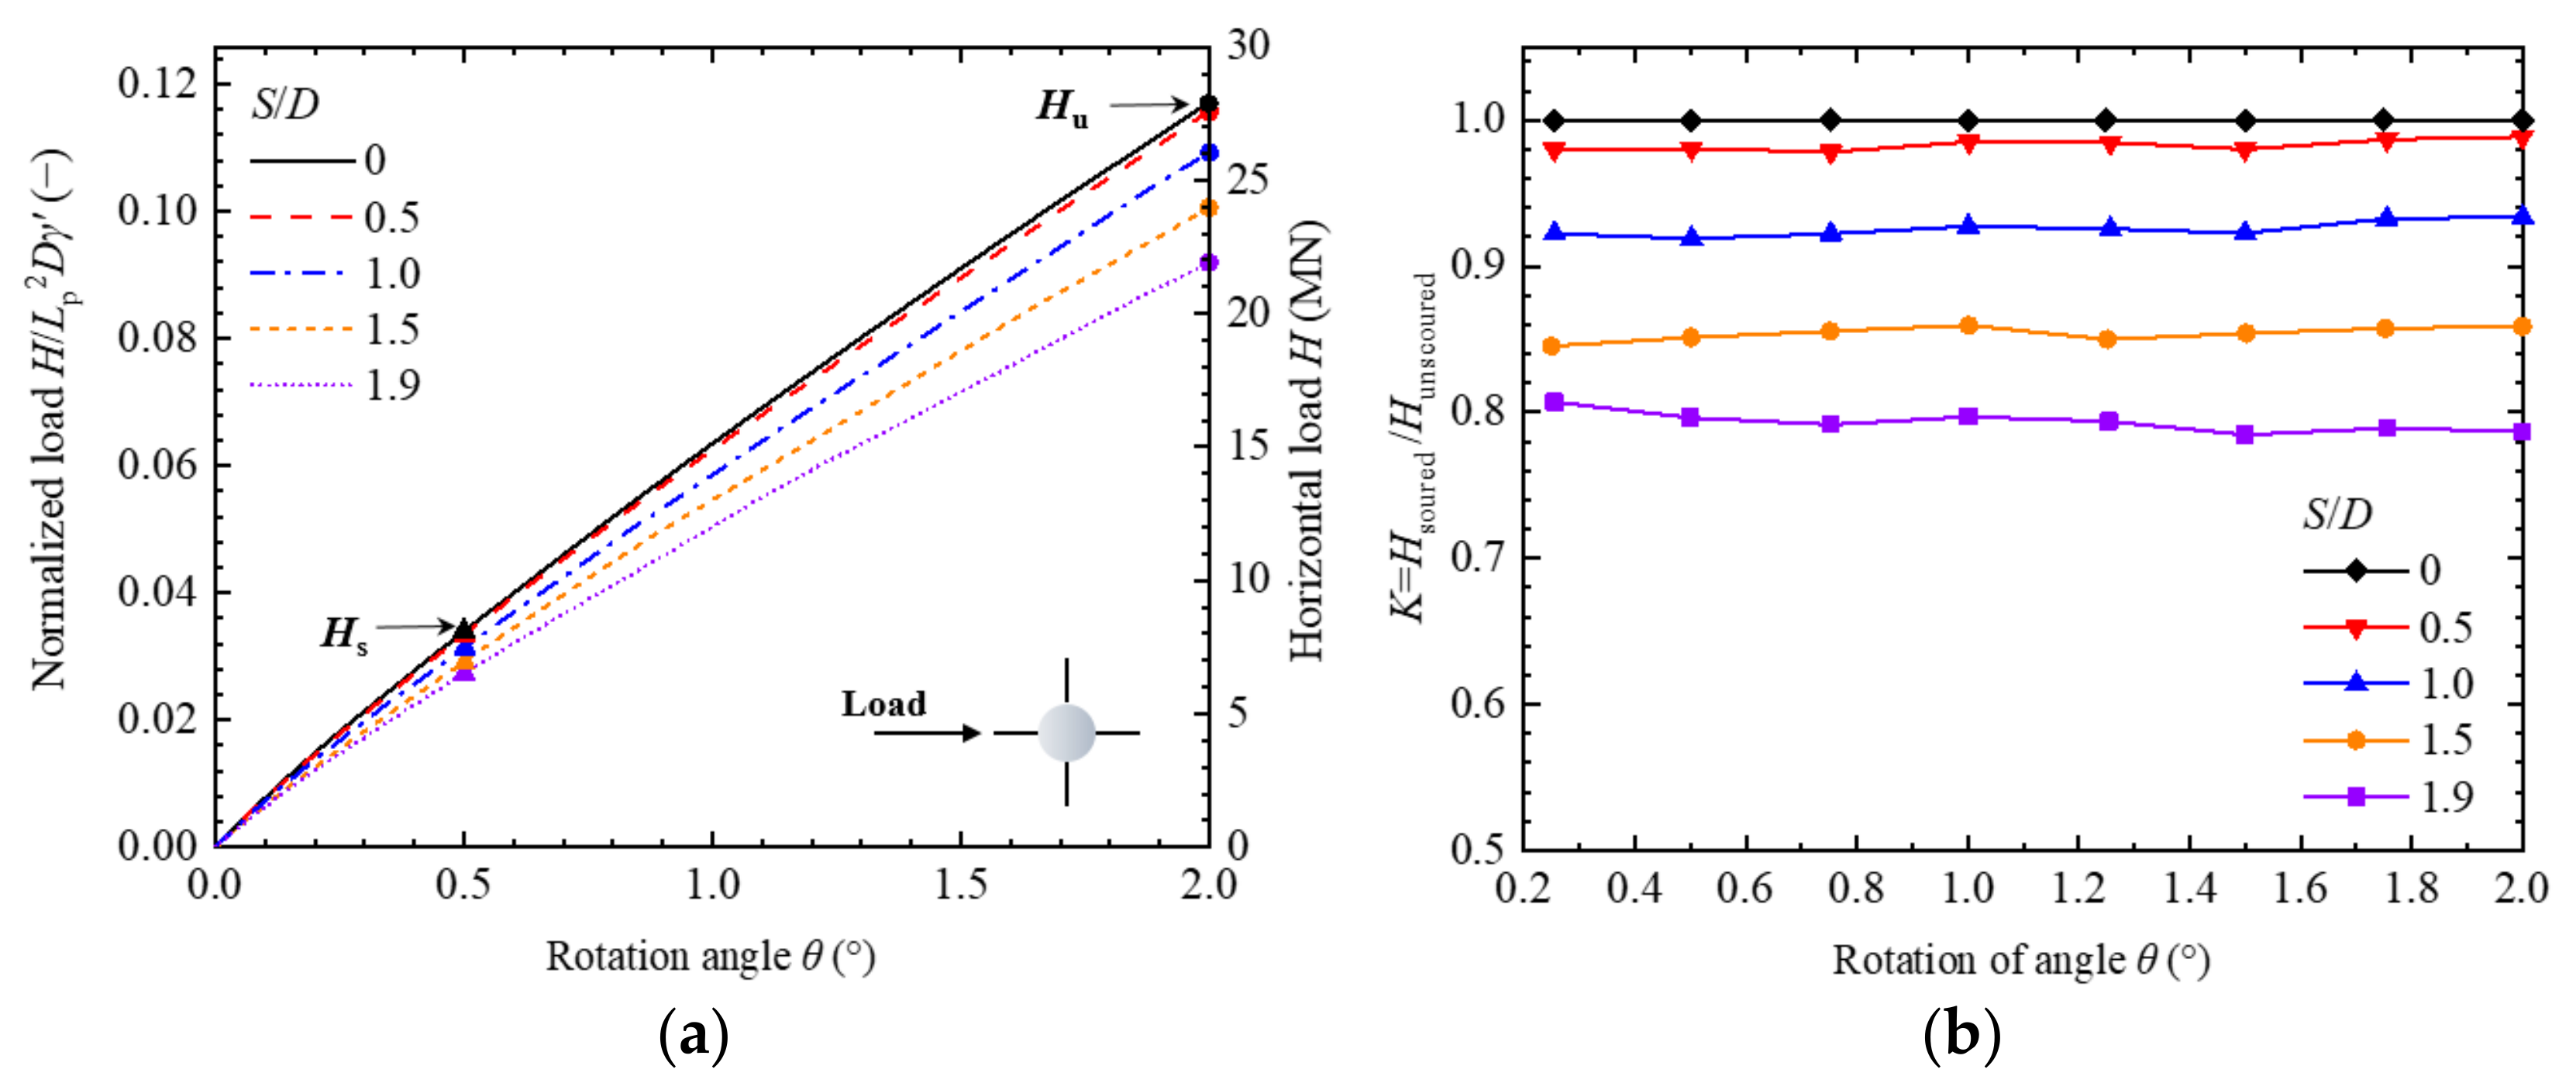
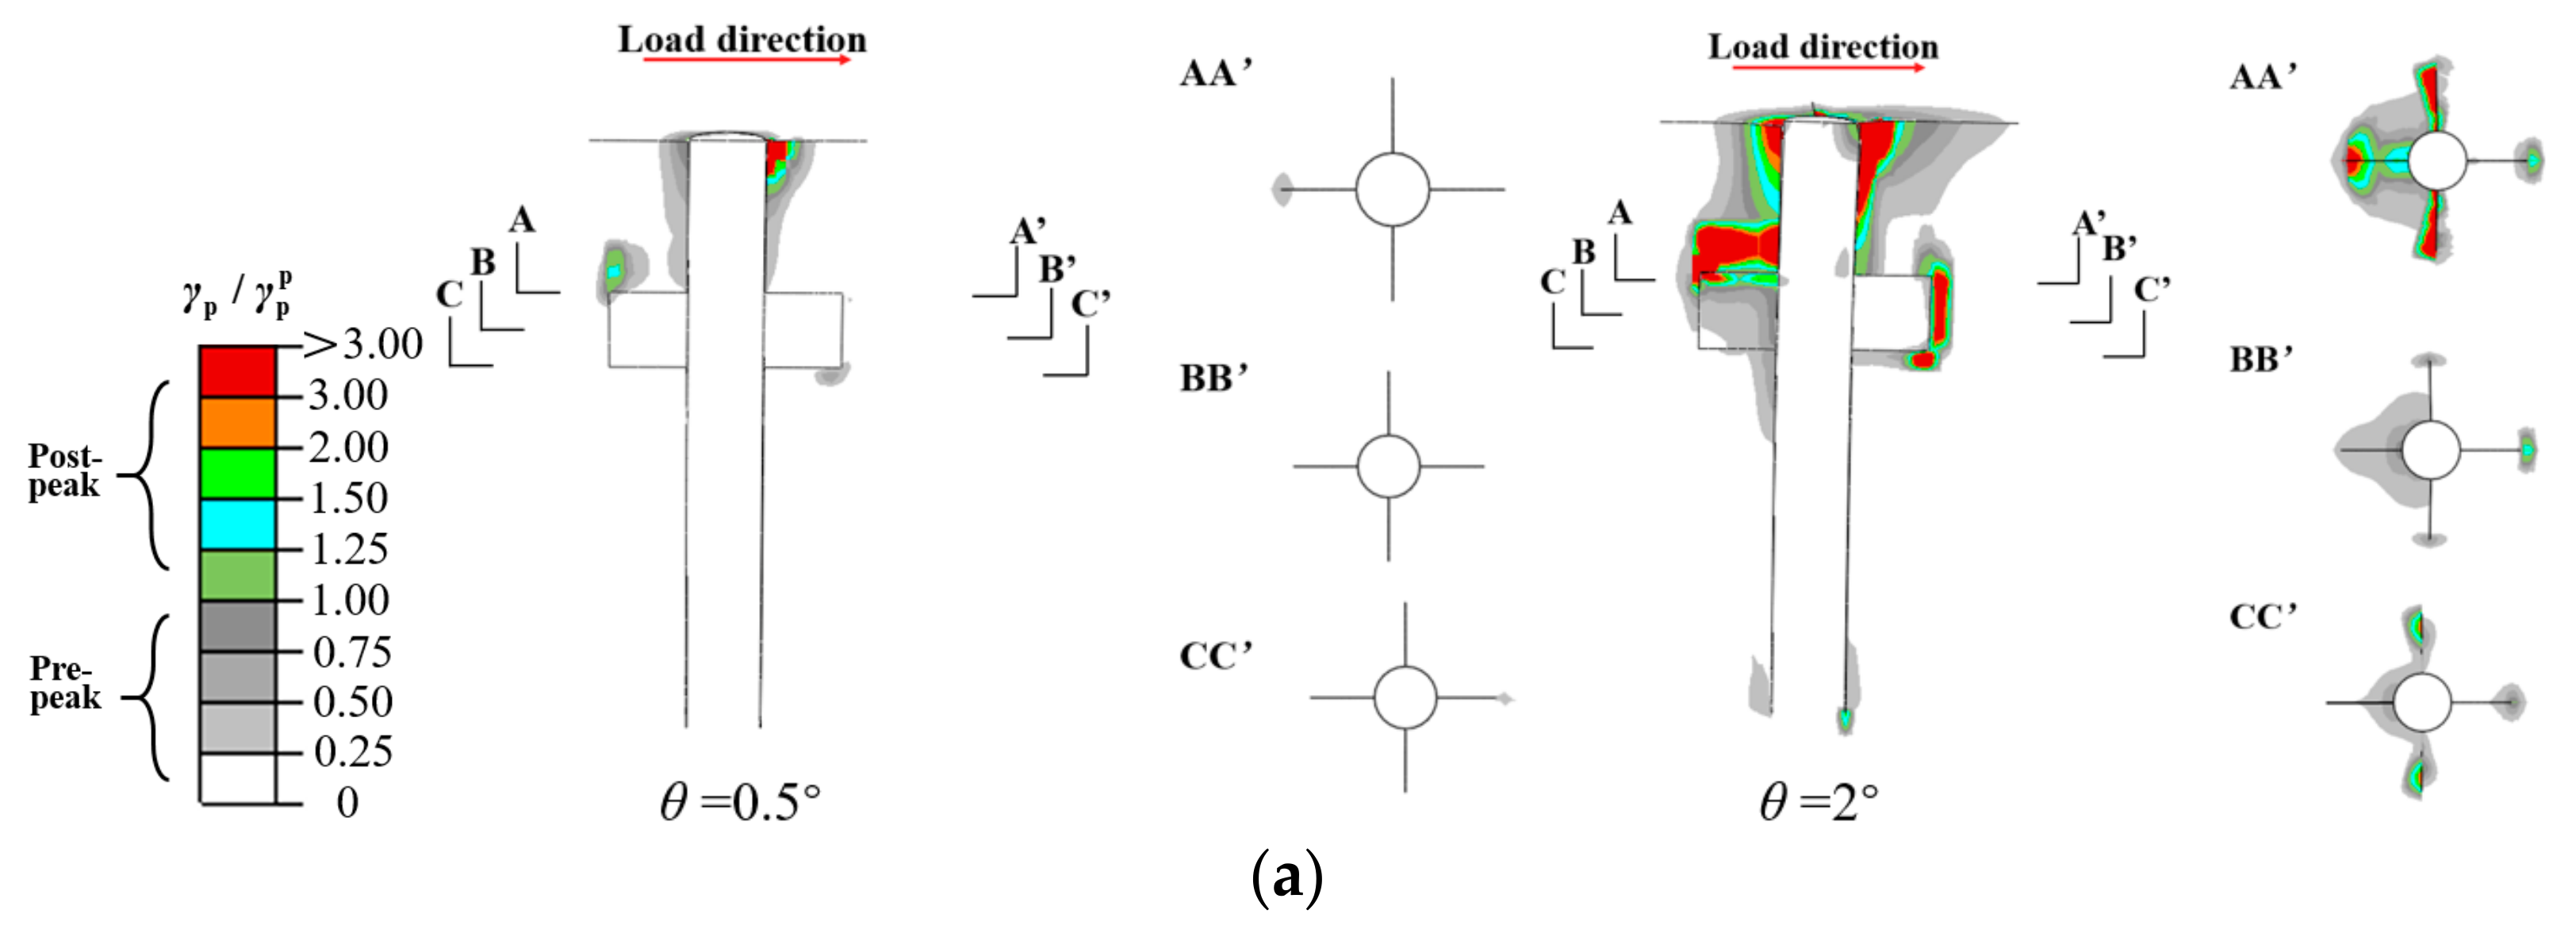
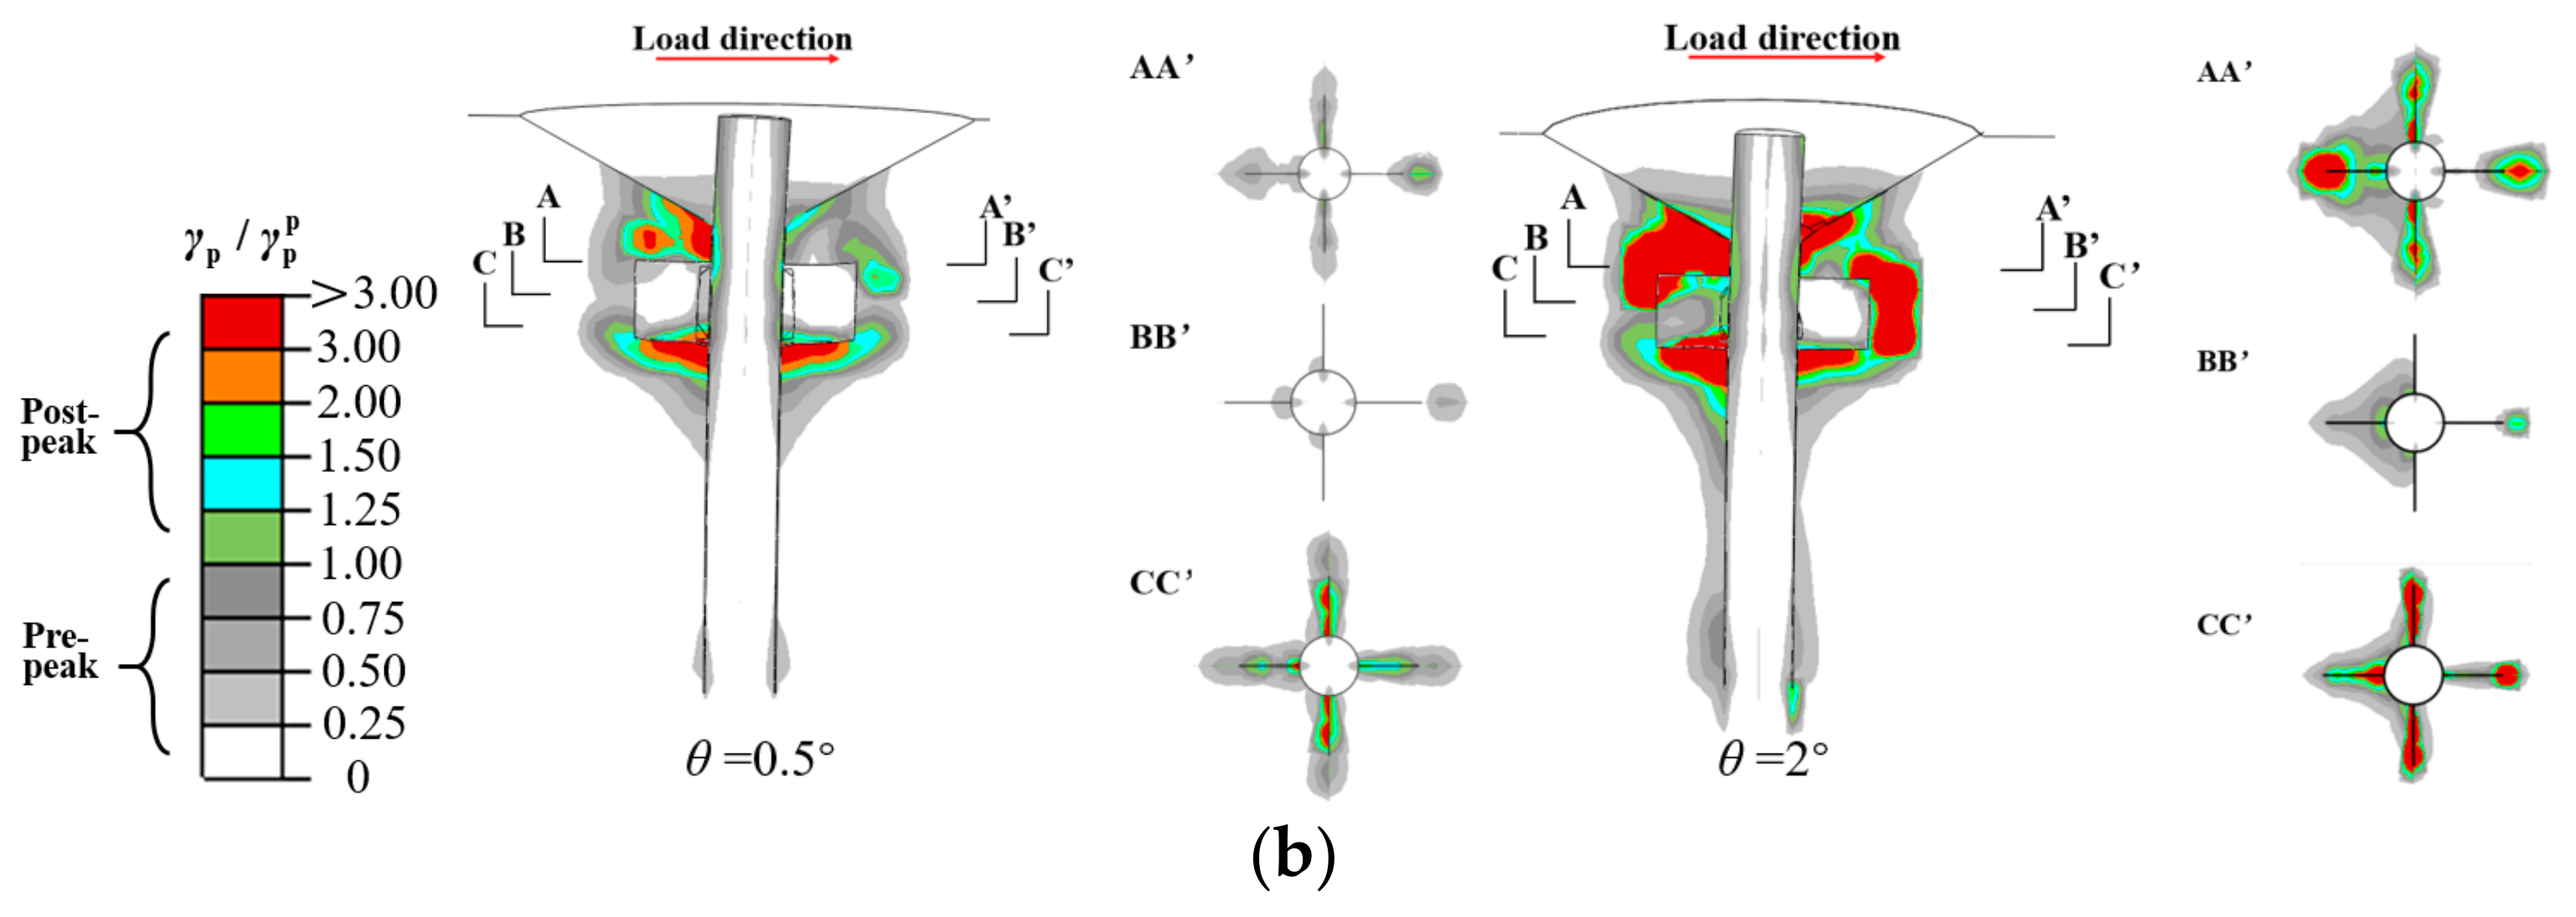
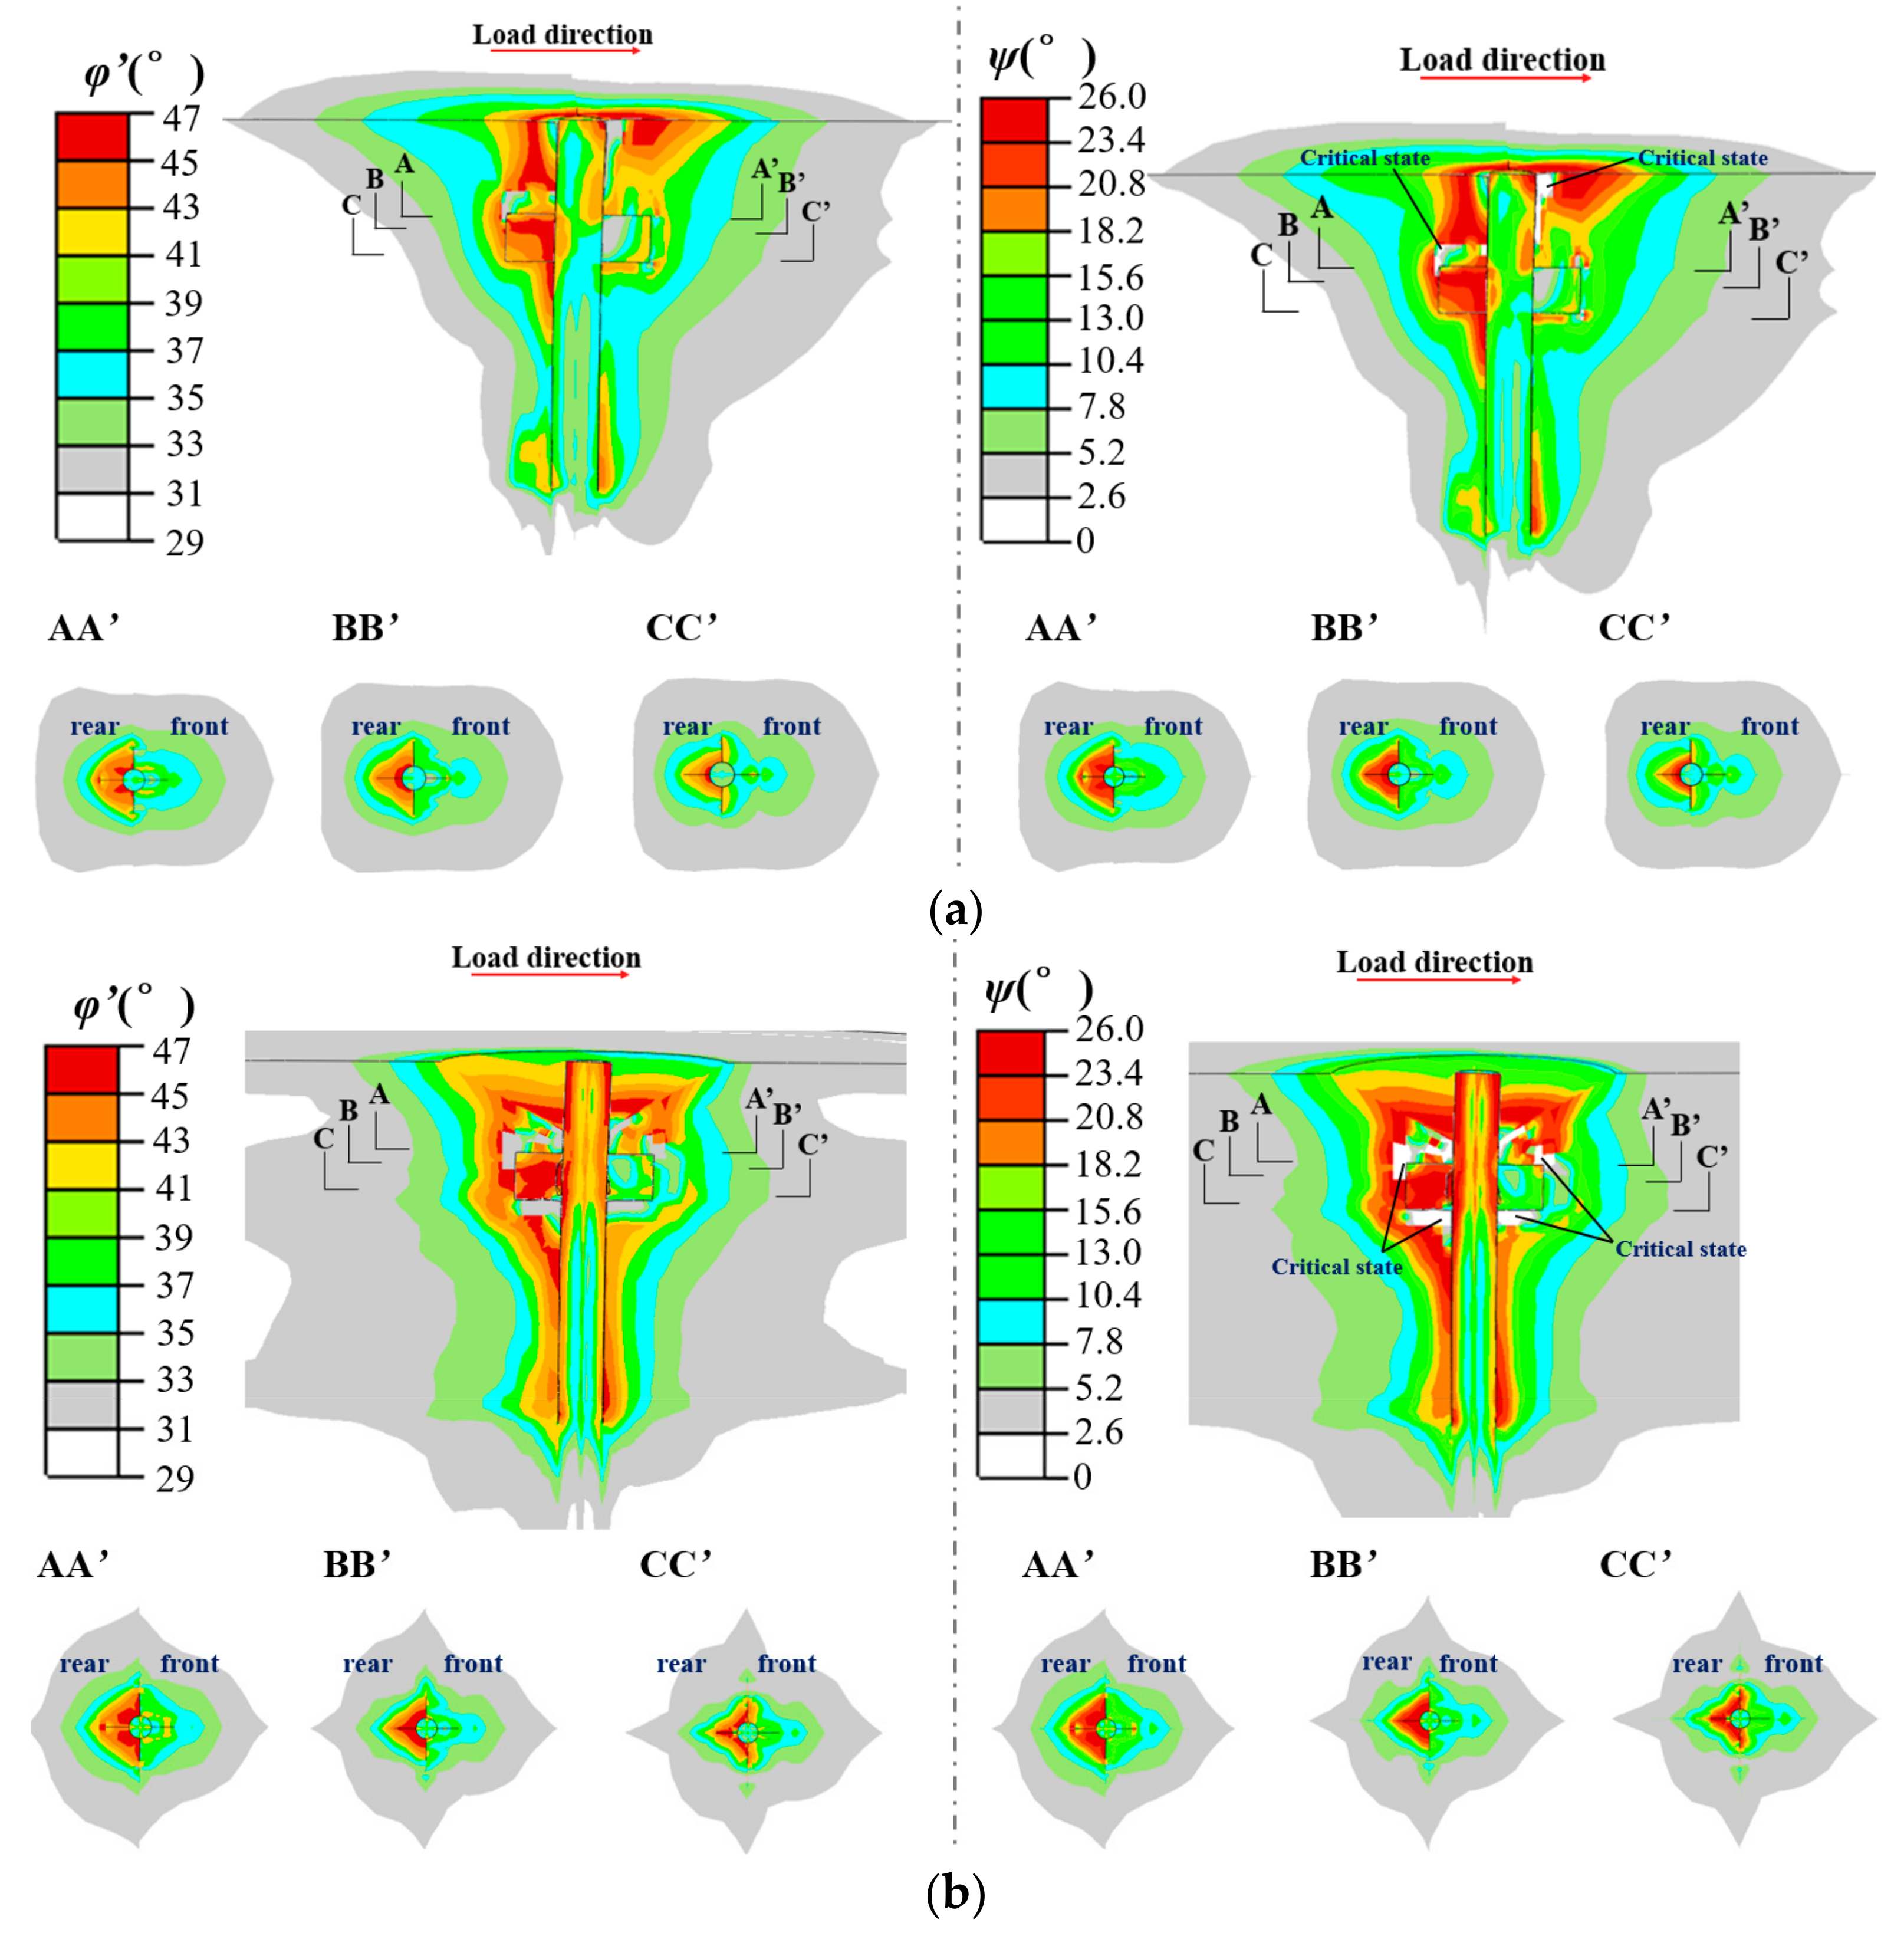
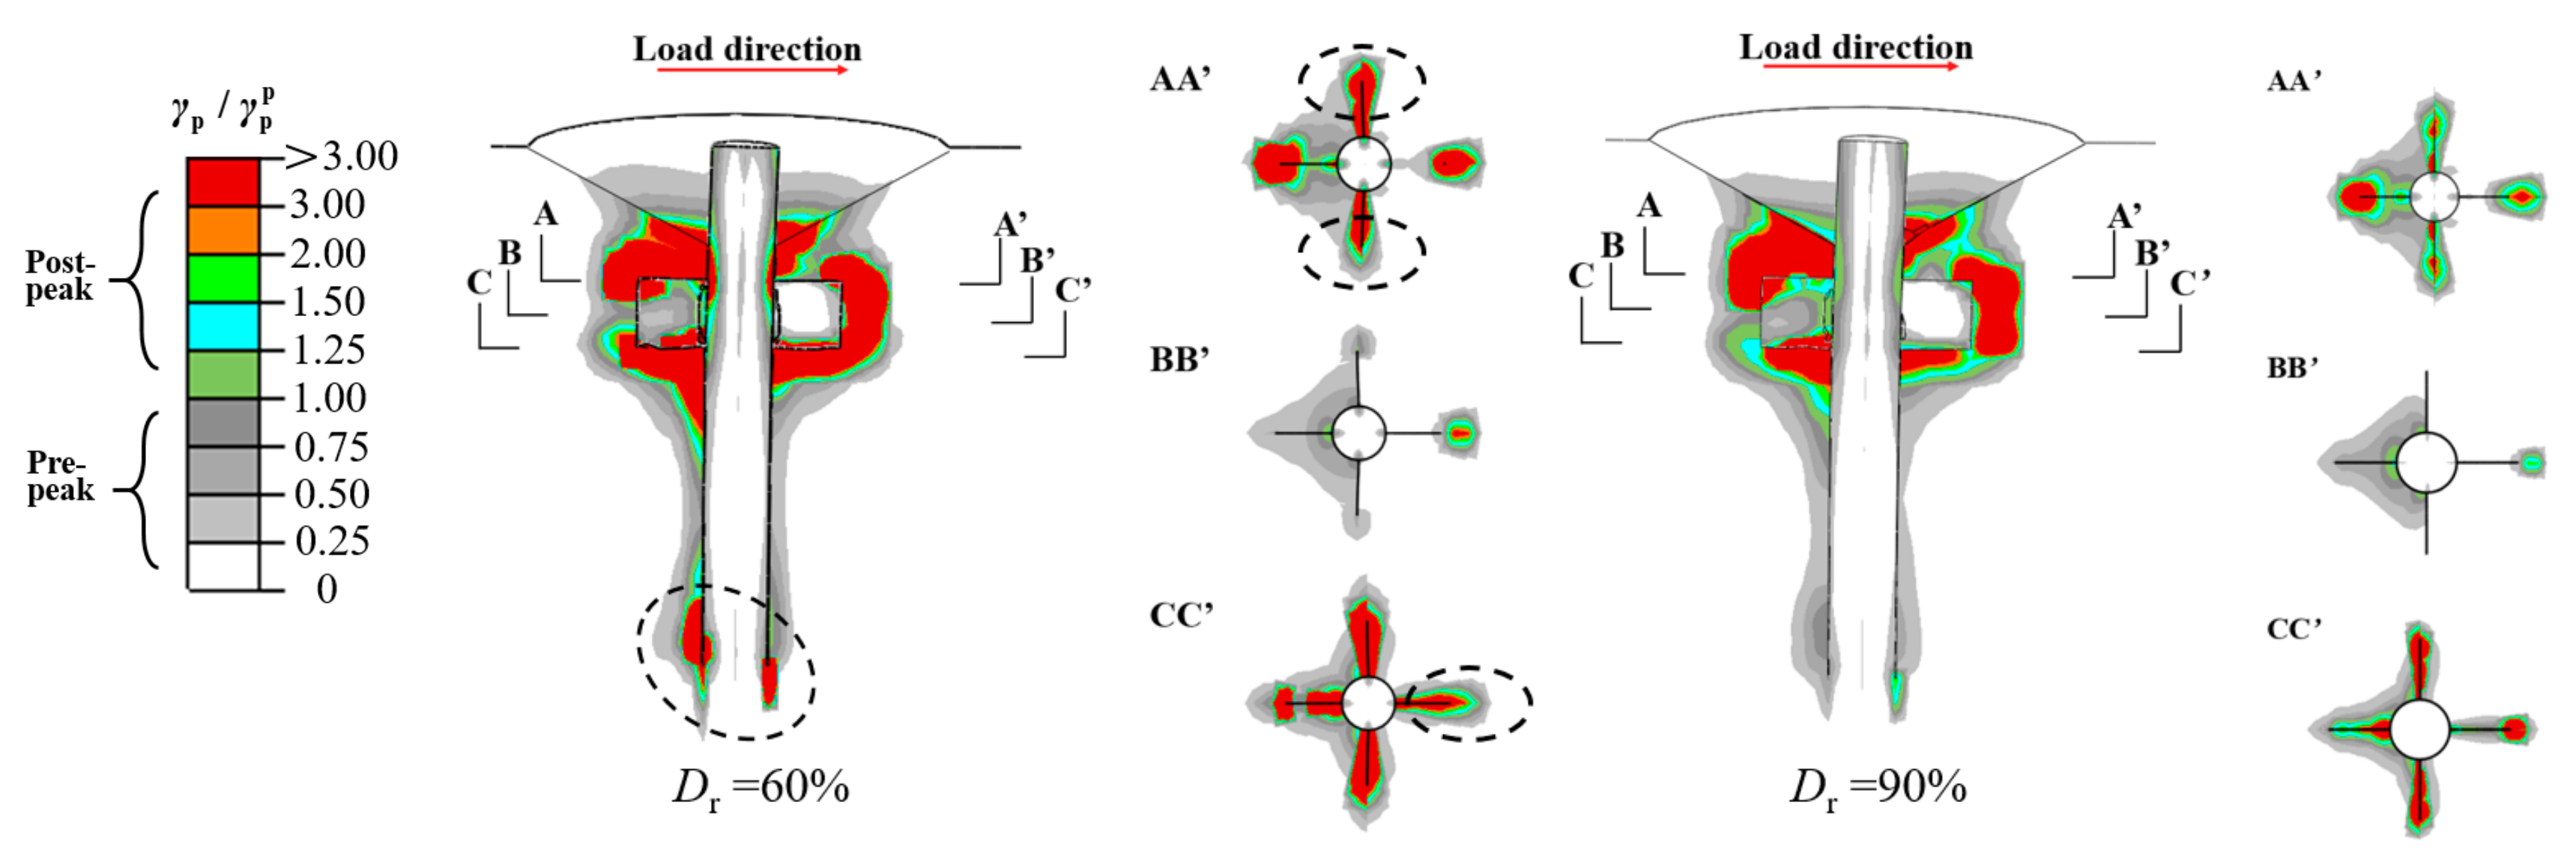
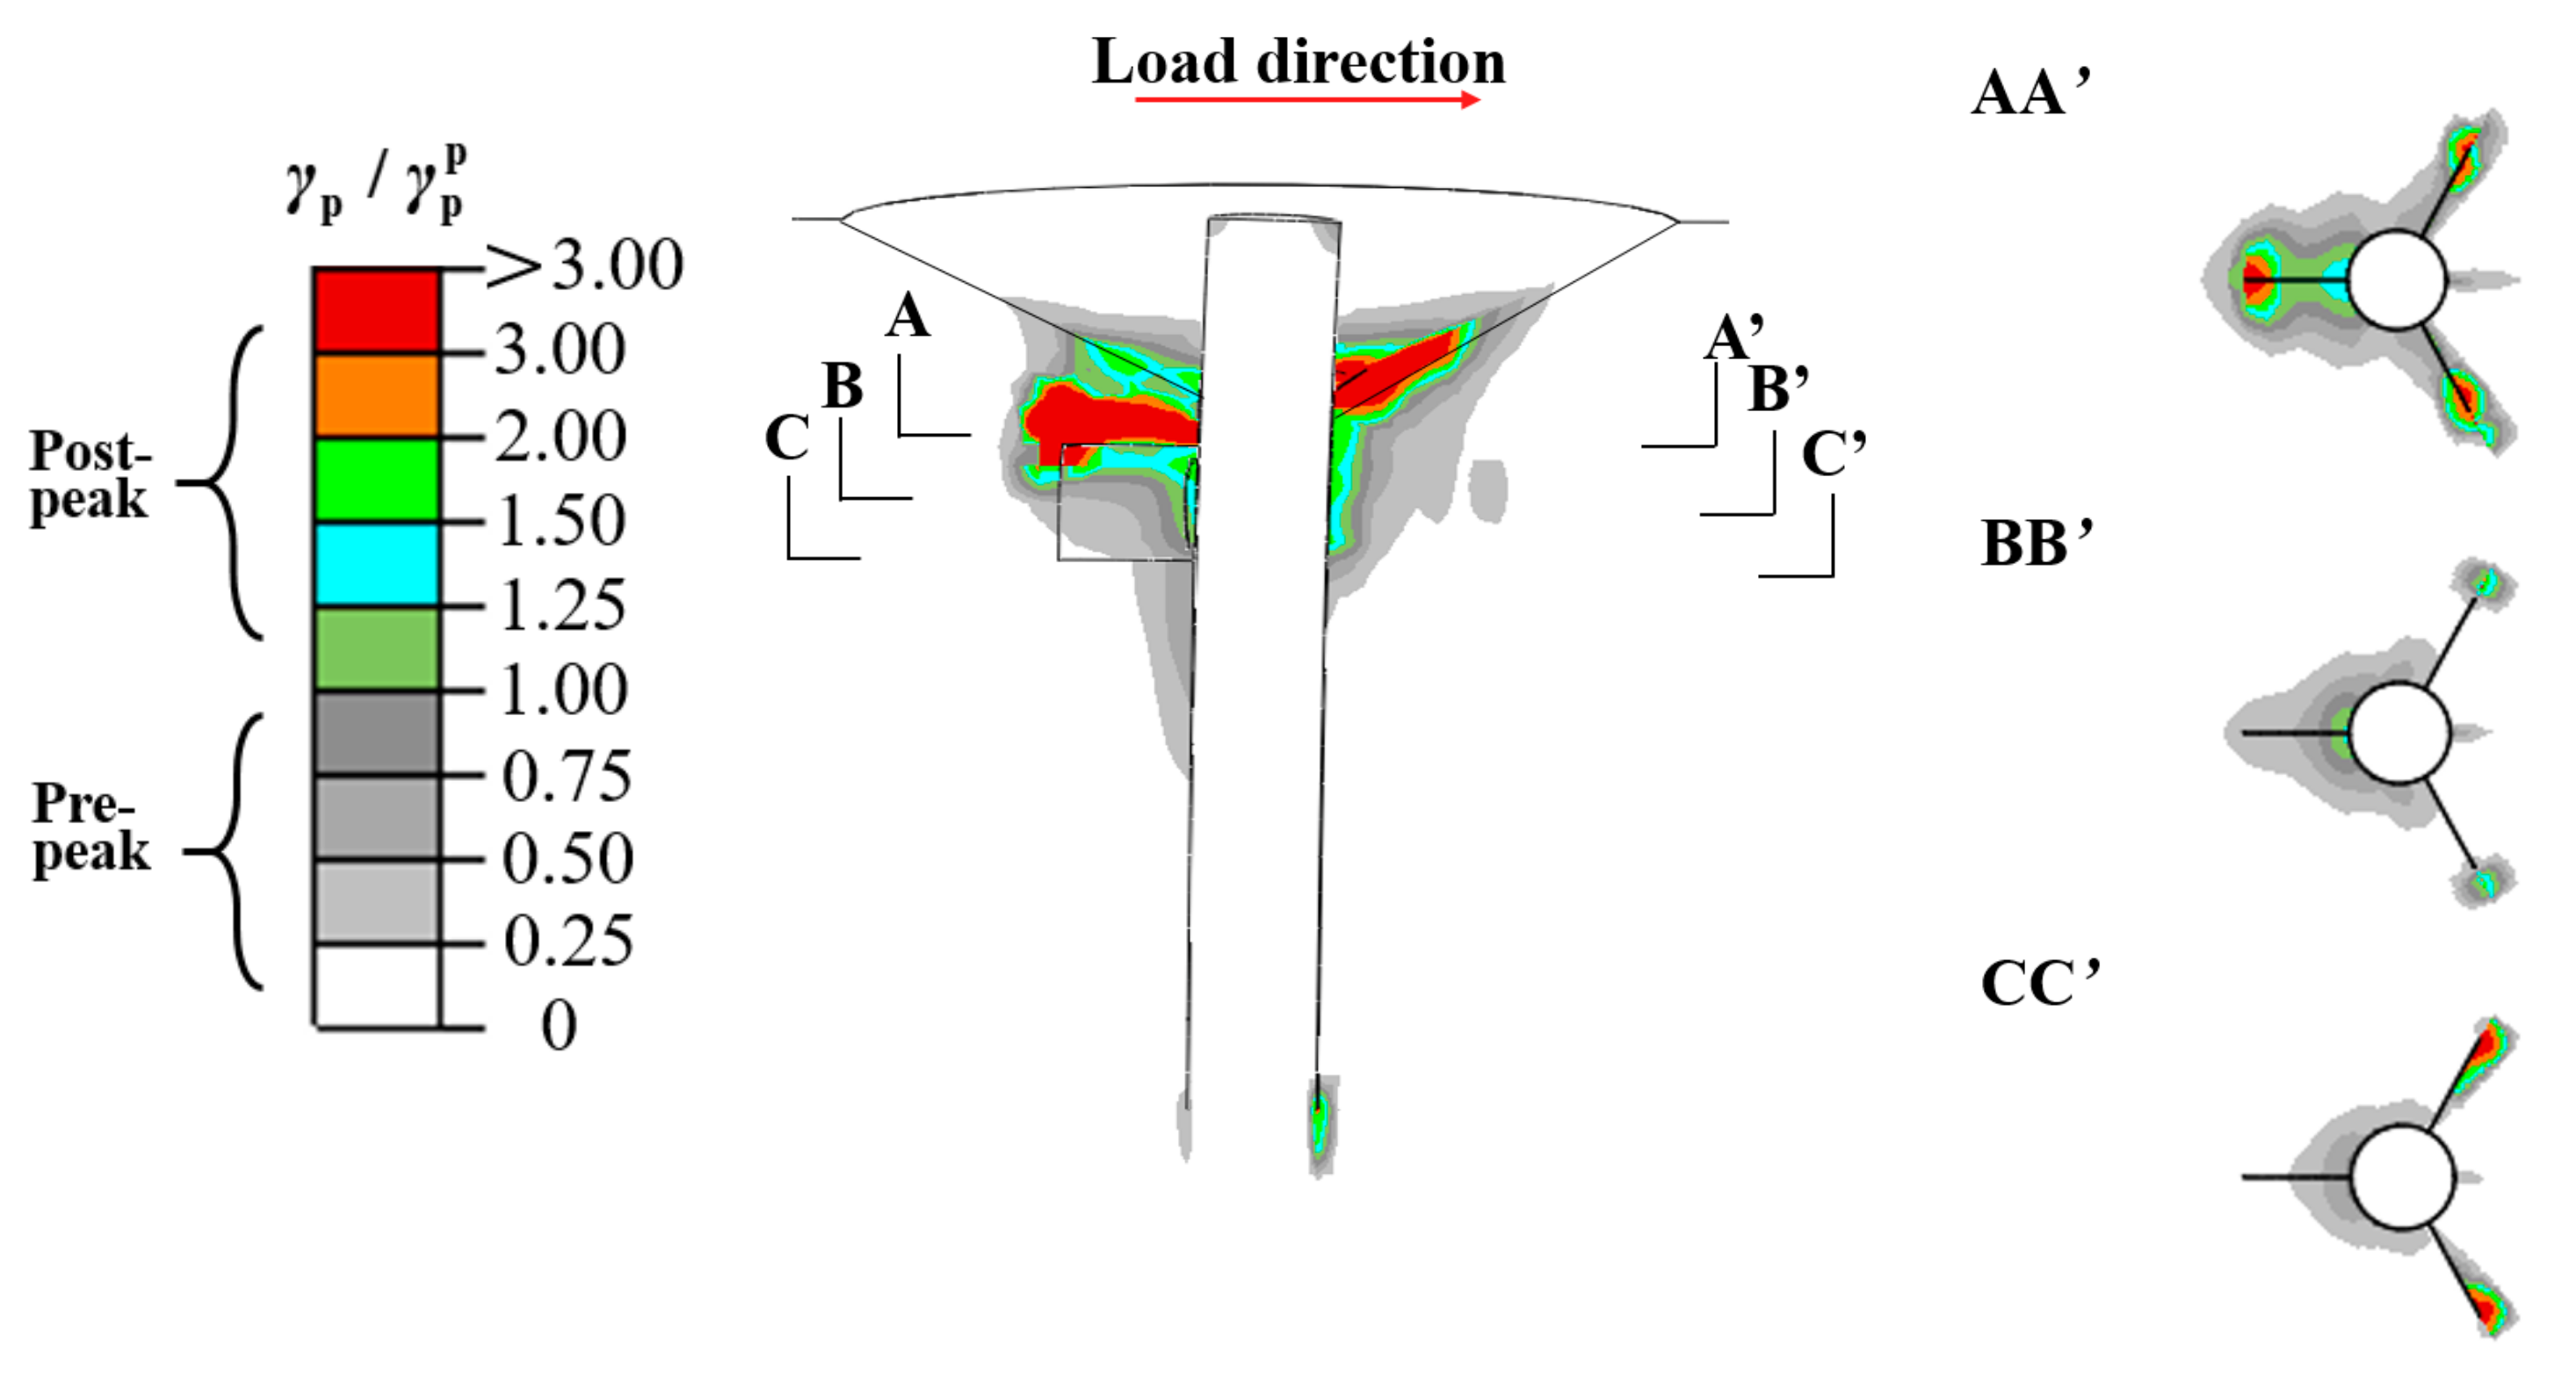
The increase in local scour depth reduces the lateral capacity of winged monopiles in the same wing load orientation. The capacity reduction can be as high as 20% at the serviceability limit state (SLS) and the ultimate limit state (ULS) for four-wing monopiles (WP4) with a scour depth of S/D = 1.9. More soil around the wings will reach the critical state caused by post-peak softening if a scour hole is developed around the pile, consequently undermining the lateral capacity;
(2)
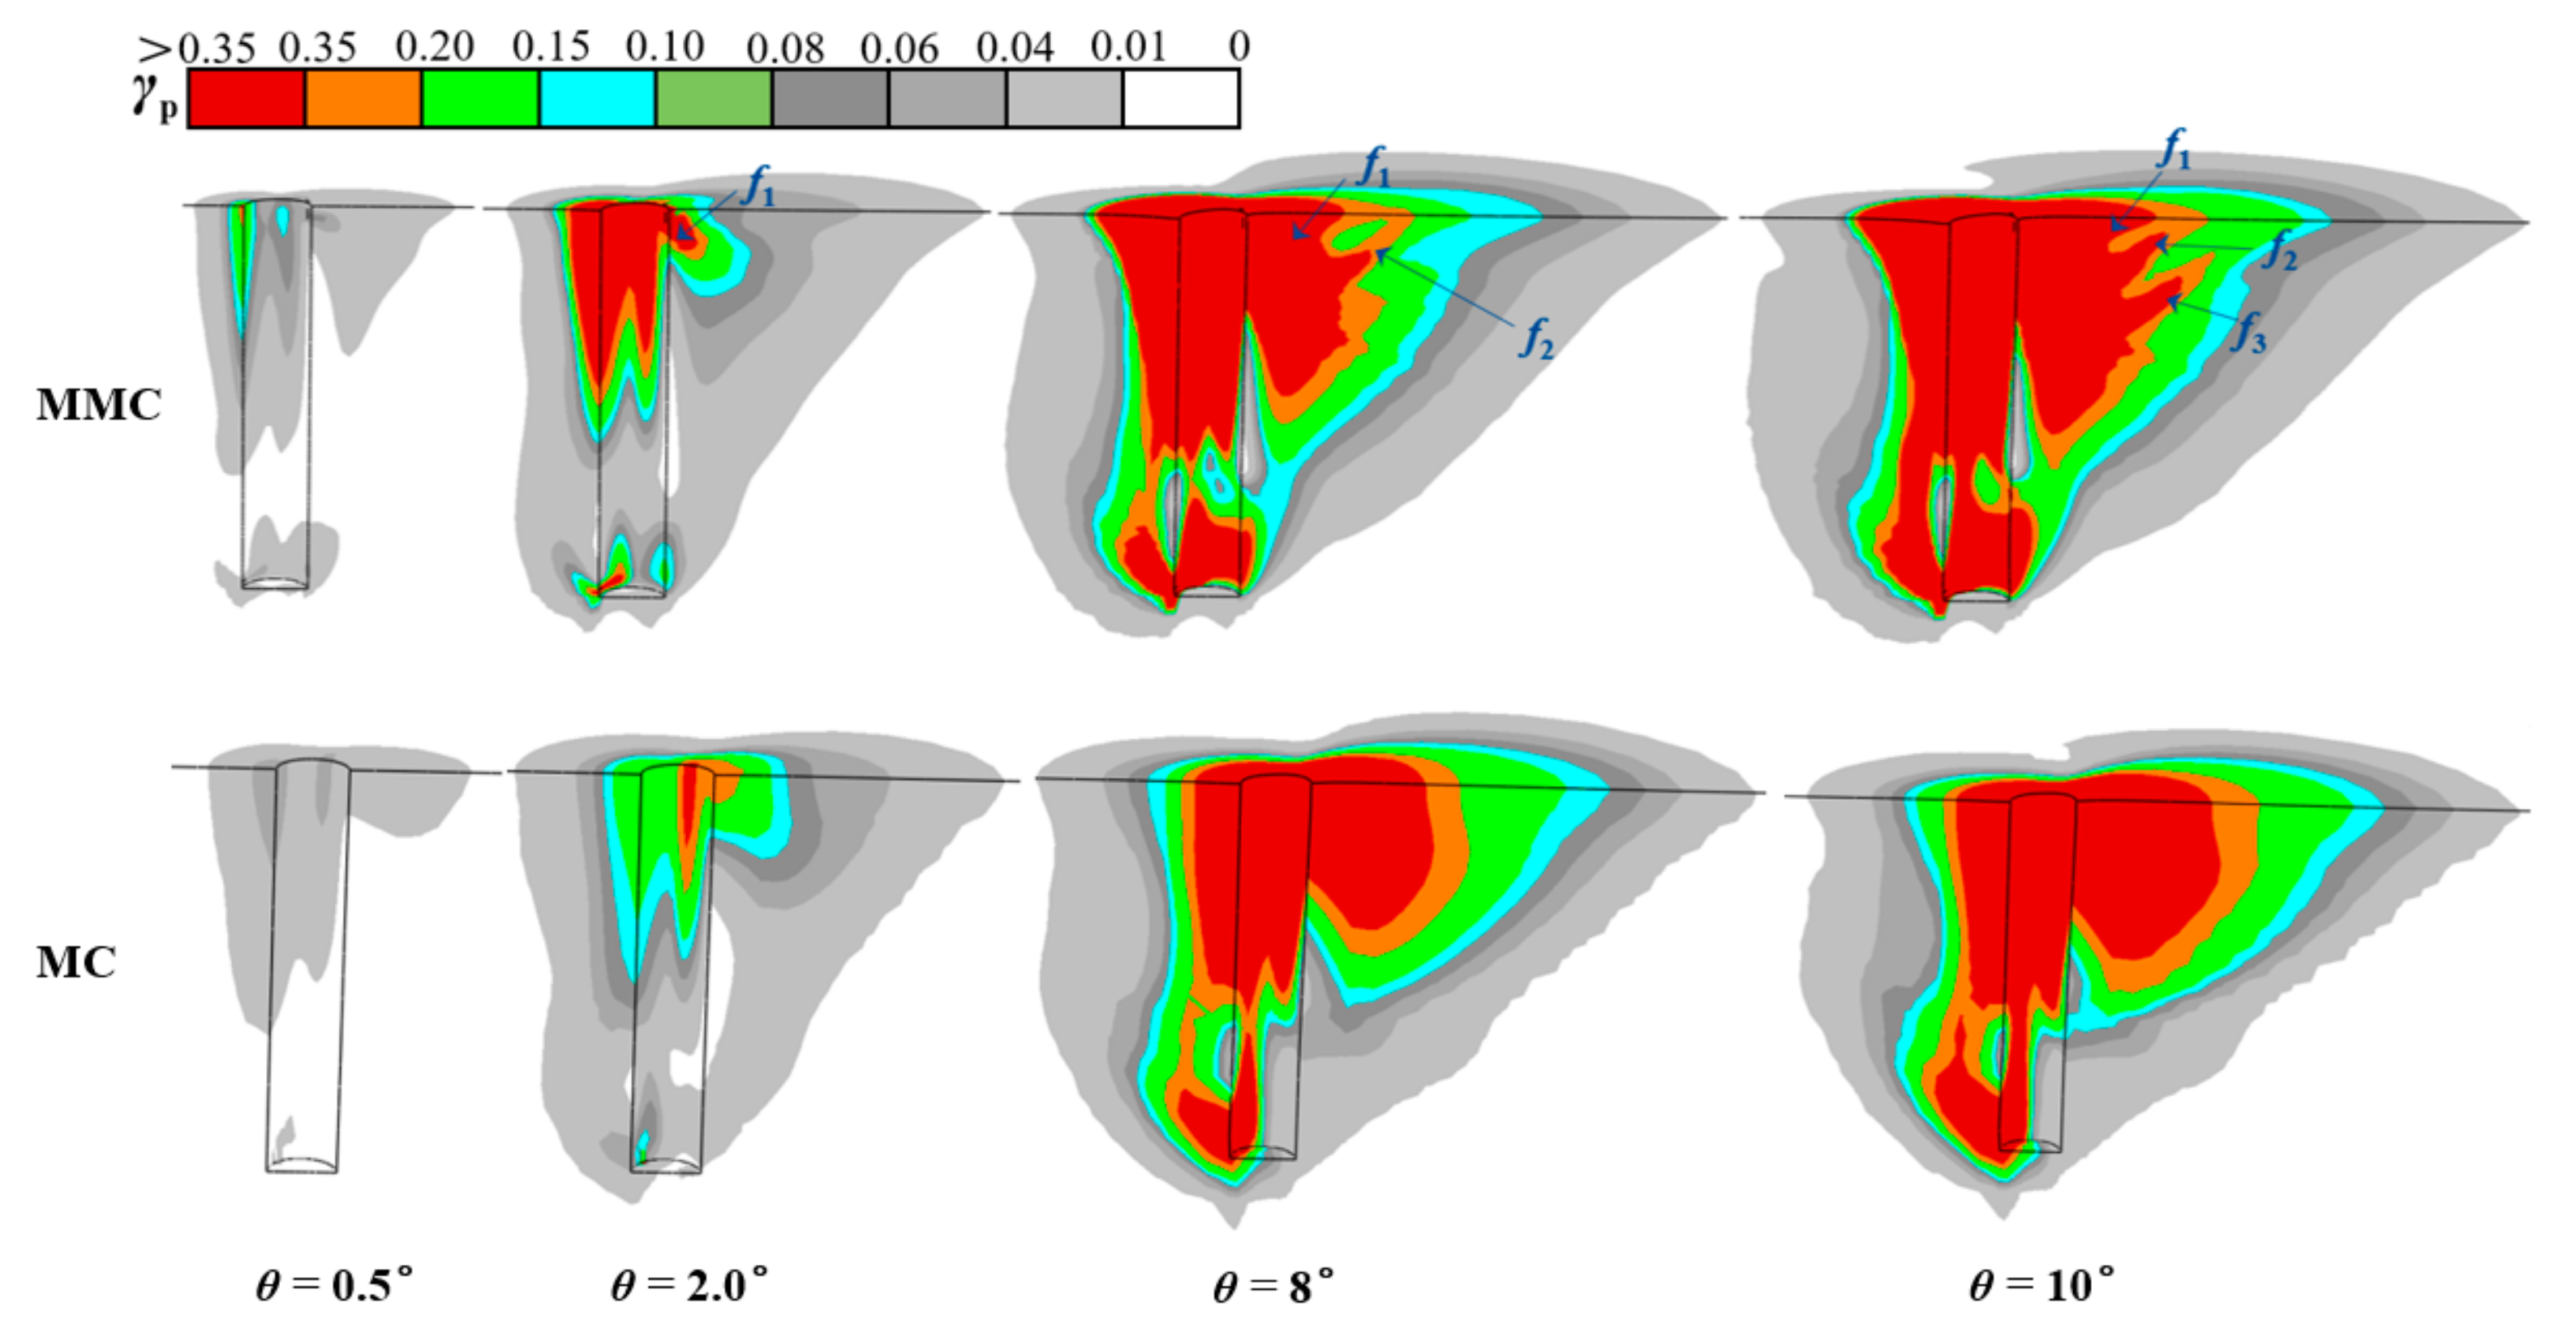
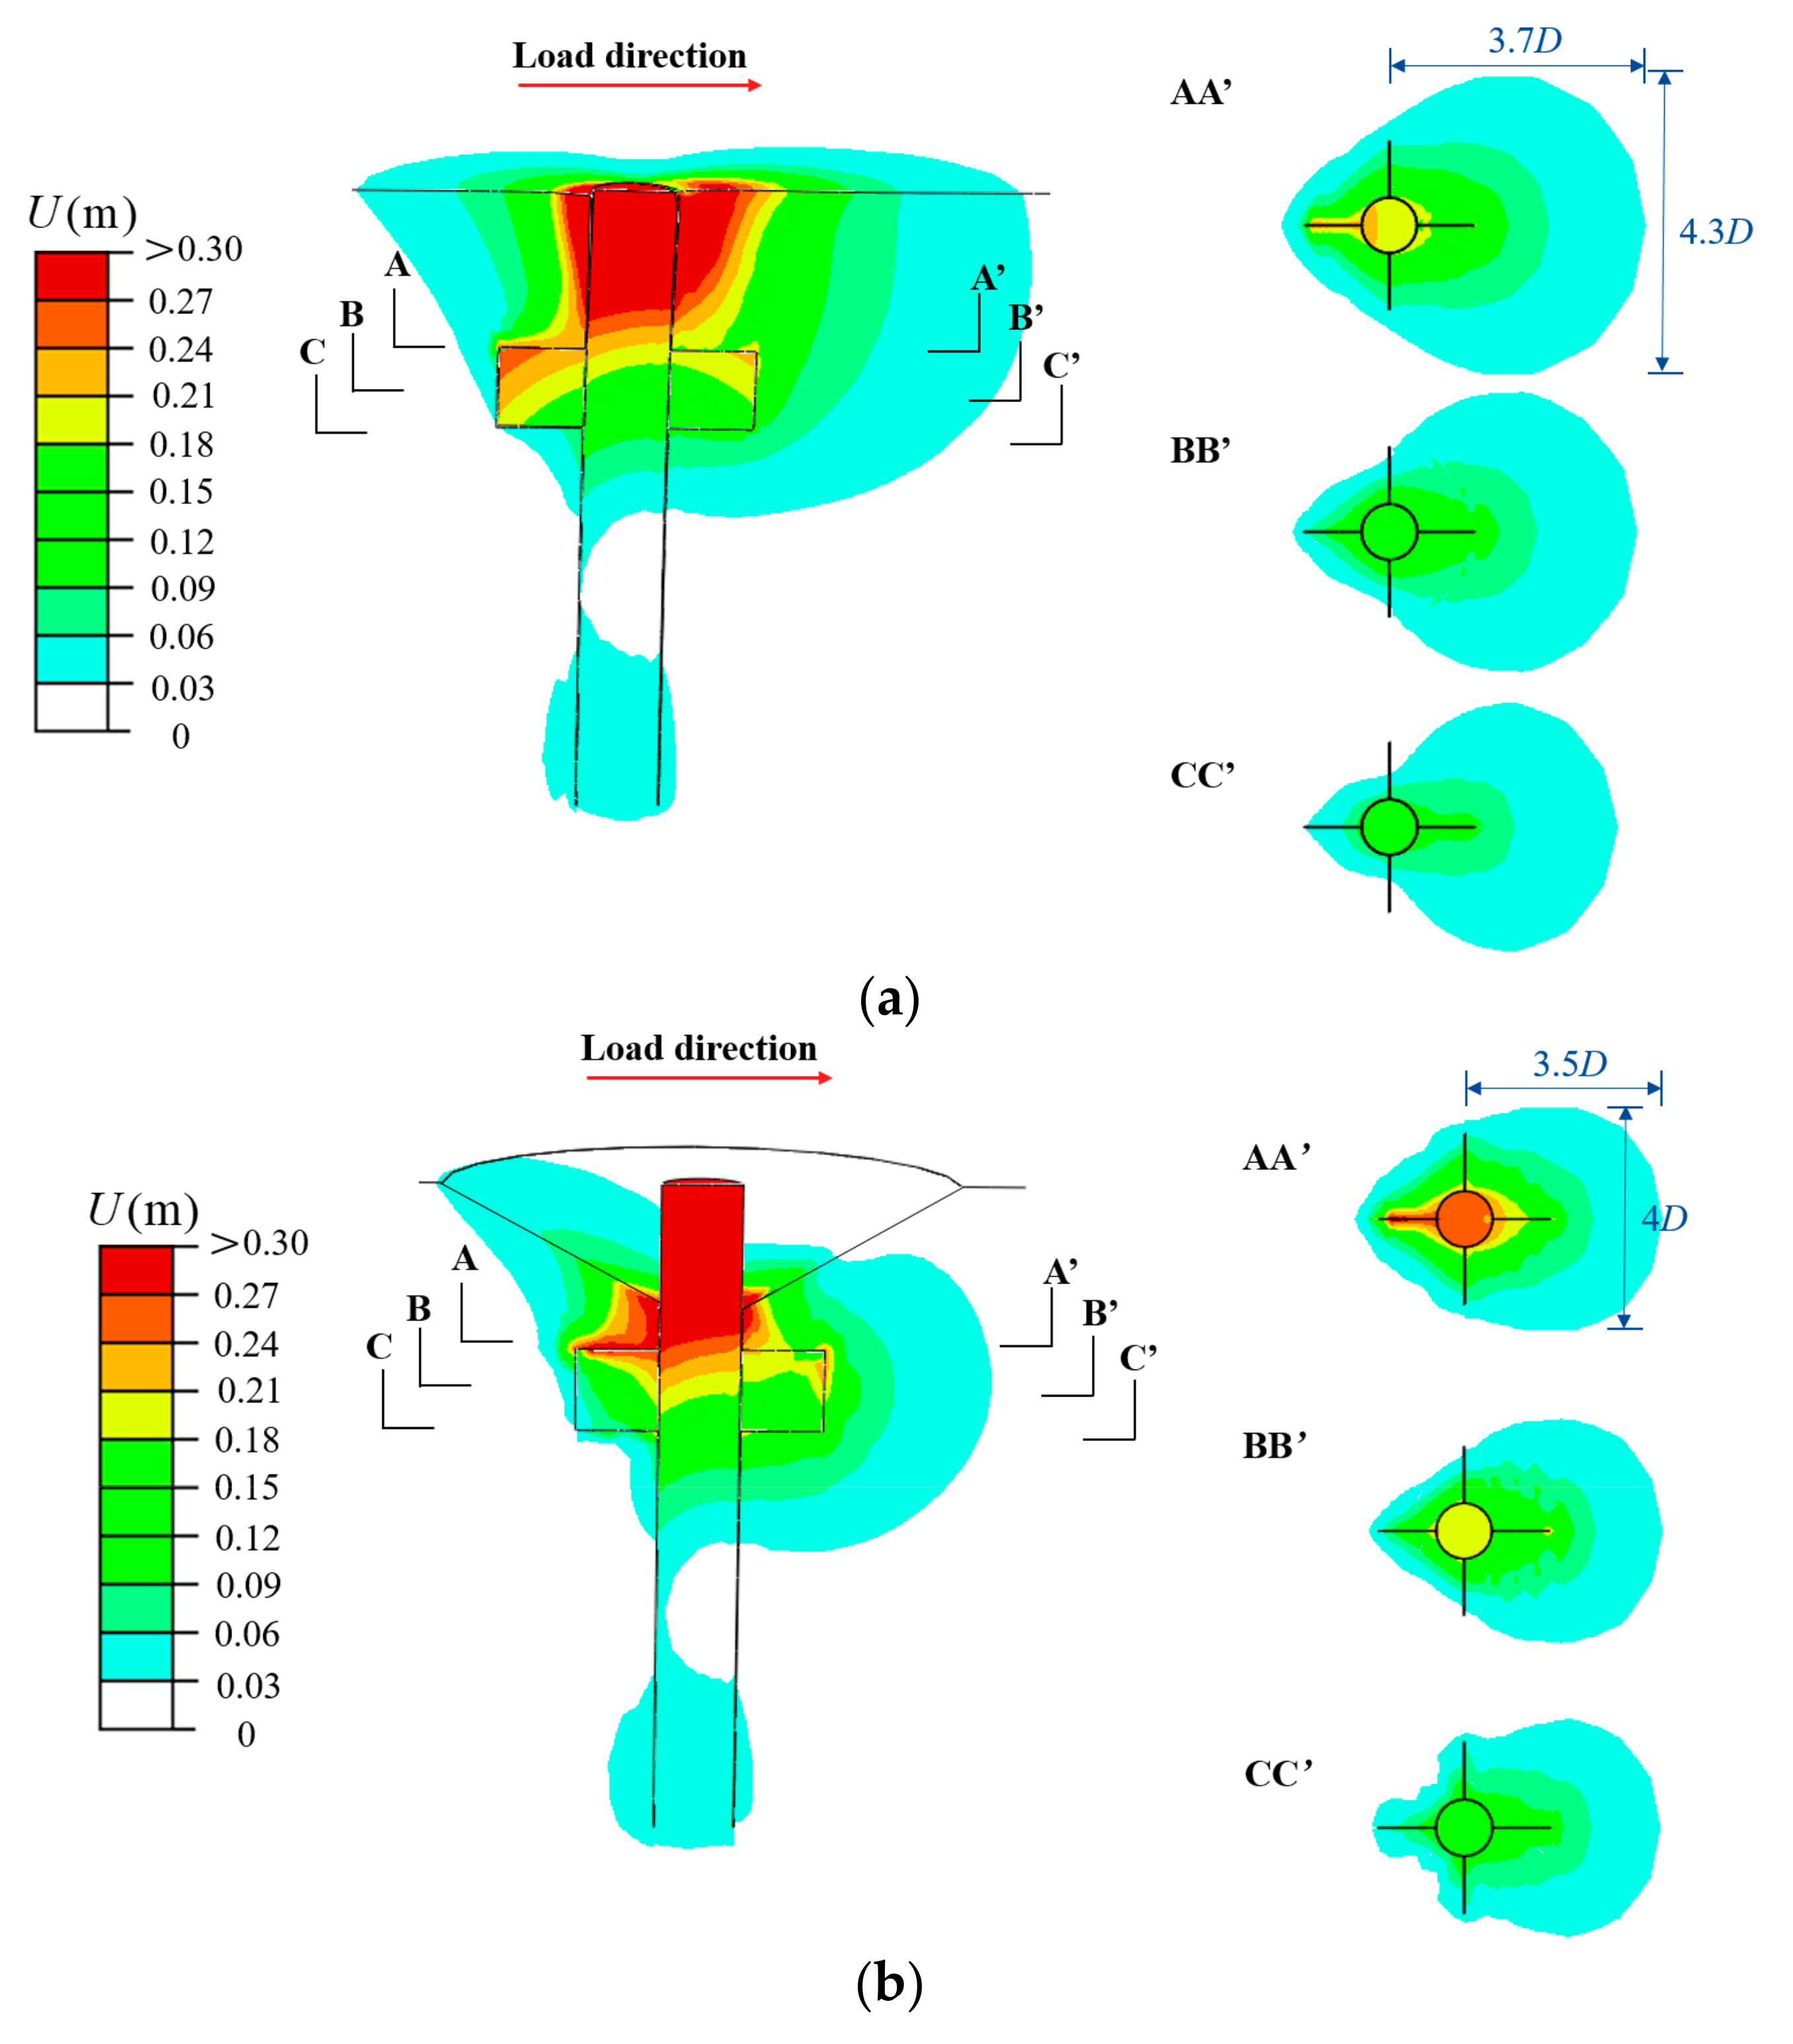
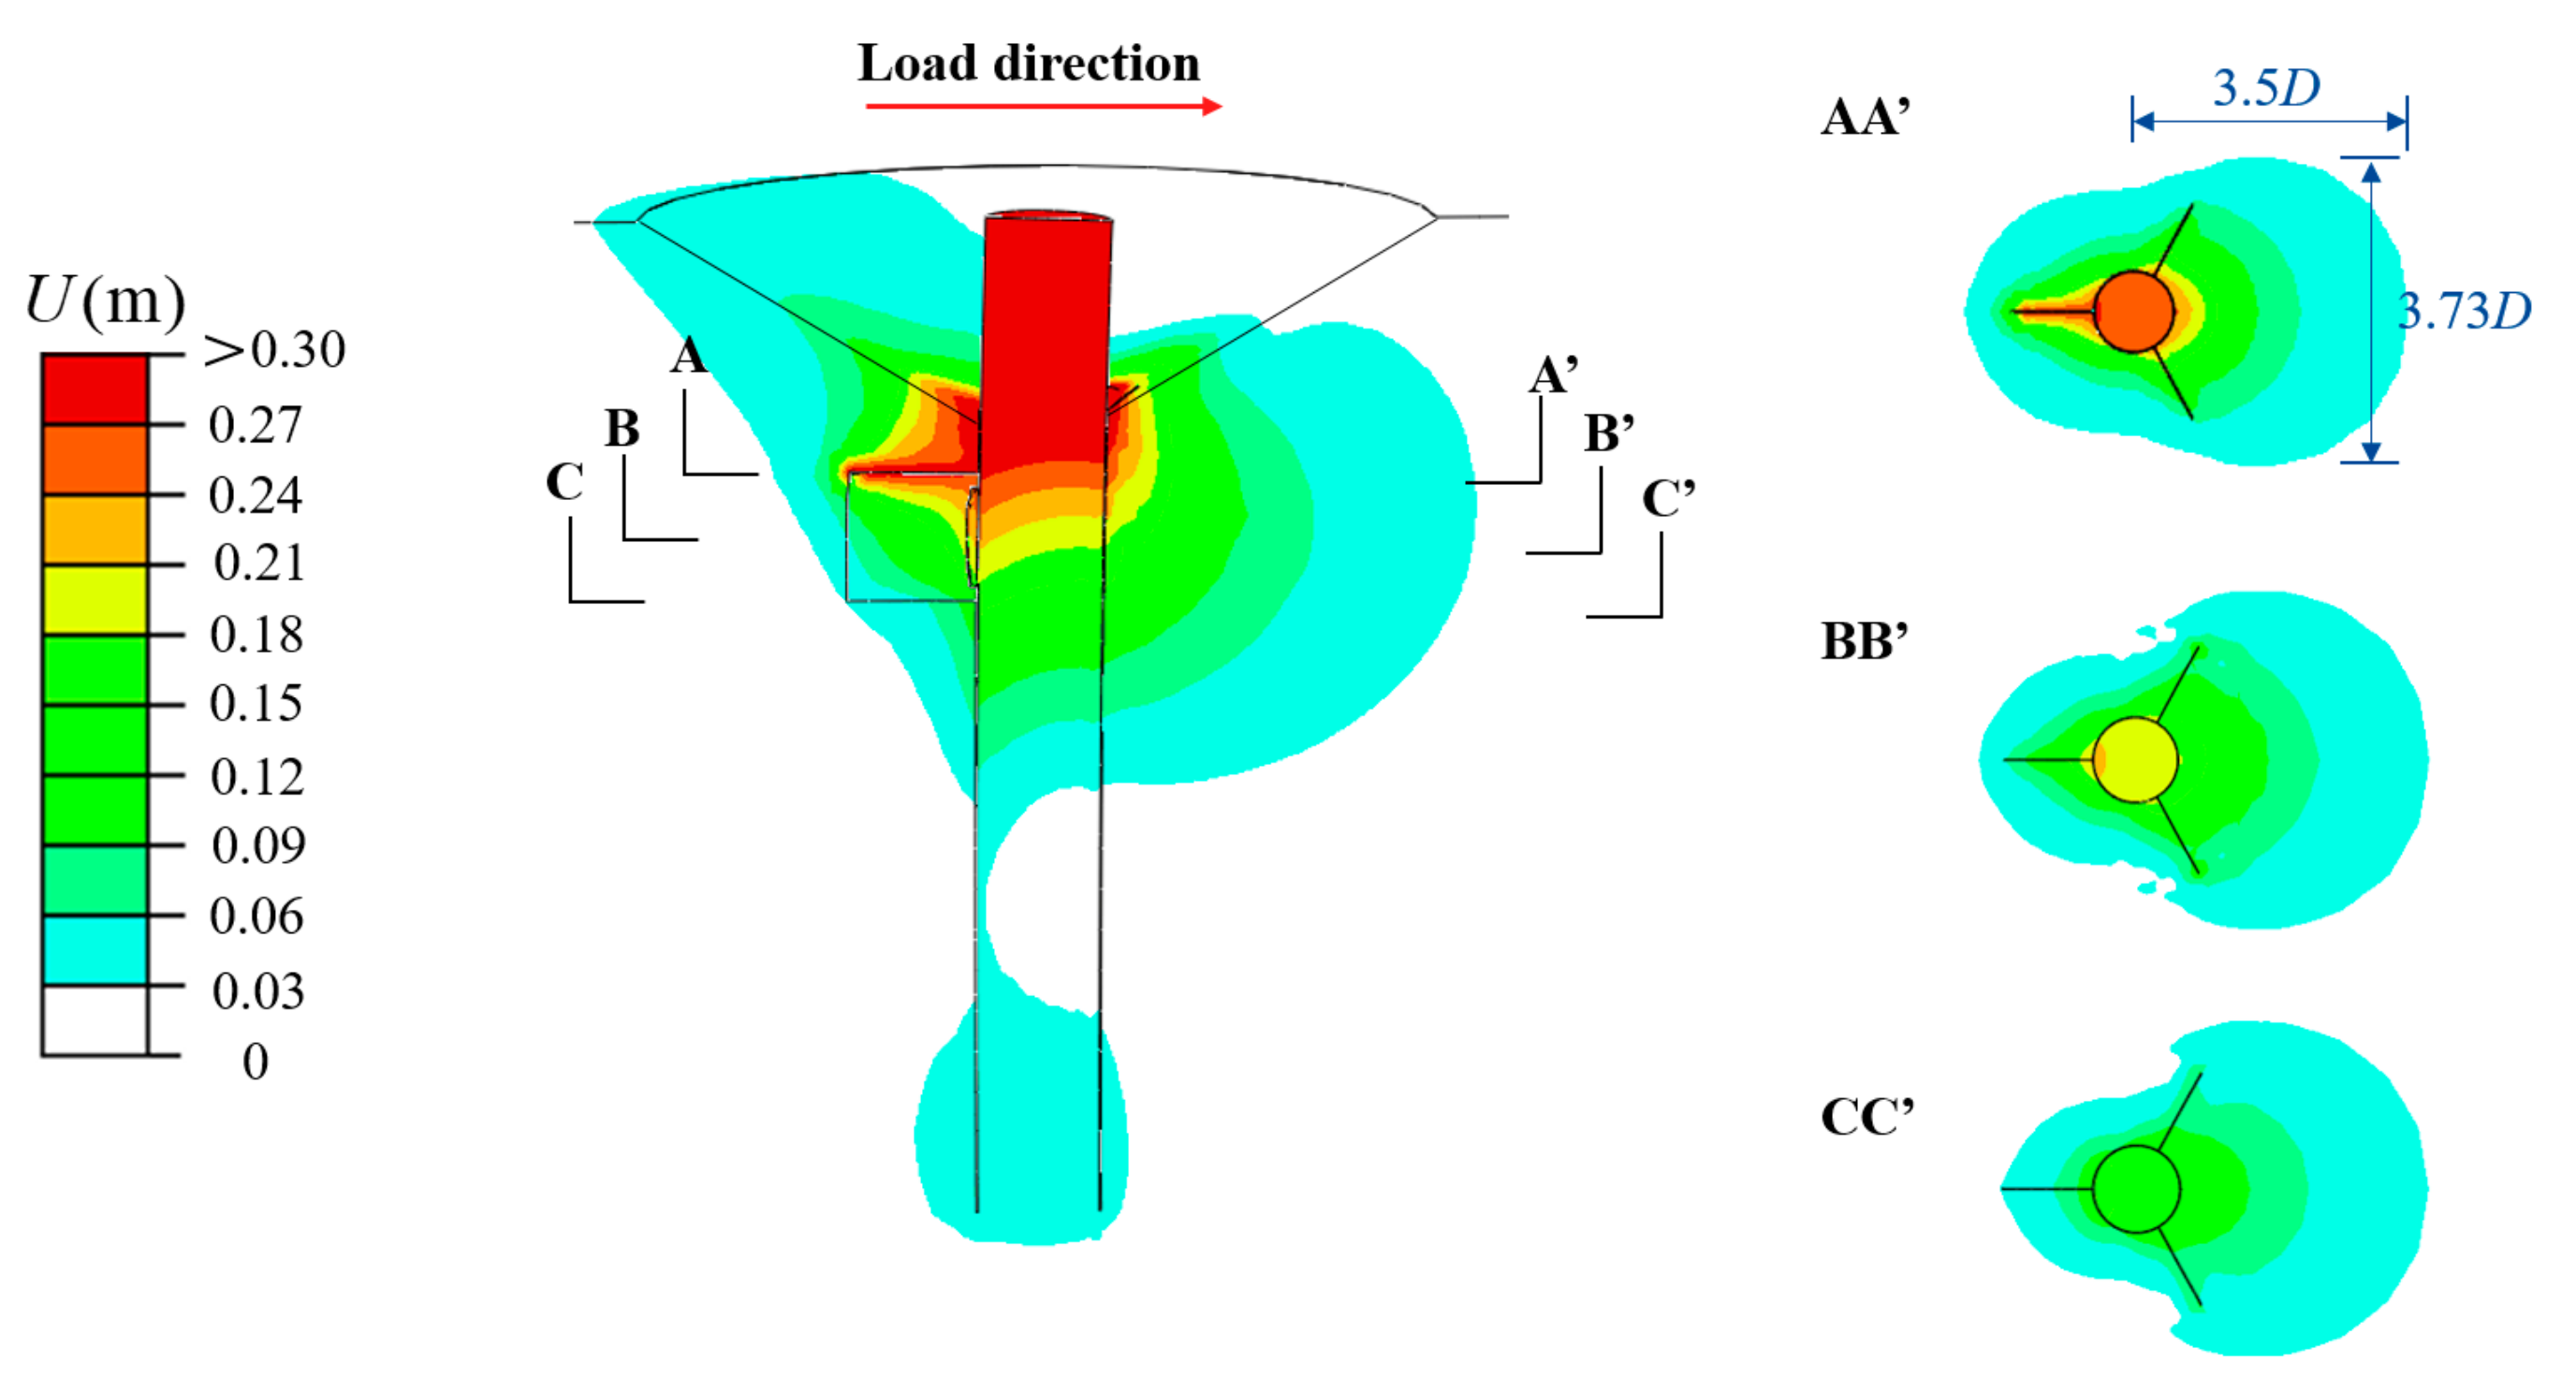
Extending the embedment length of the pile foundation contributes marginally to the lateral capacity, while introducing wings can significantly enhance the capacity. The lateral capacity of the winged monopile is increased by 9.1% compared to the regular monopile when the scour depth S/D = 1.5. Due to the presence of wings, the circumferential failure pattern around the pile shifts from a “gourd” to a “teardrop” shape;
(3)
Higher lateral capacity can be expected for winged monopiles in denser sand. The lateral capacity at SLS and ULS can be raised by 12.4% and 16.7%, respectively, with the relative density increasing from 60% to 90%;
(4)
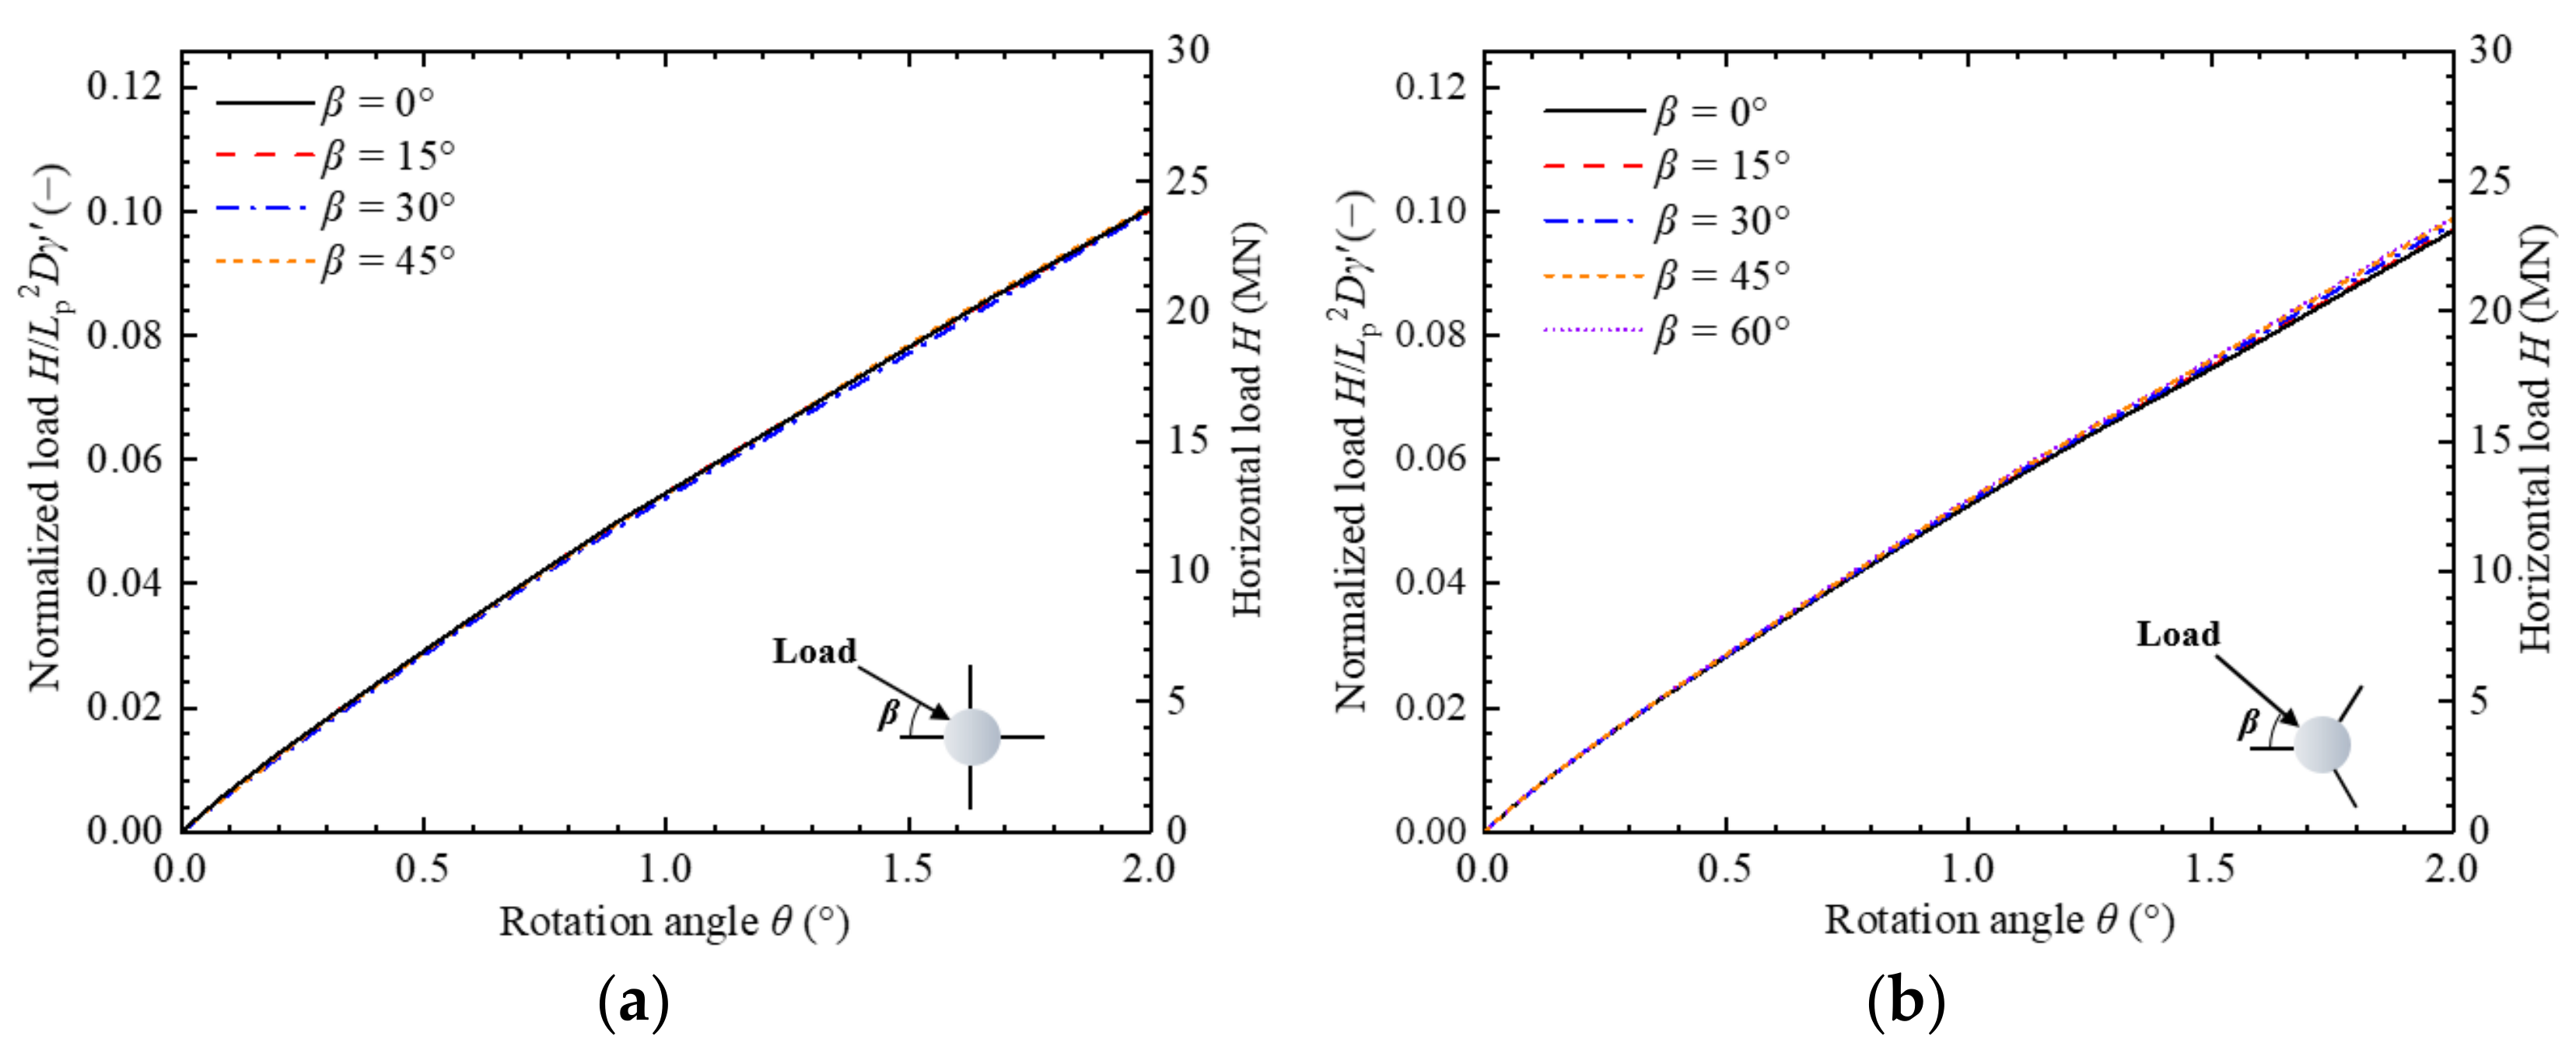
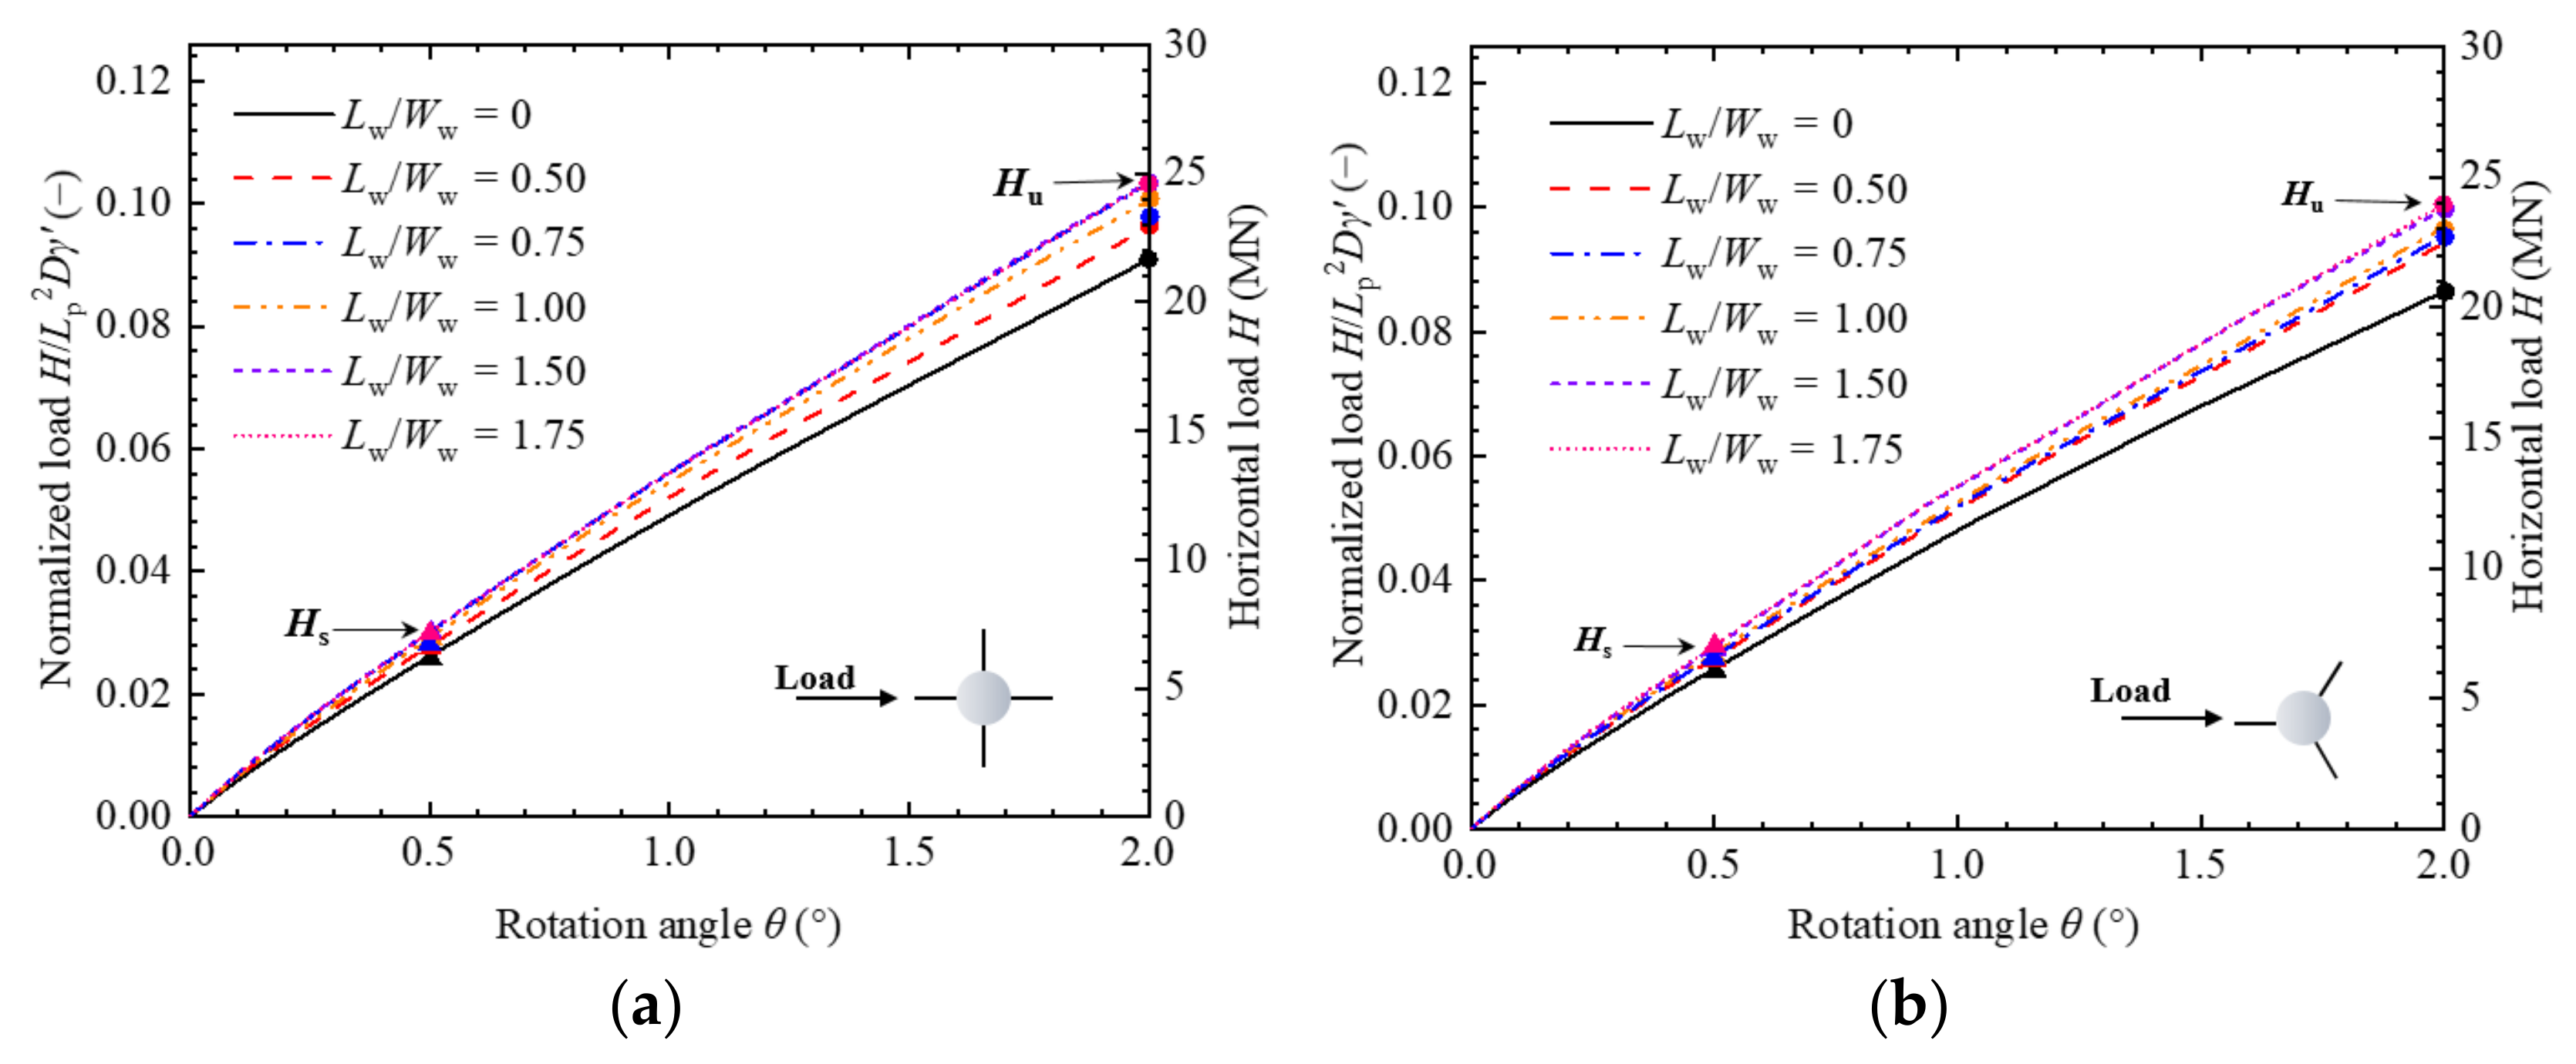
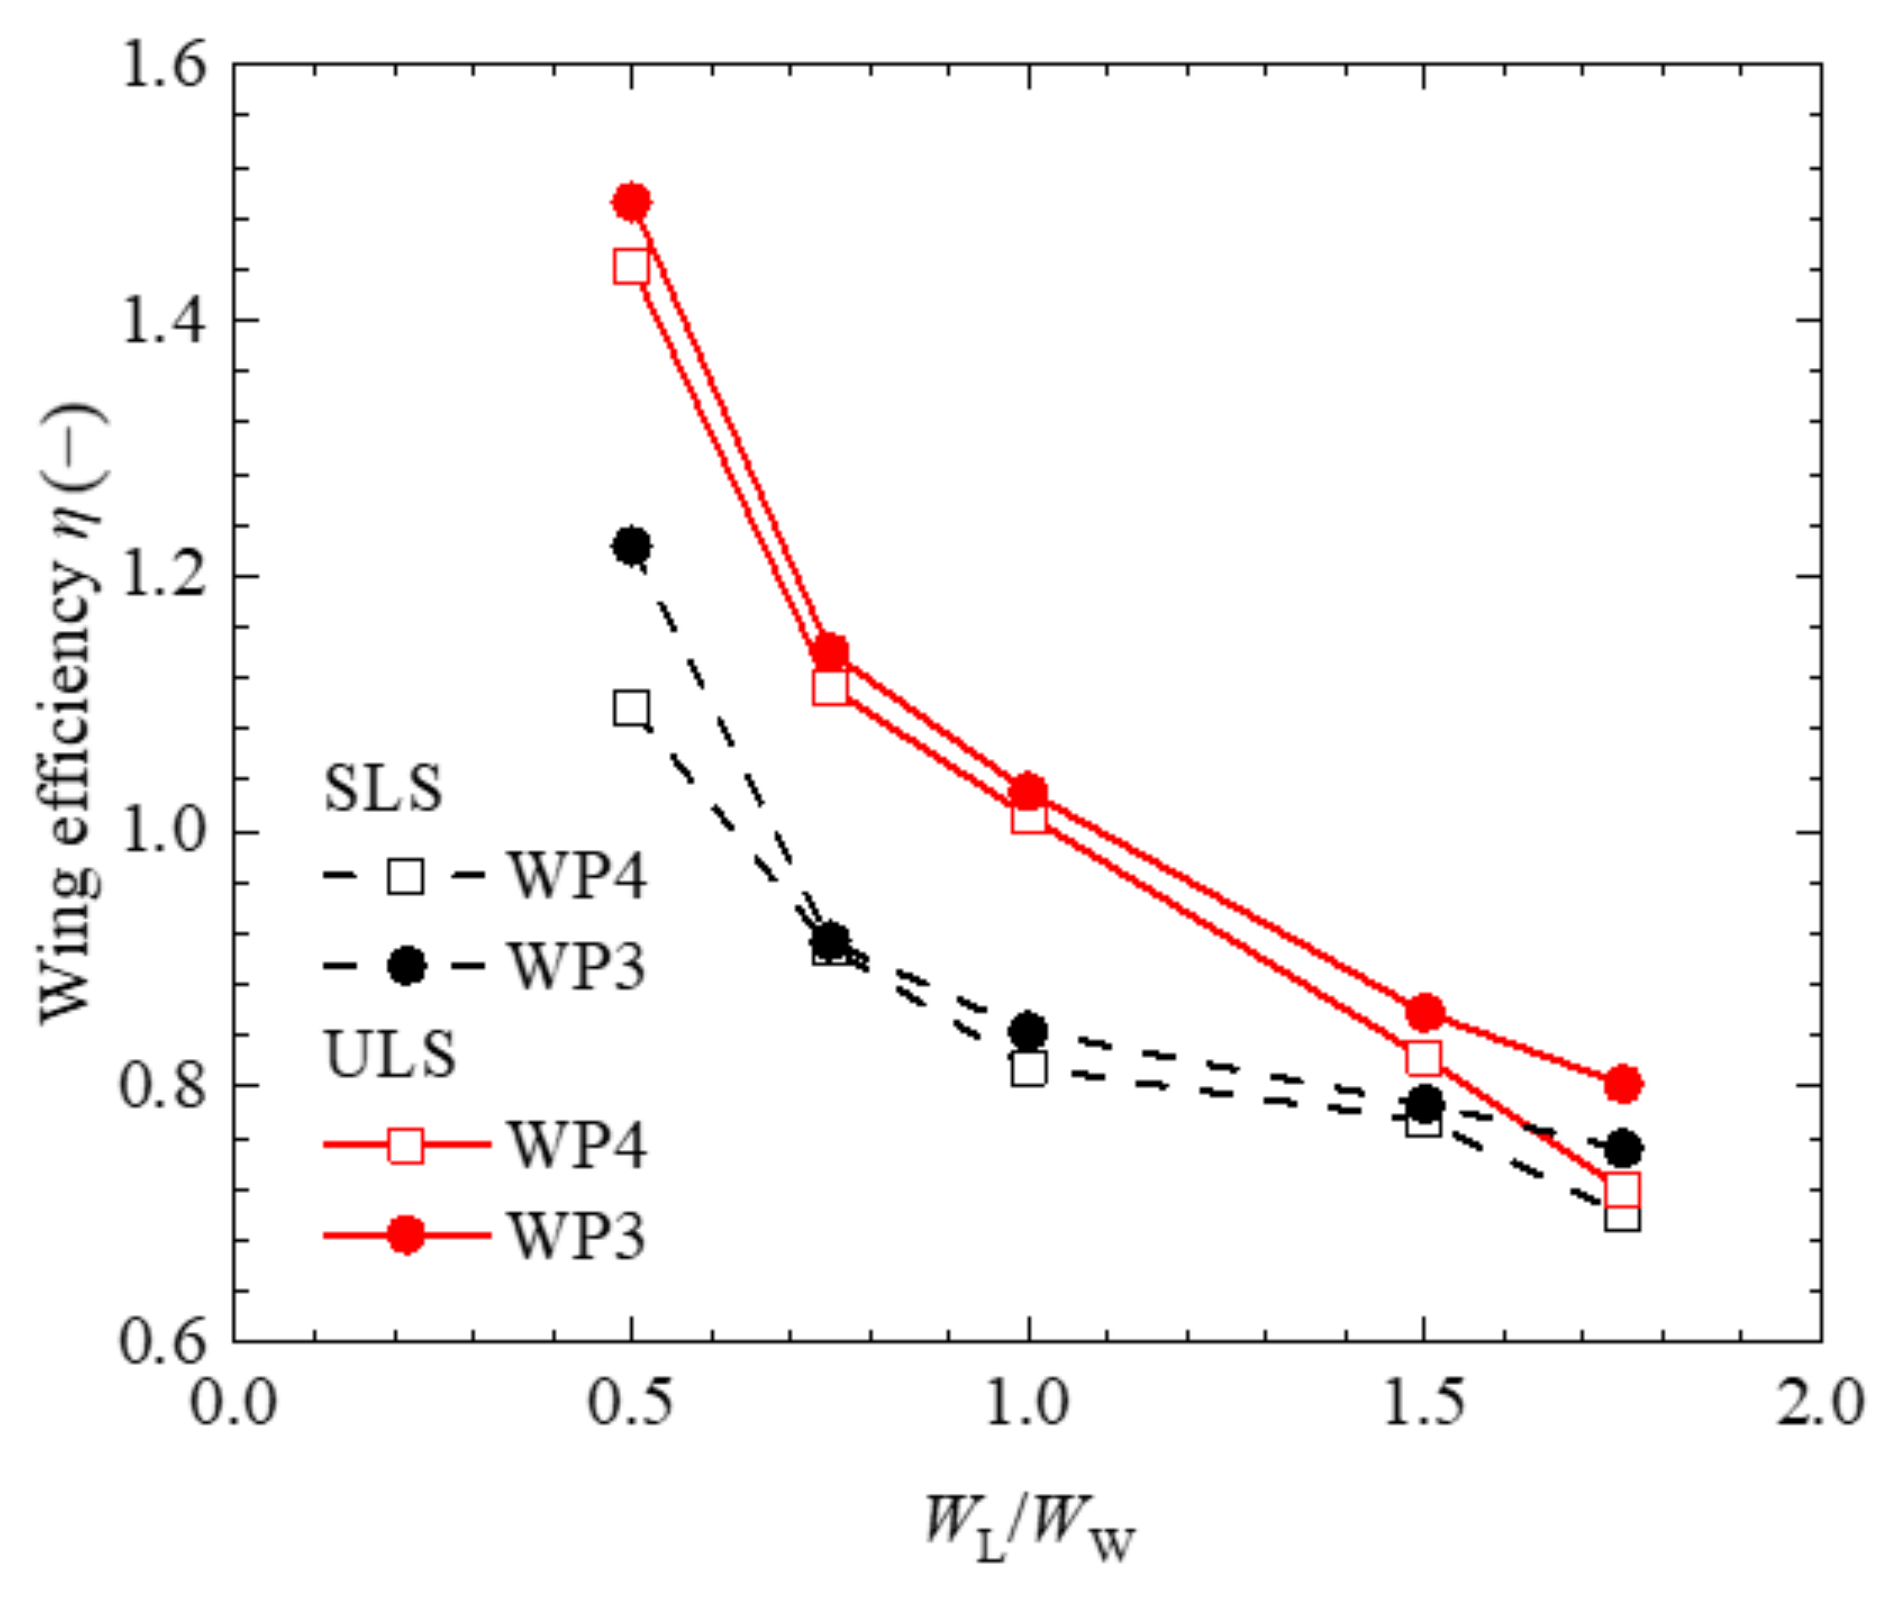
A wing efficiency number is proposed to determine the optimal design of wing configuration, accounting for both load and economic efficiency. The wing efficiency at SLS reaches its maximum value when the ratio of wing height and wing width reaches its minimum (LW/WW = 0.5) and only decreases slightly for the wing height LW/WW > 1. A wing efficiency larger than unity is recommended to maximize the effectiveness of wings for enhancing the lateral capacity of monopiles.
This paper mainly aims to reveal the combined effects of local scour and wing configuration on a winged monopile under horizontal loading. Future research is required to quantify the effect of wings on monopile capacity with various pile diameters and embedment depths, which is essential to taking full advantage of the wings in the design. The modified p–y curve accounting for the influence of wings could be a feasible approach to accomplish the optimal design.

Author Contributions

Conceptualization, W.Q.; numerical simulations and data analyses, B.L., W.Q. and Y.W.; writing—original draft, B.L.; writing—review and editing, W.Q., Y.W., S.W. and F.G.; supervision, W.Q., F.G. and Y.W.; funding acquisition, W.Q. and F.G. All authors have read and agreed to the published version of the manuscript.

Funding

This research was funded by the National Natural Science Foundation of China (11972036; 11825205) and the Youth Innovation Promotion Association CAS (Grant No. 2021018).

Institutional Review Board Statement

Not applicable.

Informed Consent Statement

Not applicable.

Data Availability Statement

The data presented in this study are available upon request from the corresponding author.

Conflicts of Interest

The authors declare no conflict of interest.

References

  1. GWEC. Global Wind Report 2021; GWEC: Brussels, Belgium, 2022. [Google Scholar]
  2. BNEF. Offshore Wind Market Outlook; BNEF: Paris, France, 2020. [Google Scholar]
  3. Oh, K.Y.; Nam, W.; Ryu, M.S.; Kim, J.Y.; Epureanu, B.I. A review of foundations of offshore wind energy convertors: Current status and future perspectives. Renew. Sustain. Energy Rev. 2018, 88, 16–36. [Google Scholar] [CrossRef]
  4. Gupta, B.K.; Basu, D. Offshore wind turbine monopile foundations: Design perspectives. Ocean Eng. 2020, 213, 107514. [Google Scholar] [CrossRef]
  5. Bhattacharya, S. Design of Foundations for Offshore Wind Turbines; John Wiley & Sons: Hoboken, NJ, USA, 2019. [Google Scholar]
  6. Qi, W.G.; Gao, F.P. Local scour around a monopile foundation for offshore wind turbines and scour effects on structural responses. In Geotechnical Engineering-Advances in Soil Mechanics and Foundation Engineering; IntechOpen: London, UK, 2019. [Google Scholar]
  7. Bienen, B.; Dührkop, J.; Grabe, J.; Randolph, M.F.; White, D.J. Response of piles with wings to monotonic and cyclic lateral loading in sand. J. Geotech. Geoenviron. Eng. 2012, 138, 364–375. [Google Scholar] [CrossRef]
  8. Murphy, G.; Cadogan, D.; Doherty, P.; Gavin, K.; Caprani, C.; O’Connor, A. Experimental investigation of novel foundation solutions for offshore wind turbines. Proc. BCRI 2012, 169, 227–239. [Google Scholar]
  9. Murphy, G.; Doherty, P.; Cadogan, D.; Gavin, K. Field experiments on instrumented winged monopiles. Proc. Inst. Civ. Eng. Geotech. Eng. 2016, 169, 227–239. [Google Scholar] [CrossRef]
  10. Babu, K.; Viswanadham, B. Numerical investigations on lateral load response of fin piles. In International Congress and Exhibition Sustainable Civil Infrastructures: Innovative Infrastructure Geotechnology; Springer: Berlin/Heidelberg, Germany, 2017; pp. 317–329. [Google Scholar]
  11. Abongo, K.O. Model Study of the Static and Cyclic Lateral Capacity of Finned Piles; Lehigh University: Bethlehem, PA, USA, 2019. [Google Scholar]
  12. Dührkop, J.; Grabe, J. Laterally loaded piles with bulge. J. Offshore Mech. Arct. Eng. 2008, 130, 041602. [Google Scholar] [CrossRef]
  13. Nasr, A.M.A. Experimental and theoretical studies of laterally loaded finned piles in sand. Can. Geotech. J. 2014, 51, 381–393. [Google Scholar] [CrossRef]
  14. Pei, T.; Qiu, T. A Numerical investigation of laterally loaded steel fin pile foundation in sand. Int. J. Geomech. 2022, 22, 04022102. [Google Scholar] [CrossRef]
  15. Peng, J.R. Behaviour of Finned Piles in Sand under Lateral Loading; Newcastle University: Newcastle upon Tyne, UK, 2006. [Google Scholar]
  16. Peng, J.R.; Rouainia, M.; Clarke, B.G. Finite element analysis of laterally loaded fin piles. Comput. Struct. 2010, 88, 1239–1247. [Google Scholar] [CrossRef]
  17. Qi, W.G.; Gao, F.P. Equilibrium scour depth at offshore monopile foundation in combined waves and current. Sci. China-Technol. Sci. 2014, 57, 1030–1039. [Google Scholar] [CrossRef] [Green Version]
  18. Qi, W.G.; Gao, F.P. Physical modeling of local scour development around a large-diameter monopile in combined waves and current. Coast. Eng. 2014, 83, 72–81. [Google Scholar] [CrossRef]
  19. Sumer, B.; Fredsøe, J.; Christiansen, N. Scour around vertical pile in waves. J. Waterw. Port Coast. Ocean Eng. 1992, 118, 15–31. [Google Scholar] [CrossRef]
  20. Sumer, B.M.; Christiansen, N.; Fredsøe, J. The horseshoe vortex and vortex shedding around a vertical wall-mounted cylinder exposed to waves. J. Fluid Mech. 1997, 332, 41–70. [Google Scholar] [CrossRef]
  21. Qi, W.G.; Gao, F.P.; Randolph, M.F.; Lehane, B.M. Scour effects on p–y curves for shallowly embedded piles in sand. Géotechnique 2016, 66, 648–660. [Google Scholar] [CrossRef] [Green Version]
  22. Li, C.; Xiao, Y.; Liu, J.; Lin, Q.; Zhang, T.; Liu, J. The impact of scour on laterally loaded piles bored and socketed in marine clay. J. Mar. Sci. Eng. 2022, 10, 1636. [Google Scholar] [CrossRef]
  23. Qi, W.G.; Liu, J.; Gao, F.P.; Li, B.; Chen, Q.G. Quantifying the spatiotemporal evolution of the turbulent horseshoe vortex in front of a vertical cylinder. Phys. Fluids 2022, 34, 015110. [Google Scholar] [CrossRef]
  24. Li, B.; Wang, S.-Y.; Qi, W.-G.; Wang, Y.; Gao, F.-P. Lateral bearing capacity of a winged monopile in the scoured Sand-Bed. In Proceedings of the 32nd International Ocean and Polar Engineering Conference, Shanghai, China, 6–10 June 2022. [Google Scholar]
  25. Hibbitt, D.; Karlsson, B.; Sorensen, P. Abaqus: Analysis User’s Manual, Version 6.11; Simulia DCS: Pawducket, RI, USA, 2011. [Google Scholar]
  26. Whitehouse, R.J.S.; Harris, J.M.; Sutherland, J.; Rees, J. The nature of scour development and scour protection at offshore windfarm foundations. Mar. Pollut. Bull. 2011, 62, 73–88. [Google Scholar] [CrossRef] [Green Version]
  27. Ahmed, S.S.; Hawlader, B. Numerical analysis of large-diameter monopiles in dense sand supporting offshore wind turbines. Int. J. Geomech. 2016, 16, 04016018. [Google Scholar] [CrossRef] [Green Version]
  28. Qi, W.; Tian, J.; Zheng, H.; Wang, H.; Yang, J.; He, G.; Gao, F. Bearing capacity of the high-rise pile cap foundation for offshore wind turbines. Sustain. Dev. Crit. Infrastruct. 2014, 413–420. [Google Scholar]
  29. Wang, H.; Wang, L.; Hong, Y.; Askarinejad, A.; He, B.; Pan, H. Influence of pile diameter and aspect ratio on the lateral response of monopiles in sand with different relative densities. J. Mar. Sci. Eng. 2021, 9, 618. [Google Scholar] [CrossRef]
  30. Achmus, M.; Kuo, Y.S.; Abdel Rahman, K. Behavior of monopile foundations under cyclic lateral load. Comput. Geotech. 2009, 36, 725–735. [Google Scholar] [CrossRef]
  31. Thieken, K.; Achmus, M.; Lemke, K. A new static p-y approach for piles with arbitrary dimensions in sand. Geotechnik 2015, 38, 267–288. [Google Scholar] [CrossRef]
  32. Roy, K.; Hawlader, B.; Kenny, S.; Moore, I. Finite element modeling of lateral pipeline–soil interactions in dense sand. Can. Geotech. J. 2016, 53, 490–504. [Google Scholar] [CrossRef] [Green Version]
  33. Abongo, K.; Gu, J.; Pervizpour, M.; Quiel, S.; Pamukcu, S. Parametric lab-scale testing and numerical simulation of finned monopiles under directional loading. Ocean Eng. 2022, 259, 111871. [Google Scholar] [CrossRef]
  34. Jung, S.; Kim, S.-R.; Patil, A.; Hung, L.C. Effect of monopile foundation modeling on the structural response of a 5-MW offshore wind turbine tower. Ocean Eng. 2015, 109, 479–488. [Google Scholar] [CrossRef] [Green Version]
  35. Wang, H.; Wang, L.Z.; Hong, Y.; He, B.; Zhu, R.H. Quantifying the influence of pile diameter on the load transfer curves of laterally loaded monopile in sand. Appl. Ocean Res. 2020, 101, 102196. [Google Scholar] [CrossRef]
  36. Wang, J.; Sun, G.; Chen, G.; Yang, X. Finite element analyses of improved lateral performance of monopile when combined with bucket foundation for offshore wind turbines. Appl. Ocean Res. 2021, 111, 102647. [Google Scholar] [CrossRef]
  37. Bolton, M. The strength and dilatancy of sands. Geotechnique 1986, 36, 65–78. [Google Scholar] [CrossRef] [Green Version]
  38. Chakraborty, T.; Salgado, R. Dilatancy and shear strength of sand at low confining pressures. J. Geotech. Geoenviron. Eng. 2010, 136, 527–532. [Google Scholar] [CrossRef]
  39. White, D.; Cheuk, C.; Bolton, M. The uplift resistance of pipes and plate anchors buried in sand. Géotechnique 2008, 58, 771–779. [Google Scholar] [CrossRef] [Green Version]
  40. Roy, K.S. Numerical Modeling of Pipe-Soil and Anchor-Soil Interactions in Dense Sand; Memorial University of Newfoundland: St. John’s, NL, Canada, 2018. [Google Scholar]
  41. Leblanc, C.; Houlsby, G.T.; Byrne, B.W. Response of stiff piles in sand to long-term cyclic lateral loading. Géotechnique 2010, 60, 79–90. [Google Scholar] [CrossRef]
  42. Wang, X.; Li, J. Parametric study of hybrid monopile foundation for offshore wind turbines in cohesionless soil. Ocean Eng. 2020, 218, 108172. [Google Scholar] [CrossRef]
  43. API. Recommended Practice for Planning, Designing and Constructing Fixed Offshore Platforms, 17th ed.; API Recomm. Pract. 2a (RP 2a); API: Washington, DC, USA, 1987. [Google Scholar]
  44. Klinkvort, R.T. Centrifuge Modelling of Drained Lateral Pile-Soil Response. Ph.D. Thesis, The Technical University of Denmark, DTU Civil Engineering, Lyngby, Denmark, 2012. [Google Scholar]
  45. Klinkvort, R.T.; Hededal, O. Lateral response of monopile supporting an offshore wind turbine. Proc. Inst. Civ. Eng.-Geotech. Eng. 2013, 166, 147–158. [Google Scholar] [CrossRef]
  46. Latini, C.; Zania, V. Triaxial Tests in Fontainebleau Sand. 2016. Available online: https://orbit.dtu.dk/en/publications/triaxial-tests-in-fontainebleau-sand (accessed on 1 August 2022).
  47. Arany, L.; Bhattacharya, S.; Macdonald, J.; Hogan, S.J. Design of monopiles for offshore wind turbines in 10 steps. Soil Dyn. Earthq. Eng. 2017, 92, 126–152. [Google Scholar] [CrossRef] [Green Version]
  48. DNV. DNVGL-ST-0126: Support Structures for Wind Turbines; DNV GL: Oslo, Norway, 2016. [Google Scholar]
  49. Doherty, P.; Gavin, K. Laterally loaded monopile design for offshore wind farms. Proc. Inst. Civ. Eng. Energy 2012, 165, 7–17. [Google Scholar] [CrossRef] [Green Version]
  50. Hu, Q.; Han, F.; Prezzi, M.; Salgado, R.; Zhao, M. Lateral load response of large-diameter monopiles in sand. Géotechnique 2022, 72, 1035–1050. [Google Scholar] [CrossRef]
  51. Luo, R.; Yang, M.; Li, W. Numerical study of diameter effect on accumulated deformation of laterally loaded monopiles in sand. Eur. J. Environ. Civ. Eng. 2020, 24, 2440–2452. [Google Scholar] [CrossRef]
Figure 1. Schematic diagram of the winged monopile model: (a) a four-wing monopile; (b) a three-wing monopile.
Jmse 10 01799 g001
Figure 2. Meshes and boundary conditions of the FE model: (a) pre-scour model; (b) post-scour model.
Jmse 10 01799 g002
Figure 3. Typical curves of modified friction angle and modified dilation angle with plastic shear strain (after Roy et al. [32]).
Jmse 10 01799 g003
Figure 4. Variations in mobilized friction angle and dilation angle with plastic shear strain ( φ c = 31°): (a) various confining pressures with Dr = 90%; (b) various relative densities with p’= 40 kPa.
Jmse 10 01799 g004
Figure 5. Comparison of FE simulation and triaxial compression soil element tests: (a) stress–strain behavior; (b) volume change behavior.
Jmse 10 01799 g005
Figure 6. Comparison of finite element results with centrifuge test results [44].
Jmse 10 01799 g006
Figure 7. Comparison of the development process of the plastic zone around the pile (scaling factor: 0.1).
Jmse 10 01799 g007
Figure 8. The effects of scour depth on bearing capacity of winged monopiles: (a) load–displacement curves of winged monopiles with various scour depths; (b) variation in lateral bearing capacity ratio with displacement at different scour depths.
Jmse 10 01799 g008
Figure 9. Soil displacement in the plane of symmetry and the planform at θ = 2°: (a) the winged monopile without local scour; (b) the winged monopile with local scour (S/D = 1.5).
Jmse 10 01799 g009
Figure 10. Distribution of plastic shear strain in the plane of symmetry of the winged monopile (WP4): (a) without local scour; (b) with local scour (S/D = 1.5).
Jmse 10 01799 g010aJmse 10 01799 g010b
Figure 11. Modified friction angle φ′ and dilation angle ψ of the sand in the plane of symmetry at θ = 2°: (a) without local scour; (b) with local scour (S/D = 1.5).
Jmse 10 01799 g011
Figure 12. Load–displacement curves with different scour depths: (a) regular monopiles (RP); (b) extended regular monopiles (RP-E).
Jmse 10 01799 g012
Figure 13. Variation in the ratio of lateral loads of WP4 and RP-E with scour depths at (a) SLS and (b) ULS.
Jmse 10 01799 g013
Figure 14. Soil displacement in the plane of symmetry and the planform at θ = 2°: (a) the regular monopile with scour (S/D = 1.5); (b) the extended monopile with scour (S/D = 1.5).
Jmse 10 01799 g014
Figure 15. Moment–lateral load interaction diagram at SLS.
Jmse 10 01799 g015
Figure 16. Load–displacement curves of winged monopiles in sand with different relative densities (Dr).
Jmse 10 01799 g016
Figure 17. Distribution of plastic shear strain in the plane of symmetry of the winged monopile with different relative densities (Dr) at θ = 2°.
Jmse 10 01799 g017
Figure 18. Effect of wing load orientation on the load capacity of winged monopiles: (a) a four-wing monopile; and (b) a three-wing monopile.
Jmse 10 01799 g018
Figure 19. Variation in the lateral bearing capacity of winged monopiles under different wing heights: (a) four-wing monopiles; (b) three-wing monopiles.
Jmse 10 01799 g019
Figure 20. Sand displacement in the plane of symmetry and the planform of the three-wing monopile under scour (S/D = 1.5) at θ = 2°.
Jmse 10 01799 g020
Figure 21. Distribution of plastic shear strain in the plane of symmetry of the winged monopile (WP3) with S/D = 1.5 at θ = 2°.
Jmse 10 01799 g021
Figure 22. Variation in wing efficiency for winged monopiles with various wing heights.
Jmse 10 01799 g022
Table 1. Properties of sand used in FE analyses [31,32].
DescriptionSymbolUnitMedium-DenseDenseVery Dense
Relative densityDr%60708090
Submerged unit weight γ kN/m36.286.586.907.24
Elastic stiffness parameters κ 400500500700
  λ 0.60.550.550.5
Poisson’s ratio υ 0.250.2250.2250.2
Critical state friction angle φ c °31
MMC parameters φ in °29
  A ψ 3.8
  k ψ 0.6
 Q10
 R1
 C10.22
 C20.11
 m0.25
CohesionckPa0.1
Constant friction angle φ 0 °34.336.438.841.5
Table 2. Numerical simulation cases for parametric study.
SeriesConstant ParametersVariable Parameters
IDr = 90%, four-wing monopile with Lp = 8D, Lw/Ww = 1, β = 0°;
Dr = 90%, regular monopile with Lp = 8D;
Dr = 90%, extended regular monopile with Lp = 9.29D;
S = 0, 0.5D, 1D, 1.5D, 1.9D
IIDr = 90%, four-wing monopile with, S = 1.9D, β = 0°;
Dr = 90%, four-wing monopile with, S = 1.0D, β = 0°;
Dr = 90%, four-wing monopile with, S = 0D, β = 0°;
Dr = 90%, regular monopile with Lp = 8D, S = 1.9D, β = 0°;
Dr = 90%, regular monopile with Lp = 8D, S = 1.0D, β = 0°;
Dr = 90%, regular monopile with Lp = 8D, S = 0D, β = 0°;
e = 0, 2D, 4D, 8D and pure moment
IIIFour-wing monopile with Lw/Ww = 1, S = 1.5D, β = 0°; Dr = 60%, 70%, 80%, 90%
IVDr = 90%, four-wing monopile with, S = 1.5D, Lw/Ww = 1;
Dr = 90%, three-wing monopile with, S =1.5D, Lw/Ww = 1;
β = 0°, 15°, 30°, 45°
β = 0°, 15°, 30°, 45°, 60°
VDr = 90%, four-wing monopile with, Ww = DP, S = 1.5D, β = 0°;
Dr = 90%, three-wing monopile with Ww = DP, S = 1.5D, β = 0°;
Lw/Ww = 0, 0.5, 0.75, 1, 1.5, 1.75
Table 3. Pile–soil interaction model parameters used for validation [32,45].
DescriptionSymbolUnitDense Fontainebleau Sand
Relative densityDr%90
Submerged unit weight γ kN/m310.2
Stiffness parameterκ1380.7
Stiffness parameterλ0.6226
Poisson’s ratioν0.3
Critical state friction angle φ c °30
Parameter of MMC φ in °29
  A ψ 3.8
  k ψ 0.6
 C10.22
 C20.11
 m0.25
Publisher’s Note: MDPI stays neutral with regard to jurisdictional claims in published maps and institutional affiliations.

