
Characteristics of the Wind and Wave Climate along the European Seas Focusing on the Main Maritime Routes


Abstract
:1. Introduction
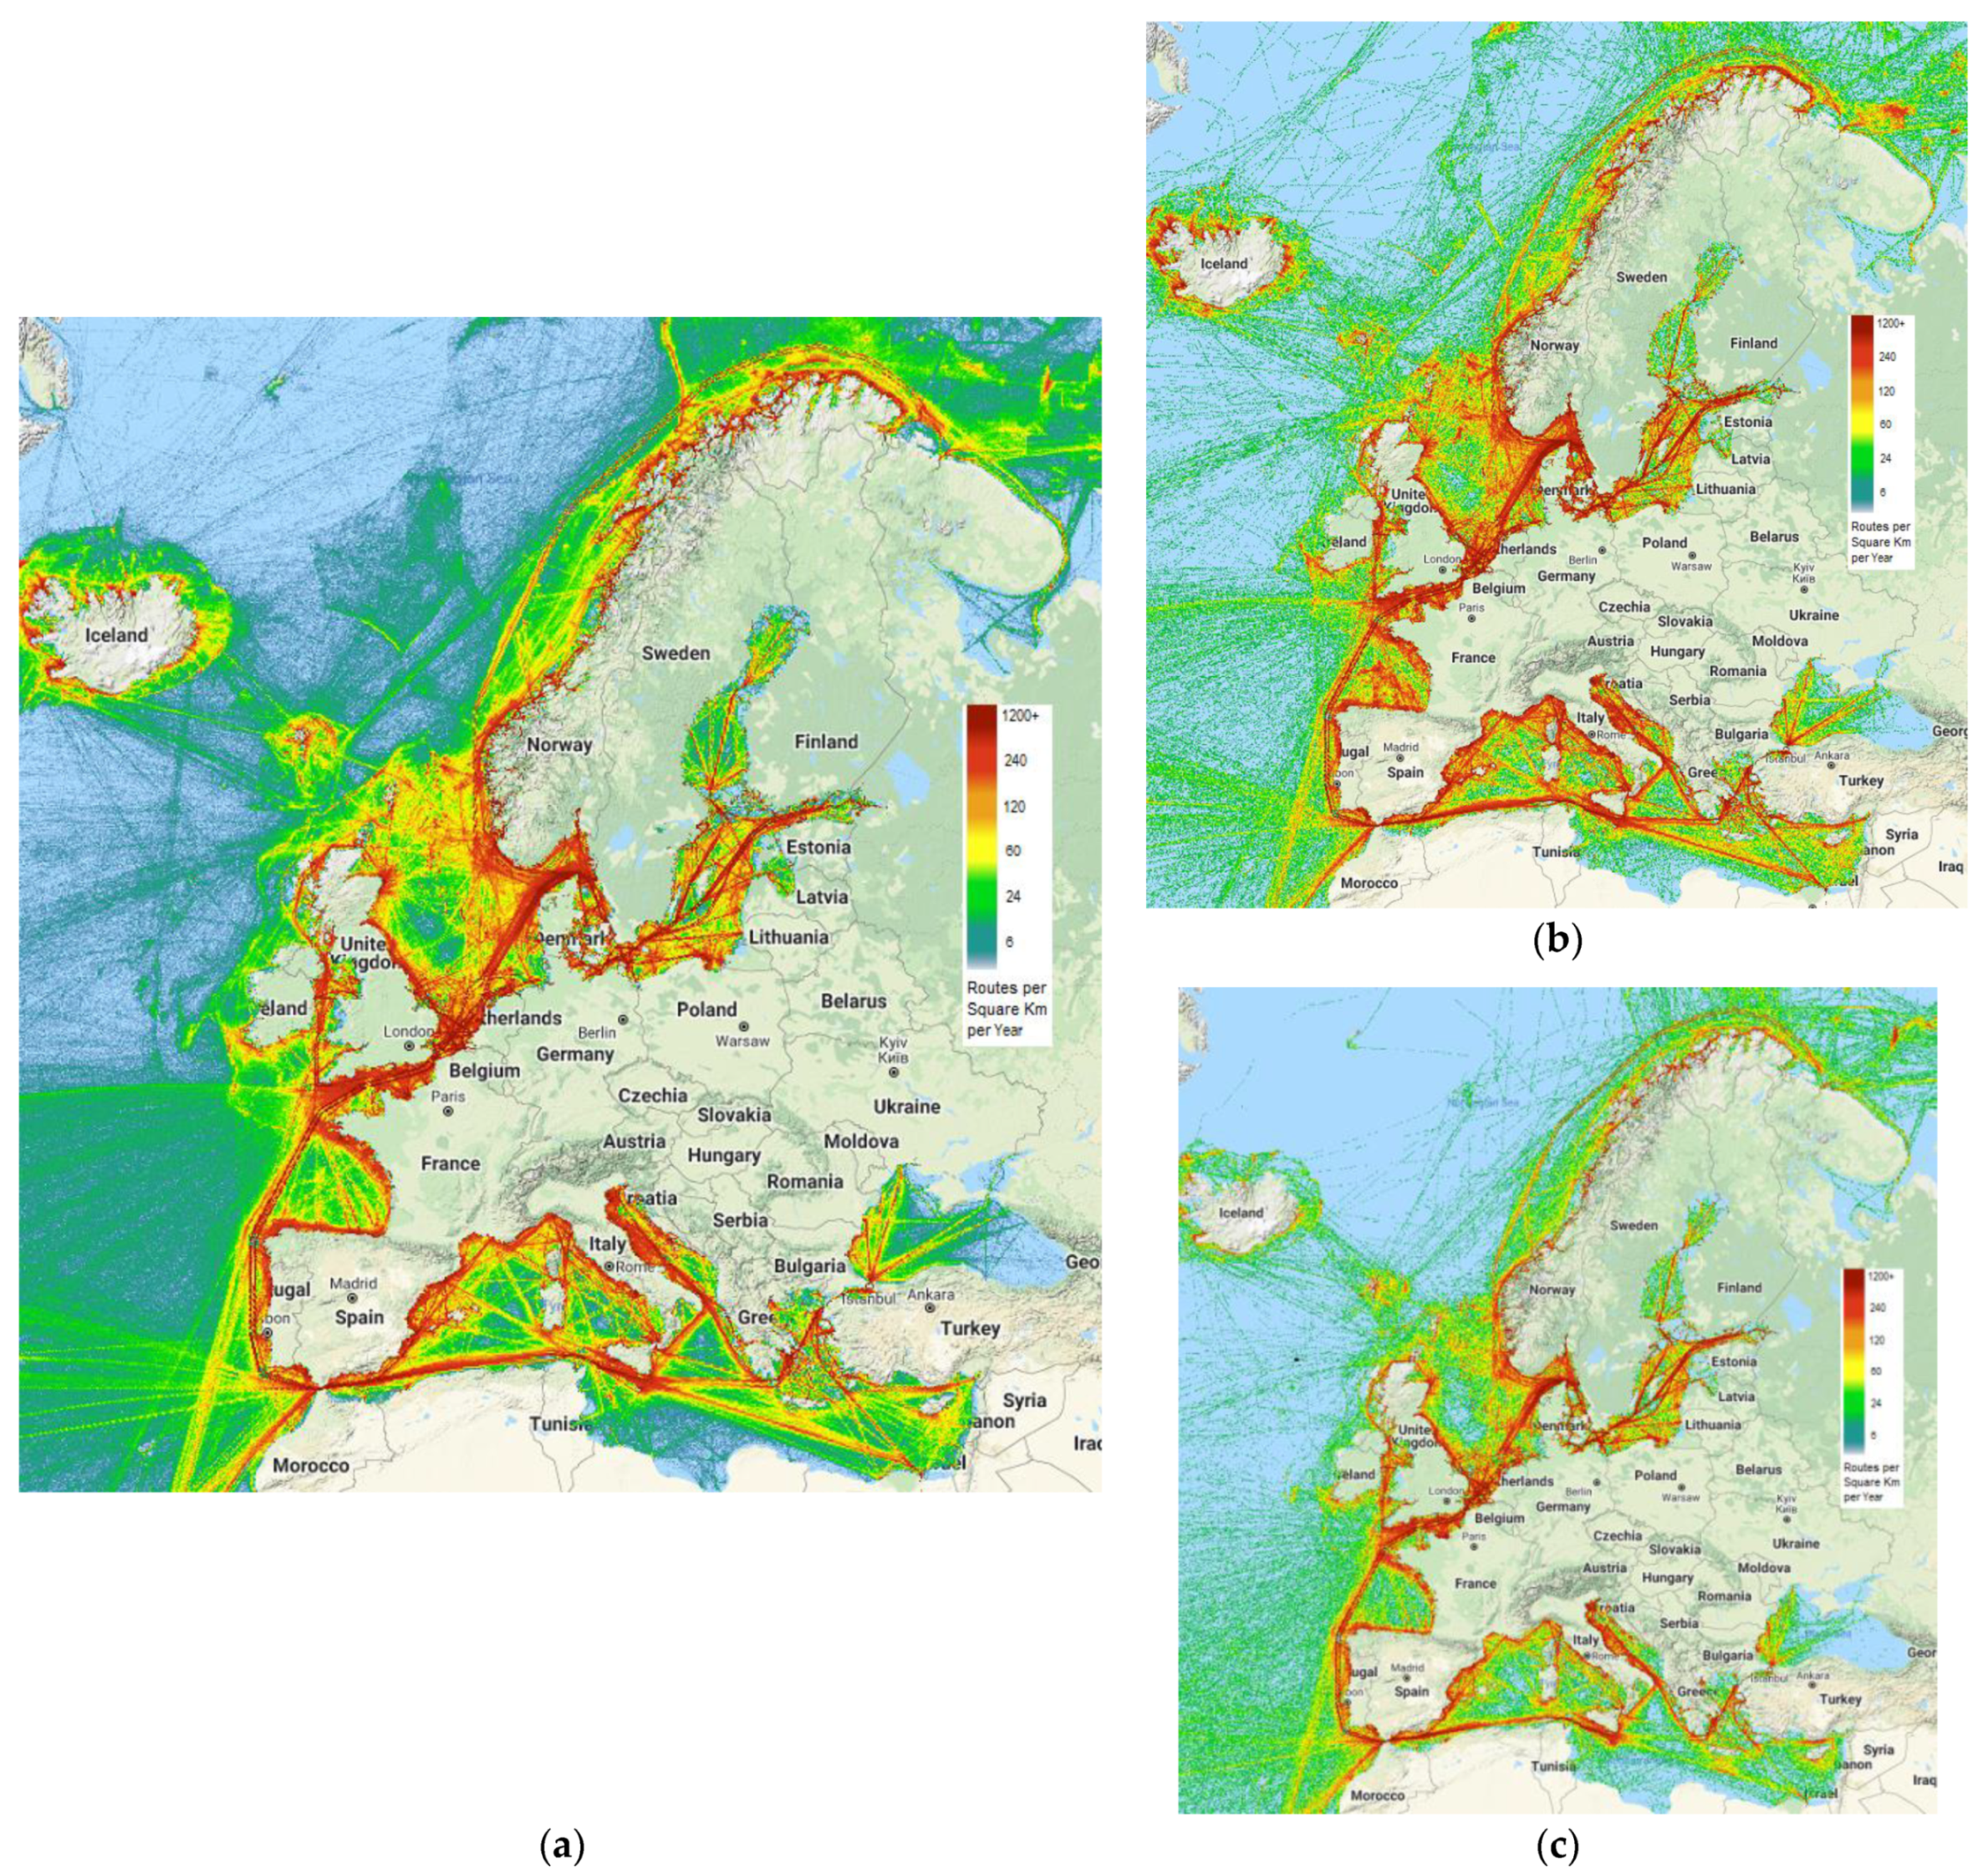
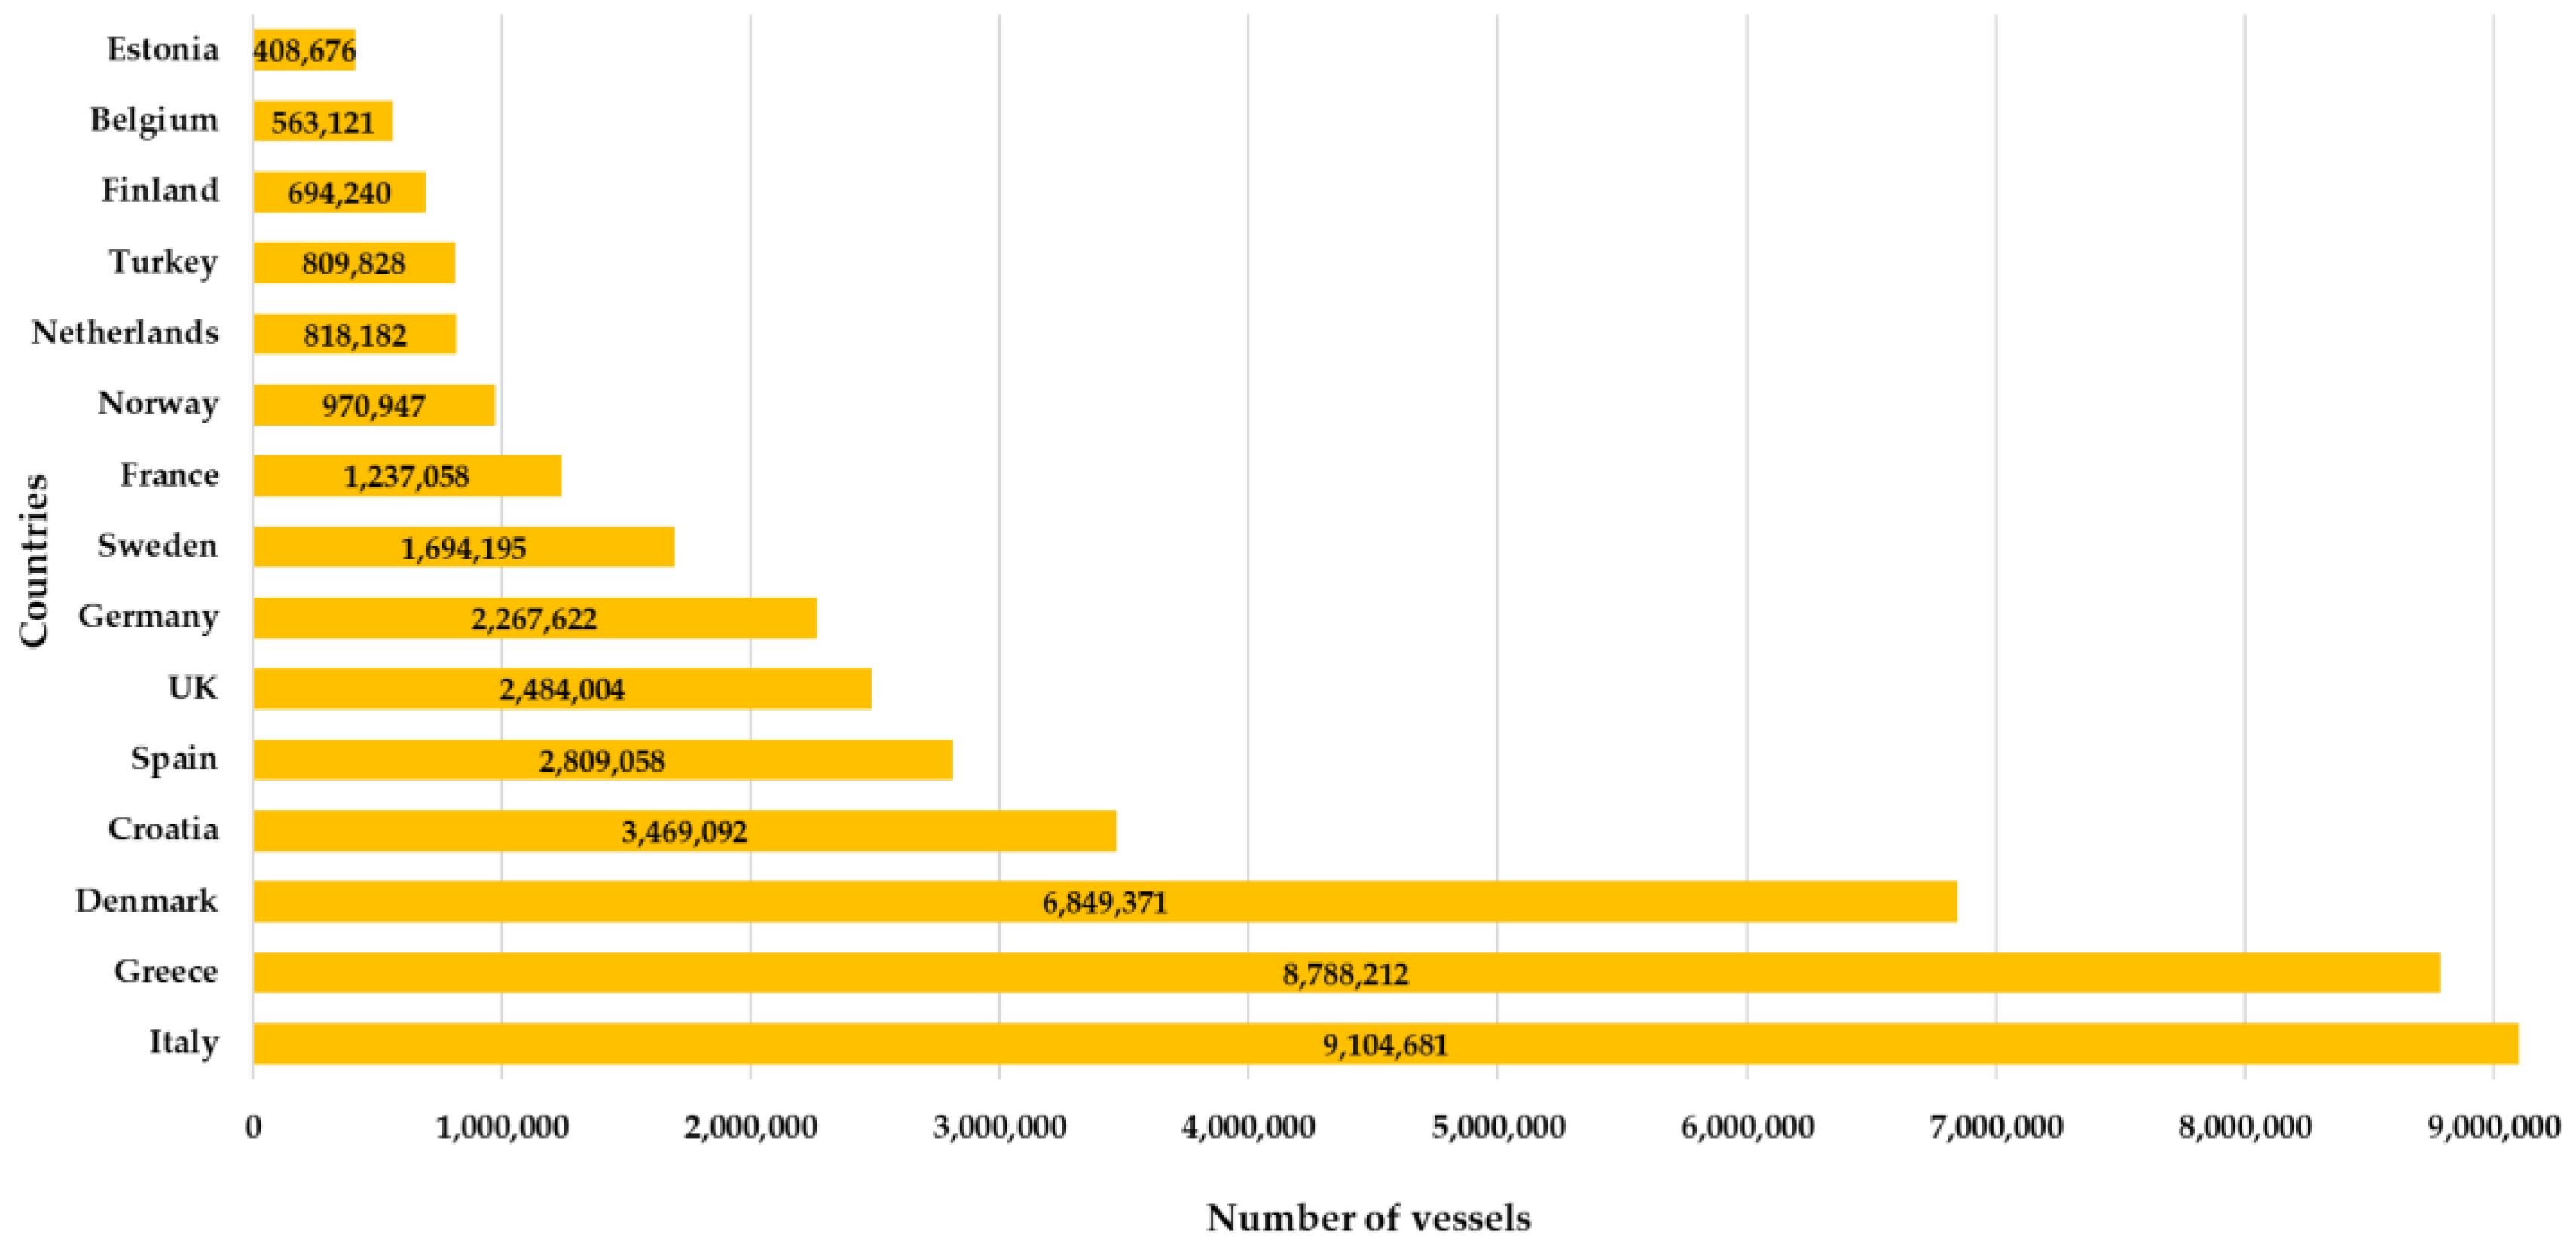
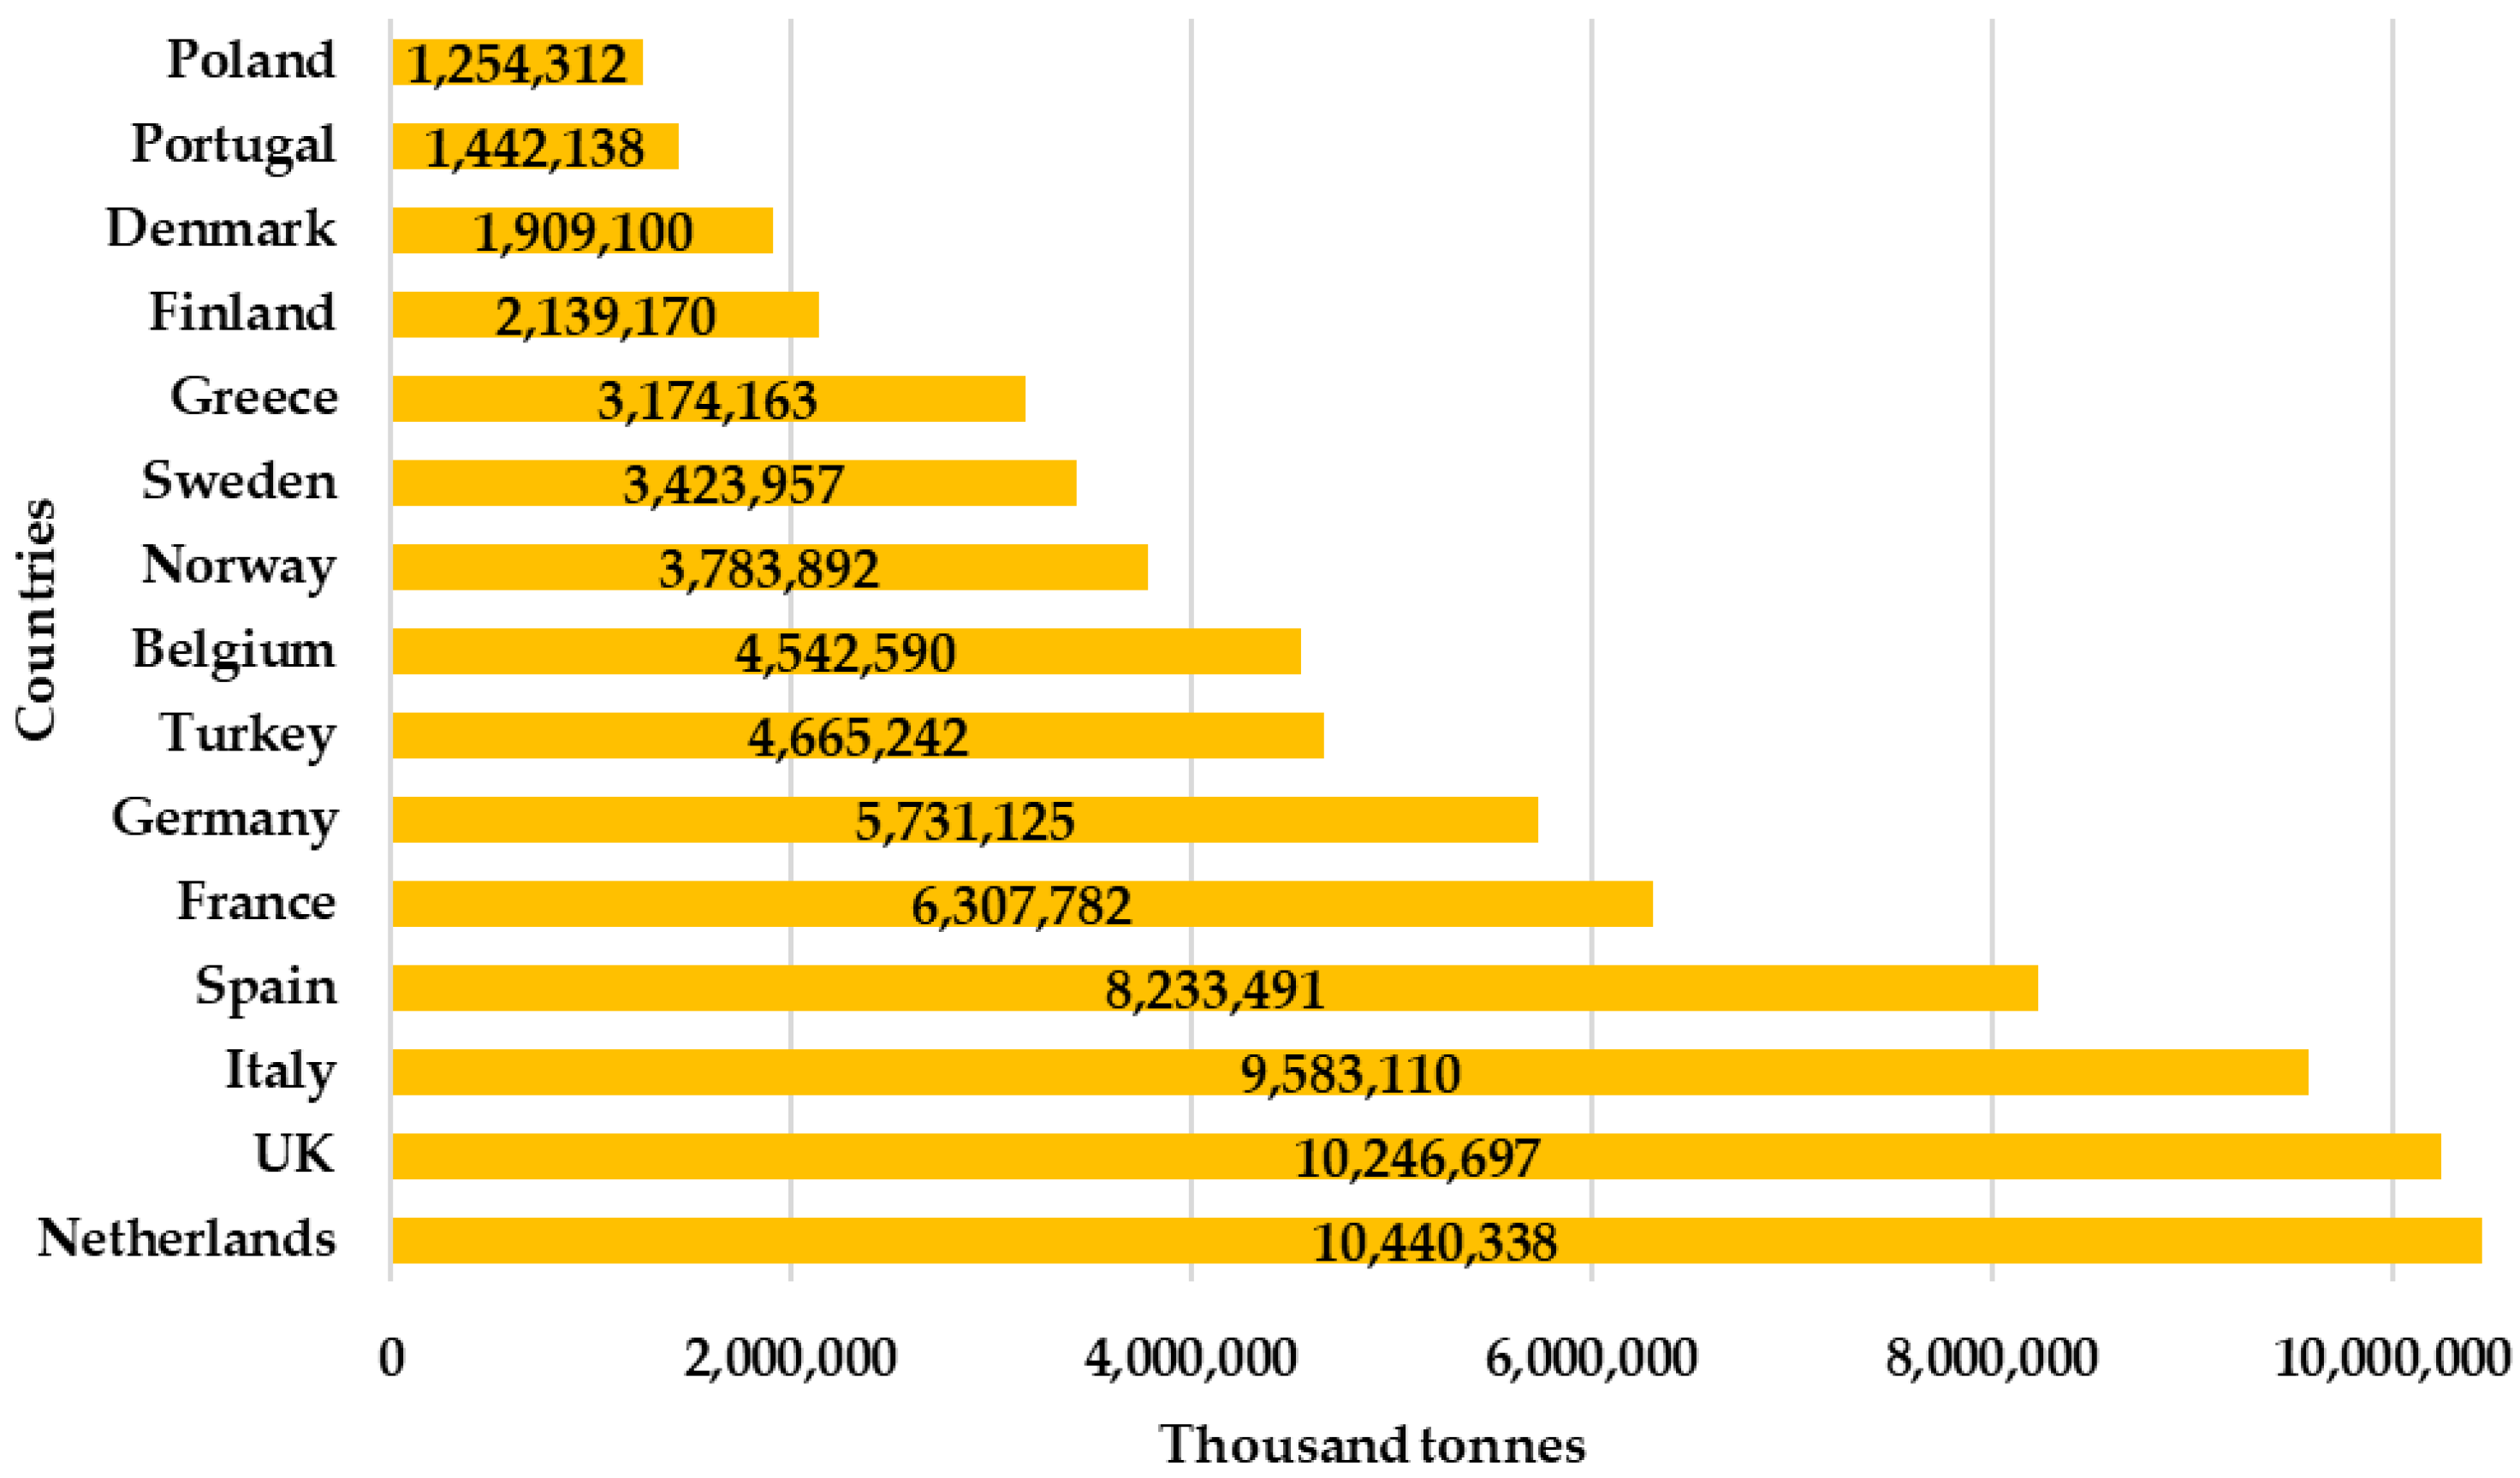
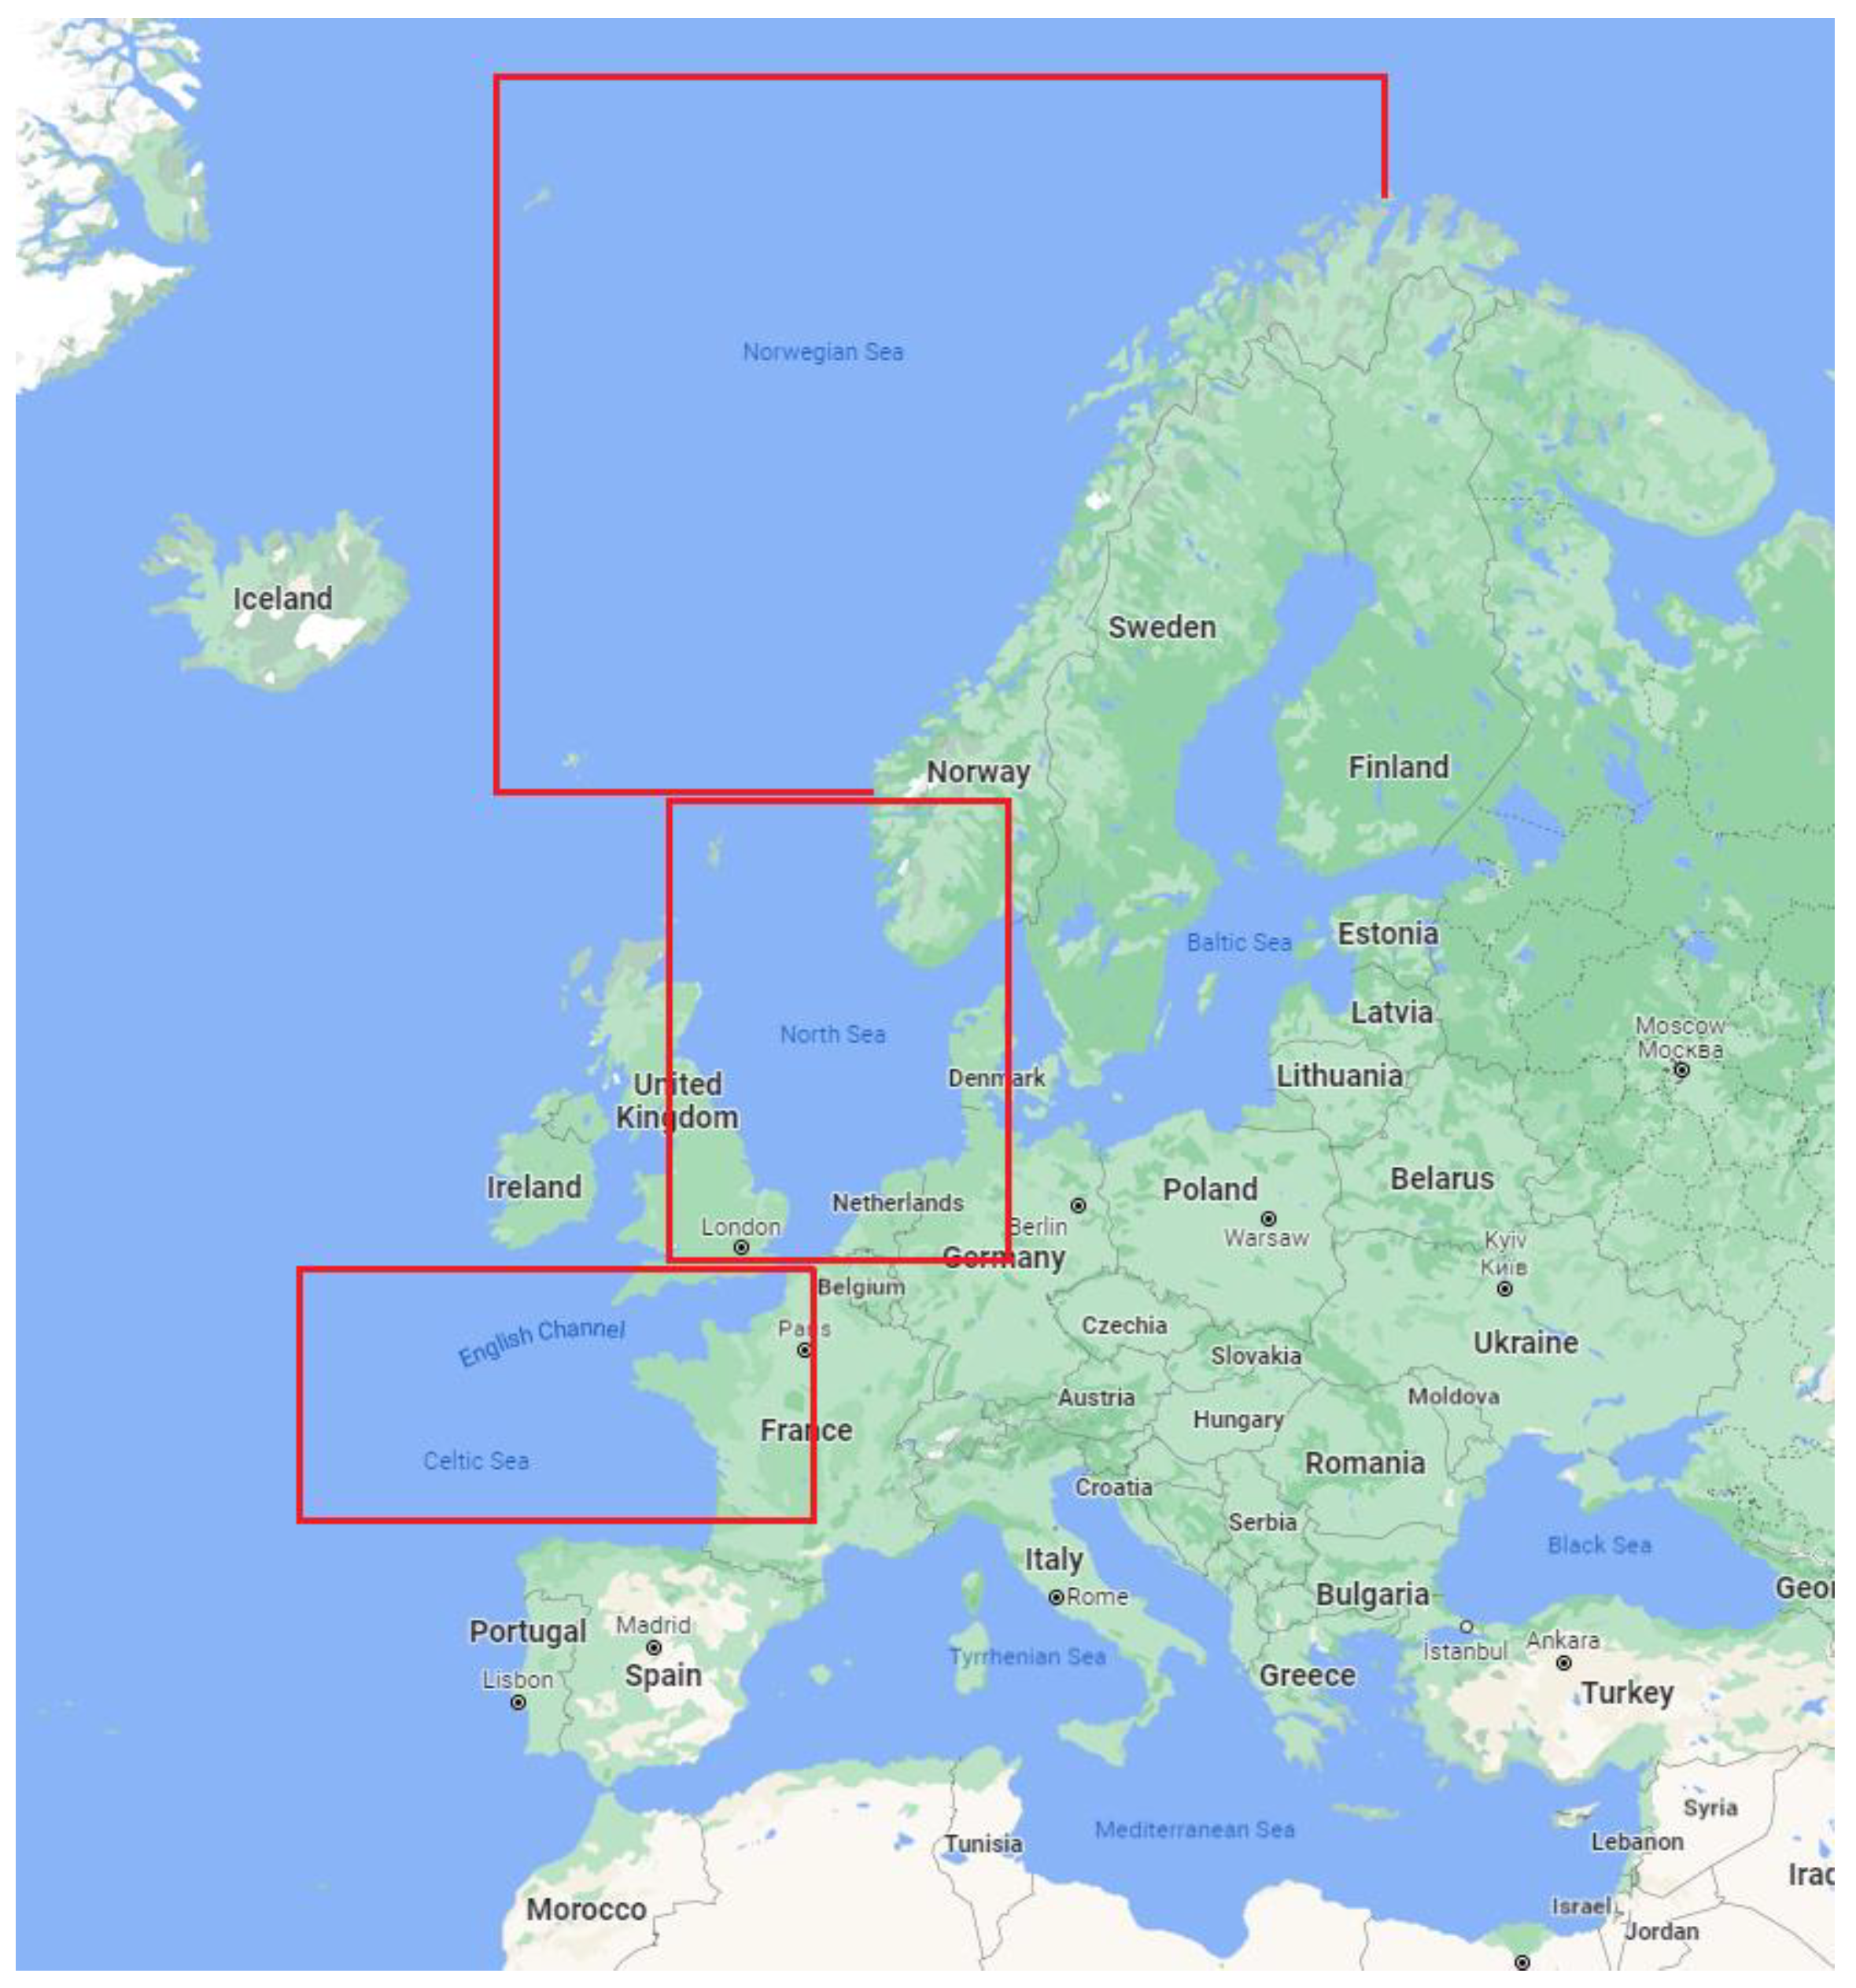
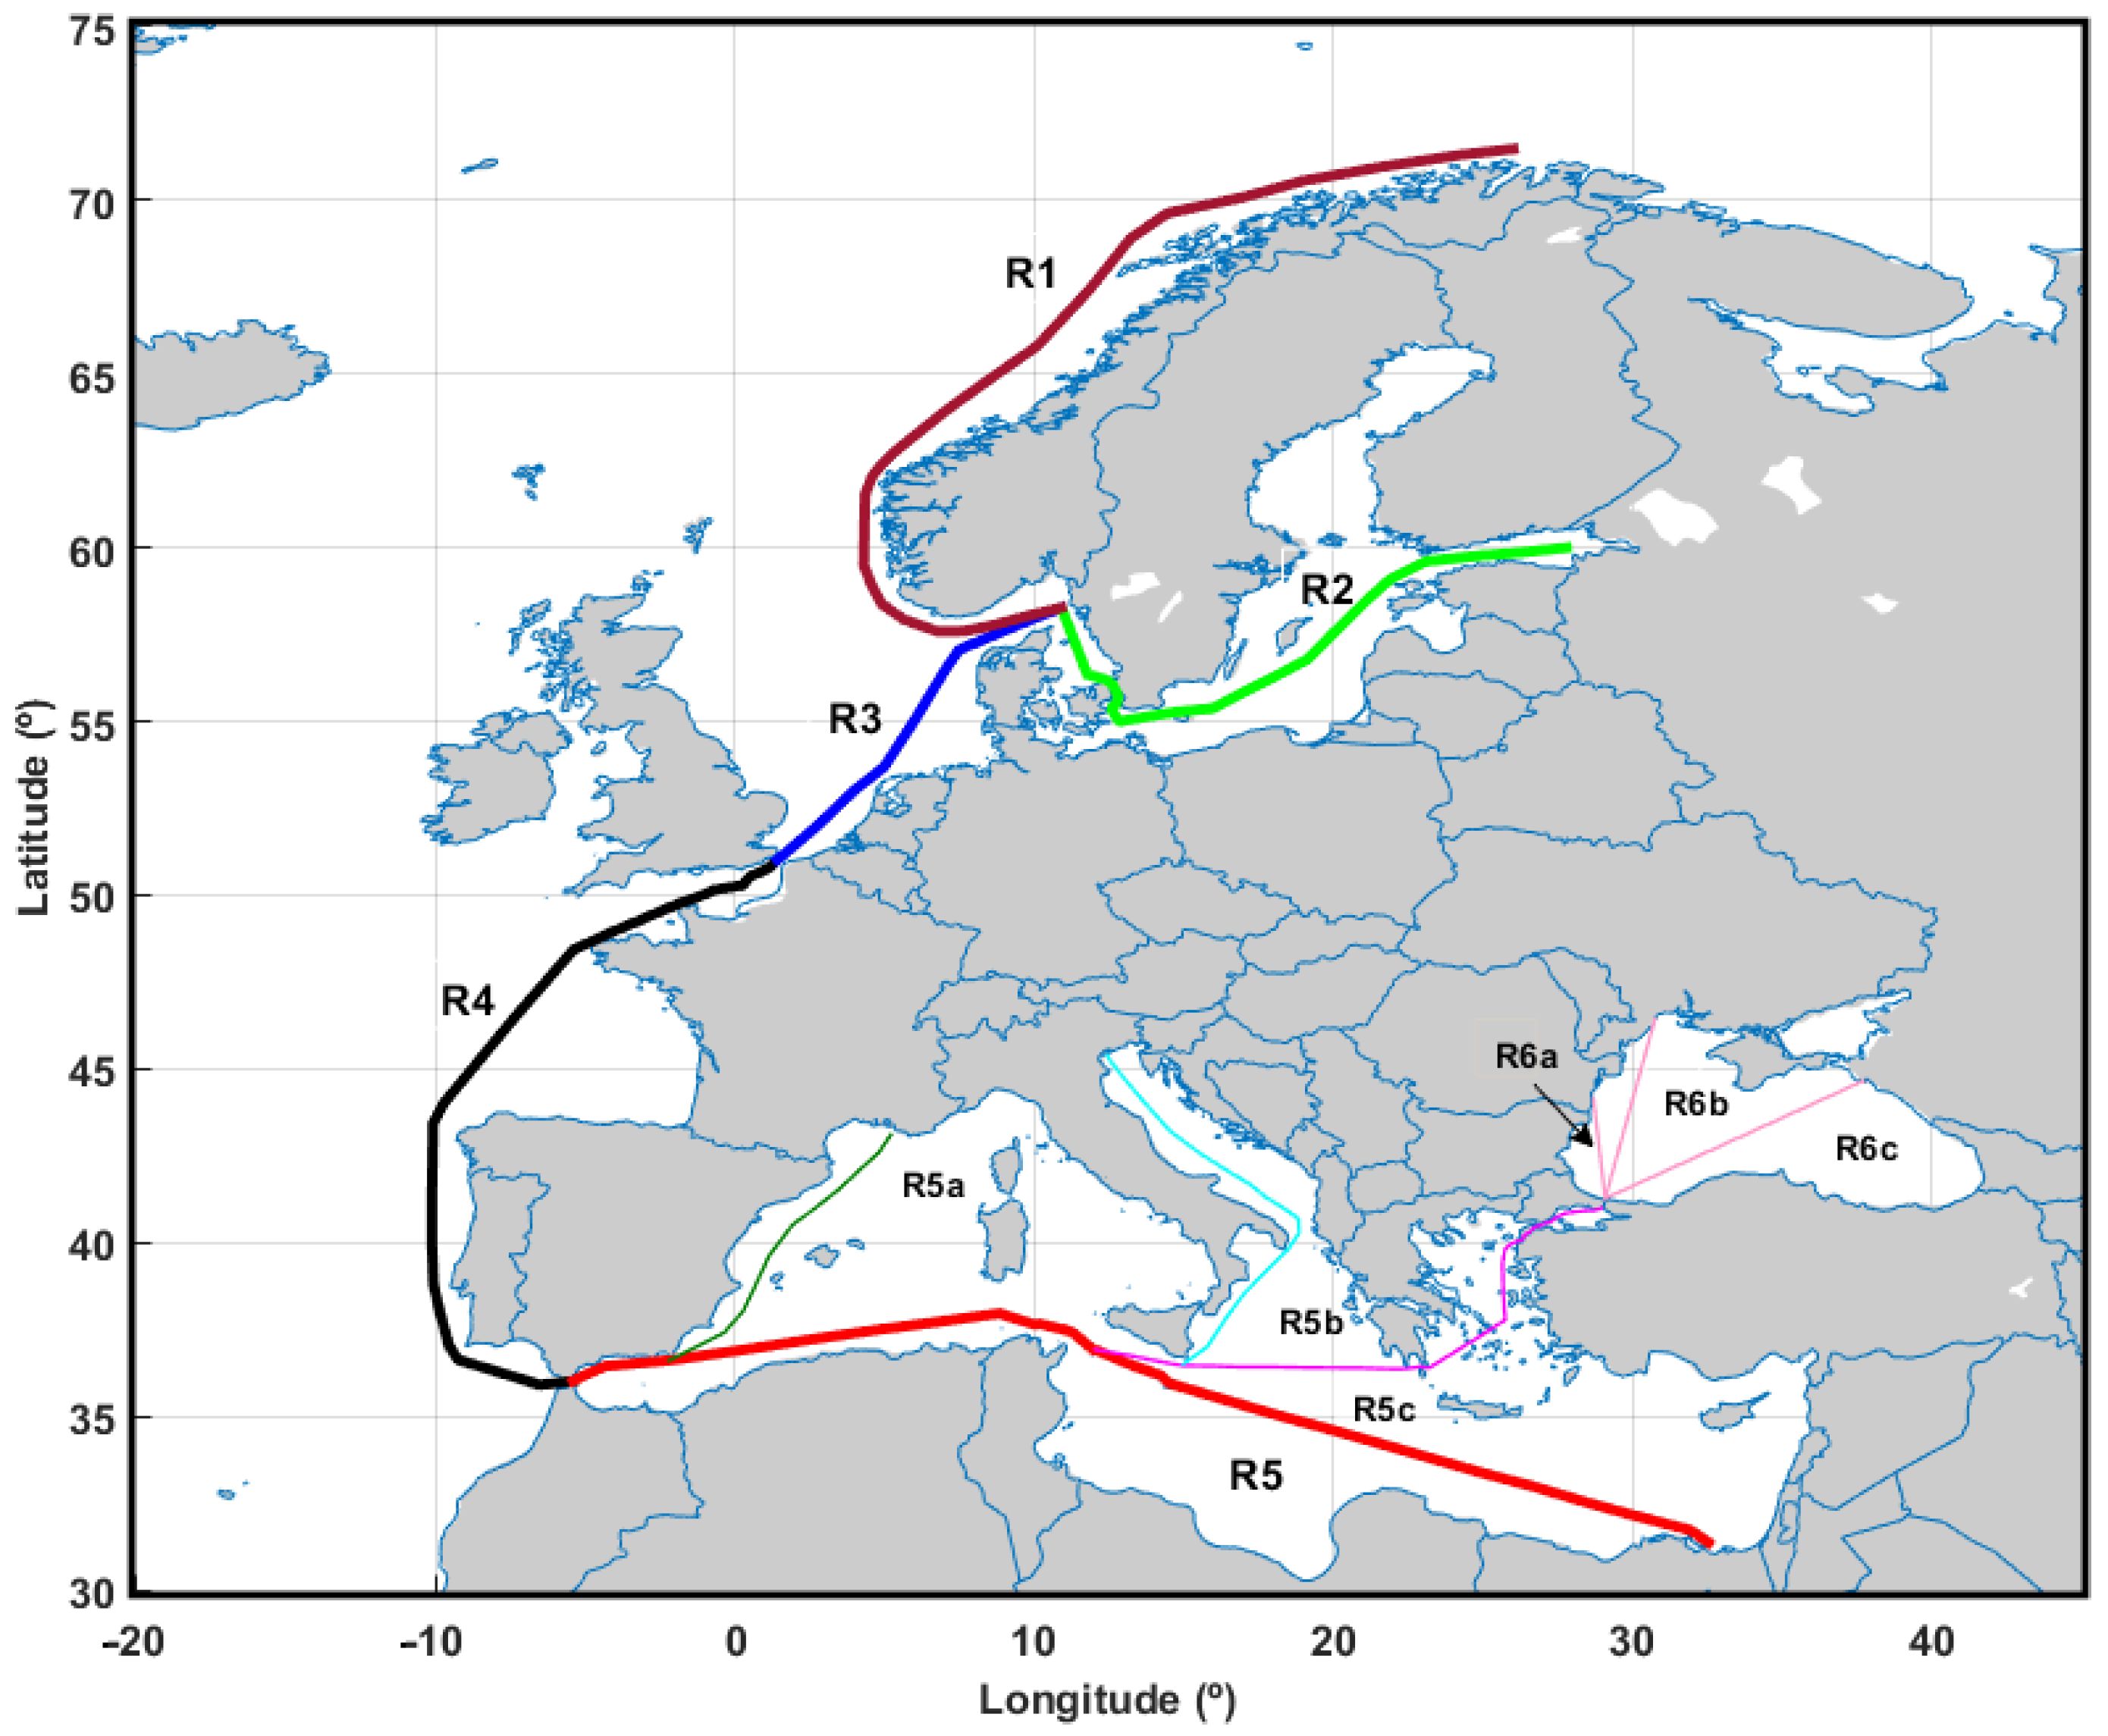
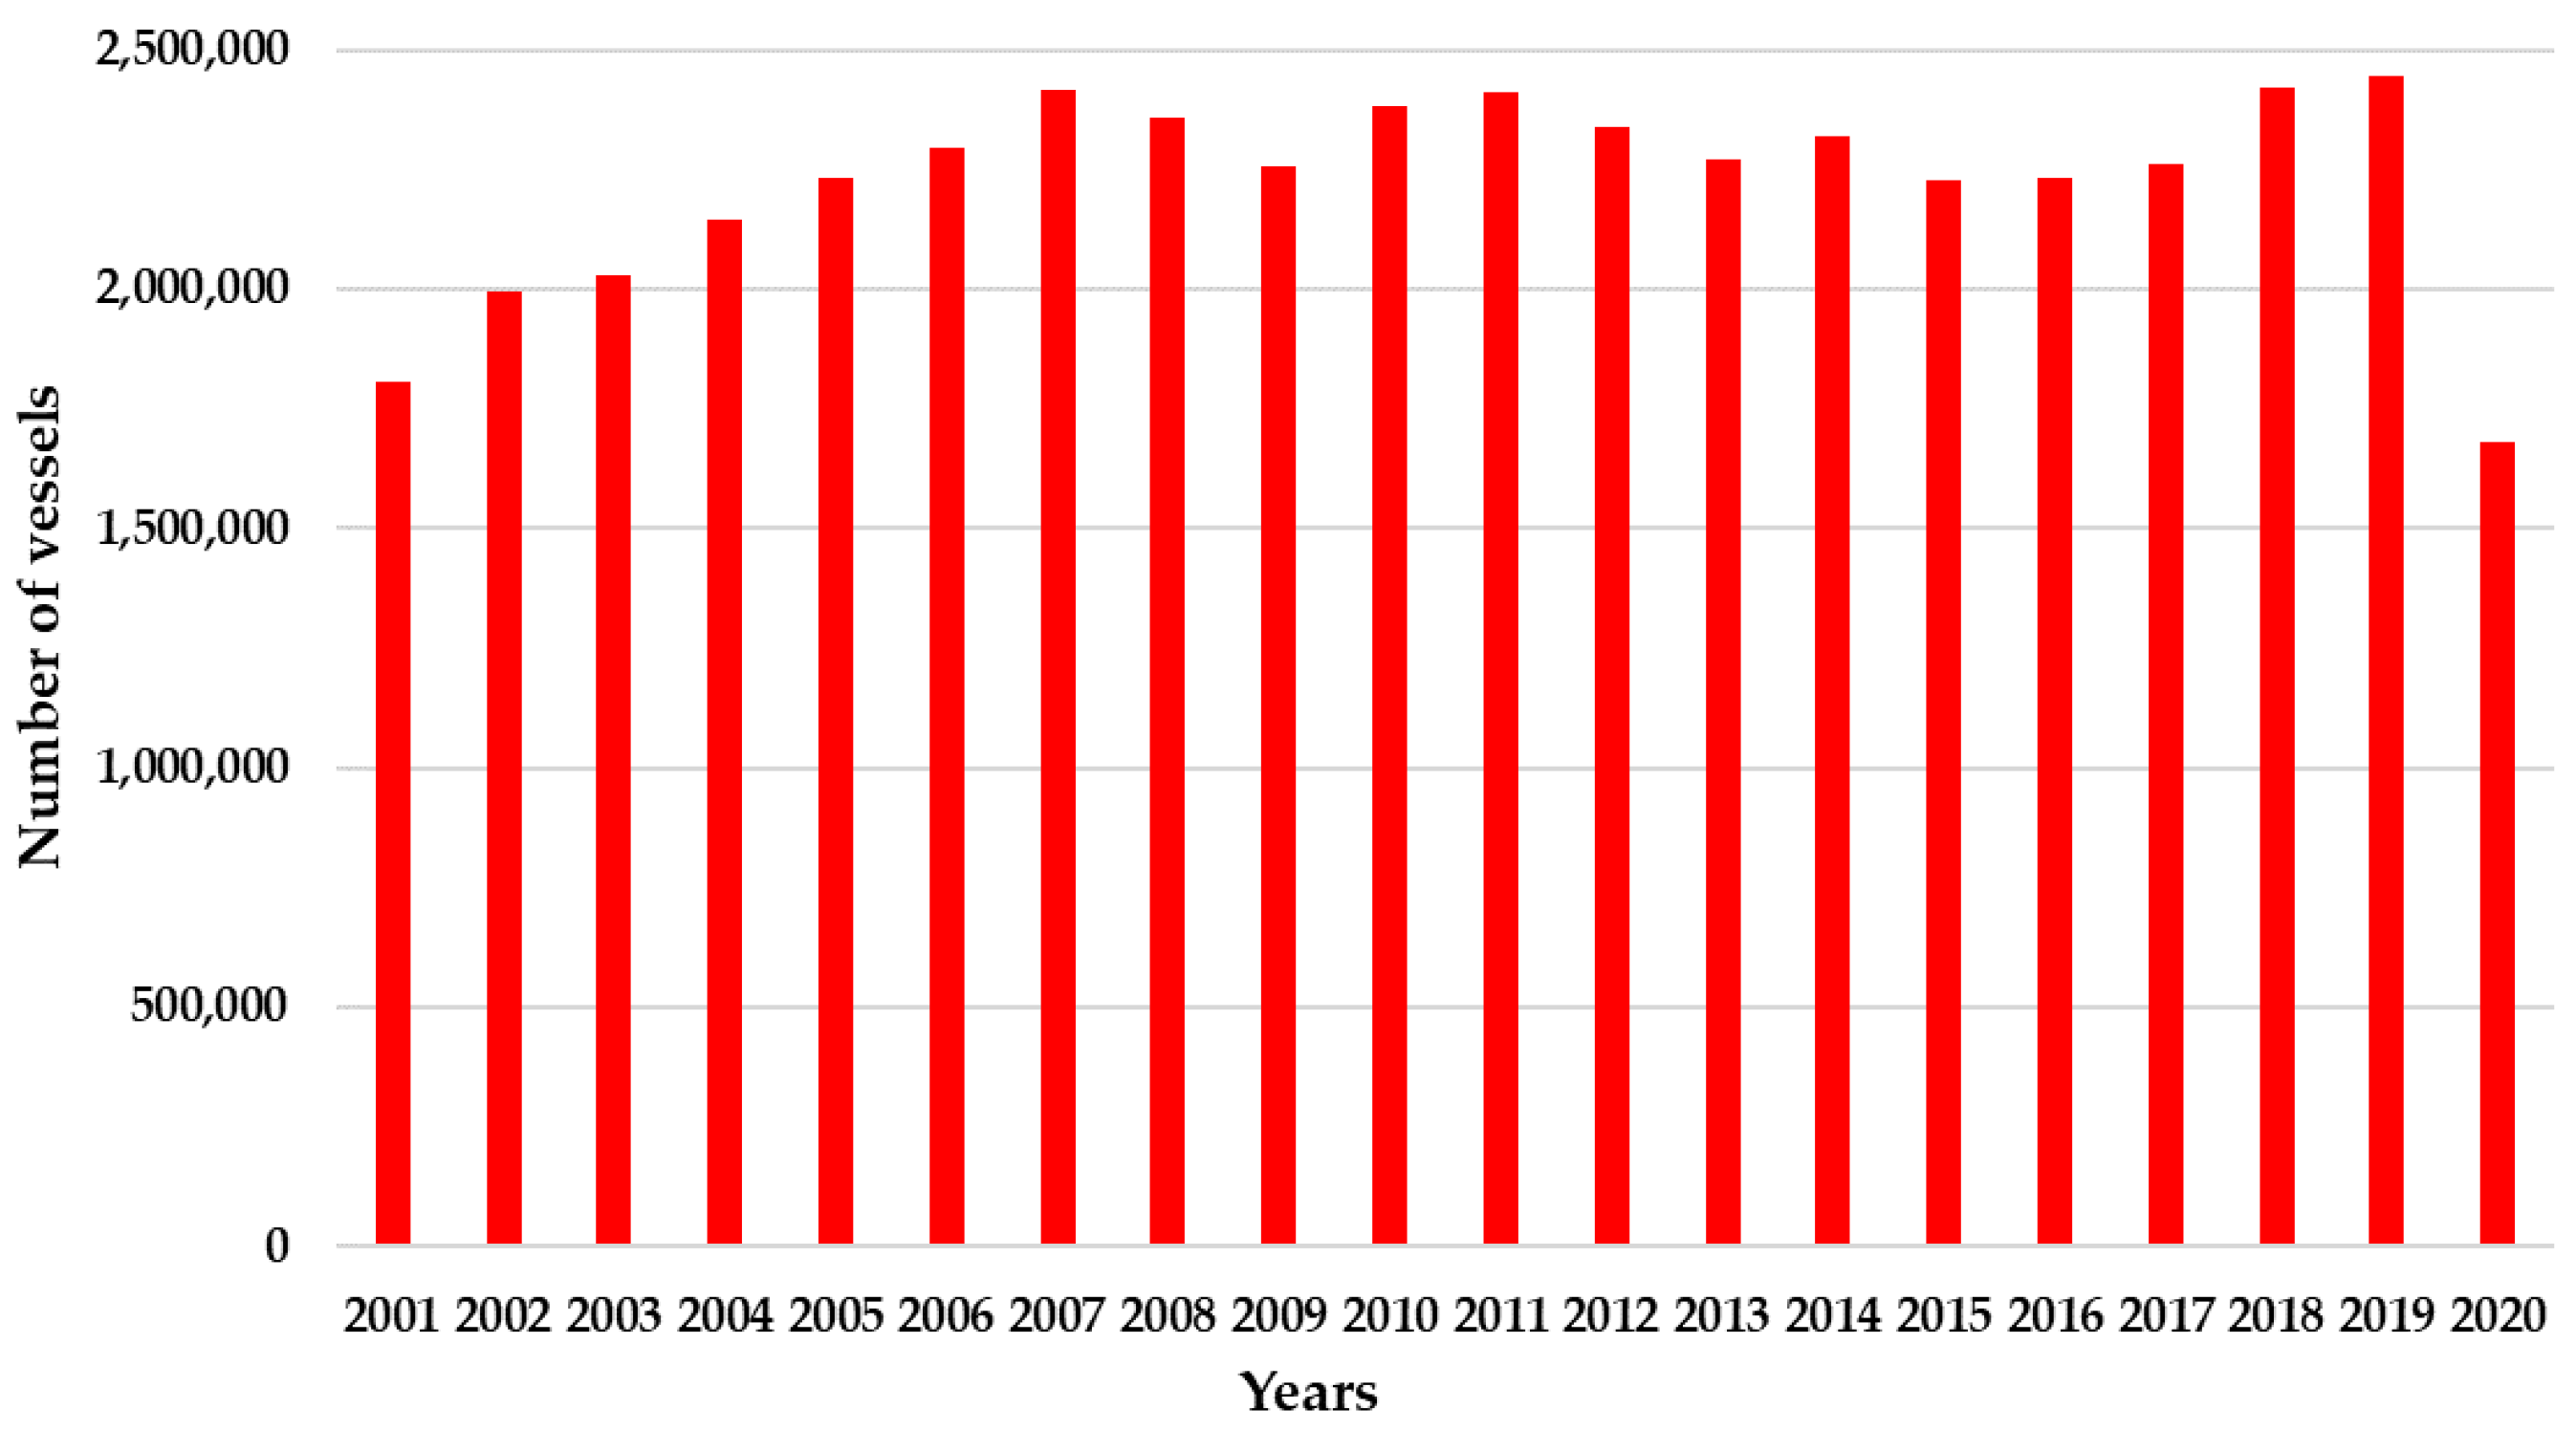
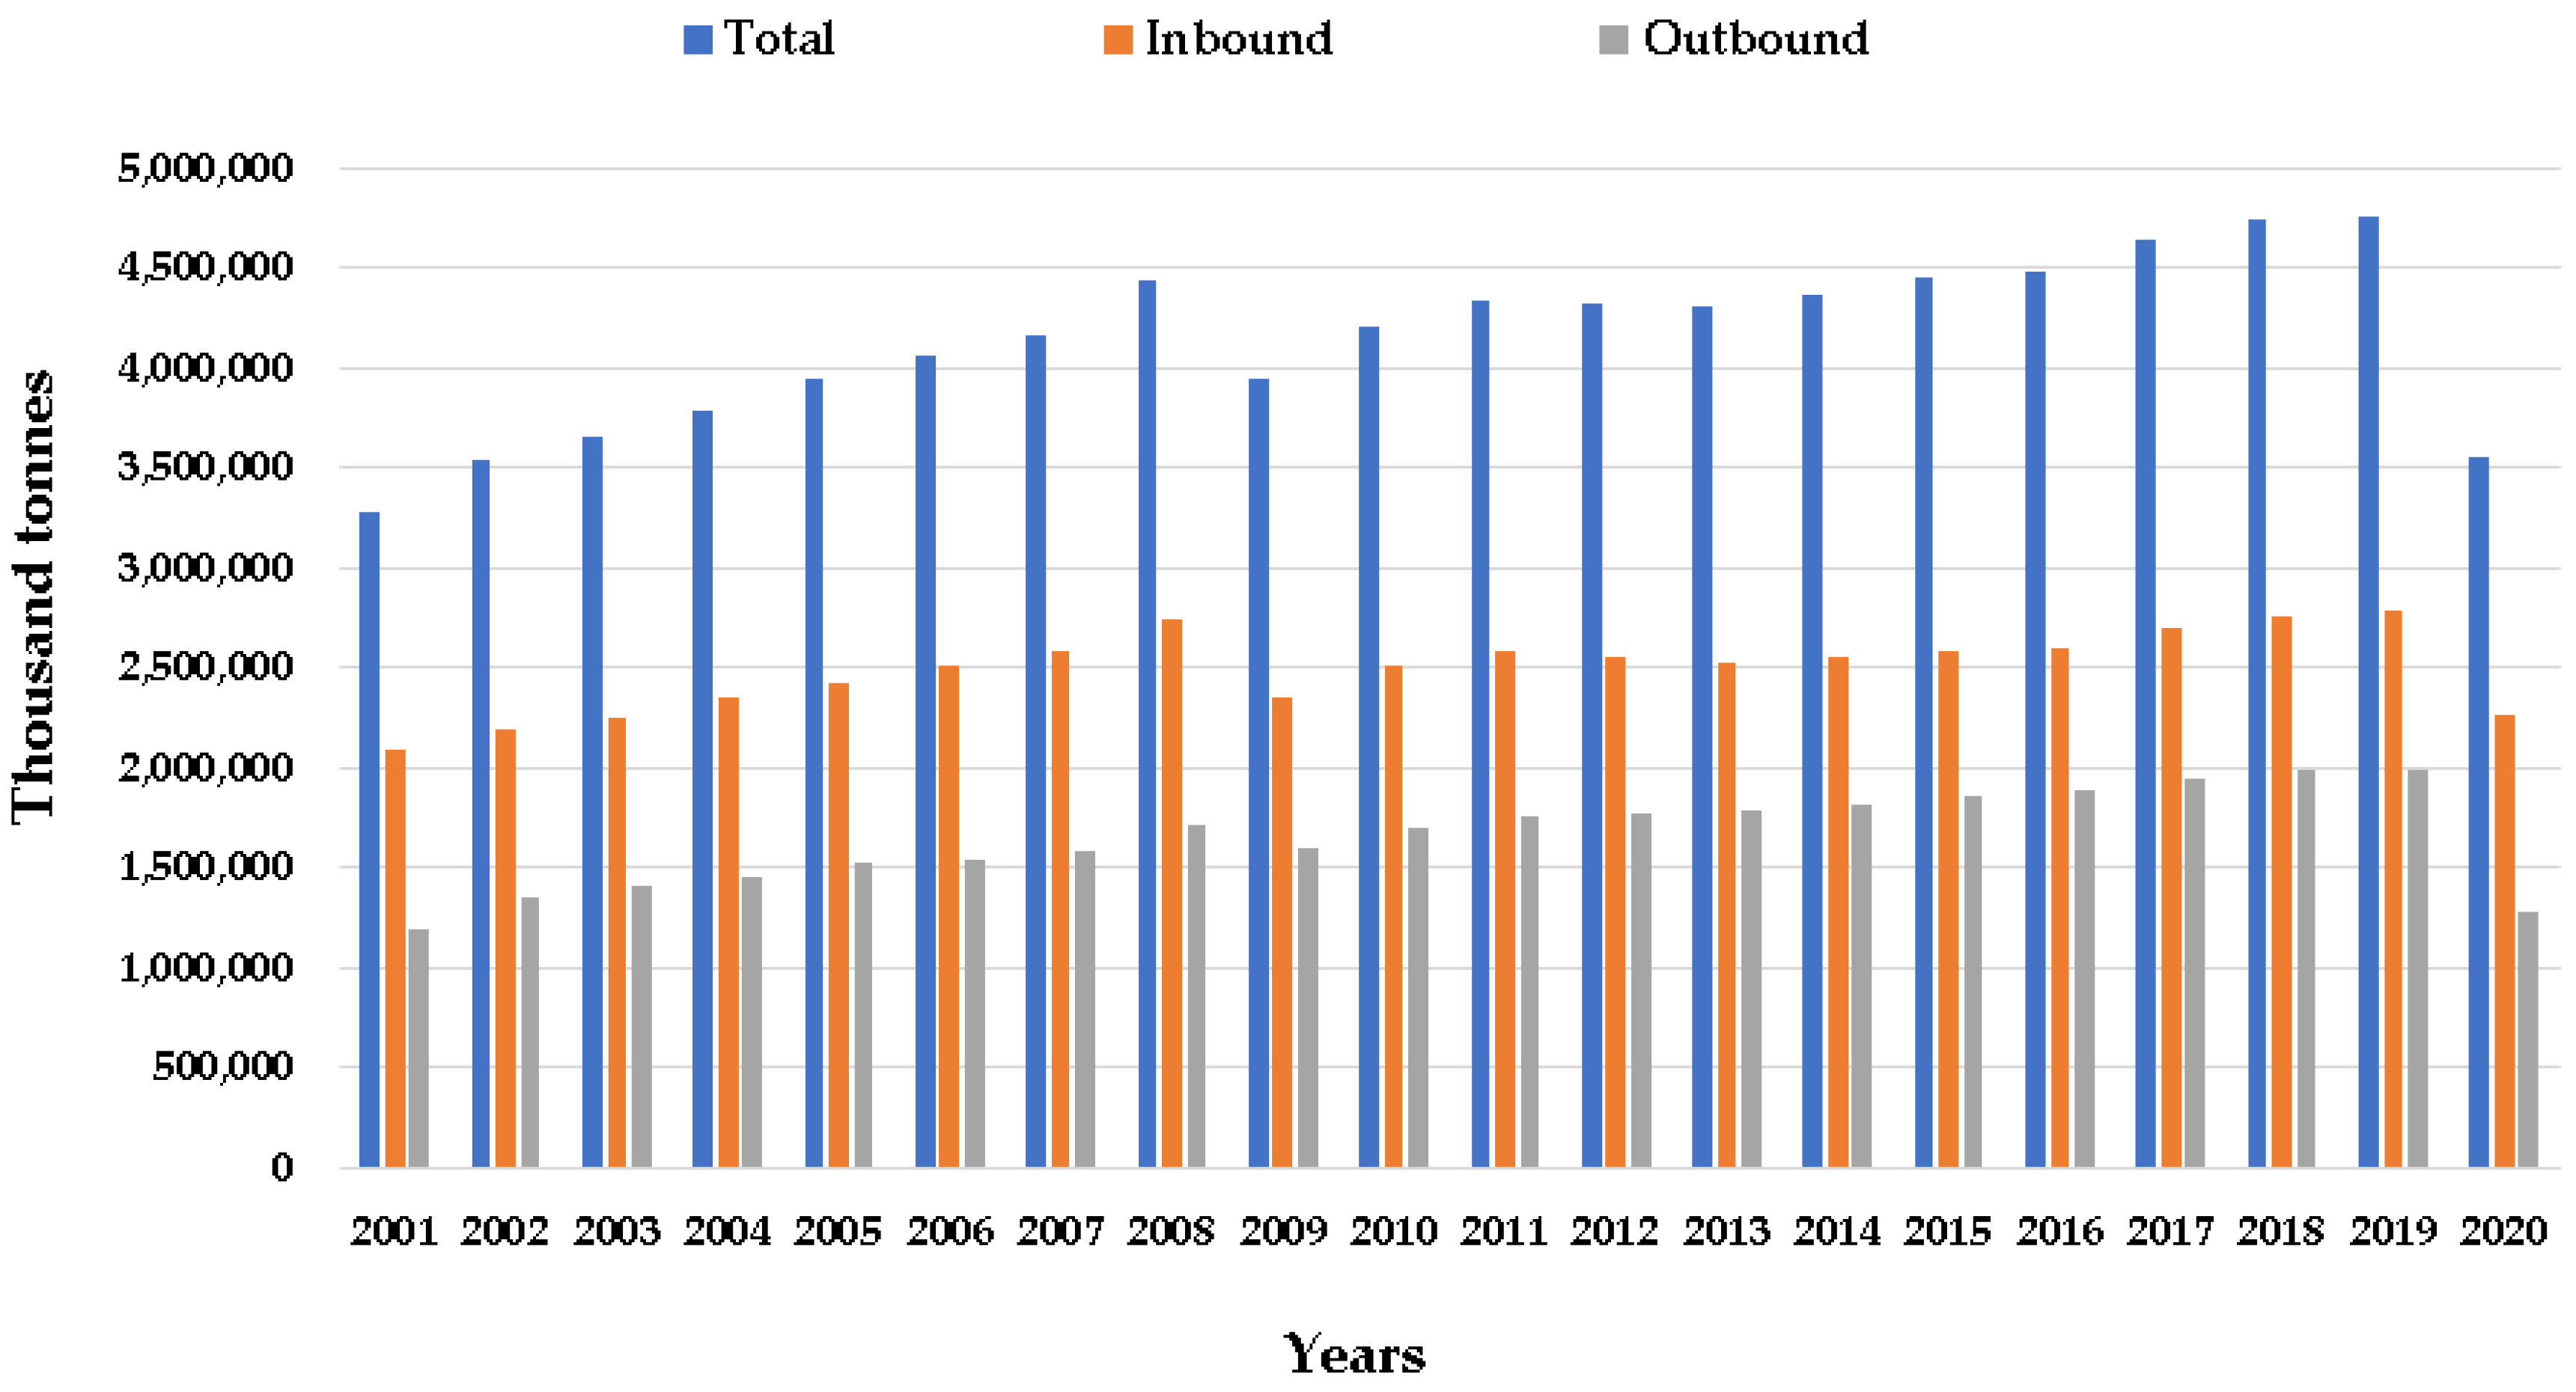
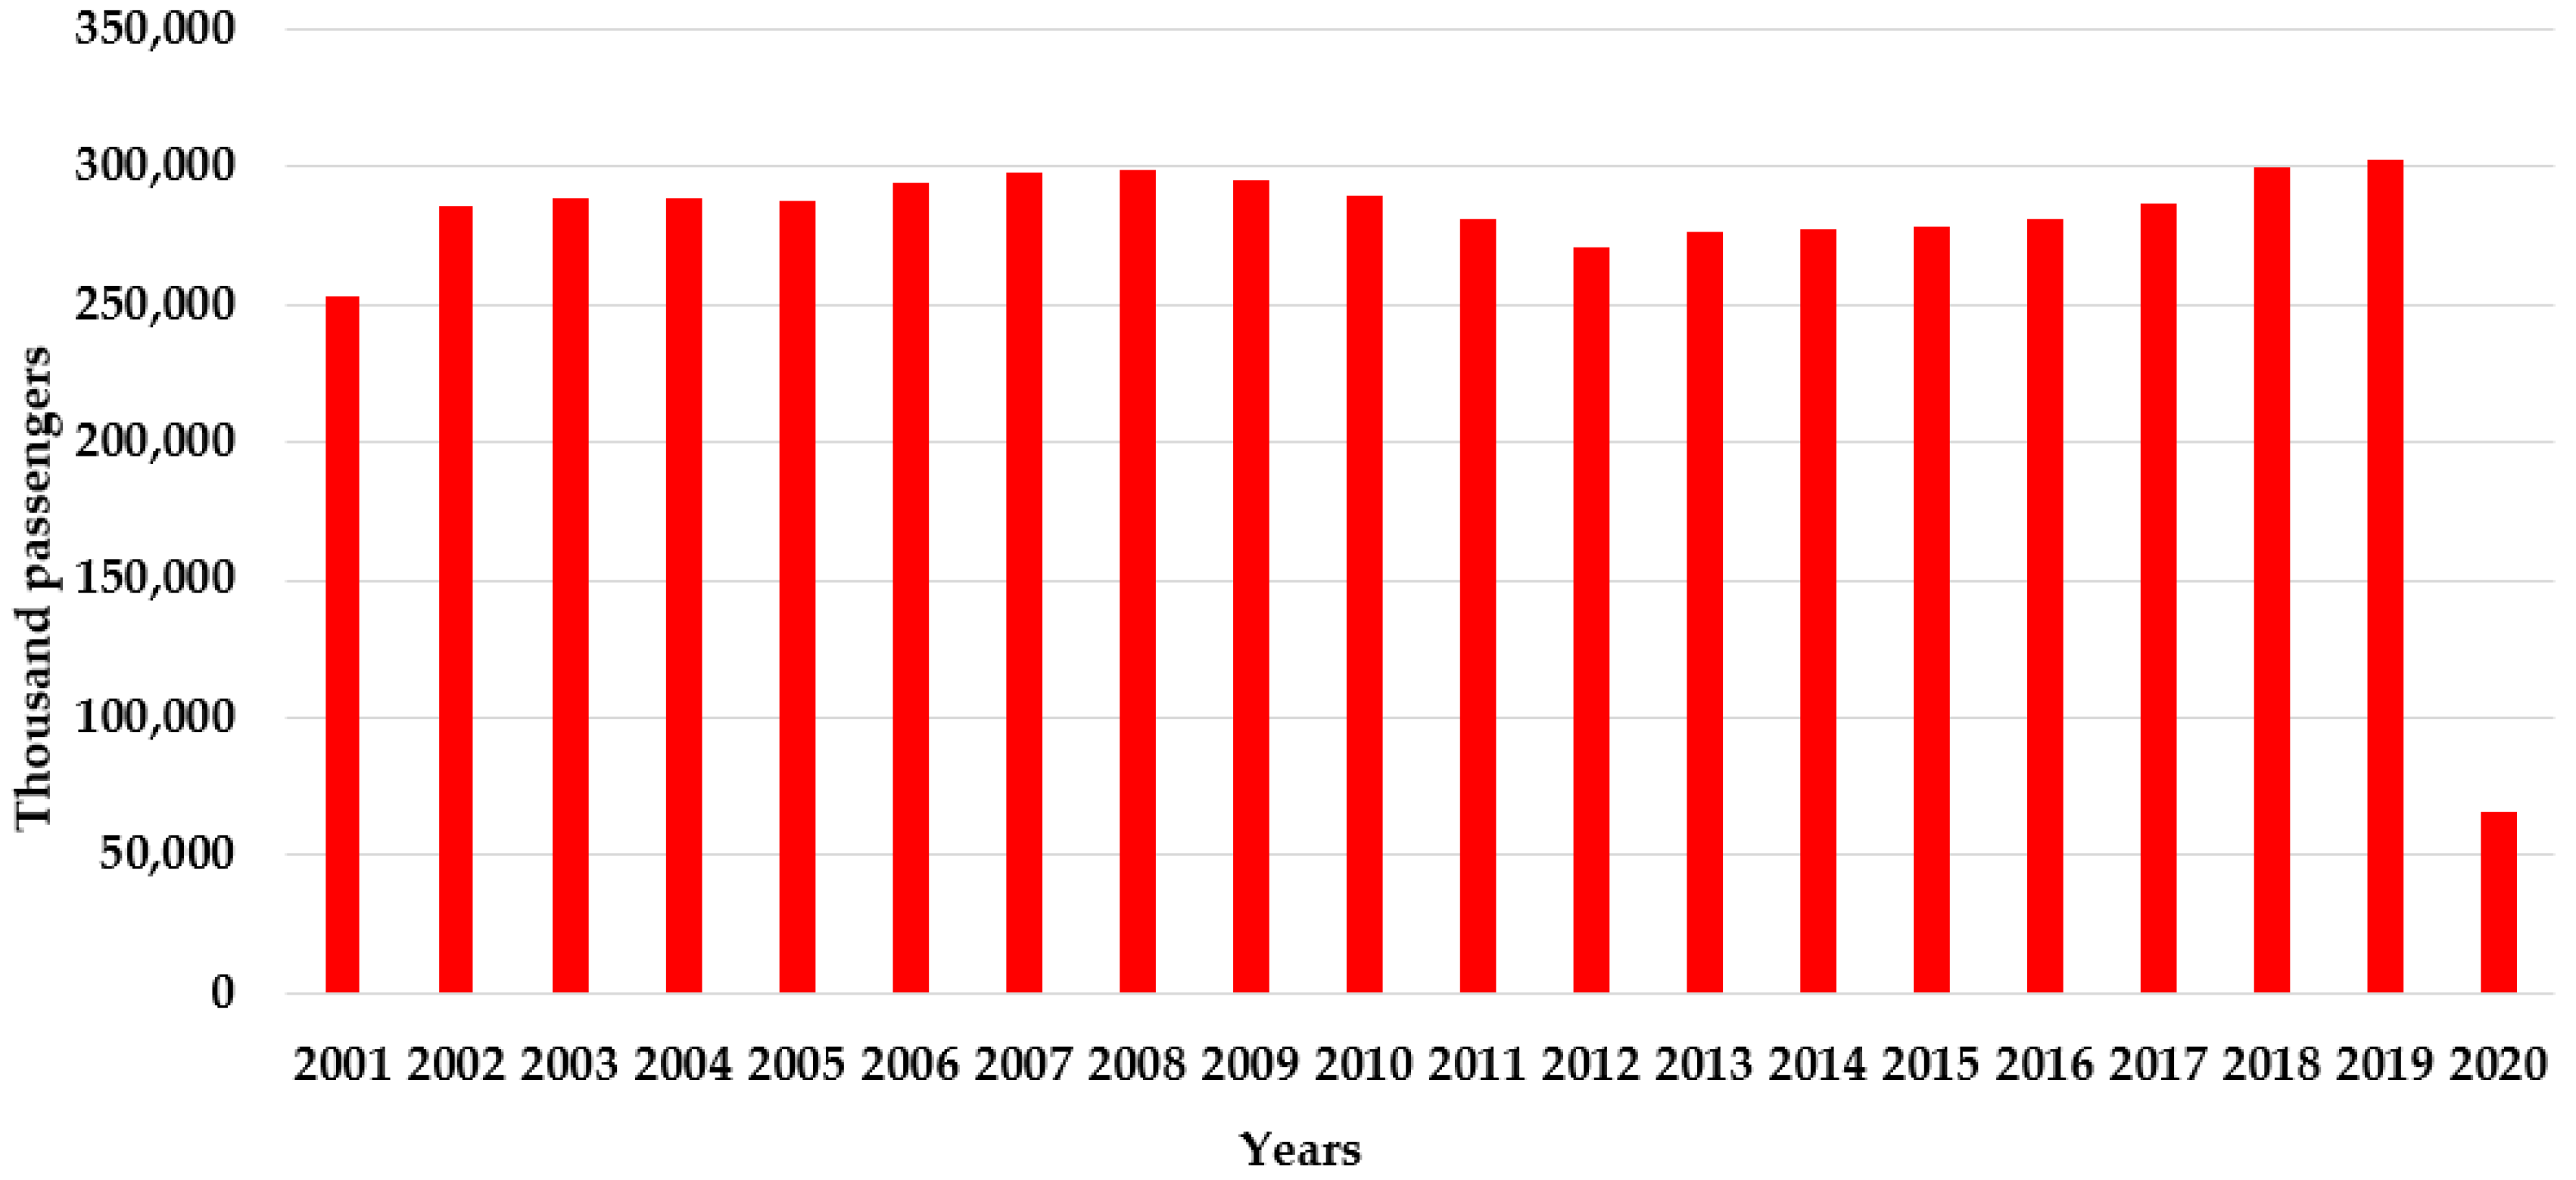
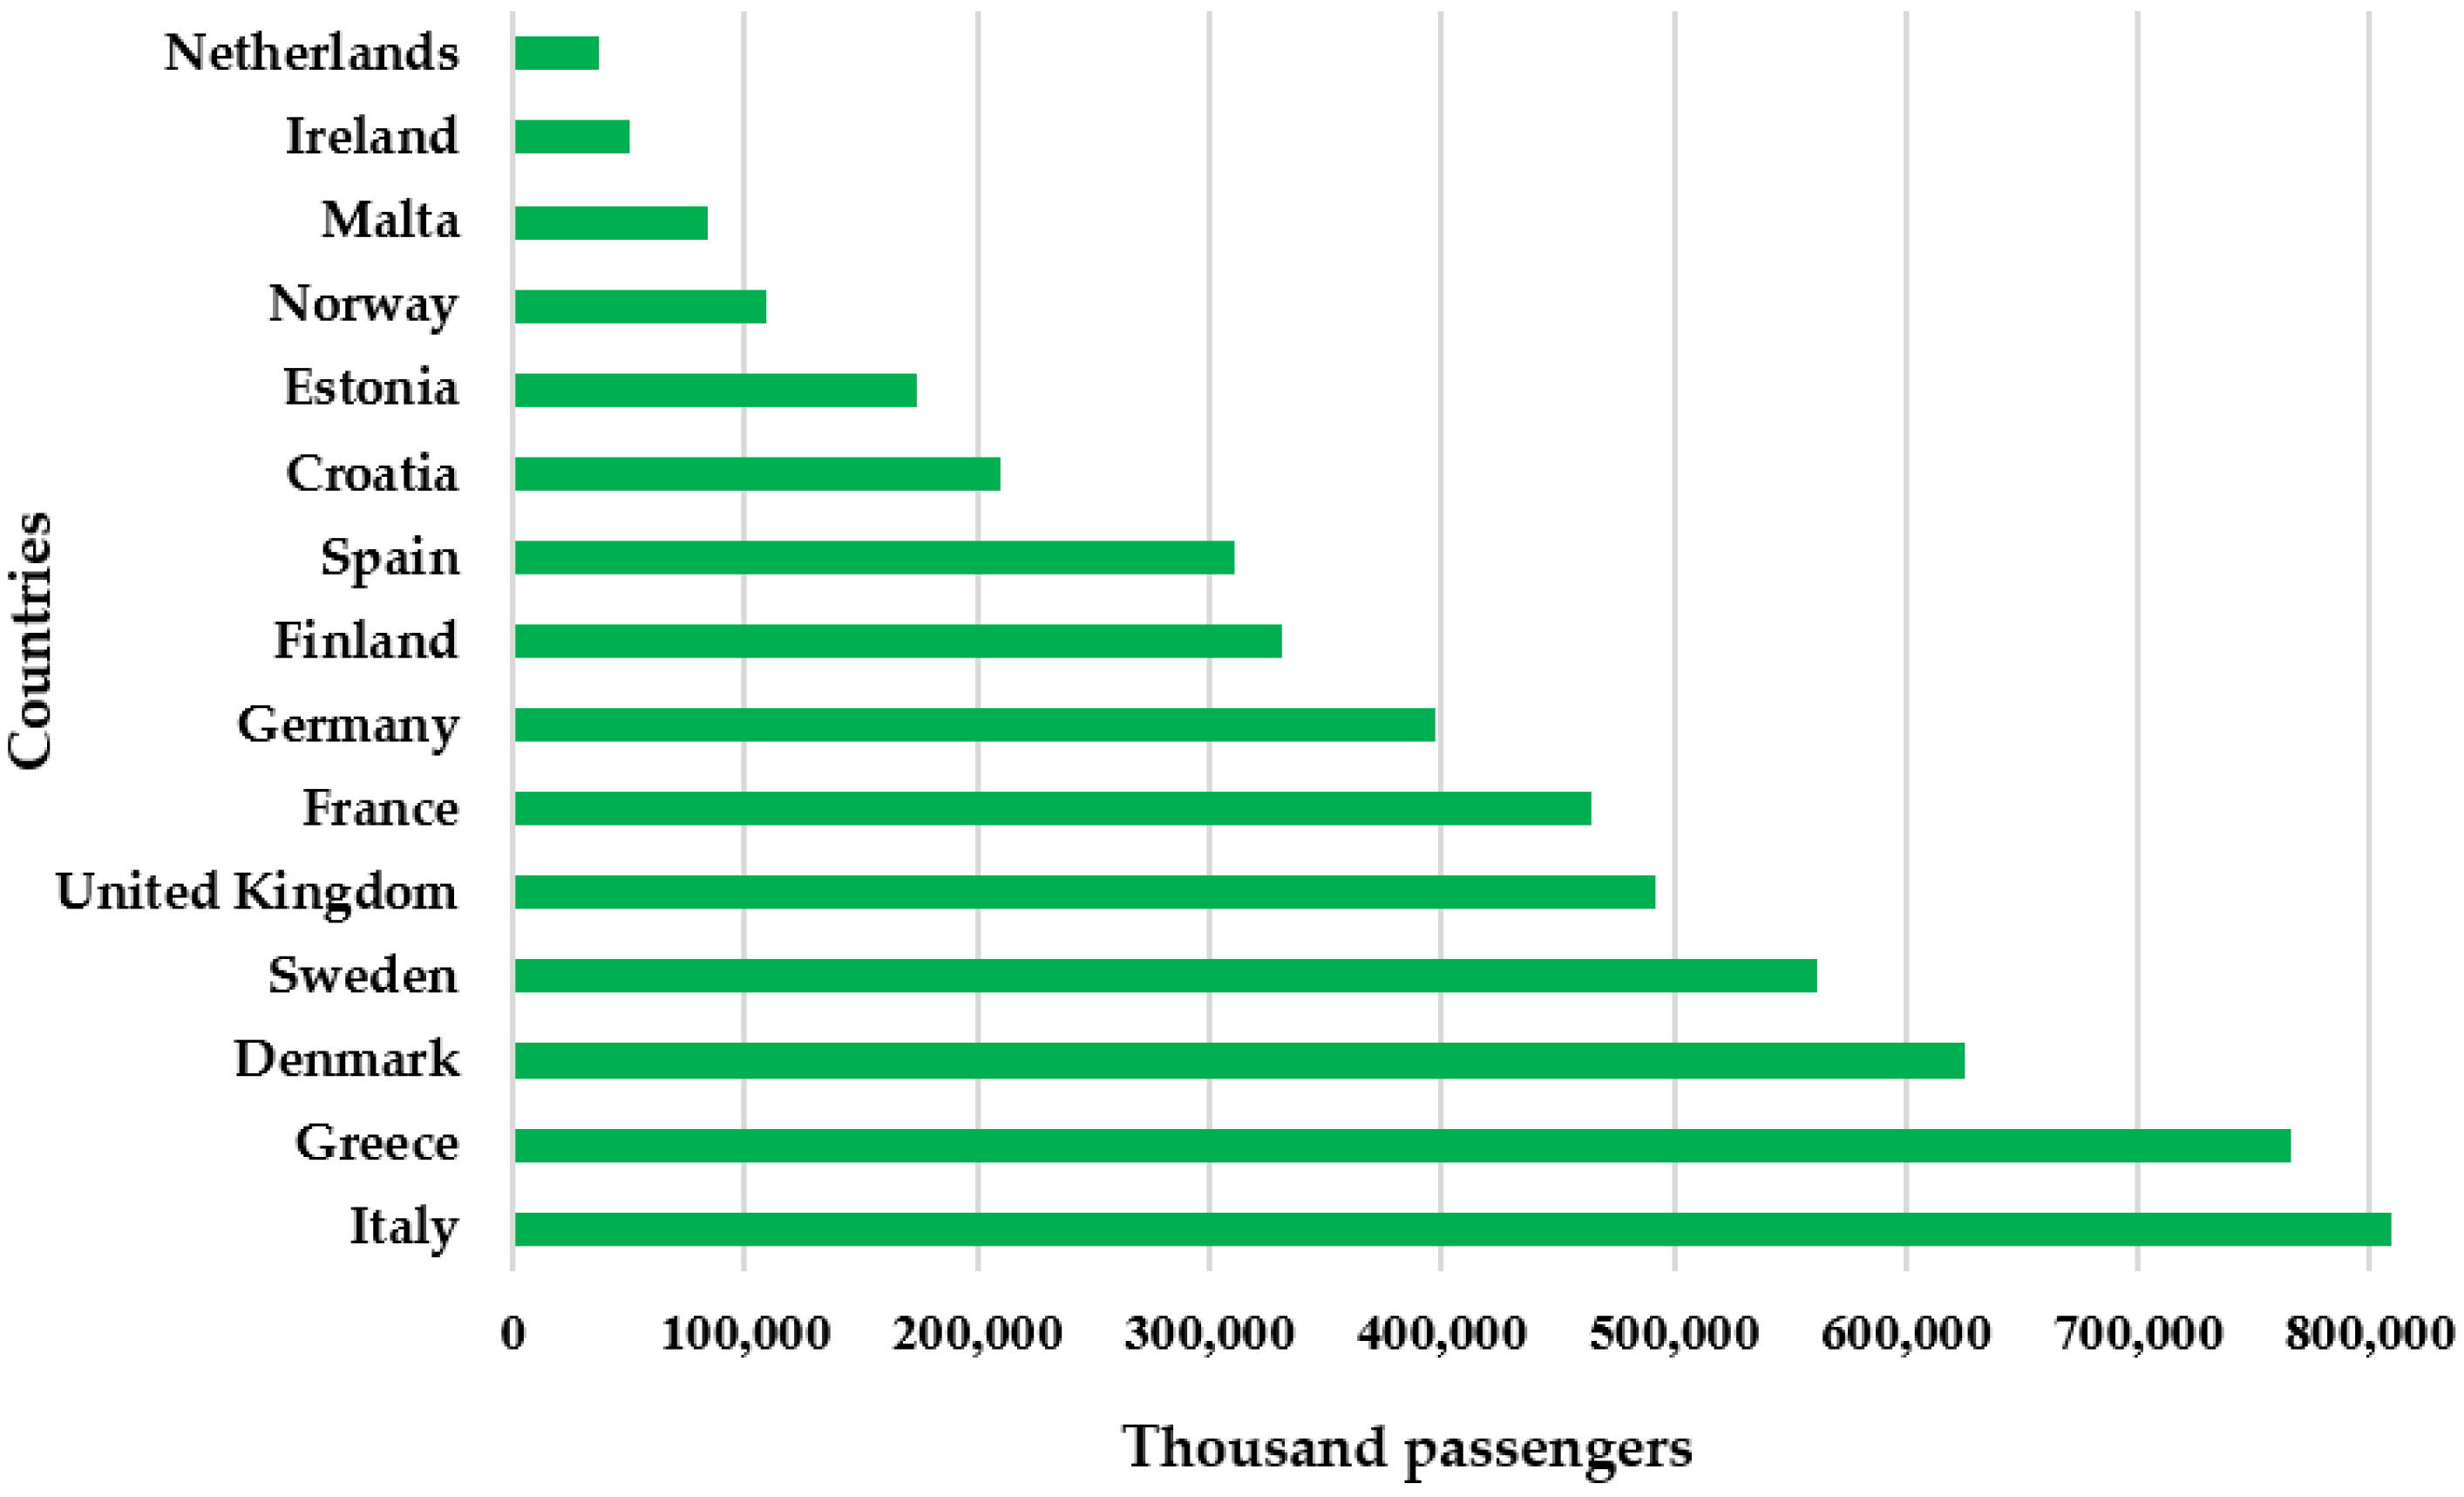
2. Marine Traffic
3. Data Used in the Climate Analysis
4. Analysis of Wind Climate
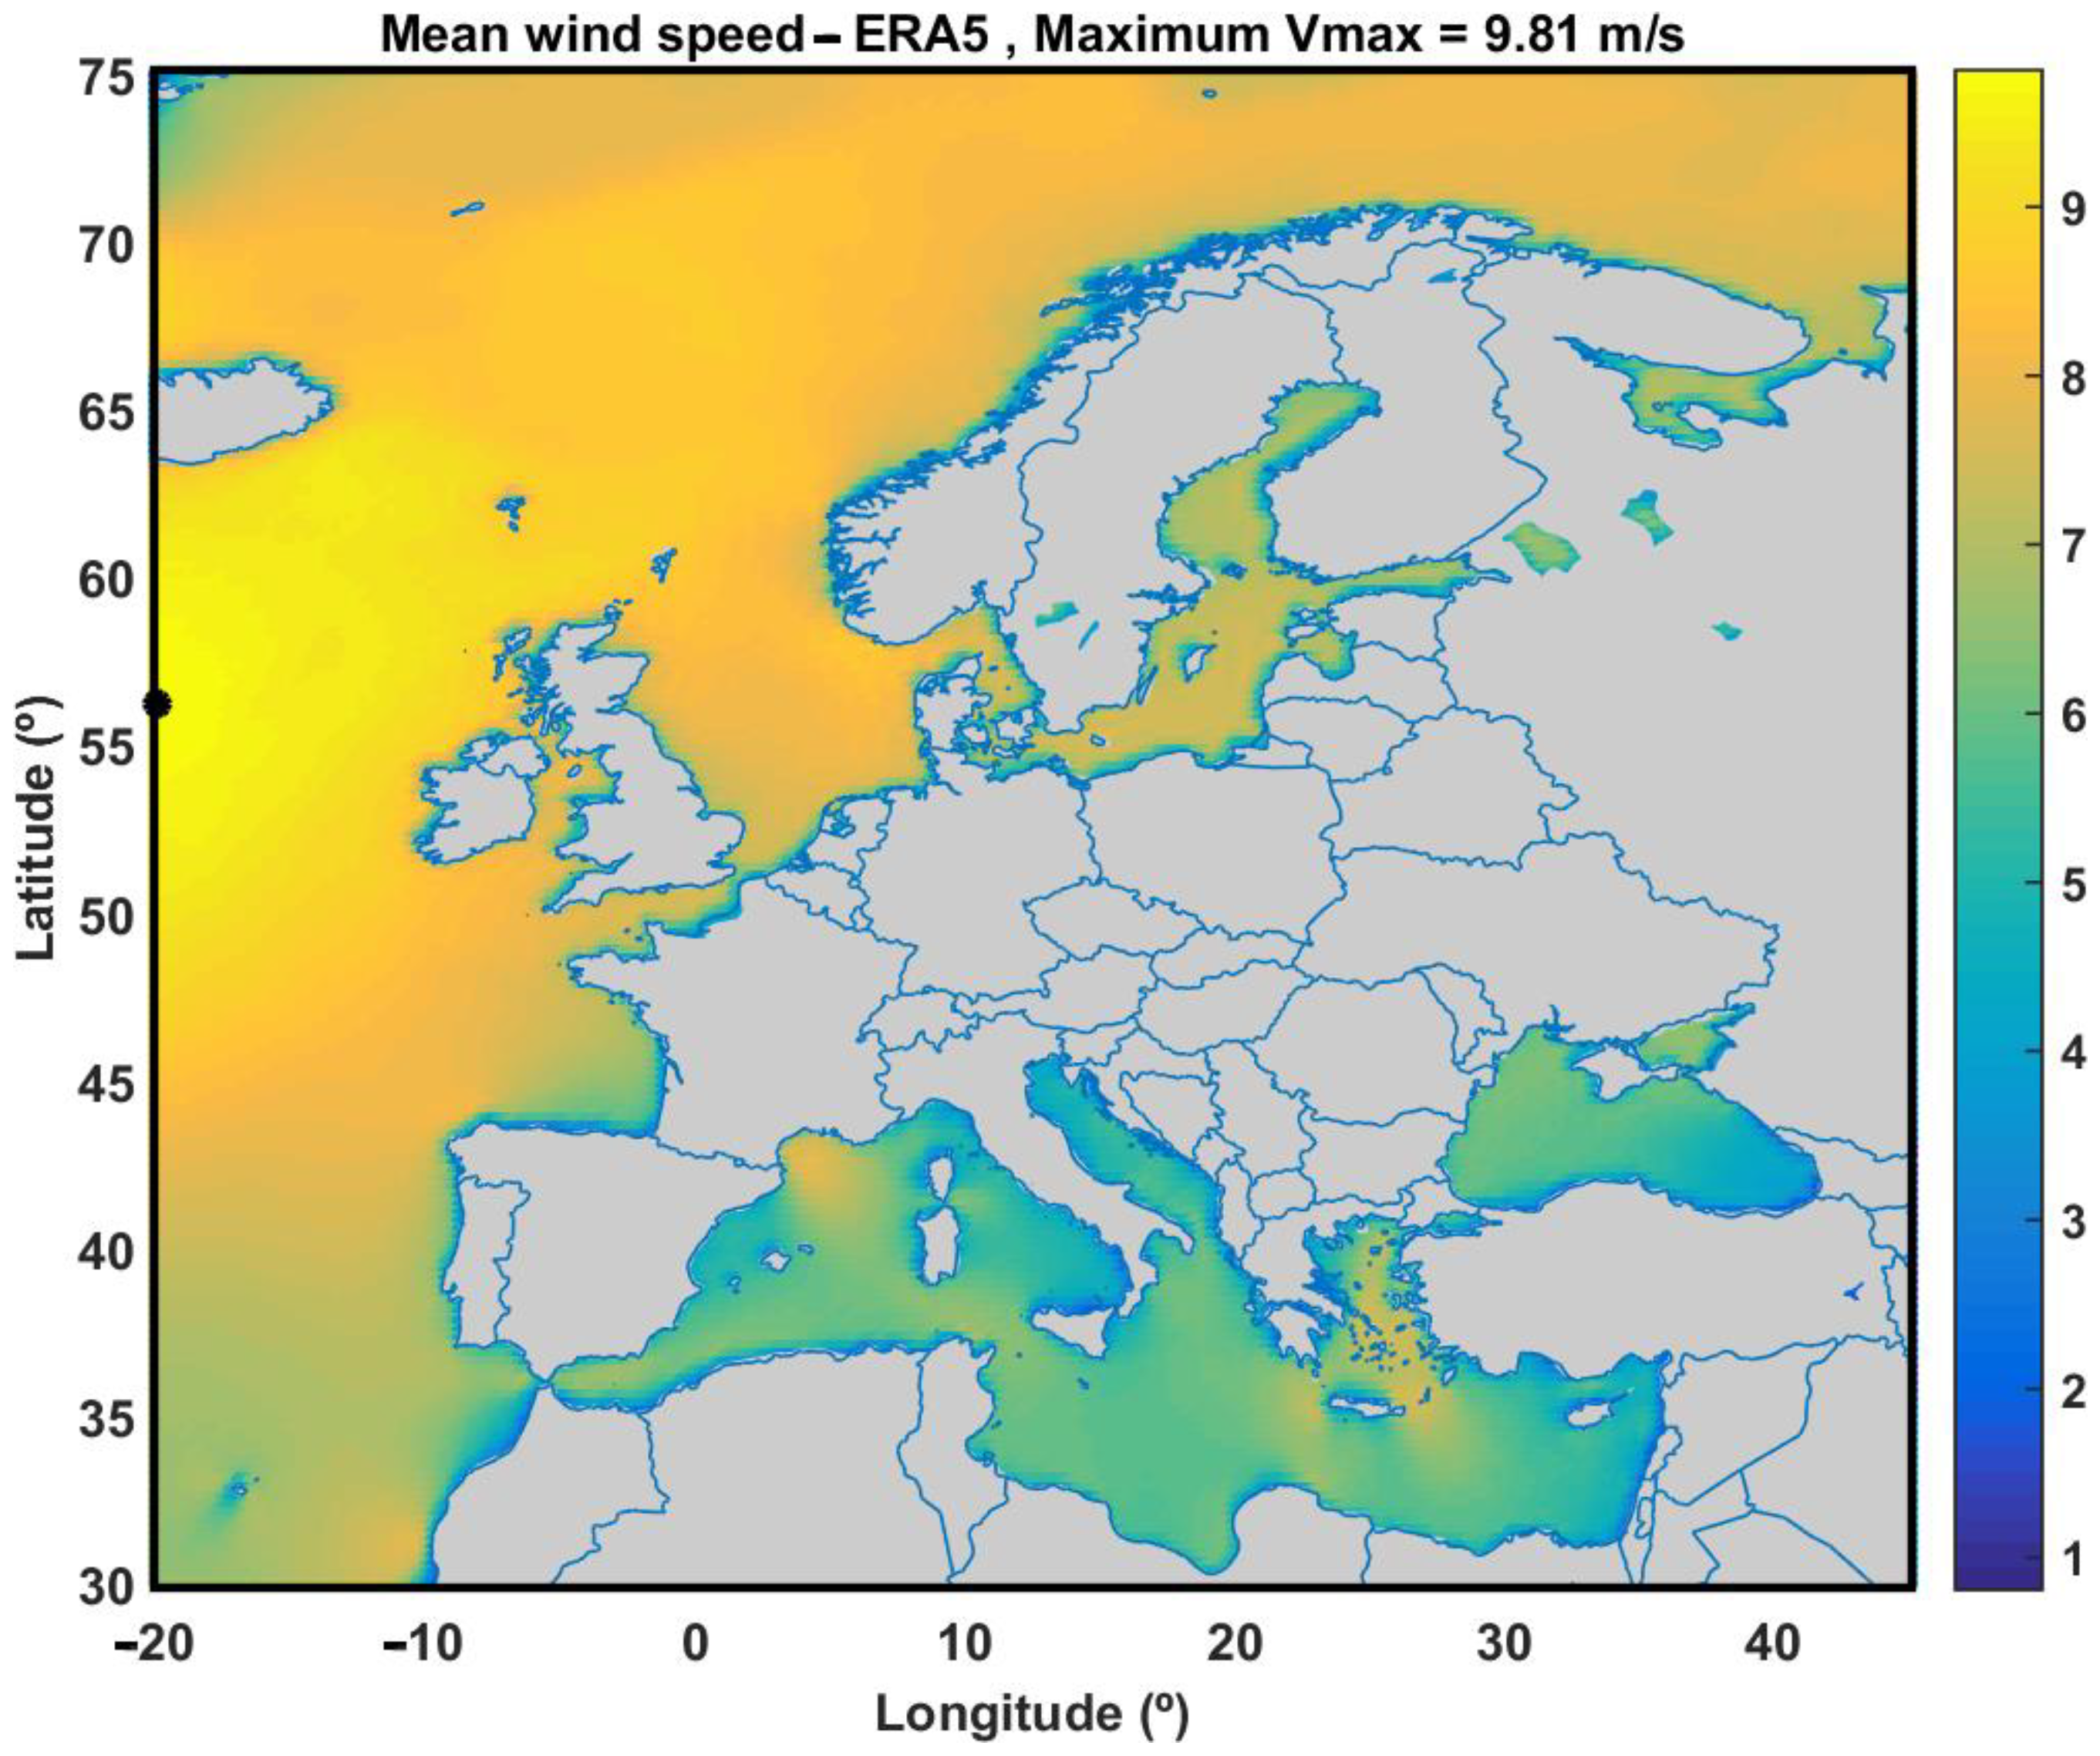
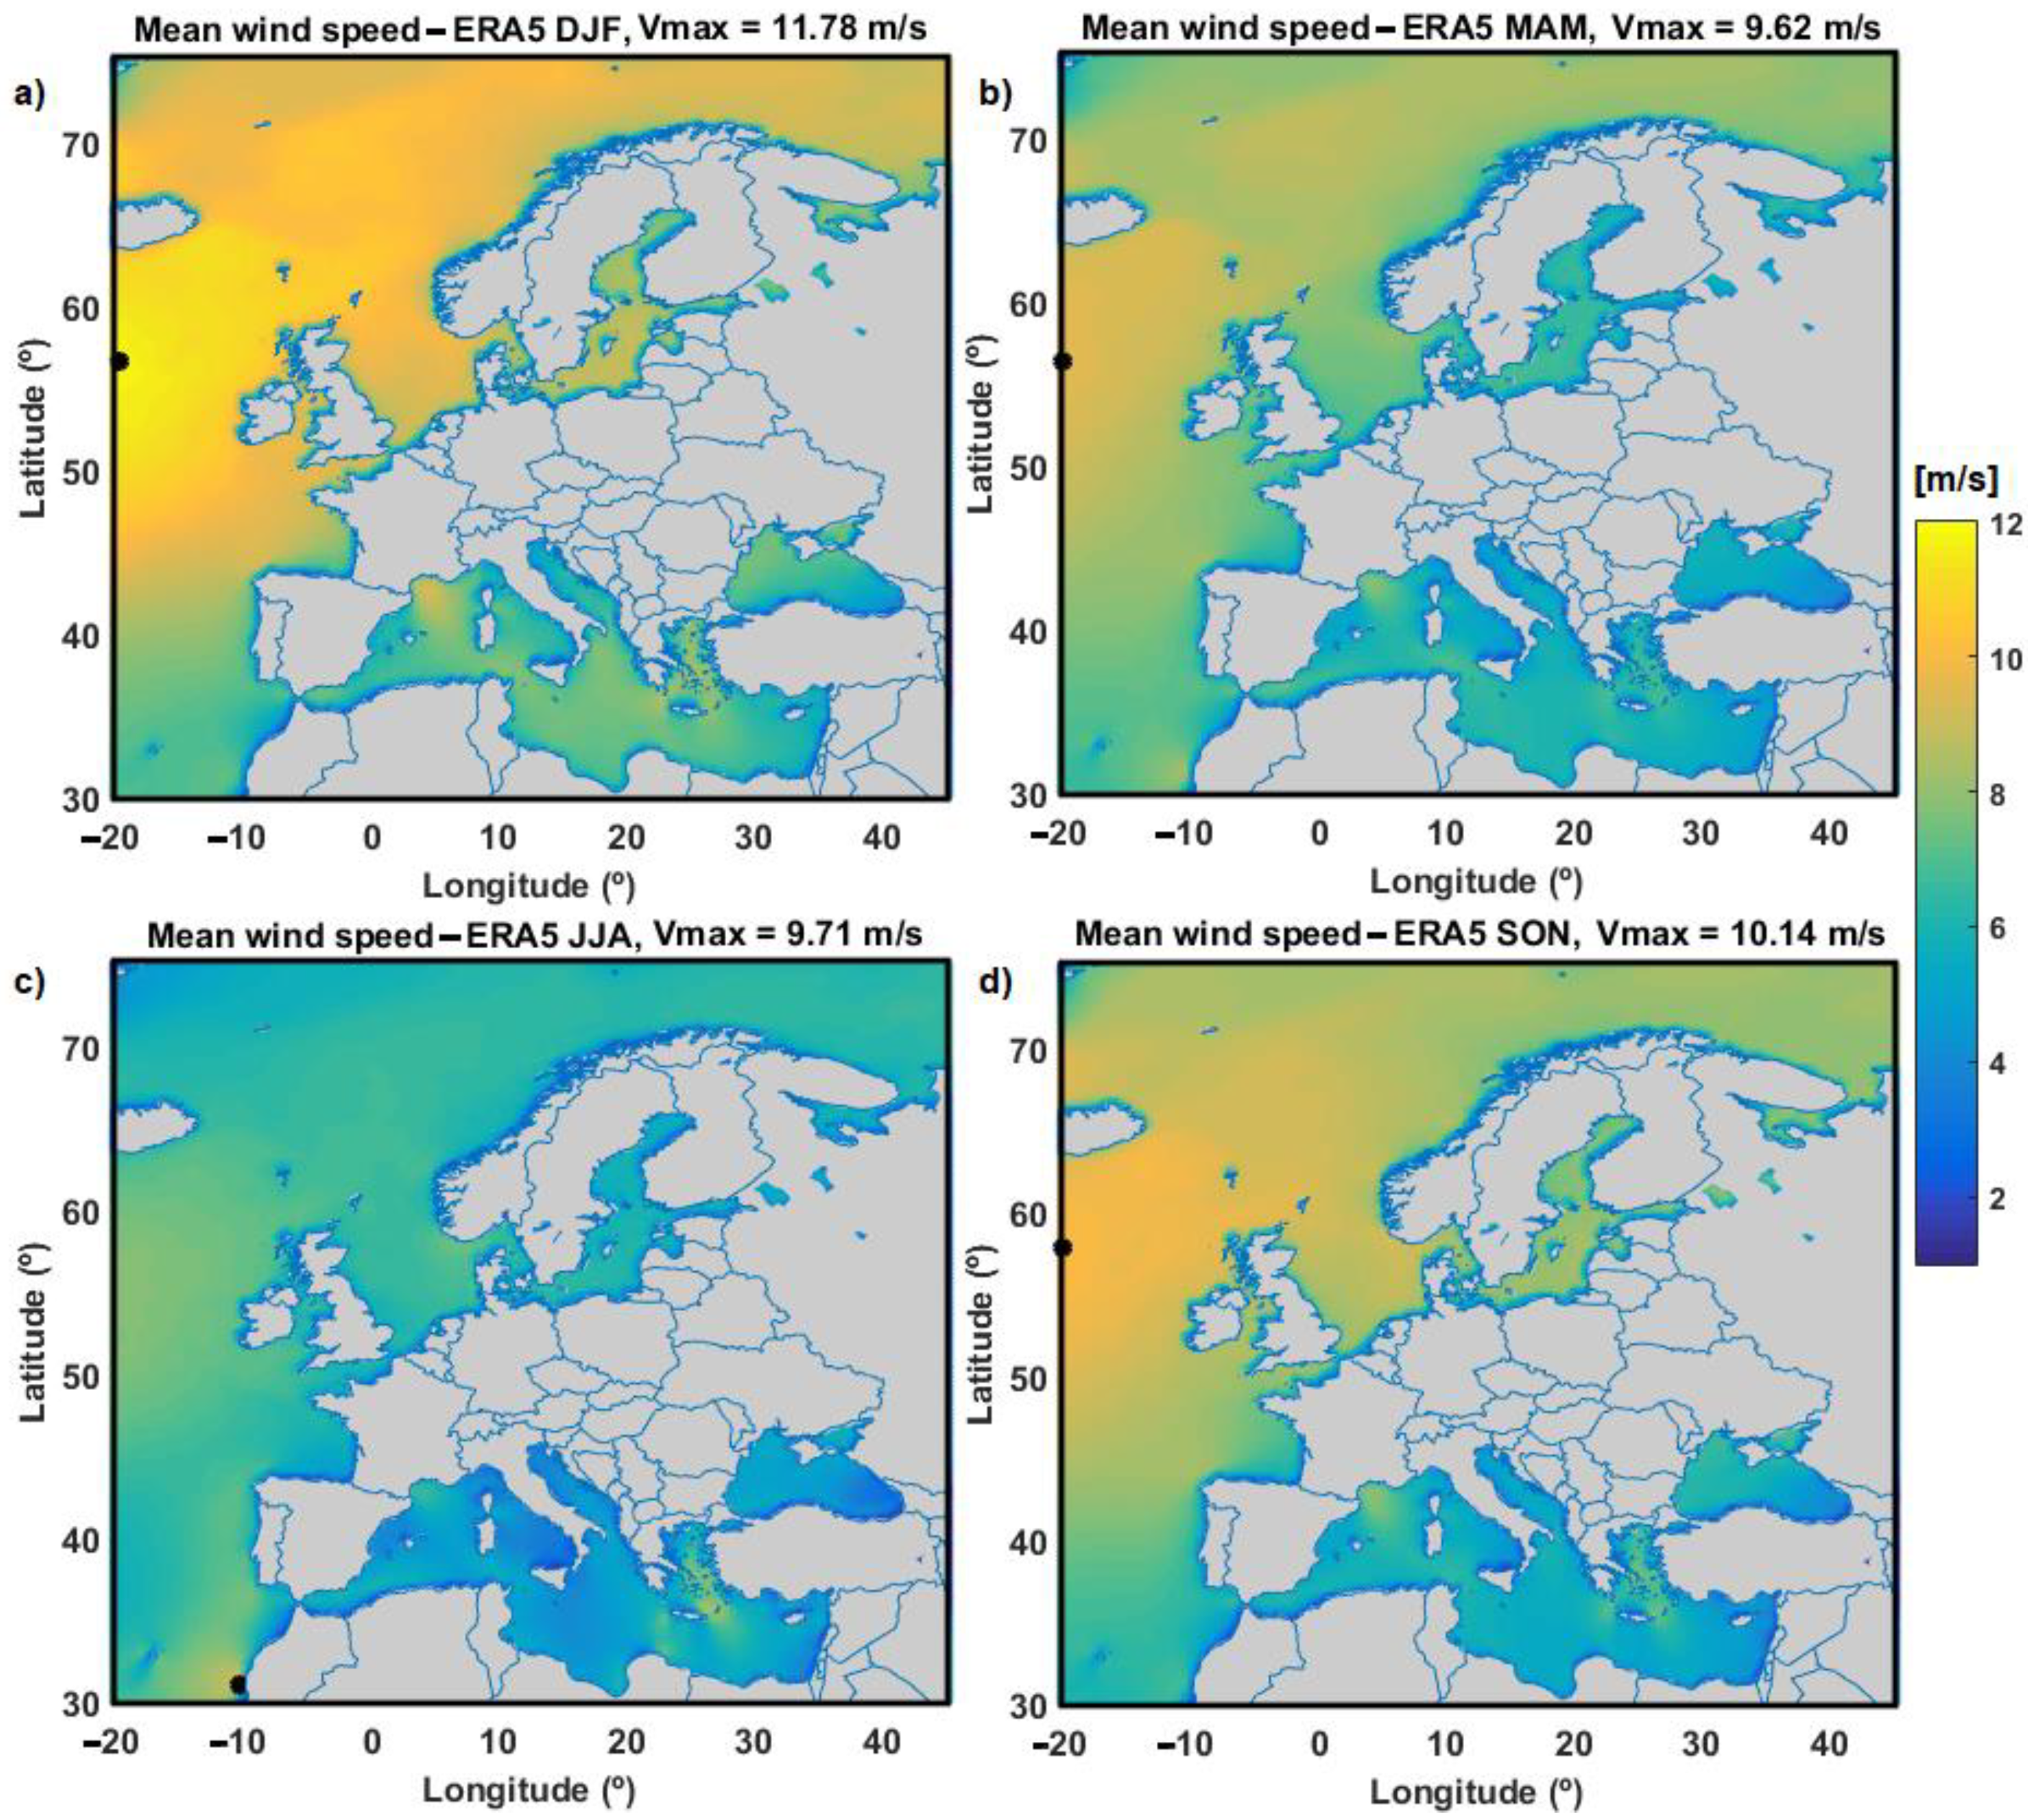
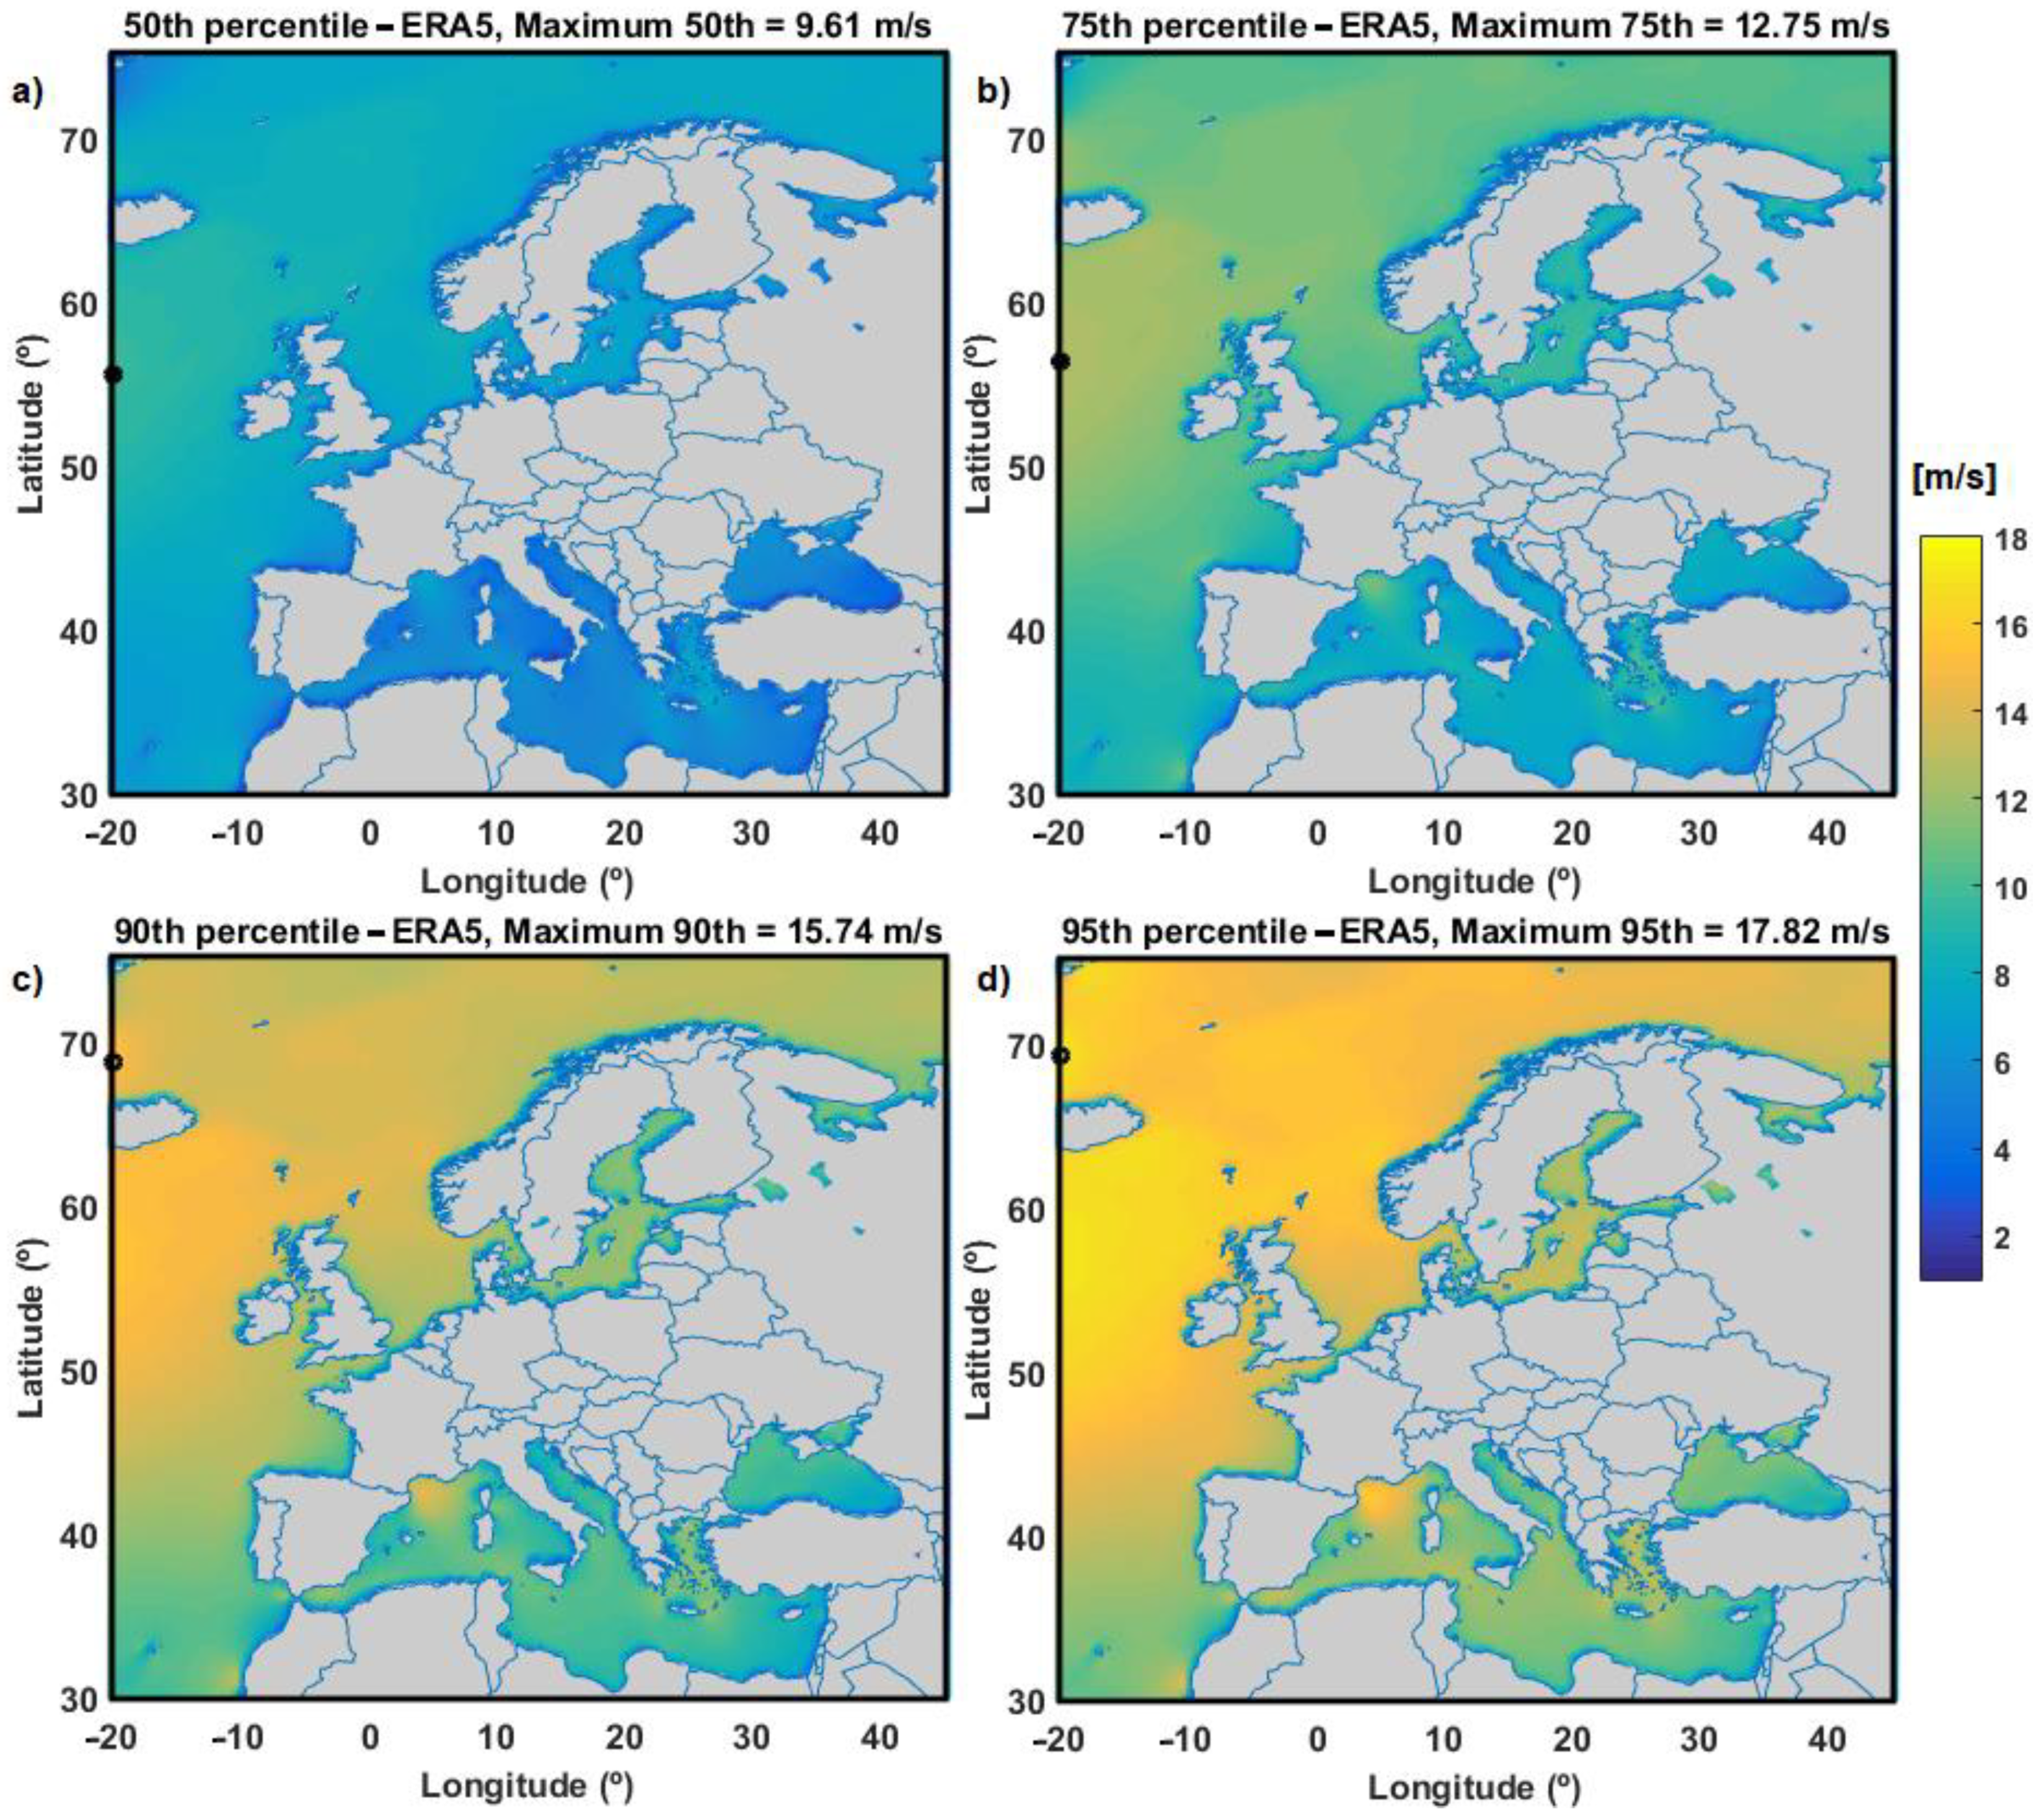
4.1. Wind Climate in the European Seas
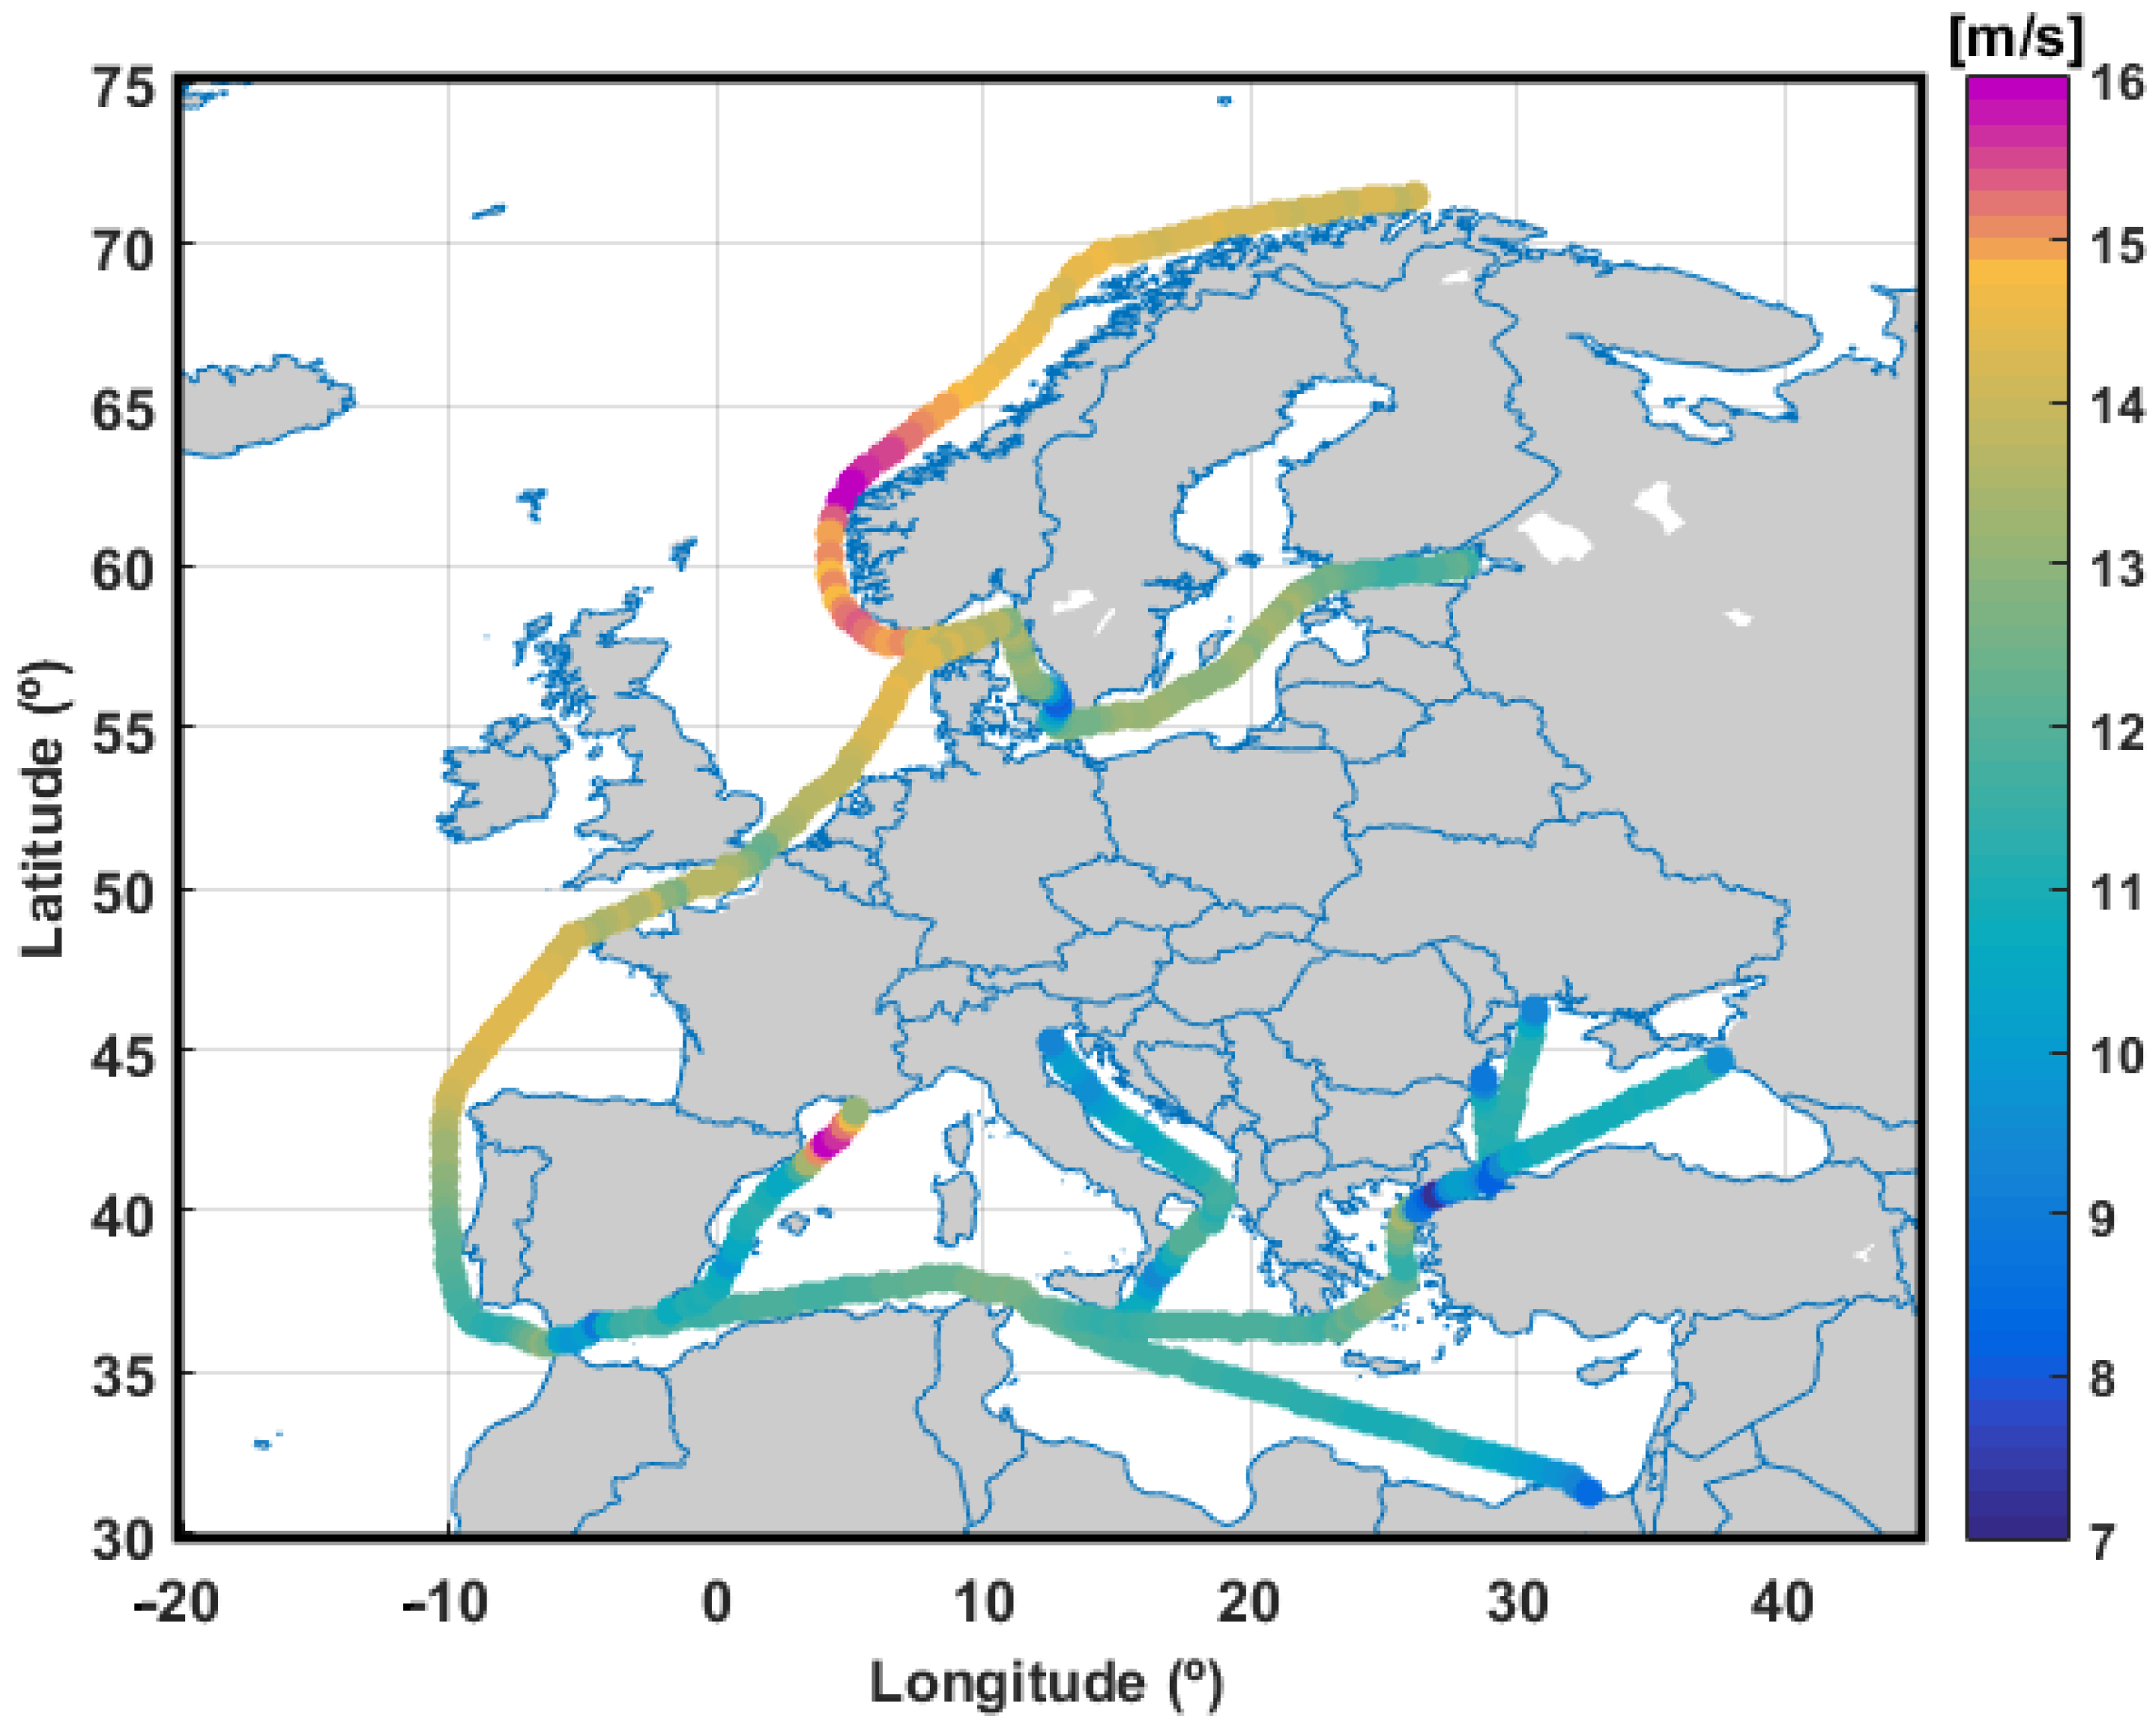
4.2. Extreme Wind Conditions along the Maritime Routes
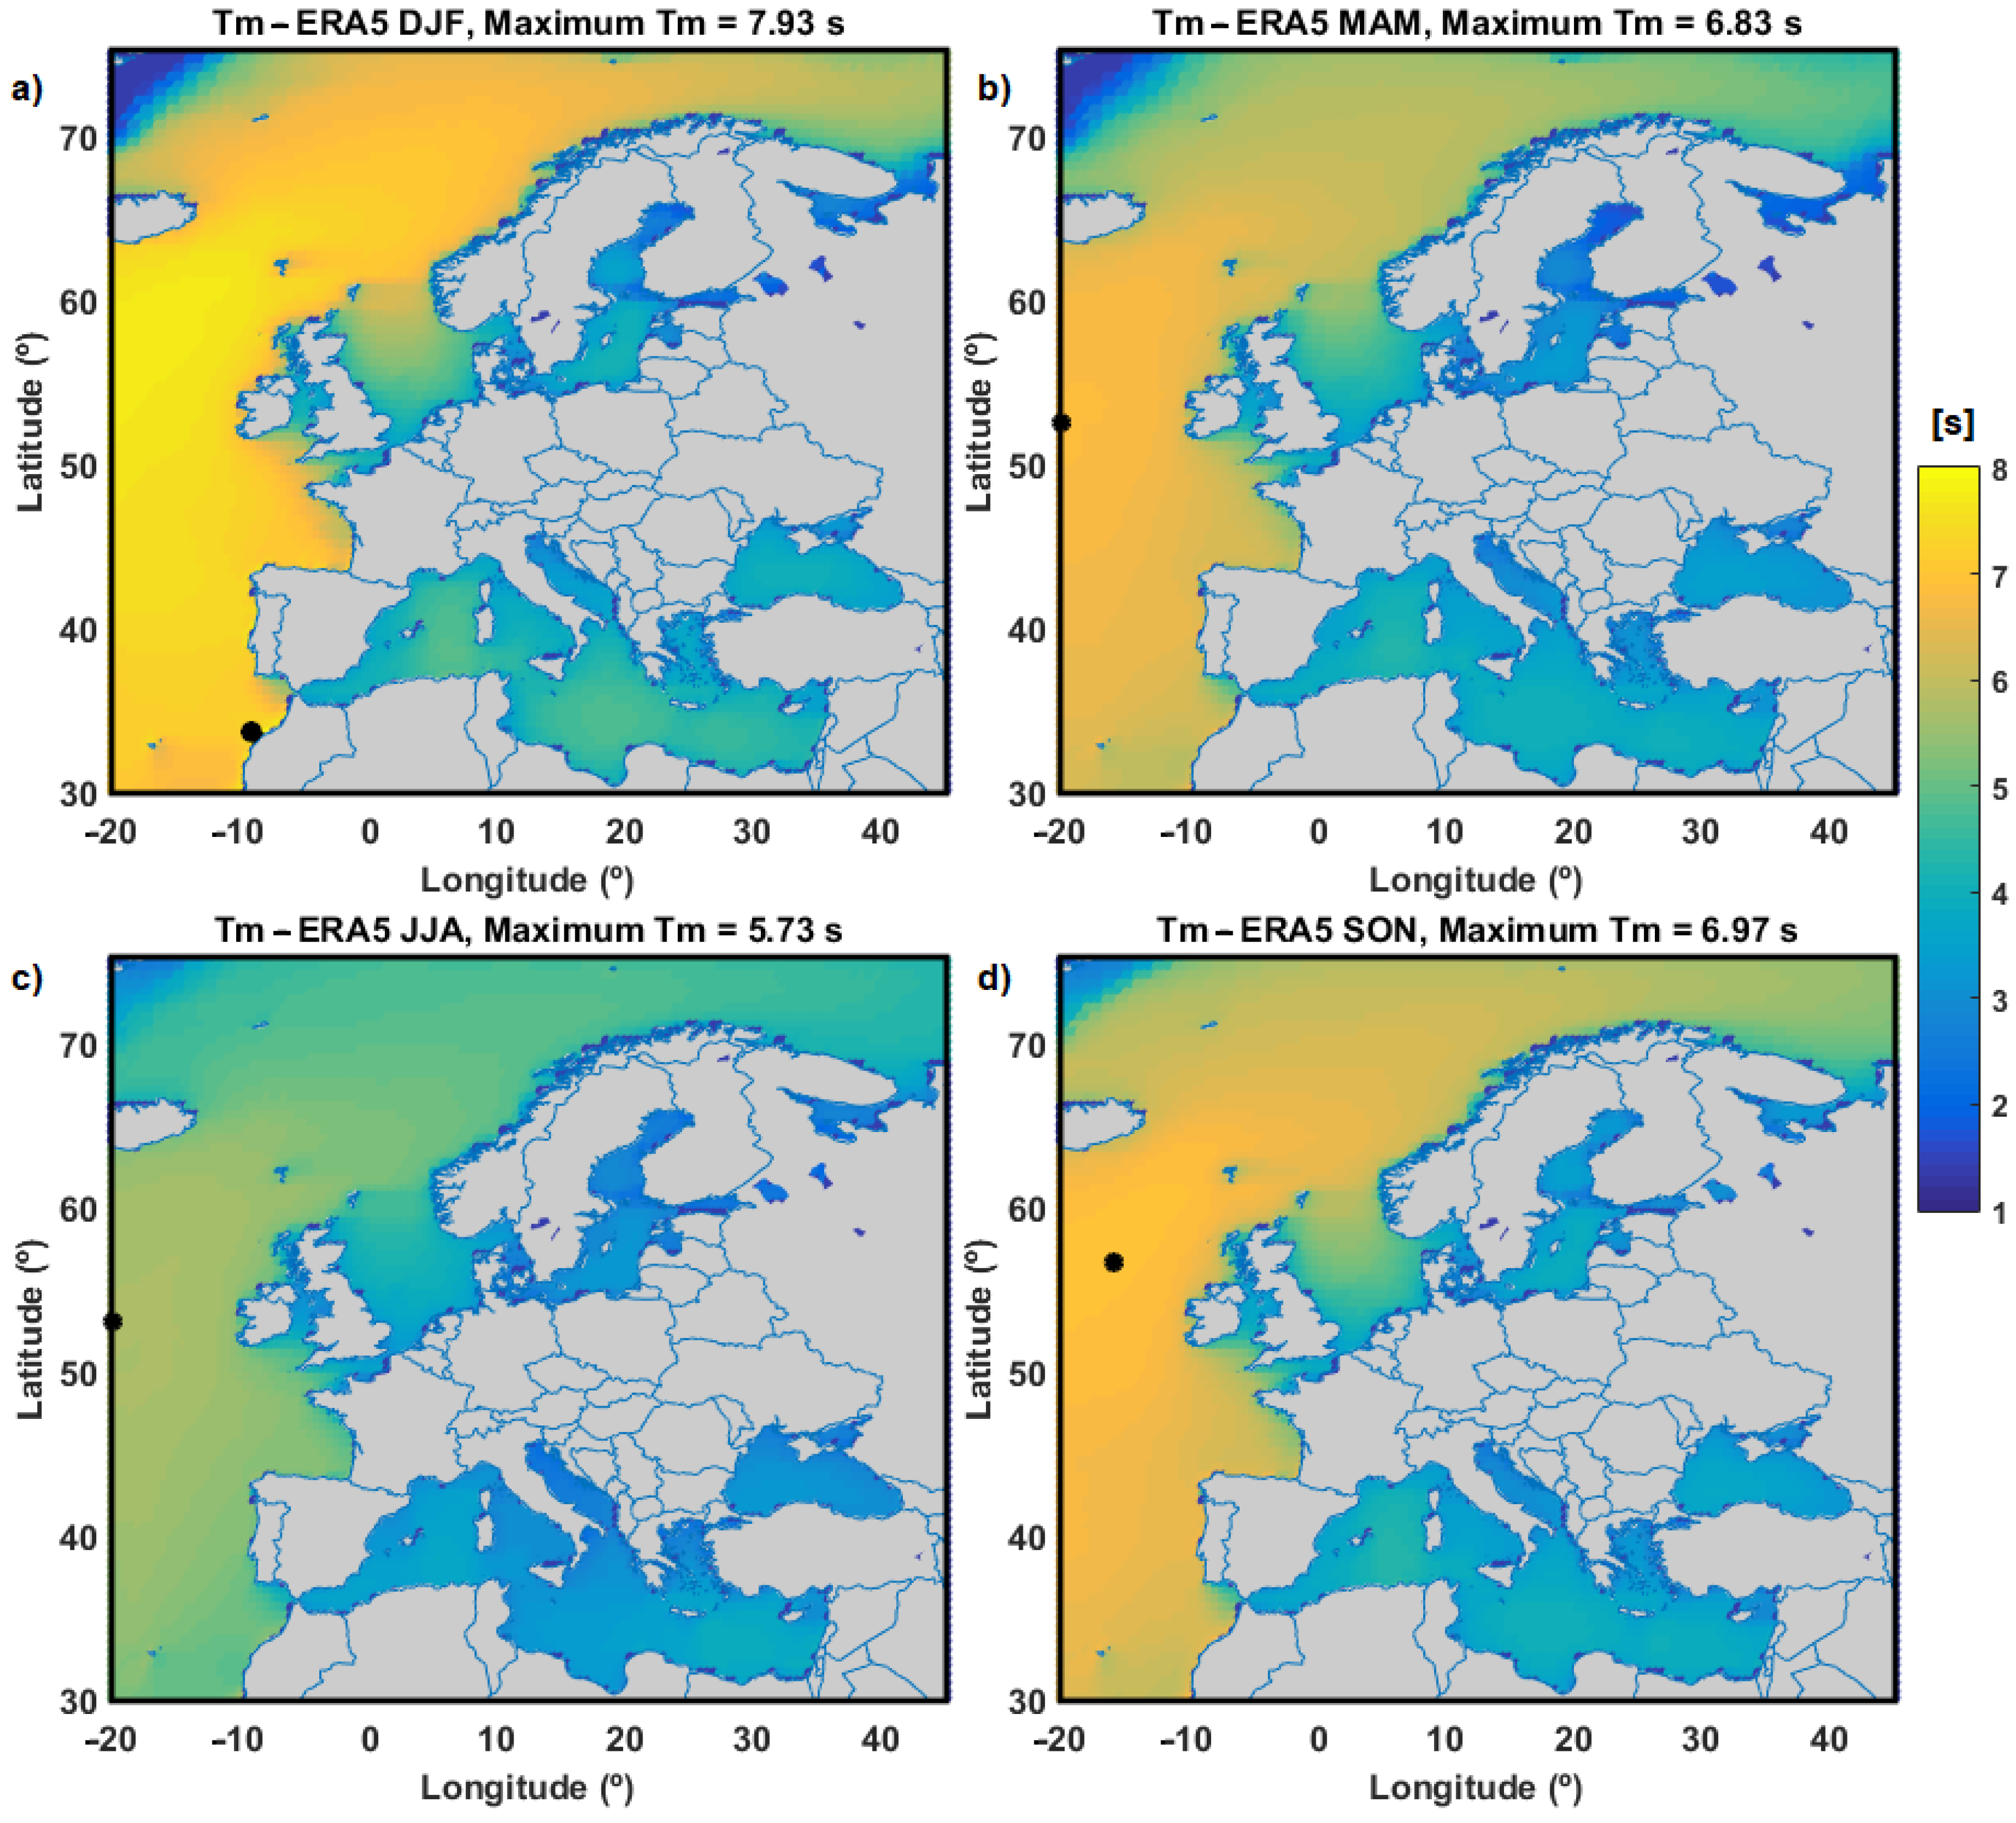
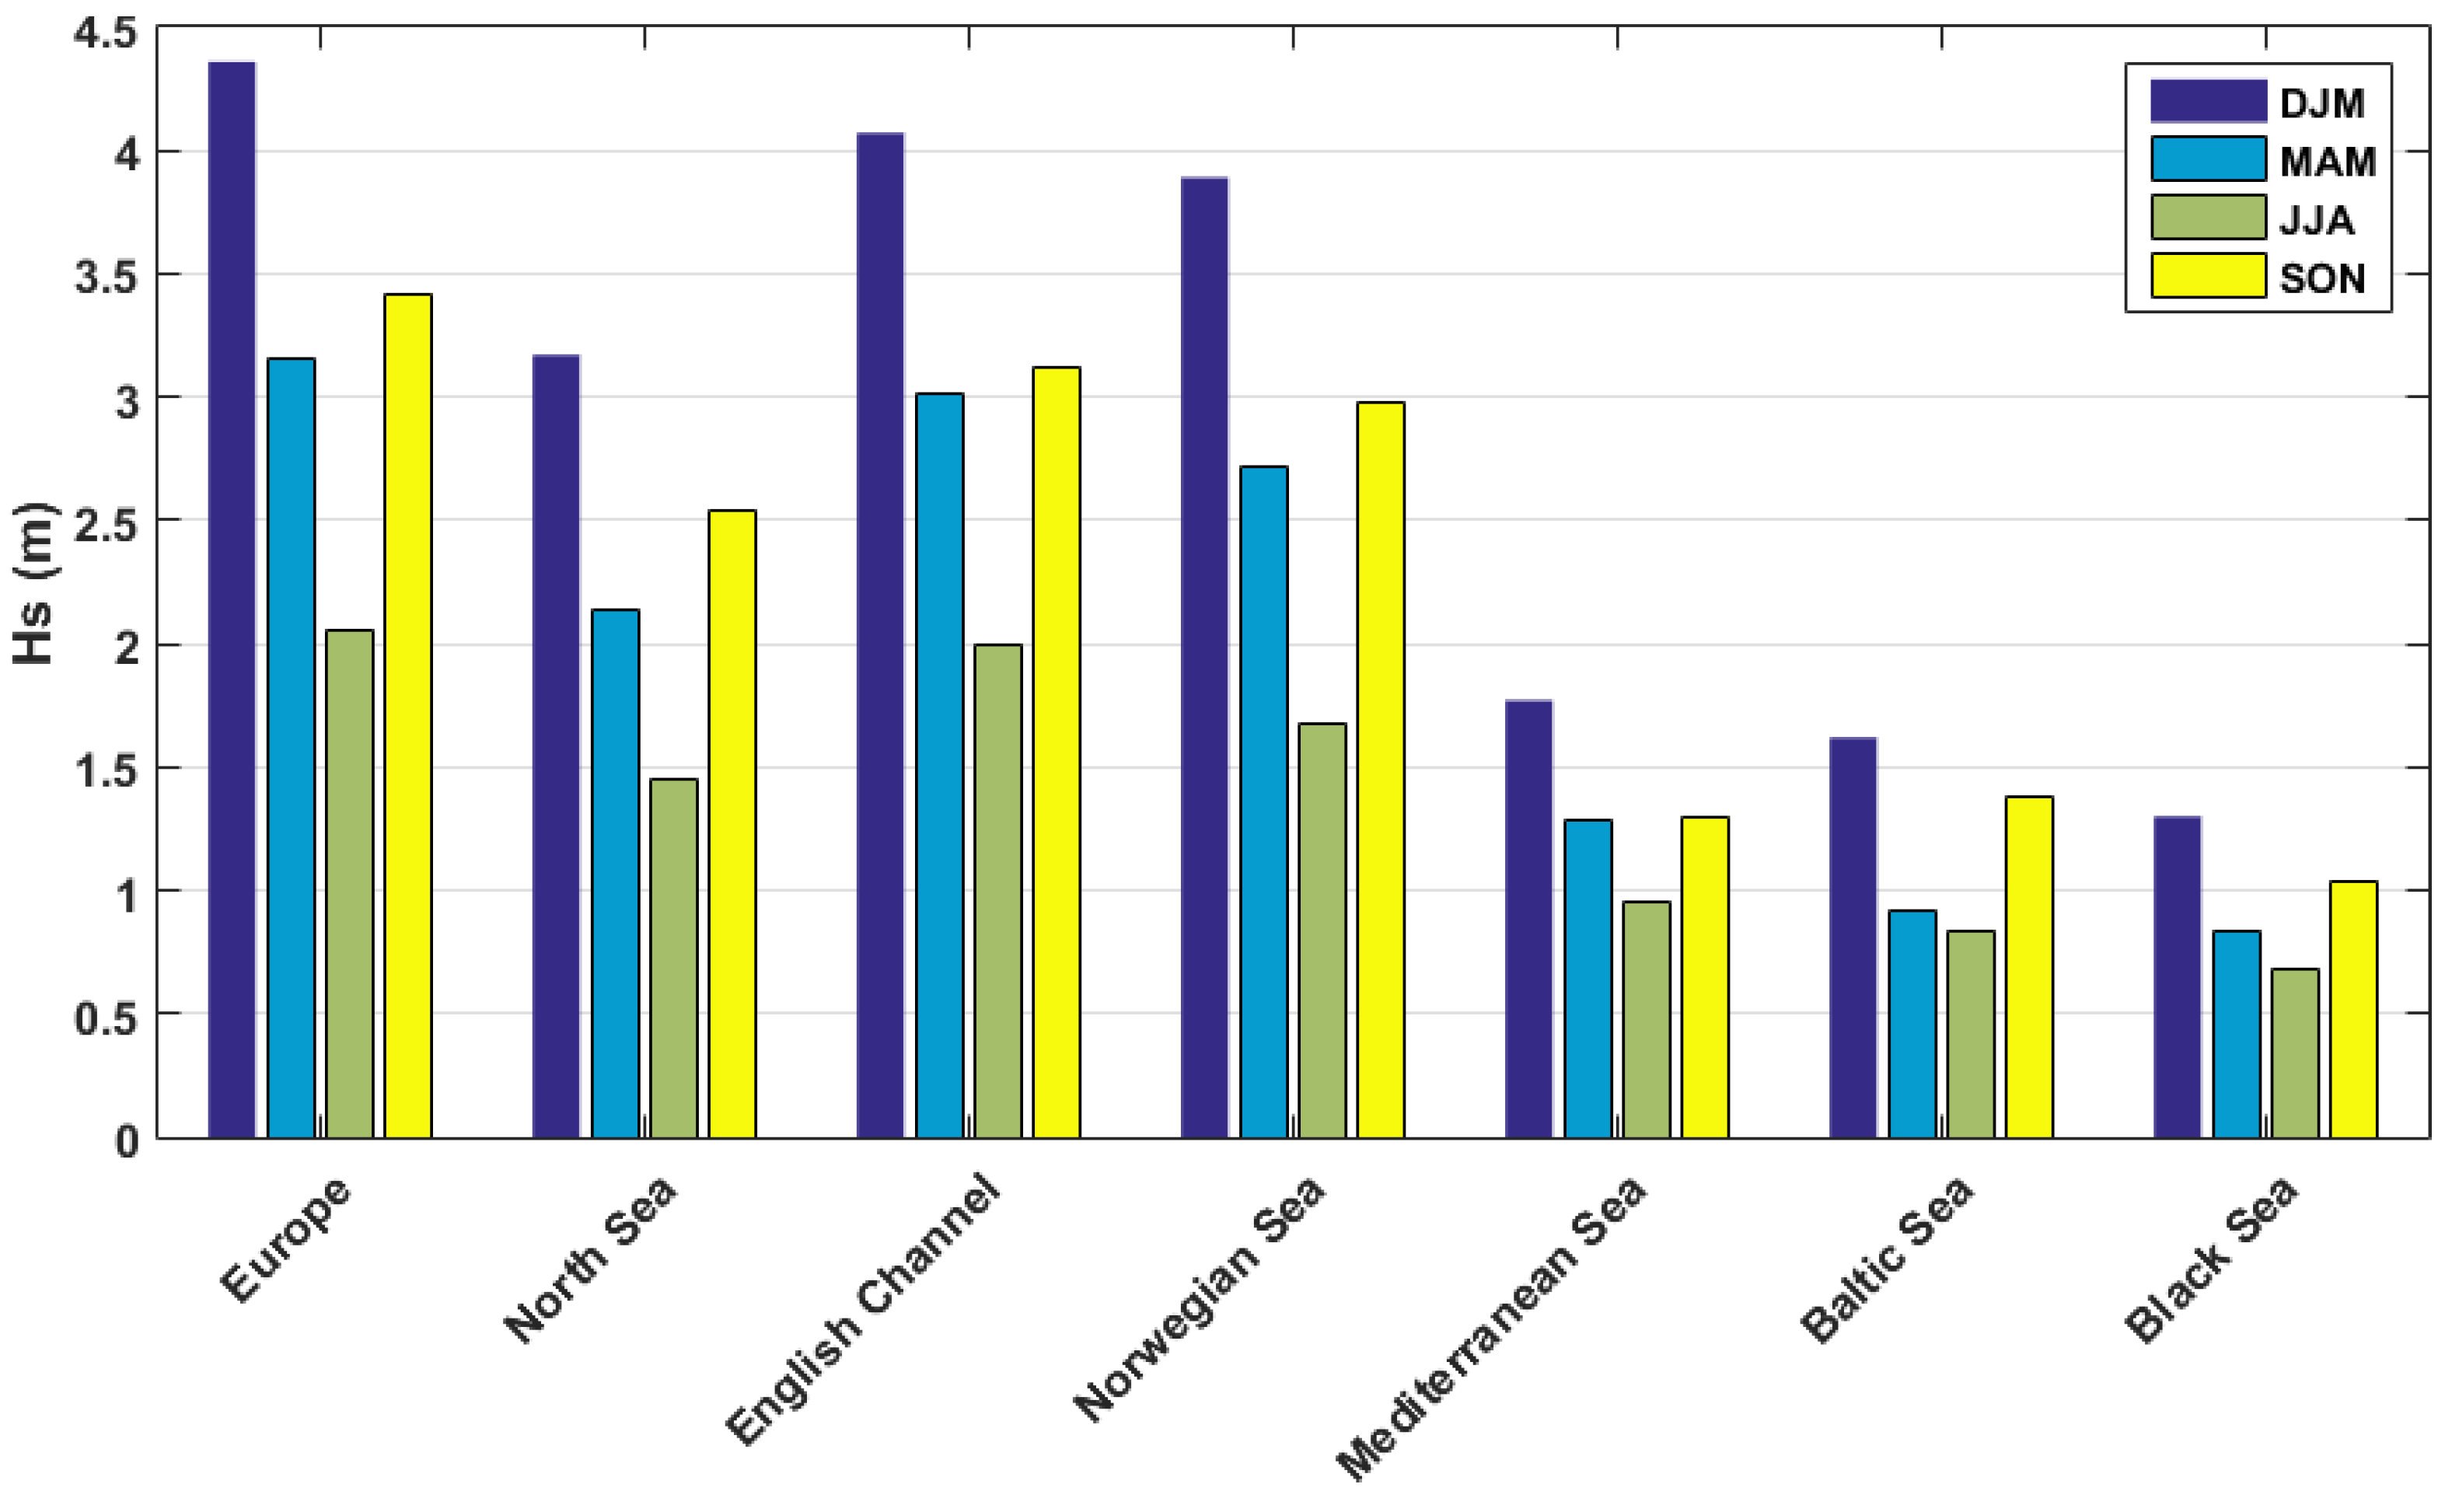
5. Analysis of Wave Climate
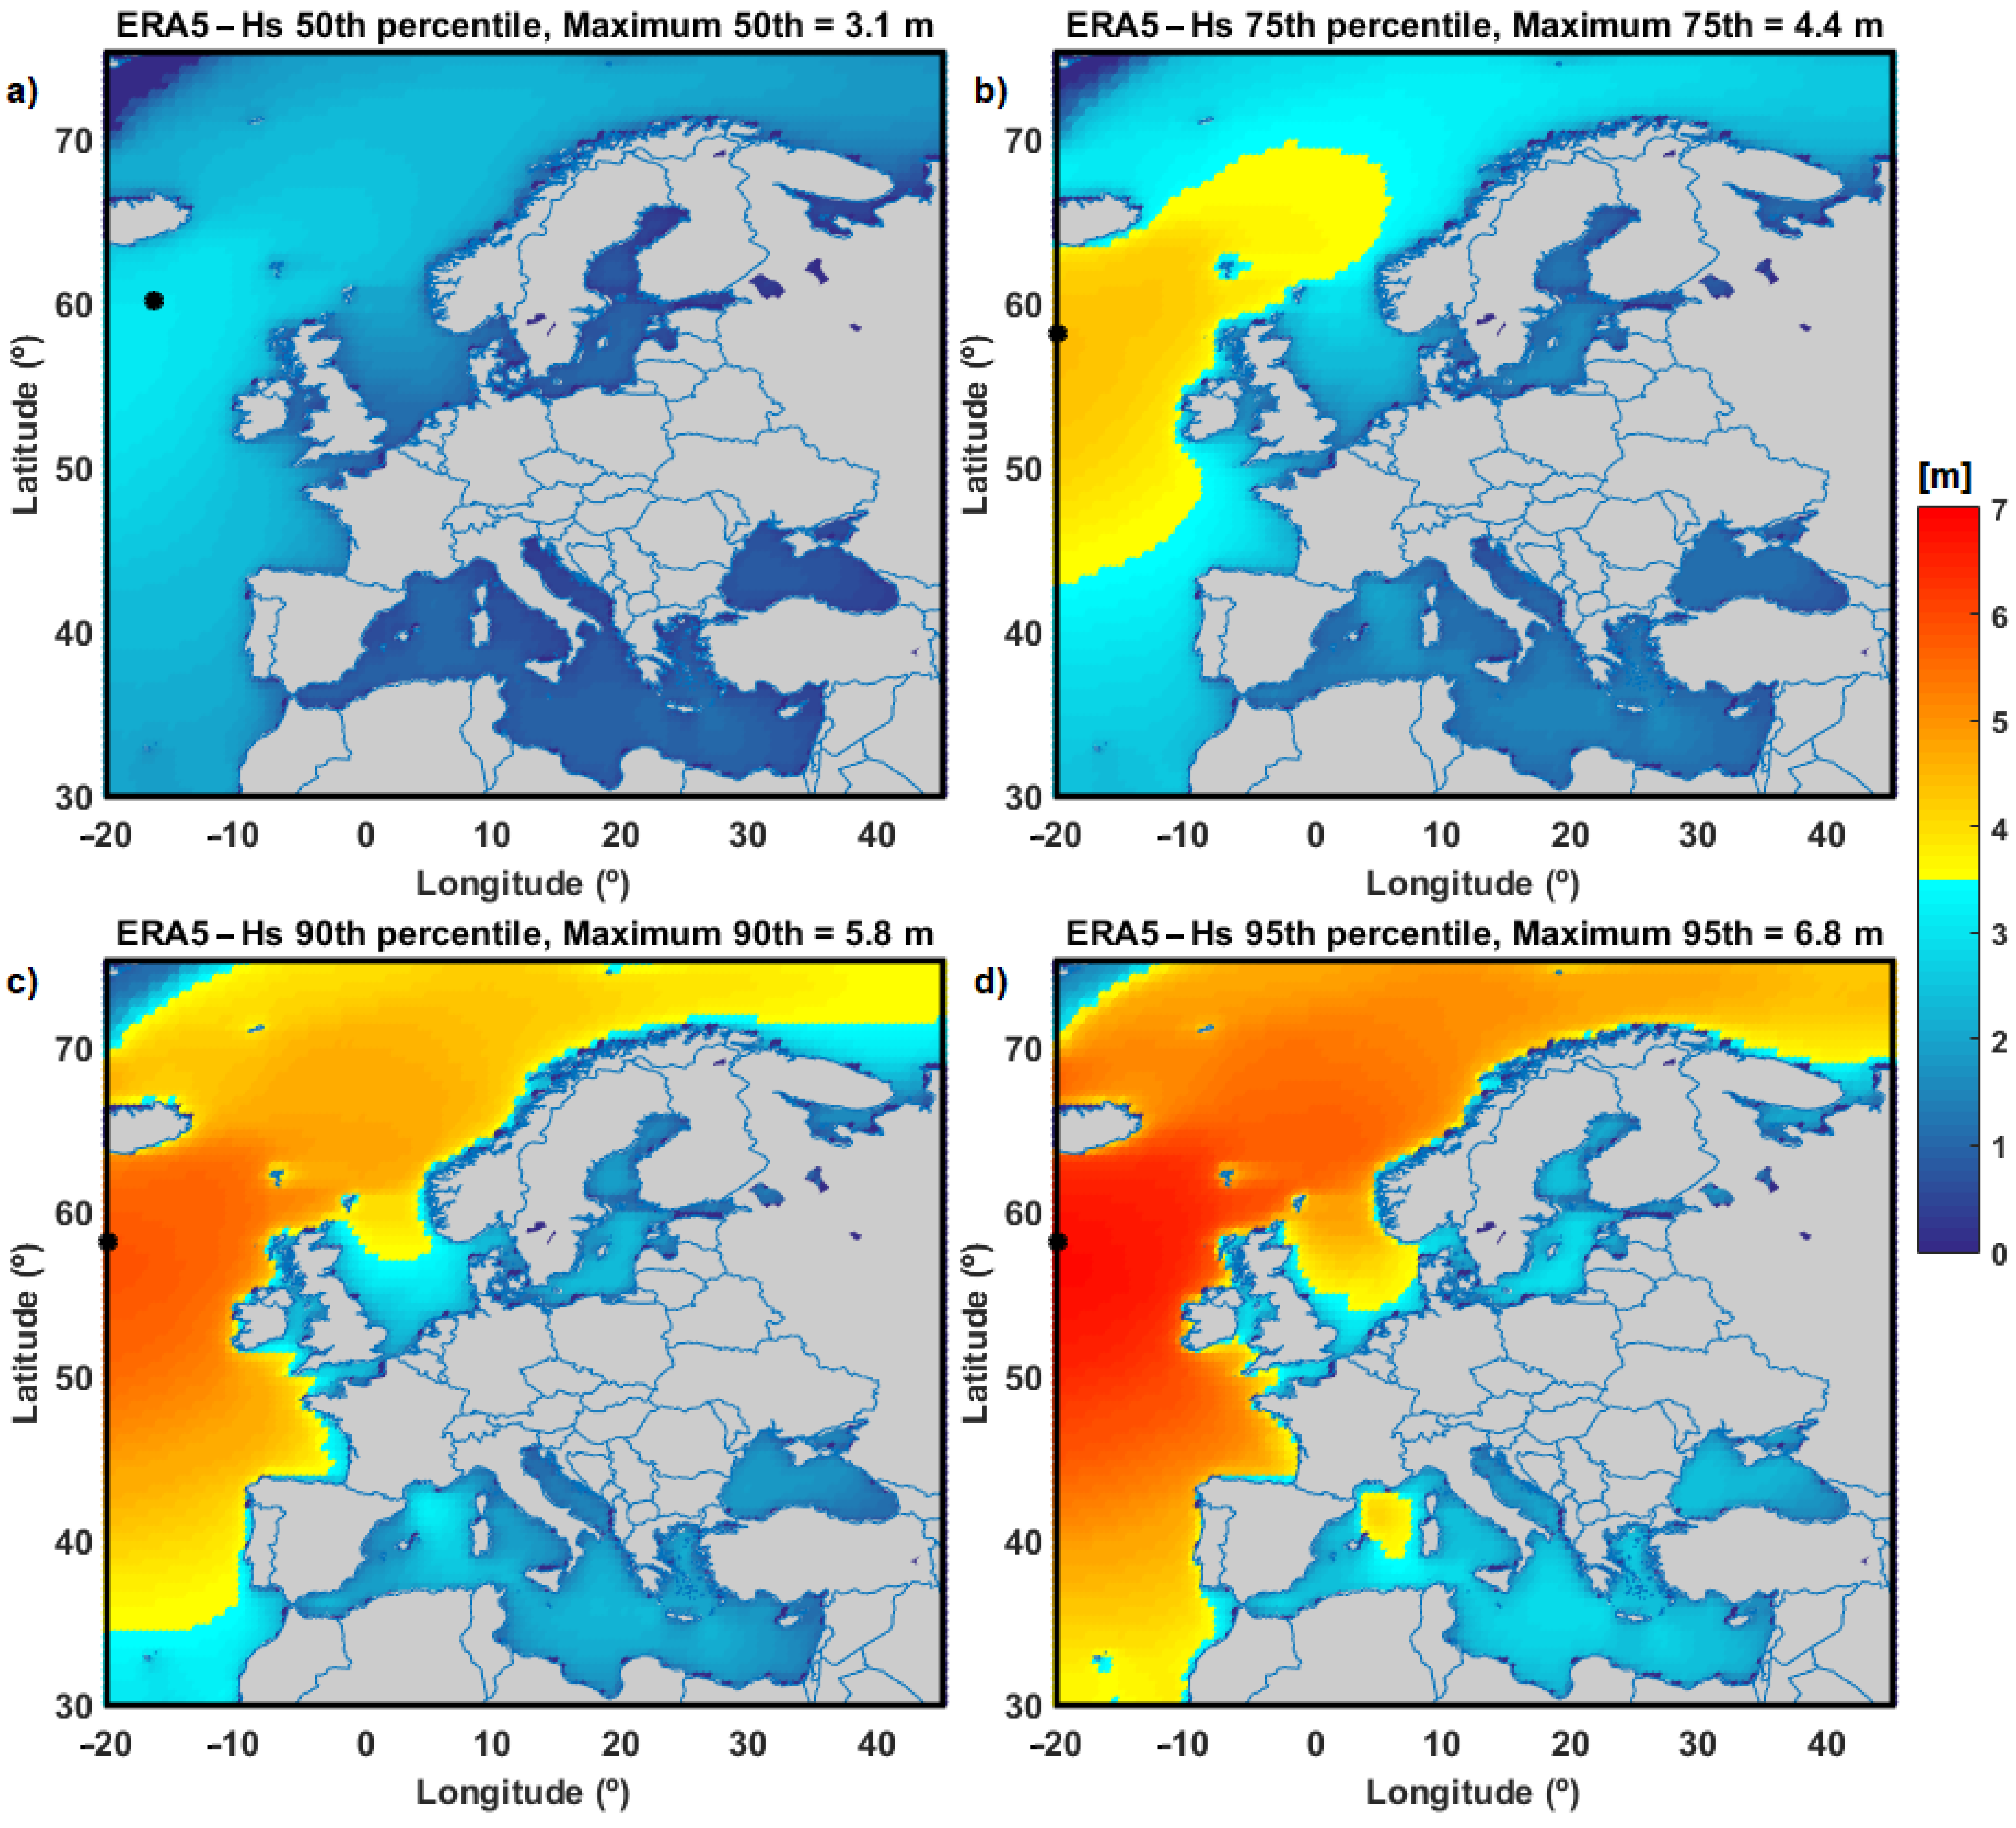
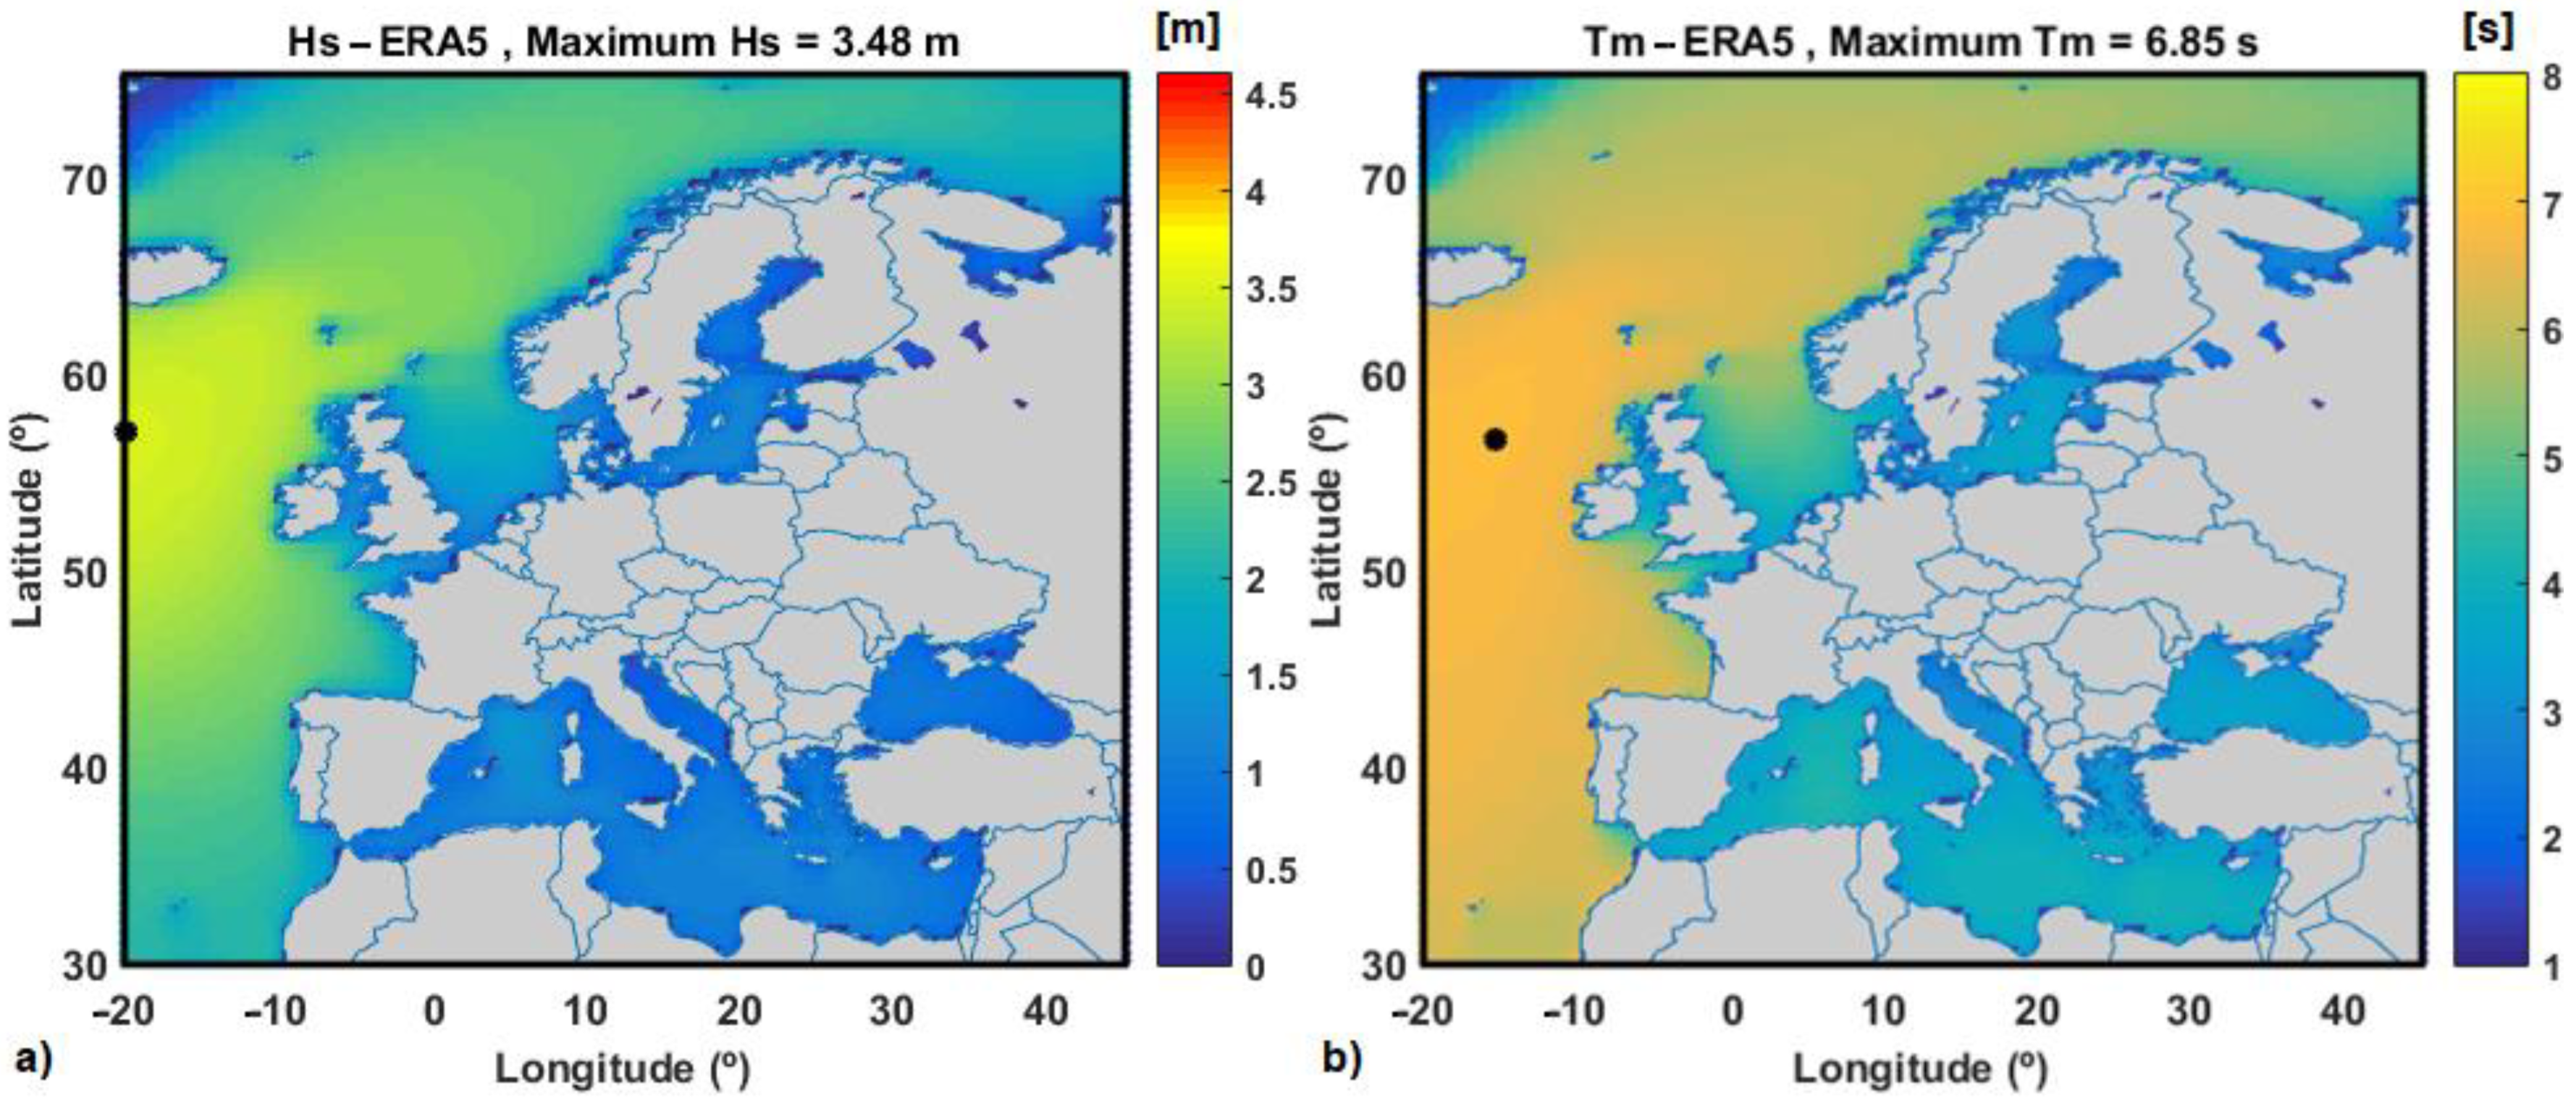
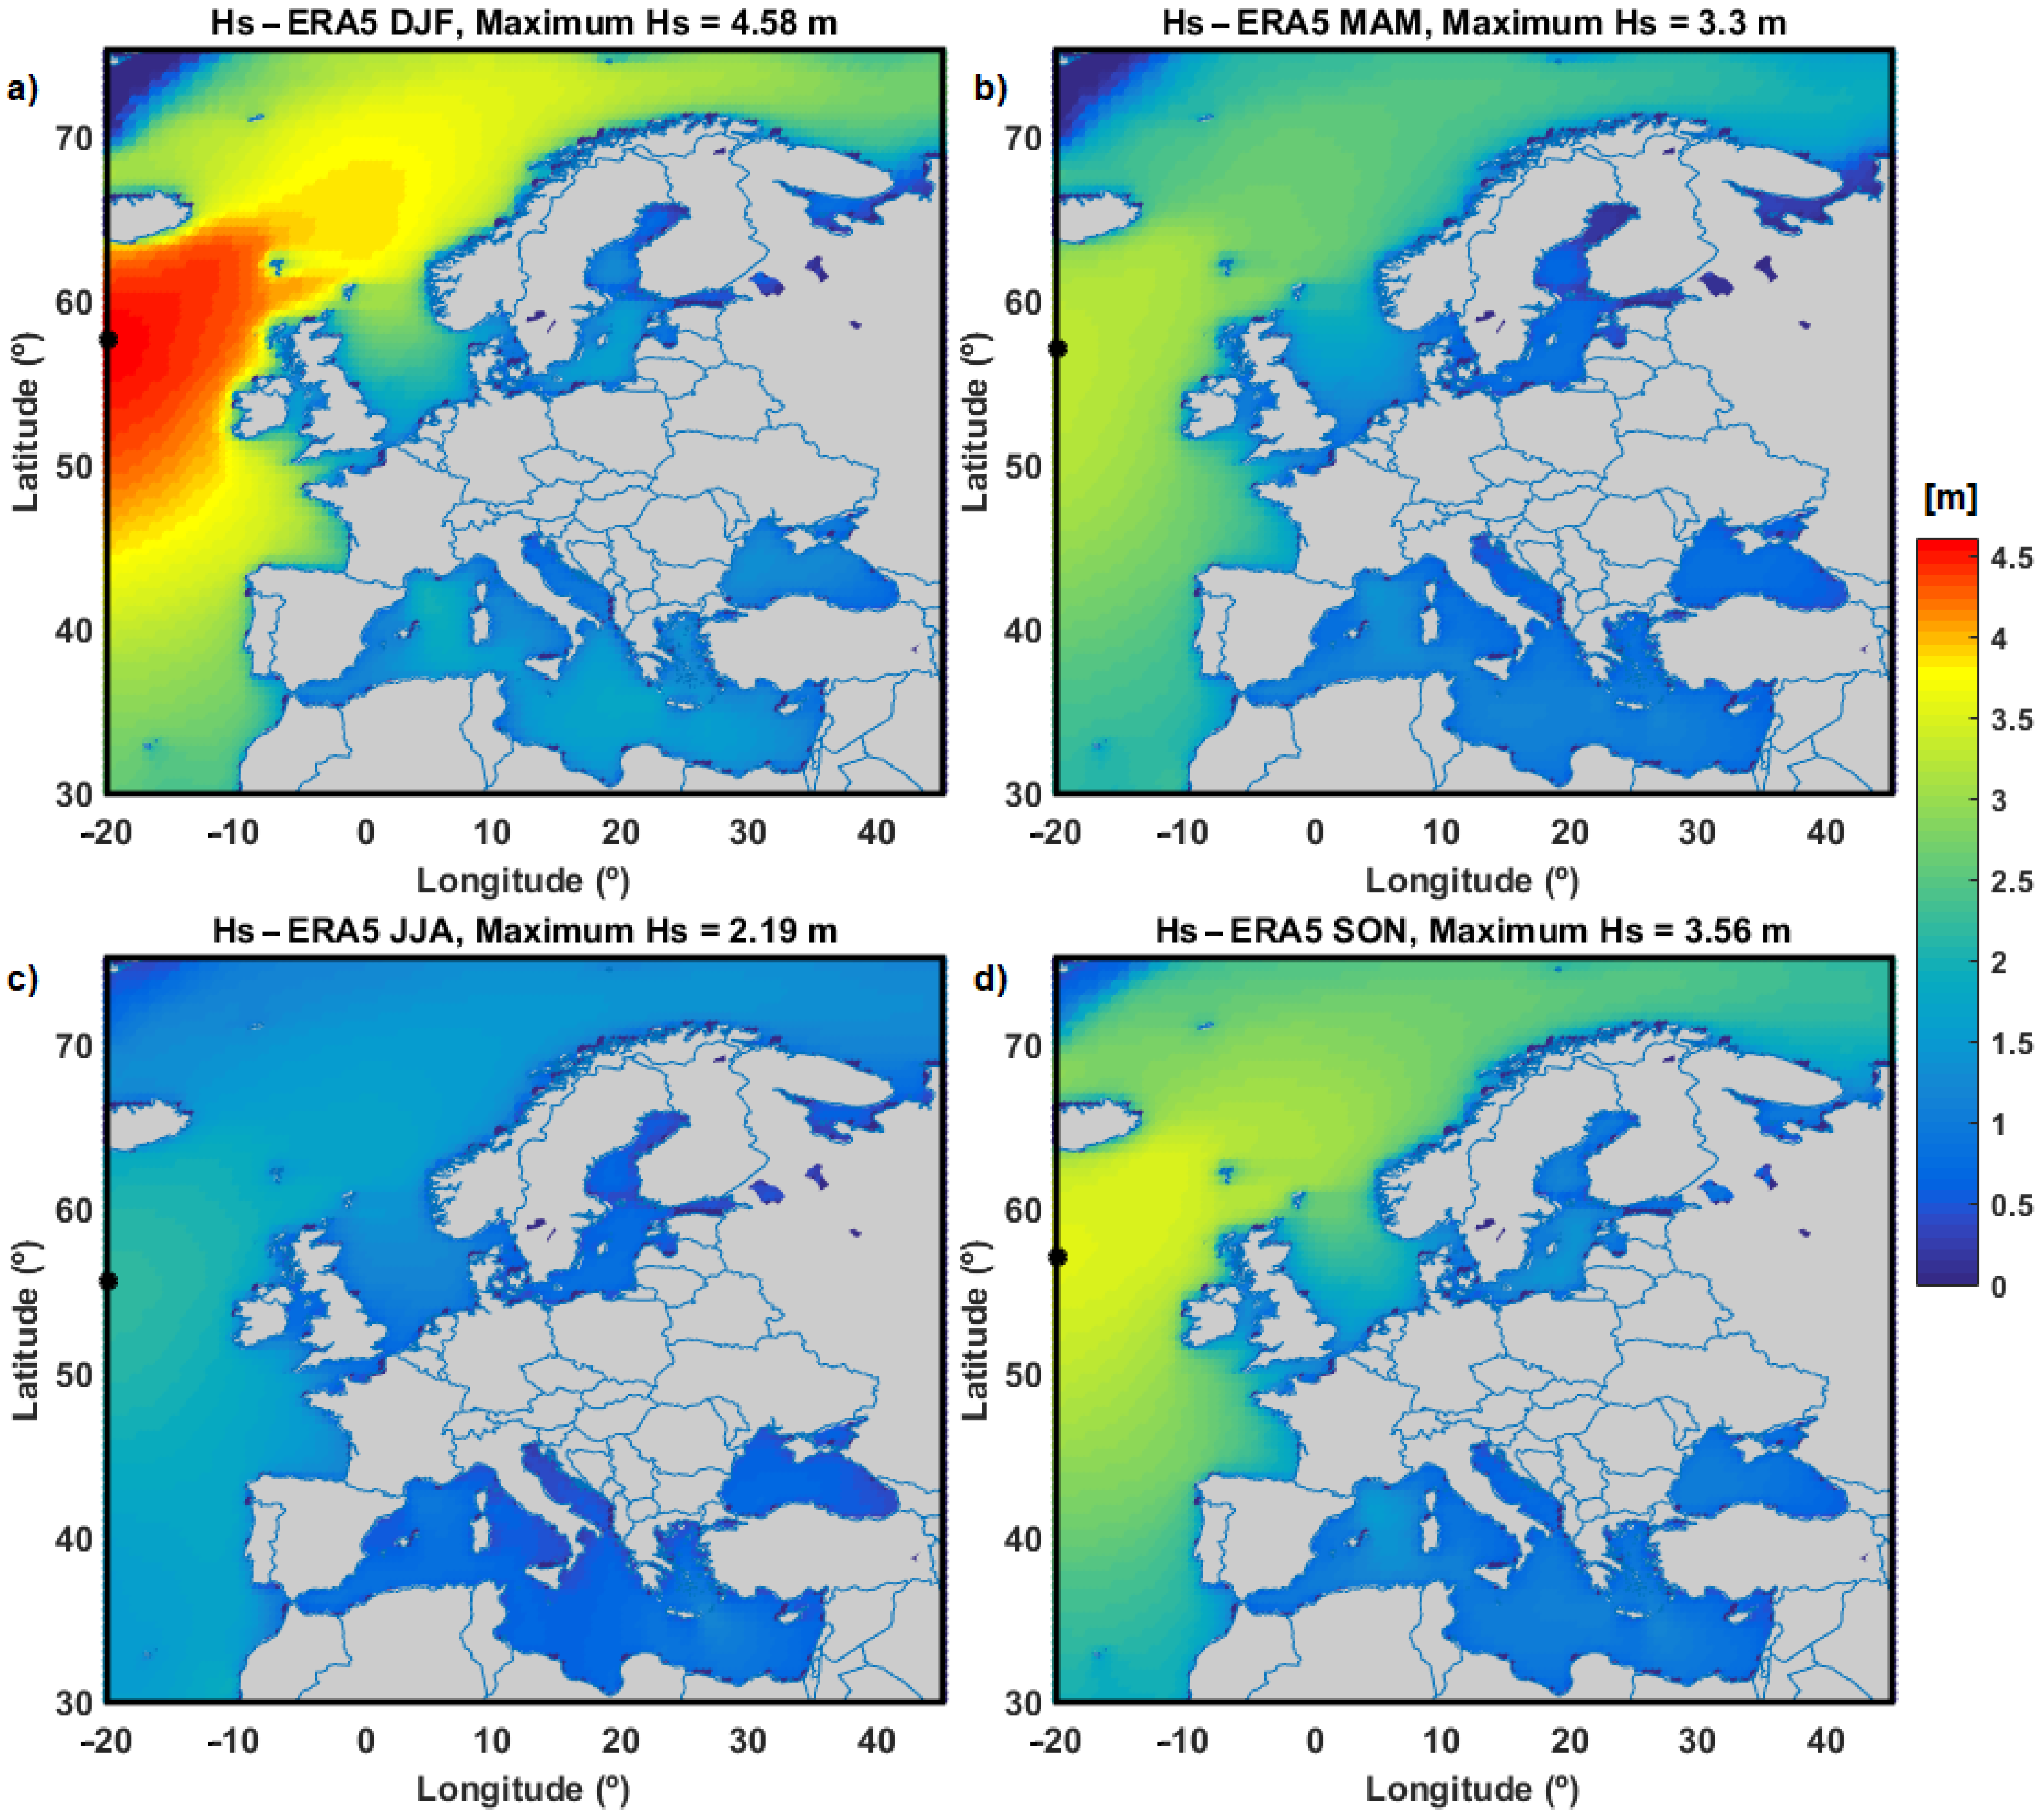
5.1. Wave Climate in the European Seas
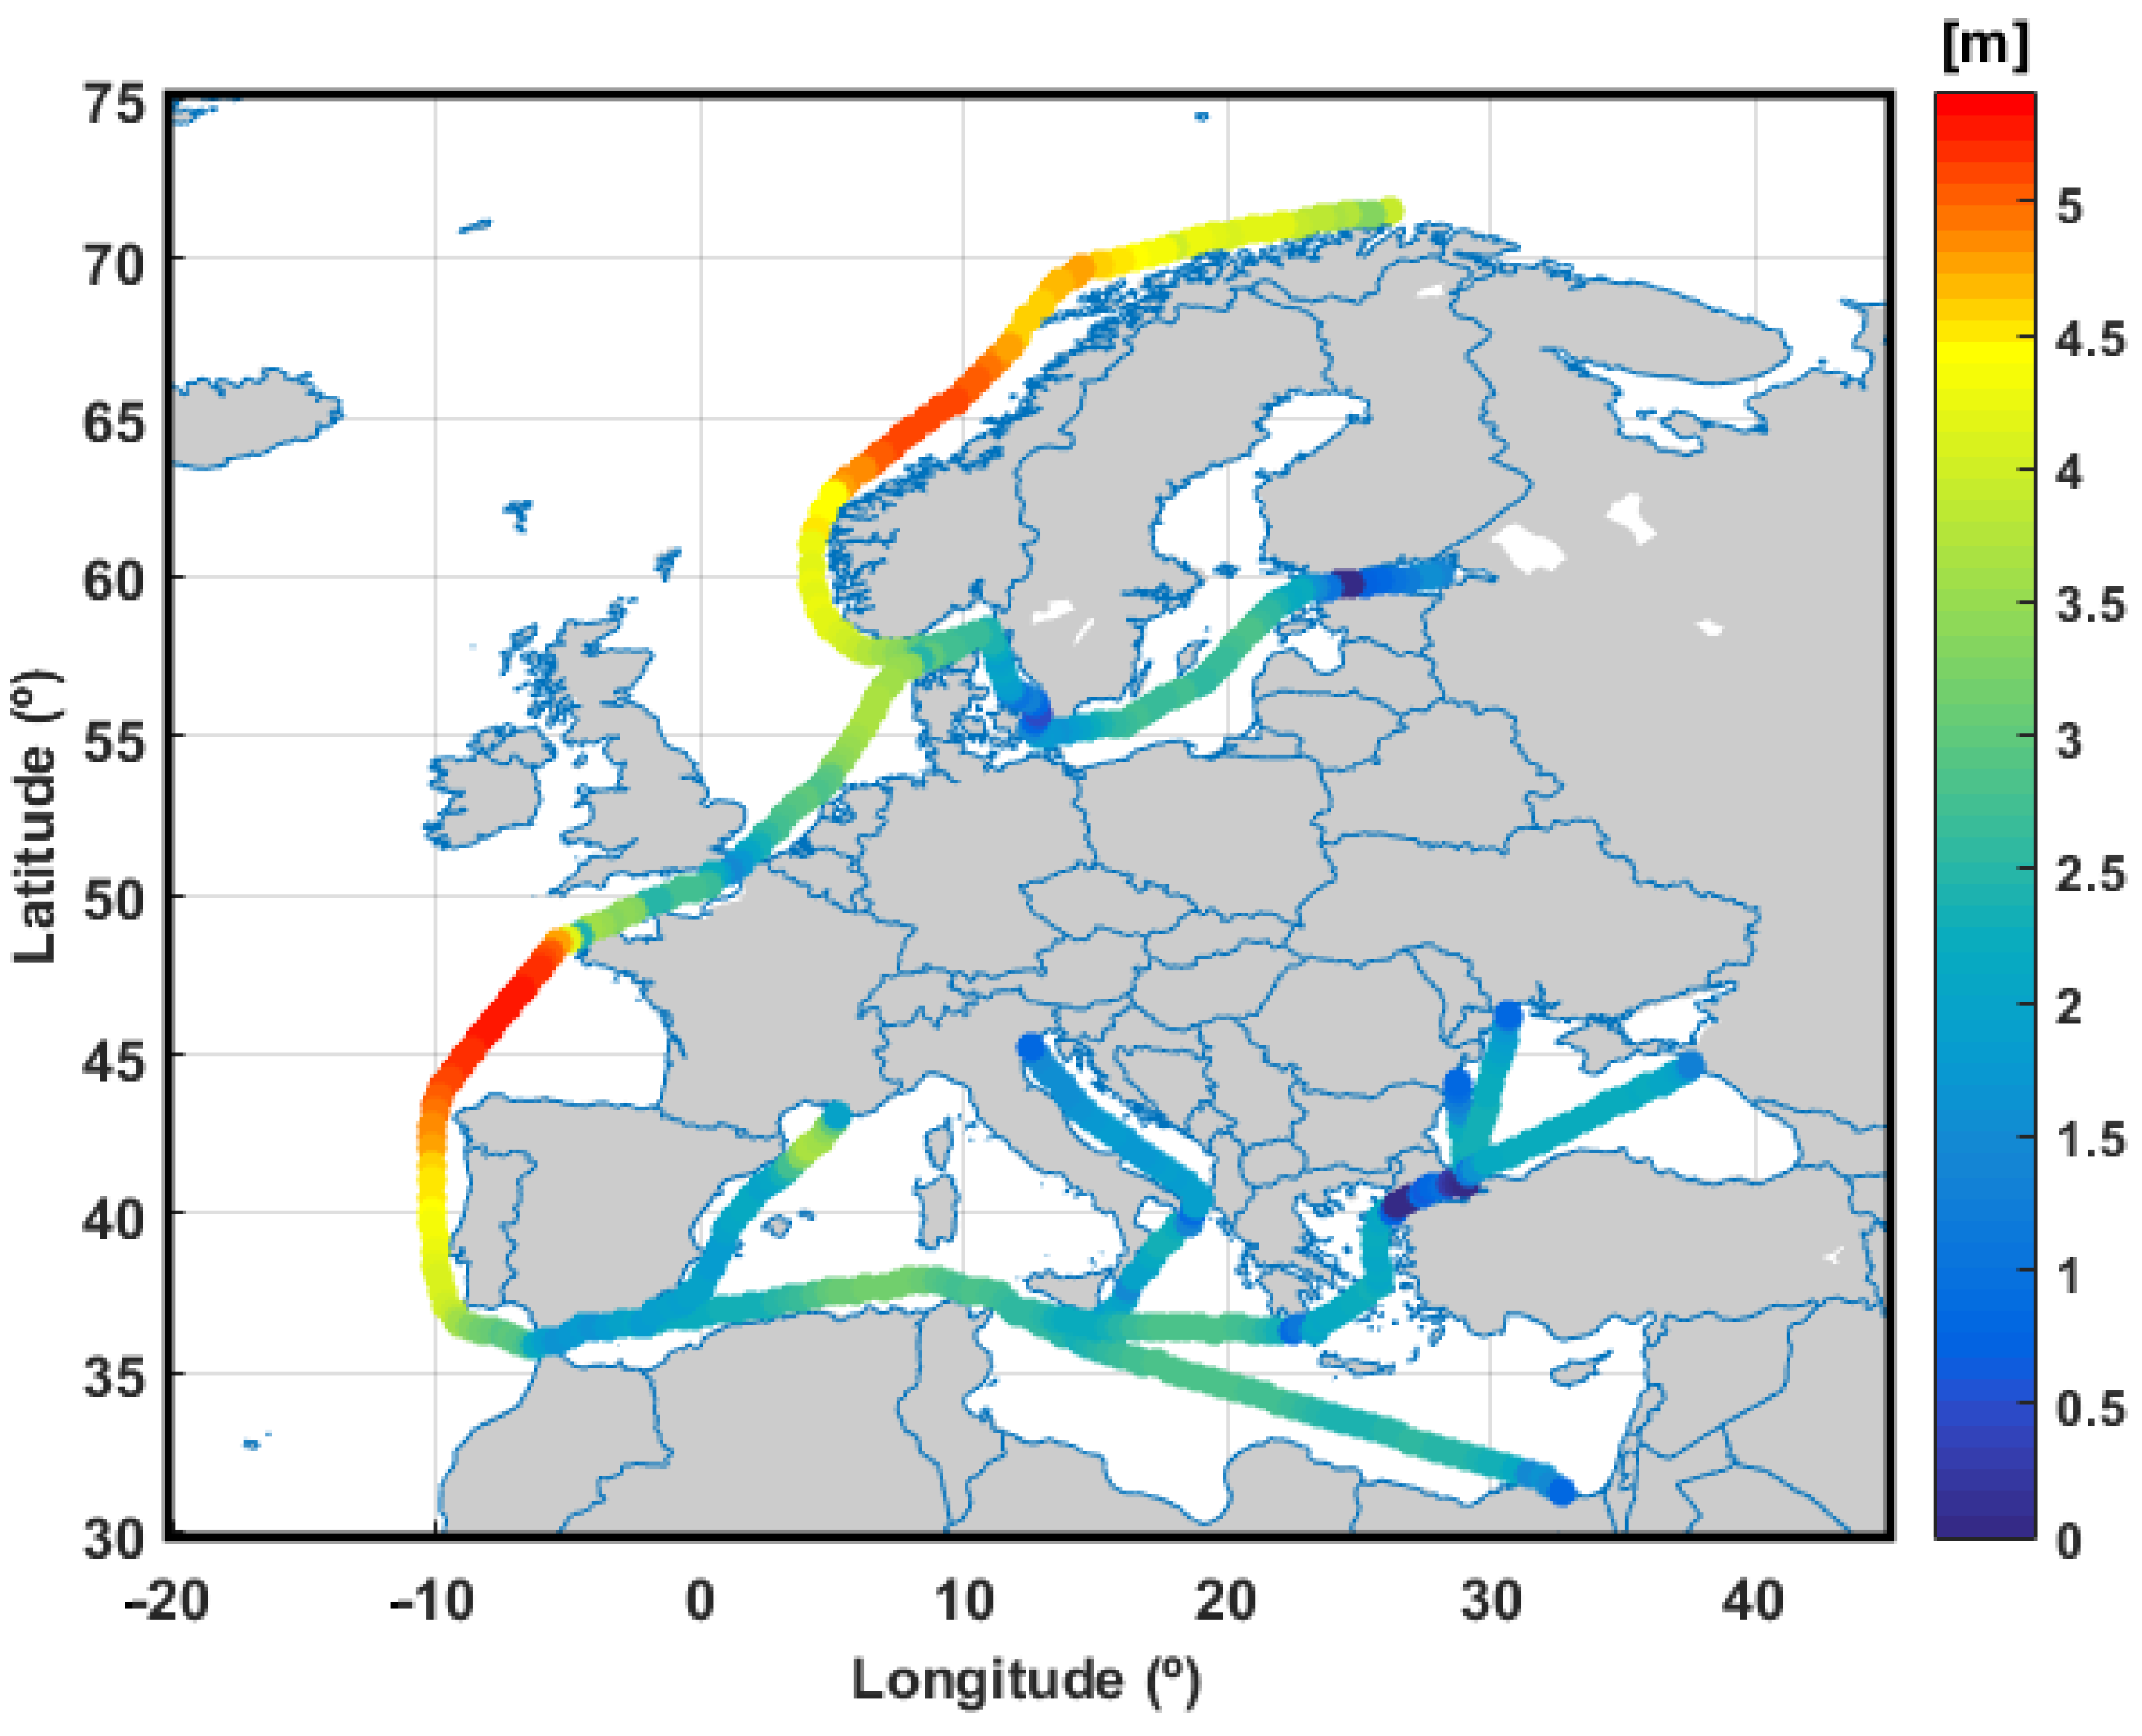
5.2. Extreme Wave Conditions along the Maritime Routes
6. Conclusions
Author Contributions
Funding
Institutional Review Board Statement
Informed Consent Statement
Data Availability Statement
Acknowledgments
Conflicts of Interest
References
- Vettor, R.; Soares, C.G. Characterization of the expected weather conditions in the main European coastal traffic routes. Ocean. Eng. 2017, 140, 244–257. [Google Scholar] [CrossRef]
- Chirosca, A.; Rusu, L. Sea state characteristics and the maritime traffic in the European Seas. In Proceedings of the 20th International Multidisciplinary Scientific GeoConference SGEM, Albena, Bulgaria, 18–24 August 2020; Volume 20, pp. 863–870. [Google Scholar] [CrossRef]
- Rusu, E. A 30-year projection of the future wind energy resources in the coastal environment of the Black Sea. Renew. Energy 2019, 139, 228–234. [Google Scholar] [CrossRef]
- Lobeto, H.; Menendez, M.; Losada, I.J. Future behavior of wind wave extremes due to climate change. Sci. Rep. 2021, 11, 7869. [Google Scholar] [CrossRef] [PubMed]
- Lavidas, G.; Polinder, H. North sea wave database (NSWD) and the need for reliable resource data: A 38 year database for metocean and wave energy assessments. Atmosphere 2019, 10, 551. [Google Scholar] [CrossRef] [Green Version]
- Novo-Corti, I.; Gonzalez-Laxe, F. The integrated offshore grid in Europe: Exploring challenges for regional energy governance. Energy Res. Soc. Sci. 2019, 52, 55–67. [Google Scholar]
- Divinsky, B.V.; Fomin, V.V.; Kosyan, R.D.; Rather, Y.D. Extreme wind waves in the Black Sea. Oceanologia 2020, 62, 23–30. [Google Scholar] [CrossRef]
- Onea, F.; Rusu, L. Long-Term Analysis of the Black Sea Weather Windows. J. Mar. Sci. Eng. 2019, 7, 303. [Google Scholar] [CrossRef] [Green Version]
- Pastor, F.; Valiente, J.A.; Khodayar, S. A Warming Mediterranean: 38 Years of Increasing Sea Surface Temperature. Remote Sens. 2020, 12, 2687. [Google Scholar] [CrossRef]
- Castells, M.; Martínez de Osés, F.X.; Usabiaga, J.J. Analysis of the Prevailing Weather Conditions Criteria to Evaluate the Adoption of a Future ECA in the Mediterranean Sea. In Marine Navigation and Safety of Sea Transportation; Weintrit, A., Ed.; CRC Press Taylor & Francis Group: Boca Raton, FL, USA, 2013; pp. 161–165. [Google Scholar] [CrossRef] [Green Version]
- Lejeusne, C.; Chevaldonne, P.; Pergent-Martini, C.; Boudouresque, C.F.; Perez, T. Climate change effects on a miniature ocean: The highly diverse, highly impacted Mediterranean Sea. Trends Ecol. Evol. 2010, 25, 250–260. [Google Scholar] [CrossRef]
- Ganea, D.; Amortila, V.; Mereuta, E.; Rusu, E. A joint evaluation of the wind and wave energy resources close to the Greek Islands. Sustainability 2017, 9, 1025. [Google Scholar] [CrossRef] [Green Version]
- Barbariol, F.; Davison, S.; Falcieri, F.M.; Ferretti, R.; Ricchi, A.; Sclavo, M.; Benetazzo, A. Wind Waves in the Mediterranean Sea: An ERA5 Reanalysis Wind-Based Climatology. Front. Mar. Sci. 2021, 8, 760614. [Google Scholar] [CrossRef]
- Onea, F.; Ruiz, A.; Rusu, E. An Evaluation of the Wind Energy Resources along the Spanish Continental Nearshore. Energies 2020, 13, 3986. [Google Scholar] [CrossRef]
- Lensu, M.; Goerlandt, F. Big maritime data for the Baltic Sea with a focus on the winter navigation system. Mar. Policy 2019, 104, 53–65. [Google Scholar] [CrossRef]
- Bonaduce, A.; Stanevra, J.; Beherens, A.; Bidlot, J.; Wilcke, R.A.I. Wave Climate Change in the North Sea and Baltic Sea. J. Mar. Sci. Eng. 2019, 7, 166. [Google Scholar] [CrossRef] [Green Version]
- Suselj, K.; Sood, A.; Heinemann, D. North Sea near-surface wind climate and its relation to the large-scale circulation patterns. Theor. Appl. Climatol 2010, 99, 403–419. [Google Scholar] [CrossRef] [Green Version]
- Bell, R.J.; Gray, S.L.; Jones, O.P. North Atlantic storm driving of extreme wave heights in the North Sea. J. Geophys. Res. Oceans 2017, 122, 3253–3268. [Google Scholar] [CrossRef] [Green Version]
- Mosquera, I.A.; Sagrilo, L.V.; Videiro, P.M.; Sousa, F. Assessing the impact of climate change on the fatigue life of offshore structures. J. Offshore Mech. Arct. Eng. 2021, 1–35. [Google Scholar] [CrossRef]
- Mork, K.A.; Skagseth, O.; Soiland, H. Recent Warming and Freshening of Norwegian Sea Observed by Argo Data. J. Clim. 2019, 32, 36–3705. [Google Scholar] [CrossRef] [Green Version]
- Dickson, B.; Østerhus, S. One hundred years in the Norwegian Sea. Nor. Geogr. Tidsskr.-Nor. J. Geogr. 2007, 61, 56–75. [Google Scholar] [CrossRef]
- Simonsen, M.; Gossling, S.; Walnum, J.H. Cruise ship emissions in Norwegian waters: A geographical analysis. J. Transp. Geogr. 2019, 78, 87–97. [Google Scholar] [CrossRef]
- Lemos, G.; Menendez, M.; Semedo, A.; Miranda, P.M.; Hemer, M. On the decreases in North Atlantic significant wave heights from climate projections. Clim. Dyn. 2021, 57, 2301–2324. [Google Scholar] [CrossRef]
- Bricheno, L.M.; Wolf, J. Future wave conditions of Europe, in response to high-end climate change scenarios. J. Geophys. Res. Oceans 2018, 123, 8762–8791. [Google Scholar] [CrossRef]
- Rodrigue, J.P. Maritime transport. In The International Encyclopedia of Geography: People, the Earth, Environment and Technology; Richardson, D., Castree, N., Goodchild, M.M., Kobayashi, A., Liu, W., Marston, R.A., Eds.; John Wiley & Sons, Ltd.: Hoboken, NJ, USA, 2017; Volume 15, pp. 1–7. [Google Scholar] [CrossRef]
- Squire, D. The Hazards of Navigating The Dover Strait (Pas-de-Calais) Traffic Separation Scheme. J. Navig. 2003, 56, 195–210. [Google Scholar] [CrossRef]
- European Marine Observation and Data Network (EMODnet). Available online: https://www.emodnet-humanactivities.eu/ (accessed on 12 December 2021).
- Dedecca, J.G.; Hakvoort, R.A.; Herder, P.M. Maritime Transport and Trade: The Impact of European Transport Policy. An Overview of Maritime Freight Transport Patterns. Eur. Res. Stud. 2009, XII, 131–147. [Google Scholar]
- Eurostat Database. Available online: https://ec.europa.eu/eurostat/data/database (accessed on 10 July 2021).
- Chirosca, A.; Rusu, L. Statistical analysis of the types of ships that have crossed the European ports in the last decade. In Proceedings of the 20th International Multidisciplinary Scientific GeoConference SGEM, Albena, Bulgaria, 18–24 August 2020; Volume 20, pp. 249–256. [Google Scholar] [CrossRef]
- ECMWF Reanalysis v5 (ERA5). Available online: https://www.ecmwf.int/en/forecasts/dataset/ecmwf-reanalysis-v5 (accessed on 12 July 2021).
- Hersbach, H.; Bell, B.; Berrisford, P. The ERA5 global reanalysis. QJR Meteorol Soc. 2020, 146, 1999–2049. [Google Scholar] [CrossRef]
- Dee, D.P.; Uppala, S.M.; Simmons, A.J.; Berrisford, P.; Poli, P.; Kobayashi, S.; Andrae, U.; Balmaseda, A.M.; Balsamo, G.; Bauer, P.; et al. The ERA-Interim reanalysis: Configuration and performance of the data assimilation system. Q. J. R. Meteorol. Soc. 2011, 137, 553–597. [Google Scholar] [CrossRef]
- Buatois, A.; Gibescu, M.; Rawn, B.G.; Van der Meijden, A.M. Analysis of North Sea offshore wind power variability. Resources 2014, 3, 454–470. [Google Scholar] [CrossRef] [Green Version]
- Bentamy, A.; Croize-Fillon, D. Spatial and temporal characteristics of wind and wind power off the coasts of Brittany. Renew. Energy 2014, 66, 670–679. [Google Scholar] [CrossRef] [Green Version]
- Karagali, I.; Badger, M.; Hahmann, A.N.; Peña, A.; Hasager, C.B.; Sempreviva, M.A. Spatial and temporal variability of winds in the Northern European Seas. Renew. Energy 2013, 57, 200–210. [Google Scholar] [CrossRef]
- Moemken, J.; Reyers, M.; Feldmann, H.; Pinto, J.G. Future changes of wind speed and wind energy potentials in EURO-CORDEX ensemble simulations. J. Geophys. Res. Atmos. 2018, 123, 6373–6389. [Google Scholar] [CrossRef]
- Diaconita, A.; Andrei, G.; Rusu, L. New insights into the wind energy potential of the west Black Sea area based on the North Sea wind farms model. Energy Rep. 2021, 7, 112–118. [Google Scholar] [CrossRef]
- Akpınar, A.; Bingölbali, B.; van Vledder, G.P. Wind and wave characteristics in the Black Sea based on the SWAN wave model forced with the CFSR winds. Ocean Eng. 2016, 126, 276–298. [Google Scholar] [CrossRef]
- Rusu, L. The wave and wind power potential in the western Black Sea. Renew. Energy 2019, 139, 1146–1158. [Google Scholar] [CrossRef]
- Koletsis, I.; Kotroni, V.; Lagouvardos, K.; Soukissian, T. Assessment of offshore wind speed and power potential over the Mediterranean and the Black Seas under future climate changes. Renew. Sustain. Energy Rev. 2016, 60, 234–245. [Google Scholar] [CrossRef]
- Soukissian, T.; Karathanasi, F.; Axaopoulos, P.; Voukouvalas, E.; Kotroni, V. Offshore wind climate analysis and variability in the Mediterranean Sea. Int. J. Climatol. 2018, 38, 384–402. [Google Scholar] [CrossRef]
- Menendez, M.D.C.R.; García-Díez, M.; Fita, L.; Fernández, J.; Méndez, F.J.; Gutiérrez, J.M. High-resolution sea wind hindcasts over the Mediterranean area. Clim. Dyn. 2014, 42, 1857–1872. [Google Scholar] [CrossRef]
- Vettor, R.; Soares, C.G. Assessment of the storm avoidance effect on the wave climate along the main North Atlantic routes. J. Navig. 2016, 69, 127–144. [Google Scholar] [CrossRef] [Green Version]
- Echevarria, E.R.; Hemer, M.A.; Holbrook, N.J. Seasonal variability of the global spectral wind wave climate. J. Geophys. Res. Oceans 2019, 124, 2924–2939. [Google Scholar] [CrossRef]
- Rusu, L.; Rusu, E. Evaluation of the worldwide wave energy distribution based on ERA5 data and altimeter measurements. Energies 2021, 14, 394. [Google Scholar] [CrossRef]
- Takbash, A.; Young, I.R. Long-Term and Seasonal Trends in Global Wave Height Extremes Derived from ERA-5 Reanalysis Data. J. Mar. Sci. Eng. 2020, 8, 1015. [Google Scholar] [CrossRef]
- Rutgersson, A.; Kjellström, E.; Haapala, J.; Stendel, M.; Danilovich, I.; Drews, M.; Jylhä, K.; Kujala, P.; Larsén, X.G.; Halsnæs, K.; et al. Natural hazards and extreme events in the Baltic Sea region. Earth Syst. Dyn. Discuss. 2021, 1–80, preprint. [Google Scholar] [CrossRef]
- Bernardino, M.; Rusu, L.; Soares, C.G. Evaluation of extreme storm waves in the Black Sea. J. Oper. Oceanogr. 2021, 14, 114–128. [Google Scholar] [CrossRef]
- Soomere, T.; Räämet, A. Spatial patterns of the wave climate in the Baltic Proper and the Gulf of Finland. Oceanologia 2011, 53, 335–371. [Google Scholar] [CrossRef] [Green Version]


| Routes | Length (nmi) | Seas Crossed by the Route | |
|---|---|---|---|
| Main routes | R1 | 1280 | Norwegian Sea |
| R2 | 814 | Baltic Sea | |
| R3 | 585 | North Sea; Northern English Cannel | |
| R4 | 1266 | English Cannel; Bay of Biscay; North Atlantic Ocean | |
| R5 | 1911 | Mediterranean Sea | |
| Secondary routes | R5a | 487 | Western Mediterranean Sea; Gulf of Lion |
| R5b | 710 | Ionian Sea; Adriatic Sea | |
| R5c | 985 | Sicilian Channel; Ionian Sea; Sea of Crete; Aegean Sea; Marmara Sea | |
| R6a | 178 | Western Black Sea | |
| R6b | 323 | Western Black Sea | |
| R6c | 495 | Black Sea | |
| Zone | Coordinates | Surface Area | Average Depth | Maximum Depth |
|---|---|---|---|---|
| Black Sea | 27° E–42° E/41° N–47° N | 436,402 km2 | 1253 m | 2212 m |
| Mediterranean Sea | 5° W–35° E/30° N–40° N | 2,500,000 km2 | 1500 m | 5267 m |
| English Channel | 15° W–10° E/45° N–51° N, | 375,000 km2 | 63 m | 174 m |
| North Sea | 5° W–10° E/51° N–60° N, | 570,000 km2 | 95 m | 700 m |
| Baltic Sea | 12° E–32° E/53° N–65° N, | 377,000 km2 | 55 m | 459 m |
| Norwegian Sea | 10° W–25° E/60.5° N–74° N | 1,380,000 km2 | 2000 m | 3970 m |
| Routes | Maximum wind Speed 95th Percentile (m/s) | |
|---|---|---|
| Main routes | R1 | 15.98 |
| R2 | 13.59 | |
| R3 | 14.51 | |
| R4 | 14.43 | |
| R5 | 12.75 | |
| Secondary routes | R5a | 15.92 |
| R5b | 11.93 | |
| R5c | 13.34 | |
| R6a | 11.39 | |
| R6b | 11.60 | |
| R6c | 11.32 | |
| Zone | Max 95th (m) | Max 90th (m) | Max 75th (m) | Max 50th (m) |
|---|---|---|---|---|
| Europe | 6.8 | 5.8 | 4.4 | 3.1 |
| North Sea | 5.9 | 5.1 | 3.8 | 2.7 |
| English Channel | 6.4 | 5.4 | 4.0 | 2.9 |
| Norwegian Sea | 5.6 | 4.8 | 3.7 | 2.6 |
| Mediterranean Sea | 4.0 | 3.2 | 2 | 1.1 |
| Baltic Sea | 2.9 | 2.4 | 1.6 | 1.0 |
| Black Sea | 2.3 | 1.9 | 1.2 | 0.8 |
| Routes | Maximum Hs 95th Percentile (m) | |
|---|---|---|
| Main routes | R1 | 5.14 |
| R2 | 2.80 | |
| R3 | 3.67 | |
| R4 | 5.31 | |
| R5 | 3.19 | |
| Secondary routes | R5a | 3.68 |
| R5b | 2.35 | |
| R5c | 2.80 | |
| R6a | 2.29 | |
| R6b | 2.31 | |
| R6c | 2.23 | |
Publisher’s Note: MDPI stays neutral with regard to jurisdictional claims in published maps and institutional affiliations. |
© 2022 by the authors. Licensee MDPI, Basel, Switzerland. This article is an open access article distributed under the terms and conditions of the Creative Commons Attribution (CC BY) license (https://creativecommons.org/licenses/by/4.0/).
Share and Cite
Chirosca, A.-M.; Rusu, L. Characteristics of the Wind and Wave Climate along the European Seas Focusing on the Main Maritime Routes. J. Mar. Sci. Eng. 2022, 10, 75. https://doi.org/10.3390/jmse10010075
Chirosca A-M, Rusu L. Characteristics of the Wind and Wave Climate along the European Seas Focusing on the Main Maritime Routes. Journal of Marine Science and Engineering. 2022; 10(1):75. https://doi.org/10.3390/jmse10010075
Chicago/Turabian StyleChirosca, Ana-Maria, and Liliana Rusu. 2022. "Characteristics of the Wind and Wave Climate along the European Seas Focusing on the Main Maritime Routes" Journal of Marine Science and Engineering 10, no. 1: 75. https://doi.org/10.3390/jmse10010075
APA StyleChirosca, A.-M., & Rusu, L. (2022). Characteristics of the Wind and Wave Climate along the European Seas Focusing on the Main Maritime Routes. Journal of Marine Science and Engineering, 10(1), 75. https://doi.org/10.3390/jmse10010075