
Scour Protection of Submarine Pipelines Using Ionic Soil Stabilizer Solidified Soil

Abstract
:1. Introduction
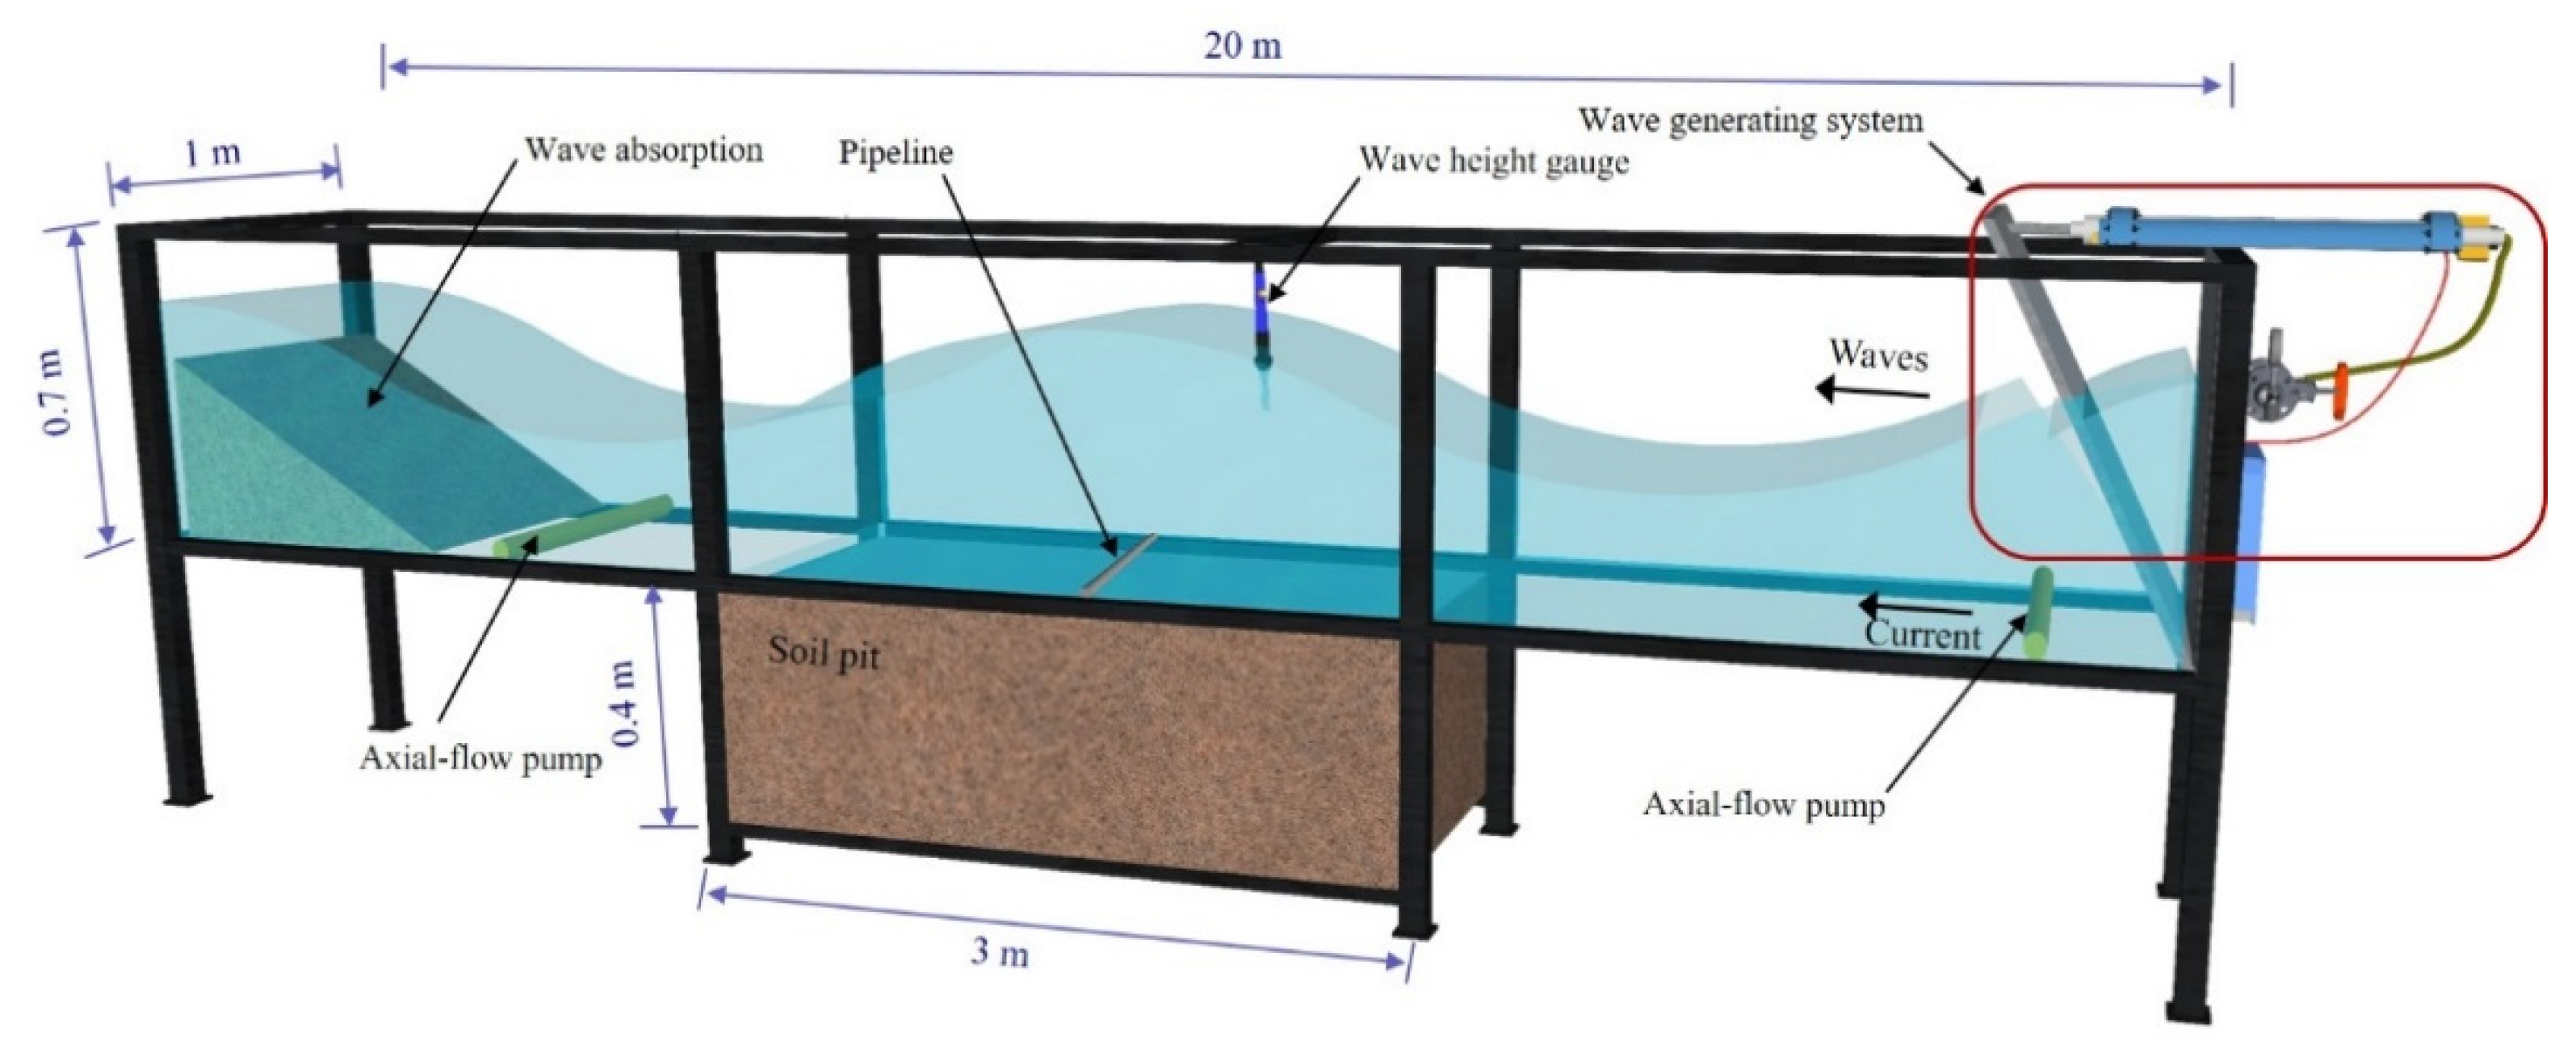
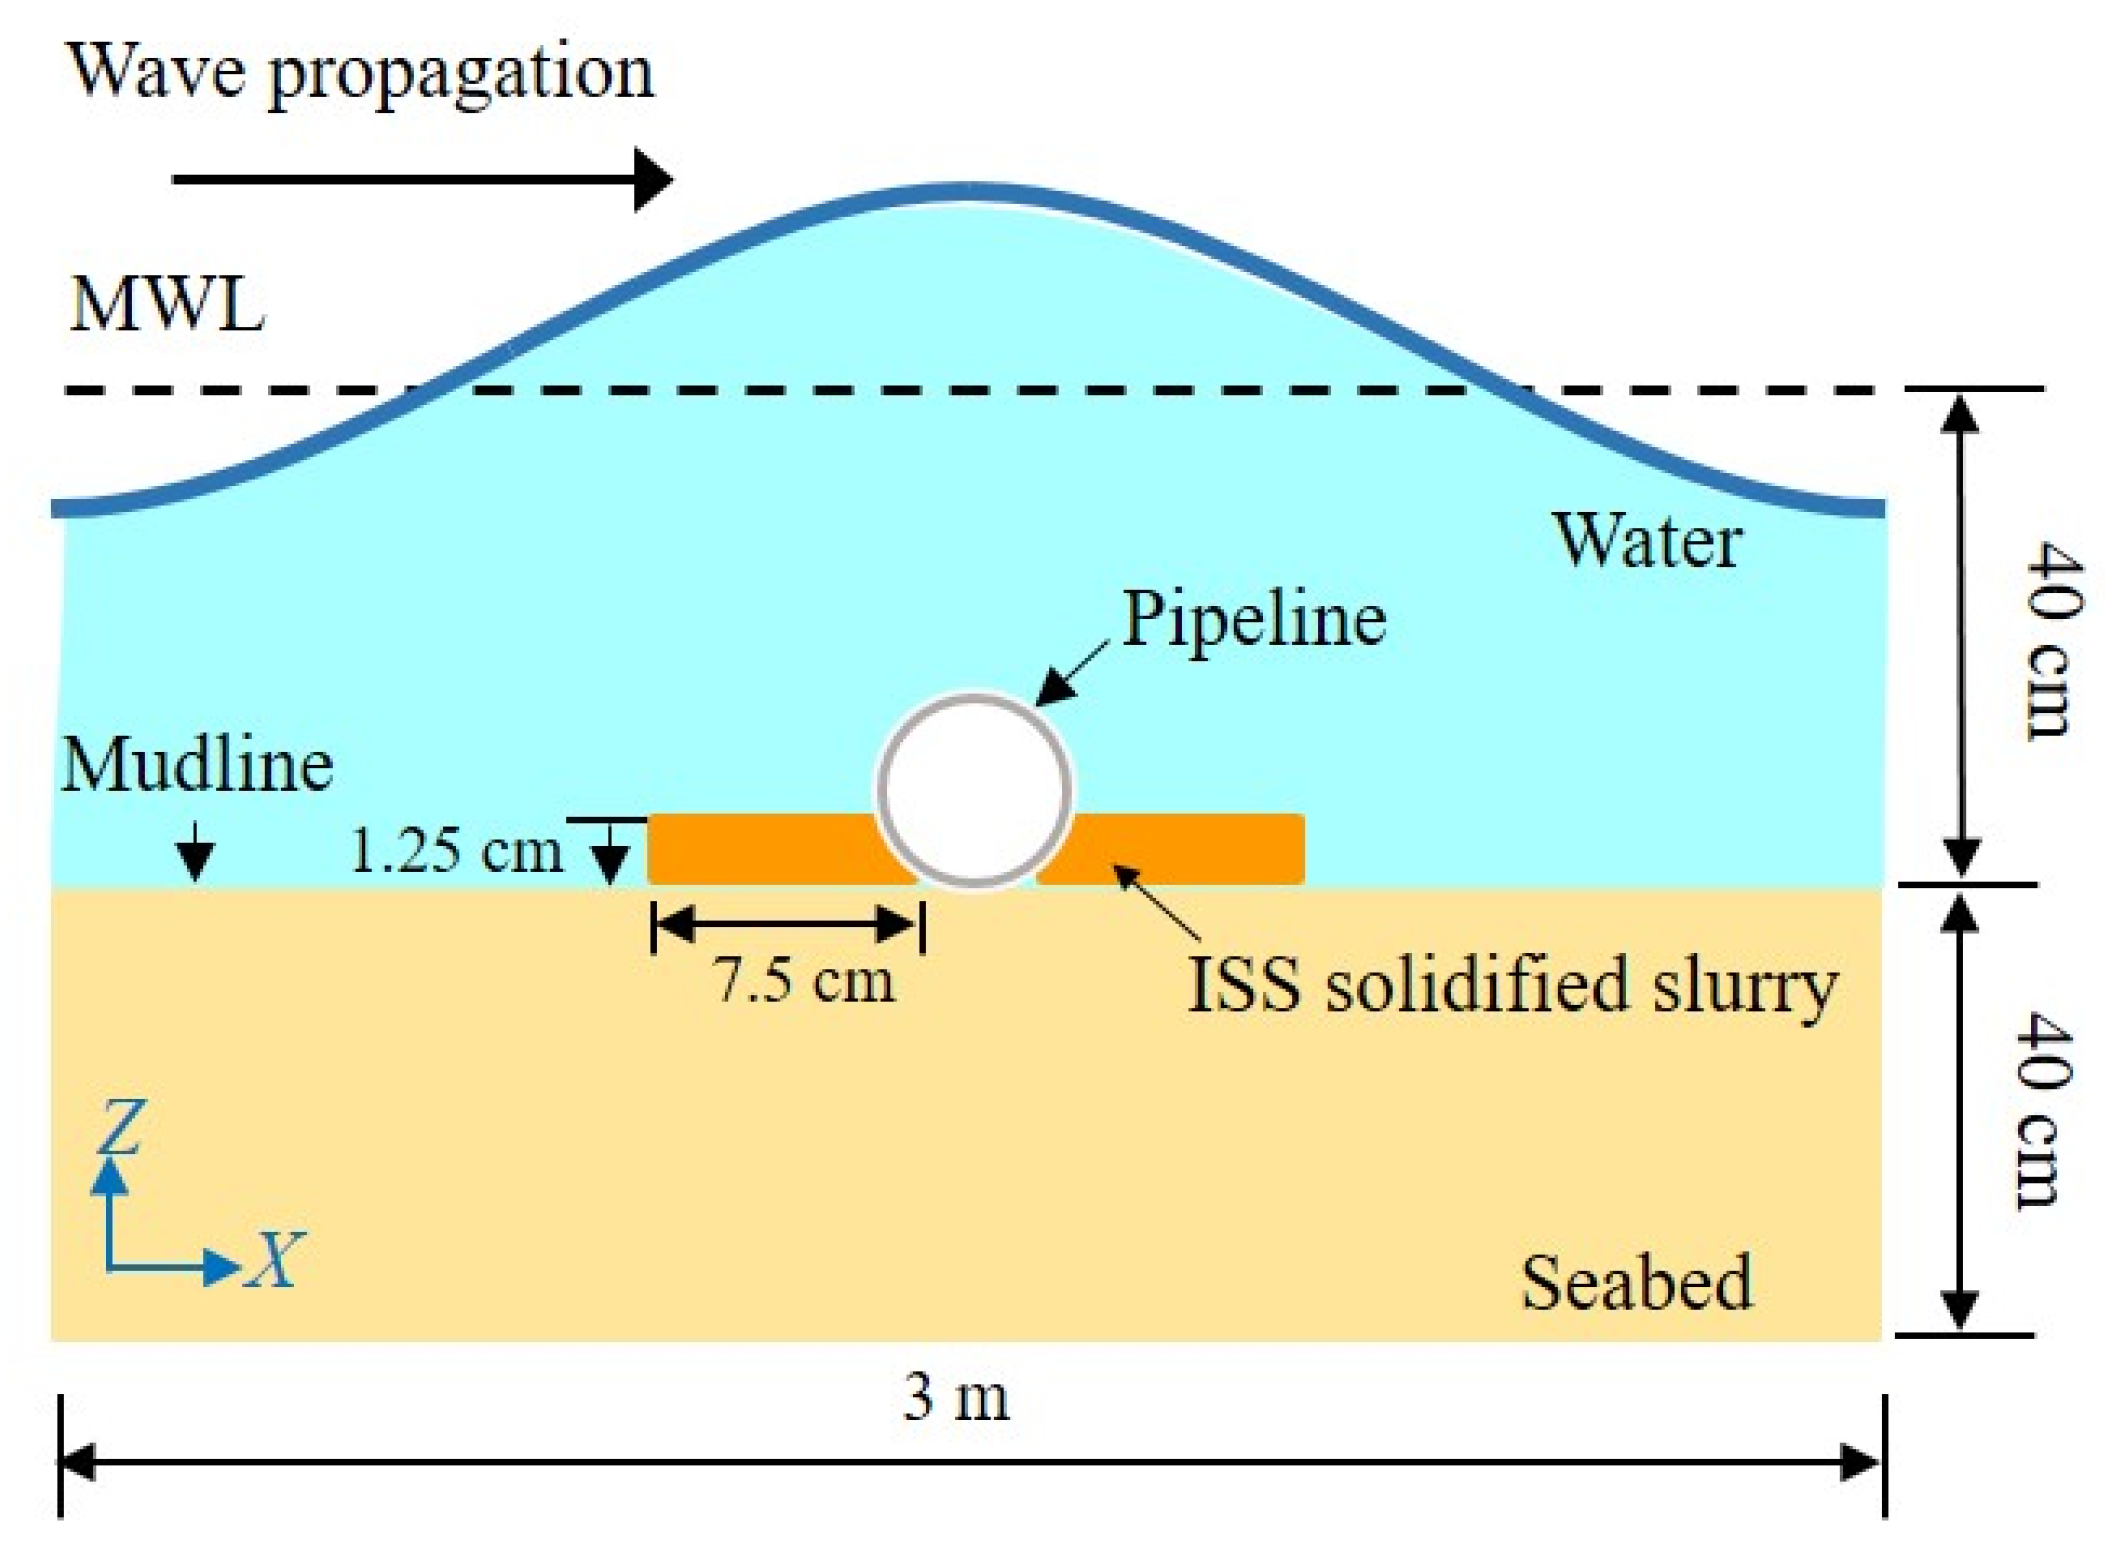
2. Tests Design
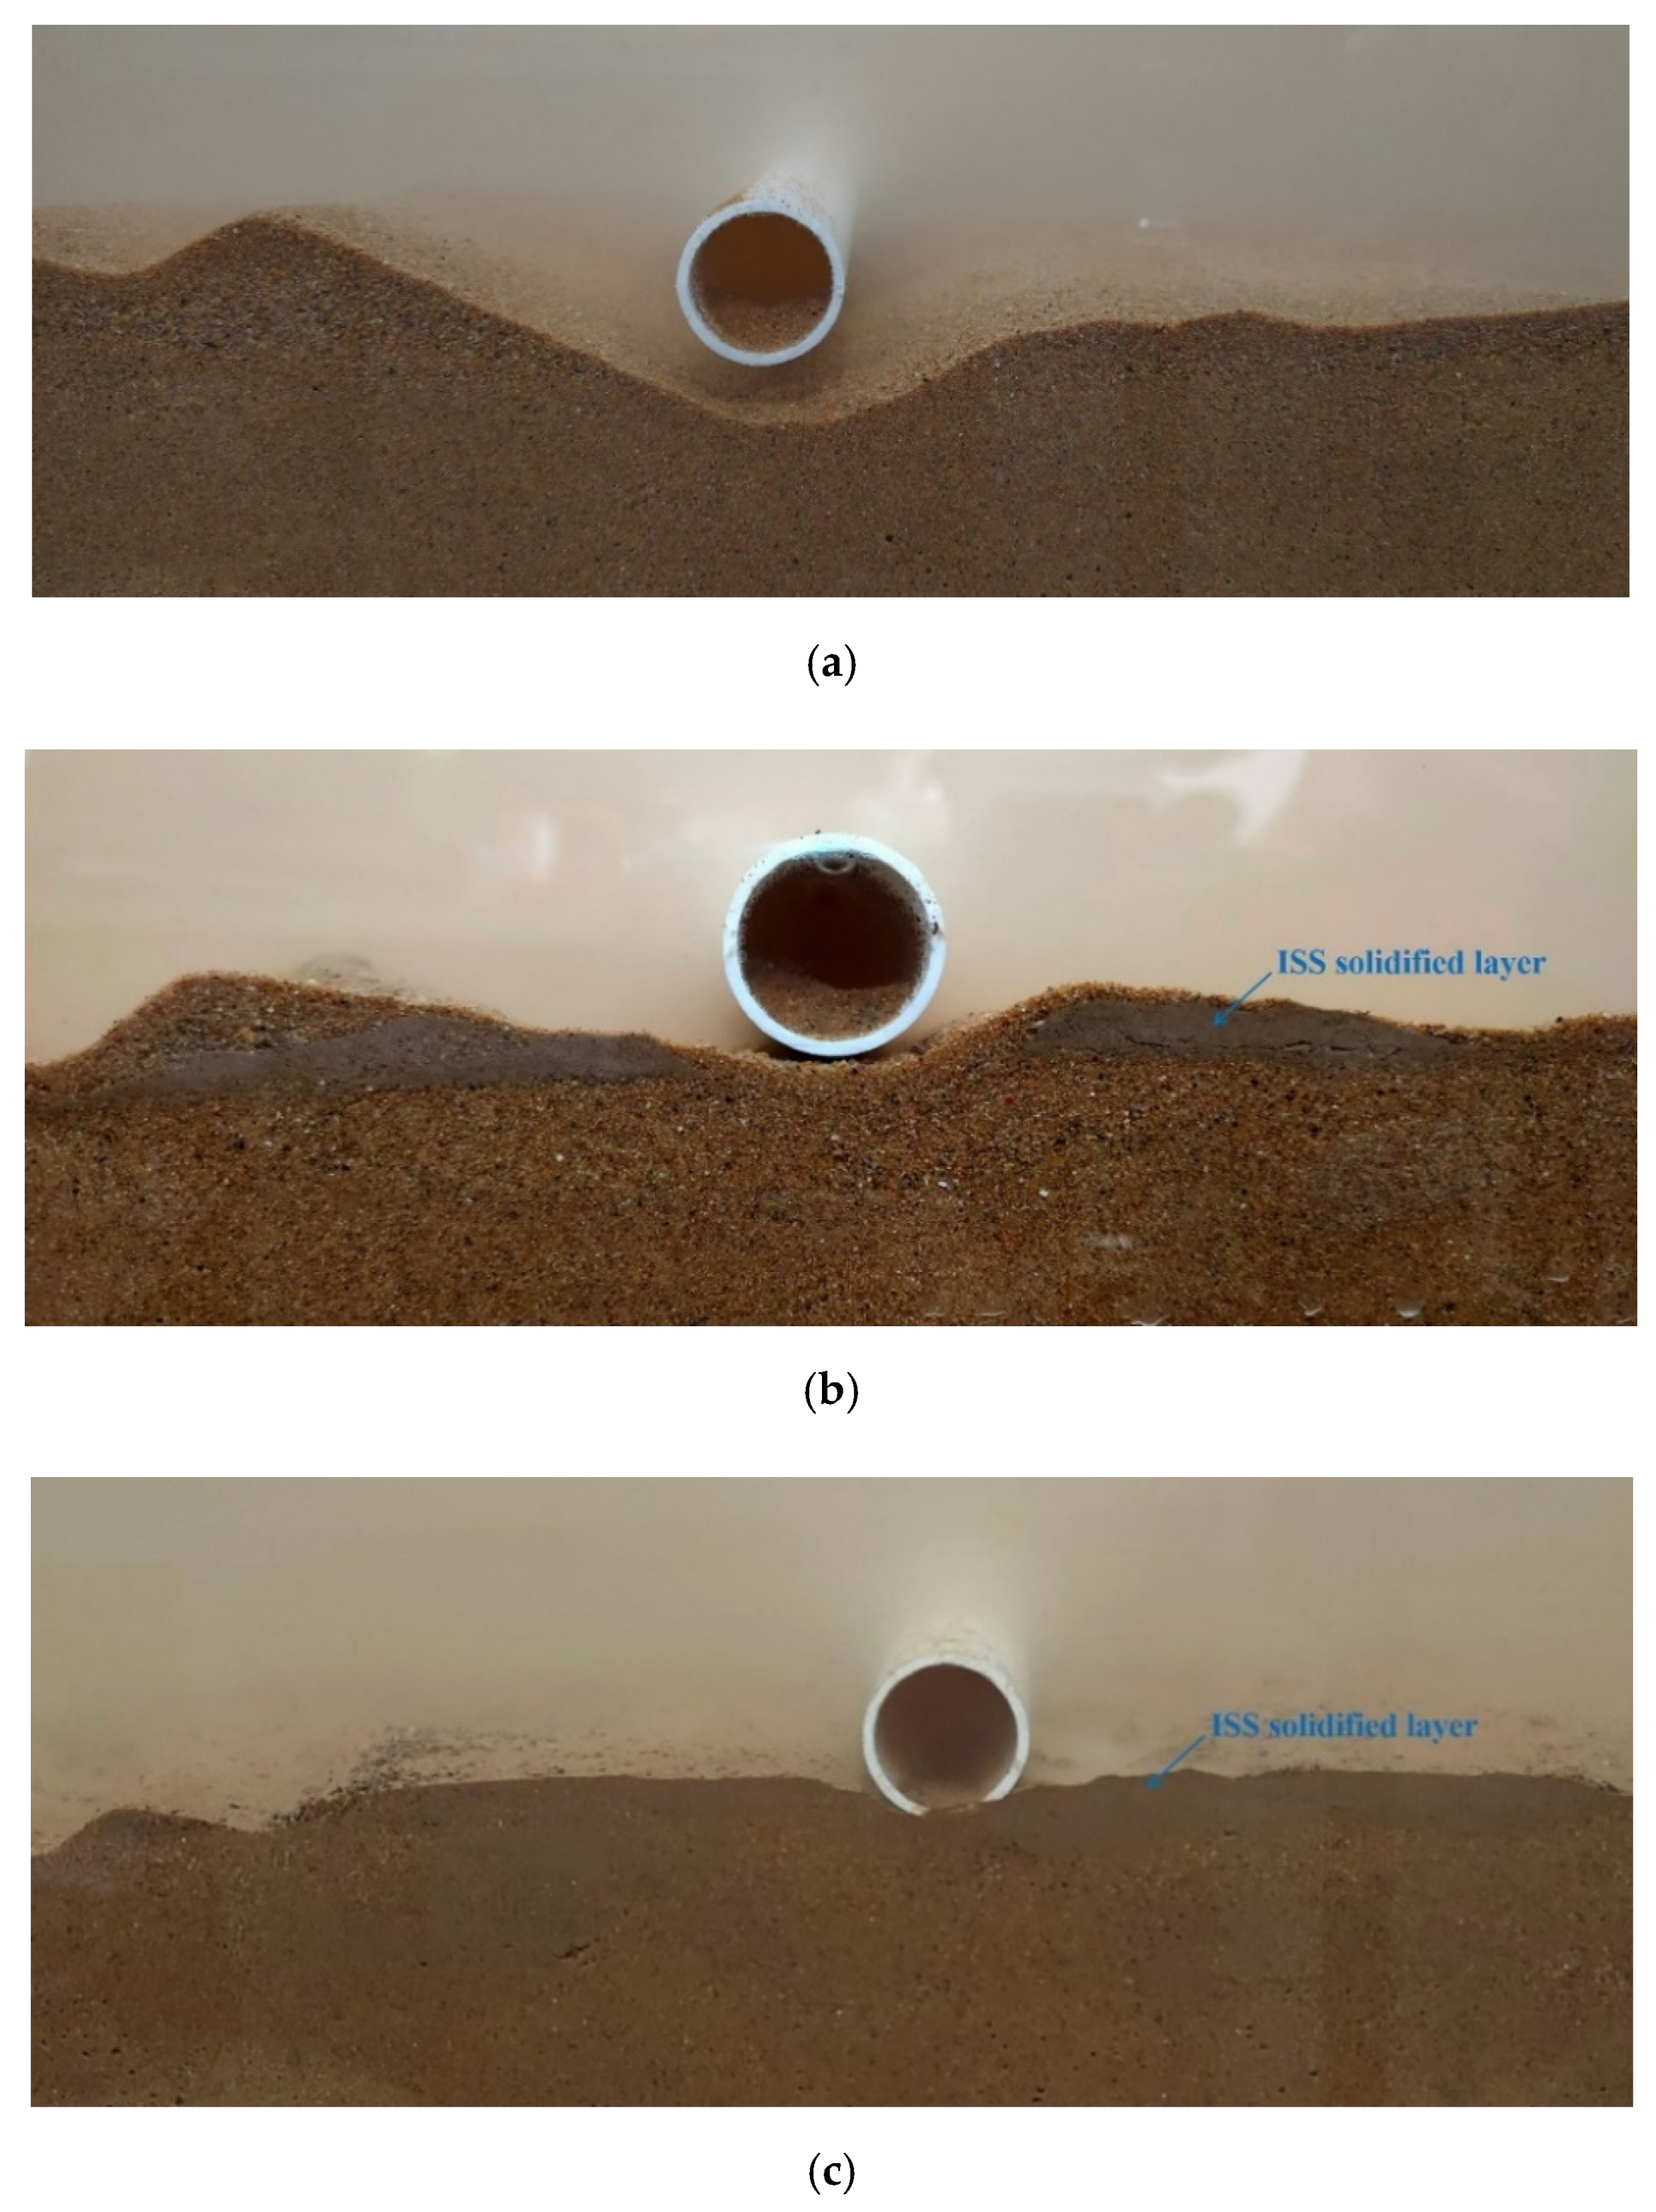
3. Scour Process and Scour Profile
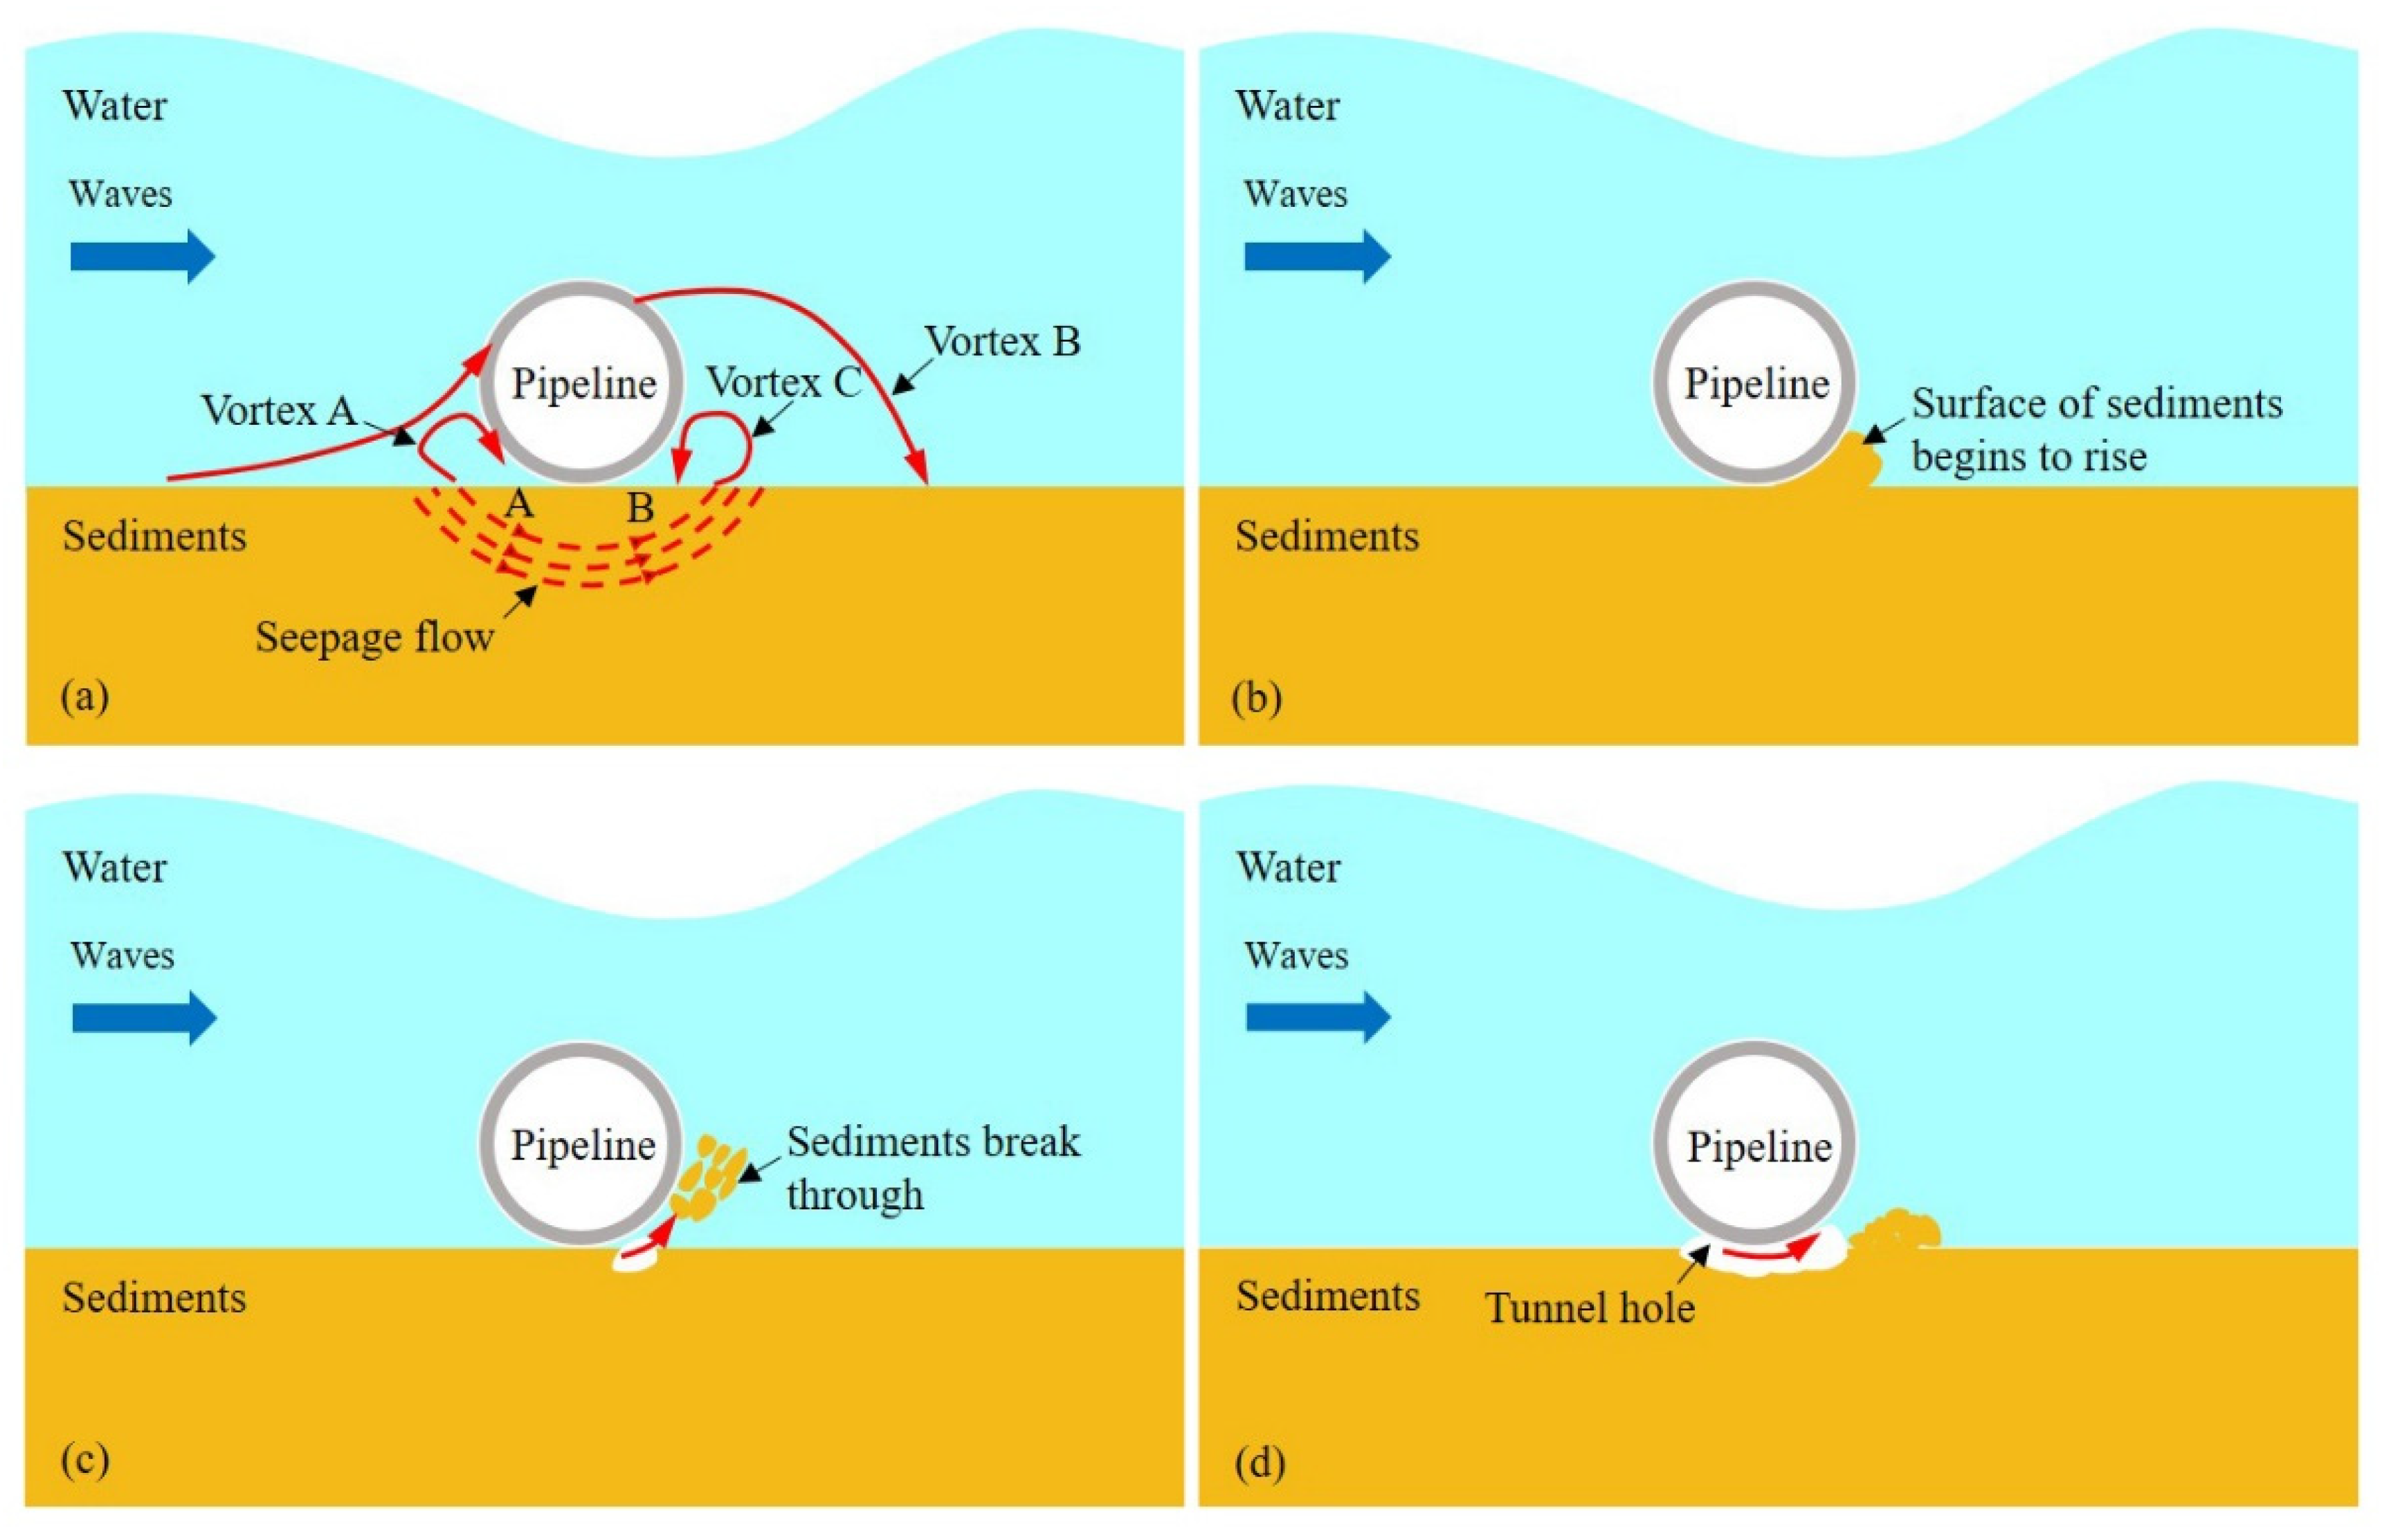
4. Mechanism of ISS for Scour Protection Beneath Pipeline
5. The Effects of ISS-solidified Layer for Liquefaction around the Pipeline
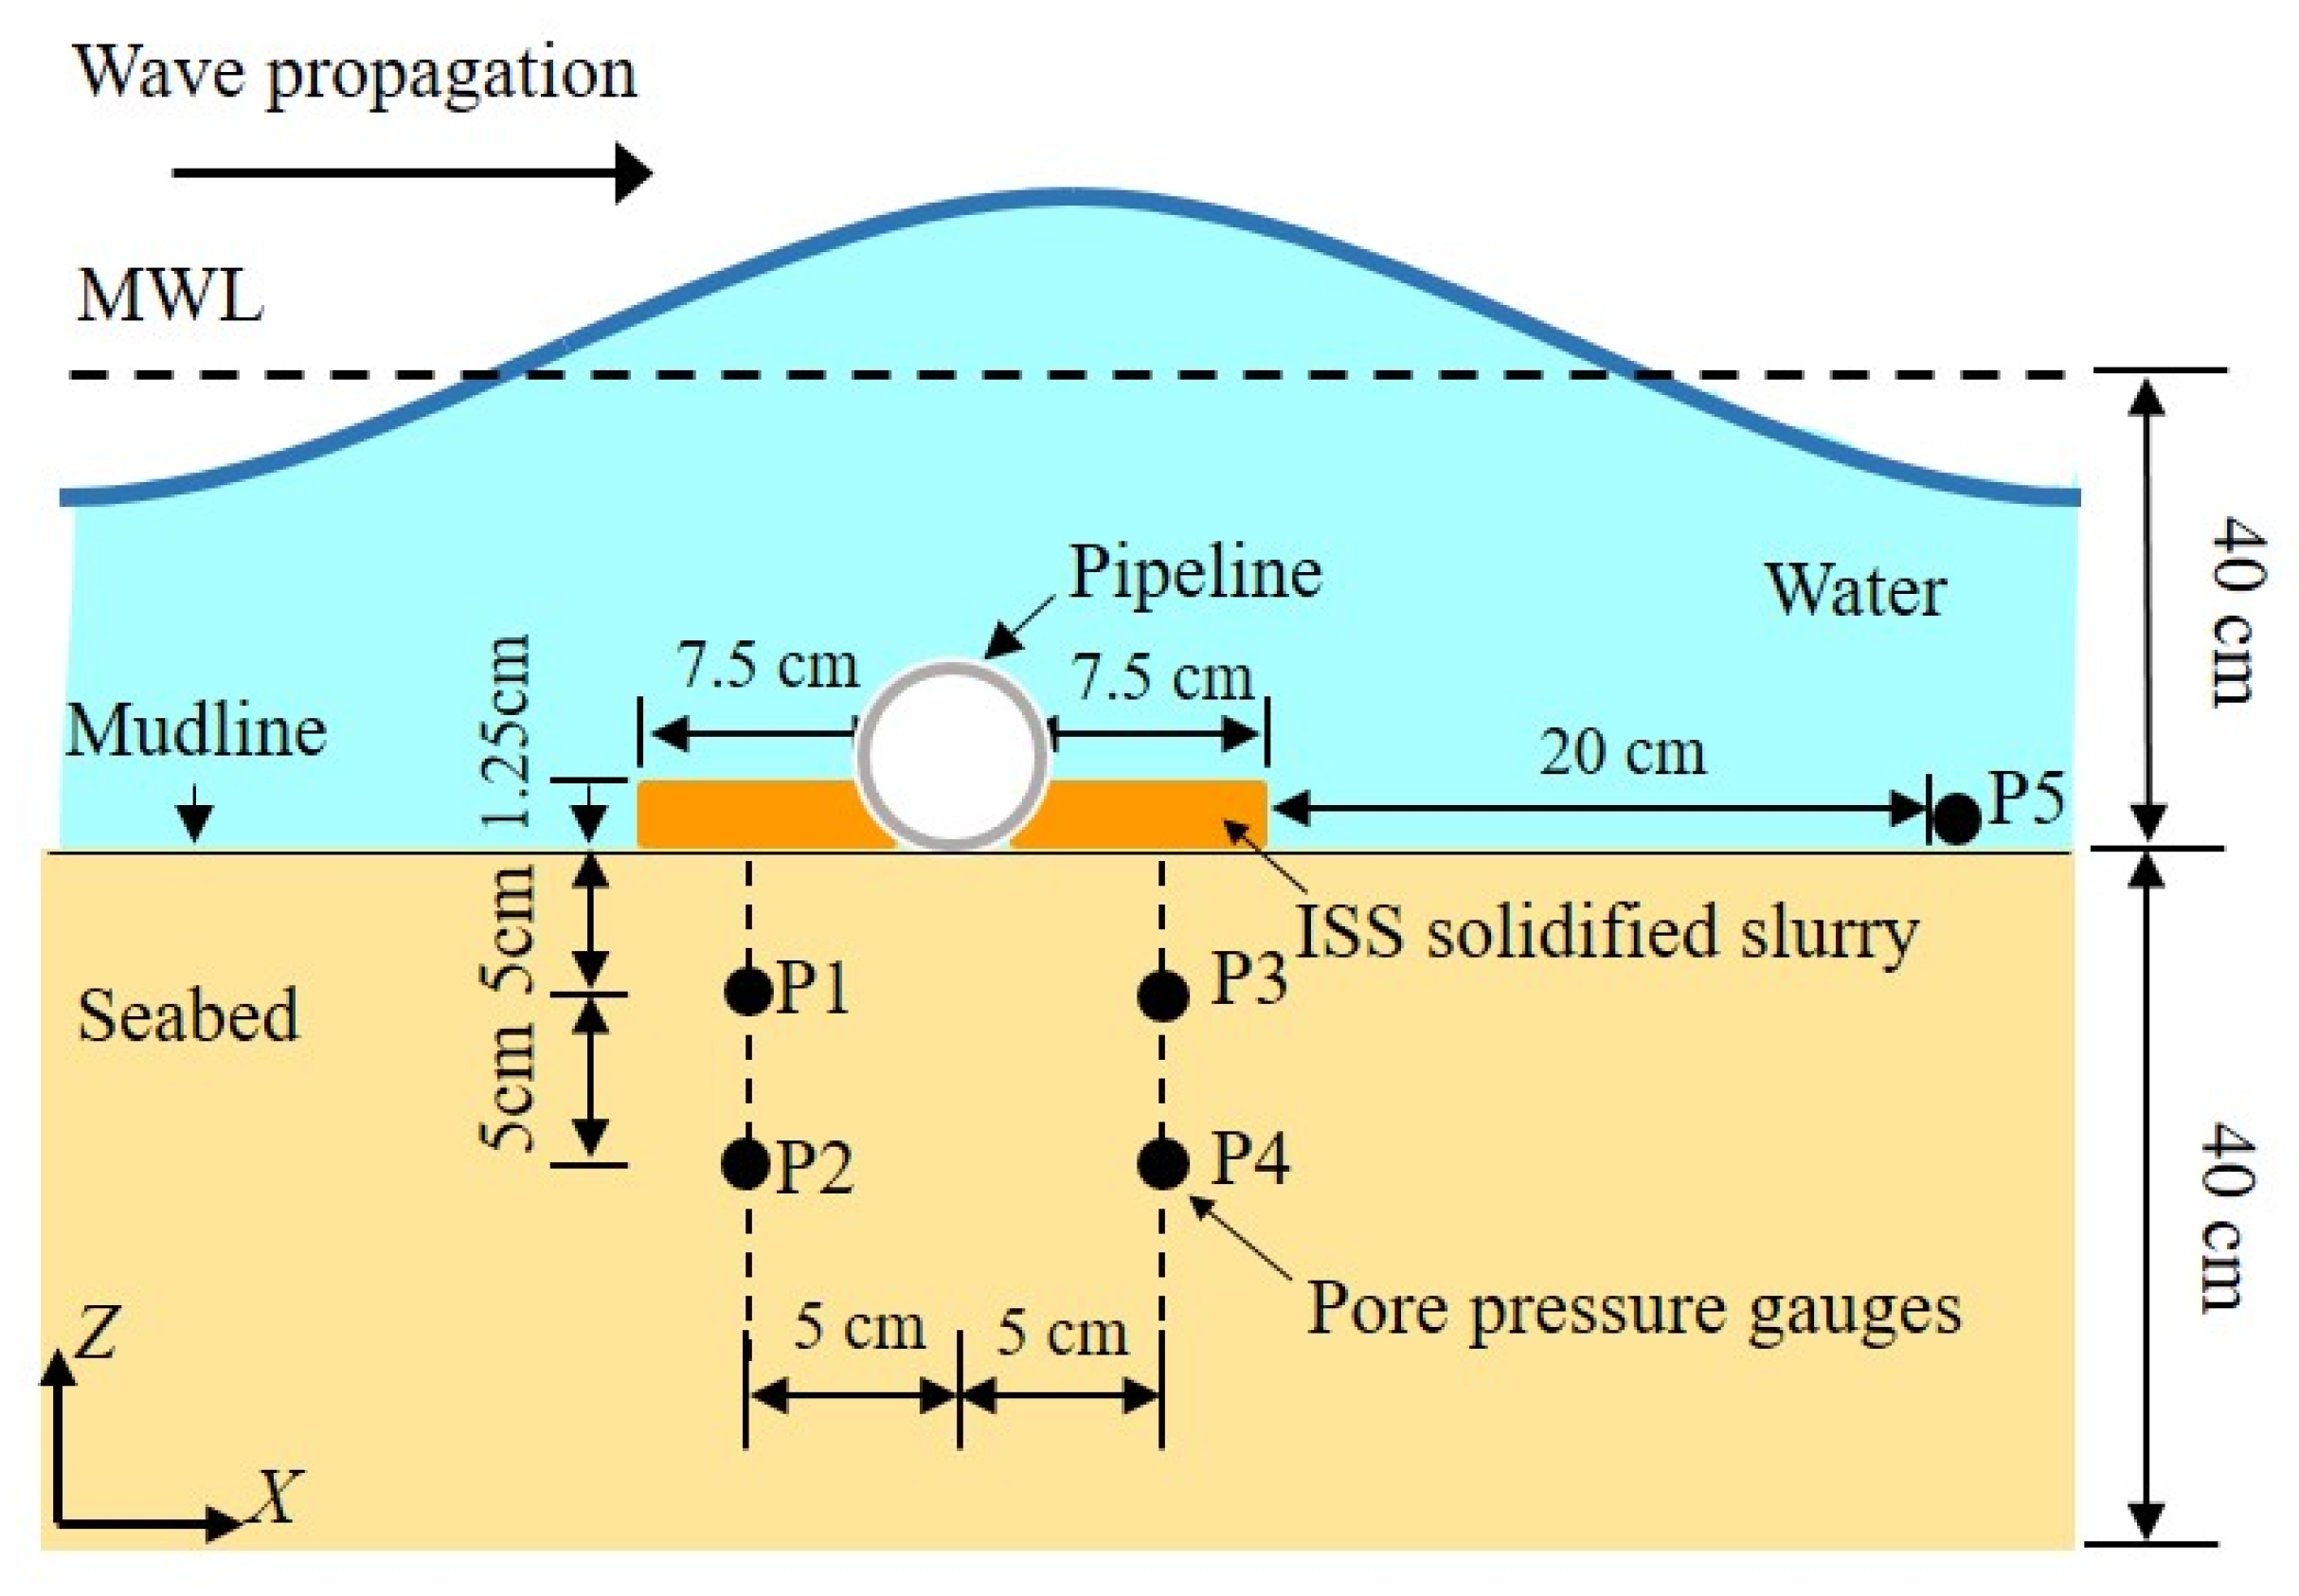
5.1. Experiments Design
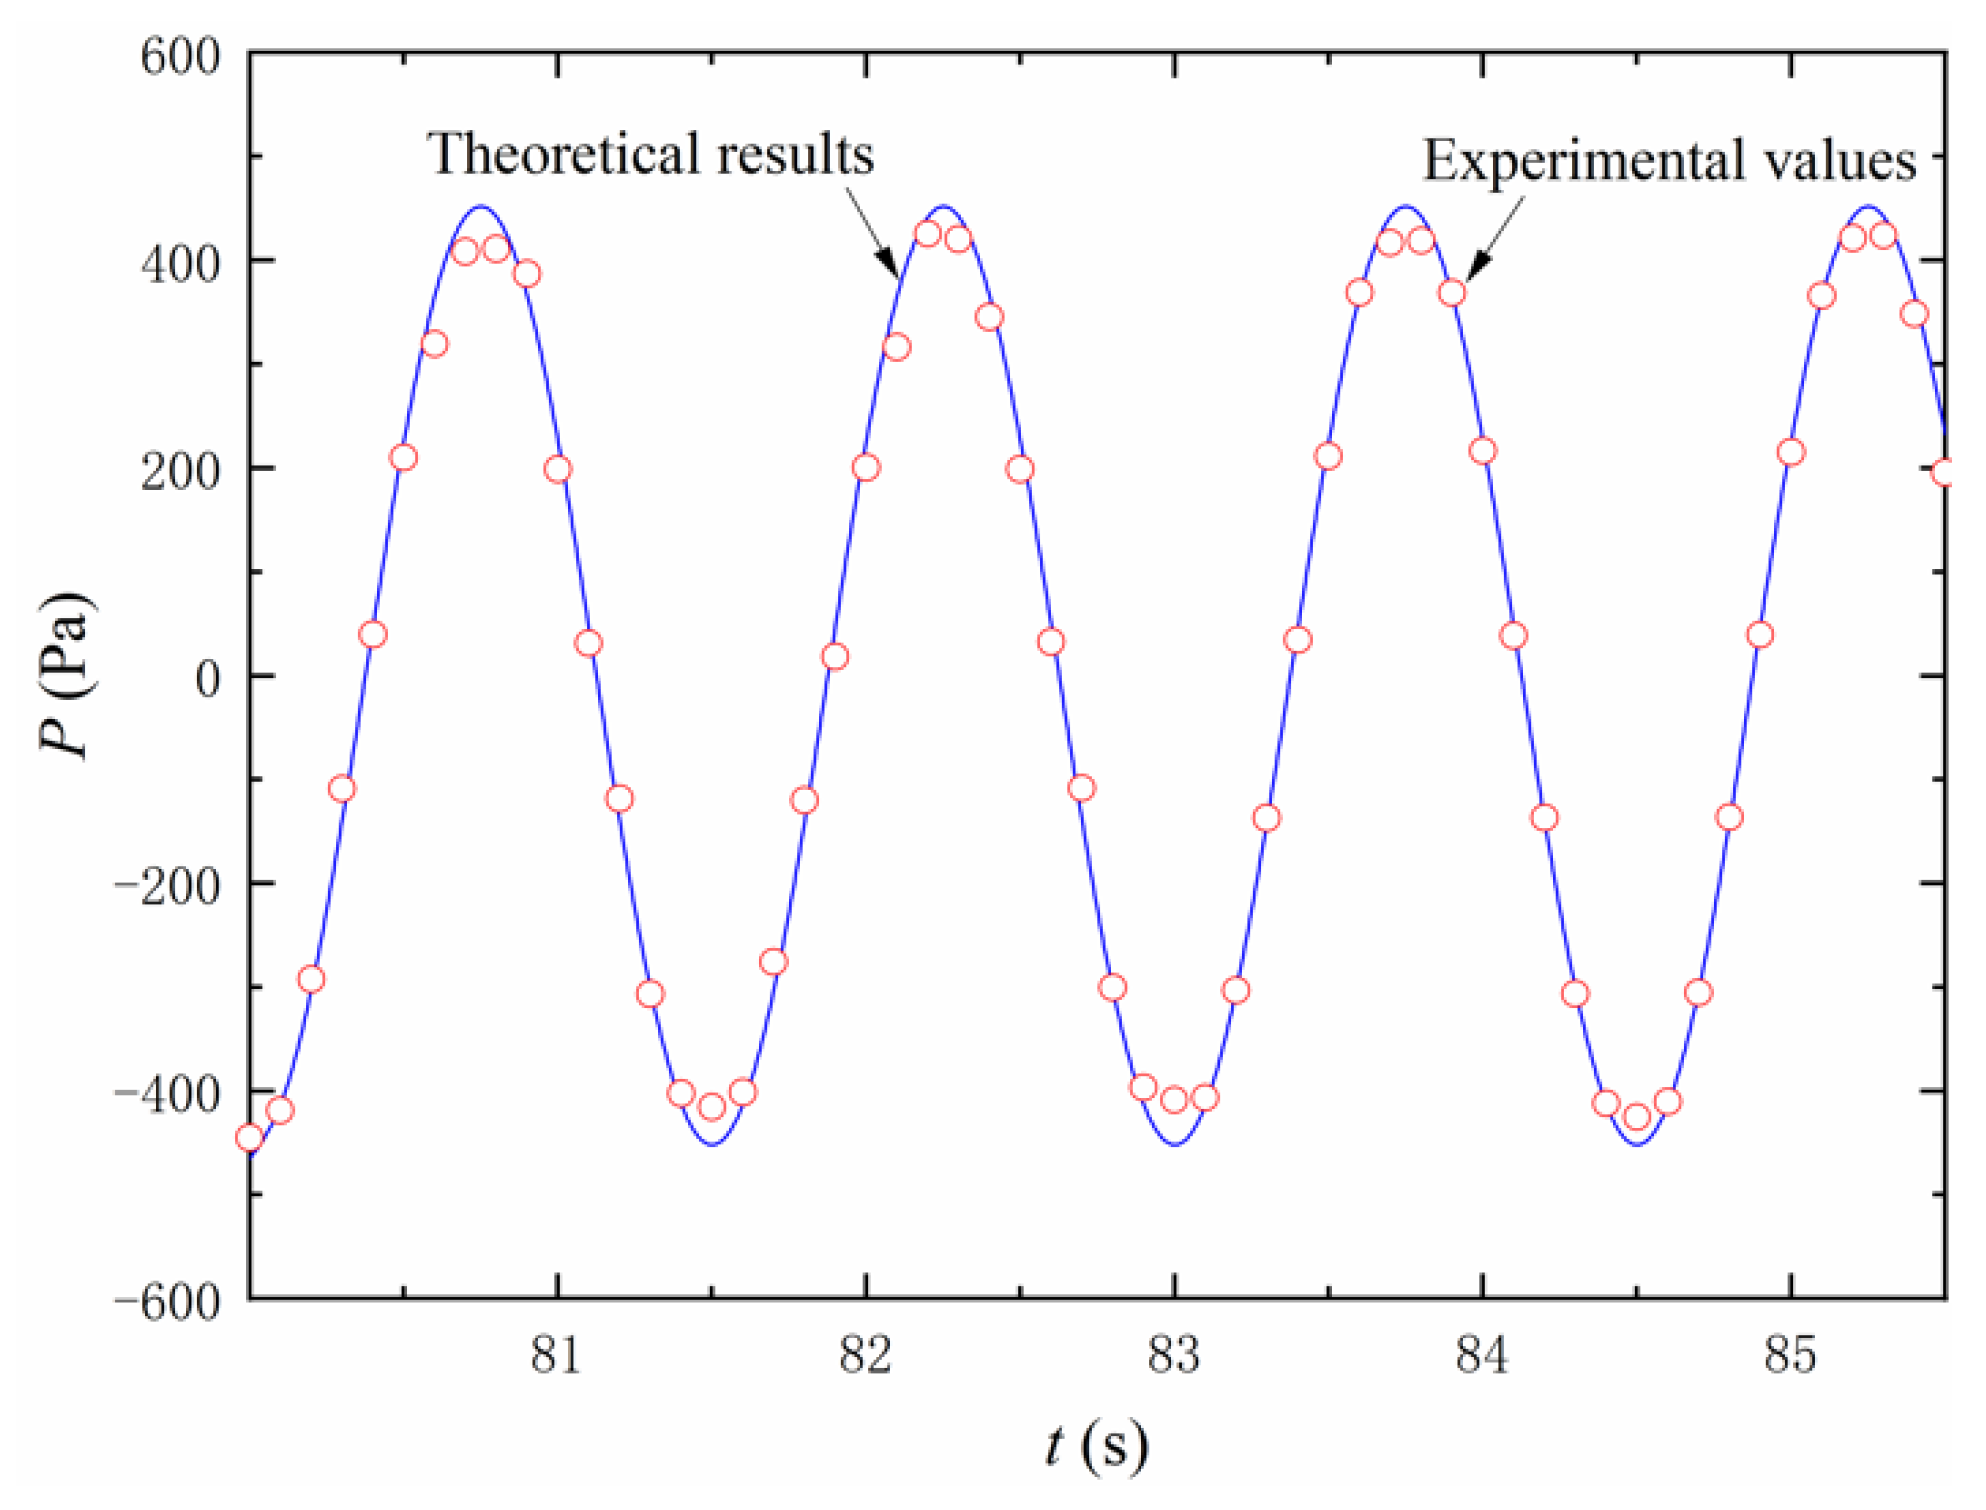
5.2. Validation of Pore Pressure
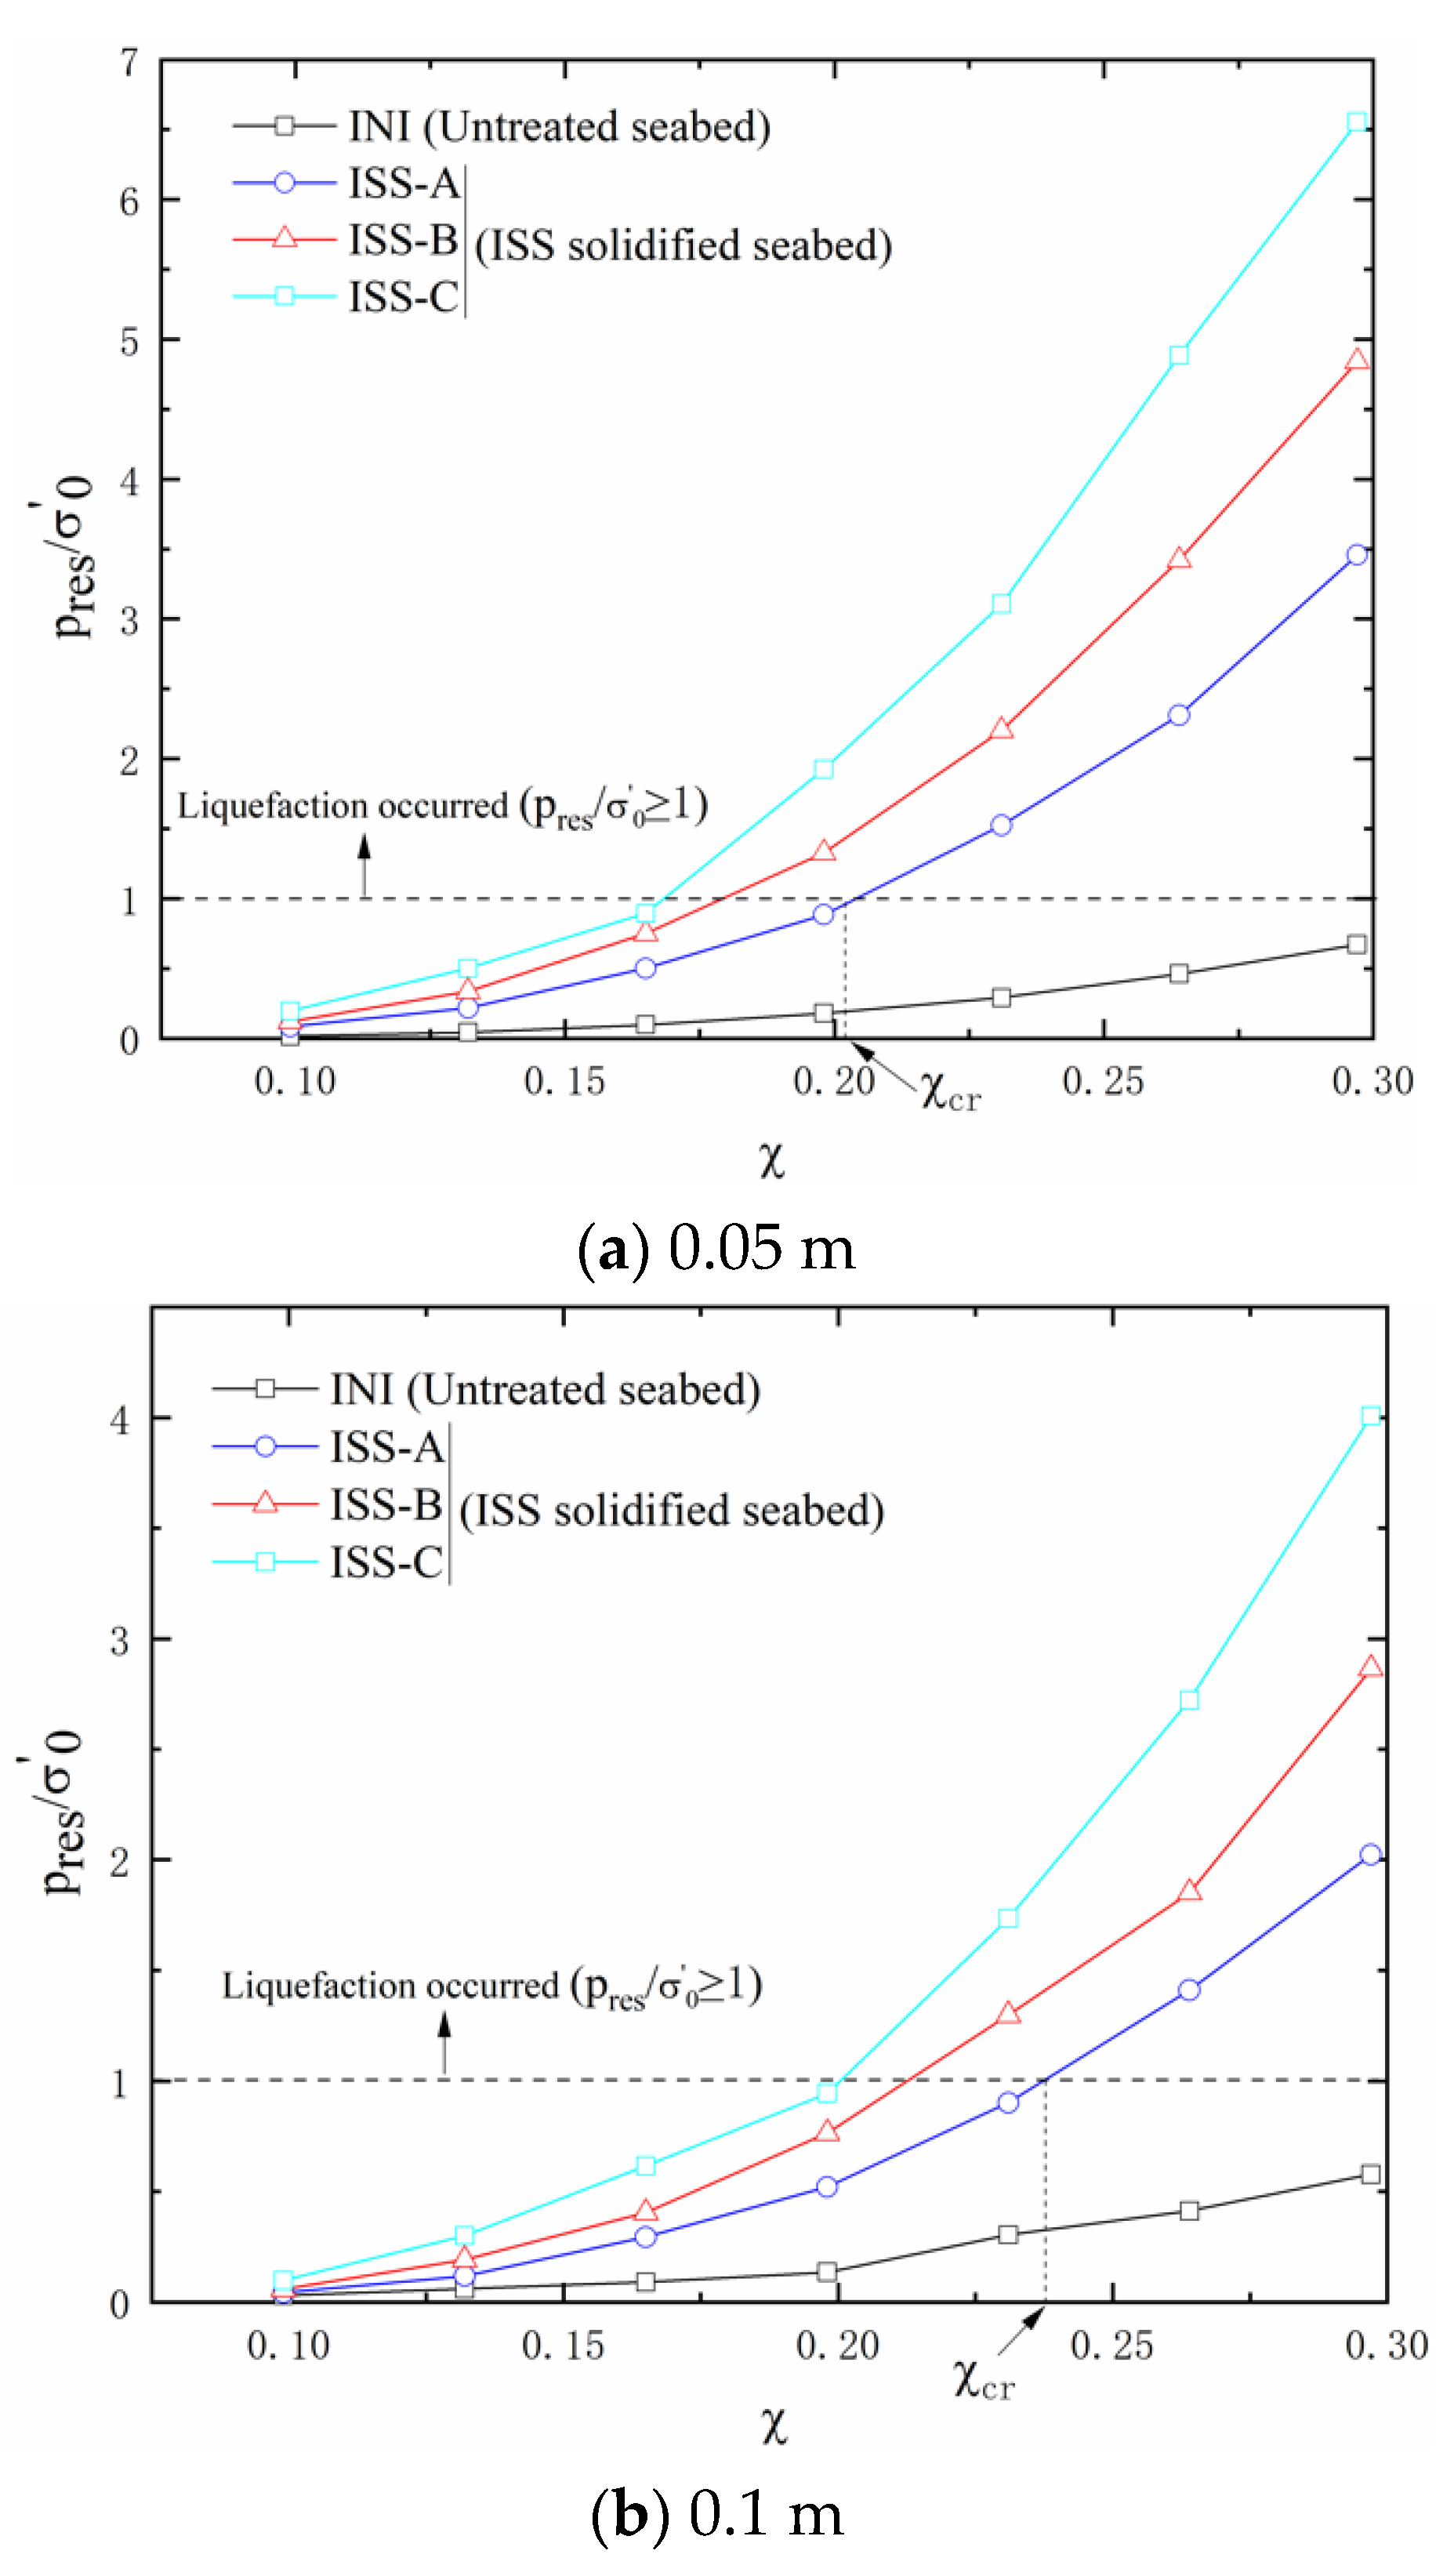
5.3. Liquefaction Evaluation of the Seabed beneath an ISS-solidified Layer
6. Remark of ISS-solidified Layer for Scour Protection around the Pipeline
7. Conclusions
- (1)
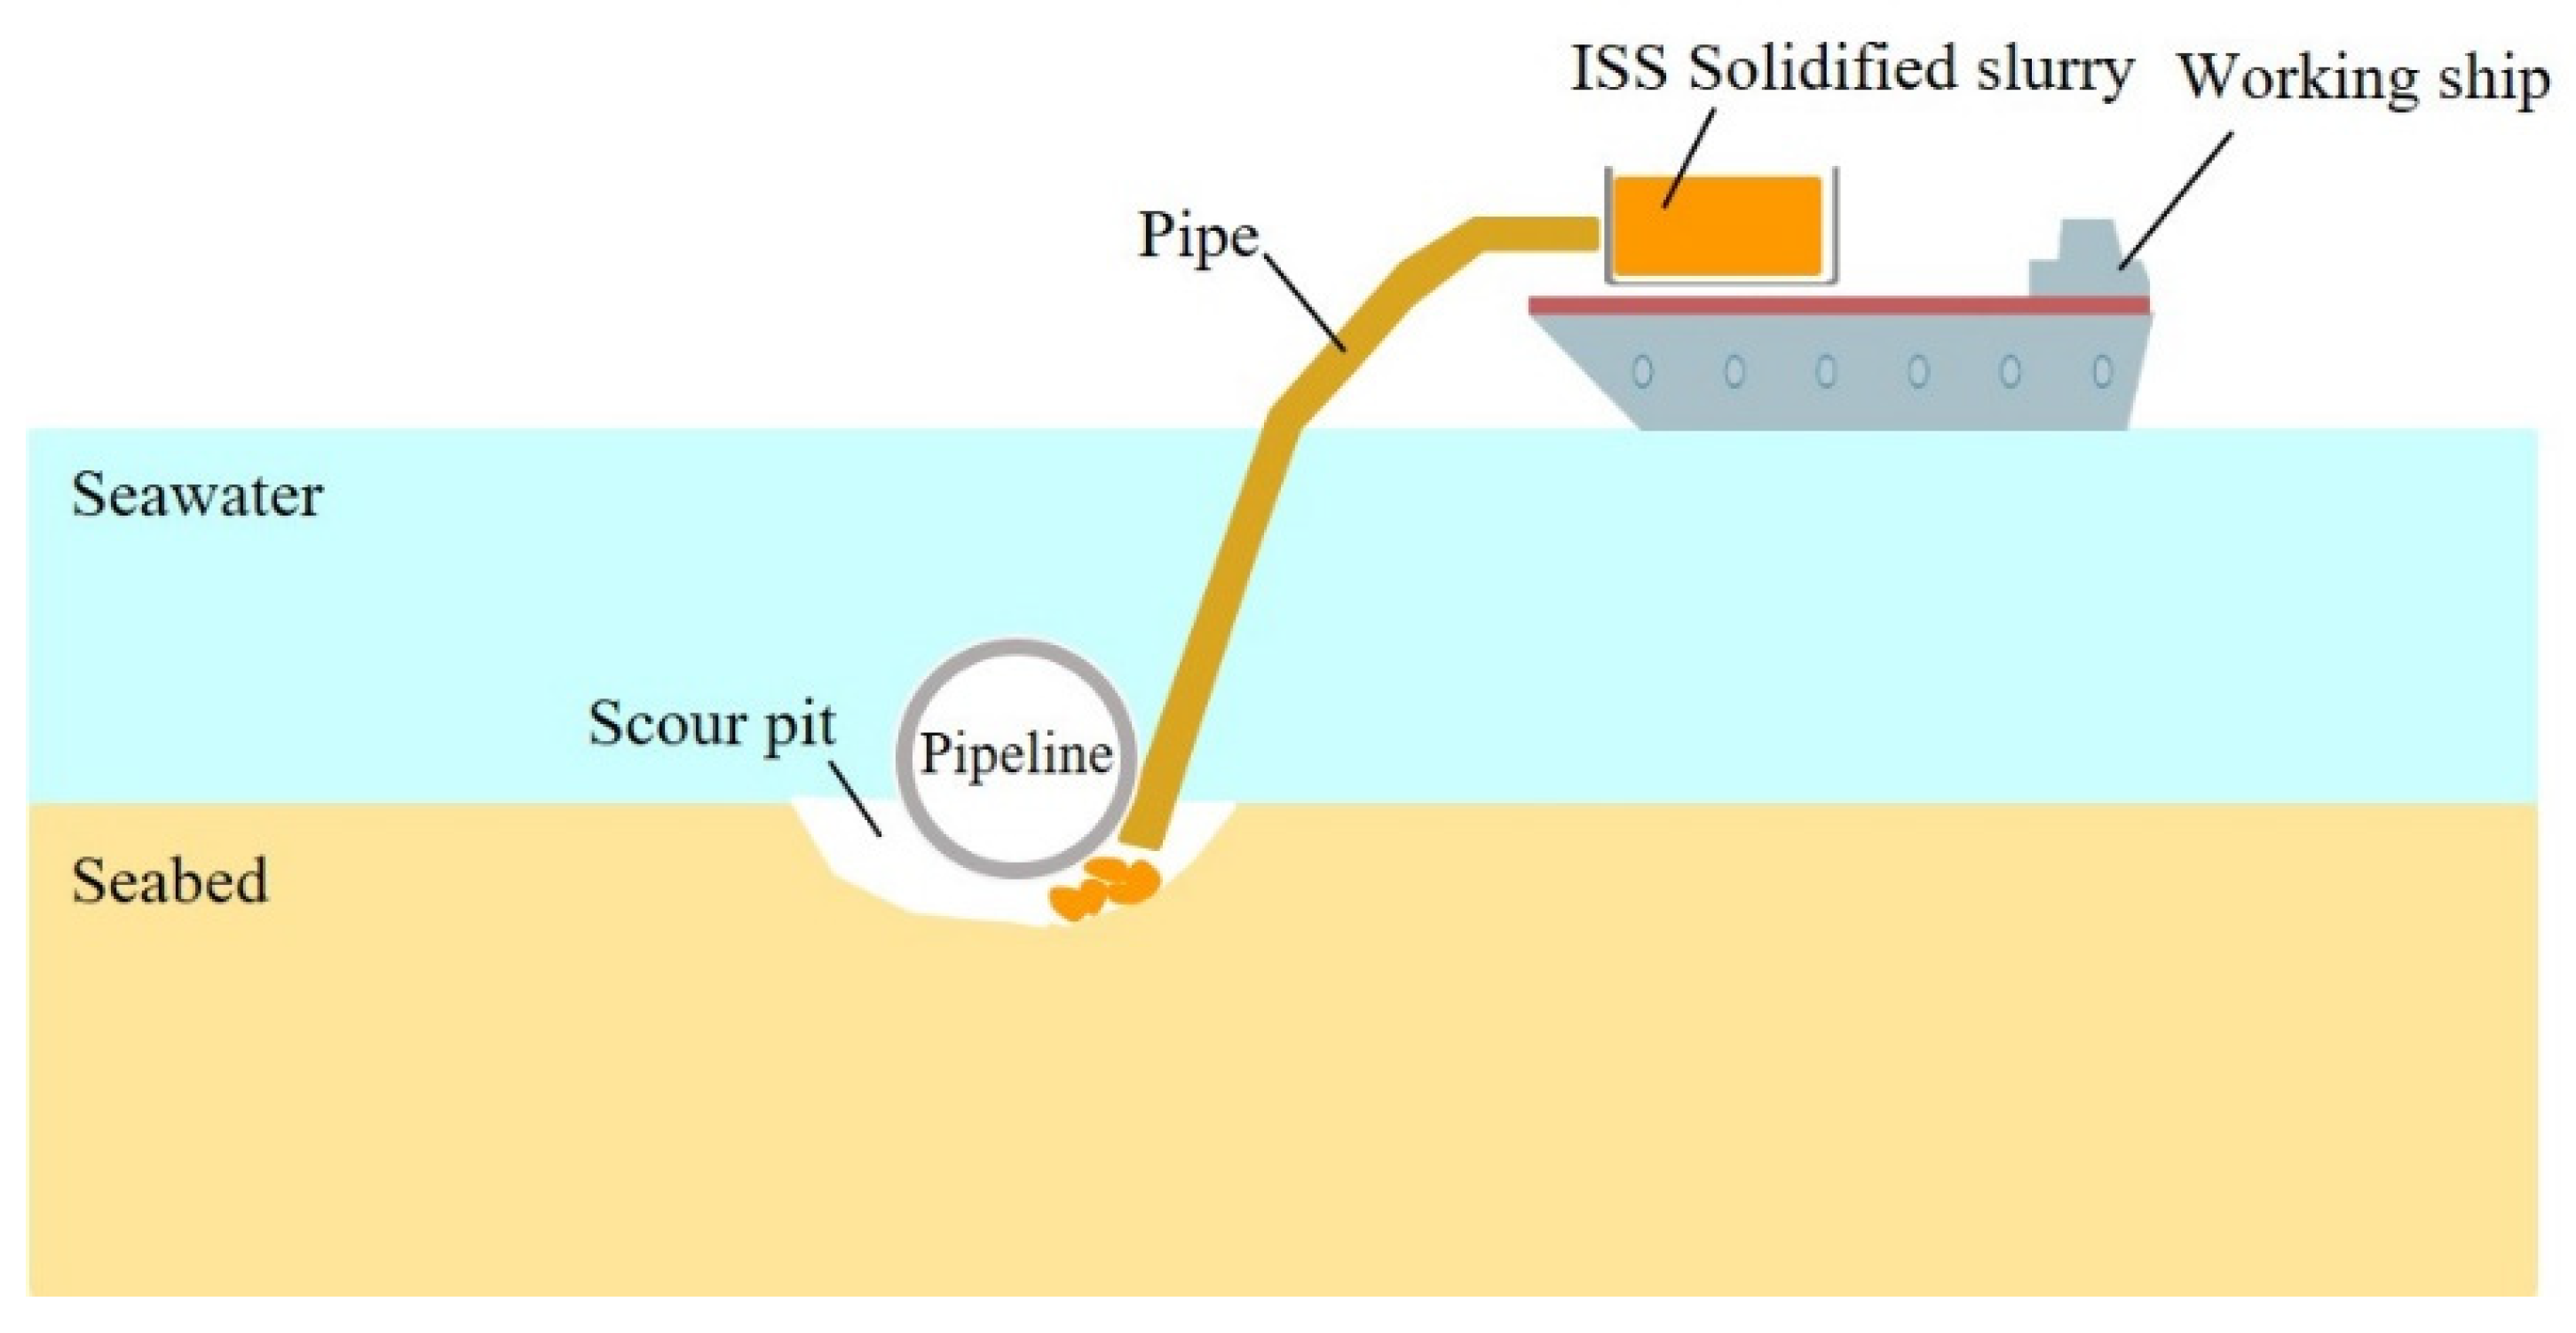
- Compared with the untreated seabed, there are almost no evident tunnel scour holes beneath the pipeline for ISS-solidified seabed, indicating the protective effects of ISS-solidified slurry for pipelines are favorable.
- (2)
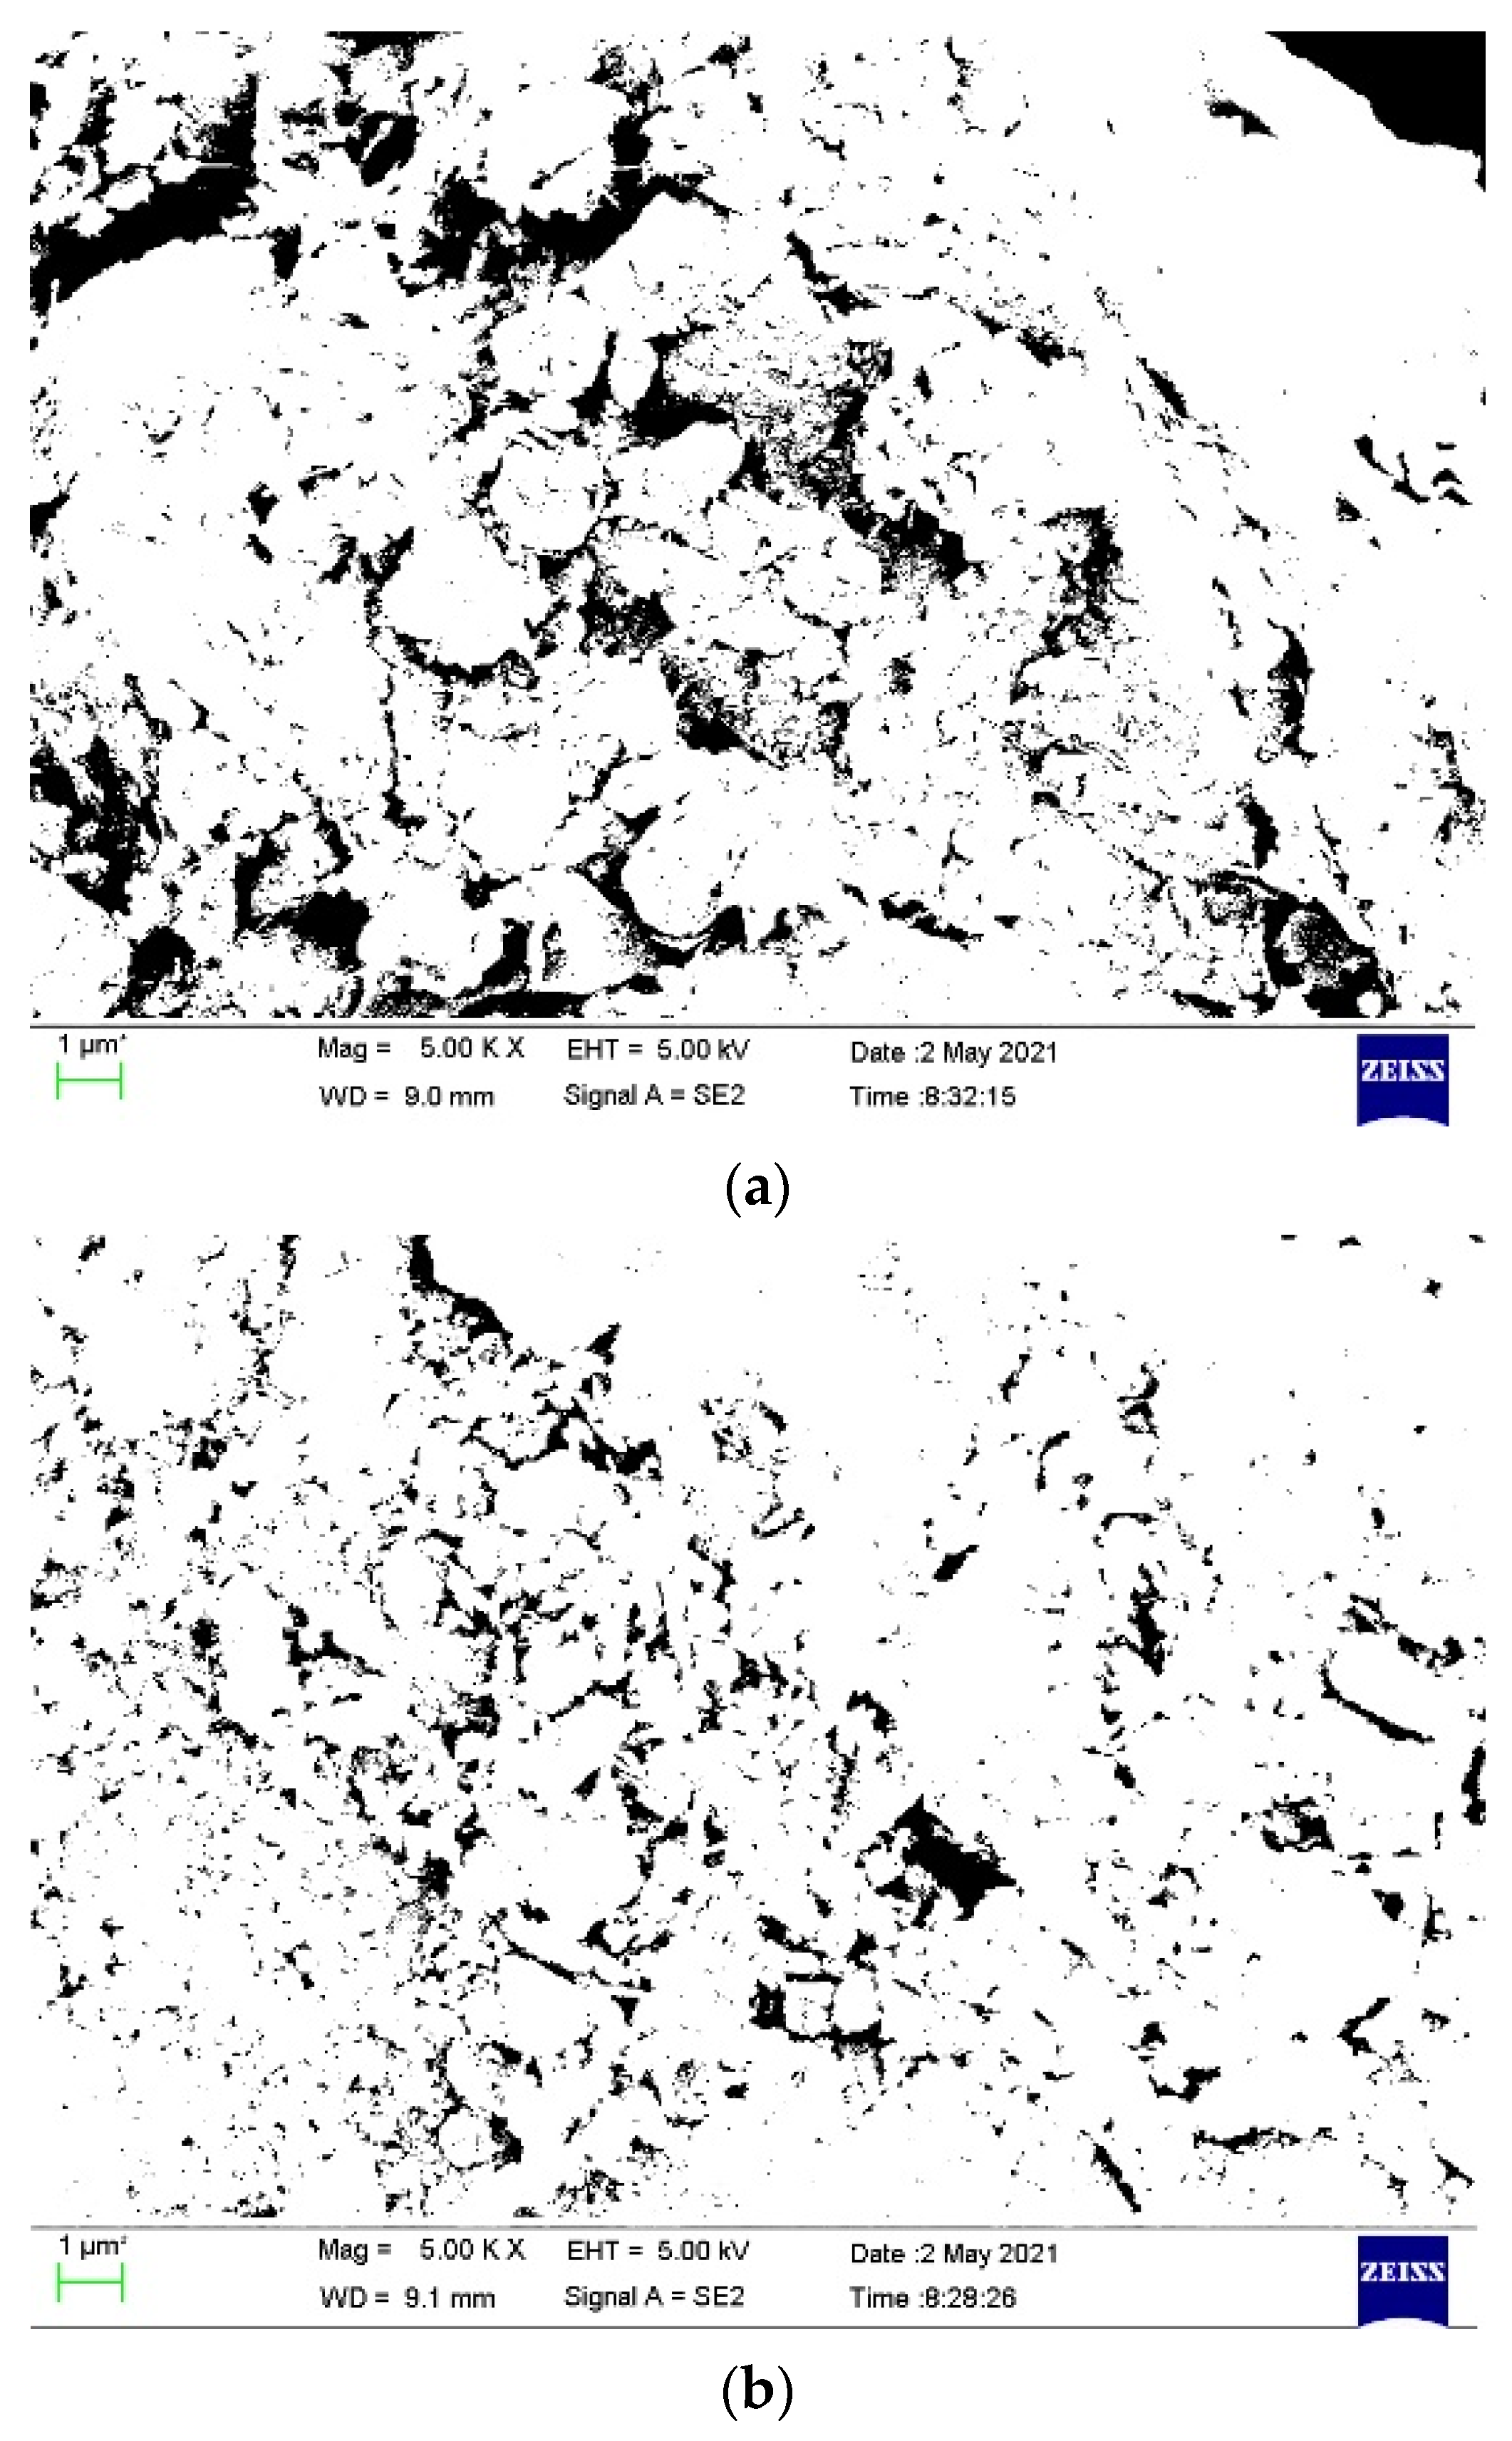
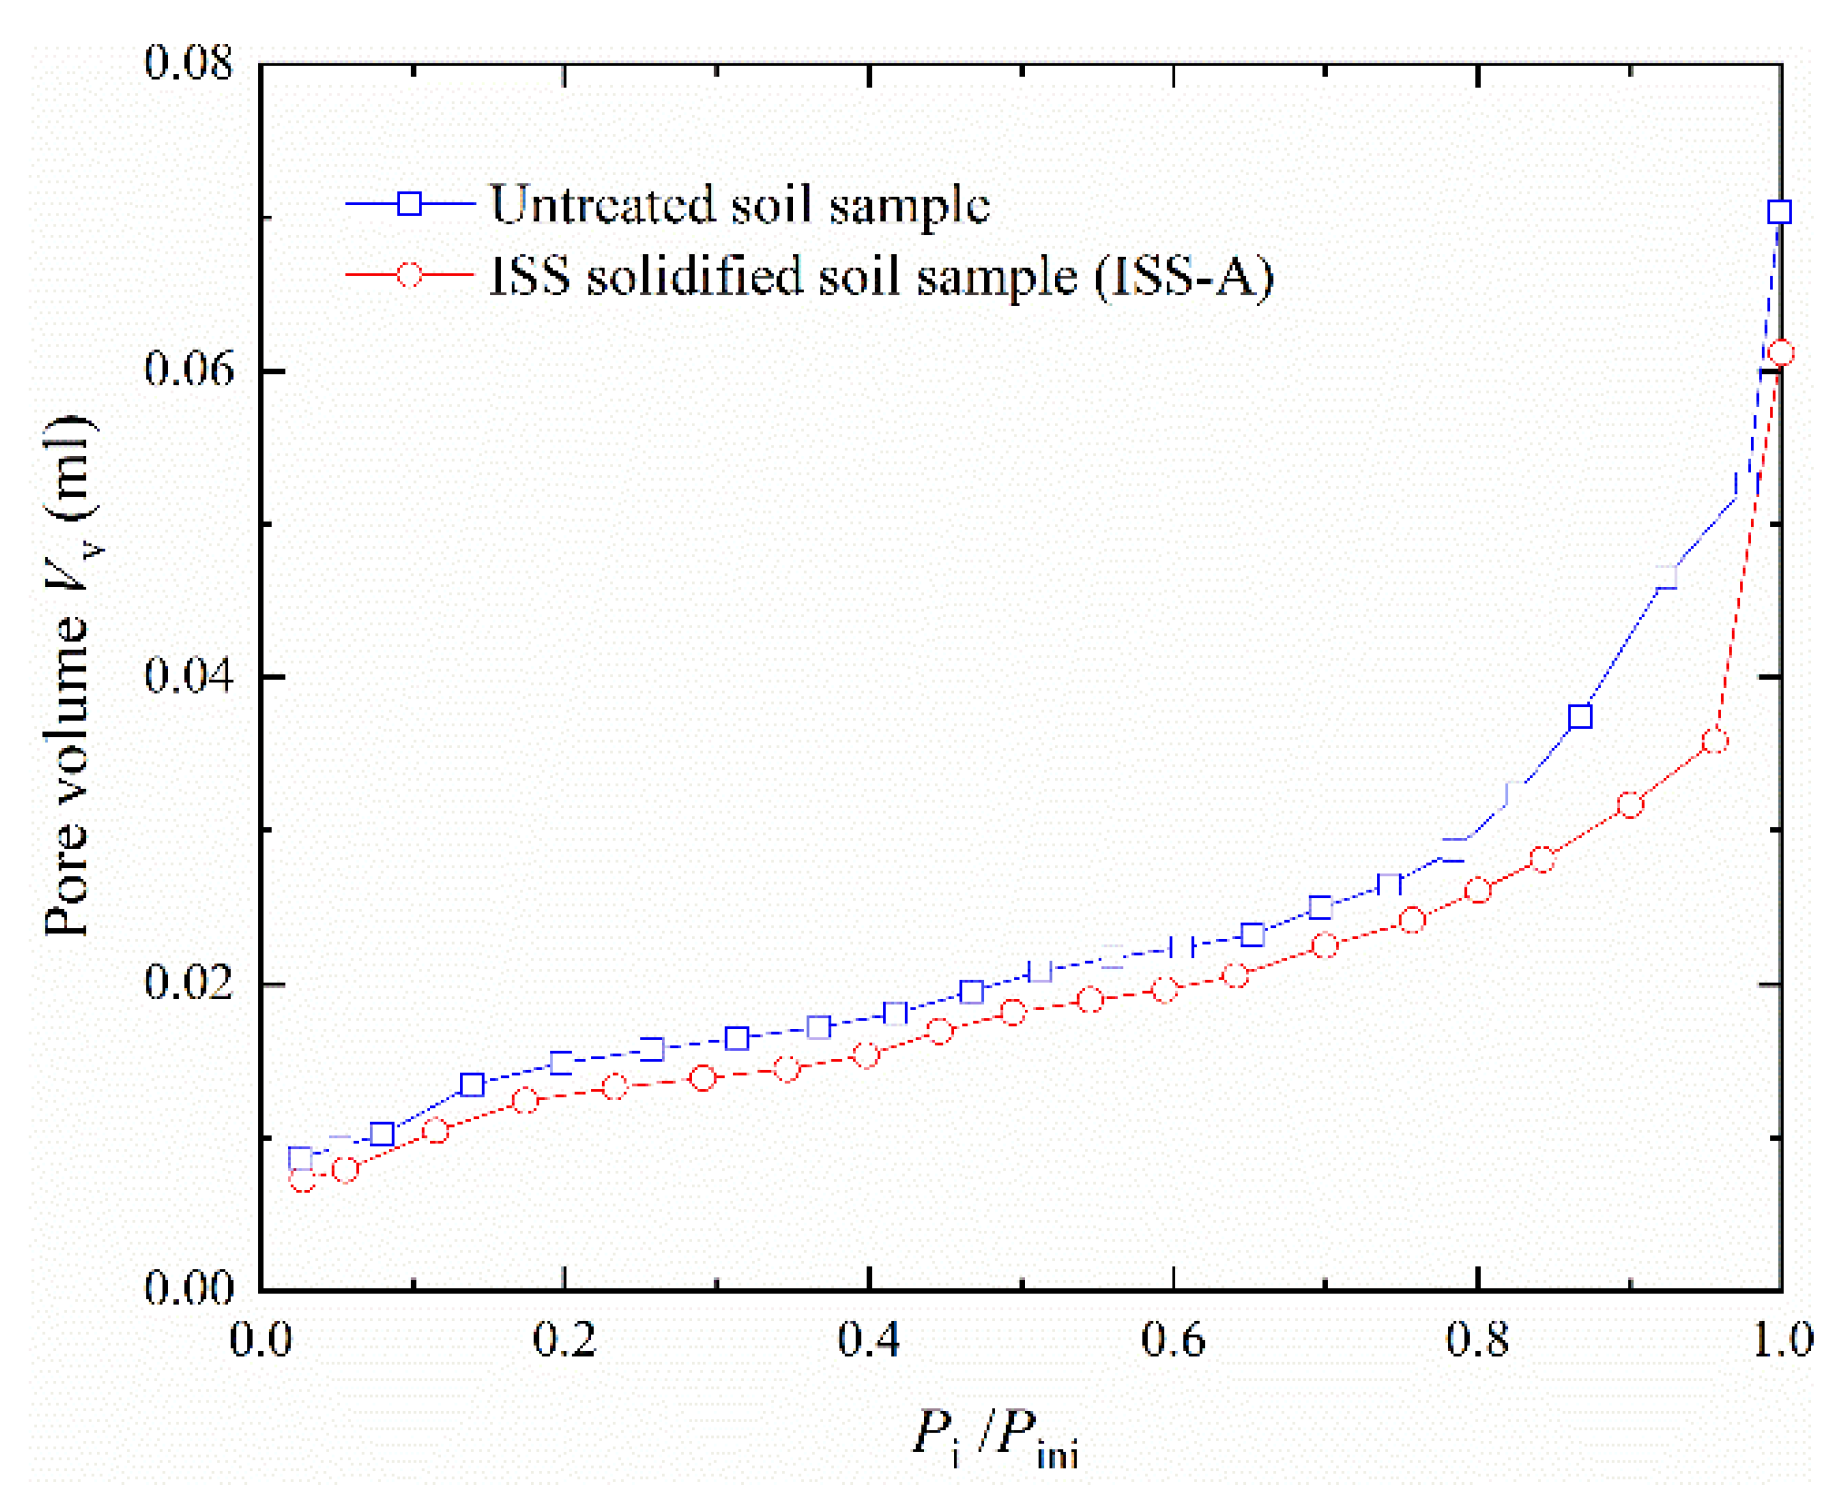
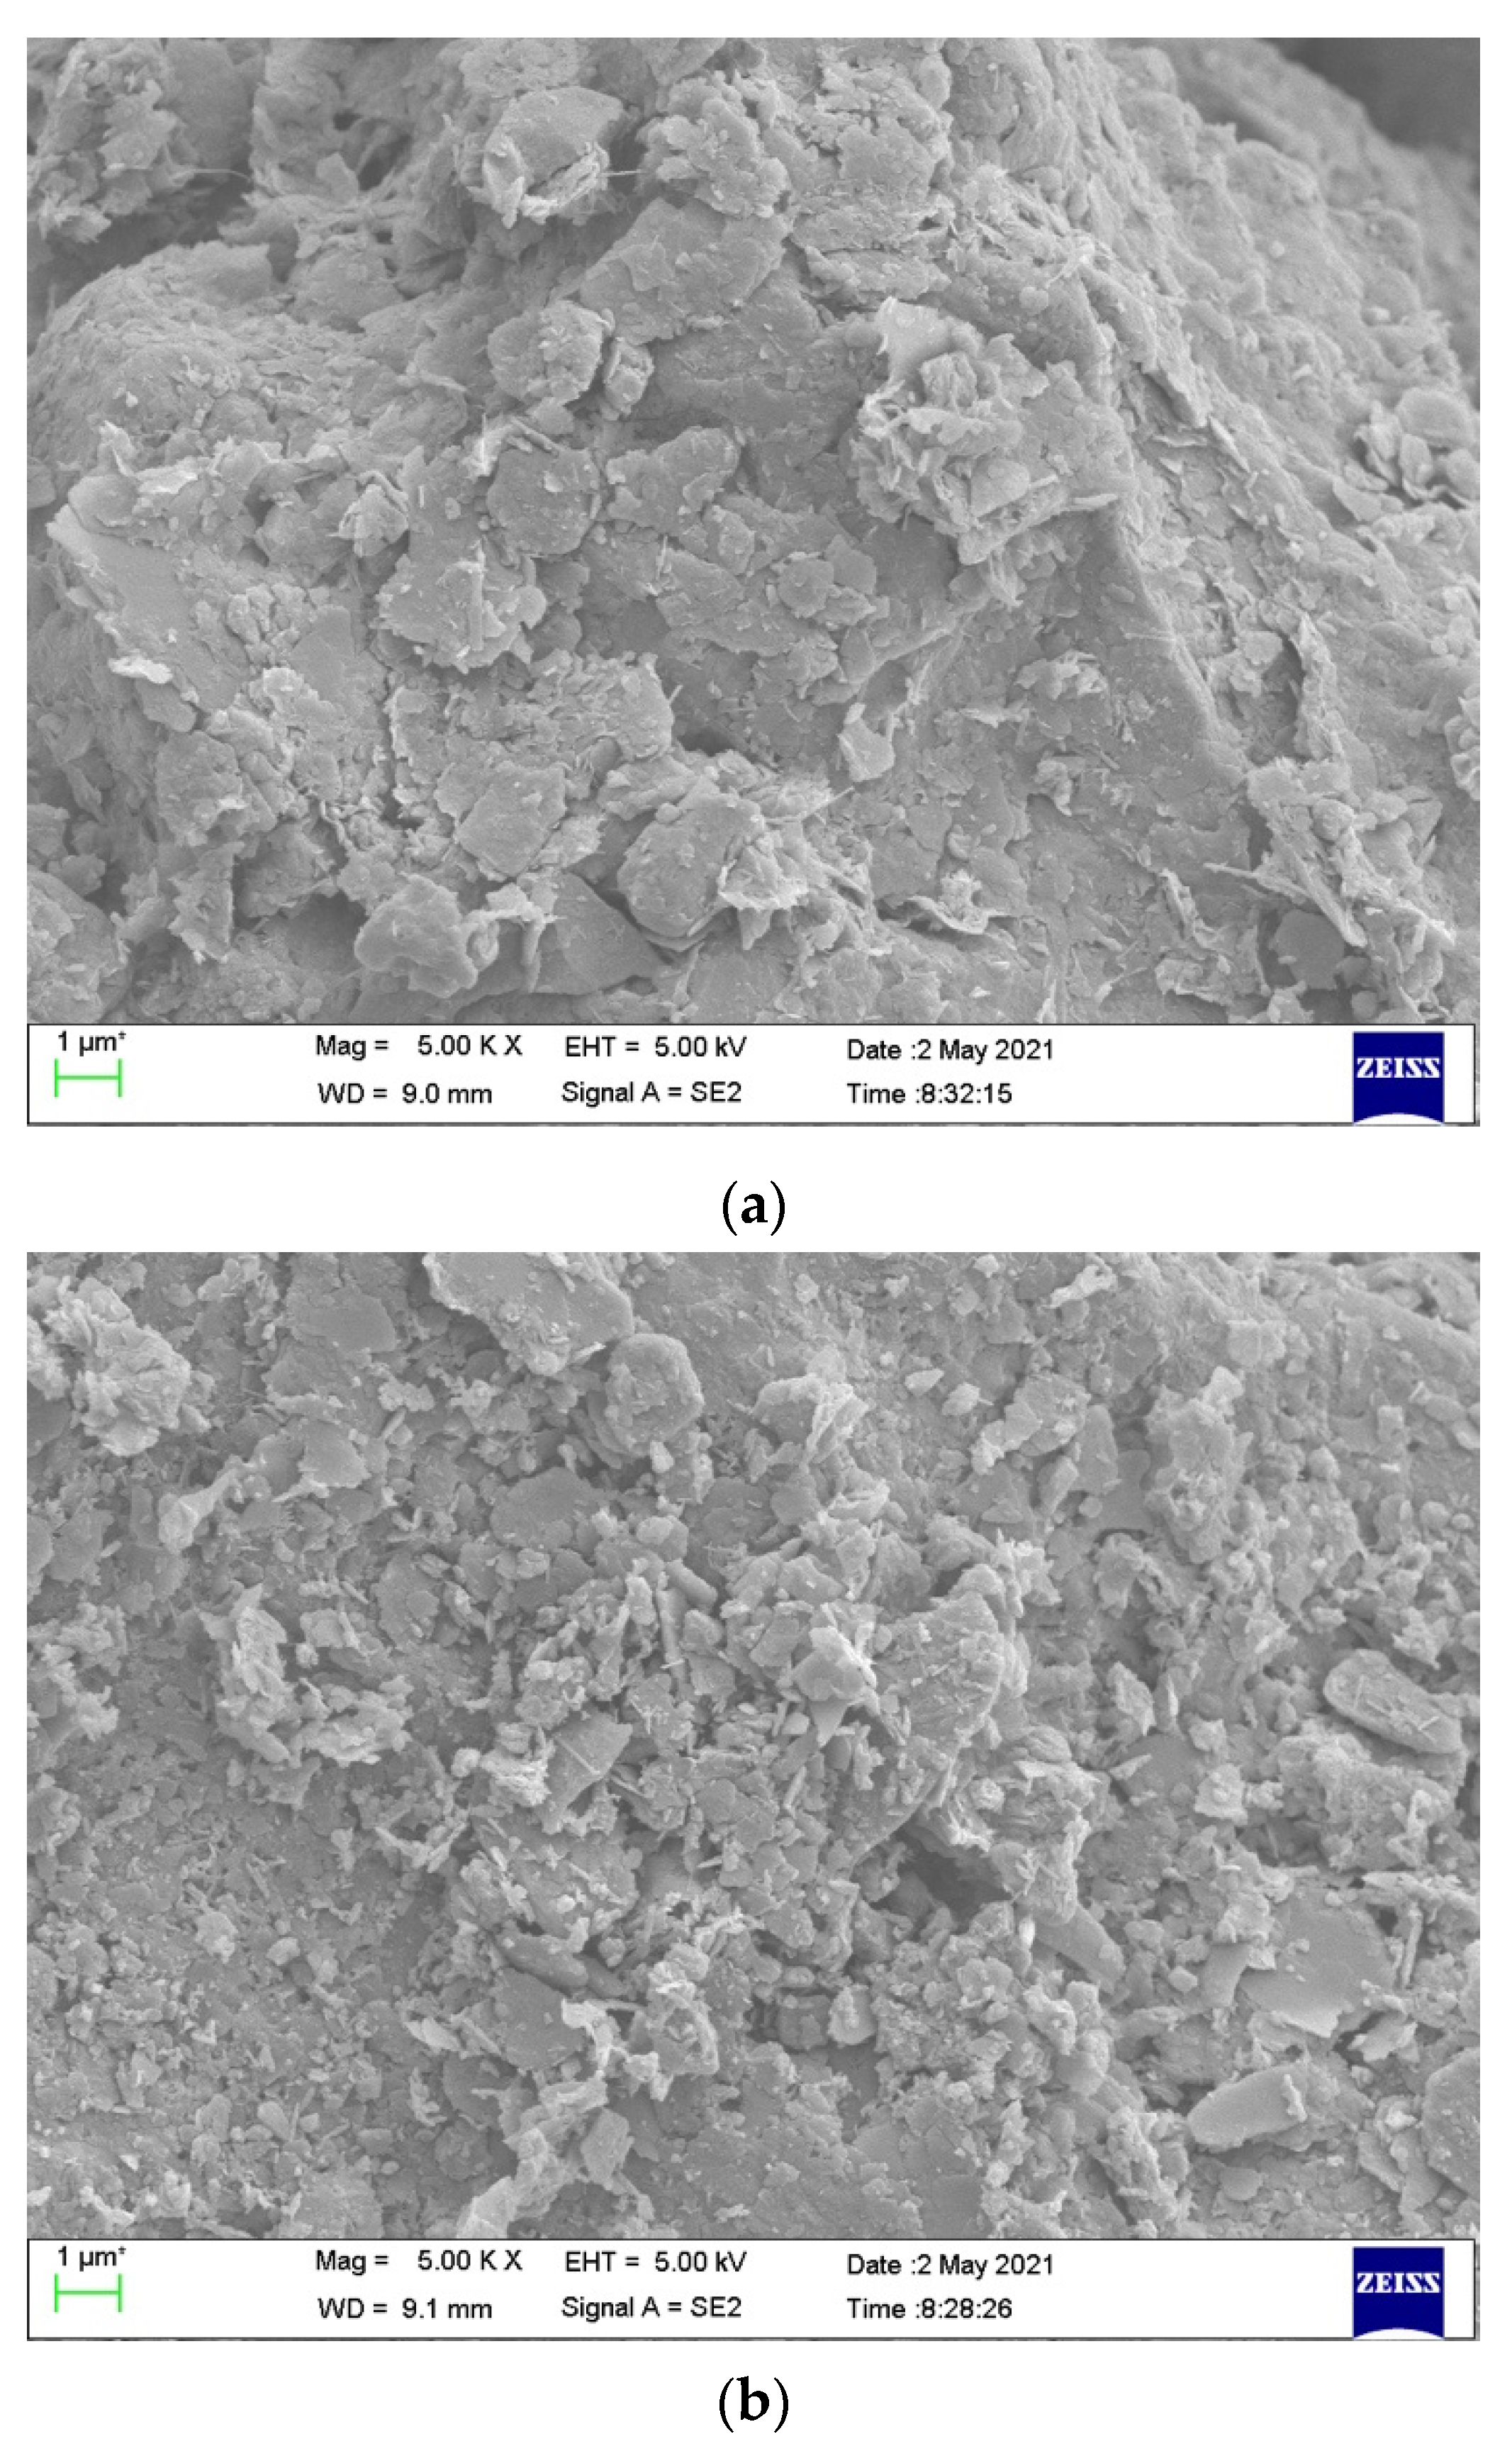
- The SEM tests and pore size tests demonstrate that the soil becomes denser after being solidified. The ISS can both prevent the onset of scour (i.e., piping) underneath the pipeline by decreasing soil porosity and inhibiting the scour induced by the vortex system around the pipeline by enhancing the critical shear stress.
- (3)
- If a non-cohesive soil layer underlies the ISS-solidified slurry, it is vulnerable to suffer accumulated liquefaction due to the dense crust structure of the ISS-solidified layer, so the adverse effects for accumulated liquefaction should be considered carefully due to the setting of the ISS-solidified layer.
- (4)
- On the premise that the scour protective effects of the ISS-solidified layer are ensured, it is suggested to adjust the mixture ratio of ISS-solidified slurry until the χ < χcr is satisfied at a fixed depth to avoid the accumulated liquefaction.
Author Contributions
Funding
Institutional Review Board Statement
Informed Consent Statement
Data Availability Statement
Conflicts of Interest
References
- Seth, D.; Manna, B.; Shahu, J.T.; Fazeres-Ferradosa, T.; Pinto, F.T.; Rosa-Santos, P.J. Buckling Mechanism of Offshore Pipelines: A State of the Art. J. Mar. Sci. Eng. 2021, 9, 1074. [Google Scholar] [CrossRef]
- Seth, D.; Manna, B.; Shahu, J.T.; Fazeres-Ferradosa, T.; Taveira-Pinto, F.; Rosa-Santos, P.; Pinto, F.V.T. Offshore pipeline buried in Indian coastal clay: Buckling behaviour analysis. Ships. Offshore Struc. 2021, 1–16. [Google Scholar] [CrossRef]
- Fredsøe, J. Pipeline–seabed interaction. J. Waterw. Port Coast. Ocean Eng. 2016, 142, 03116002. [Google Scholar] [CrossRef] [Green Version]
- Zhang, Q.; Draper, S.; Cheng, L.; An, H. Time scale of local scour around pipelines in current, waves, and combined waves and current. J. Hydraul. Eng. 2017, 143, 04016093. [Google Scholar] [CrossRef]
- Ahmad, N.; Bihs, H.; Myrhaug, D.; Kamath, A.; Arntsen, Ø.A. Three-dimensional numerical modelling of wave-induced scour around piles in a side-by-side arrangement. Coast. Eng. 2018, 138, 132–151. [Google Scholar] [CrossRef]
- Cheng, L.; Yeow, K.; Zhang, Z.; Teng, B. Three-dimensional scour below offshore pipelines in steady currents. Coast. Eng. 2009, 56, 577–590. [Google Scholar] [CrossRef]
- Fazeres-Ferradosa, T.; Rosa-Santos, P.; Taveira-Pinto, F.; Vanem, E.; Carvalho, H.; Correia, J.A.F.D.O. Advanced research on offshore structures and foundation design: Part 1. Proc. Inst. Civ. Eng.-Marit. Eng. 2019, 4, 118–123. [Google Scholar] [CrossRef]
- Sumer, B.M.; Truelsen, C.; Sichmann, T.; Fredsøe, J. Onset of scour below pipelines and self-burial. Coast. Eng. 2001, 42, 313–335. [Google Scholar] [CrossRef]
- Yang, L.P.; Shi, B.; Guo, Y.K.; Wen, X.Y. Calculation and experiment on scour depth for submarine pipeline with a spoiler. Ocean Eng. 2012, 55, 191–198. [Google Scholar] [CrossRef]
- Yang, L.P.; Shi, B.; Guo, Y.K.; Zhang, L.X.; Zhang, J.S.; Han, Y. Scour protection of submarine pipelines using rubber plates underneath the pipes. Ocean Eng. 2014, 84, 176–182. [Google Scholar] [CrossRef] [Green Version]
- Liang, D.; Cheng, L. Numerical model for wave-induced scour below a submarine pipeline. J. Waterw. Port. Coast. Ocean. Eng. 2005, 131, 193–202. [Google Scholar] [CrossRef]
- Larsen, B.E.; Fuhrman, D.R.; Sumer, B.M. Simulation of wave-plus-current scour beneath submarine pipelines. J. Waterw. Port. Coast. Ocean Eng. 2016, 142, 04016003. [Google Scholar] [CrossRef] [Green Version]
- Ahmad, N.; Bihs, H.; Myrhaug, D.; Kamath, A.; Arntsen, Ø.A. Numerical modelling of pipeline scour under the combined action of waves and current with free-surface capturing. Coast. Eng. 2019, 148, 19–35. [Google Scholar] [CrossRef]
- Zang, Z.; Tang, G.; Chen, Y.; Cheng, L.; Zhang, J. Predictions of the equilibrium depth and time scale of local scour below a partially buried pipeline under oblique currents and waves. Coast. Eng. 2019, 150, 94–107. [Google Scholar] [CrossRef]
- Chiew, Y.M. Mechanics of local scour around submarine pipelines. J. Hydraul Eng. 1990, 116, 515–529. [Google Scholar] [CrossRef]
- Lu, L.; Li, Y.; Chen, B. Mechanism of local scour around submarine pipelines based on numerical simulation of turbulence model. In Proceedings of the 24th International Conference on Offshore Mechanics and Arctic Engineering, Halkidiki, Greece, 12–17 June 2005. [Google Scholar]
- Zang, Z.; Cheng, L.; Zhao, M.; Liang, D.; Teng, B. A numerical model for onset of scour below offshore pipelines. Coast. Eng. 2009, 56, 458–466. [Google Scholar] [CrossRef]
- Zang, Z.; Cheng, L.; Zhao, M. Onset of scour below pipeline under combined waves and current. In Proceedings of the 29th International Conference on Offshore Mechanics and Arctic Engineering, Shanghai, China, 6–11 June 2010. [Google Scholar]
- Fredsoe, J.; Sumer, B.M.; Arnskov, M.M. Time scale for wave/current scour below pipelines. In Proceedings of the 1st International Offshore and Polar Engineering Conference, Edinburgh, UK, 11–16 August 1991. [Google Scholar]
- Liu, M.M.; Lu, L.; Teng, B.; Zhao, M.; Tang, G.Q. Numerical modeling of local scour and forces for submarine pipeline under surface waves. Coast. Eng. 2016, 116, 275–288. [Google Scholar] [CrossRef]
- Fuhrman, D.R.; Baykal, C.; Sumer, B.M.; Jacobsen, N.G.; Fredsøe, J. Numerical simulation of wave-induced scour and backfilling processes beneath submarine pipelines. Coast. Eng. 2014, 94, 10–22. [Google Scholar] [CrossRef]
- Xie, L.; Zhu, Y.; Su, T.C. Scour protection of partially embedded pipelines using sloping curtains. J. Hydraul. Eng. 2019, 145, 04019001. [Google Scholar] [CrossRef]
- Ji, U.; Yeo, W.; Kang, J. Subsidence of riprap protection without filters for different installation types of riprap around a pier in sands. J. Hydro. Environ. Res. 2013, 7, 41–49. [Google Scholar] [CrossRef]
- Fazeres-Ferradosa, T.; Welzel, M.; Schendel, A.; Baelus, L.; Santos, P.R.; Pinto, F.T. Extended characterization of damage in rubble mound scour protections. Coast. Eng. 2020, 158, 103671. [Google Scholar] [CrossRef]
- Fazeres-Ferradosa, T.; Taveira-Pinto, F.; Reis, M.T.; das Neves, L. Physical modelling of dynamic scour protections: Analysis of the Damage Number. Proc. Inst. Civ. Eng.-Marit. Eng. 2018, 171, 11–24. [Google Scholar] [CrossRef]
- Xie, L.; Huang, W.; Yu, Y. Experimental study of sediment trapping by geotextile mattress installed with sloping curtain. Geosynth. Int. 2013, 20, 389–395. [Google Scholar] [CrossRef]
- Fazeres-Ferradosa, T.; Chambel, J.; Taveira-Pinto, F.; Rosa-Santos, P.; Taveira-Pinto, F.V.C.; Giannini, G.; Haerens, P. Scour protections for offshore foundations of marine energy harvesting technologies: A review. J. Mar. Sci. Eng. 2021, 9, 297. [Google Scholar] [CrossRef]
- Fazeres-Ferradosa, T.; Taveira-Pinto, F.; Romão, X.; Reis, M.; Neves, L.D. Reliability assessment of offshore dynamic scour protections using copulas. Wind Eng. 2019, 43, 506–538. [Google Scholar] [CrossRef]
- Xie, L.; Liu, S. Stability of sand beds around mattress curtain sets. In Proceedings of the 29th International Conference on Offshore Mechanics and Arctic Engineering, Shanghai, China, 6–11 June 2010. [Google Scholar]
- Zhu, Y.; Xie, L.; Su, T.C. Scour Protection Effects of a Geotextile Mattress with Floating Plate on a Pipeline. Sustainability 2020, 12, 3482. [Google Scholar] [CrossRef] [Green Version]
- Xiang, W.; Cui, D.; Liu, Q.; Lu, X.; Cao, L. Theory and practice of ionic soil stabilizer reinforcing special clay. J. Earth Sci.-China 2010, 21, 882–887. [Google Scholar] [CrossRef]
- Lu, X.; Xiang, W. Experimental Study and Its Mechanism of Ionic Soil Stabilizer for Reinforcing Red Clay in Wuhan; Wuhan University of Technology Press: Wuhan, China, 2019. [Google Scholar]
- Sumer, B.M.; Fredsøe, J. Scour around Pile in Combined Waves and Current. J. Hydraul. Eng. 2001, 127, 403–411. [Google Scholar] [CrossRef]
- Soulsby, R. Dynamics of Marine Sands; Thomas Telford Ltd.: London, UK, 1998. [Google Scholar]
- Frostick, L.E.; McLelland, S.J.; Mercer, T.G. Users Guide to Physical Modelling and Experimentation: Experience of the HYDRALAB Network; CRC Press: Los Angeles, CA, USA, 2019. [Google Scholar]
- Sutherland, J.; Whitehouse, R.J.S. Scale Effects in the Physical Modelling of Seabed Scour; Technical Report; HR Wallingford: Wallingford, UK, 1998. [Google Scholar]
- Mao, Y. Seabed scour under pipelines. In Proceedings of the 7th International Symposium Offshore Mechanics and Arctic Engineering, Houston, TX, USA, 7–12 February 1988. [Google Scholar]
- Xu, J.; Li, G.; Dong, P.; Shi, J. Bedform evolution around a submarine pipeline and its effects on wave-induced forces under regular waves. Ocean Eng. 2010, 37, 304–313. [Google Scholar] [CrossRef]
- Smerdon, E.; Beasley, R.P. The Tractive Force Theory Applied to Stability of Open Channels in Cohesive Soils; Research Bulletin 715; University of Missouri, Agricultural Experiment Station: Columbia, MO, USA, 1959. [Google Scholar]
- Zen, K.; Yamazaki, H. Mechanism of wave-induced liquefaction and densification in seabed. Soils Found. 1990, 30, 90–104. [Google Scholar] [CrossRef] [Green Version]
- Sassa, S.; Sekiguchi, H. Wave-induced liquefaction of beds of sand in a centrifuge. Geotechnique 1999, 49, 621–638. [Google Scholar] [CrossRef]
- Jeng, D.-S. Porous Models for Wave-Seabed Interactions; Shanghai Jiao Tong University Press: Shanghai, China, 2013. [Google Scholar]
- Gao, F.P. Flow-pipe-soil coupling mechanisms and predictions for submarine pipeline instability. J. Hydrodyn. Ser. B 2017, 29, 763–773. [Google Scholar] [CrossRef]
- Wu, M.; De Vos, L.; Arboleda Chavez, C.E.; Stratigaki, V.; Fazeres-Ferradosa, T.; Rosa-Santos, P.; Taveira-Pinto, F.; Troch, P. Large Scale Experimental Study of the Scour Protection Damage Around a Monopile Foundation Under Combined Wave and Current Conditions. J. Mar. Sci. Eng. 2020, 8, 417. [Google Scholar] [CrossRef]
- Arboleda Chavez, C.E.; Stratigaki, V.; Wu, M.; Troch, P.; Schendel, A.; Welzel, M.; Villanueva, R.; Schlurmann, T.; De Vos, L.; Kisacik, D.; et al. Large-Scale Experiments to Improve Monopile Scour Protection Design Adapted to Climate Change—The PROTEUS Project. Energies 2019, 12, 1709. [Google Scholar] [CrossRef] [Green Version]


| Type | Mix proportion | Run number | Hw (m) | T (s) | Uc (m/s) | Ucw | KC | θ | (S/D)max |
|---|---|---|---|---|---|---|---|---|---|
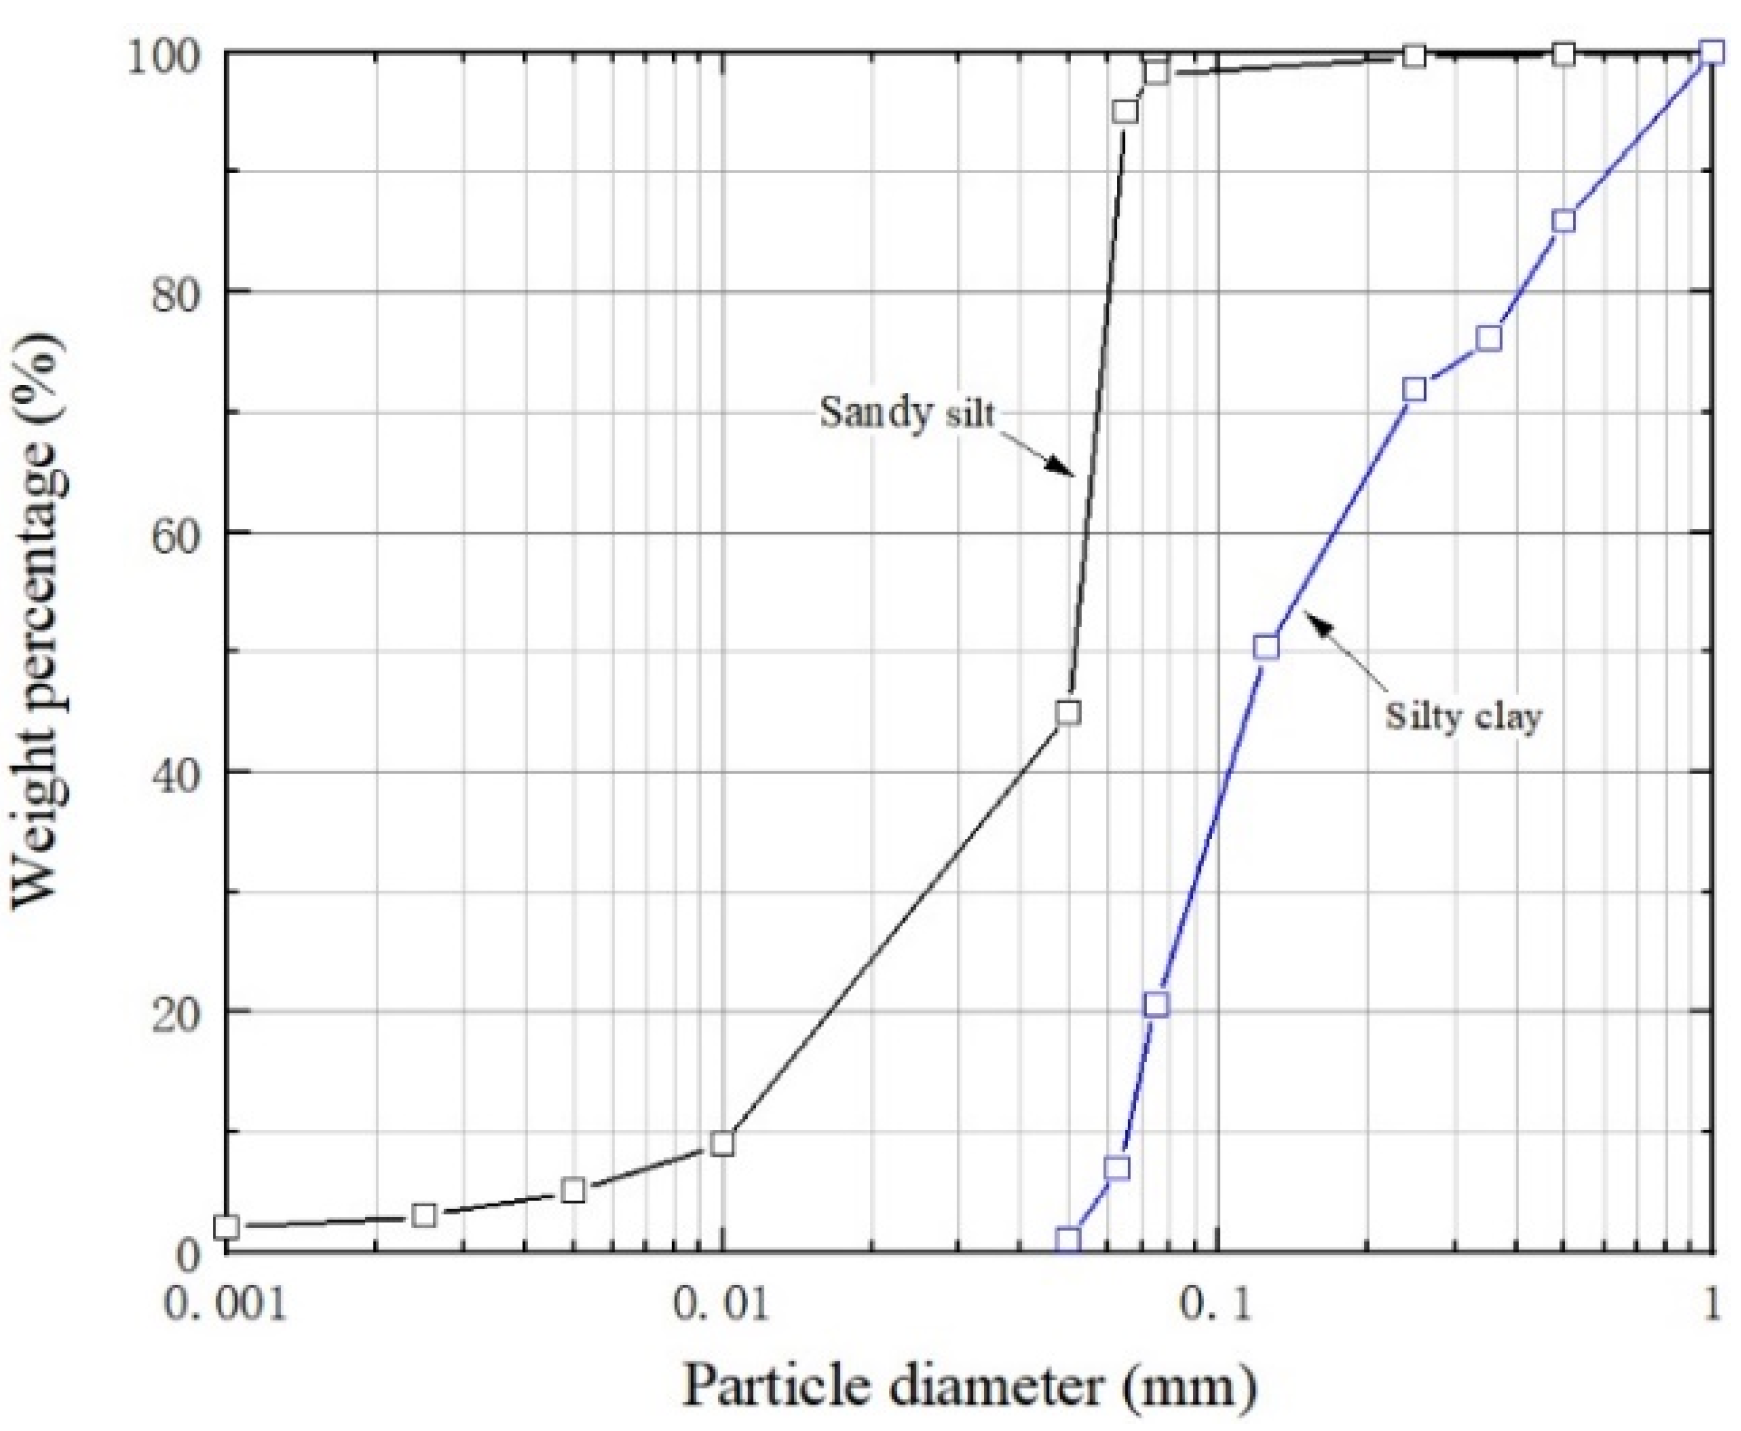
| Untreated (Initial) seabed (INI) | Sandy silt (in Figure 2) | INI-1 | 0.06 | 1.5 | 0 | 0 | 5.87 | 0.04 | 0.26 |
| INI-2 | 0.08 | 1.5 | 0 | 0 | 7.82 | 0.07 | 0.3 | ||
| INI-3 | 0.10 | 1.5 | 0 | 0 | 9.78 | 0.09 | 0.33 | ||
| INI-4 | 0.08 | 1.5 | 0.16 | 0.45 | 7.82 | 0.07 | 0.32 | ||
| INI-5 | 0.10 | 1.5 | 0.16 | 0.41 | 9.78 | 0.11 | 0.35 | ||
| INI-6 | 0.12 | 1.5 | 0.16 | 0.30 | 11.73 | 0.12 | 0.36 | ||
| ISS-solidified seabed (ISS-A) | VISS:Vwater = 1:20 MDRA:MISS solution:Msilty clay = 1:10:20 | ISS-A-1 | 0.06 | 1.5 | 0 | 0 | 5.87 | 0.04 | 0.062 |
| ISS-A-2 | 0.08 | 1.5 | 0 | 0 | 7.82 | 0.07 | 0.071 | ||
| ISS-A-3 | 0.10 | 1.5 | 0 | 0 | 9.78 | 0.09 | 0.085 | ||
| ISS-A-4 | 0.08 | 1.5 | 0.16 | 0.45 | 7.82 | 0.07 | 0.079 | ||
| ISS-A-5 | 0.10 | 1.5 | 0.16 | 0.41 | 9.78 | 0.11 | 0.096 | ||
| ISS-A-6 | 0.12 | 1.5 | 0.16 | 0.30 | 11.73 | 0.12 | 0.102 | ||
| ISS-solidified seabed (ISS-B) | VISS:Vwater = 1:20 M DRA:MISS solution: Msilty clay = 1:5:9 | ISS-B-1 | 0.06 | 1.5 | 0 | 0 | 5.87 | 0.04 | 0.012 |
| ISS-B-2 | 0.08 | 1.5 | 0 | 0 | 7.82 | 0.07 | 0.019 | ||
| ISS-B-3 | 0.10 | 1.5 | 0 | 0 | 9.78 | 0.09 | 0.031 | ||
| ISS-B-4 | 0.08 | 1.5 | 0.16 | 0.45 | 7.82 | 0.07 | 0.028 | ||
| ISS-B-5 | 0.10 | 1.5 | 0.16 | 0.41 | 9.78 | 0.11 | 0.043 | ||
| ISS-B-6 | 0.12 | 1.5 | 0.16 | 0.30 | 11.73 | 0.12 | 0.045 | ||
| ISS-solidified seabed (ISS-C) | VISS:Vwater = 1:20 M DRA:MISS solution: Msilty clay = 1:3:6 | ISS-C-1 | 0.06 | 1.5 | 0 | 0 | 5.87 | 0.04 | ≈0 |
| ISS-C-2 | 0.08 | 1.5 | 0 | 0 | 7.82 | 0.07 | ≈0 | ||
| ISS-C-3 | 0.10 | 1.5 | 0 | 0 | 9.78 | 0.09 | 0.011 | ||
| ISS-C-4 | 0.08 | 1.5 | 0.16 | 0.45 | 7.82 | 0.07 | 0.009 | ||
| ISS-C-5 | 0.10 | 1.5 | 0.16 | 0.41 | 9.78 | 0.11 | 0.013 | ||
| ISS-C-6 | 0.12 | 1.5 | 0.16 | 0.30 | 11.73 | 0.12 | 0.015 |
| Type | Mix Proportion | G (Pa) | Ks (cm/s) | Run Number | Hw (m) | χ |
|---|---|---|---|---|---|---|
| Untreated seabed (INI) | Sandy silt (in Figure 2) | 5.0 × 10⁵ | 1.0 × 10⁻⁵ | INI-7 | 0.06 | 0.099 |
| INI-8 | 0.08 | 0.132 | ||||
| INI-9 | 0.10 | 0.165 | ||||
| INI-10 | 0.12 | 0.198 | ||||
| INI-11 | 0.14 | 0.231 | ||||
| INI-12 | 0.16 | 0.264 | ||||
| INI-13 | 0.18 | 0.297 | ||||
| ISS-solidified seabed (ISS-A) | VISS:Vwater = 1:20 MDRA:MISS solution:Mclay = 1:10:20 | 5.8 × 10⁵ | 1.0 × 10⁻⁶ | ISS-A-7 | 0.06 | 0.099 |
| ISS-A-8 | 0.08 | 0.132 | ||||
| ISS-A-9 | 0.10 | 0.165 | ||||
| ISS-A-10 | 0.12 | 0.198 | ||||
| ISS-A-11 | 0.14 | 0.231 | ||||
| ISS-A-12 | 0.16 | 0.264 | ||||
| ISS-A-13 | 0.18 | 0.297 | ||||
| ISS-solidified seabed (ISS-B) | VISS:Vwater = 1:20 MDRA:MISS solution:Msilty clay = 1:5:9 | 6.1 × 10⁵ | 6.8 × 10⁻⁷ | ISS-B-7 | 0.06 | 0.099 |
| ISS-B-8 | 0.08 | 0.132 | ||||
| ISS-B-9 | 0.10 | 0.165 | ||||
| ISS-B-10 | 0.12 | 0.198 | ||||
| ISS-B-11 | 0.14 | 0.231 | ||||
| ISS-B-12 | 0.16 | 0.264 | ||||
| ISS-B-13 | 0.18 | 0.297 | ||||
| ISS-solidified seabed (ISS-C) | VISS:Vwater = 1:25 MDRA:MISS solution:Msilty clay = 1:3:6 | 6.4 × 10⁵ | 4.9 × 10⁻⁷ | ISS-C-7 | 0.06 | 0.099 |
| ISS-C-8 | 0.08 | 0.132 | ||||
| ISS-C-9 | 0.10 | 0.165 | ||||
| ISS-C-10 | 0.12 | 0.198 | ||||
| ISS-C-11 | 0.14 | 0.231 | ||||
| ISS-C-12 | 0.16 | 0.264 | ||||
| ISS-C-13 | 0.18 | 0.297 |
Publisher’s Note: MDPI stays neutral with regard to jurisdictional claims in published maps and institutional affiliations. |
© 2022 by the authors. Licensee MDPI, Basel, Switzerland. This article is an open access article distributed under the terms and conditions of the Creative Commons Attribution (CC BY) license (https://creativecommons.org/licenses/by/4.0/).
Share and Cite
Hu, R.; Wang, X.; Liu, H.; Leng, H. Scour Protection of Submarine Pipelines Using Ionic Soil Stabilizer Solidified Soil. J. Mar. Sci. Eng. 2022, 10, 76. https://doi.org/10.3390/jmse10010076
Hu R, Wang X, Liu H, Leng H. Scour Protection of Submarine Pipelines Using Ionic Soil Stabilizer Solidified Soil. Journal of Marine Science and Engineering. 2022; 10(1):76. https://doi.org/10.3390/jmse10010076
Chicago/Turabian StyleHu, Ruigeng, Xiuhai Wang, Hongjun Liu, and Hao Leng. 2022. "Scour Protection of Submarine Pipelines Using Ionic Soil Stabilizer Solidified Soil" Journal of Marine Science and Engineering 10, no. 1: 76. https://doi.org/10.3390/jmse10010076
APA StyleHu, R., Wang, X., Liu, H., & Leng, H. (2022). Scour Protection of Submarine Pipelines Using Ionic Soil Stabilizer Solidified Soil. Journal of Marine Science and Engineering, 10(1), 76. https://doi.org/10.3390/jmse10010076