Article

Evaluation of Late-Maturing Peach and Nectarine Fruit Quality by Chemical, Physical, and Sensory Determinations

by
Vittorio Farina
1,
Riccardo Lo Bianco
1,* and
Agata Mazzaglia
2
1
Department of Agricultural, Food and Forest Sciences. Università degli Studi di Palermo, 90128 Palermo, Italy
2
Department of Agriculture, Food and Environment. Università degli Studi di Catania, 95131 Catania, Italy
*
Author to whom correspondence should be addressed.
Agriculture 2019, 9(9), 189; https://doi.org/10.3390/agriculture9090189
Submission received: 26 June 2019 / Revised: 23 August 2019 / Accepted: 30 August 2019 / Published: 3 September 2019
(This article belongs to the Special Issue Postharvest Physiology and Technology of Fruits and Vegetables)

Abstract

:
In this work, both analytical and sensory determinations were carried out to evaluate the quality of yellow (‘Summerset‘, ‘Tardiva 2000‘, ‘Fairtime’, ‘Guglielmina’) and white flesh (‘Daniela’) late-ripening peach and nectarine (‘California’ and ‘Fairlane’) cultivars. Analytical measurements included weight, diameter, soluble solid content, titratable acidity, pH, and peel color. To describe and quantify the peach and nectarine sensory profile, a panel of 10 judges generated 15 descriptors. According to univariate analysis of fruit quality attributes, ‘Fairtime’, ‘Summerset, ‘Daniela’, and ‘California’ produced large and attractive fruits with an extensive red peel color. On the other hand, ‘Guglielmina’, ‘Daniela’, ‘Tardiva 2000’, and ‘Fairlane’ produced superior quality fruit in terms of soluble solids, titratable acidity, sweetness, and flavor. The white flesh peach ‘Daniela’ produced fruits with the best balance between external and internal quality. Cluster analysis on standardized component coordinates from biplot analysis allowed for the identification of two main groups. One group included ‘Daniela’, ‘Guglielmin’, ‘Tardiva 2000’, and ‘Fairlane’, along with attributes that are more indicative of ripe fruit such as soluble solids, sweetness, sugar/acid, juiciness, ground color index, peel color uniformity, flesh color intensity, mealiness, peach odor and flavor, and flower odor and flavor. The other group included ‘Summerset’, ‘Fairtime’, and ‘California’ along with weight, diameter, consistency, flesh firmness, percentage of cover color, bitterness, titratable acidity, sour odor and flavor, and grassy odor and flavor. The dual approach adopted in this study indicates that cultivars with large and attractive fruits are often lacking real eating quality. This poses serious doubts on the real value of exterior appearance for recognizing high-quality peaches and nectarines.

1. Introduction

Peaches and nectarines (Prunus persica L. Batsch) with 4.5 million t are the third most important fruit crop in Europe after grapes and apples [1]. The particular climate of Sicily allows for production of extra-early and early ripening peaches in the coastal areas as well as of late and extra-late ripening peaches mostly inland and on hillsides [2,3,4]. The late-maturing cultivars include peaches and nectarines characterized by yellow or white flesh, free stones, regular round shape, red peel cover color, resistance to handling and shipping, and high soluble solid content at ripening [5,6]. Under Sicilian climate and soils [7], these cultivars exhibit a long maturation cycle (they ripen from late August to early September, 50–70 days after Redhaven) and reach excellent quality at maturity. They are cultivated at an average altitude that is generally around 500 m, and the temperatures during the initial growth stages are very low compared to coastal areas. The temperature during this early stage of fruit development determines the time of harvest [8] and, in this case, it delays fruit maturation. They are easily marketed probably because, by the time they mature, there is nearly no other peach on the national and European markets. Their fruits vary strongly for flesh color, flavor, soluble solid content, and acidity, but are all able to reach high-quality standards. High-quality peaches for fresh market consumption should be large (AA or A size, where size codes range from D at 56–60 mm to AAA at 80–89 mm), regular shaped, well red colored, firm enough to withstand handling, and have a good sugar/acid balance [9].
Consumers have an important role in determining fruit quality and base their judgment on appearance and taste. Eating quality in the broadest sense (texture, taste, and odor) is one of the primary reasons why consumers purchase fruit [10]. The consumer is, in fact, able to recognize fruit quality through a visual and sensory acknowledgment of the characteristics when the fruit is eaten [11].
The use of analytical methods has been fundamental to characterize the most important chemical and physical parameters of fruit quality. Fruit quality greatly depends on the level of fruit ripening at harvest. Commercial maturity indexes for peach include not-destructive measurements (skin color and fruit size) or destructive analyses (total soluble solid content and flesh firmness). Modern non-destructive techniques such as near infre-red systems (NIRs) today are widely applied [12,13,14]. One of the options is the DA-Meter based on chlorophyll absorbance (index of absorbance difference), which allows sorting fruits into different groups according to their maturation [15,16]. However, because of large differences in fruit ripening-rate patterns and specific pericarp characteristics, the response is cultivar-dependent, and requires large investigation to properly calibrate the measure [17].
An acceptable quality to the ultimate consumer implies the development of recognizable and measurable levels of quality along with appropriate techniques to measure maturity. Appropriate maturity indexes are selected to consistently reflect the quality of the harvested product and identify the best harvest time [18]. Panel tests have also proved useful in the evaluation of fruit quality. Panel tests have been used in fruit studies, and trained judges have evaluated the quality of apples [19,20], peaches [21], kiwi fruits [22,23], sweet cherries [24], apricots [25,26], mangoes [27], and loquats [28,29]. The aim of this technique is primarily to assess consumer appreciation [20], but also to characterize the qualitative profiles of newly introduced fruit varieties [30] and to evaluate the influence of fruit ripening on consumer acceptance.
In recent years, approaches combining chemical, physical, and sensory analyses have been developed and used to evaluate the texture [20,31,32], chemical composition [21,23], firmness, sugar and acid balance [28,33,34,35], and volatile composition [22,36]. Also, in this study, we used both chemical–physical and sensory analyses to evaluate the overall fruit quality in late-ripening cultivars of peaches and nectarines. Multivariate tests were used to establish associations among measured attributes and identify attribute and cultivar groupings. This procedure on one side emphasizes differences or similarities between instrumental and sensory approaches, and on the other side characterizes the cultivars under observation in terms of prevailing quality attributes.

2. Materials and Methods

2.1. Plant Material

The trial was carried out using four yellow-flesh peaches (‘Summerset’, ‘Tardiva 2000’, ‘Fairtime’, and ‘Guglielmina’), one white-flesh peach (‘Daniela’), and two yellow-flesh nectarines (‘California’ and ‘Fairlane’), all late-ripening and grown near Riesi (37°16′ N and 330 m a.s.l.), in central–southern Sicily. The cultivars ‘Summerset’, ‘Fairtime’, ‘California’, and ‘Fairlane’ were obtained by Californian breeding programs in the 1970s and 1980s, whereas ‘Guglielmina’, ‘Tardiva 2000’, and ‘Daniela’ were obtained by Italian programs in the 1980s [37]. Three eight-year-old trees, uniform in size, grafted on GF677 rootstock (Prunus persica × Prunus amigdalus), and trained to a delayed vase were selected for each cultivar. Trees were planted in single rows (north–south oriented), spaced at 5 × 4 m (500 tree/ha), and managed with conventional cultural practices. At 20 days after full bloom, all the trees were hand thinned to about 1 fruit every 15 cm of shoot. Crop load per tree ranged from a minimum of 2.8 (‘California’) to a maximum of 4.5 (‘Tardiva 2000’) kg cm−2 depending on the shoot number and length in each cultivar.
Peach and nectarine fruits were harvested at commercial ripening (Table 1) using flesh firmness (5.5–6.5 kg cm−2) and the typical ground color for each cultivar as maturity indexes. The fruits of all three trees per cultivar were harvested, graded, and a sample of 50 fruits per cultivar similar in shape, size, and ripening stage was selected and used for chemical–physical (30 fruits) and sensory (20 fruits) evaluations.

2.2. Physical and Chemical Attributes

Physical and chemical measurements included the weight, diameter, flesh firmness (kg cm−2), total soluble solids (Brix°), titratable acidity (g L−1 of malic acid), and peel color. Fruit weight (FW) was determined with a digital scale; transversal diameter (TD) was determined with a digital caliper TR53307 (Turoni, Forlì, Italy); flesh firmness (FF) was determined with a TR5325 digital penetrometer (Turoni, Forlì, Italy) mounting an 8-mm plunger tip; content of soluble solids (SSC) was determined with an Atago Palette PR-32 (Atago Co., Ltd., Tokyo, Japan) digital refractometer; titratable acidity (TA) and pH were determined with a CrisonS compact titrator (Crison Instruments, SA, Barcelona, Spain). Each fruit was photographed with a digital camera, and digital images were used to determine the percentage and intensity of ground and cover peel color. Specifically, we used an algorithm that converts images from RGB to CIE (Commission Internationale de l’Eclairage) L*a*b* format, extracts the fruit from the image (removing the image background), and quantifies color characteristics as the weighed distance of each pixel in the image from a reference sample (best colored area interactively chosen from a well colored fruit) [38]. The output is an index (ground color index, GC) ranging from 0 to 1 (identical to reference sample). For those cultivars presenting fruits with a red cover color, a green–red threshold algorithm was added to the previous procedure to obtain a separation of the total fruit area (in number of pixels) into two sub-regions: cover color (closer to red) and ground color (closer to green). The pixel ratio between the red-colored area and total fruit area was used to quantify the percentage of cover color (CC%).

2.3. Sensory Attributes

The sensory profile [39] was defined by a panel of 10 judges (four male and six female, aged between 25–37 years) that were selected from the Department of Agriculture, Food and Environment, University of Catania to participate in the descriptive analysis. The judges had more than five years of experience in the sensory analysis of fruits and fruit products. Panel members were trained (3 s of 90 min) using different samples of peach to recognize the qualitative characteristics to be assessed and to generate the attributes, on the basis of frequency of citation (>60%). Besides, the judges were trained on the aroma, flavor, texture, and mouth feel attributes during the training session, using product and ingredient references. The samples were evaluated using 15 attributes sorted by groups: two related to appearance (peel color uniformity, PCU; flesh color, FC), four related to rheology (consistency, CON; easy stone, ES; mealiness, ML; juiciness, JU), three related to odor (peach odor, PO; grass odor, GO; flower odor, FO), three related to taste (sweetness, SW; sourness, SO; bitterness, BT), and three related to flavor (peach flavor, PF; grass flavor, GF; flower flavor, FLF). The judges, for each sample, were given a whole fruit. They evaluated the intensity of each descriptor by assigning categorical scores of 1 (absence of sensation), 2 (just recognizable), 3 (very weak), 4 (weak), 5 (slight), 6 (moderate), 7 (intense), 8 (very intense), and 9 (extremely intense). The evaluations were carried out on two whole fruits per cultivar and judged (total 20 fruits per cultivar) from 10:00 to 12:00 in individual booths illuminated by white light [40]. The sample evaluation order was randomized for each judge, and water was provided for rinsing between fruit samples. Data regarding consistency in judging are not reported, because they are specifically used to evaluate the consistency for each judge, and we repeated the evaluation only twice for each judge. Data collection was automated using FIZZ software (FIZZ Biosystemes ver. 2.00 M, Couternon, France).

2.4. Data Analysis

Physical, chemical, and sensory data were tested for differences among cultivars using one-way analysis of variance followed by Tukey’s multiple range test for p < 0.05. Biplot analysis (a distance-based class of principal component analysis) with the multidimensional scaling preferences procedure (MDPREF) [41] was performed to investigate the relationship among fruit attributes and any possible cultivar grouping based on similar properties. Average data per cultivar were standardized, and factor and object loadings were fit in a common space with the MDPREF procedure [41]; finally, cluster analysis with the k-means technique was performed on standardized factor coordinates to individuate grouping of attributes and cultivars [42].

3. Results and Discussion

3.1. Physical and Chemical Attributes

On a size basis, ‘Fairtime’ produced the largest fruit, followed by ‘Summerset’ and ‘Daniela’ (Table 2). All these three cultivars produced more than 70% of fruit belonging to the AA category (74–81 mm), conforming to retail group and supermarket chain standards of European markets [43]. ‘Guglielmina’ and ‘Tardiva 2000’, on the other hand, produced relatively small fruits, with the majority (> 70%) belonging to A category (68–74 mm). As for nectarines, ‘California’ produced larger (> 70% in AA category) fruits than ‘Fairlane’ (> 70% in A category) (Table 3).
All peach cultivars exhibited similar flesh firmness (Table 2), whereas for nectarines, ‘California’ exhibited higher firmness than ‘Fairlane’ (Table 3). In all cases, flesh firmness ranged within commercial standards for the best handling and storage time [43].
All peaches showed similar ground color index (Table 2). ‘Fairtime’, ‘Summerset’, and ‘Daniela’ showed the highest percentage of cover color, followed by ‘Guglielmina’ and finally by ‘Tardiva 2000’ showing the least cover color (Table 2). For nectarines, ‘Fairlane’ exhibited a higher ground color index but a lower percentage of cover color than ‘California’ (Table 3). In peaches and nectarines, a red peel cover color is directly associated with exterior fruit quality, while a light yellow or greenish ground color is associated with unripe fruit. Consumers will in fact prefer full red-colored fruits to less colored ones [44]. Overall, ‘Guglielmina’, ‘Tardiva 2000’, and ‘Fairlane’ exhibited the poorest exterior fruit quality, producing relatively small and unattractive fruit.
On the contrary, ‘Guglielmina’ had the highest SSC followed by ‘Tardiva 2000’, and finally by ‘Daniela’, ‘Fairtime’, and ‘Summerset’ showing the lowest levels (Table 2). For nectarines, ‘Fairlane’ showed higher SSC than ‘California’ (Table 3). Several studies have associated high consumer acceptance with high SSC in peaches [45,46]; all tested cultivars exhibited SSC within an acceptable range. Based on some early studies, minimum SSC standards of 10% have been proposed and are generally accepted in California [47] and France [48] for mid-season peaches; whereas 11–14% has been proposed for late-season peaches [41]. On the other hand, minimum SSC standards of 12% are generally requested in Italy, with an industry mostly oriented toward yellow flesh cultivars [49]. Soluble solids below 10% are generally unacceptable to consumers [50].
‘Summerset’, ‘Fairtime’, and ‘Tardiva 2000’ showed higher TA than ‘Guglielmina’ and ‘Daniela’ (Table 2), while ‘California’ had higher TA than ‘Fairlane’ (Table 3). The observed levels are in line with typical values indicated for peaches and nectarines at the mature stage [43]. As a result, ‘Summerset’ and ‘Fairtime’ had lower SSC/TA than ‘Guglielmina’ and ‘Daniela’ (Table 2), while ‘Fairlane’ had higher SSC/TA than ‘California’ (Table 3). In particular, ‘Guglielmina’, more than any other peach or nectarine, reached relatively high SSC/TA values. The SSC/TA ratio is a very important parameter in determining fruit quality, because it provides information on the sweet/acid balance in the fruit. Recent studies showed that this ratio is strictly dependent on the cultivar and maturity stage, and that consumer acceptance is not linearly related to SSC/TA [46]. This ratio plays an important role in consumer acceptance only for those peach and nectarine cultivars showing specific ranges of TA and SSC. Specifically, Crisosto and Crisosto [46] observed that a higher consumer acceptance of ripe fruit was achieved with low TA cultivars compared to high TA cultivars, but only within a relatively high SSC range (15–16%). The latter suggests a potential consumer preference for ‘Guglielmina’ over ‘Daniela’, which is the other low-acidity cultivar.

3.2. Sensory Profile

Only a few sensory attributes showed significant variations among peach cultivars, i.e., easy stone, flesh color, peach odor, and sweetness attributes. In particular, ‘Fairtime’ and ‘Summerset’ had the highest easy stone score and the lowest peach odor score; flesh color score was highest in ‘Tardiva 2000’ and, as expected, lowest in ‘Daniela’ being the only white-flesh cultivar; sweetness score was higher in ‘Daniela’, ‘Guglielmina’, and ‘Tardiva 2000’ than in ‘Fairtime’ (Table 2). As for nectarines, ‘California’ had higher easy stone, grass odor and flavor, and sour scores, but lower mealiness, sweetness, bitterness, and peach flavor scores than ‘Fairlane’ (Table 3). Overall, ‘Fairtime’ and ‘California’ produced the least interesting cultivars from the sensory evaluation.

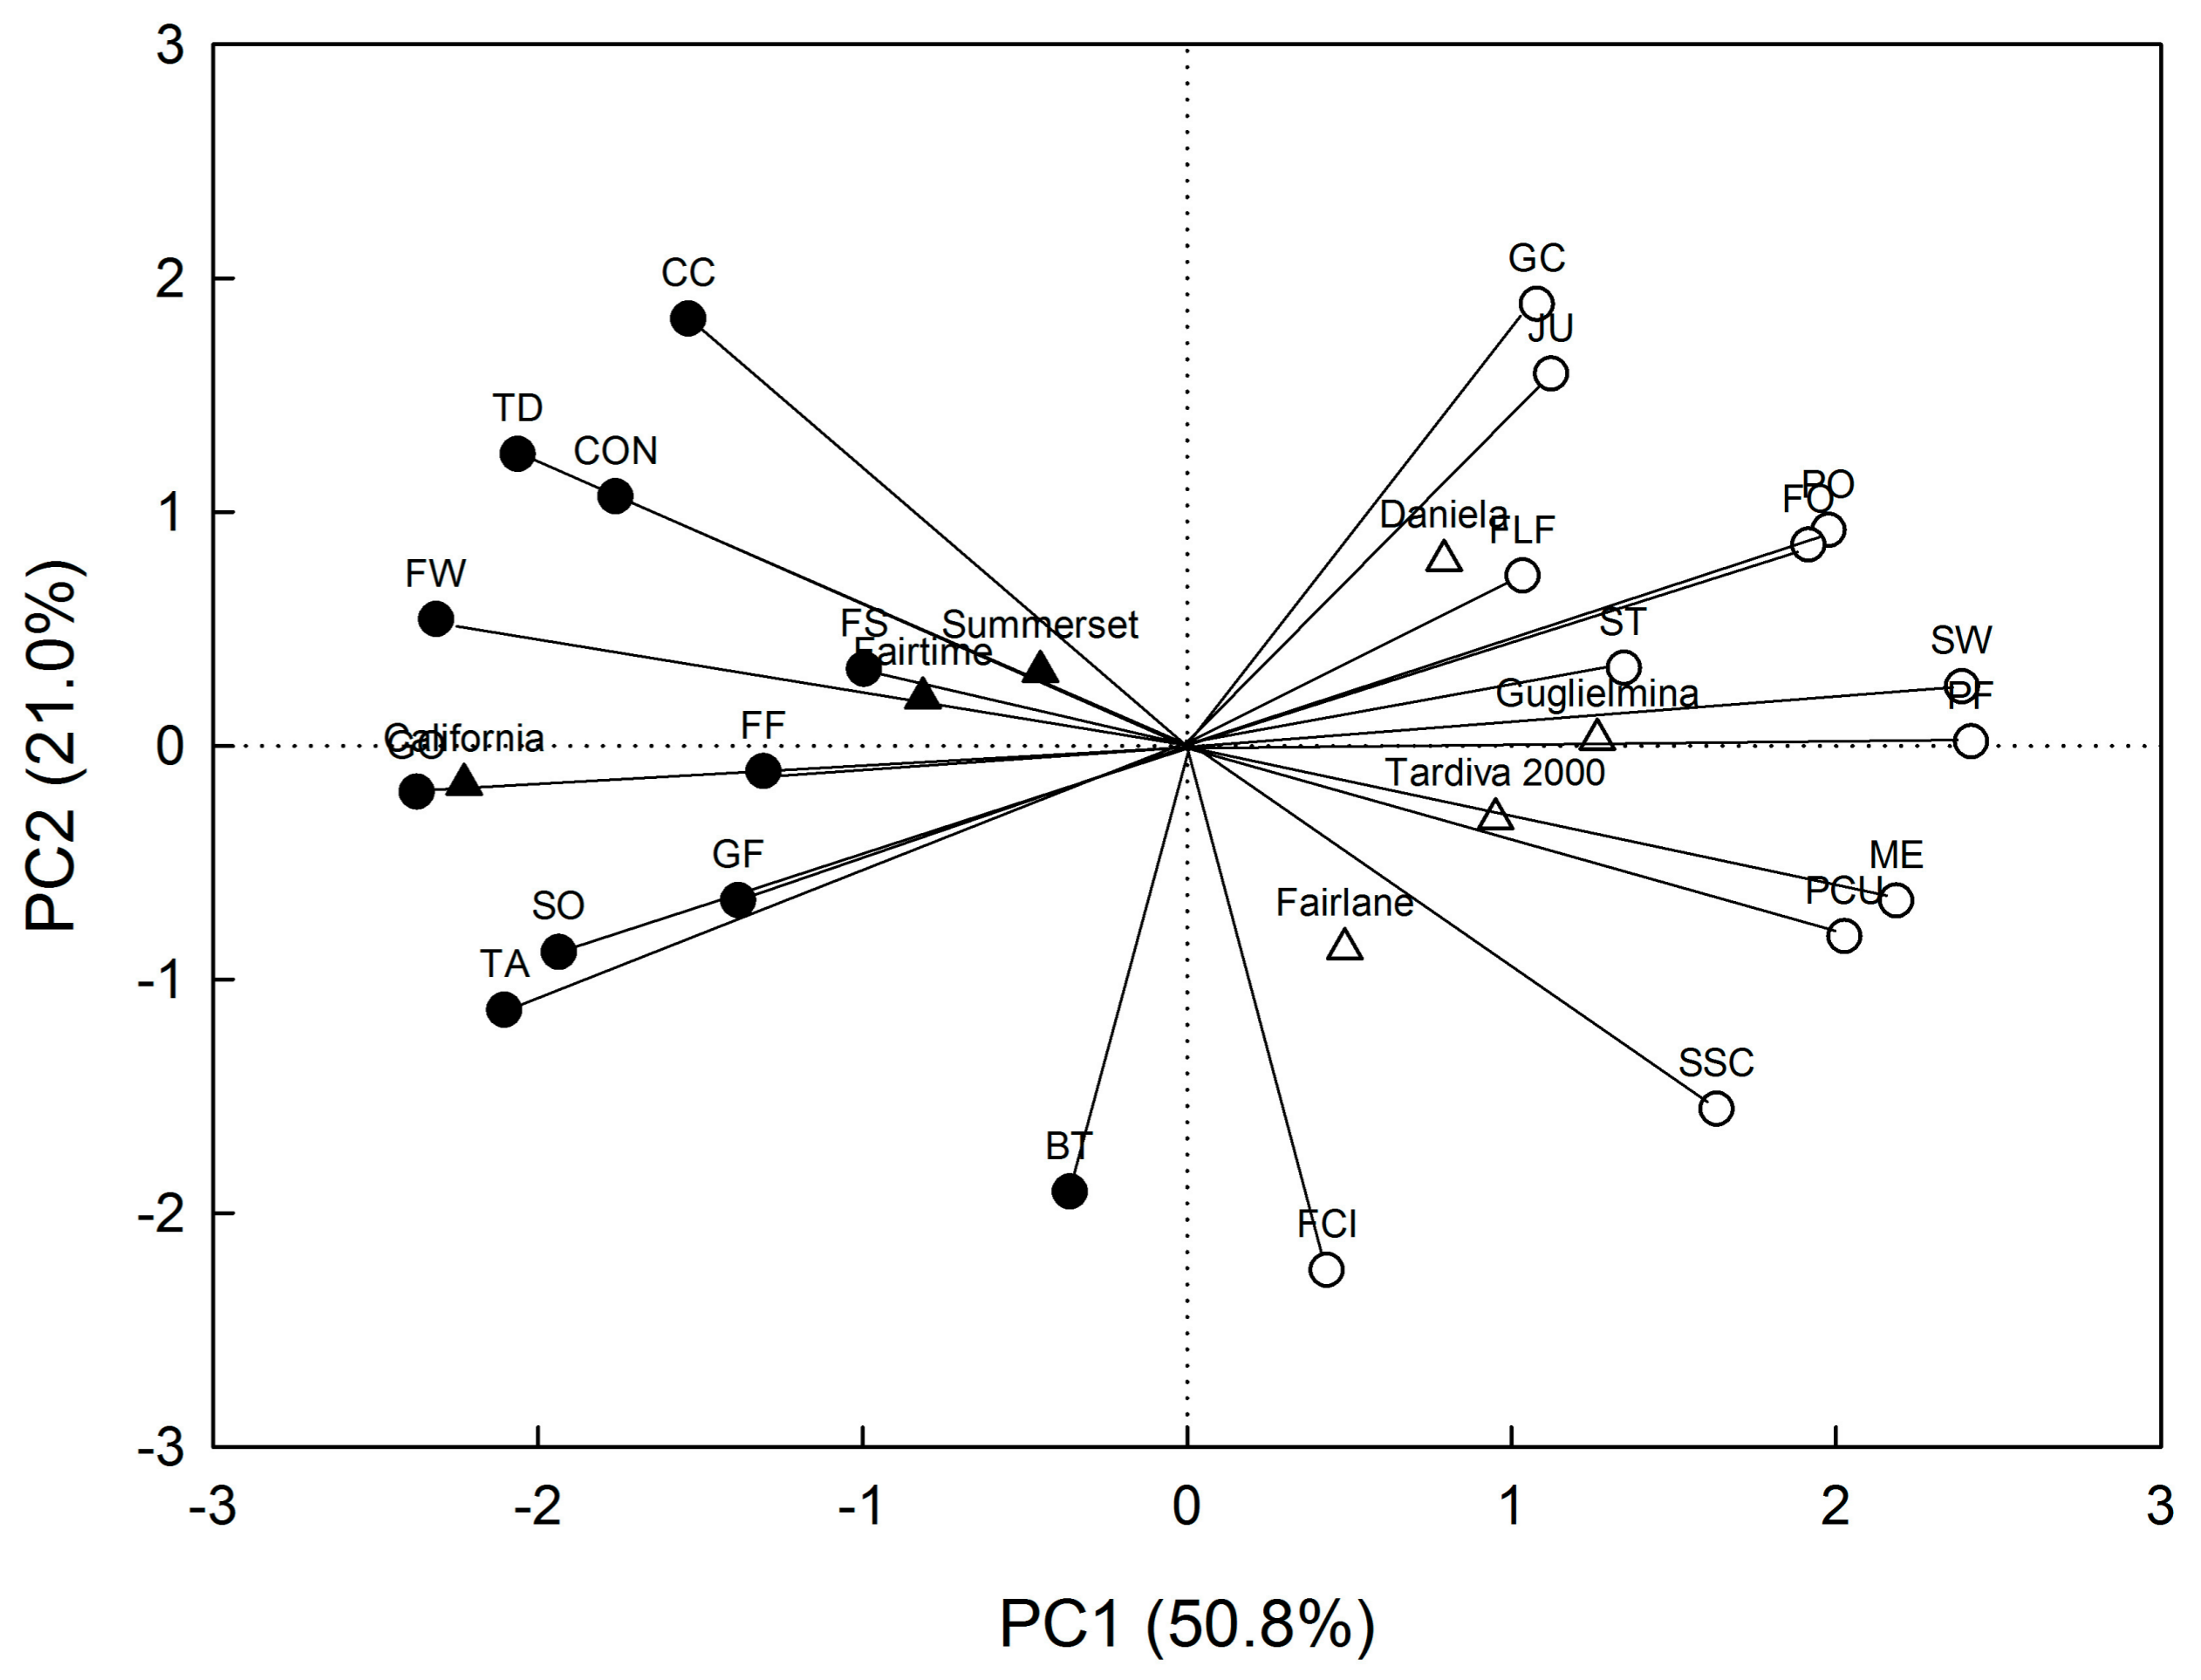
3.3. Multivariate Analysis

When the 23 fruit quality attributes were considered together, principal component analysis showed that nearly 98% of the variability observed was explained by the first five components (Table 4). Although the number of principle components considered does not allow for an easy interpretation of associations (Table 5), further analysis with perceptual mapping procedures (biplot) and clustering produced some interesting results. In particular, the analysis revealed some expected associations, such as the one between the soluble solid content and sweetness or ground color index and peel color intensity; and some other interesting relationships between instrumental and sensory attributes, such as the association between flesh firmness and consistency or titratable acidity, acidity, sourness, grass odor and grass flavor (Figure 1). Associations between sensory scores and instrumental data have been already reported for ‘Pescabivona’ peaches [51].
Most importantly, cluster analysis on standardized component scores allowed for the identification of two main groups associating specific quality attributes with certain cultivars. In particular, cluster analysis indicated that ‘Daniela’, ‘Guglielmina’, ‘Tardiva 2000’, and ‘Fairlane’ form one group and are positioned in the two right quadrants along with attributes more indicative of ripe fruit such as SSC, sweetness, SSC/TA, juiciness, ground color index, peel color uniformity, flesh color intensity, mealiness, peach odor and flavor, and flower odor and flavor. ‘Summerset’, ‘Fairtime’, and ‘California’ form a second group, and are spread in the two left quadrants along with weight, diameter, consistency, flesh firmness, percentage of cover color, easy stone, bitterness, titratable acidity, sourness, and grassy odor and flavor (Figure 1). This multivariate approach distinguished two main groups of cultivars, one of which had clearly higher fruit quality than the other. Surprisingly, fruit size and red cover color did not group with the other high-quality attributes. Similar results were obtained in apricot, where multivariate analysis revealed an association between TA and fruit peel color and in part also fruit size [52]. An explanation for this may be the strong selective pressure toward big and good-looking fruits in modern varieties, especially in those regions where the peach and fruit industry is relatively recent, and retail groups demand high standards of exterior quality with little care for real eating quality and consumer affection. Cultivar grouping did not reflect any separation related to genetic origin (peaches or nectarines).

4. Conclusions

According to the univariate analysis of fruit quality attributes, ‘Fairtime’, ‘Summerset’, ‘Daniela’, and ‘California’ produced large and attractive fruits. On the other hand, ‘Guglielmina’ in the first place, but also ‘Daniela’, ‘Tardiva 2000’, and ‘Fairlane’ produced superior internal fruit quality in terms of chemical and sensory attributes. The white flesh peach ‘Daniela’ seems to produce fruits with the best balance between external and internal quality. These results have been confirmed and strengthened by multivariate tests considering physical, chemical, and sensory attributes altogether. One strong message that is delivered by this dual approach is that cultivars with large and attractive fruits are often lacking real eating quality, posing serious doubts on the real value of exterior appearance for recognizing high quality peaches and nectarines. More effort needs to be done to either include real eating quality traits in the new cultivars with attractive fruits, or to instruct consumers on looking for internal more than external quality.

Author Contributions

Conceptualization, V.F. and R.L.B.; methodology, V.F., A.M. and R.L.B; validation, V.F., A.M. and R.L.B; formal analysis, R.L.B; investigation, V.F. and A.M.; resources, V.F, A.M and R.L.B.; data curation, V.F., A.M. and R.L.B.; writing—original draft preparation, V.F., A.M. and R.L.B.; writing—review and editing, R.L.B.; visualization R.L.B.

Funding

This research received no external funding.

Acknowledgments

We would like to thank the Ecofarm S.r.l. company (Butera, Sicily) for providing plant material, workspace, and field support.

Conflicts of Interest

The authors declare no conflict of interest.

References

  1. Food and Agriculture Organization of the United Nations. FAOSTAT Database; FAO: Rome, Italy, 2012; Available online: http://www.fao.org/faostat/en/#data/QC. (accessed on 16 August 2019).
  2. Marra, F.P.; Lo Bianco, R.; La Mantia, M.; Caruso, T. Growth, yield and fruit quality of ‘Tropic Snow’peach on size-controlling rootstocks under dry Mediterranean climates. Sci. Hortic. 2013, 160, 274–282. [Google Scholar] [CrossRef]
  3. Sortino, G.; Gallotta, A.; Farina, V.; Allegra, A. Shelf-Life and quality of fresh-cut peach cv ‘Ruby Rich’ at different maturity stage. Chem. Eng. Trans. 2017, 58, 409–414. [Google Scholar]
  4. Farina, V.; Lo Bianco, R.; Inglese, P. Shoot Growth, Crop Load, and Fruit Quality within Vase-shaped Canopies of Fairtime’Peach Trees. Eur. J. Hort. Sci. 2006, 71, 227. [Google Scholar]
  5. Sortino, G.; Farina, V.; Liguori, G.; Inglese, P. Fruit ripening evolution in ‘Settembrina di Leonforte’ and ‘Gialla Tardiva di Leonforte’ peach [Prunus persica (L.) Batsch] ecotypes. Acta Hortic. 2013, 1084, 791–798. [Google Scholar]
  6. Allegra, A.; Sortino, G.; Farina, V.; Inglese, P. Effect of passive atmosphere and chemical treatment on fresh cut of white-flesh peach cultivar ‘Settembrina di Bivona’. Acta Hort. 2013, 1084, 765–770. [Google Scholar] [CrossRef]
  7. Drago, A.; Cartabellotta, D.; Lo Bianco, B.; Lombardo, M. Atlante Climatologico Della Sicilia; Regione Siciliana, Assessorato Agricoltura e Foreste: Palermo, Italy, 2000. [Google Scholar]
  8. LaRue, J.H. Peaches, Plums, and Nectarines: Growing and Handling for Fresh Market; UC ANR Publications: Fresno, CA, USA, 1989; Volume 3331. [Google Scholar]
  9. Okie, W.R.; Bacon, T.; Bassi, D. Fresh market cultivar development. In The Peach: Botany, Production and Uses; CABI: Cambridge, UK, 2008; pp. 139–174. [Google Scholar]
  10. Jaeger, S.R.; Rossiter, K.L.; Wismer, W.V.; Harker, F.R. Consumer-driven product development in the kiwifruit industry. Food Qual. Pref. 2003, 14, 187–198. [Google Scholar] [CrossRef]
  11. Palmer, J.W.; Harker, F.R.; Tustin, D.S.; Johnston, J. Fruit dry matter concentration: A new quality metric for apples. J. Sci. Food Agric. 2010, 90, 2586–2594. [Google Scholar] [CrossRef] [PubMed]
  12. Nyasordzi, J.; Friedman, H.; Schmilovitch, Z.; Ignat, T.; Weksler, A.; Rot, I.; Lurie, S. Utilizing the IAD index to determine internal quality attributes of apples at harvest and after storage. Postharvest Biol. Technol. 2013, 77, 80–86. [Google Scholar] [CrossRef]
  13. Hayes, C.J.; Walsh, K.B.; Greensill, C.V. The impact of lamp environment on prediction of peach TSS content. Acta Hortic. 2016, 1119, 155–162. [Google Scholar] [CrossRef]
  14. Kaur, H.; Künnemeyer, R.; McGlone, A. Comparison of hand-held near infrared spectrophotometers for fruit dry matter assessment. J. Near Infrared Spectr. 2017, 25, 267–277. [Google Scholar]
  15. Ziosi, V.; Noferini, M.; Fiori, G.; Tadiello, A.; Trainotti, L.; Casadoro, G.; Costa, G. A new index based on vis spectroscopy to characterise the progression of ripening in peach fruit. Postharvest Biol. Technol. 2008, 49, 319–329. [Google Scholar] [CrossRef]
  16. Costa, G.; Noferini, M. Use of non-destructive devices as a decision support system for fruit quality enhancement. Acta Hort. 2013, 998, 103–115. [Google Scholar]
  17. Infante, R.; Rubio, P.; Contador, L.; Noferini, M.; Costa, G. Harvest maturity determination of D’Agen plums through the chlorophyll absorbance index. Cienc. Investig. Agrar. 2011, 38, 199–203. [Google Scholar]
  18. Crisosto, C. Stone fruit maturity indices: A descriptive review. Postharvest News Inf. 1994, 5, 65–68. [Google Scholar]
  19. Farina, V.; Gianguzzi, G.; Mazzaglia, A. Fruit quality traits of six ancient apple (Malus domestica Borkh) cultivars grown in the Mediterranean area. Int. J. Fruit Sci. 2015, 16, 275–283. [Google Scholar]
  20. Ross, C.F.; Chauvin, M.A.; Whiting, M. Firmness evaluation of sweet cherries by a trained and consumer sensory panel. J. Texture Stud. 2009, 40, 554–570. [Google Scholar] [CrossRef]
  21. Colaric, M.; Veberic, R.; Stampar, F.; Hudina, M. Evaluation of peach and nectarine fruit quality and correlations between sensory and chemical attributes. J. Sci. Food Agric. 2005, 85, 2611–2616. [Google Scholar] [CrossRef]
  22. Wang, M.Y.; MacRae, E.; Wohlers, M.; Marsh, K. Changes in volatile production and sensory quality of kiwifruit during fruit maturation in Actinidia deliciosa ‘Hayward’ and A. chinensis ‘Hort16A’. Postharvest Biol. Technol. 2011, 59, 16–24. [Google Scholar] [CrossRef]
  23. Marsh, K.; Attanayake, S.; Walker, S.; Gunson, A.; Boldingh, H.; MacRae, E. Acidity and taste in kiwifruit. Postharvest Biol. Technol. 2004, 32, 159–168. [Google Scholar] [CrossRef]
  24. Ross, C.F.; Chauvin, M.A.; Whiting, M. Assignation of sweet cherry selections to 3 taste groupings based on perceived sweetness and sourness. J. Food Sci. 2010, 75, S48–S54. [Google Scholar]
  25. Farina, V.; Volpe, G.; Mazzaglia, A.; Lanza, C.M. Fruit quality traits of two apricot cultivars. Acta Hort. 2010, 862, 593–598. [Google Scholar] [CrossRef]
  26. Egea, J.; Romojaro, F.; Pretel, M.T.; Martinez-Madrid, M.C.; Costell, E.; Cascales, A. Application of sensory analysis to the determination of the determination of the optimum quality and harvesting moment in apricots. Acta Hort. 2006, 701, 529–532. [Google Scholar]
  27. Gentile, C.; Di Gregorio, E.; Di Stefano, V.; Mannino, G.; Perrone, A.; Avellone, G.; Sortino, G.; Inglese, P.; Farina, V. Food quality and nutraceutical value of nine cultivars of mango (Mangifera indica L.) fruits grown in Mediterranean subtropical environment. Food Chem. 2019, 277, 471–479. [Google Scholar] [CrossRef] [PubMed]
  28. Farina, V.; Barone, F.; Mazzaglia, A.; Lanza, C.M. Evaluation of fruit quality in loquat using both chemical and sensory analyses. Acta Hort. 2011, 887, 345–349. [Google Scholar] [CrossRef]
  29. Gentile, C.; Reig, C.; Corona, O.; Todaro, A.; Mazzaglia, A.; Perrone, A.; Gianguzzi, G.; Agustì, M.; Farina, V. Pomological traits, sensory profile and nutraceutical properties of nine cultivars of loquat (Eriobotrya japonica Lindl.) fruits grown in Mediterranean area. Plant. Foods Hum. Nutr. 2016, 71, 330–338. [Google Scholar] [PubMed]
  30. Predieri, S.; Ragazzini, P.; Rondelli, R. Sensory evaluation and peach fruit quality. Acta Hort. 2005, 713, 429–434. [Google Scholar] [CrossRef]
  31. Chauvin, M.A.; Ross, C.F.; Pitts, M.; Kupferman, E.; Swanson, B. Relationship between instrumental and sensory determination of apple and pear texture. J. Food Qual. 2010, 33, 181–198. [Google Scholar] [CrossRef]
  32. Harker, F.; Maindonald, J.; Murray, S.; Gunson, F.; Hallet, I.; Walker, S. Sensory interpretation of instrumental measurements. 1: Texture of apple fruit. Postharvest Biol. Technol. 2002, 24, 225–239. [Google Scholar] [CrossRef]
  33. Oraguzie, N.; Alspach, P.; Volz, R.; Whitworth, C.; Ranatunga, C.; Weskett, R.; Harker, R. Postharvest assessment of fruit quality parameters in apple using both instruments and an expert panel. Postharvest Biol. Technol. 2009, 52, 279–287. [Google Scholar] [CrossRef]
  34. Gunness, P.; Kravchuk, O.; Nottingham, S.M.; D’Arcy, B.R.; Gidley, M.J. Sensory analysis of individual strawberry fruit and comparison with instrumental analysis. Postharvest Biol. Technol. 2009, 52, 164–172. [Google Scholar] [CrossRef]
  35. Harker, F.R.; Marsh, K.B.; Young, H.; Murray, S.H.; Gunson, F.A.; Walker, S.B. Sensory interpretation of instrumental measurements 2: Sweet and acid taste of apple fruit. Postharvest Biol. Technol. 2002, 24, 241–250. [Google Scholar] [CrossRef]
  36. Guarrasi, V.; Farina, V.; Germanà, M.A.; San Biagio, P.L.; Mazzaglia, A. Fruit quality evaluation of four loquat cultivars grown in Sicily. Acta Hort. 2011, 887, 299–304. [Google Scholar] [CrossRef]
  37. Okie, W.R. Handbook of Peach and Nectarine Varieties; Agriculture Handbook 714; USDA, Agricultural Research Service: Byron, GA, USA, 1998.
  38. Francaviglia, D.; Farina, V.; Avellone, G.; Lo Bianco, R. Fruit yield and quality responses of apple cvars Gala and Fuji to partial rootzone drying under Mediterranean conditions. J. Agric. Sci. 2013, 151, 556–569. [Google Scholar] [CrossRef]
  39. UNI 10957. Sensory Analysis—Method for Establishing a Sensory Profile in Foodstuffs and Beverages; UNI: Ente Nazionale Italiano di Unificazione: Milan, Italy, 2003. [Google Scholar]
  40. UNI EN ISO 8589. Sensory Analysis—General Guidance for the Design of Test Rooms; UNI: Ente Nazionale Italiano di Unificazione: Milan, Italy, 2010. [Google Scholar]
  41. Carroll, J.D. Individual differences and multidimensional scaling. In Multidimensional Scaling: Theory and Applications in the Behavioral Sciences; Shepard, R.N., Romney, A.K., Nerlove, S.B., Eds.; Seminar Press: New York, NY, USA, 1972; Volume 1, pp. 105–155. [Google Scholar]
  42. Lo Bianco, R.; Mirabella, F. Use of leaf and fruit morphometric analysis to identify and classify white mulberry (Morus alba L.) genotypes. Agriculture 2018, 8, 157–166. [Google Scholar]
  43. Kader, A.A.; Mitchell, F.G. Maturity and quality. In Peaches, Plums and Nectarines: Growing and Handling for Fresh Market; La Rue, J.H., Johnson, R.S., Eds.; University of California Department of Agriculture and Natural Resources Publication: Oakland, CA, USA, 1989; Volume 3331, pp. 191–196. [Google Scholar]
  44. Bruhn, C.M. Consumer and retailer satisfaction with the quality and size of California peaches and nectarines. J. Food Qual. 1995, 18, 241–256. [Google Scholar] [CrossRef]
  45. Parker, D.; Ziberman, D.; Moulton, K. How quality relates to price in California fresh peaches. Calif. Agric. 1991, 45, 14–16. [Google Scholar] [Green Version]
  46. Crisosto, C.; Crisosto, G. Relationship between ripe soluble solids concentration (RSSC) and consumer acceptance of high and low acid meeting flesh peach and nectarine (Prunus persica L. Batsch) cultivars. Postharvest Biol. Technol. 2005, 38, 239–246. [Google Scholar] [CrossRef]
  47. Kader, A.A. Fruit maturity, ripening, and quality relationships. Perish. Handl. Newsl. 1994, 80, 2. [Google Scholar] [CrossRef]
  48. Hilaire, C. The peach industry in France: State of art, research and development. In First Mediterranean Peach Symposium; Marra, F., Sottile, F., Eds.; Panuzzo Prontostampa, Caltanissetta: Agrigento, Italy, 2003; pp. 27–34. [Google Scholar]
  49. Ventura, M.; Sama, A.; Minguzzi, A.; Lazoni, S.; Sansavini, S. Ottimizzazione del carico di frutti per migliorare la produzione e la qualità delle nettarine ‘Supercrimson’ e ‘Venus’. In XXIV Italian Peach Meeting; Sansavini, S., Ed.; MDM: Cesena, Italy, 2000; pp. 173–176. [Google Scholar]
  50. Clareton, M. Peach and nectarine production in France: Trends, consumption and perspectives. In Summaries of the Prunus Breeders Meeting; Embrapa Cliama Temperado: Pelotas, Brazil, 2000; pp. 83–91. [Google Scholar]
  51. Montevecchi, G.; Vasile Simone, G.; Mellano, M.G.; Masino, F.; Antonelli, A. Fruit sensory characterization of four Pescabivona, white-fleshed peach [Prunus persica (L.) Batsch] landraces and correlation with physical and chemical parameters. Fruits 2013, 8, 195–207. [Google Scholar] [CrossRef]
  52. Lo Bianco, R.; Farina, V.; Indelicato, S.G.; Filizzola, F.; Agozzino, P. Fruit physical, chemical and aromatic attributes of early, intermediate and late apricot cultivars. J. Sci. Food Agric. 2010, 90, 1008–1019. [Google Scholar] [CrossRef]
Figure 1. Two-dimensional positioning of cultivars (five peaches and two nectarines) and physical, chemical (n = 30) and sensory (n = 20) fruit quality attributes determined by Biplot technique (MDPREF). Trees (500/ha) were grown near Riesi (37°16’ N and 330 m a.s.l.), in central-southern Sicily. Open and closed symbols indicate the two groups obtained by k-means clustering of object and vector coordinates. FW, fresh weight; TD, transversal diameter; FF, flesh firmness; GC, ground color index; CC, percentage of cover color; SSC, soluble solid content; TA titratable acidity; ST, SSC/TA; PCU, peel color uniformity; CON, consistency; ES, easy stone; FCI, flesh color intensity; PO, peach odor; GO, grass odor; FO, flower odor; ME, mealiness; SW, sweetness; BT, bitterness; SO, sourness; JU, juiciness; PF, peach flavor; GF, grass flavor; FLF, flower flavor.
Agriculture 09 00189 g001
Table 1. Fruit type, flesh color, harvest date, and harvest time in days after full bloom (DAFB) of the seven cultivars grown (500 trees/ha) near Riesi (37°16′ N and 330 m a.s.l.), in central–southern Sicily. P, peach; N, nectarine; Y, yellow flesh; W, white flesh.
CultivarTypeFlesh ColorHarvest DateHarvest Time (DAFB)
FairtimePY10 September158
GuglielminaPY10 September158
SummersetPY15 September163
Tardiva 2000PY25 September184
DanielaPW25 September173
FairlaneNY28 September176
CaliforniaNY30 September189
Table 2. Physical, chemical (n = 30), and sensory (n = 20) attributes for the five peach cultivars grown (500 trees/ha) near Riesi (37°16′ N and 330 m a.s.l.), in central–southern Sicily. Physical and chemical attribute assessments were done within a day from harvest. Different letters indicate significant differences (Tukey’s test, p < 0.05) among cultivars and for each attribute. SSC: content of soluble solids, TA: titratable acidity.
DanielaFairtimeGuglielminaSummersetTardiva 2000
Physical attributes
Fruit weight (g)198 ab237 a175 bc213 ab148 c
Transverse diameter (mm)74.2 a76 a68.5 b74.2 a65.6 b
Size category (> 70%)AAAAAAAA
Flesh firmness (kg cm−2)5.745.995.865.625.43
Ground color index0.830.830.820.830.82
Cover color (%)53.2 a52.6 a27.6 b53.6 a20 c
Chemical attributes
Soluble solids (°Brix)13.8 c13.4 c16.6 a13.3 c15.3 b
Acidity (g malic acid L−1)4.38 c6.09 ab4.42 c6.19 a5.79 b
SSC/TA3.15 b2.2 c3.76 a2.15 c2.64 bc
Sensory attributes
Peel color uniformity4.74.55.14.25.8
Consistency6.97.377.86.9
Easy stone4.1 b6.9 a3.8 b6.7 a7.8 a
Flesh color 3.d4.8 bc5.5 ab3.7 cd6.5 a
Peach odor6.8 a5 b7.2 a5 b6.1 ab
Grass odor4.15.63.65.44.7
Flower odor4.634.74.14
Mealiness5.34.15.356
Sweetness6.7 a5 b6.7 a5.9 ab6.8 a
Bitterness2.53.53.14.33.3
Sourness1.82.31.921.5
Juiciness5.24.15.14.55.5
Peach flavor6.656.75.66.9
Grass flavor33.33.94.64.7
Flower flavor4.13.23.73.22.9
Table 3. Physical, chemical (n = 30), and sensory (n = 20) attributes for the two nectarine cultivars grown (500 trees/ha) near Riesi (37°16′ N and 330 m a.s.l.), in central–southern Sicily. Physical and chemical attribute assessments were done within a day from harvest. Different letters indicate significant differences (t-test, p < 0.05) between the cultivars and for each attribute.
CaliforniaFairlane
Physical attributes
Fruit weight (g)289 a175 b
Transverse diameter (mm)80.2 a66.3 b
Size category (> 70%)AAA
Flesh firmness (kg cm−2)6.49 a5.63 b
Ground color index0.79 b0.81 a
Cover color (%)51.3 a21.2 b
Chemical attributes
Soluble solids (°Brix)13.6 b16.5 a
Acidity (g malic acid L−1)9.22 a6.77 b
SSC/TA1.48 b2.44 a
Sensory attributes
Peel color uniformity3.95
Consistency7.76.4
Easy stone6.2 a3.1 b
Flesh color 5.16.5
Peach odor4.65
Grass odor6.8 a4.5 b
Flower odor3.23.7
Mealiness3.5 b5.9 a
Sweetness3.9 b6.1 a
Bitterness4b6.6 a
Sourness6.1 a3.4 b
Juiciness3.22
Peach flavor4.1 b6.2 a
Grass flavor5.7 a3.5 b
Flower flavor3.23.7
Table 4. Eigenvalues and proportion of total variability among the observed cultivars and fruit quality attributes as explained by the five principal components (PC). Peach (five cultivars) and nectarine (two cultivars) trees (500/ha) were grown near Riesi (37°16′ N and 330 m a.s.l.), in central–southern Sicily.
PCEigenvalues Variance (%)Cumulative Variance (%)
111.6850.850.8
24.8212171.8
32.86612.584.3
42.0488.993.2
51.0084.497.6
Table 5. Standardized component coordinates for quality attributes (vectors) and cultivars (objects) from biplot analysis and grouping by cluster analysis (FW, fresh weight; TD, transversal diameter; FF, flesh firmness; GC, ground color index; SSC, soluble solid content; TA titratable acidity; ST, SSC/TA; PCU, peel color uniformity; CON, consistency; ES, easy stone; FCI, Flesh color intensity; PO, peach odor; GO, grass odor; FO, flower odor; ME, mealiness; SW, sweetness; BT, bitterness; SO, sourness; JU, juiciness; PF, peach flavor; GF, grass flavor; FLF, flower flavor). Peach (five cultivars) and nectarine (two cultivars) trees (500/ha) were grown near Riesi (37°16′ N and 330 m a.s.l.), in central–southern Sicily.
PC1PC2PC3PC4PC5
Vector coordinates
FW−2.3130.54−0.4350.410.056
TD−2.0621.246−0.360.250.035
FF−1.304−0.11−0.7091.75−0.648
SSC1.632−1.556−0.3670.7640.362
TA−2.103−1.1330.042–0.0990.321
ST1.3470.3310.5461.665−0.168
GC1.0791.889−0.561–0.701−0.392
CC−1.5361.826−0.372–0.345−0.096
PCU2.027−0.8170.8180.182−0.5
CON−1.7611.0650.931−0.0270.728
ES−0.9950.3262.107−0.391−0.528
FCI0.432−2.2450.5790.577−0.311
PO1.9780.9210.0011.01550.344
GO−2.372−0.1970.474−0.228−0.083
FO1.9160.859−0.1680.1071.244
ME2.186−0.6650.125−0.8190.183
SW2.3880.2520.198−0.3860.196
BT−0.361−1.911−0.884−1.0590.148
SO−1.934−0.885−0.7140.5540.577
JU1.1231.5911.3870.4520.117
PF2.4160.0160.189−0.1960.128
GF−1.382−0.6641.260.2861.34
FLF1.0350.726−2.0580.2230.287
Object coordinates
Fairtime−0.8150.2040.0440.051−0.208
Guglielmina1.2650.028−0.0190.3280.077
Summerset−0.4520.3190.176−0.2940.108
Tardiva 20000.951−0.3120.535−0.034−0.029
Daniela0.7920.794−0.31−0.056−0.008
California−2.228−0.164−0.0310.1590.079
Fairlane0.487−0.869−0.395−0.155−0.018

