Article

Development and Field Evaluation of a Spray Drift Risk Assessment Tool for Vineyard Spraying Application

by
Georgios Bourodimos
1,2,*,
Michael Koutsiaras
1,
Vasilios Psiroukis
1,
Athanasios Balafoutis
3 and
Spyros Fountas
1
1
Department of Natural Resources Management & Agricultural Engineering, Agricultural University of Athens, Iera Odos 75, 11855 Athens, Greece
2
Department of Agricultural Engineering, Institute of Soil and Water Resources, Hellenic Agricultural Organization “DEMETER”, Democratias 61, 13561 Aghii Anargiri Attikis, Greece
3
Institute for Bio-Economy & Agri-Technology, Centre of Research & Technology Hellas, Dimarchou Georgiadou 118, 38221 Volos, Greece
*
Author to whom correspondence should be addressed.
Agriculture 2019, 9(8), 181; https://doi.org/10.3390/agriculture9080181
Submission received: 25 June 2019 / Revised: 8 August 2019 / Accepted: 11 August 2019 / Published: 14 August 2019
(This article belongs to the Special Issue Sensors Application in Agriculture)

Abstract

:
Spray drift is one of the most important causes of pollution from plant protection products and it puts the health of the environment, animals, and humans at risk. There is; thus, an urgent need to develop measures for its reduction. Among the factors that affect spray drift are the weather conditions during application of spraying. The objective of this study was to develop and evaluate a spray drift evaluation tool based on an existing model by TOPPS-Prowadis to improve the process of plant protection products’ application and to mitigate spray drift for specific meteorological conditions in Greece that are determined, based on weather forecast, by reassessing the limits for wind speed and direction, temperature, and air relative humidity set in the tool. The new limits were tested by conducting experimental work in the vineyard of the Agricultural University of Athens with a trailed air-assisted sprayer for bush and tree crops, using the ISO 22866:2005 methodology. The results showed that the limits set are consistent with the values of the spray drift measured and follows the tool’s estimates of low, medium, and high risk of spray drift.

1. Introduction

Chemical crop protection is one of the most important factors in agricultural production, as global potential crop yield is diminished by pests up to 40%, a figure that would be twice as large if no plant protection products (PPPs) were used [1]. The benefits from crop protection are also undeniably significant in regards to improved food security and the reduction of labor [2]. However, as most PPPs are applied in the field by spraying, due to low cost and efficient performance [3], serious PPP losses are a side effect of chemical crop protection due to run-off, leaching, evaporation, and spray drift, putting the health of the environment, animals, and humans at risk [4].
Spray drift is the quantity of PPPs that is carried out by air currents from the sprayed area during the spraying application [5]. Spray drift is an important and costly (environmentally and economically) problem that is hard to control and may cause the PPPs to be deposited in off-target areas. The consequences can be serious, such as surface water contamination, air pollution, damage to sensitive nearby crops and other susceptible off-target areas, residues of chemical substances in food and feed commodities, health risks for animals and people (farm workers, bystanders, and passers-by), nearby urban or natural area contamination, and reduced PPP effectiveness due to lower dose than intended on the targeted crops [6,7,8,9,10]. Additionally, the financial burden resulting from spray drift due to increased inputs is very high [11].
There are many factors that contribute to spray drift and several of them are interrelated. Some factors can be controlled by the sprayer operator, while others cannot be controlled. These factors can be grouped into the following categories: (i) Equipment and application techniques (i.e., sprayer type, size and type of nozzles, spray pressure, spray volume rate, air flow rate, driving speed, sprayer’s setup, etc.); (ii) weather conditions during application (i.e., wind speed and direction, temperature, relative humidity, and stability of air at the application site); (iii) spray characteristics, (i.e., volatility and viscosity of the PPP formulation; (iv) operator’s care, attitude, and skill; and (v) characteristics and geometry of the crop (i.e., foliage, density, dimensions, etc.) [12,13,14,15,16,17].
Among the technical factors that affect spray drift, the most important is droplet size [18] and more particularly the percentage of fine spray droplets [19,20,21,22]. Considering the pressure atomization, droplet size depends on the nozzle design, orifice size, operating pressure, and the physical properties of the PPP formulation and spray additives [23,24]. The smaller a spray droplet, the longer it remains airborne, and the higher the possibility for it to be carried away by crosswind [25]. Droplets with diameter smaller than 100 μm contribute significantly to drift losses [26,27]. Forward speed has also a clear effect on spray drift, where the higher the driving speed the greater the spray drift, both for airborne drift and for ground deposition [28]. Regarding bush and tree sprayers, among the various application operating parameters that affect spray drift, those that concern spray generation (nozzle type and pressure) and droplet transport to the canopy (air fan volume, speed, orientation) are of great importance [29].
Environmental conditions influence spray drift and cannot be controlled by the sprayer operator. These factors need to be taken into consideration and be monitored before and during the PPP application. Among the meteorological factors affecting spray drift, wind velocity has the greatest impact, while wind direction plays also an important role. There is a strong positive correlation between wind speed and spray drift deposition [30]. Higher wind speeds result in more drift at greater distances [31]. Summer [32] pointed out that wind speed should not exceed 16 km h−1 (4.44 m s−1) to continue spraying. According to da Cunha et al. [33], the maximum permissible wind speed for spraying is 12 km h−1 (3.33 m s−1), while Maciel et al. [34] also proposed that spraying operation should be performed with wind speeds ranging between 2 and 12.8 km h−1 (0.55 to 3.55 m s−1). It should be noted that different wind speeds and directions have also been reported to contribute to uneven spray distribution between the left and right side of the sprayer [35]. In addition, large fluctuations in wind direction increase the unpredictability of droplet travel direction and the amount of dilution due to atmospheric turbulence [36].
Air temperature and relative humidity during the spraying operation play also key role in spray drift. Low relative humidity and/or high air temperature can reinforce evaporation by decreasing the droplet size, especially small droplets, having, as a result, decreased sedimentation velocity and droplets more prone to drift [37]. Low relative humidity combined with high temperatures contributes to the evaporation of the spray liquid with an impact both on the environment and on the economic viability of the farm [34]. ISO 22866 standard [5] considers acceptable conditions for field measurement of spray drift at temperatures ranging from 5 to 35 °C. Da Cunha et al. [33], pointed out that spraying should be avoided when temperature is above 30 °C and relative air humidity is below 55%. As a rule, if the relative humidity is above 70%, the conditions are ideal for spraying, and if the relative humidity is below 50%, it is quite critical and requires special attention [32]. Generally, spray drift can be significantly reduced by spraying at low wind speed, low temperature, with low turbulence, at times of low sun radiation and at high relative humidity [38].
Moreover, it should be noted that during rain or shortly before it occurs, PPP application should be avoided due to leaching risk from the crop canopy before the active substance is able to act [39], polluting the soil and the underground water resources.
Since the negative effect of spray drift has been recognized, there is a need for harmonized mitigation measures to reduce human health and environmental impact. Such measures have been developed and can be divided into three classes [40,41,42]: (i) The use of no-spray or even no-crop buffer zones; (ii) the reduction of exposure using vegetative or artificial windbreaks, and (iii) the application of drift-reducing technology, such as drift-reducing nozzles and spray additives to coarsen the droplet size distribution, as well as shielded and band sprayers. In addition, the EU legislation has been adjusted in this direction, with Directive 2009/128/EC [43] establishing a framework to achieve sustainable use of PPPs, while Directive 2009/127/EC [44] specifies that sprayers should be designed and constructed to ensure that PPPs are deposited on target areas, to minimize losses to other areas and to prevent drift. USA has also set certain measures for spray drift prevention that are in the same direction as the EU legislation [45].
In recent years, several attempts have been made to reduce spray drift through predicting weather conditions and creating automated spray drift reduction systems. Such systems may collect meteorological data from either ground meteorological stations or geostationary satellites and predict drift or provide information to the user on how to treat and regulate the sprayer. The frequency of meteorological data gathering is crucial to optimize weather prediction and develop a reliable spray drift model. As an example, Huang and Thomson [46] highlighted the importance of knowing meteorological data on 15 min basis than on 1 h basis, as climate conditions can change rapidly, making hourly forecasts unreliable. On-line applications are also used for spray drift prediction and reduction helping farmers make decisions for best practice implementation. For example, Nansen et al. [47] created an online decision support tool for farmers and agricultural advisors. This tool allows the prediction, measurement, and archiving of spraying coverage, which is quantified using water sensitive filter papers. Spray drift investigation and prediction under a wide range of conditions have been conducted [48,49]. A comprehensive model which accurately predicts the downwind movement of spray for given circumstances, including spray liquid characteristics, spray nozzle characteristics, and meteorological conditions, was developed by the US Spray Drift Task Force [50]. Hong et al. [51] presented a software application for spray drift estimation using an orchard air-assisted sprayer, through their research study on spray drift prediction. Another case of a spray drift prediction model, which simulates spray drift taking meteorological conditions into consideration, is the one produced by Nsibande et al. [52] in South Africa.
The aim of this research was to evaluate spray drift in vineyards using a drift risk assessment tool in order to improve the process of PPP application and mitigate spray drift. The spray drift risk assessment tool was developed taking into consideration a similar drift evaluation tool developed in the framework of the TOPPS-Prowadis [53]. The factors that the tool considers are wind speed and direction, air temperature, and relative humidity. The ultimate goal was to examine the reliability of the tool by measuring the meteorological conditions in the field and assessing ground and airborne spray drift. The evaluation used field trials in a vineyard under the standardized test methodology of ISO 22866:2005 [5]. The selected vineyard variety for spray drift trials was Savatiano, the most widespread winemaking variety in the Attica region, which has been cultivated for about 4000 years [54].

2. Materials and Methods

2.1. Spay Drift Risk Assessment Tool

The tool evaluates the potential drift risk from PPP applications using air-assisted sprayers for different meteorological conditions under field conditions in vineyards. The meteorological data input to the tool is obtained from a weather forecast website for the geographic coordinates of the field. The drift evaluation tool can help the farmers or spray contractors to make decisions for PPP applications with high spray efficiency and low spray drift risk to the environment.
The tool is based on the methodology developed from the TOPPS-Prowadis drift evaluation tool [53], and presents three categories depending on the risk of spray drift to occur:
  • Low” indicates that it is possible to apply spraying as the drift will have small/acceptable extent;
  • Medium” indicates that there is medium risk of spray drift due to conditions and, the use of drift-reducing technology and/or setting drift-reducing application parameters should be considered;
  • High” indicates that there is high risk of spray drift and; therefore, spraying should not be applied.
The tool takes into account limitations related to air temperature, relative humidity, wind speed, and wind direction. Considering the meteorological conditions in Greece and a series of experimental measurements carried out in Greek vineyards, the tool’s limits on weather conditions varied from those used by the TOPPS-Prowadis drift evaluation tool as follows:
  • Air temperature: The limits between the three categories were set at 25 and 30 °C, while the TOPPS-Prowadis tool uses, as limits, 15 and 25 °C. This is because during the spraying period of vineyards in Greece temperatures vary from 20 °C to above 30 °C.
  • Relative humidity: The TOPPS-Prowadis tool’s limits between the three categories were maintained and they are 40% and 60%.
  • Wind speed: The 5 classes of the TOPPS-Prowadis tool were made 3, with the limits between them set at 3 and 4.5 m s−1. The classes of the TOPPS tool which refer to low and medium wind speeds were merged, because during the spraying period the high temperatures do not allow weak winds to occur.
In order to evaluate and categorize the drift risk, the tool combines the values of the meteorological parameters by giving priority to the wind speed.
The above limits and categories apply with the following basic assumptions:
  • The wind direction is towards the sensitive area.
  • The canopy crop density is greater than 50%.
  • There is no rainfall.
  • The rows are sprayed from two sides and air is blown from two sides to each row.

2.2. Test Site and Crop Characteristics

The experimental field was an organic vineyard at the Agricultural University of Athens farm in Athens, Greece (37°59′06″ N, 23°54′21″ E).
The vineyard has 2.0 m row spacing with 1.6 m spacing of vines along the row to result in a density of 3125 vines ha−1. The average vine height was about 1.1 m, with the leaves and grapes occupying the zone above ground between 0.3 and 1.2 m. At spraying times, the vines were in full leaf stage (BBCH 83 “Berries developing colors” and BBCH 91 “After harvest; end of wood maturation”) [55], and the leaf area index (LAI) values were 1.58 and 1.46, respectively.

2.3. Experimental Design

The field experiments were carried out based on the ISO 22866:2005 standard [
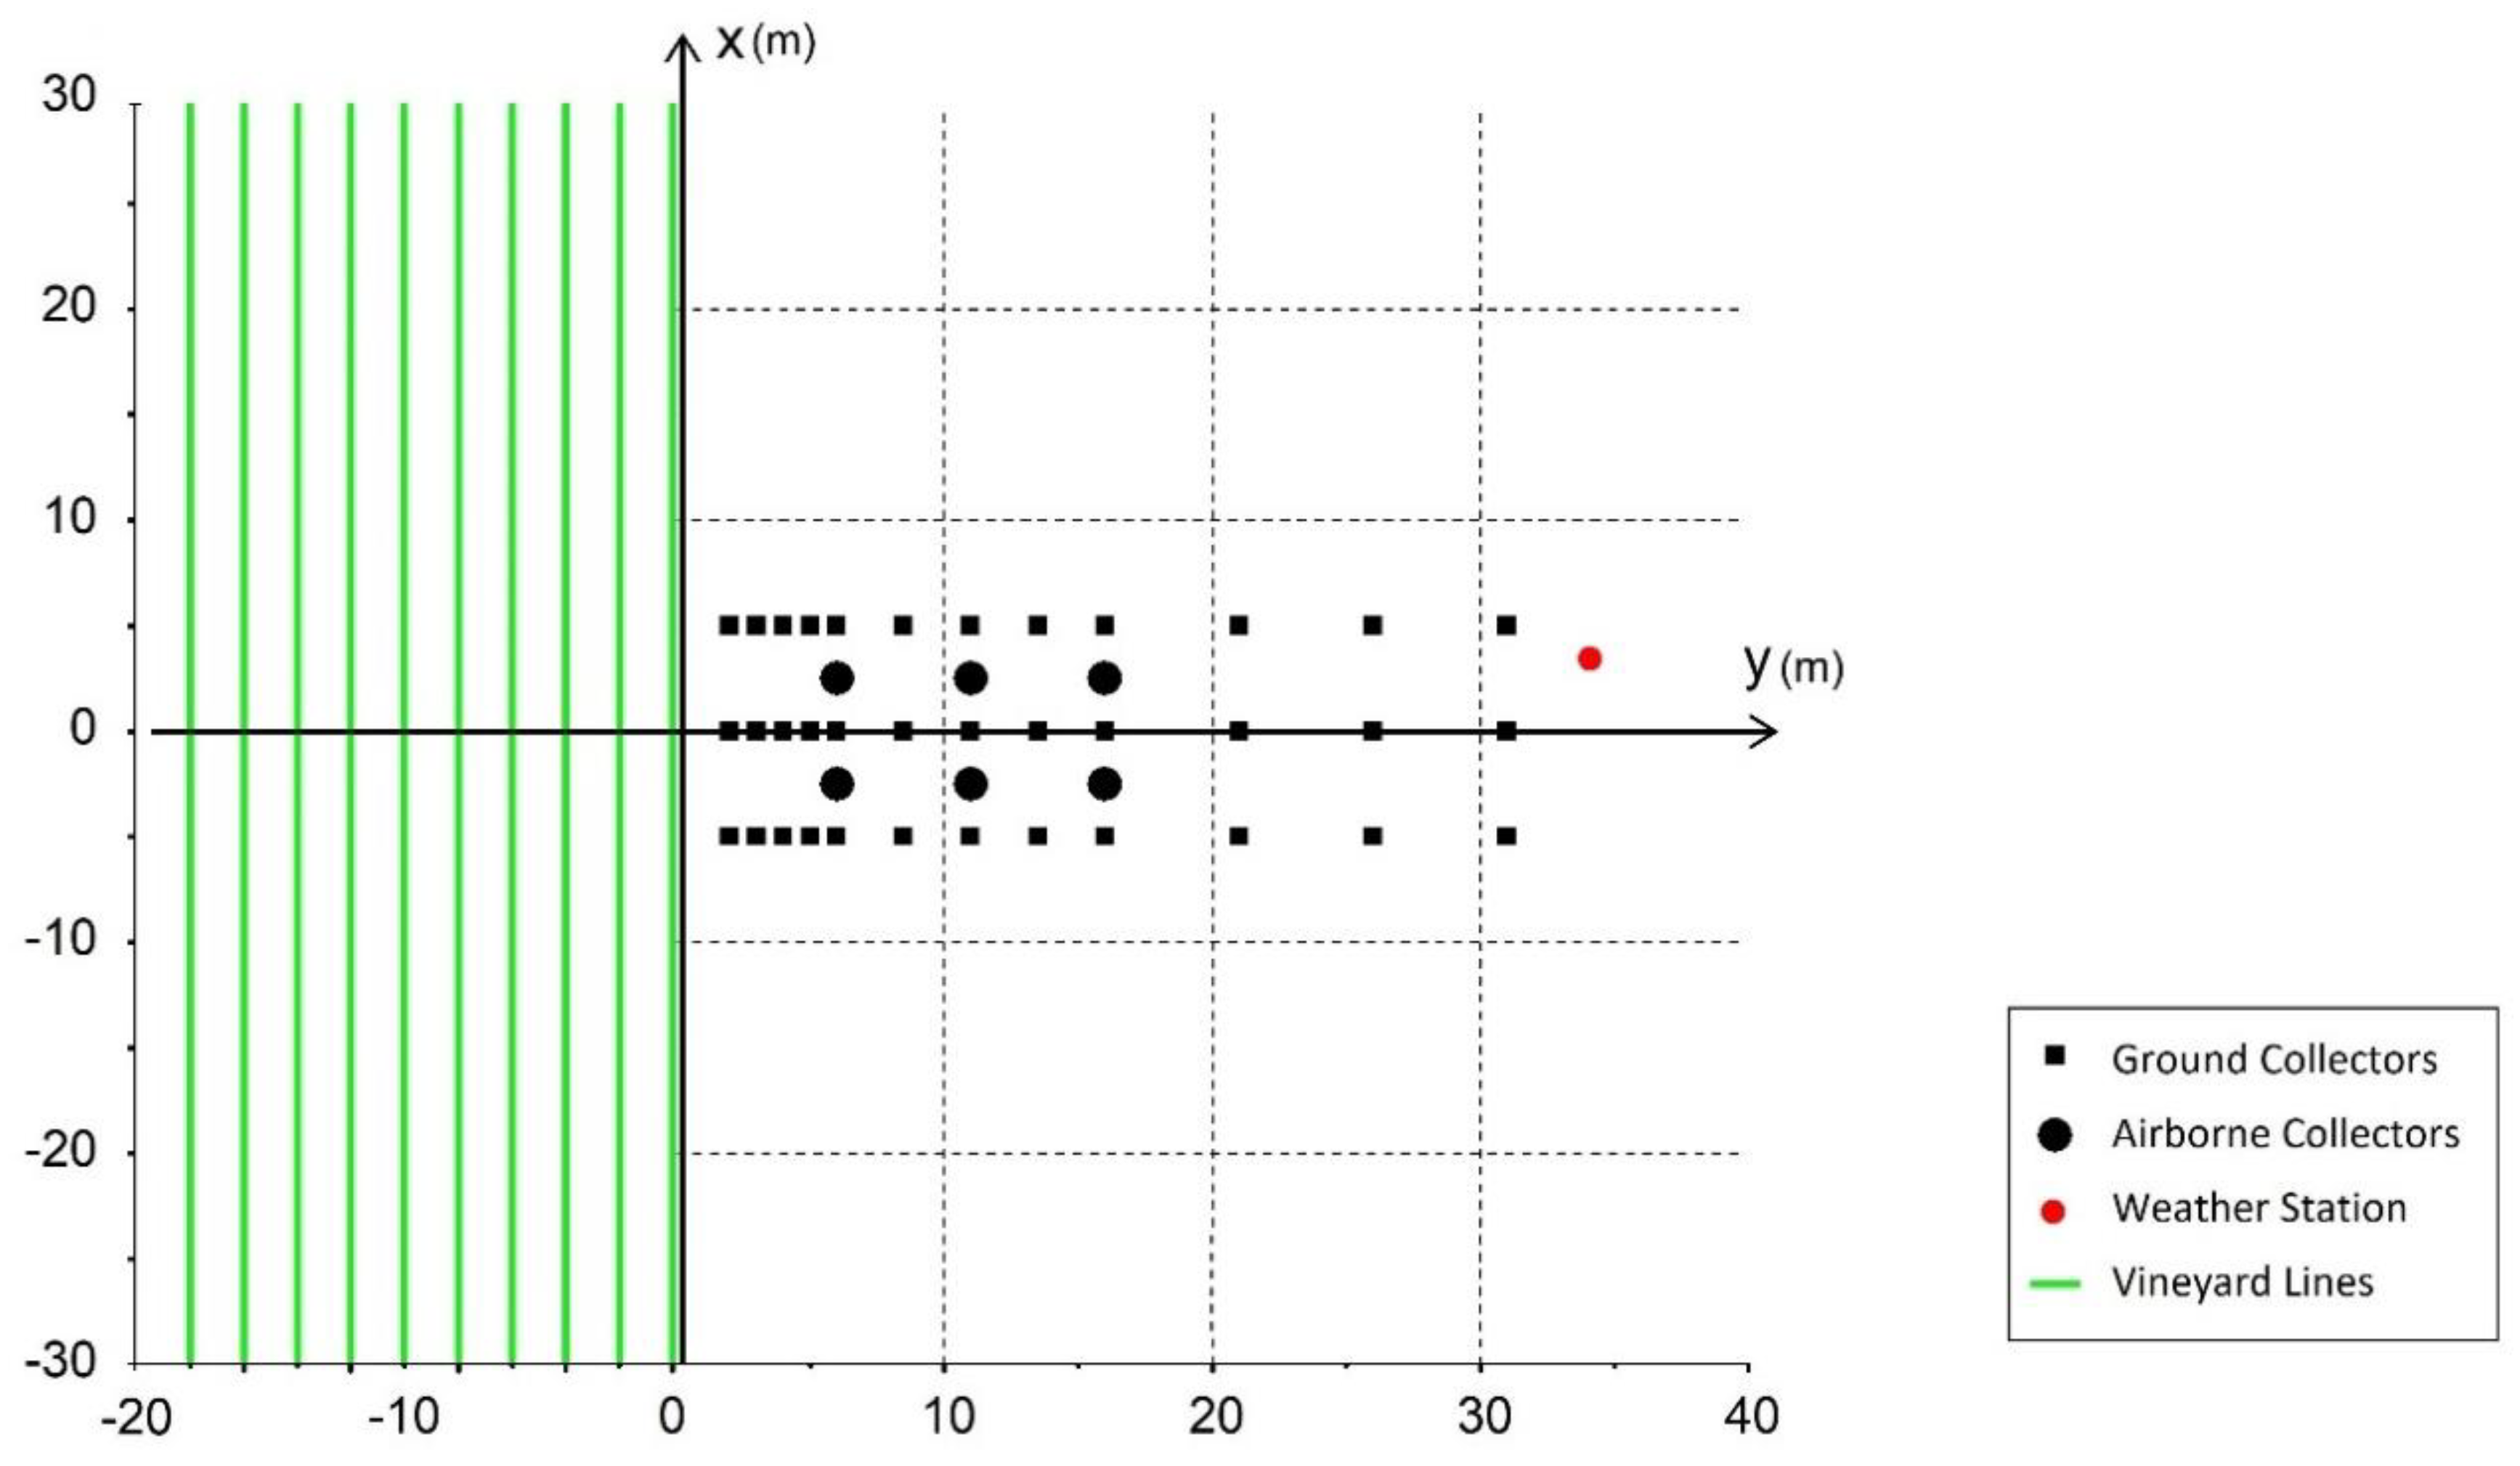
5], which set the criteria on the conditions for spray drift measurements. In accordance to this, the directly-sprayed area shall be at least 20 m wide upwind of the edge of the cropped area and the length of the spray track at least twice as the largest downwind sampling distance, and should be symmetrical to the axis of the sampling array. Therefore, every trial was carried out by spraying the ten outer downwind rows of the vineyard along a distance of 60 m, in order to treat a surface of 1200 m2 (60 × 20 m) (Figure 1).
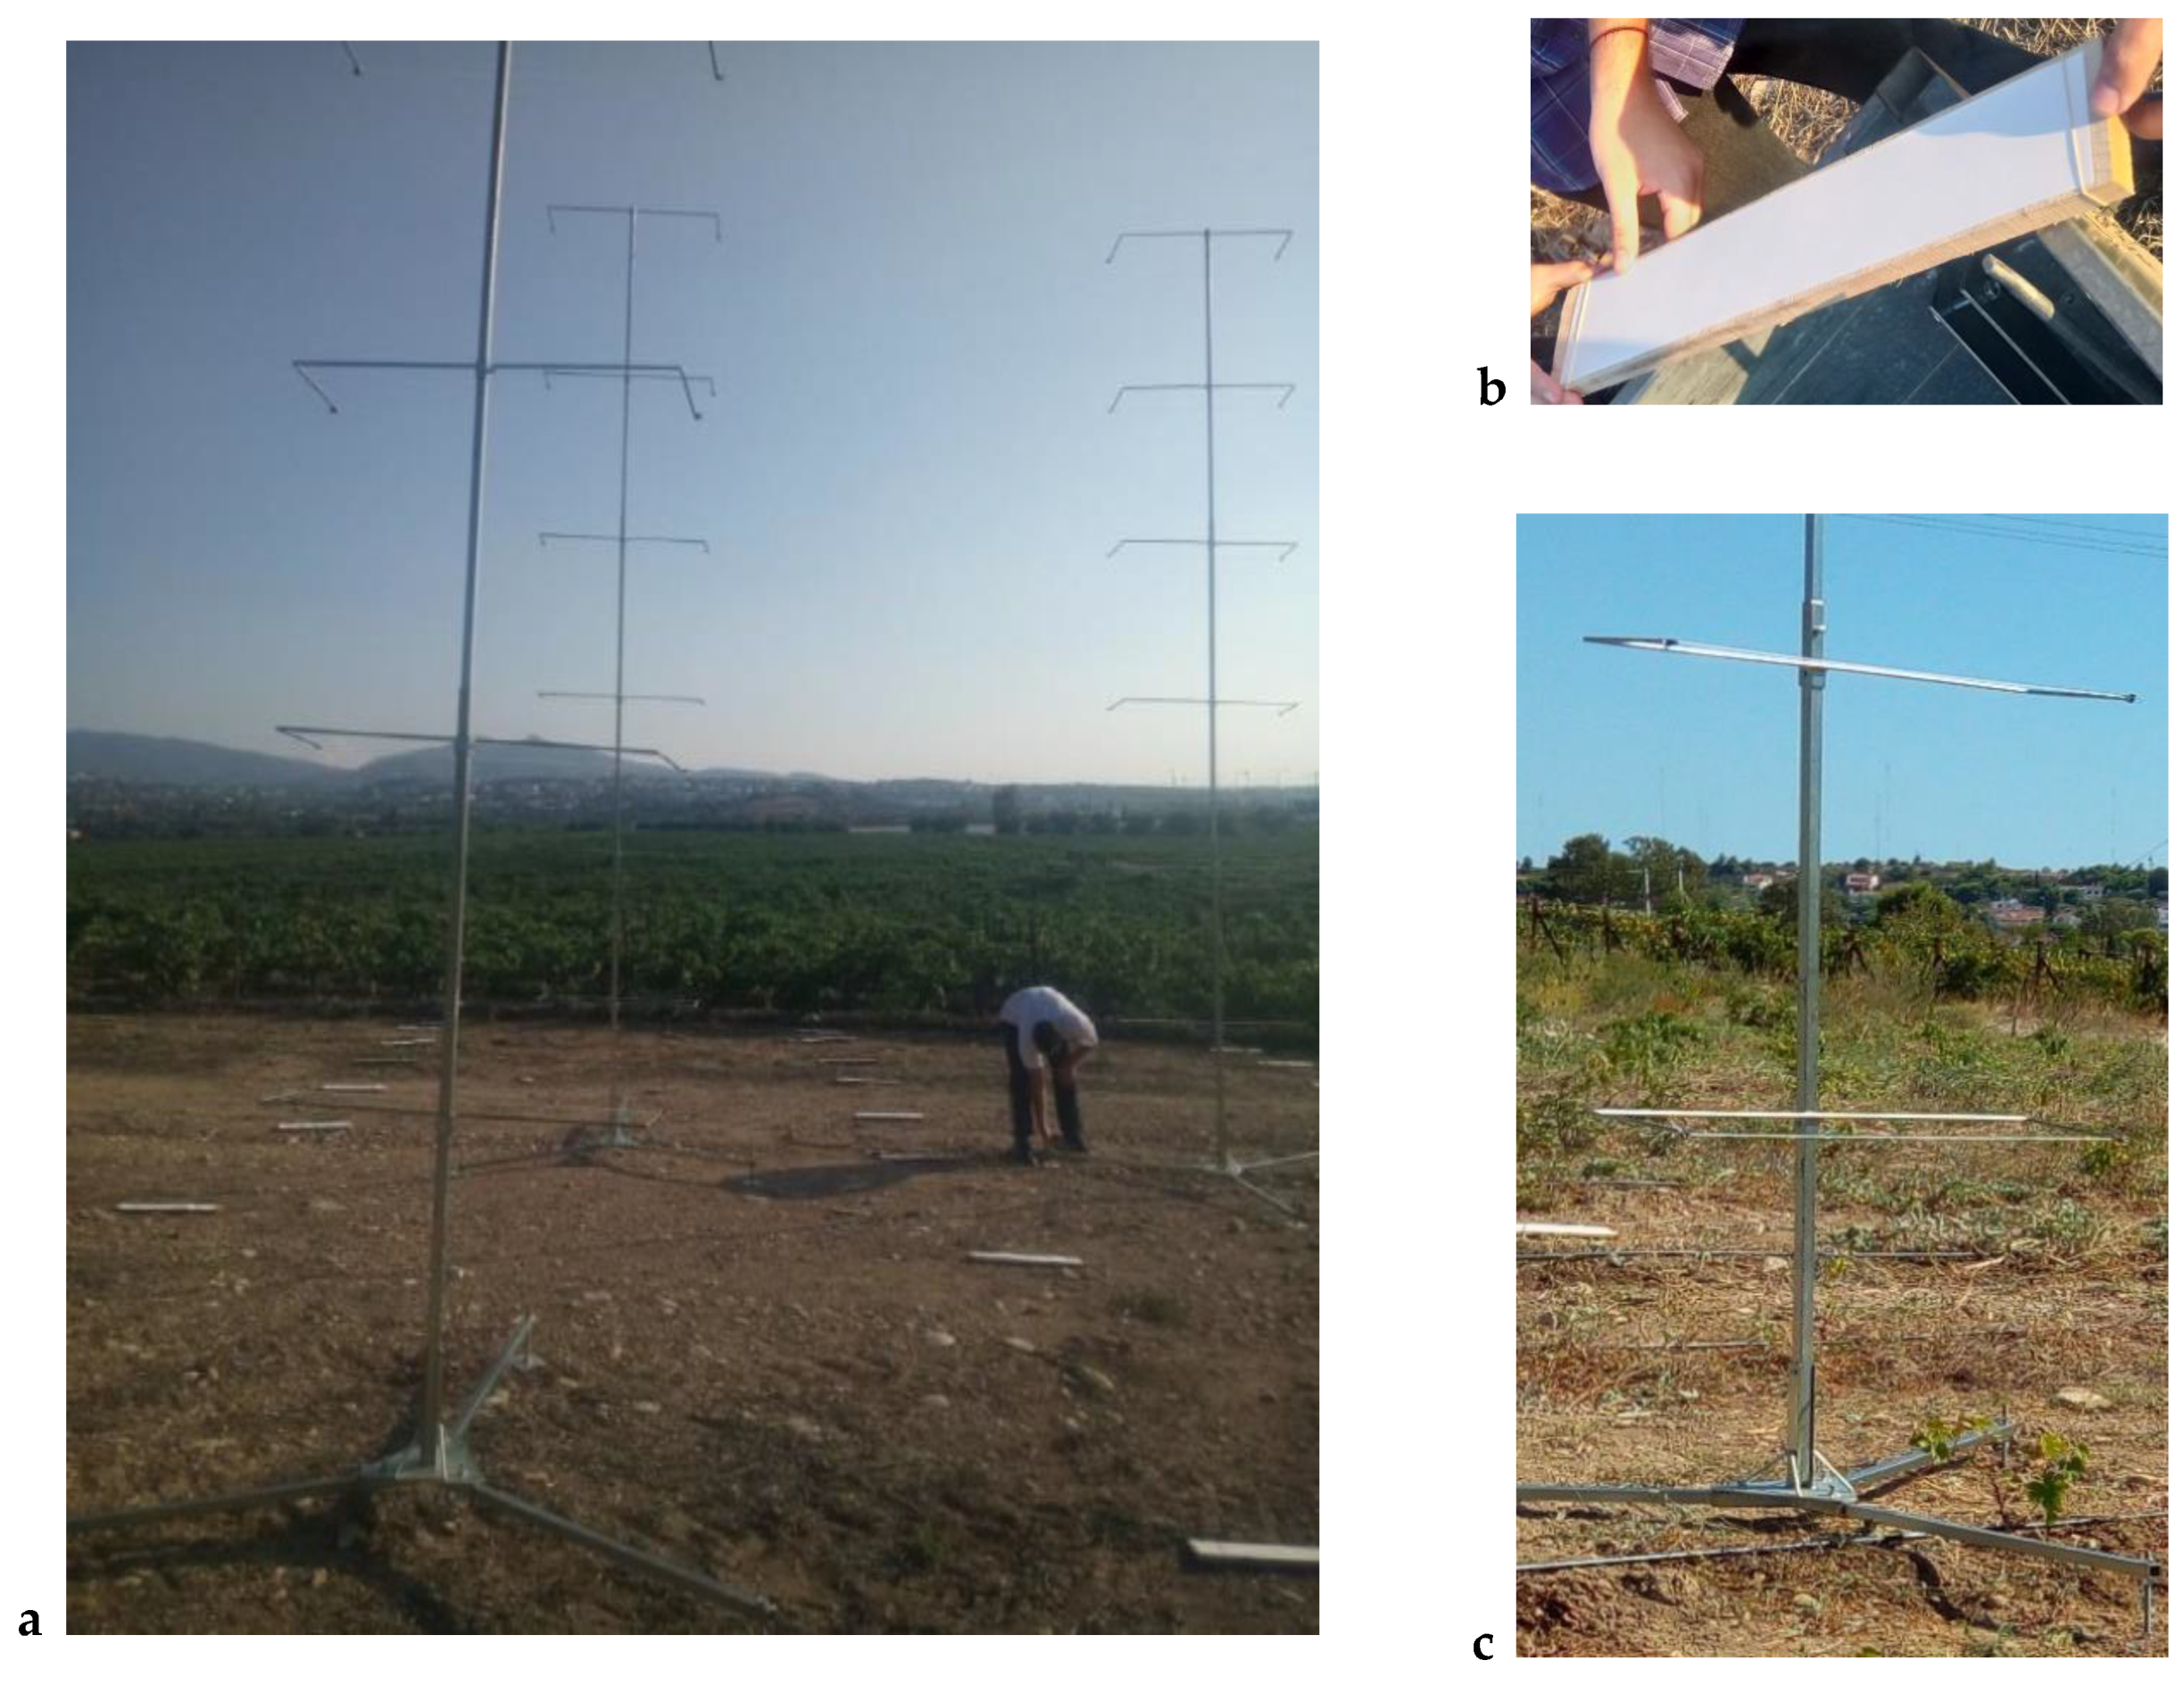
The experimental area was open and free of obstructions, other than the target crop (vineyard), as these may affect the airflow in the sampling area [5]. On the downwind side of the directly-sprayed area, there was bare soil or short vegetation (maximum height 7.5 cm), on which collectors were placed for the estimation of airborne spray drift and sedimenting spray drift [5] (Figure 2a).
In each trial, both ground sediment and airborne spray drift downwind to the directly-sprayed area were sampled. The ground collectors were placed at 12 different sampling distances in bare soil at 1, 2, 3, 4, 5, 7.5, 10, 12.5, 15, 20, 25, and 30 m from the edge of the directly-sprayed area (Figure 1). These distances started from the parallel straight line in front of the last plant row spaced 1 m (half of the row spacing). At each sampling distance, three wooden laths were placed with an upper surface covered in filter paper, Whatman Grade−1, 46 × 8 cm (Figure 2a,b), counting 36 soil samples per trial (Figure 1). So, each ground collector had a surface area of 368 cm2, summing up to a total of 1104 cm2 collector surface at each distance (the minimum collector area at any distance must be 1000 cm2 [5]).
The airborne spray drift was monitored on cylindrical polyethylene lines with an external diameter of 2 mm, length 1 m, and collection area 62.8 cm2 (Figure 2c). The measurements were taken at 3 distances, 5, 10, and 15 m, downwind from the edge of the directly-sprayed area (Figure 1). At each sampling distance, two 6 m high columns were placed, each of which had support structures per meter for the polyethylene lines, thus forming an array of 6 sampling collectors (Figure 2a,c). Therefore, at each distance there were 12 collectors summing up to a total sampling area of 753.6 cm2, resulting in 36 collectors per trial.
After each spraying repetition, the ground and air collectors were stored into plastic sachets and sealed in refrigerators for maintenance at the appropriate temperature (4 °C) until their spectrophotometric analysis in the laboratory.

2.4. Meteorological Conditions

Local weather conditions were measured following ISO 22866:2005 [5], but also to check the reliability of the weather forecast used by the drift risk assessment tool. Wind speed, wind direction, air temperature, and relative humidity were measured during the trials using a meteorological station placed at the edge of the downwind area in the center of the sampling area, 30 m from the sprayed area. Wind speed and direction were measured at a distance of 3 m from the ground, using an ultrasonic anemometer (Campbell Scientific WindSonic1 Gill 2D, Logan, UT, USA). Temperature and relative humidity were measured at two different heights, 2 and 3 m above ground, using two thermo-hygrometer probes (Rotronic HC2A-S3, Hauppauge, NY, USA). All measurements were taken at a frequency of 1 Hz sampling rate and all data were recorded automatically by a data logger (Campbell Scientific CR850, Logan, UT, USA).
The following parameters were calculated for each trial [5]:
  • Percentage of wind speed measurements less than 1 m s−1 (must be <10%);
  • Mean wind direction shall be at 90° ± 30° to the spray track (in this experiment between 0° and 60°) and no more than 30% of results shall be >90° ± 45° to the spray track;
  • Mean temperatures must be between 5 and 35 °C.

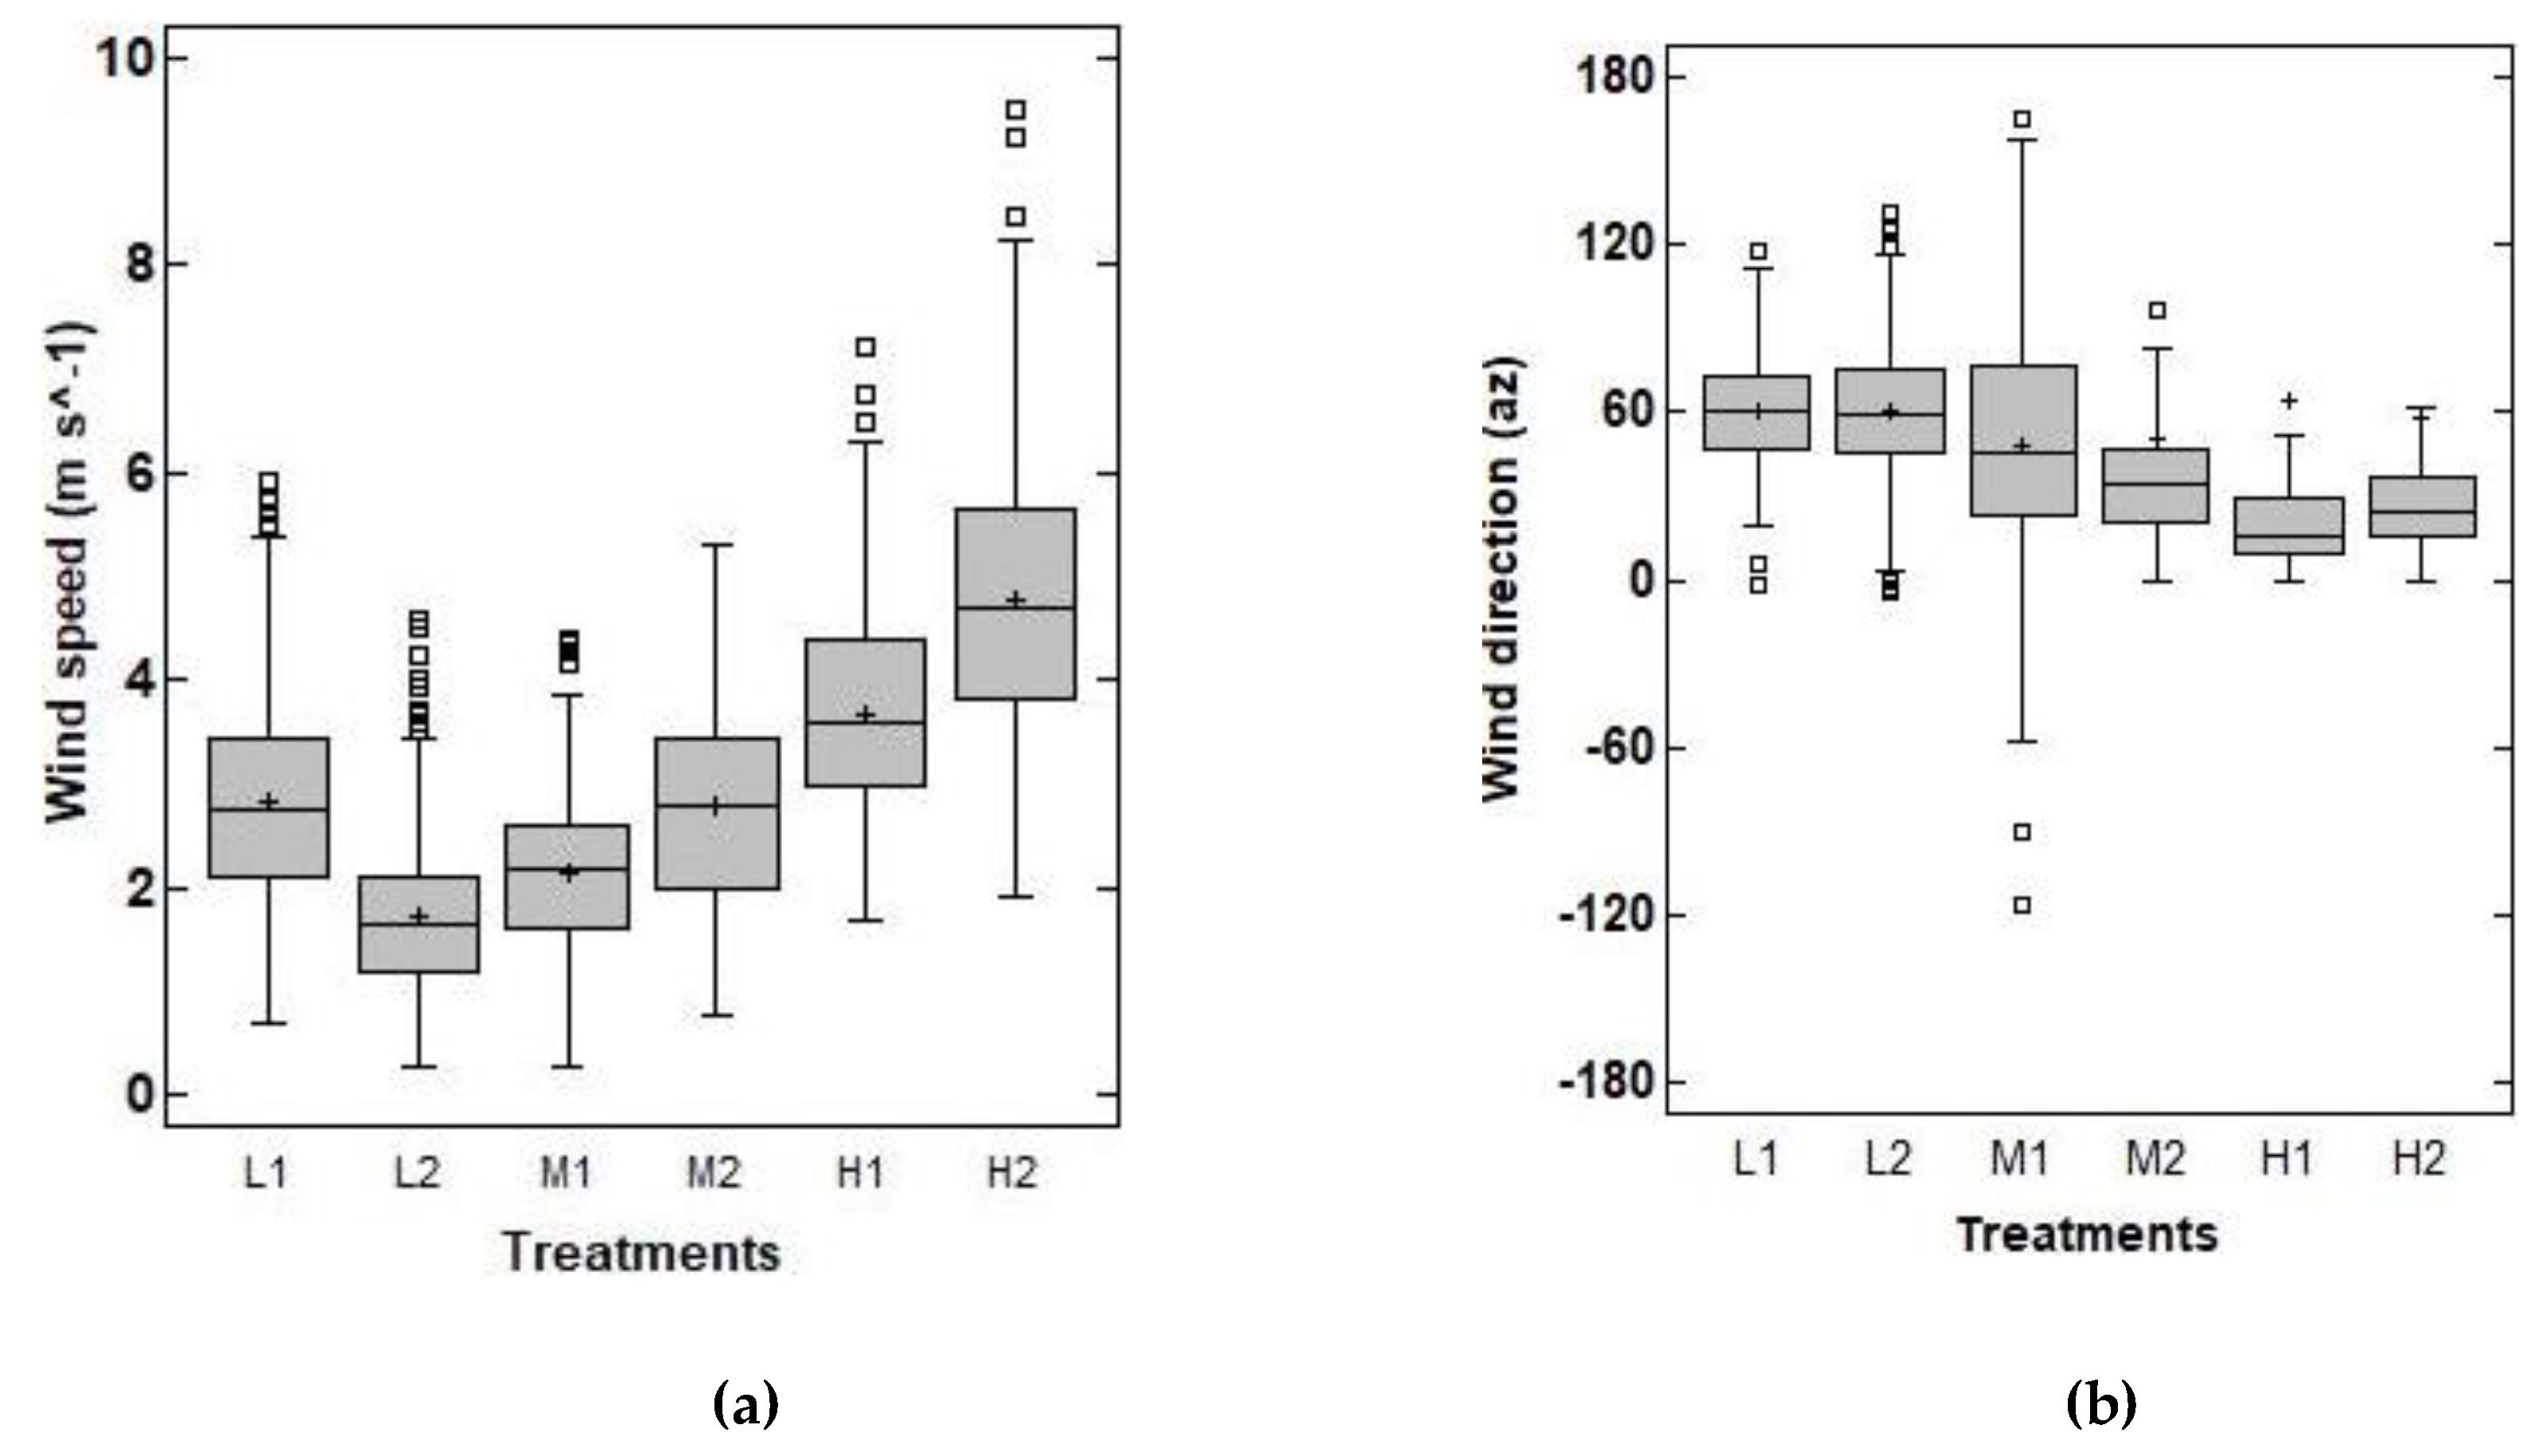
2.5. Treatments and Equipment Application Parameters

A total of six trials were carried out, two were related to the assessment of spray drift with a low risk tool indicator, two with medium, and two tests with high risk tool indicator.
Trials were performed using a trailed air-assisted sprayer for bush and tree crops Archimedes Turbo FS 1000 (“Archimedes” G. Roumeliotis, Aridaia Pellas, Greece), equipped with a 1000 L polyester tank, an axial fan of 800 mm in diameter with a two-speed gearbox and 7 nozzles for each side of the sprayer. The nozzles used were conventional hollow cone Teejet TXA 8002VK, yellow signed, with nominal nozzle flow rate of 1.40 L min−1 at 1.0 MPa. The real flow rate was closest to the nominal one. It was measured in the Department of Agricultural Engineering, Institute of Soil and Water Resources of the Hellenic Agricultural Organization “DEMETER”, using an electronic measuring device (AAMS-Salvarani BVBA, Maldegem, Belgium) (Figure 3a). During testing, after adjusting the spray profile to target characteristics by means of water-sensitive paper spread on the vineyard canopy and poles, it was decided to activate a total of 6 nozzles (3 on each side of the sprayer). For all treatments, the working pressure was 1.0 MPa, driving speed 1.61 m s−1 (5.8 km h−1), and volume application rate 434 L ha−1. In all trials the PTO revolution speed was 56.55 rad s−1 (540 rev min−1), fan speed 169.65 rad s−1 (1620 rev min−1) (fan ratio 1:3), and fan airflow rate 10,000 m3 h−1. Fan air flow rate was measured in the Department of Agricultural Engineering, using a measuring tunnel (AAMS-Salvarani BVBA, Maldegem, Belgium) (Figure 3b).

2.6. Spray Liquid, Sample Extraction, and Spray Drift Estimation

The spray liquid was a solution of clean water and E−102 Tartrazine yellow dye tracer 85% (w/w) at a concentration of about 4 g L−1 [56,57].
Before each test, a blank sample of filter paper was placed in the sprayed area and collected just before the start of spraying. Two samples of the spray liquid were also collected from the spray tank directly from a nozzle, one at the beginning and one at the end of the test, to determine the precise tracer concentration at the nozzle outlet at each test.
After collecting the samples, they were transferred for analysis to the laboratory. Tartrazine’s concentration in soil and air collectors was studied and quantified using a Shimadzu UV−1800 spectrophotometer, functioning at a wavelength of 426 nm.
Deposits of the spray tracer were extracted from samples using deionized water. For the respective samples the following volumes of deionized water were applied: A total of 40 mL for filter paper from 1 to 5 m distance, 20 mL for filter paper from 7.5 to 30 m distance, and 10 mL for polyethylene lines.
The reading of the spectrophotometer is related to the amount of tracer in solution through a calibration curve. From the reading of the spectrophotometer, the calibration factor, the collector surface area, the spray concentration and the volume of dilution liquid, and the amount of spray deposit per unit area were calculated as follows [5]:
d r i f t d e p = ( ρ s m p l ρ b l k ) · F c a l · V d i l ρ s p r a y · A c o l ,
  • driftdep = spray drift deposit (μL cm−2)
  • ρsmpl = spectrophotometer reading of the sample (Abs)
  • ρblk = spectrophotometer reading of the blanks (collector + deionized water) (Abs)
  • Fcal = calibration factor (μg L−1)
  • Vdil = volume of dilution liquid (L)
  • ρspray = spray concentration of tracer (g L−1)
  • Acol = collection area of the spray drift collector (cm2)
From this spray drift deposition figure, the percentage of spray drift on a collector can be calculated relating spray drift deposition to the amount applied in the field on the same unit of area, with the following formula:
d r i f t % = d r i f t d e p · 10 4 β v ,
where βv is the spray application volume in liters per hectare (L ha−1) and given by the following equation:
β v = T o t a l   n o z z l e   f l o w   r a t e · T i m e A r e a = T o t a l   n o z z l e   f l o w   r a t e · 60 R o w   S p a c i n g · V e l o c i t y / 10 = T o t a l   n o z z l e   f l o w   r a t e · 600 R o w   S p a c i n g · V e l o c i t y ,
  • Total nozzle flow rate = number of nozzles used multiplied by the nozzle nominal flow rate (L min−1)
  • Row spacing = distance between lines (m)
  • Velocity = velocity of the tractor (km h−1)
  • Time = 60 min
  • Area = 10,000 m2
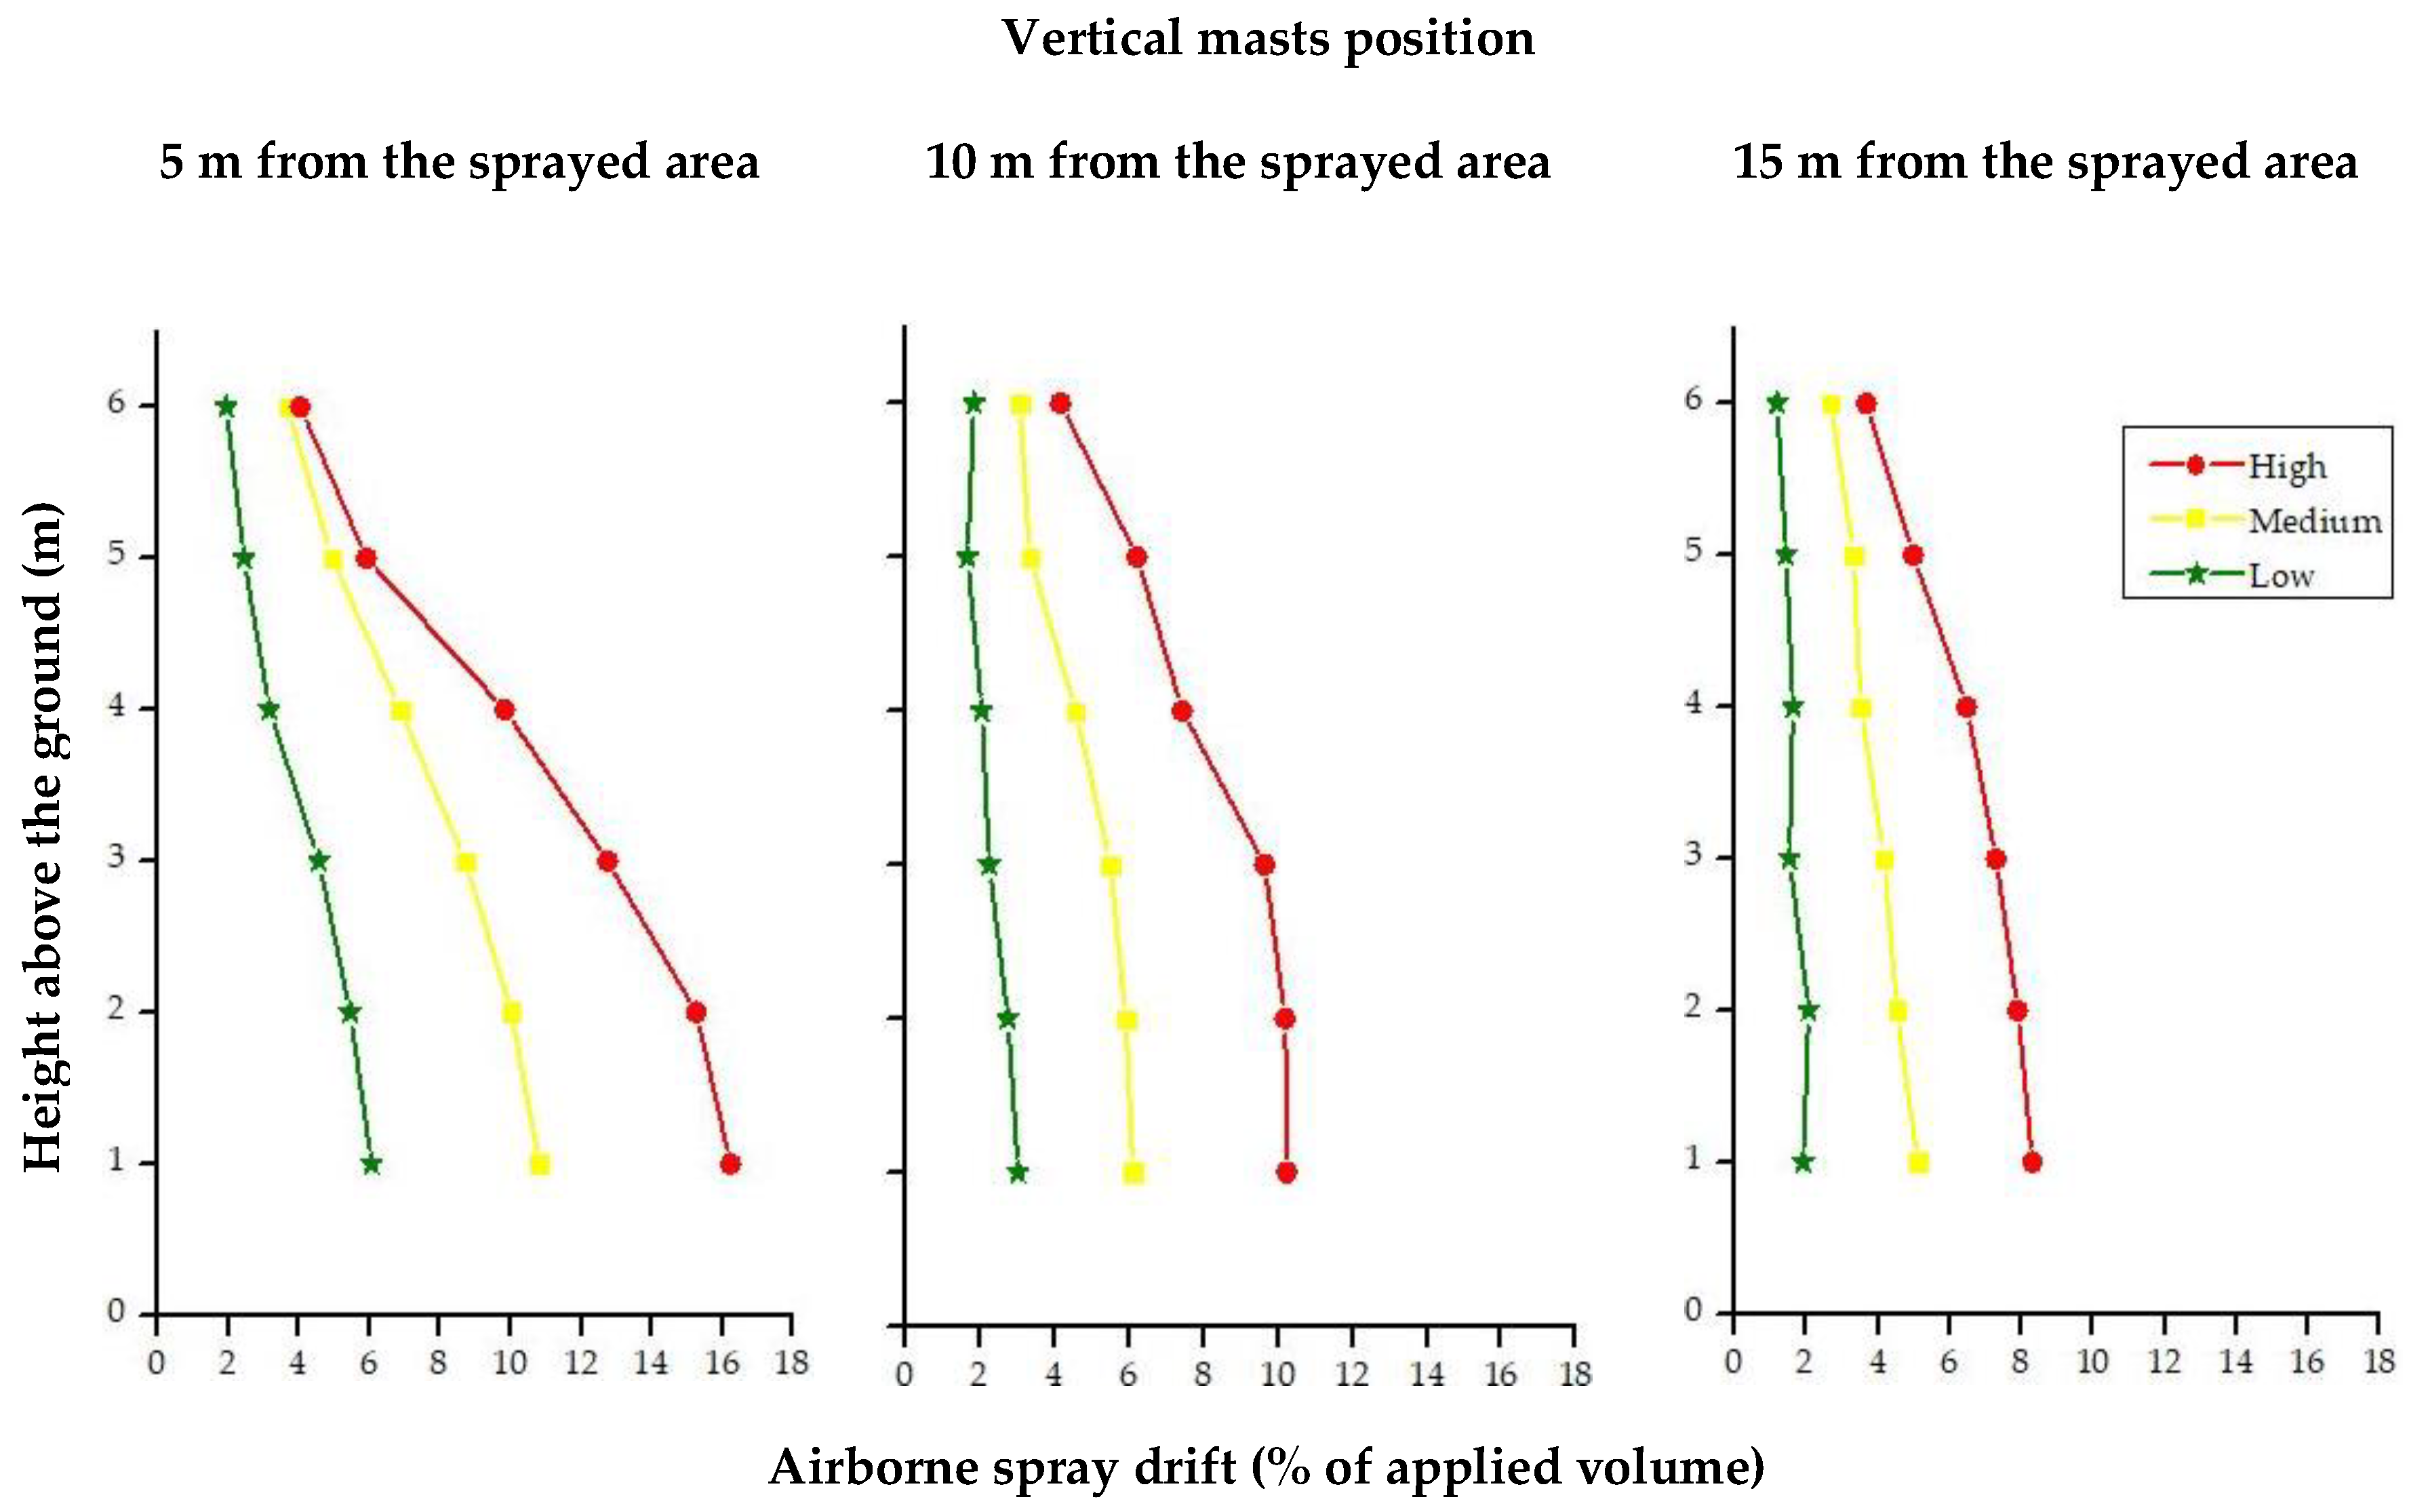
For drift ground sediment, once the tracer amount on each collector was measured, the mean of values derived from the three samples placed at each downwind distance was calculated. For airborne drift, the mean tracer amount derived from the two samples placed at each sampling height above the ground was calculated separately for each of the three sampled downwind distances (5, 10, and 15 m from the sprayed area).
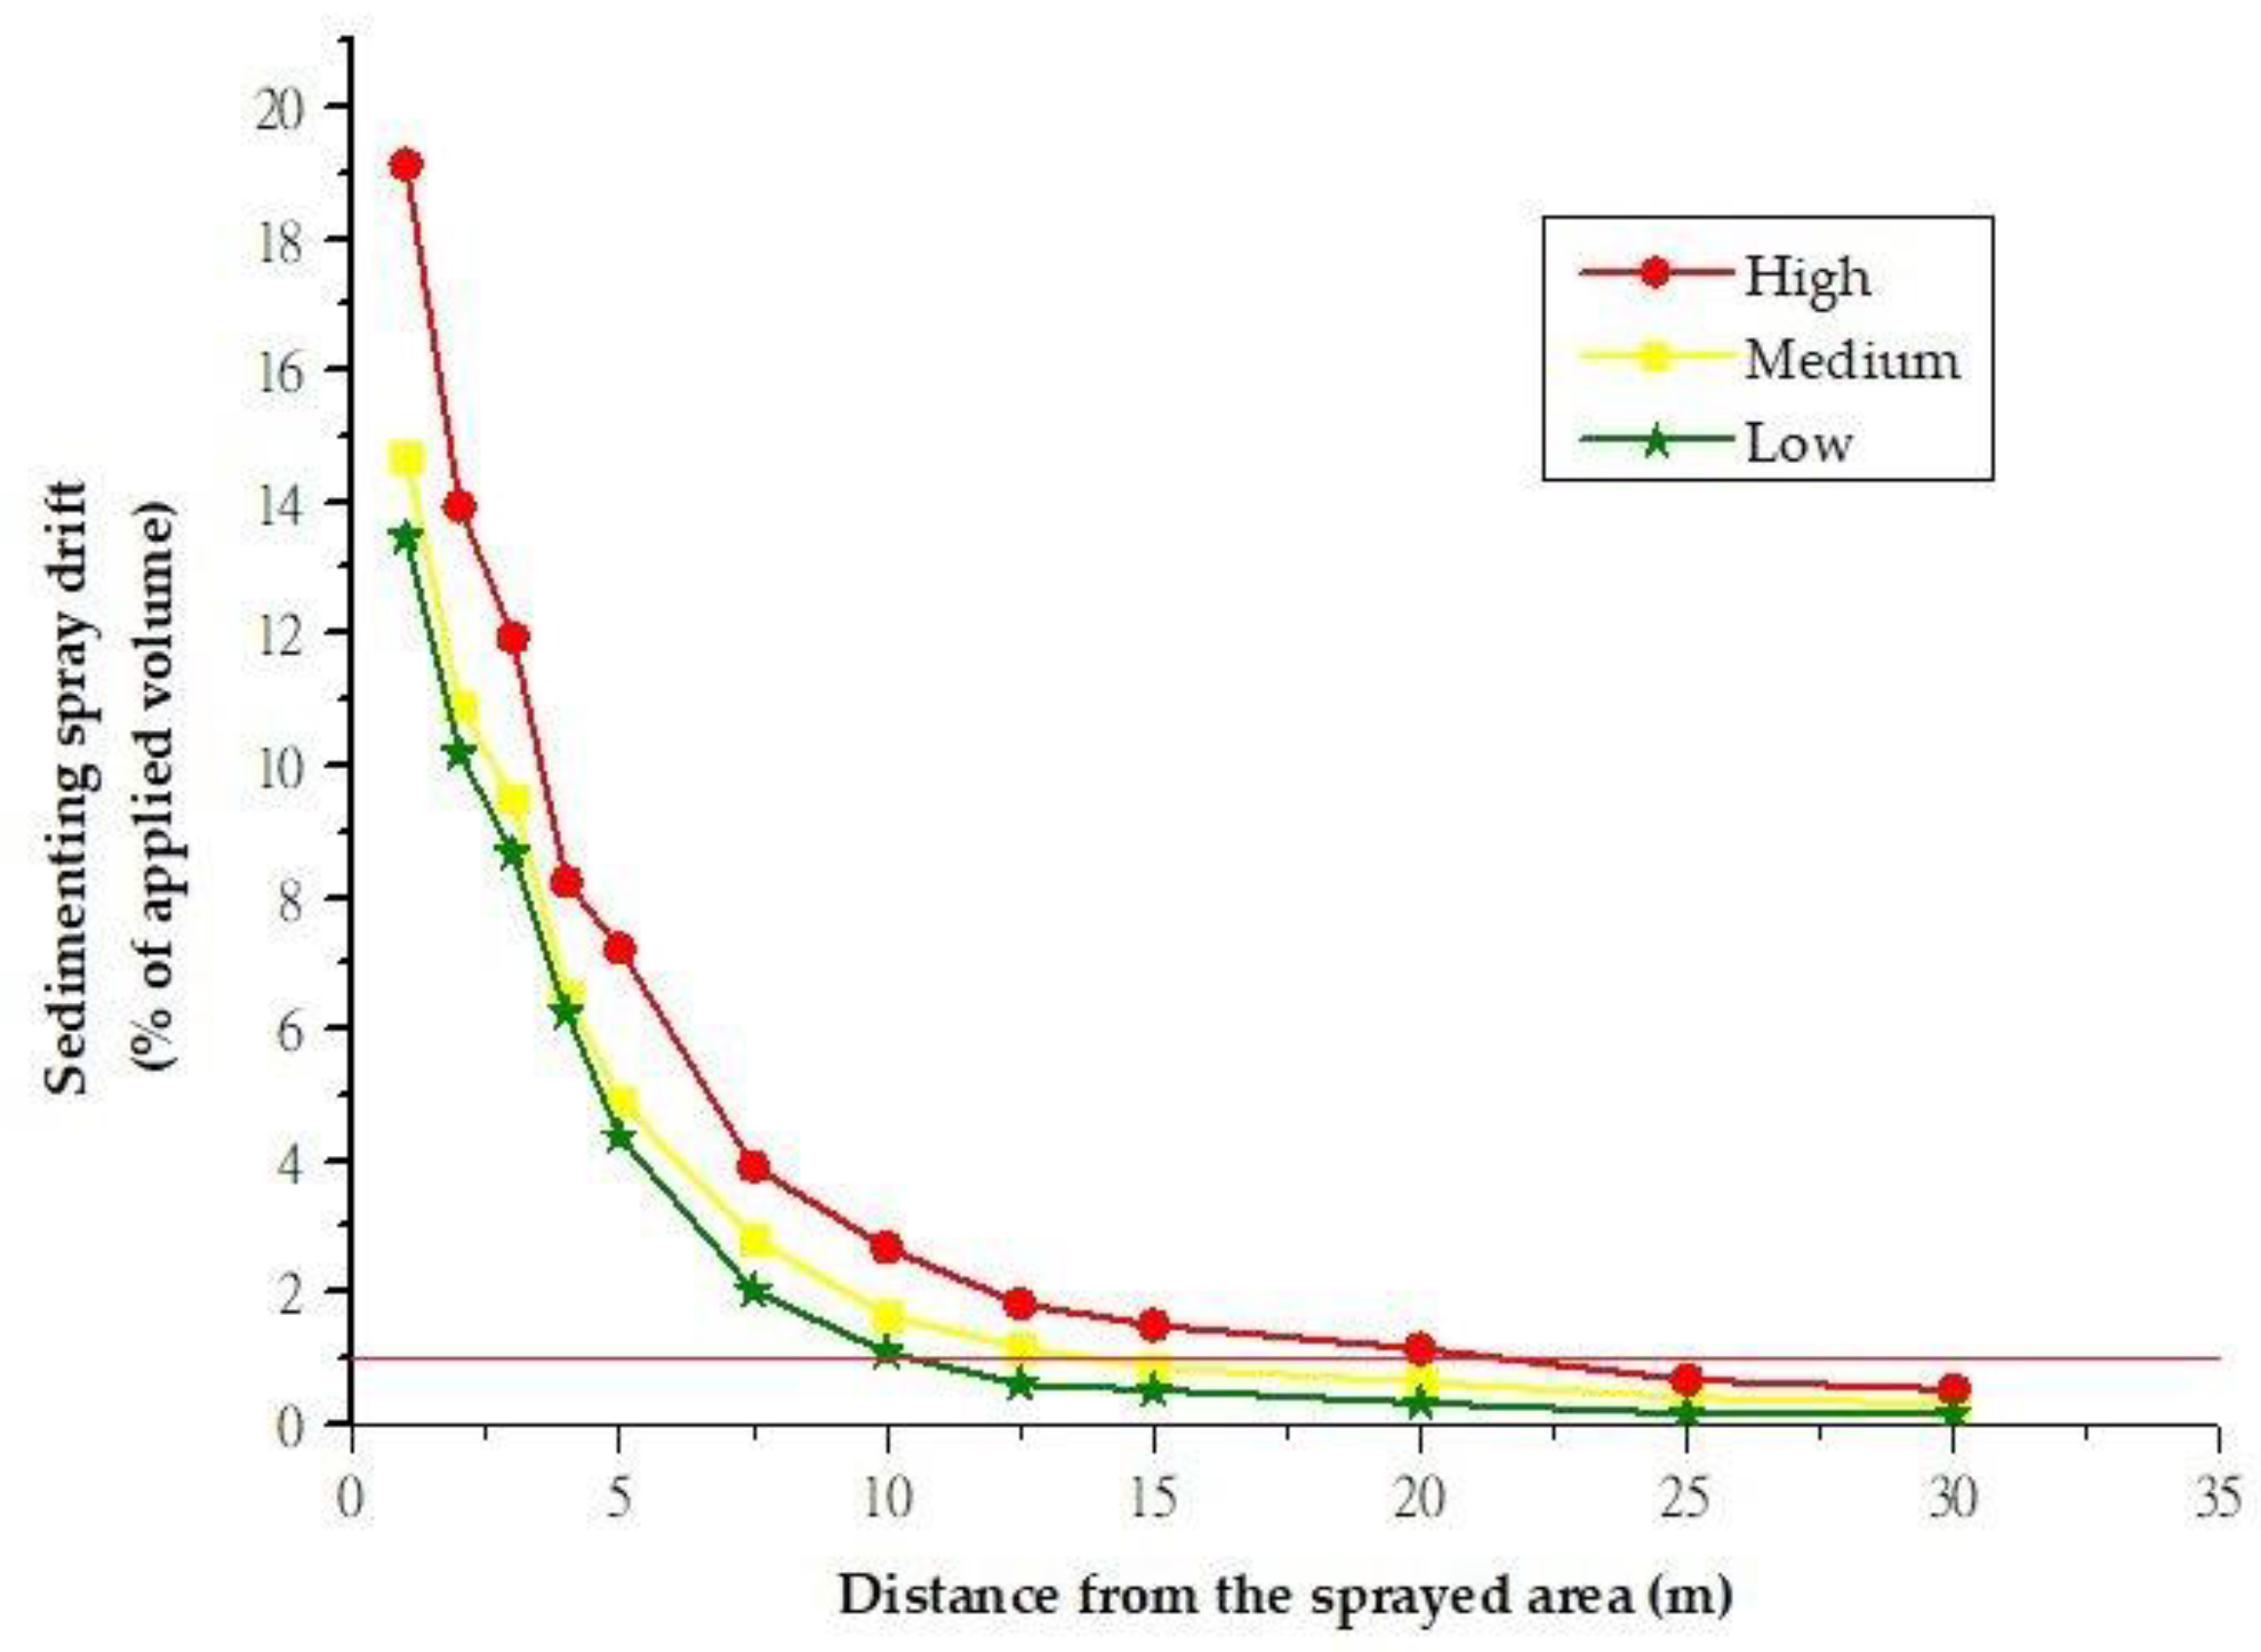
While the drift is precisely defined by ISO 22866:2005 [5], for mitigation estimate a 1% line was calculated, which is the distance from the sprayer where the drift equaled only 1% of the original applied rate. If the reference parameter is the distance of the 1% line from the sprayed area, the mitigation of sedimenting drift from one treatment to another is given in the following equation [58]:
M ( % ) = D i D j D i · 100 ,
where,
  • M = mitigation of sedimenting drift from (i) to (j) treatment (%)
  • Di = distance of the 1% line from the sprayed area at (i) treatment
The 1% line was selected because its distance is detected with good precision in field trials and has been used by other researchers [58]; however, the results can be extended to other parameters (e.g., the 0.5% line).

2.7. Data Analysis

STATGRAPHICS Centurion XVI Version 16.1.15 software for Windows was used for all statistical analyses [59]. In all tests a confidence level of 95% was considered. The effect of each treatment on the sedimenting drift was studied using two-way analysis of variance (ANOVA) considering drift risk indication from the tool and distance from the sprayed area as sources of variation. Airborne drift was evaluated with three-way ANOVA considering drift risk indication, distance, and height above the ground as factors. Spearman’s correlation was used to identify the correlations between the above parameters [60]. Fisher’s least significant difference (LSD) procedure was applied for pair-by-pair comparison among the means of the three treatments for all distances and heights [61]. Previously, the homogeneity of variance of the studied variables was verified by the Levene’s test [62].

3. Results and Discussion

3.1. Weather Conditions

Trials were carried out during July, August, and October 2018 in order to achieve alignment with the weather conditions that respond to the three different categories of drift risk assessment tool. The weather forecasts used in the tool are shown in Table 1.
The weather conditions during trials were monitored (Table 2) to evaluate the tool and weather forecasts and to ensure following limitations set in ISO22866:2005 standard [5]. Table 1 and Table 2 indicate the validity of the prediction tool, as the measurements from the weather station have very small differences compared to the forecasts used by the tool. This outcome is considered sufficient given that the drift risk assessment tool used data from an open data source which uses a weather station that is not located in the experimental site, in contrast to the local weather station.
During trials the mean temperature fell within ISO 22866 [5] requirements. The maximum differences (Δ) in air temperature and relative humidity measured for the two heights (2 and 3 m from ground) were 0.38 °C and 0.46%, respectively. The mean wind speed was from 1.71 to 4.79 m s−1, and the mean wind direction from 12.86° to 60.56° (ideal direction was 30° ± 30°). Wind direction deviation for treatment L1 was 7.30% over the limit prescribed in [5], meaning 24 records out of the 337 recorded during the trial. Considering the deviation slight, all data were used in the statistical analysis.
Temperature and relative humidity may vary much during the year, but they are stable during short periods of time (time of trial). This does not apply to wind speed and wind direction, which can drastically change during each trial, resulting in high influence on spray drift measurements [63]. For that reason, wind speed and wind direction correlation were analyzed indicating that high speed results in lower wind direction variance (Figure 4), in agreement with the result of previous research [64]. Studying the relationship between minimum wind speed, mean wind speed, and range of wind directions during trials, it appears that for minimum wind speeds less than 1 m s−1 and mean wind speeds less than 3 m s−1, the range of wind directions was greater than 110°. Simultaneously, when the minimum wind speed was greater than 1.5 m s−1, and the mean wind speed greater than 3.5 m s−1, the wind direction was more uniform and range of the wind direction was less than about 90° (Table 2).

3.2. Sedimenting (Fallout) Spray Drift

The spray drift deposits on ground collectors measured at different distances downwind of the sprayed area for all treatments are presented in Table 3, and the mean data curves are shown in Figure 5.
The results indicate a significant amount of ground sediment at all sampled distances. In all treatments the greatest deposition was measured in the first few meters of the downwind area. Additionally, all curves showed continued decreased deposition as distance increased from 1 to 30 m, but the rate of decrease varied among the three treatments, keeping, though, a common trend for all treatments. Similar results in both vineyard and orchard experiments have also been found by other researchers [65,66,67,68].
It is also apparent that the three treatments (three categories of drift risk) generated different amounts of sedimenting drift over distance. As expected, the greatest amounts of ground sediment were observed when spraying was performed under worst-case conditions of high wind speed, high temperature, and low relative humidity (“High” treatment), while the lowest amounts were found under favorable weather conditions of low wind speed, low temperature, and high relative humidity (“Low” treatment). This finding comes in accordance with previous studies [69,70].
More precisely, spray drift deposit corresponding to about 1% of the spray volume was achieved at 10, 13.5, and 20 m from the sprayed area during “Low”, “Medium”, and “High” treatments, respectively (Figure 5).
Therefore, the mitigation of sedimenting drift, according to Equation (3), was 32.5% between “High” and “Medium” treatments, 50% between “High” and “Low” treatments, and 25.93% for “Medium” and “Low” treatments.
For the ground collectors the two-way ANOVA test showed that there is a statistically highly significant effect of the collector’s placement distance, downwind of the sprayed area, and drift risk indication of the tool on the spray drift deposits (p < 0.001). However, there is no interaction between distance and drift risk indication (p > 0.05) (Table 4).
Spearman’s rank correlation test indicated (Table 5) that there is very strong negative correlation between distance and drift (rs = −0.9392), meaning that drift decreased drastically with increasing distance (p < 0.001), while drift risk category and drift have weak positive correlation (rs = 0.2047), meaning that drift slightly increased when drift risk category changed following “Low”–“Medium”–“High” sequence (p < 0.01). These results are aligned with previous research trials, in which spray drift amounts are directly influenced by distance of the sprayed area and weather parameters, especially with the wind speed [48,64,71,72].
Fisher’s least significant difference (LSD) procedure was applied for pair-by-pair comparison among the means of the three treatments for all distances, showing statistically significant differences between “High”–“Medium” and “High”–“Low” treatments at downwind distances from 5 to 30 m, while no statistically significant differences were observed between “Medium”–“Low” treatments (p < 0.05) (Table 6). This finding enhances the fact, that the wind speed, which is less than 3 m s−1 in “Low” and “Medium” treatments, while in the “High” treatment is greater than 3.5 m s−1, has the most significant effect on the spray drift from other meteorological parameters [30,73]. Additionally, the effect of meteorological parameters on ground drift is shown in Figure 6, where the means of sedimenting drift indicate that “High” treatment gave the highest ground drift deposition and the other treatments decreased from “Medium” to “Low”.

3.3. Airborne Spray Drift

The spray drift deposits on vertical samplers measured at six different heights for three different distances, downwind of the sprayed area, are presented in Table 7, and the mean data curves are shown in Figure 7.
The results indicate that, in all treatments, the greatest deposition was measured at 5 m distance from the sprayed area, followed by 10 and 15 m distances. The three treatments (three categories of drift risk) generated different amounts of airborne drift over distance, having the greatest amount for “High” treatment and the lowest for “Low” treatment. The meteorological parameters had more influence on airborne spray drift than ground spray drift, since at 5, 10, and 15 m distances the amounts of airborne drift were greatest than the corresponding ground sediment.
Furthermore, in all treatments, spray drift deposition decreased with increasing height above ground, especially at 5 m distance from the sprayed area. This shape of the airborne drift profile is similar to the profile described by other researches in orchards [67,74], while there are also studies in vineyards showing that the airborne spray drift deposition increased with increasing height [64]. This discrepancy is justified by the fact that spray drift amount depends heavily on the architecture and geometry of the canopy [75,76]. The experimental vineyard had particularly poor canopy and small height, resulting in larger drift depositions in lower heights.
For the vertical samplers the three-way ANOVA test showed that there is a statistically significant effect of the collector’s placement distance, downwind of the sprayed area, height from the ground, and drift risk indication of the tool on the spray drift deposits at level p < 0.001. Moreover, it was found that there are statistically highly significant interactions between distance and height (p < 0.001), height and drift risk indication (p < 0.001), and distance and drift risk indication (p < 0.05) (Table 8).
Spearman’s rank correlation test indicated that there is weak negative correlation between distance and drift (rs = −0.3599), moderate negative correlation between height and drift (rs = −0.4130), while drift risk category and drift have a strong positive correlation (rs = 0.6993), meaning that drift strongly increased when wind speed and air temperature increased and relative humidity decreased, and the drift risk category followed the “Low”–“Medium”–“High” succession (p < 0.001) (Table 9). These results are largely consistent with other field studies. Fox et al. [77], in experiments on apple trees, found that deposits on floss decreased with height at 7.5 m distance downwind, but were more uniform across all heights at 15, 30, and 60 m downwind. Kasner et al. [78] reported that the distance from sprayed area, the height above ground, and the wind speed were significantly associated with drift level. Grella et al. [64] found a good significant relationship between airborne drift and wind speed variables, especially for the maximum and mean wind speed.
Fisher’s least significant difference (LSD) procedure was applied for pair-by-pair comparison among the means of the three treatments for the distances of 5, 10, and 15 m from the sprayed area and for all heights above the ground (p < 0.05). The results showed statistically significant differences between all treatment pairs, except for “Medium”–“High” pair at the heights of 5 and 6 m, at 5 m distance, and 6 m high at 15 m distance (Table 10). Furthermore, in Figure 8 the means of airborne drift for all treatments at distances 5, 10, and 15 m are presented. The highest airborne drift was registered in the distance closest to the sprayed area, and in each distance airborne drift was reduced following the “High”–“Medium”–“Low” order.

4. Conclusions

It is undeniable that there is great need to develop measures for spray drift reduction. Weather conditions during spraying application have considerable impact on sediment and airborne spray drift. Therefore, this work has developed a drift risk assessment tool based on the methodology derived from the TOPPS-Prowadis drift evaluation tool, which uses weather forecast data to predict spray drift extend. This tool is adapted to the Greek meteorological conditions and has three classification categories (low, medium, high) based on air temperature, relative humidity, and wind speed.
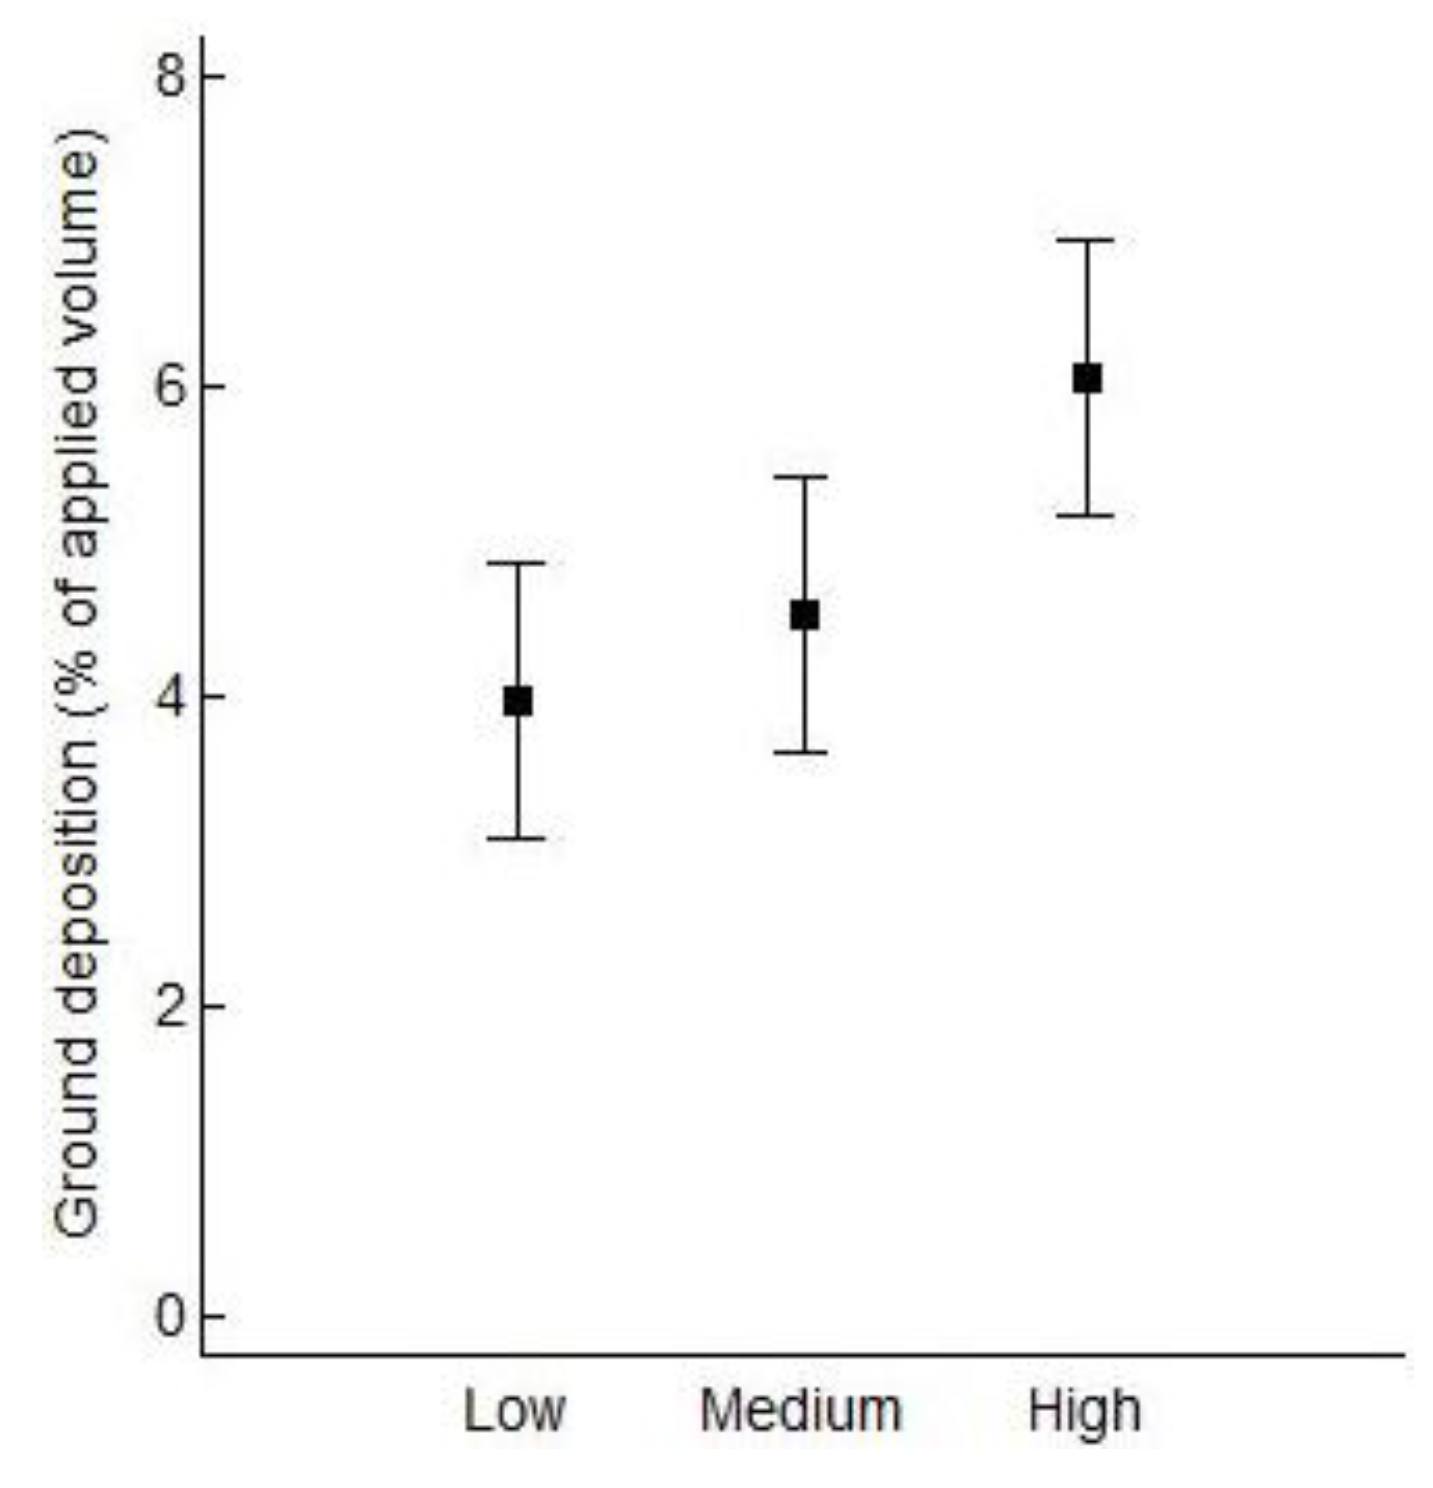
This tool and its limits between categories were evaluated successfully in real conditions, by conducting spray drift measurements in the vineyard of the Agricultural University of Athens, according to the ISO 22866:2005 methodology. Results showed that there are significant differences in airborne as well as in sediment drift among the treatments that correspond to the three drift risk classifications. The highest amount of spray drift deposits was observed within “High risk” treatments, which relate to unfavorable weather conditions; and the lowest within “Low risk” treatments, which are related to ideal weather conditions for spraying application.
The experimental results make evident that fine-tuning of the limits provides an optimized tool for Greek conditions that allows farmers to spray their vineyards with limited spray drift, resulting in higher spraying efficacy and minimized environmental impact. This tool shows that the limits classifying spray drift risk can be adjusted based on local experience for optimized results in spraying, but at the same time strengthens the importance of the TOPPS-Prowadis tool as a basis for such local optimization. Such a tool could be converted to software to assist farmers to predict and plan future spraying activities avoiding PPP application in “High” spray drift risk days.
This research produced the first set of data on spray drift amounts in vineyards when working with a conventional air-assisted sprayer and proved the efficiency of the tool. However, since the assessment of the effect of uncontrolled environmental conditions is objectively very difficult, the developed drift assessment tool will have to be tested in a wider range of environmental conditions and under different spraying techniques and crop characteristics.

Author Contributions

G.B., A.B. and S.F. conceived and designed the experiments; G.B., M.K. and V.P. performed the experiments; G.B., M.K. and V.P. analyzed the samples in the laboratory; G.B. and M.K. analyzed the data; G.B. wrote the paper; and M.K., A.B. and S.F. contributed in the analysis and presentation of data.

Funding

This study did not receive any funds for covering the costs to publish in open access.

Acknowledgments

We would like to thank Nuri Bezolli, Giannis Kalliakmanis, Charalampos Miliotis and Dinos Grivakis for their collaboration in conducting our field experiments.

Conflicts of Interest

The authors declare no conflicts of interest.

References

  1. Oerke, E.C. Crop losses to pests. J. Agric. Sci. 2006, 144, 31–43. [Google Scholar] [CrossRef]
  2. Cooper, J.; Dobson, H. The benefits of pesticides to mankind and the environment. Crop Prot. 2007, 26, 1337–1348. [Google Scholar] [CrossRef]
  3. Giles, D.K.; Akesson, N.B.; Yates, W.E. Pesticide application technology: Research and development and the growth of the industry. Trans. ASABE 2008, 51, 397–403. [Google Scholar] [CrossRef]
  4. Garcera, C.; Roman, C.; Molto, E.; Abad, R.; Insa, J.A.; Torrent, X.; Planas, S.; Chueca, P. Comparison between standard and drift-reducing nozzles for pesticide application in citrus: Part II. Effects on canopy spray distribution, control efficacy of Aonidiella aurantii (Maskell), beneficial parasitoids and pesticide residues on fruit. Crop Prot. 2017, 94, 83–96. [Google Scholar] [CrossRef]
  5. ISO 22866:2005. Equipment for Crop Protection-Methods for Field Measurement of Spray Drift; International Organization for Standardization: Geneva, Switzerland, 2005; pp. 1–17. [Google Scholar]
  6. Nuyttens, D.; De Schampheleire, M.; Baetens, K.; Sonck, B. The influence of operator- controlled variables on spray drift from field crop sprayers. Trans. ASABE 2007, 50, 1129–1140. [Google Scholar] [CrossRef]
  7. Butler Ellis, M.C.; Lane, A.G.; O’Sullivan, C.M.; Miller, P.C.H.; Glass, C.R. Bystander exposure to pesticide spray drift: new data for model development and validation. Biosyst. Eng. 2010, 107, 162–168. [Google Scholar] [CrossRef]
  8. Felsot, A.S.; Unsworth, J.B.; Linders, J.B.H.J.; Roberts, G. Agrochemical spray drift; assessment and mitigation-a review. J. Environ. Sci. Health Part B 2011, 46, 1–23. [Google Scholar] [CrossRef]
  9. Hilz, E.; Vermeer, A.W.P. Spray drift review: the extent to which a formulation can contribute to spray drift reduction. Crop Prot. 2013, 44, 75–83. [Google Scholar] [CrossRef]
  10. Benbrook, C.M.; Baker, B.P. Perspective on dietary risk assessment of pesticide residues in organic food. Sustainability 2014, 6, 3552–3570. [Google Scholar] [CrossRef]
  11. Kruger, R.G.; Klein, N.R.; Ogg, L.C. Spray Drift of Pesticides; University of Nebraska-Lincoln Extension: Nebraska, NE, USA, 2013; p. G1773. [Google Scholar]
  12. Balsari, P.; Grella, M.; Marucco, P.; Matta, F.; Miranda-Fuentes, A. Assessing the influence of air speed and liquid flow rate on the droplet size and homogeneity in pneumatic spraying. Pest Manag. Sci. 2019, 75, 366–379. [Google Scholar] [CrossRef]
  13. Ozkan, H.E. New Nozzles for Spray Drift Reduction; AEX-523-98; Ohio State University Extension Fact Sheet Food Agricultural and Biological Engineering: Columbus, OH, USA, 1998. [Google Scholar]
  14. Hofman, V.; Solseng, E. Reducing Spray Drift; North Dakota State University NDSU Extension Service AE−1210: Fargo, ND, USA, 2001. [Google Scholar]
  15. Farooq, M.; Salyani, M. Modeling of spray penetration and deposition on citrus tree canopies. Trans. ASABE 2004, 47, 619–627. [Google Scholar] [CrossRef]
  16. Da Silva, A.; Sinfort, C.; Tinet, C.; Pierrot, D.; Huberson, S. A lagrangian model for spray behaviour within vine canopies. Aerosol Sci. 2006, 37, 658–674. [Google Scholar] [CrossRef]
  17. Yi, C. Momentum transfer within canopies. J. Appl. Meteorol. Climatol. 2008, 47, 262–275. [Google Scholar] [CrossRef]
  18. Take, M.E.; Barry, J.W.; Richardson, B. An FSCBG Sensitivity Study for Decision Support Systems; ASAE Annual Meeting: Phoenix, AZ, USA, 1996; p. 961037. [Google Scholar]
  19. Arvidsson, T.; Bergström, L.; Kreuger, J. Spray drift as influenced by meteorological and technical factors. Pest. Manag. Sci. 2011, 67, 586–598. [Google Scholar] [CrossRef] [PubMed]
  20. Nuyttens, D.; Schampheleire, M.D.; Verboven, P.; Sonck, B. Comparison between indirect and direct spray drift assessment methods. Biosyst. Eng. 2010, 105, 2–12. [Google Scholar] [CrossRef]
  21. Nuyttens, D.; de Schampheleire, M.; Baetens, K.; Brusselman, E.; Dekeyser, D.; Verboven, P. Drift from field crop sprayers using an integrated approach: results of a five-year study. Trans. ASABE 2011, 54, 403–408. [Google Scholar] [CrossRef]
  22. Miranda-Fuentes, A.; Marucco, P.; Gonzalez-Sanchez, E.J.; Gil, E.; Grella, M.; Balsari, P. Developing strategies to reduce spray drift in pneumatic spraying vineyards: Assessment of the parameters affecting droplet size in pneumatic spraying. Sci. Total Environ. 2018, 616–617, 805–815. [Google Scholar] [CrossRef]
  23. Miller, P.C.H.; Butler Ellis, M.C. Effects of formulation on spray nozzle performance for applications from ground-based boom sprayers. Crop Prot. 2000, 19, 609–615. [Google Scholar] [CrossRef]
  24. Stainier, C.; Destain, M.F.; Schiffers, B.; Lebeau, F. Effect of the entrained air and initial droplet velocity on the release height parameter of a Gaussian spray drift model. Commun. Agric. Appl. Biolog. Sci. 2006, 71, 197–200. [Google Scholar]
  25. De Ruiter, H.; Holterman, H.J.; Kempenaar, C.; Mol, H.G.J.; de Vlieger, J.J.; van de Zande, J. Influence of Adjuvants and Formulations on the Emission of Pesticides to the Atmosphere. In A Literature Study for the Dutch Research Programme Pesticides and the Environment (DWK) Theme C-2; Plant Research International B.V.: Wageningen, The Netherlands, 2003; Report 59. [Google Scholar]
  26. Hobson, P.A.; Miller, P.C.H.; Walklate, P.J.; Tuck, C.R.; Western, N.M. Spray drift from hydraulic spray nozzles: the use of a computer simulation model to examine factors influencing drift. J. Agric. Eng. Res. 1993, 54, 293–305. [Google Scholar] [CrossRef]
  27. Miller, P.C.H. The measurement of spray drift. Pestic. Outlook 2003, 14, 205–209. [Google Scholar] [CrossRef]
  28. van de Zande, J.C.; Stallinga, H.; Michielsen, J.M.G.P.; van Velde, P. Effect of sprayer speed on spray drift. Annu. Rev. Agric. Eng. 2005, 4, 129–142. [Google Scholar]
  29. Grella, M.; Marucco, P.; Manzone, M.; Gallart, M.; Balsari, P. Effect of sprayer settings on spray drift during pesticide application in poplar plantations (Populus spp.). Sci. Total Environ. 2017, 578, 427–439. [Google Scholar] [CrossRef] [PubMed] [Green Version]
  30. Arvidsson, T. Spray Drift as Influenced by Meteorological and Technical Factors. A Methodological Study; Swedish University of Agricultural Sciences, Acta Universitatis Agriculturae Sueciae: Agraria Sweden, 1997; Volume 71, p. 144. [Google Scholar]
  31. Nuyttens, D.; Sonck, B.; De Schampheleire, M.; Steurbaut, W.; Baetens, K.; Verboven, P.; Nicolai, B.; Ramon, H. Spray drift as affected by meteorological conditions. Commun. Agric. Appl. Biol. Sci. 2005, 70, 947–959. [Google Scholar] [PubMed]
  32. Sumner, P.E. Reducing Spray Drift. In Cooperative Extension Service; The University of Georgia College of Agricultural and Environmental Sciences: Athens, GA, USA, 1997. [Google Scholar]
  33. da Cunha, J.P.A.R.; Pereira, J.N.P.; Barbosa, L.A.; da Silva, C.R. Pesticide Application Windows in the Region of Uberlândia-MG, Brazil. Biosci. J. Uberlândia 2016, 32, 403–411. [Google Scholar]
  34. Maciel, C.F.S.; Teixeira, M.M.; Fernandes, H.C.; Zolnier, S.; Cecon, P.R. Droplet Spectrum of a Spray Nozzle under Different Weather Conditions. Revista Ciência Agronômica 2018, 49, 430–436. [Google Scholar] [CrossRef]
  35. Al-Jumaili, A.; Salyani, M. Wind Effect on the Deposition of an Air-Assisted Sprayer; University of Florida: Gainesville, FL, USA, 2014. [Google Scholar]
  36. Thistle, H. Meteorological concepts in the drift of pesticide. In Proceedings of the International Conference on Pesticide Application for Drift Management, Washington State University, Waikoloa, HI, USA, 27–29 October 2004; pp. 156–162. [Google Scholar]
  37. Holterman, H.J. Kinetics and Evaporation of Water Drops in Air; IMAG Report 2003-2012; Institute of Agricultural and Environmental Engendering: Wageningen, The Netherlands, 2003. [Google Scholar]
  38. Carlsen, S.C.K.; Spliid, N.H.; Svensmark, B. Drift of 10 herbicides after tractor spray application. Primary drift (droplet drift). Chemosphere 2006, 64, 778–786. [Google Scholar] [CrossRef]
  39. Fishel, F.M. When a Pesticide Doesn’t Work; Agronomy Department: Florida, FL, USA, 2008. [Google Scholar]
  40. FOCUS, 2004. Focus Surface Water Scenarios in the EU evaluation process under 91/414/EEC; Report prepared by the FOCUS working group on Surface Water Scenarios; European Commission: Brussels, Belgium, March 2004; p. 238. [Google Scholar]
  41. FOCUS, 2007a. Landscape and mitigation factors. In Aquatic Risk Assessment. Extended Summary and Recommendations, vol. 1, Report of the FOCUS Working Group on Landscape and Mitigation Factors in Ecological Risk Assessment; EC Document Reference SANCO/10422/2005 V.2.0; European Commission: Brussels, Belgium, 2007; p. 169. [Google Scholar]
  42. FOCUS, 2007b. Landscape and mitigation factors. In Aquatic Risk Assessment. Detailed Technical Reviews, vol. 2, Report of the FOCUS Working Group on Landscape and Mitigation Factors in Ecological Risk Assessment; EC Document Reference: SANCO/10422/2005 V.2.0; European Commission: Brussels, Belgium, September 2007; p. 436. [Google Scholar]
  43. Directive 2009/128/EC of the European parliament and the council of 21 October 2009 establishing a framework for community action to achieve the sustainable use of pesticides. Off. J. Eur. Union 2009, 309, 71–86.
  44. Directive 2009/127/EC of the European parliament and of the council of 21 October 2009 amending Directive 2006/42/EC with regard to machinery for pesticide application. Off. J. Eur. Union L 2009, 310, 29–33.
  45. EPA-United States Environmental Protection Agency. 2015; Reducing Pesticide Drift. Available online: http://www.epa.gov/reducing-pesticide-drift (accessed on 22 December 2015).
  46. Huang, Y.; Thomson, S.J. Atmospheric Stability Determination Using Fine Time-Step Intervals for Timing of Aerial Application. In Proceedings of the ASABE, 2016 Annual International Meeting 162461162, Orlando, FL, USA, 17–20 July 2016. [Google Scholar] [CrossRef]
  47. Nansen, C.; Ferguson, J.C.; Moore, J.; Groves, L.; Emery, R.; Garel, N.; Hewitt, A. Optimizing Pesticide Spray Coverage Using a Novel Web and smartphone Tool, SnapCard. Agron. Sustain. Dev. 2015, 35, 1075–1085, INRA and Springer Verlag France, 2015. [Google Scholar] [CrossRef]
  48. Baetens, K.; Nuyttens, D.; Verbovena, P.; De Schampheleire, M.; Nicolai, B.; Ramona, H. Predicting drift from field spraying by means of a 3D computational fluid dynamics model. Comput. Electron. Agric. 2007, 56, 161–173. [Google Scholar] [CrossRef]
  49. Kruckeberg, J.; Hanna, M.; Darr, M.; Steward, B. An interactive spray drift simulator. In Proceedings of the American Society of Agricultural and Biological Engineers Annual International Meeting, ASABE, Dallas, TX, USA, 13–16 September 2010; Volume 3, pp. 2297–2311. [Google Scholar]
  50. Maber, J.; Dewar, P.; Praat, J.P.; Hewitt, A.J. Real Time Spray Drift Prediction. Acta Hortic. 2001, 566, 493–498. [Google Scholar] [CrossRef]
  51. Hong, S.W.; Zhaoa, L.; Zhuc, H. SAAS, a computer program for estimating pesticide spray efficiency and drift of air-assisted pesticide applications. Comput. Electron. Agric. 2018, 155, 58–68. [Google Scholar] [CrossRef]
  52. Nsibande, S.A.; Dabrowski, J.M.; van der Walt, E.; Venter, A.; Forbes, P.B.C. Validation of the AGDISP model for predicting airborne atrazine spray drift: A South African ground application case study. Chemosphere 2015, 138, 454–461. [Google Scholar] [CrossRef] [PubMed] [Green Version]
  53. TOPPS-Prowadis Project. Best Management Practices to Reduce Spray Drift. 2014. Available online: http://www.topps-life.org/ (accessed on 24 June 2019).
  54. Stavrakas, E.D. Ampelographia; Ziti Publications: Thessaloniki, Greece, 2010. [Google Scholar]
  55. Meier, U. Growth Stages of Mono-and Dicotyledonous Plants: BBCH Monograph, 2nd ed.; Uwe Meier Federal Biological Research Centre for Agriculture and Forestry: Braunschweigh, Germany, 2001; pp. 1–158. [Google Scholar]
  56. Pergher, G. Recovery rate of tracer dyes used for spray deposit assessment. Trans. ASABE 2001, 44, 787–794. [Google Scholar] [CrossRef]
  57. Gil, E.; Balsari, P.; Gallart, M.; Llorens, J.; Marucco, P.; Andersen, P.G.; Fàbregas, X.; Llop, J. Determination of drift potential of different flat fan nozzles on a boom sprayer using a test bench. Crop Prot. 2014, 56, 58–68. [Google Scholar] [CrossRef]
  58. Otto, S.; Loddo, D.; Baldoin, C.; Zanin, G. Spray drift reduction techniques for vineyards in fragmented landscapes. J. Environ. Manag. 2015, 162, 290–298. [Google Scholar] [CrossRef] [PubMed]
  59. StatPoint Technologies Inc. STATGRAPHICS Centurion XVI Version 16.1.15; StatPoint Technologies Inc.: Warrenton, VA, USA, 1982–2011. [Google Scholar]
  60. Spearman, C. The Proof and Measurement of Association between Two Things. Am. J. Psychol. 1904, 15, 72–101. [Google Scholar] [CrossRef]
  61. Fisher, R.A. The Design of Experiments; Oliver and Boyd: Edinburg, TX, USA; London, UK, 1935. [Google Scholar]
  62. Levene, H. Robust tests for equality of variances. In Contributions to Probability and Statistics: Essays in Honor of Harold Hotelling; Olkin, I., Ghyrye, S.G., Hoeffding, W., Madow, W.G., Mann, H.B., Eds.; Stanford University Press: Palo Alto, CA, USA, 1960; pp. 278–292. [Google Scholar]
  63. Bode, L.E.; Butler, B.J.; Goering, C.E. Spray drift and recovery as affected by spray thickener, nozzle type, and nozzle pressure. Trans. ASAE 1976, 19, 213–218. [Google Scholar] [CrossRef]
  64. Grella, M.; Gallart, M.; Marucco, P.; Balsari, P.; Gil, E. Ground Deposition and Airborne Spray Drift Assessment in Vineyard and Orchard: The Influence of Environmental Variables and Sprayer Settings. Sustainability 2017, 9, 728. [Google Scholar] [CrossRef]
  65. Balsari, P.; Marucco, P.; Grella, M.; Savoia, S. Spray drift measurements in Italian vineyards and orchards. In Proceedings of the 13th Workshop on Spray Application in Fruit Growing (SuproFruit 2015), Lindau/Lake Costance, Germany, 15–18 July 2015; pp. 30–31. [Google Scholar]
  66. Balsari, P.; Marucco, P. Sprayer Adjustment and Vine Canopy Parameters Affecting Spray Drift: The Italian Experience; DEIAFA-University of Turin: Torino, Italy, 2004. [Google Scholar]
  67. Torrent, X.; Garcera, C.; Molto, E.; Chueca, P.; Abad, R.; Grafulla, C.; Roman, C.; Planas, S. Comparison between standard and drift-reducing nozzles for pesticide application in citrus: Part, I. Effects on wind tunnel and field spray drift. Crop Prot. 2017, 96, 130–143. [Google Scholar] [CrossRef]
  68. Grella, M.; Marucco, P.; Balsari, P. Toward a new method to classify the airblast sprayers according to their potential drift reduction: comparison of direct and new indirect measurement methods. Pest Manag. Sci. 2019, 75, 2219–2235. [Google Scholar] [CrossRef] [PubMed]
  69. Threadgill, E.D.; Smith, D.B. Effects of physical and meteorological parameters on the drift of controlled-size droplets. Trans. ASAE 1975, 18, 51–56. [Google Scholar]
  70. De Schampheleire, M.; Baetens, K.; Nuyttens, D.; Spanoghe, P. Spray drift measurements to evaluate the Belgian drift mitigation measures in field crops. Crop Prot. 2008, 27, 577–589. [Google Scholar] [CrossRef]
  71. Nuyttens, D.; Zwertvaegher, I.; Dekeyser, D. Comparison between drift test bench results and other drift assessment techniques. Asp. Appl. Biol. Int. Adv. Pestic. Appl. 2014, 122, 293–302. [Google Scholar]
  72. Combellack, J.H.; Westen, N.M.; Richardson, R.G. A comparison of the drift potential of a novel twin fluid nozzle with conventional low volume flat fan nozzles when using a range of adjuvants. Crop Prot. 1996, 15, 147–152. [Google Scholar] [CrossRef]
  73. Huang, Y.; Zhan, W.; Fritz, B.; Thomson, S.; Fang, A. Analysis of impact of various factors on downwind deposition using a simulation method. J. ASTM Int. 2010, 7, 1–11. [Google Scholar] [CrossRef]
  74. van de Zande, J.C.; Butler Ellis, M.C.; Wenneker, M.; Walklate, P.J.; Kennedy, M. Spray drift and bystander risk from fruit crop spraying. Asp. Appl. Biol. 2014, 122, 177–185. [Google Scholar]
  75. Bird, S.L.; Esterly, D.M.; Perry, S.G. Atmospheric pollutants and trace gases. Off-target deposition of pesticides from agricultural aerial spray applications. J. Environ. Qual. 1996, 25, 1095–1104. [Google Scholar] [CrossRef]
  76. Duga, A.T.; Ruysen, K.; Dekeyser, D.; Nuyttens, D.; Bylemans, D.; Nicolai, B.M.; Verboven, P. Spray deposition profiles in pome fruit trees: Effects of sprayer design, training system and tree canopy characteristics. Crop Prot. 2015, 67, 200–213. [Google Scholar] [CrossRef]
  77. Fox, R.; Hall, F.; Reichard, D.; Brazee, R.D.; Krueger, H.R. Pesticide tracers for measuring orchard spray drift. Appl. Eng. Agric. 1993, 9, 501–505. [Google Scholar] [CrossRef]
  78. Kasner, E.J.; Fenske, R.A.; Hoheisel, G.A.; Galvin, K.; Blanco, M.N.; Seto, E.Y.W.; Yost, M.G. Spray Drift from a Conventional Axial Fan Airblast Sprayer in a Modern Orchard Work Environment. Ann. Work Expos. Health 2018, 62, 1134–1146. [Google Scholar] [CrossRef] [PubMed]
Figure 1. Test site layout according to the ISO 22866:2005 standard.
Agriculture 09 00181 g001
Figure 2. (a) The vineyard and sampling area; (b) detail showing the ground collector; (c) detail showing the pole holding the polythene lines.
Agriculture 09 00181 g002
Figure 3. (a) Nozzles flow rate measurement; (b) fan air flow rate measurement.
Agriculture 09 00181 g003
Figure 4. Boxplots of all wind speed and wind direction measurements; (a) wind speed; (b) wind direction.
Agriculture 09 00181 g004
Figure 5. Spray drift deposit on the ground collectors.
Agriculture 09 00181 g005
Figure 6. Sedimenting spray drift mean ± SE of the mean.
Agriculture 09 00181 g006
Figure 7. Airborne spray drift deposition profile at three distances from the sprayed area.
Agriculture 09 00181 g007
Figure 8. Airborne spray drift mean ± SE of the mean.
Agriculture 09 00181 g008
Table 1. Meteorological data used by the tool.
DateTreatmentsReplicatesTemperatureRelative HumidityWind SpeedWind DirectionRainfall
°C%m s−1
07.10.2018“Low”L121.5069.002.60North-EastNo
20.10.2018L223.1062.001.65North-EastNo
21.07.2018“Medium”M133.0046.102.00North-EastNo
29.07.2018M229.2056.002.50North-EastNo
02.08.2018“High”H131.0055.004.00North/North-EastNo
02.08.2018H231.0055.004.00North/North-EastNo
Table 2. Meteorological data collected during trials.
TreatmentsReplicatesTemperatureRelative HumidityWind SpeedWind Direction
MeanΔMeanΔMinMaxMeanDeviation aMeanRangeDeviation b
°C°C%%m s−1m s−1m s−1%° az°%
“Low”L120.670.1467.170.240.705.912.841.5060.5612037.30
L222.380.2460.250.430.274.581.719.6159.3013929.95
“Medium”M132.670.3844.760.460.264.402.1210.1947.8028129.21
M228.910.1654.920.400.775.302.770.2431.271100.72
“High”H130.580.1951.470.201.687.213.680.0012.86750.99
H230.400.1255.230.231.929.514.790.0019.69922.87
a Percentage of measurements <1 m s−1 (must be <10%); b percentage of measurements [30° − 45°, 30° + 45°] (must be <30%).
Table 3. Ground deposit of spray drift.
Distance mTreatments
“Low”“Medium”“High”
L1L2M1M2H1H2
% Application Rate% Application Rate% Application Rate% Application Rate% Application Rate% Application Rate
113.0713.8814.4414.9514.3123.93
29.8610.5010.0411.7912.8515.02
37.709.639.799.2110.8213.06
45.337.166.076.977.878.61
53.595.133.356.477.476.97
7.51.802.252.423.214.193.64
101.051.121.172.132.622.73
12.50.540.670.771.541.632.02
150.520.520.411.301.361.65
200.290.360.300.970.891.39
250.160.150.190.620.460.89
300.140.140.170.440.360.69
Table 4. Results of ANOVA for sedimenting spray drift as affected by distance and drift risk indication (Df: degrees of freedom).
SourceDfSum SqMean SqF-Ratiop-Value
Distance115338.32485.302107.470.00001
Drift Risk2167.04183.520618.500.00001
Distance × Drift Risk2292.42564.201160.930.5555
Residual180812.824.51566
Table 5. Results of Spearman rank correlation test.
DistanceDrift Risk
Drift (%)Correlation−0.93920.2047
Sample size216216
p-Value0.000010.0027
Table 6. Multiple range LSD tests for ground collectors (LSD: least significant difference; Sig: significant).
Distance+/−LimitsLow–MediumMedium–HighLow–High
Sig.DifferenceSig.DifferenceSig.Difference
15.44014 −1.22583 −4.4235*−5.64933
23.95954 −0.736167 −3.02083 −3.757
34.70071 −0.832333 −2.446 −3.27833
42.77943 −0.277167 −1.7155 −1.99267
52.12408 −0.546667*−2.31417*−2.86083
7.51.03509 −0.7955*−1.0965*−1.892
100.718107 −0.5655*−1.02733*−1.59283
12.50.541351*−0.554*−0.670167*−1.22417
150.506432 −0.338667*−0.644167*−0.982833
200.466114 −0.31*−0.507*−0.817
250.264212 −0.247667*−0.2675*−0.515167
300.172946 −0.162667*−0.216833*−0.3795
Table 7. Airborne spray drift deposition.
Distance mHeight mTreatments
“Low”“Medium”“High”
L1L2M1M2H1H2
% Application Rate% Application Rate% Application Rate% Application Rate% Application Rate% Application Rate
515.426.719.9311.6914.5417.93
25.535.399.6310.4114.9815.55
34.734.418.299.1413.4012.10
43.612.727.436.319.839.83
52.812.095.664.216.505.35
62.401.483.833.514.333.75
1013.702.343.398.8110.3110.16
23.252.243.258.569.7810.60
32.771.723.897.1210.788.50
42.201.873.865.277.757.12
52.061.243.073.597.045.39
61.911.763.033.074.853.47
1512.391.422.327.888.358.26
21.822.311.847.217.807.99
31.681.382.355.997.367.22
41.621.632.025.016.606.35
51.821.042.544.085.294.67
61.450.911.783.583.953.41
Table 8. Results of ANOVA for airborne spray drift as affected by distance, height, and drift risk indication.
SourceDfSum SqMean SqF-Ratiop-Value
Distance2436.733218.36691.090.00001
Height5614.543122.90951.270.00001
Drift Risk21194.12597.058249.050.00001
Distance × Height10161.67216.16726.740.00001
Distance × Drift Risk424.73856.184632.580.0393
Height × Drift Risk10158.01415.80146.590.00001
Distance × Height × Drift Risk2023.02761.151380.480.9709
Residual162388.3692.39734
Table 9. Results of Spearman rank correlation test.
DistanceHeightDrift Risk
Drift (%)Correlation−0.3599−0.41300.6993
Sample size216216216
p-Value0.000010.000010.00001
Table 10. Multiple-range LSD tests for vertical samplers.
DistanceHeight+/−LimitsLow-MediumMedium-HighLow-High
Sig.DifferenceSig.DifferenceSig.Difference
514.56578*−4.7505*−5.42075*−10.1713
23.73621*−4.56775*−5.2415*−9.80925
32.71095*-4.148*−4.03025*−8.17825
42.08707*−3.70825*−2.95925*−6.6675
51.65814*−2.48625 −0.98875*−3.475
60.989128*−1.73475 −0.369*−2.10375
1013.07183*−3.087*−4.13*−7.217
23.10751*−3.1645*−4.2845*−7.449
32.82998*−3.25975*−4.134*−7.39375
41.44807*−2.5295*−2.86675*−5.39625
51.27078*−1.67875*−2.8825*−4.56125
60.897631*−1.2185*−1.10525*−2.32375
1513.06148*−3.19225*-3.209*−6.40125
22.949*−3.156*-3.3745*−5.8305
32.069*−2.64175*−3.1235*−5.76525
41.86667*−1.89125*−2.9625*−4.85375
51.11037*−1.88125*−1.66925*−3.5505
61.21974*−1.49475 −1.002*−2.49675

