Article

Is a Change of Protein Composition after Late Application of Nitrogen Sufficient to Improve the Baking Quality of Winter Wheat?

1
Institute of Crop Science, Quality of Plant Products (340e), University of Hohenheim, 70593 Stuttgart, Germany
2
Bayerische Landesanstalt für Landwirtschaft (LfL), 85354 Freising, Germany
*
Author to whom correspondence should be addressed.
Agriculture 2019, 9(5), 101; https://doi.org/10.3390/agriculture9050101
Submission received: 3 April 2019 / Revised: 24 April 2019 / Accepted: 30 April 2019 / Published: 6 May 2019

Abstract

:
Concentration and composition of storage proteins affect the baking quality of wheat. Although both are influenced by late nitrogen fertilization, it is not clear whether compositional changes are sufficient to improve the baking quality, and whether such effects are cultivar specific. In a pot experiment, two winter wheat cultivars belonging to different quality classes were supplied with two levels of late N fertilizer. Protein subunits were analysed by SDS-PAGE (Sodium Dodecyl Sulfate Polyacrylamide Gel Electrophoresis). Late N supply increased grain yield and protein content in both cultivars, but improved baking quality only in Discus, correlated with stronger changes in glutenin and gliadin fractions. Where baking quality was improved, this occurred at the lower late N level. Overall, the composition rather than the amount of gluten proteins was decisive for flour quality. Measures for enhancing grain protein concentration and composition are less necessary for cultivars such as Rumor in order to achieve optimum baking quality. These results open up an opportunity to reduce N fertilization in wheat production systems.

1. Introduction

Concentration and composition of grain protein subunits strongly influence the bread baking quality of wheat (Triticum aestivum L.) [1]. Originally it was assumed that the loaf volume, which is an important aspect of baking quality, was correlated with the total protein concentration of the flour [2,3]. However, baking qualities differed despite comparable protein contents and the different baking qualities could be attributed to a different composition of the storage protein subunits [4].
Proteins present in wheat are divided based on their solubility in different solvents into albumins/globulins (non-gluten proteins), gliadins and glutenins (both gluten proteins). While water and dilute salts are solvents for albumins/globulins, alcohol and reducing solvents are suitable to extract gliadins and glutenins, respectively [2]. Albumins plus globulins represent approximately 15–20% of the grain proteins [5] and often have structural and metabolic functions [6]. They are normally formed at an early stage after flowering [4] and their concentration is thought to stay constant during ripening [6].
Glutens constitute 80–85% of the total wheat grain proteins [5] and are the major factors for the visco-elastic properties of the wheat dough [7]. The gluten proteins are divided in two fractions. Monomeric gliadins are primarily responsible for dough viscosity, whereas polymeric glutenins mainly determine dough elasticity [8]. Gliadins are usually divided into α/β-, γ-, and ω-gliadins. The α/β- and γ-gliadins represent the low molecular weight (LMW), sulfur-rich fraction of glutens, while ω-gliadins form a separate sulfur-poor group [9]. The second main group of storage proteins, the glutenins, are present as polymers. These polymeric proteins have molecular weights ranging from less than 300 to more than 1000 kD [10]. Depending on their size, they can be separated into high molecular weight glutenins (HMW-GS), and low molecular weight glutenins (LMW-GS) [9]. Although, the HMW-GS make up only a small fraction of 6–10% of the glutens, they are the best characterized storage proteins as they are crucial for conferring dough strength by determining the proportion of large glutenin polymers [11].
It seems that the differences in the structure and properties of allelic subunits, which are determined by genes, are relevant for the quality of each protein subunit and the bread making quality [1]. In addition to the genetic determination, gene expression determines the quantity of different protein subunits and storage protein and can be regulated by environmental factors such as nutrient availability at different growth stages, the agricultural site, the soil quality, soil water availability, temperature and other climate conditions, which all play an important role in storage protein composition and subsequent quality aspects [6]. Nutrient, and especially nitrogen (N) management, is an important tool to regulate wheat baking quality, since N supply as well as the timing of applications significantly influences grain yield and storage protein formation [12,13]. Therefore, management of N fertilization has the capability to change both the quality (composition) and the quantity of grain proteins. Specifically, N fertilization variables, such as rate, timing and form, affect the relative quantity of specific proteins, protein subunits and protein groups. The amount and size distribution of gluten proteins are also affected, as N is an essential component of the amino acid skeleton of proteins [14,15].
There is a positive correlation between the amount of N supplied and the grain yield [16]. N is often supplied at rather high levels at the late growth stage of wheat, which may result in low nitrogen use efficiencies (NUE) and penetration of the N into the soil. This can ultimately result in leaching of nitrate, nitrous oxide emission and environmental pollution. Application of a late season fertilizer should ideally have the positive effect of enhancing grain protein concentrations, as N contributes directly to grain protein synthesis [6]. However, late season N application has variable effects on grain proteins, depending on many factors such as year, location, rate, time and type of N application, plant potential to produce yield and the plant N status at flowering [1,14,17]. It thus still remains unclear whether alterations in the concentration and composition of grain proteins after late N fertilization could be sufficient to improve the baking quality of wheat flour, specifically for cultivars whose baking quality is relatively stable throughout a certain range of protein concentrations. An additional open question is whether a combination of early and late N fertilization might be a tool to increase NUE, decrease N losses to the environment and at the same time maintain or increase yield and flour quality.
In Germany, bread wheat is classified into four quality classes, which are determined by the quality parameters such as volume (determined by a rapid-mix-test), dough elasticity, falling number, protein content and sedimentation value amongst others [18]. The highest bread making quality is reached in class E (elite wheat), followed by class A (quality wheat), class B (bread wheat) and class C (other or feed wheat). Based on this classification and to be able to study the effect of late N fertilization more comprehensively, two cultivars belonging to different quality classes (A and B) were selected. Furthermore, as the correlation between grain protein concentration and baking quality is diverse, a baking test is essential to avoid improper evaluation of bread making quality of cultivars. Very limited studies used baking tests to evaluate flour quality mainly as result of inaccurate equipment or material.
The aim of the present study was to answer the following questions: (1) Which storage protein subunits are specifically affected by late N fertilization, and does this correlate with improvements in baking quality? (2) Do changes in baking quality depend on the level of late N fertilization? (3) Is there a distinct effect of a late N fertilization on storage protein composition and concentration in two winter wheat cultivars belonging to different quality classes?

2. Materials and Methods

2.1. Experimental Set Up

We performed a pot experiment to avoid the interaction of late N fertilizer with other environmental factors and guarantee total plant N up take and later reveal the effect of late N on baking quality. The experiment was done in an open greenhouse at the University of Hohenheim during the growing season of December 2014 to July 2015. Two winter wheat cultivars (Triticum aestivum L.) were used in the present study. Each cultivar belonged to a different baking quality class, as defined by the German Federal Office of Plant Varieties [18]. While "Discus" (Deutsche Saatenveredelung AG, Germany) is classified as a quality wheat (class A) with very stable falling number and high protein content, "Rumor" (Saaten-Union GmbH, Germany) is classified as bread wheat (class B). Compared to Discus, it is a very productive cultivar with more tillers per plant and higher grain yields, but with a lower crude protein content. While both cultivars had similar loaf volume, the Glu-1 quality score [19] based on HMW-GS for Rumor is six whereas for Discus, it is eight.
Plants were cultivated in Mitscherlich pots with a capacity of 6.2 L, a diameter of 20 cm, and an area of 314 cm2 with 6 kg soil consisting of 50% clay, 45% sand and 5% turf (pH 7.3). Sixteen plants were cultivated in each pot with supplemental irrigation under natural conditions, i.e. outdoor, except during strong frost and exceptionally high rainfall. Different N fertilization regimes were established as treatments (Table 1). In addition to the basic fertilization with 1.2 g N pot−1 supplied in two doses before sowing and at EC 32 according to the unified Biologische Bundesanstalt, Bundessortenamt und CHemische Industrie (BBCH) code [20], the treatments differed in the amount of N given in a late fertilization application at EC 49, when ears were appearing (Table 1). The N was applied in the form of ammonium nitrate. Microelements and all other macronutrients (P, K and S) were supplied before sowing in adequate quantities per pot (1.8 g K, 0.2 g S, 0.2 g Mg, 1.2 g Ca and 0.9 g P). By returning the leached water from the Mitscherlich vessel trays, it was guaranteed that minerals extracted with the water were returned to the plant roots and the entire quantity of fertilizer could be absorbed. Plants were harvested at maturity.
Overall, the experimental setup was a completely randomized block design with cultivar and N supply as factors. Each treatment was established with 3 replicates, pest and disease management was done as necessary and pots were kept weed free.

2.2. Yield, Total Protein Content and Nitrogen Uptake Efficiency

After harvest, grains were separated, and grain water content determined by near infrared transmission (NIT) (Infratec 1241, FOSS, Hilleroed, Denmark). Each sample was measured in duplicate to reduce errors.
Total protein content was determined by means of near-infrared spectroscopy (NIRS), (2500X SpectraStar, Unity Scientific, Brookfield, CT, USA). The N content of the grain was calculated from the total protein content divided by the factor 5.7 [21] and nitrogen uptake efficiency into the grain (NupE) was calculated by dividing the N content of the grains by the amount of N supplied.

2.3. Extraction of Cereal Proteins

Grains were milled with a ball mill (MM301, Retsch, Haan, Germany) into a whole-grain flour. In order to achieve the best possible homogenization for subsequent protein extraction, the grinding process was carried out in two steps with a total duration of 90 s with a frequency of 27 Hz and a pause of approximately 30 s to prevent denaturation of the proteins by the heating of samples during grinding.
Three different protein fractions were extracted according to Osborne [2], based on the modified method of Wieser and Seilmeier [12]. For the extraction of albumins/globulins, 1 mL of extraction buffer (0.067 M HKNaPO4, 0.4 M NaCl, pH 7.6) was added to 200 mg of the whole flour, mixed in an overhead shaker (Multi Bio RS-24, bioSan, Riga, Latvia) for 5 min at 20 °C, and incubated on ice for 10 min with repeated vigorous vortexing. After centrifugation (13,800 g, 6 °C, 10 min), the supernatant containing albumins and globulins was transferred into new tubes, and the whole extraction step was repeated two more times.
The remaining pellet was then extracted with 0.8 mL of 70% (v/v) ethanol for 5 min at 20 °C in an overhead shaker and centrifuged again at 13,800 g (6 °C, 10 min) to yield the gliadin fraction. Again, the extraction was repeated two more times. After a washing step with 1 mL of dH2O and centrifugation (13,800 g, 6 °C, 5 min), the glutenin fraction was extracted using 0.8 ml of extraction buffer (2 M urea, 1% (w/v) dithiothereitol, 50% (v/v) 2-propanol, 0.05 M Tris pH 7.5) for 5 min in an overhead shaker at 20 °C, followed by incubation at 60°C for 10 min, cooling to room temperature (RT), and centrifugation at 13,800 g (6 °C, 10 min). Similar to the first extraction steps, this fraction was also extracted three times. Finally, all samples were frozen at −20 °C for later use. Two separate technical replicates were done for each sample.

2.4. Quantitative Analysis of the Protein Fractions

The method developed by Bradford [22] using bovine serum albumin (BSA) as a calibration reference was used to determine the concentration of proteins from the extracted fractions spectrophotometrically (Specord® 50 Plus, Analytik Jena, Jena, Germany). Albumin/globulin fractions had to be diluted 1:4 with dH2O, while gliadin and glutenin fractions were used undiluted. All samples were measured in duplicate to reduce technical errors.

2.5. Qualitative Analysis of the Protein Fractions by SDS-PAGE

The SDS-PAGE (Sodium Dodecyl Sulfate Polyacrylamide Gel Electrophoresis) was performed with a standard Dual Cooled Vertical Unit (Hoefer SE 600, Hoefer, Taufkirchen, Germany) according to Laemmli [23] by using 12% (w/v) polyacrylamide separation gels with the size of 16 × 18 cm and a thickness of 1.3 mm, and a running buffer consisting of 0.192 M glycine, 0.025 M Tris and 0.01% SDS. A protein amount of 10 μg (albumin and globulin), 2.5 μg (gliadin) and 7 μg (glutenin) was loaded into individual lanes. For each gel, a molecular weight marker ranging from 10 to 150 kD was included (Sigma, Taufkirchen, Germany). Running conditions were 400 V for 90 min followed by 480 V for 120 min and the system was cooled to 18 °C using a cooling unit. After the run, SDS-PAGE gels were fixed with a 40% (v/v) ethanol, 10% (v/v) acetic acid, stained in a heated 0.025% Coomassie R-250 staining solution, washed in dH2O, and destained in 10% (v/v) acetic acid solution until the gel background was completely decolorized. SDS-PAGE gels were scanned by an image scanner (EPSON perfection 700 Photo, Epson, CA, USA; 300 dpi and 16 bits per pixel, as TIF format).

2.6. Evaluation of SDS Gels

The scanned SDS-PAGE gels were evaluated with the Gel Analyzer 2010a program (http://www.gelanalyzer.com/). The gels were analyzed for their color in the "dark on light" mode. For each lane, all existing bands were detected automatically, corrected manually and numbered according to their respective rf values (distance from starting point). For each lane, the sum of the raw volumes (based on pixel intensity) of all bands was set as 100%, and relative intensities of each individual band were calculated and used for comparison between treatments in order to equalize possible gel to gel staining differences. Gel evaluations were confirmed by three biological replications and two technical replications.

2.7. Micro-Baking Test

Usually the baking test is based on the standardized rapid-mix-test (RMT) [24]. Since very small amounts of grain were available in our experimental set up, a micro-baking test was used. However, to be able to determine the accuracy of our micro baking test result in comparison with rapid mix test (200 g), several micro baking tests (10 g) and RMT (200 g) with different flour samples were performed. Both scales of tests showed good accordance in their trends of baking volumes and specific baking volume.
The micro baking test with was performed according to Kieffer et al. [24] with some modifications, using 10 g of flour supplemented with 5% fresh yeast, 1% sugar, 1% fat, 1.5% NaCl and water. In the micro-baking-test there was no use of ascorbic acid, which has been used as a flour improver and serves as a reducing agent to solidify the dough and increase the baking volume by promoting the formation of disulfide bonds between the thiol side residues (SH) of cysteine. All ingredients were added to the kneading device of the Promylograph (Brabender, Duisburg, Germany), mixed and kneaded for 60 s. The resulting dough was proofed at 33 °C and relative humidity of 80% for 20 min. The dough was shaped by hand into a ball shape and covered at 20–22 °C for 10 min. The relaxed dough again proofed at 32 °C and humidity of 80% for 25 min. After drying for 2 min at room temperature (25 °C) the baking process was carried out for 12 min at 200 °C. For the baking process, the four-stage oven (INFRA AE 412/30, Winkler Wachtel GmbH, Hilden, Germany) was used. After cooling of the bread to room temperature, the volume was determined.
In order to obtain sufficient grains for the baking test, grains of two pots of each treatment and cultivar were combined to form one sample.

2.8. Statistical Methods

Significance of treatments (p < 0.05) was determined by analysis of variance (two-way ANOVA) with correction after Tukey Kramer using SAS software (version 9.4, Cary, NC, USA). Data for each parameter were derived as the mean value of three replications.

3. Results

3.1. Grain Yield

While grain yield was not significantly different between the two cultivars under control conditions, it was significantly higher in Rumor compared to Discus under both levels of late N fertilization. Late N application led to a significant increase of dry grain yield in both cultivars (Figure 1). Relative to the control, the maximum grain yield increase was 21.0% in Rumor and 16.3% in Discus. However, most of this increase (19%) was obtained in the LNlow treatment in Rumor, whereas the LNhigh treatment resulted in only 2% additional yield increase. In Discus, however, only 10% increase was obtained in LNlow, but an additional 6% in LNhigh.

3.2. Relative Nitrogen Uptake Efficiency of Grain

The NupE of grains was similar between both cultivars at any N level. Relative to the control, NupE of the grains was significantly increased in the LNlow treatment by 18% in Rumor and 12% in Discus, while the additional increase induced by the LNhigh treatment was significant only in Discus (+11%), i.e., not in Rumor (Figure 2).

3.3. Total Protein Concentration of the Grain

Under control conditions, Rumor had a slightly lower grain protein concentration compared to Discus, even though the difference between both cultivars was not significant (Figure 3). Late N fertilization induced higher grain protein concentrations, which correlated with the N level supplied. Even though the total increase relative to the control was similar for both cultivars (47%), the slightly higher concentration for Discus control plants resulted in significantly higher protein values in both late N treatments (Figure 3).

3.4. Concentration and Composition of the Grain Protein Fractions

All protein fractions were increased in response to a late N fertilization, but they were affected to different extent (Table 2). The largest effect of late N supply was observed for glutenins, which were increased by almost 80% relative to the control in both cultivars at the LNlow treatment, followed by gliadins (14–19%) and albumins/globulins (8–9%). An additional increase in late N supply significantly increased albumins/globulins in Rumor and gliadins and glutenins in Discus (Table 2).
In this study, all protein fractions were further analyzed by SDS-PAGE in order to see whether individual components of a fraction were affected similarly or whether some compounds stood out by a specifically strong response to late N fertilization. Since gliadins and glutenins are known to determine the baking quality; relative band intensities for these two fractions are shown in Tables 3 and 5.
For the gliadin fraction, 18 protein bands were detected and their relative quantities were determined for Discus and Rumor (Table 3). Based on their molecular weights and the molecular position of their protein subunits, they were classified into α/β- (17–29 kD), γ- (30–39 kD), and ω- (40–60 kD) gliadin subunits (Table 3). ω-gliadins represented the smallest subunit with 8.8–18.4% of all gliadins (Table 4), and they responded differently to late N in both varieties (Table 3). ω-gliadins were especially low in the controls of Discus (8.8%) compared to Rumor (13.4%); however, they strongly increased in this cultivar in response to the N supply, reaching 18.4% under LNhigh compared to 15.2% in Rumor (Table 4). There were also large genotypic differences in individual bands of this subunit. Two bands (#2: 53.7 kD and #3: 48.4 kD) were only detected in Rumor, where their intensity increased significantly with the highest rate of late N fertilizer. A relatively strong band (#1: 59.3 kD, Rumor; #1: 58.9 kD, Discus) was present in both varieties, but it significantly increased with late N supply only in Discus, and not in Rumor. A contrasting response between cultivars was observed for band #6 (40.8 kD, Rumor; 40.3 kD, Discus), which significantly increased in both late N treatments in Discus, but decreased in Rumor.
Even though only three bands were detected in the subunit of the γ-gliadins, they accounted for 23.0–32.2% of the total gliadin fraction (Table 4). Although the response of this subunit to late N supply was overall not significant, a decreasing tendency was nevertheless observed (Table 4). The γ-gliadins were always slightly lower in Rumor compared to Discus, and this difference between cultivars was significant in LNhigh (Table 4). In Rumor, but not in Discus, band #7 (35.0 kD) decreased significantly with late N supply, while band #9 (30.8 kD) increased.
The α/β-gliadin was the dominant subunit, representing 52.7–61.9% of the gliadins (Table 4). Under control conditions, α/β-gliadin were equally represented in Rumor and Discus. α/β-gliadins were unchanged by late N fertilization in Rumor, but they were significantly decreased in Discus. Due to this decrease, the α/β-gliadin subunit was significantly lower in Discus compared to Rumor in both late N treatments (Table 4). Only two individual bands significantly decreased in LNhigh in Discus (#14: 23.9 kD and #17: 18.4 kD).
For the glutenin fraction, 12 protein bands were detected and analyzed. Based on their molecular weights and the molecular position of their protein subunits, they were classified into HMW (60–110 kD), LMW-D (40–59 kD), LMW-B (30–39 kD) and LMW-C (24–29 kD) glutenin subunits (Table 5). Overall the composition of different glutenin subunits responded significantly to the late N supply in Discus, but not in Rumor (Table 6).
The HMW was the dominant subunit representing between 46–53.7% of all glutenins. No genotypic differences were observed under control conditions. For both cultivars, HMW increased with late N supply, even though this effect was significant only for Discus. Among low molecular weight glutenins, LMW-B represented between 28.5–34.3%, LMW-C between 15.8–19.4% and LMW-D only between 0.3–1.7% (Table 6). In Discus, LMW-B decreased with late N supply, while LMW-D significantly increased. A slight increase in LMW-D was also observed in Rumor, but this effect was not statistically significant (Table 6). LMW-C was not affected by late N fertilization in either cultivar (Table 6).
With the exception of LMW-C, protein patterns of all glutenin subunits were affected to some extent by late N fertilization (Table 5). A significant increase was observed for HMW bands #1 (109.4 kD) and #2 (102.6 kD) in Discus and band #3 (83.8 kD) in Rumor, as well as for LMW-D band #5 (58.7 kD) and LMW-B band #6 (39.0 kD) in Discus. Decreases were observed for LMW-B bands #7 (38.1, Rumor; 38.5, Discus) in both cultivars, as well as #8 (34.0) and #9 (32.9) in Discus. It is noticeable that with the exception of band #6 in Discus, both late N supply levels induced similar significant changes, but there was no further effect of the LNhigh compared to the LNlow treatment (Table 5).

3.5. Baking Volume

Under control conditions, the baking volume was not significantly different between the two cultivars (Figure 4). In Rumor, it did not change with late N fertilizer application, while it increased in Discus with increasing N supply, resulting in a significantly higher baking volume of Discus compared to Rumor in the LNhigh treatment.

4. Discussion

4.1. Late N Supply Increases Grain Yield and Grain Protein Concentration

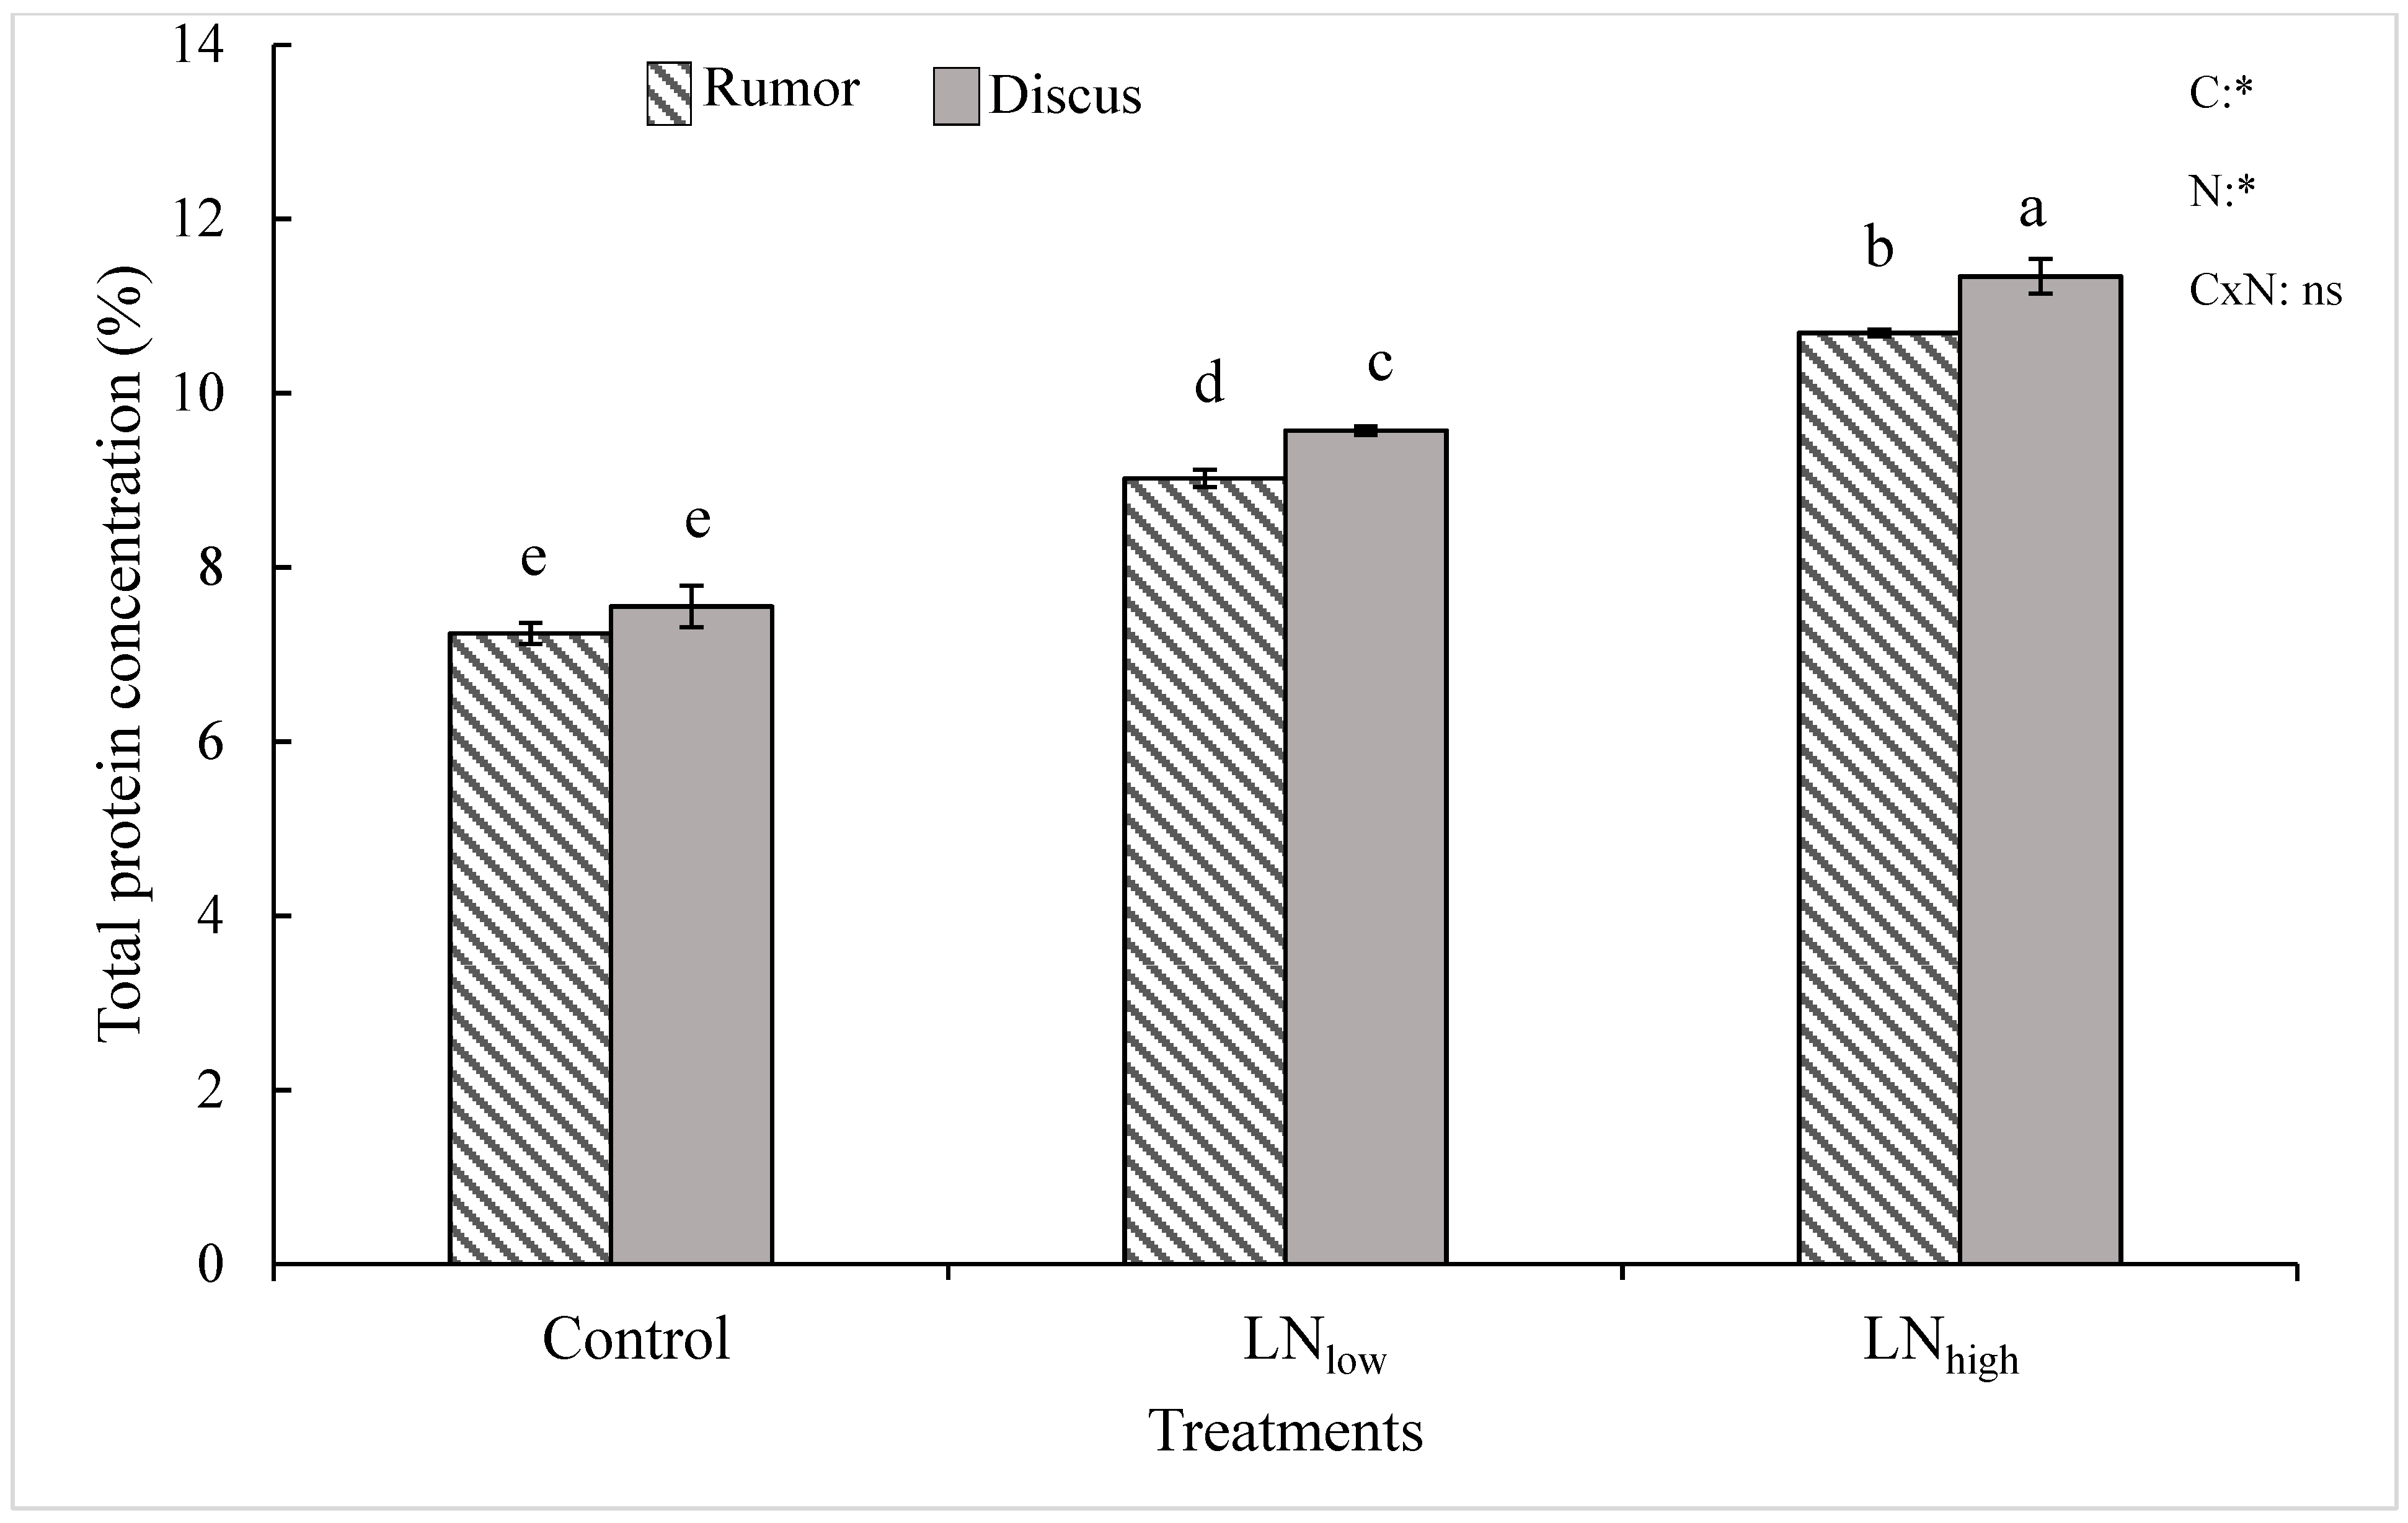
Results of the current study indicate that late N management is a viable option to improve the total protein content in winter wheat cultivars. This is in agreement with other studies where late N application increased the grain protein content of winter, spring and durum wheat cultivars within different growing seasons [12,13,
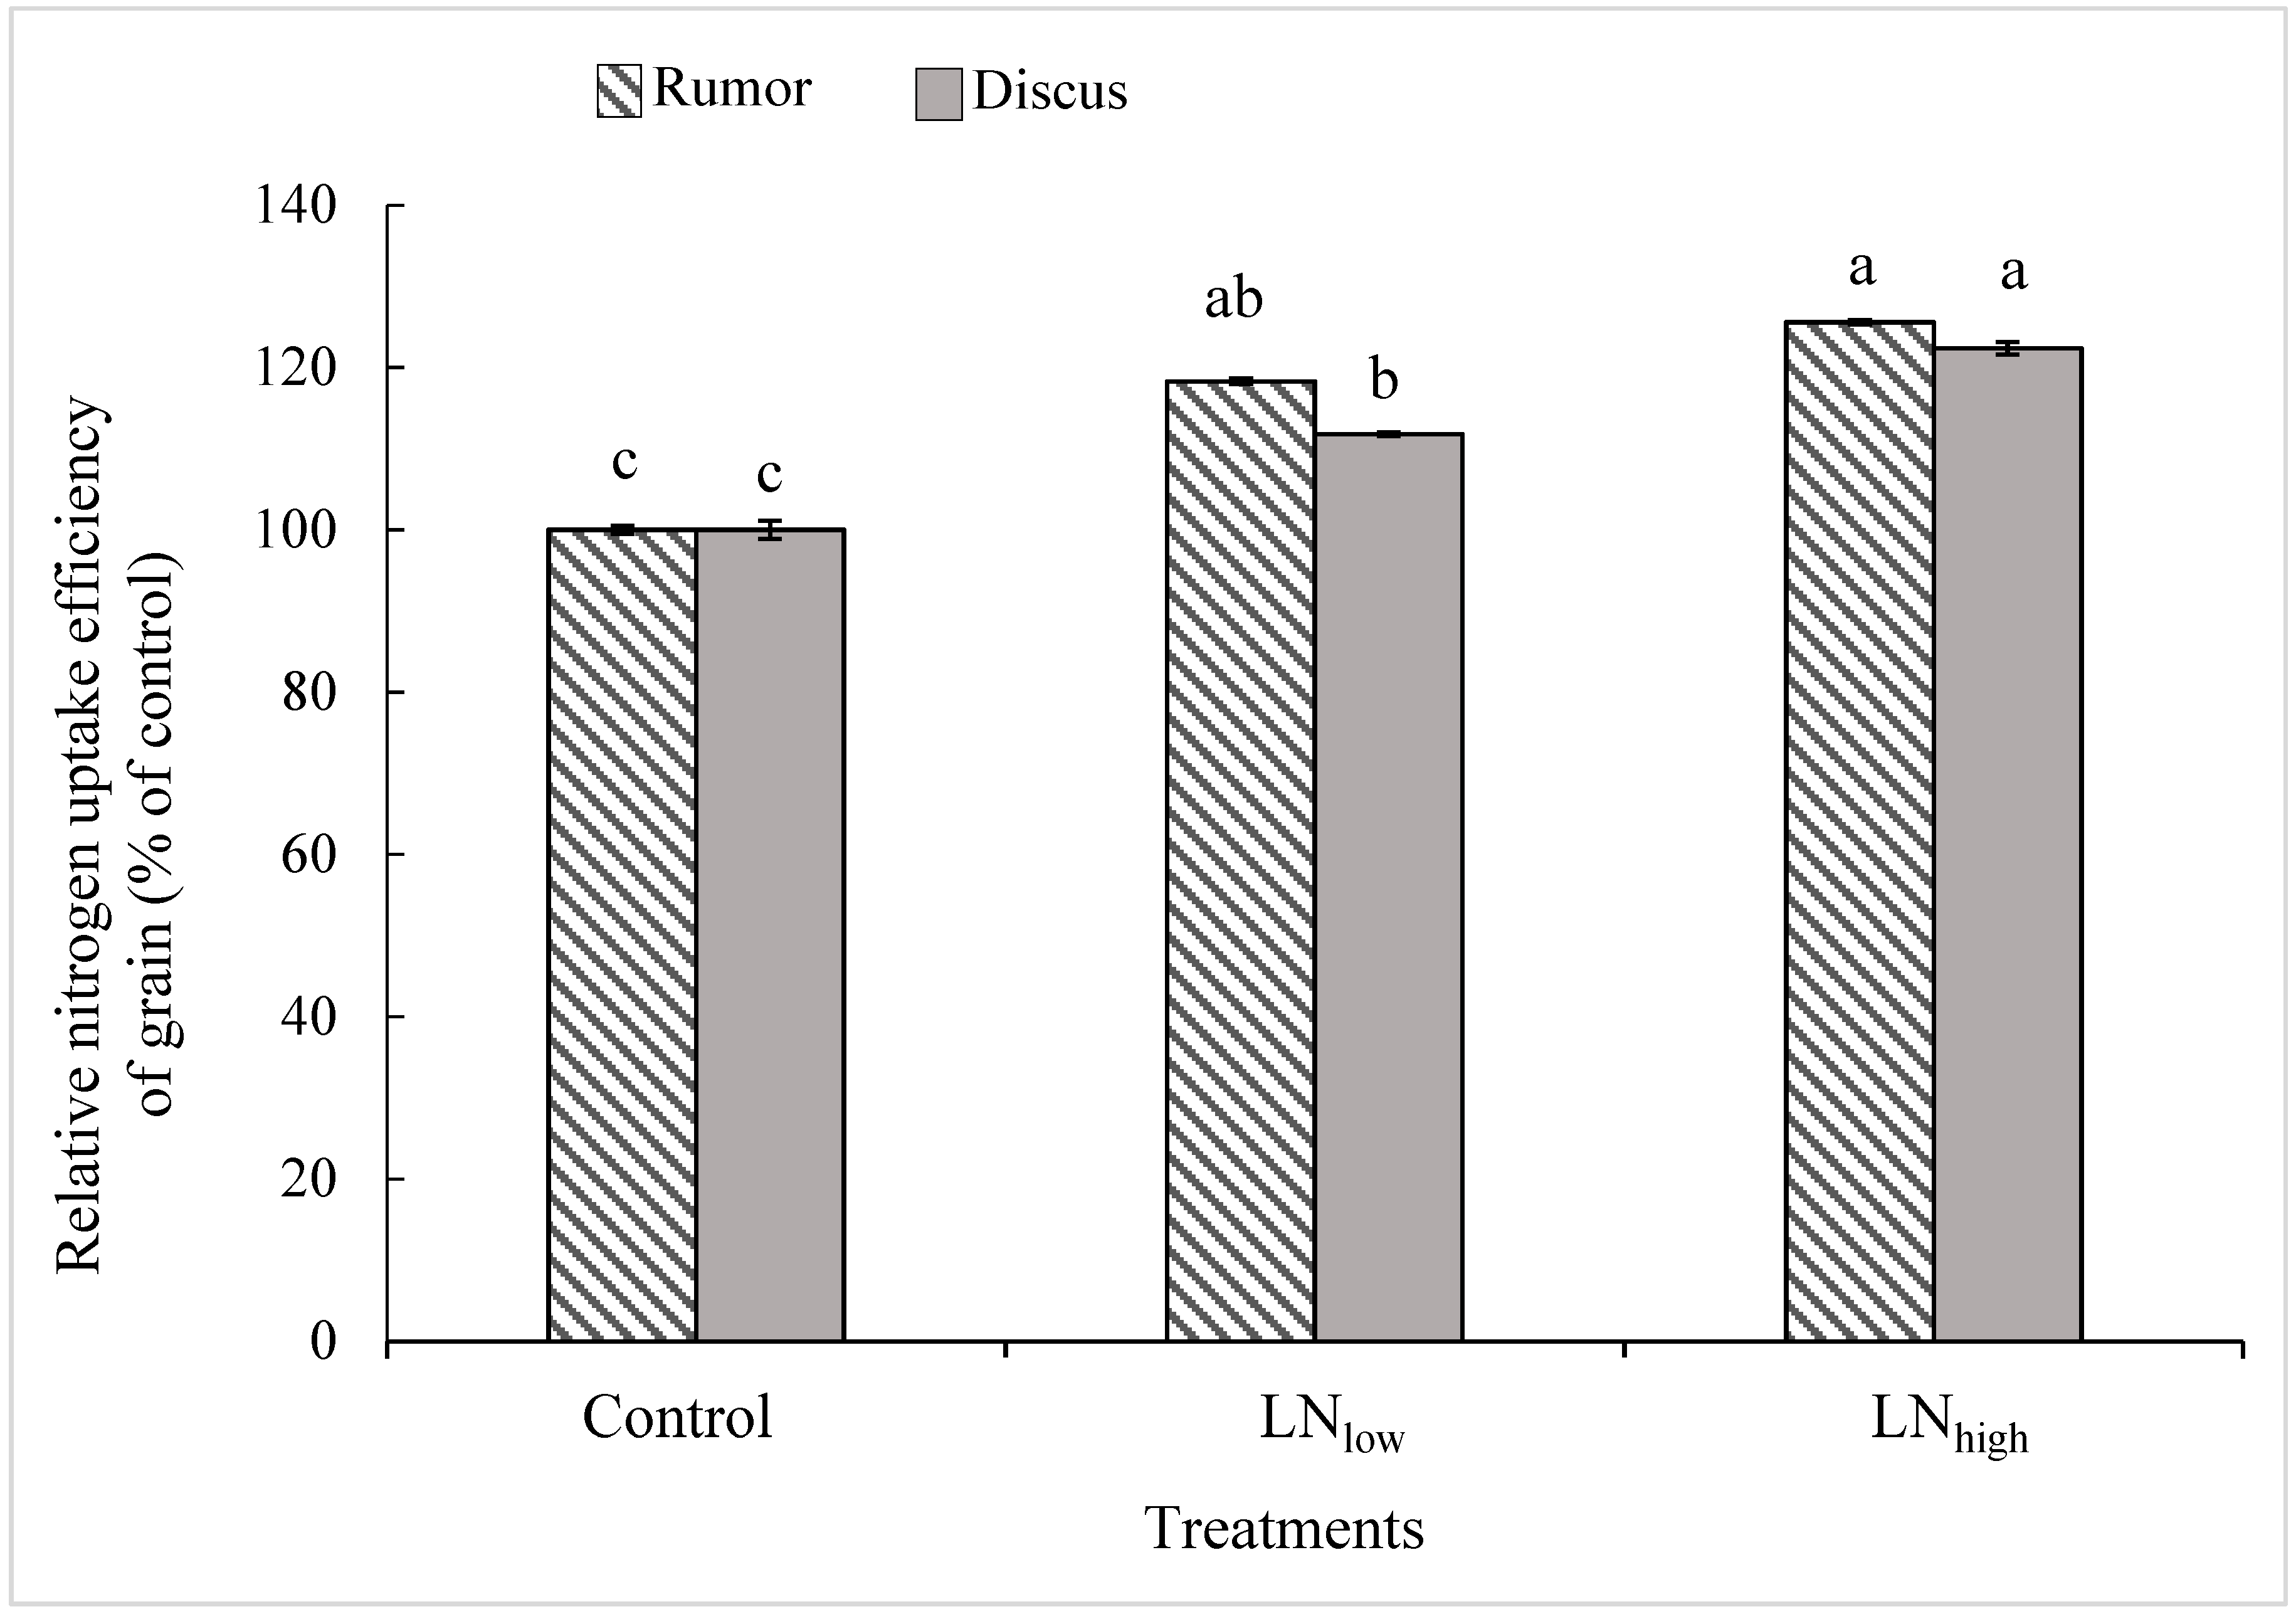
25]. Such an increase in grain protein content might be attributed to the fact that N applied after completion of vegetative growth would be directly available for grain protein synthesis, and thus increase N uptake efficiency [1]. Accumulation of grain proteins can be fed by two different amino acid pools. The first pool represents amino acids that are assimilated during vegetative growth and are remobilized during grain filling, and the second pool represents amino acids that are assimilated during grain filling [26]. It is plausible that amino acids synthesized from later added N are more readily available for export to the phloem to meet the demand of grain protein synthesis compared to those slowly released from the storage pool.
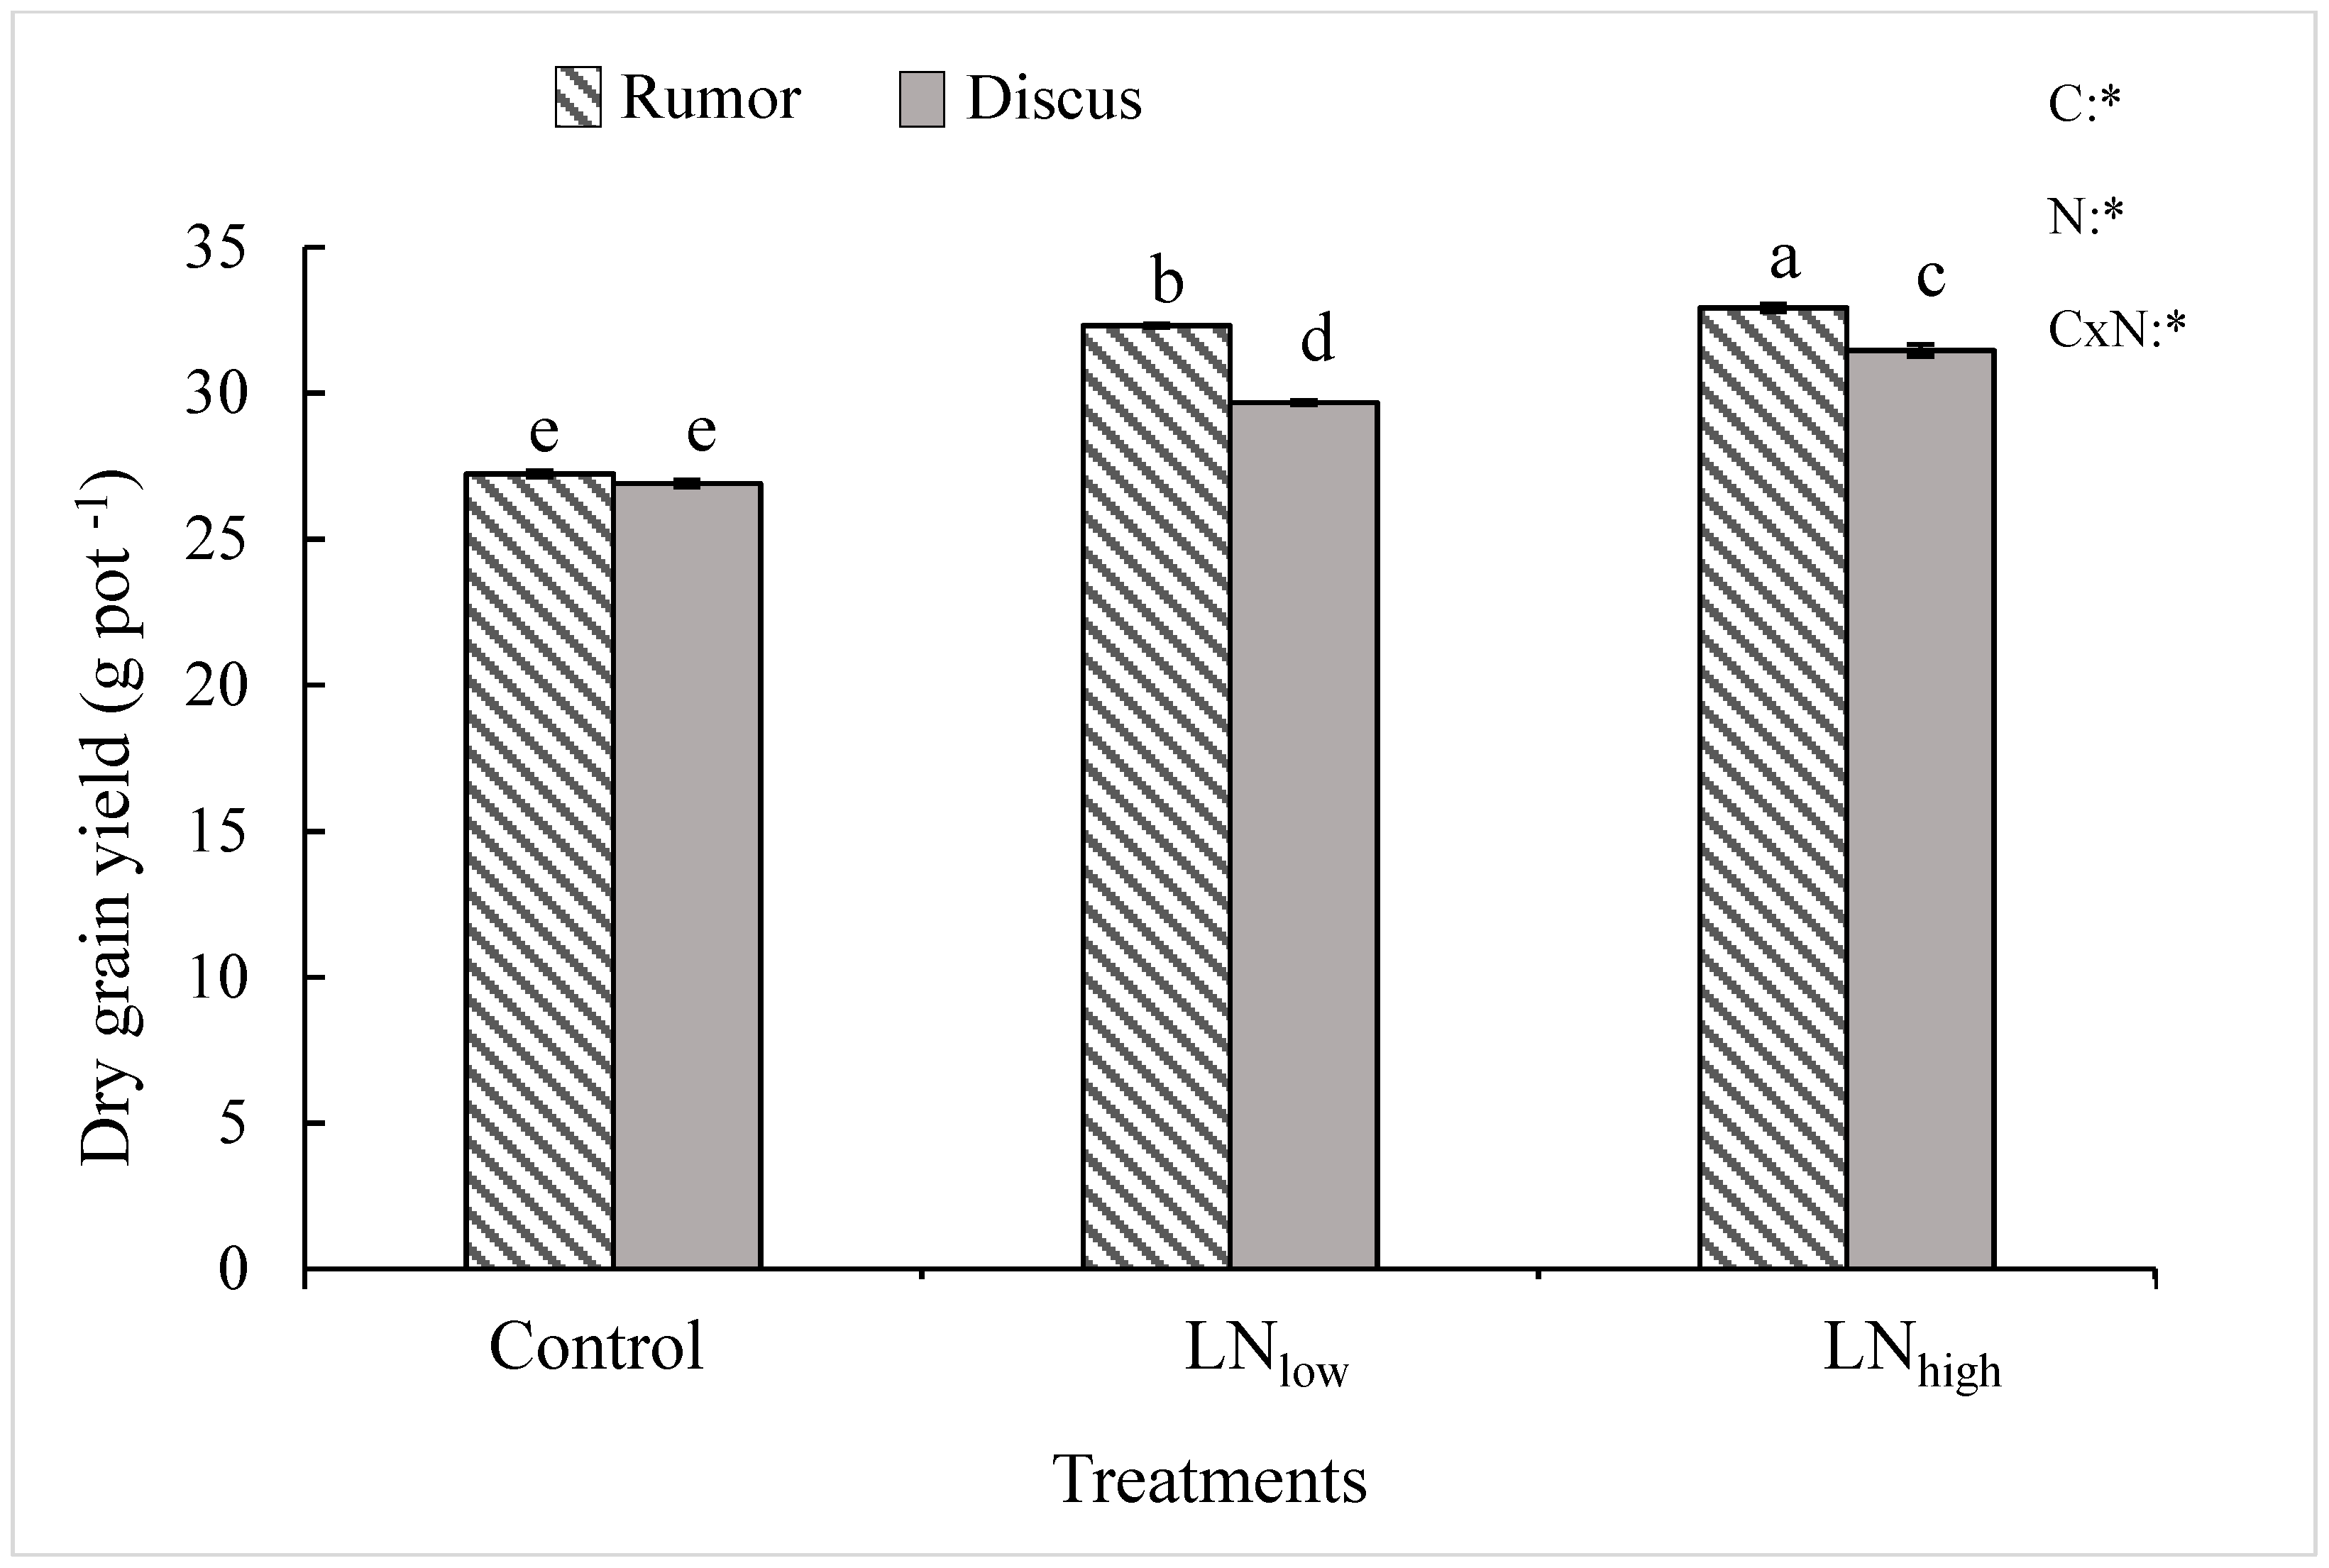
In the present study, late N application not only increased grain protein content but also grain yield in both cultivars. It is possible that the N applied before heading was mostly used up by the plant during vegetative growth but possibly the N supply during prior growth stages was below optimum to reach maximum yield. Therefore, plants used the late N at least in part for kernel filling, and partly for synthesis of proteins.

4.2. Late N Supply Alters Protein Composition and Improves Baking Quality in High Protein Cultivars

Late N fertilization caused an increase in all protein fractions, though mainly in the glutenins and gliadins. The stronger increase in glutenins and gliadins with application of late N fertilizer indicates that gluten proteins were preferentially biosynthesized compared to albumins and globulins. Even though it has been suggested that N distribution within grain protein fractions is mostly dependent upon the genetic background [
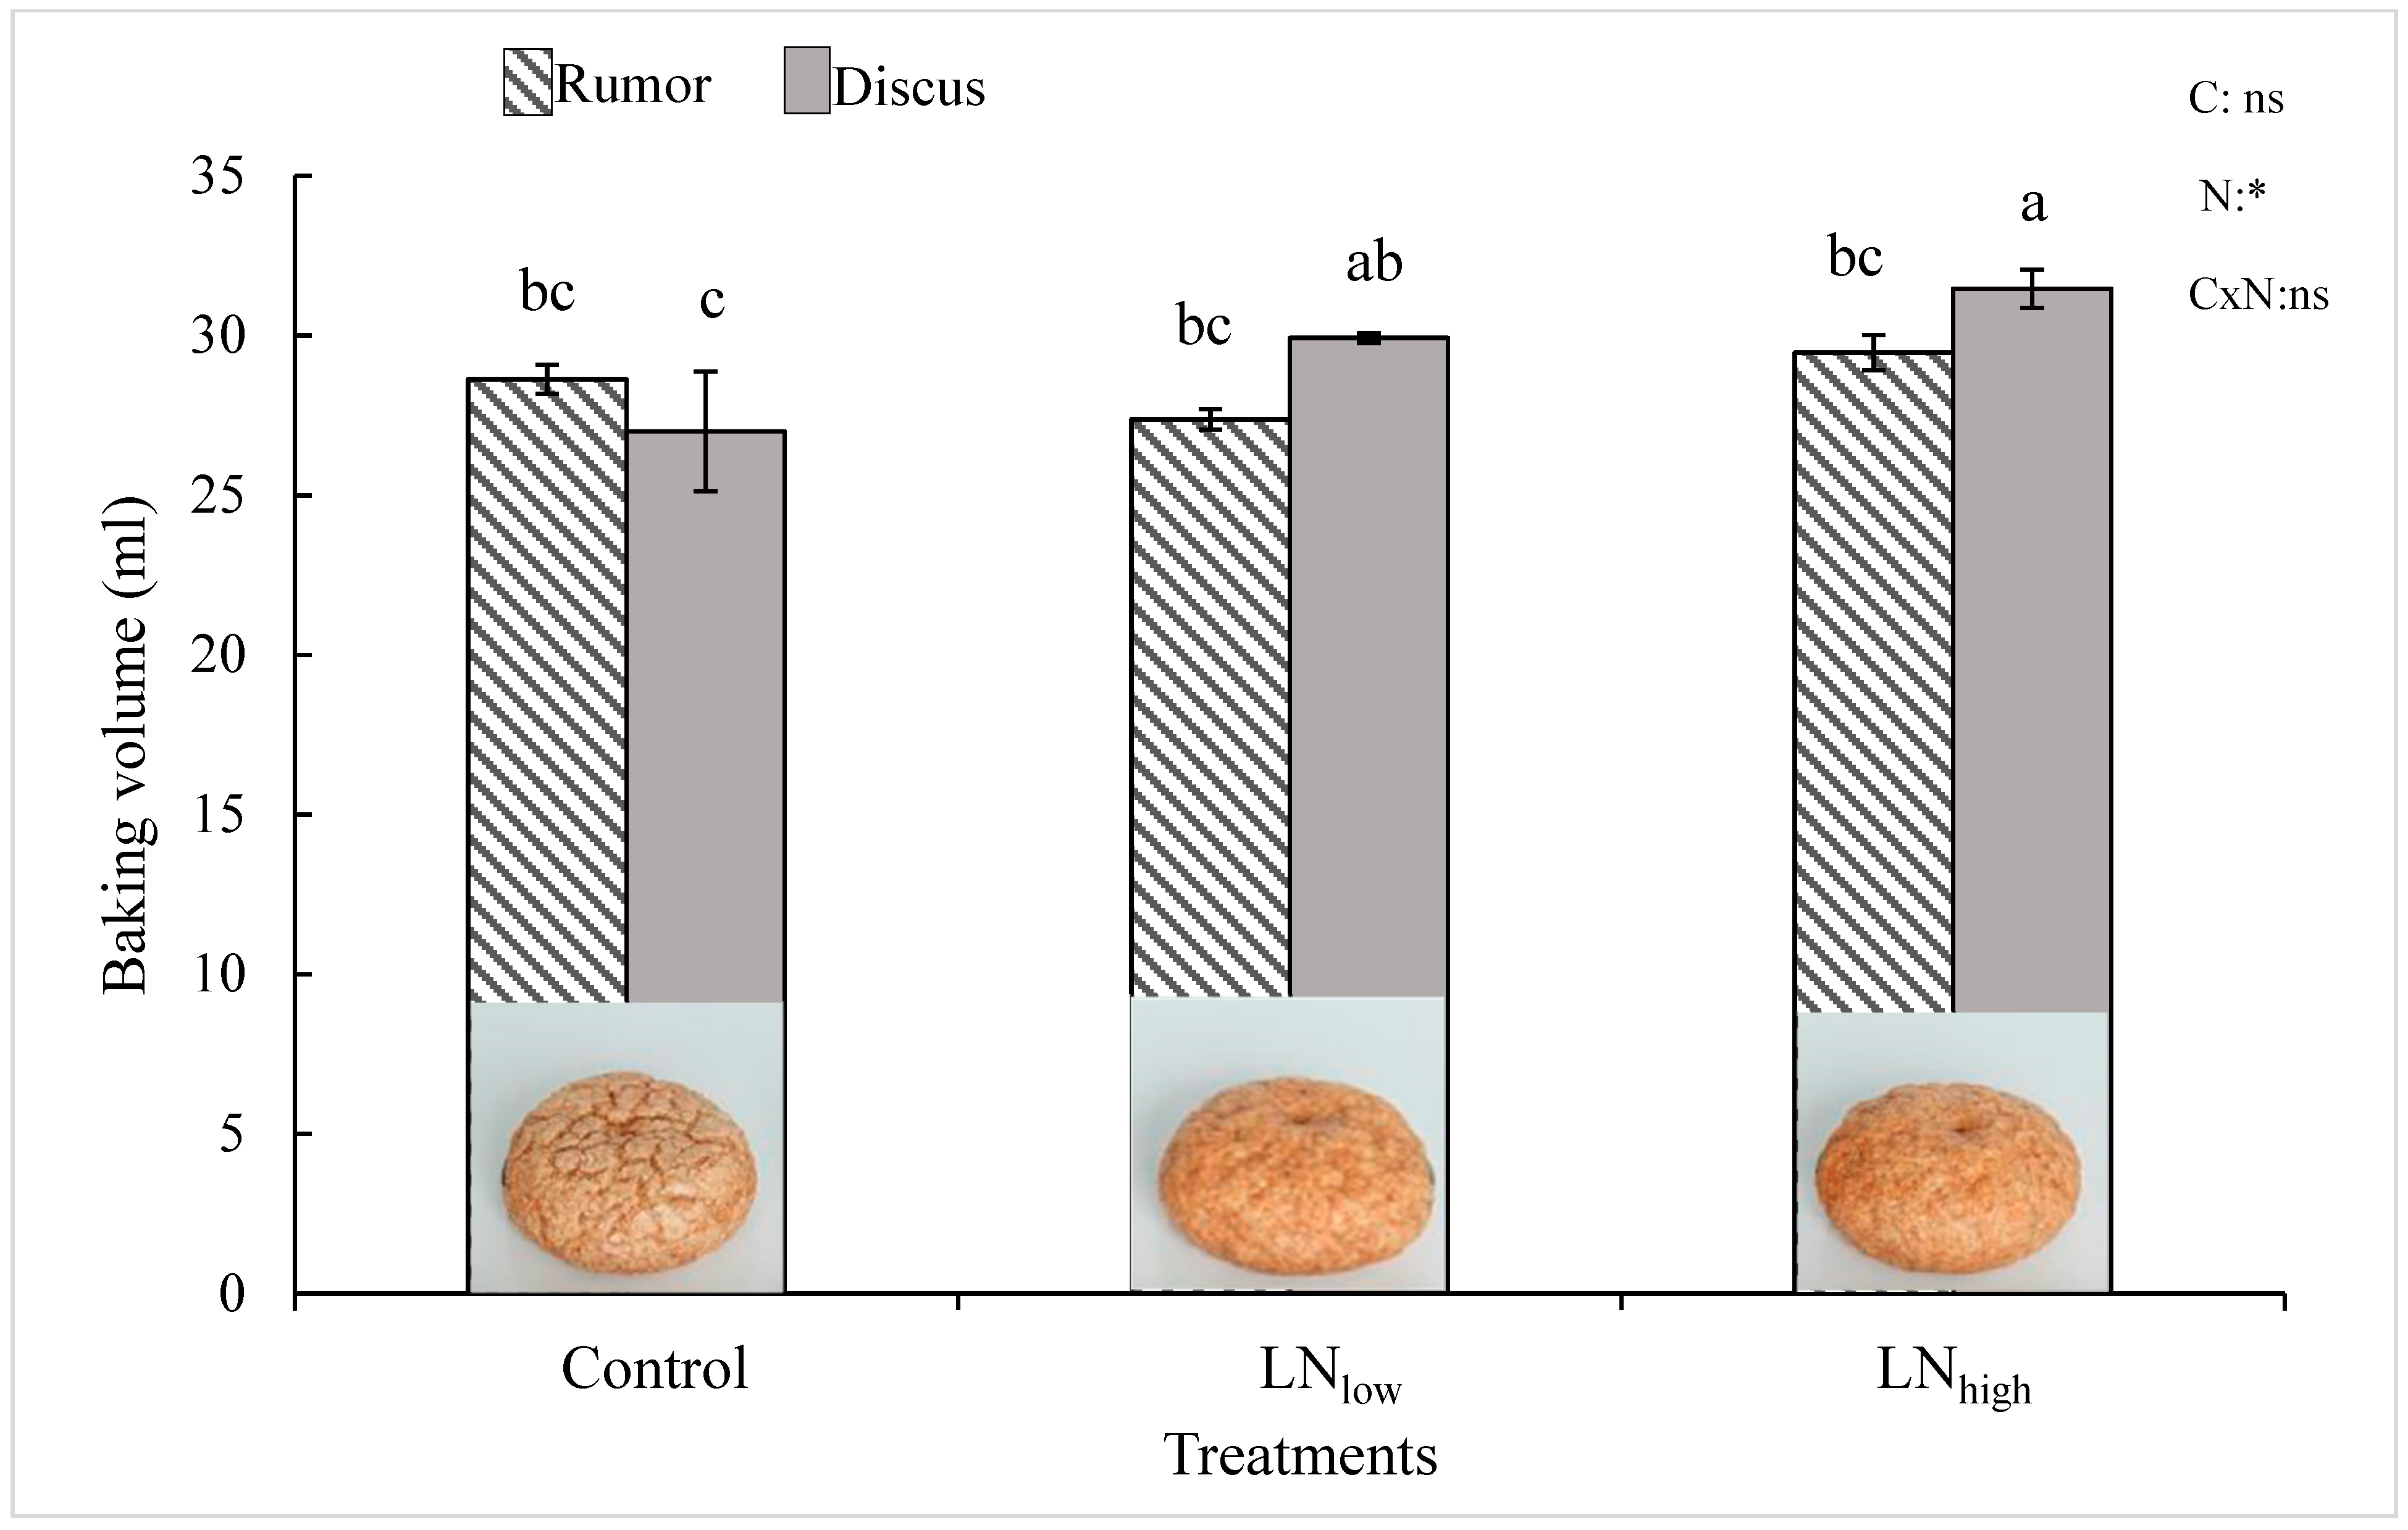
27], our results clearly indicate that protein composition can also be modified by external factors such as the concentration of N available after heading. However, the overall increase in gluten proteins did not seem to be directly correlated with an improvement of the baking volume. While gluten increased to a similar extent in both cultivars with late N application, baking quality was enhanced only in Discus, i.e., not in Rumor (Figure 4).
We therefore conclude that the composition changes of glutenin and to some extent gliadin with late N application might be decisive for the baking quality, rather than the overall total gluten concentration. This is further supported by the fact that changes in the composition of gluten fractions, especially HMW glutenins and ω-gliadins, in response to late N fertilization were significant only in Discus, i.e., not in Rumor (Table 4, Table 5 and Table 6). The HMW glutenin subunit is known to be extremely important for dough properties, and it was suggested that variation in quantity and quality of HMW-GS in European wheat cultivars is responsible for 45–70% of the variation in baking quality [28]. HMW-GS and ω-gliadins have relatively low sulfur contents [9] and previous reports have shown that N fertilization enhanced the percentages of storage proteins containing low to medium sulfur, while those of sulfur rich proteins (e.g., LMW-GS) remained constant or decreased [28,29,30]. This is fully in line with our results where HMW-GS and ω-gliadins tended to increase with late N fertilizer, while LMW-GS rather decreased, at least in Discus. Both ω-gliadins and HMW-GS mainly consist of metabolically inexpensive amino acids (glutamine and proline), which may represent sinks for readily available N, which is not needed for vegetative growth [31]. As protein concentration was improved in both cultivars by application of LNlow and LNhigh, the same improvement was not recorded for different protein subunits; therefore, it can be assumed that the composition of gluten subunits is independent from total protein concentration.
Moreover, it was suggested that bread wheat cultivars contain between three and five HMW-GS. On the other hand it was assumed that the relative proportion of individual HMW-GS with application of N fertilizer stayed constant [17]. Our results point out that relative quantity of specific HMW-GS was improved with late N application at least in one cultivar. In addition, it was proposed that amongst HMW-GS, x-type subunits had higher effects on bread making quality than y-type subunits [32]. In our study, x-type HMW-GS present in both wheat cultivars was the largest HMW-GS (Table 5). The change of x-type HMW-GS in Discus was significant (Table 5 band #1 and #2). As a result, the relative change of this subunit may have excessive impacts on baking quality, as was observed in our study.
Additionally, the ratio of protein subunits (HMW/LMW or gliadin/glutenin) strongly affects baking performance of flour [33]. Therefore, it is essential to study the effect of late N application not only on protein fractions and subunits but also on their ratios.
It was suggested that the increase of the HMW/LMW ratio may improve baking volume [33]. This effect was observed in our study. While the ratio of HMW/LMW and further baking volume stayed unchanged in Rumor, application of LNlow increased HMW/LMW and baking volume significantly in Discus.
It was suggested [34] with an increase in nitrogen supply over unchanged sulfur supply, more N is available for biosynthesis, which causes a higher increase in glutenin with respect to gliadin. Simultaneously, the bread volume and gliadin to glutenin ratio has a negative correlation [35]. This effect was observed in our study where the gliadin/glutenin ratio was decreased with the application of LNlow in Discus and baking volume improved. In contrast, neither the gliadin/glutenin ratio nor baking volume significantly changed in Rumor. This can be due to the higher gliadin concentration in Rumor compared to Discus.
While grain yield and total grain protein concentration overall increased with increasing amount of supplied N, significant changes in glutenin and gliadin subunits were already observed in the LNlow treatment, while a higher late N supply did not bring about additional changes in protein composition, nor did further improve baking volumes. These results seem to further indicate not only that baking quality is more strongly determined by the gluten composition rather than the overall protein concentration, but also that a small increase in late N availability might be sufficient for improving baking quality at least in cultivars with a higher grain protein yield capacity. For these cultivars, higher rates of late N supply would not seem to be economically advantageous and might potentially lead to N leaching and losses into the environment.
In summary, it can be suggested that a LNlow application of late N fertilizer might be a feasible way to improve the baking quality of wheat flour. However, one of the main findings of the present study is that the compositional changes of gluten protein fractions were much less pronounced in Rumor compared to Discus. Rumor is a cultivar characterized by optimum baking quality at lower grain protein content compared with Discus. In other words, it reaches its optimal baking volume already at lower protein levels, and consequently, additional N supplied at late stages of development can be used for kernel filling and thus increase grain yield, but they do not induce major compositional protein changes and improved baking quality. A similar result was also obtained in a previous study using a different pair of wheat cultivars [13], which further supports that different N management strategies might be adequate for different wheat cultivars. This opens up an opportunity for some reduction of N fertilization rates in wheat production. Overall in this study gliadin, glutenin and protein concentrations were not well correlated with different protein subunits and loaf volume in both cultivars. Therefore, our results confirm that total grain protein concentration alone may not be a reliable parameter for the evaluation of flour quality in high protein wheat cultivars, while an increased amount of gluten fractions is not a promising breeding target for lower protein wheat cultivars. It can be suggested that combined analysis of protein concentration and composition should take a place in order to evaluate the wheat baking quality.
Based on this study, the effect of late N application was observed in protein concentration, composition and baking quality of wheat flour. Many other factors such as the rate and type of late N, cultivar differences and environmental conditions (availability of rainfall, especially during spring) need to be considered. This study provides knowledge on effects of late N fertilizer under controlled condition with two cultivars. Therefore, it is essential to bring this result to the field level with different cultivars and locations to evaluate the further G*E effects.

Author Contributions

Conceptualization, G.H. and C.Z.; Data curation, A.R. and M.A.W.; Formal analysis, A.R. and M.A.W.; Investigation, A.R. and G.H.; Methodology, A.R., M.A.W., G.H. and C.Z.; Software, A.R.; Supervision, C.Z.; Validation, A.R. and M.A.W.; Visualization, A.R.; Writing–original draft, A.R. and M.A.W.; Writing–review & editing, G.H. and C.Z.

Funding

This research was funded by the Foundation fiat panis and Food Security center (FSC), University of Hohenheim, which is supported by the German Academic Exchange Service (DAAD) with Funds from the Federal Ministry of Economic Cooperation and Development (BMZ) of Germany, grant number DAAD 57160040.

Acknowledgments

We thank Christiane Beierle for her excellent technical assistance for preparing SDS-PAGE. We are also immensely grateful to Benedikt Volkheimer for his help in the micro baking test.

Conflicts of Interest

The authors declare no conflict of interest. The funders had no role in the design of the study; in the collection, analyses, or interpretation of data; in the writing of the manuscript, or in the decision to publish the results.

Abbreviations

Biologische Bundesanstalt, Bundessortenamt und CHemische Industrie (BBCH)
Bovine Serum Albumin (BSA)
High Molecular Weight (HMW)
High Molecular Weight Glutenins (HMW-GS)
Late N high (LNhigh)
Late N low (LNlow)
Low Molecular Weight (LMW)
Low Molecular Weight Glutenins (LMW-GS)
Near Infrared Transmission (NIT)
Near-Infrared Spectroscopy (NIRS)
Nitrogen (N)
Nitrogen Uptake Efficiency (NupE)
Nitrogen Use Efficiencies (NUE)
Rapid Micro Test (RMT)
Room Temperature (RT)
Sodium Dodecyl Sulfate Polyacrylamide Gel Electrophoresis(SDS-PAGE)

References

  1. Zörb, C.; Ludewig, U.; Hawkesford, M.J. Perspective on Wheat Yield and Quality with Reduced Nitrogen Supply. Trends Plant Sci. 2018, 23, 1029–1037. [Google Scholar] [CrossRef] [PubMed]
  2. Osborne, T.B. The vegetable proteins. London: Longmans, Green, and Co. J. Soc. Chem. Ind. 1924, 43, 440. [Google Scholar] [CrossRef]
  3. Tipples, K.H.; Kilborn, R.H. “Baking strength index” and the relation of protein content to loaf volume. Can. J. Plant Sci. 1974, 54, 231–234. [Google Scholar] [CrossRef]
  4. Singh, J.; Skerritt, J.H. Chromosomal Control of Albumins and Globulins in Wheat Grain Assessed using Different Fractionation Procedures. J. Cereal Sci. 2001, 33, 163–181. [Google Scholar] [CrossRef]
  5. Shewry, P.R.; Tatham, A.S.; Barro, F.; Barcelo, P.; Lazzeri, P. Biotechnology of Bread making: Unraveling and Manipulating the Multi-Protein Gluten Complex. Nat. Biotechnol. 1995, 13, 1185–1190. [Google Scholar] [CrossRef]
  6. Dupont, F.M.; Altenbach, S. Molecular and biochemical impacts of environmental factors on wheat grain development and protein yield. J. Cereal Sci. 2003, 38, 133–146. [Google Scholar] [CrossRef]
  7. Ejaz, A.W.; Basra, S.M.A.; Ahmad, N.; Ahmad, R.; Aftab, M. Effect of nitrogen on grain quality and vigour in wheat (Triticum aestivum L.). Int. J. Agric. Biol. 2002, 4, 517–520. [Google Scholar]
  8. Wieser, H. Chemistry of gluten proteins. Food Microbiol. 2007, 24, 115–119. [Google Scholar] [CrossRef]
  9. Shewry, P.R.; Halford, N.G.; Belton, P.S.; Tatham, A.S. The structure and properties of gluten: an elastic protein from wheat grain. Philos. Trans. R. Soc. Lond. B Biol. Sci. 2002, 357, 133–142. [Google Scholar] [CrossRef]
  10. Liu, L.; Ikeda, T.; Branlard, G.; Peña, R.; Rogers, W.; Lerner, S.; Kolman, M.; Xia, X.; Wang, L.; Ma, W.; et al. Comparison of low molecular weight glutenin subunits identified by SDS-PAGE, 2-DE, MALDI-TOF-MS and PCR in common wheat. BMC Plant Biol. 2010, 10, 124–148. [Google Scholar] [CrossRef]
  11. Gupta, R.B.; Batey, I.L.; MacRitchie, F. Relationships between protein composition and functional properties of wheat flours. Cereal Chem. 1992, 69, 125–131. [Google Scholar]
  12. Wieser, H.; Seilmeier, W. The influence of nitrogen fertilization on quantities and proportions of different protein types in wheat flour. J. Sci. Food Agric. 1998, 76, 49–55. [Google Scholar] [CrossRef]
  13. Xue, C.; Schulte auf’m Erley, G.; Rücker, S.; Koehler, P.; Obenauf, U.; Mühling, K.H. Late nitrogen application increased protein concentration but not baking quality of wheat. J. Plant Nutr. Soil Sci. 2016, 179, 591–601. [Google Scholar] [CrossRef]
  14. Garrido-Lestache, E.; López-Bellido, R.J.; López-Bellido, L. Durum wheat quality under Mediterranean conditions as affected by N rate, timing and splitting, N form and S fertilization. Eur. J. Agron. 2005, 23, 265–278. [Google Scholar] [CrossRef]
  15. Martre, P.; Jamieson, P.D.; Semenov, M.A.; Zyskowski, R.F.; Porter, J.R.; Triboï, E. Modelling protein content and composition in relation to crop nitrogen dynamics for wheat. Eur. J. Agron. 2006, 25, 138–154. [Google Scholar] [CrossRef]
  16. Fowler, D.B. Crop Nitrogen Demand and Grain Protein Concentration of Spring and Winter Wheat. Agron. J. 2003, 95, 260–265. [Google Scholar] [CrossRef]
  17. Fuertes-Mendizábal, T.; González-Torralba, J.; Arregui, L.M.; González-Murua, C.; González-Moro, M.B.; Estavillo, J.M. Ammonium as sole N source improves grain quality in wheat. J. Sci. Food Agric. 2013, 93, 2162–2171. [Google Scholar] [CrossRef] [PubMed]
  18. Bundessortenamt. Descriptive List of Varieties for Cereals, Maize, Oil and Fiber Plants, Legumes, Beets, Catch Crops. Available online: https://www.bundessortenamt.de/bsa/media/Files/BSL/bsl_getreide_2015.pdf (accessed on 24 September 2015).
  19. Payne, P.I.; Nightingale, M.A.; Krattiger, A.F.; Holt, L.M. The relationship between HMW glutenin subunit composition and the bread-making quality of British-grown wheat varieties. J. Sci. Food Agric. 1987, 40, 51–65. [Google Scholar] [CrossRef]
  20. Lancashire, P.D.; Bleiholder, H.; Boom, T.V.; Langelüddeke, P.; Stauss, R.; Weber, E.; Witzenberger, A. A uniform decimal code for growth stages of crops and weeds. Ann. Appl. Biol. 1991, 119, 561–601. [Google Scholar] [CrossRef]
  21. Lee, S.M. Official methods of analysis of AOAC International (16th edn). Trends Food Sci. Technol. 1995, 6, 382. [Google Scholar] [CrossRef]
  22. Bradford, M.M. A rapid and sensitive method for the quantitation of microgram quantities of protein utilizing the principle of protein-dye binding. Anal. Biochem. 1976, 72, 248–254. [Google Scholar] [CrossRef]
  23. Laemmli, U.K. Cleavage of Structural Proteins during the Assembly of the Head of Bacteriophage T4. Int. J. Sci. Nat. 1970, 227, 680–685. [Google Scholar] [CrossRef]
  24. Kieffer, R.; Belitz, H.D.; Zweier, M.; Ipfelkofer, R.; Fischbeck, G. Der Rapid-Mix-Test als 10-g-Mikrobackversuch. Eur. Food Res. Technol. 1993, 197, 134–136. [Google Scholar] [CrossRef]
  25. Blandino, M.; Vaccino, P.; Reyneri, A. Late-Season Nitrogen Increases Improver Common and Durum Wheat Quality. Agron J. 2015, 107, 680–690. [Google Scholar] [CrossRef]
  26. Barneix, A.J. Physiology and biochemistry of source-regulated protein accumulation in the wheat grain. J. Plant Physiol. 2007, 164, 581–590. [Google Scholar] [CrossRef] [PubMed]
  27. Triboï, E.; Martre, P.; Triboï-Blondel, A. Environmentally-induced changes in protein composition in developing grains of wheat are related to changes in total protein content. J. Exp. Bot. 2003, 54, 1731–1742. [Google Scholar] [CrossRef] [Green Version]
  28. Shewry, P.R.; Tatham, A.S.; Halford, N.G. Nutritional control of storage protein synthesis in developing grain of wheat and barley. J. Plant Growth Regul. 2001, 34, 105–111. [Google Scholar] [CrossRef]
  29. Daniel, C.; Triboï, E. Effects of Temperature and Nitrogen Nutrition on the Grain Composition of Winter Wheat: Effects on Gliadin Content and Composition. J. Cereal Sci. 2000, 32, 45–56. [Google Scholar] [CrossRef]
  30. Hurkman, W.J.; Tanaka, C.K.; Vensel, W.H.; Thilmony, R.; Altenbach, S.B. Comparative proteomic analysis of the effect of temperature and fertilizer on gliadin and glutenin accumulation in the developing endosperm and flour from Triticum Aestivum L. Cv. Butte 86. Proteome Sci. 2013, 11, 8–23. [Google Scholar] [CrossRef]
  31. Dupont, F.M.; Hurkman, W.J.; Vensel, W.H.; Tanaka, C.; Kothari, K.M.; Chung, O.K.; Altenbach, S.B. Protein accumulation and composition in wheat grains: Effects of mineral nutrients and high temperature. Eur. J. Agron. 2006, 25, 96–107. [Google Scholar] [CrossRef]
  32. Wieser, H.; Kieffer, R. Correlations of the amount of gluten protein types to the technological properties of wheat flours determined on a micro-scale. J. Cereal Sci. 2001, 34, 19–27. [Google Scholar] [CrossRef]
  33. Millar, S.J. The Development of Near Infrared (NIR) Spectroscopy Calibrations for the Prediction of Wheat and Flour Quality. HGCA Project Report 310. 2003. Available online: https://cereals.ahdb.rg.uk/media/376552/310_complete_final_report.pdf (accessed on 14 March 2016).
  34. Bonnot, T.; Bancel, E.; Alvarez, D.; Davanture, M.; Boudet, J.; Pailloux, M.; Zivy, M.; Ravel, C.; Martre, P. Grain subproteome responses to nitrogen and sulfur supply in diploid wheat Triticum monococcum ssp. monococcum. Plant J. 2017, 91, 894–910. [Google Scholar] [CrossRef]
  35. Dhaka, V.; Khatkar, B. Effects of Gliadin/Glutenin and HMW-GS/LMW-GS Ratio on Dough Rheological Properties and Bread-Making Potential of Wheat Varieties. J. Food Qual. 2015, 38, 71–82. [Google Scholar] [CrossRef]
Figure 1. Total grain yield (g DW pot−1) in response to late application of N fertilizers (Control, LNlow, LNhigh) for two cultivars Rumor and Discus. Bars represent mean values ± SE (n = 3). Different small letters indicate significant differences between all treatment combinations (p ≤ 0.05); Two-way ANOVA results are shown in the upper right corner of the diagram. C: cultivar; N: different fertilizer treatment; CxN: Interaction between cultivar and different fertilizer treatment; *: significant effect.
Agriculture 09 00101 g001
Figure 2. Relative N uptake efficiency of grains (% of control) in response to late application of N fertilizers (Control, LNlow, LNhigh) for the two cultivars Rumor and Discus. Bars represent mean values ± SE (n = 3). Different small letters indicate significant differences between all treatment combinations (p ≤ 0.05).
Agriculture 09 00101 g002
Figure 3. Total protein concentration (% of dry weight) in response to late application of N fertilizers (Control, LNlow, LNhigh) for the two cultivars Rumor and Discus. Bars represent mean values ± SE (n = 3). Different small letters indicate significant differences between all treatment combinations (p ≤ 0.05). Two-way ANOVA results are shown in the upper right corner of the diagram. C: cultivar; N: different fertilizer treatment; CxN: Interaction between cultivar and different fertilizer treatment; ns: not significant; *: significant effect.
Agriculture 09 00101 g003
Figure 4. Baking volume [ml] in response to late N fertilization (Control, LNlow, LNhigh) for the two cultivars Rumor and Discus. Bars represent mean values ± SE (n = 3). Different small letters indicate significant differences between all treatment combinations (p ≤ 0.05). Two-way ANOVA results are shown in the upper right corner. C: cultivar; N: different fertilizer treatment; CxN: Interaction between cultivar and different fertilizer treatment. ns: not significant; *: significant effect. Representative pictures of mini-loaf produced by the micro baking test for Discus are shown at the bottom of the graph.
Agriculture 09 00101 g004
Table 1. Timing and amount of N-fertilization of the three treatments (g N pot−1, provided as ammonium nitrate).
N Supply (g N per pot)
TreatmentsBefore SowingEC 32EC 49
control0.70.50.01.2
LNlow0.70.50.31.5
LNhigh0.70.50.51.7
Application times are indicated according to the BBCH scale (EC 32: 2nd node detectable; EC 49: first awns visible; LN = late nitrogen supply).
Table 2. Relative concentrations of individual protein fractions (% of control) in response to late N fertilization for the two cultivars Rumor and Discus based upon the protein concentration derived from Bradford assay.
CultivarRumorDiscus
TreatmentsControlLNlowLNhighControlLNlowLNhigh
Albumin/Globulin100 c107.7 b114.1 a100 c108.5 b109.9 b
Gliadin100 c118.9 b120.8 ab100 c114.2 b123.5 a
Glutenin100 c179.6 b182.0 b100 c179.9 b191.1 a
Gliadin/Glutenin0.35 ab0.23 b0.23 b0.40 a0.25 b0.26 b
Different small letters within rows indicate significant differences between all treatment combinations (p ≤ 0.05).
Table 3. Relative protein concentration (% of total lane intensity) of gliadin bands in response to late N fertilization for the two cultivars Rumor and Discus.
Band NoSub-FractionRumorDiscus
Treatments
MWControlLNlowLNhigh MWControlLNlowLNhigh
1ω–gliadin59.34.35.94.9 58.94.4 C7.0 B9.4 A
253.71.0 b1.0 b1.4 a ------
348.41.2 b1.2 b2.1 a ------
445.00.90.71.0 45.90.30.40.5
543.34.85.95.0 43.93.14.46.4
640.81.2 a0.6 b0.7 b40.30.9 B1.7 A2.0 A
7γ-gliadin35.08.0 a3.7 b4.2 b35.17.25.35.2
832.419.117.916.0 32.917.717.315.7
930.80.3 b2.8 a2.8 a30.67.37.68.0
10α/β-gliadin28.92.62.72.6 28.811.411.311.5
1127.023.123.725.6 27.420.220.819.0
1225.20.50.40.3 25.50.80.60.5
1324.19.99.610.6 24.53.83.83.5
14 ------ 23.91.0 A1.1 A0.6 B
1523.18.59.410.0 23.38.97.48.9
1618.211.210.18.2 18.69.47.66.5
1718.02.73.83.2 18.43.1 A2.8 A1.9 B
1817.90.70.91.3 18.20.40.90.5
Total: 100100100 100100100
For each cultivar, different letters within rows indicate significant differences (p < 0.05). For clarity, significant effects are shown in bold, and no letters are shown for non-significant effects. ↑: up-regulated; ↓: down- regulated; --: not-regulated. #: band number.
Table 4. Relative distribution of the gliadin subunits (% of total gliadins) in response to late N application (Control, LNlow, LNhigh) for the two cultivars Rumor and Discus.
CultivarRumorDiscus
TreatmentsControlLNlowLNhighControlLNlowLNhigh
ω-gliadin13.4 cb15.2 b15.2 b8.8 d13.4 cb18.4 a
γ-gliadin27.4 abc24.3 bc23.0 c32.2 a30.2 ab28.9 ab
α/β-gliadin59.3 ab60.5 a61.9 a59.1 ab56.4 bc52.7 c
Total100100100100100100
Different small letters within rows indicate significant differences between all treatment combinations (p ≤ 0.05).
Table 5. Relative protein concentration (% of total lane intensity) of glutenin bands in response to late N fertilization for the two cultivars Rumor and Discus.
Band NoSub-Fraction RumorDiscus
Treatments
# MWControlLNlowLNhigh MWControlLNlowLNhigh
1HMW110.118.718.618.1 109.414.8 B19.9 A20.7 A
2103.47.67.77.9 102.68.7 B10.2 A10.1 A
383.85.5 b8.2 a8.0 a84.87.97.47.3
478.514.214.815.0 78.416.015.715.6
5LMW-D58.90.41.00.9 58.70.3 B1.4 A1.7 A
6LMW-B39.00.91.11.2 39.00.6 C1.7 B2.6 A
738.13.0 a1.9 b2.0 b38.52.1 A1.3 B1.7 AB
834.023.922.622.8 34.024.8 A20.7 B20.2 B
932.86.45.85.7 32.96.2 A4.9 B4.4 B
10LMW-C28.70.50.90.9 28.90.81.11.2
1126.615.212.713.1 27.413.811.510.9
1224.13.74.54.4 23.84.04.23.6
Total: 100100100 100100100
For each cultivar, different letters within rows indicate significant differences (p < 0.05). For clarity, significant effects are shown in bold, and no letters are shown for non-significant effects. ↑: up-regulated; ↓: down- regulated; --: not-regulated. #: band number.
Table 6. Relative distribution of the glutenin subunits (% of total glutenins) in response to late N application (Control, LNlow, LNhigh) for the two cultivars Rumor and Discus.
CultivarRumorDiscus
TreatmentsControlLNlowLNhighControlLNlowLNhigh
HMW46.0 b49.4 ab49.0 ab47.4 b53.2 a53.7 a
LMW D-type0.4 b1.0 ab0.9 ab0.3 b1.4 a1.7 a
LMW B-type34.3 a31.5 ab31.7 ab33.7 a28.5 b28.9 b
LMW C-type19.4 a18.2 ab18.4 ab18.6 ab16.8 ab15.8 b
Total100100100100100100
HMW/LMW0.85 b0.97 ab0.96 ab0.90 b1.14 a1.16 a
Different small letters within rows indicate significant differences between all treatment combinations (p ≤ 0.05).

