Sensitivity and Recovery of Grain Sorghum to Simulated Drift Rates of Glyphosate, Glufosinate, and Paraquat


 ,
,
Abstract
:1. Introduction
2. Materials and Methods
3. Results and Discussion
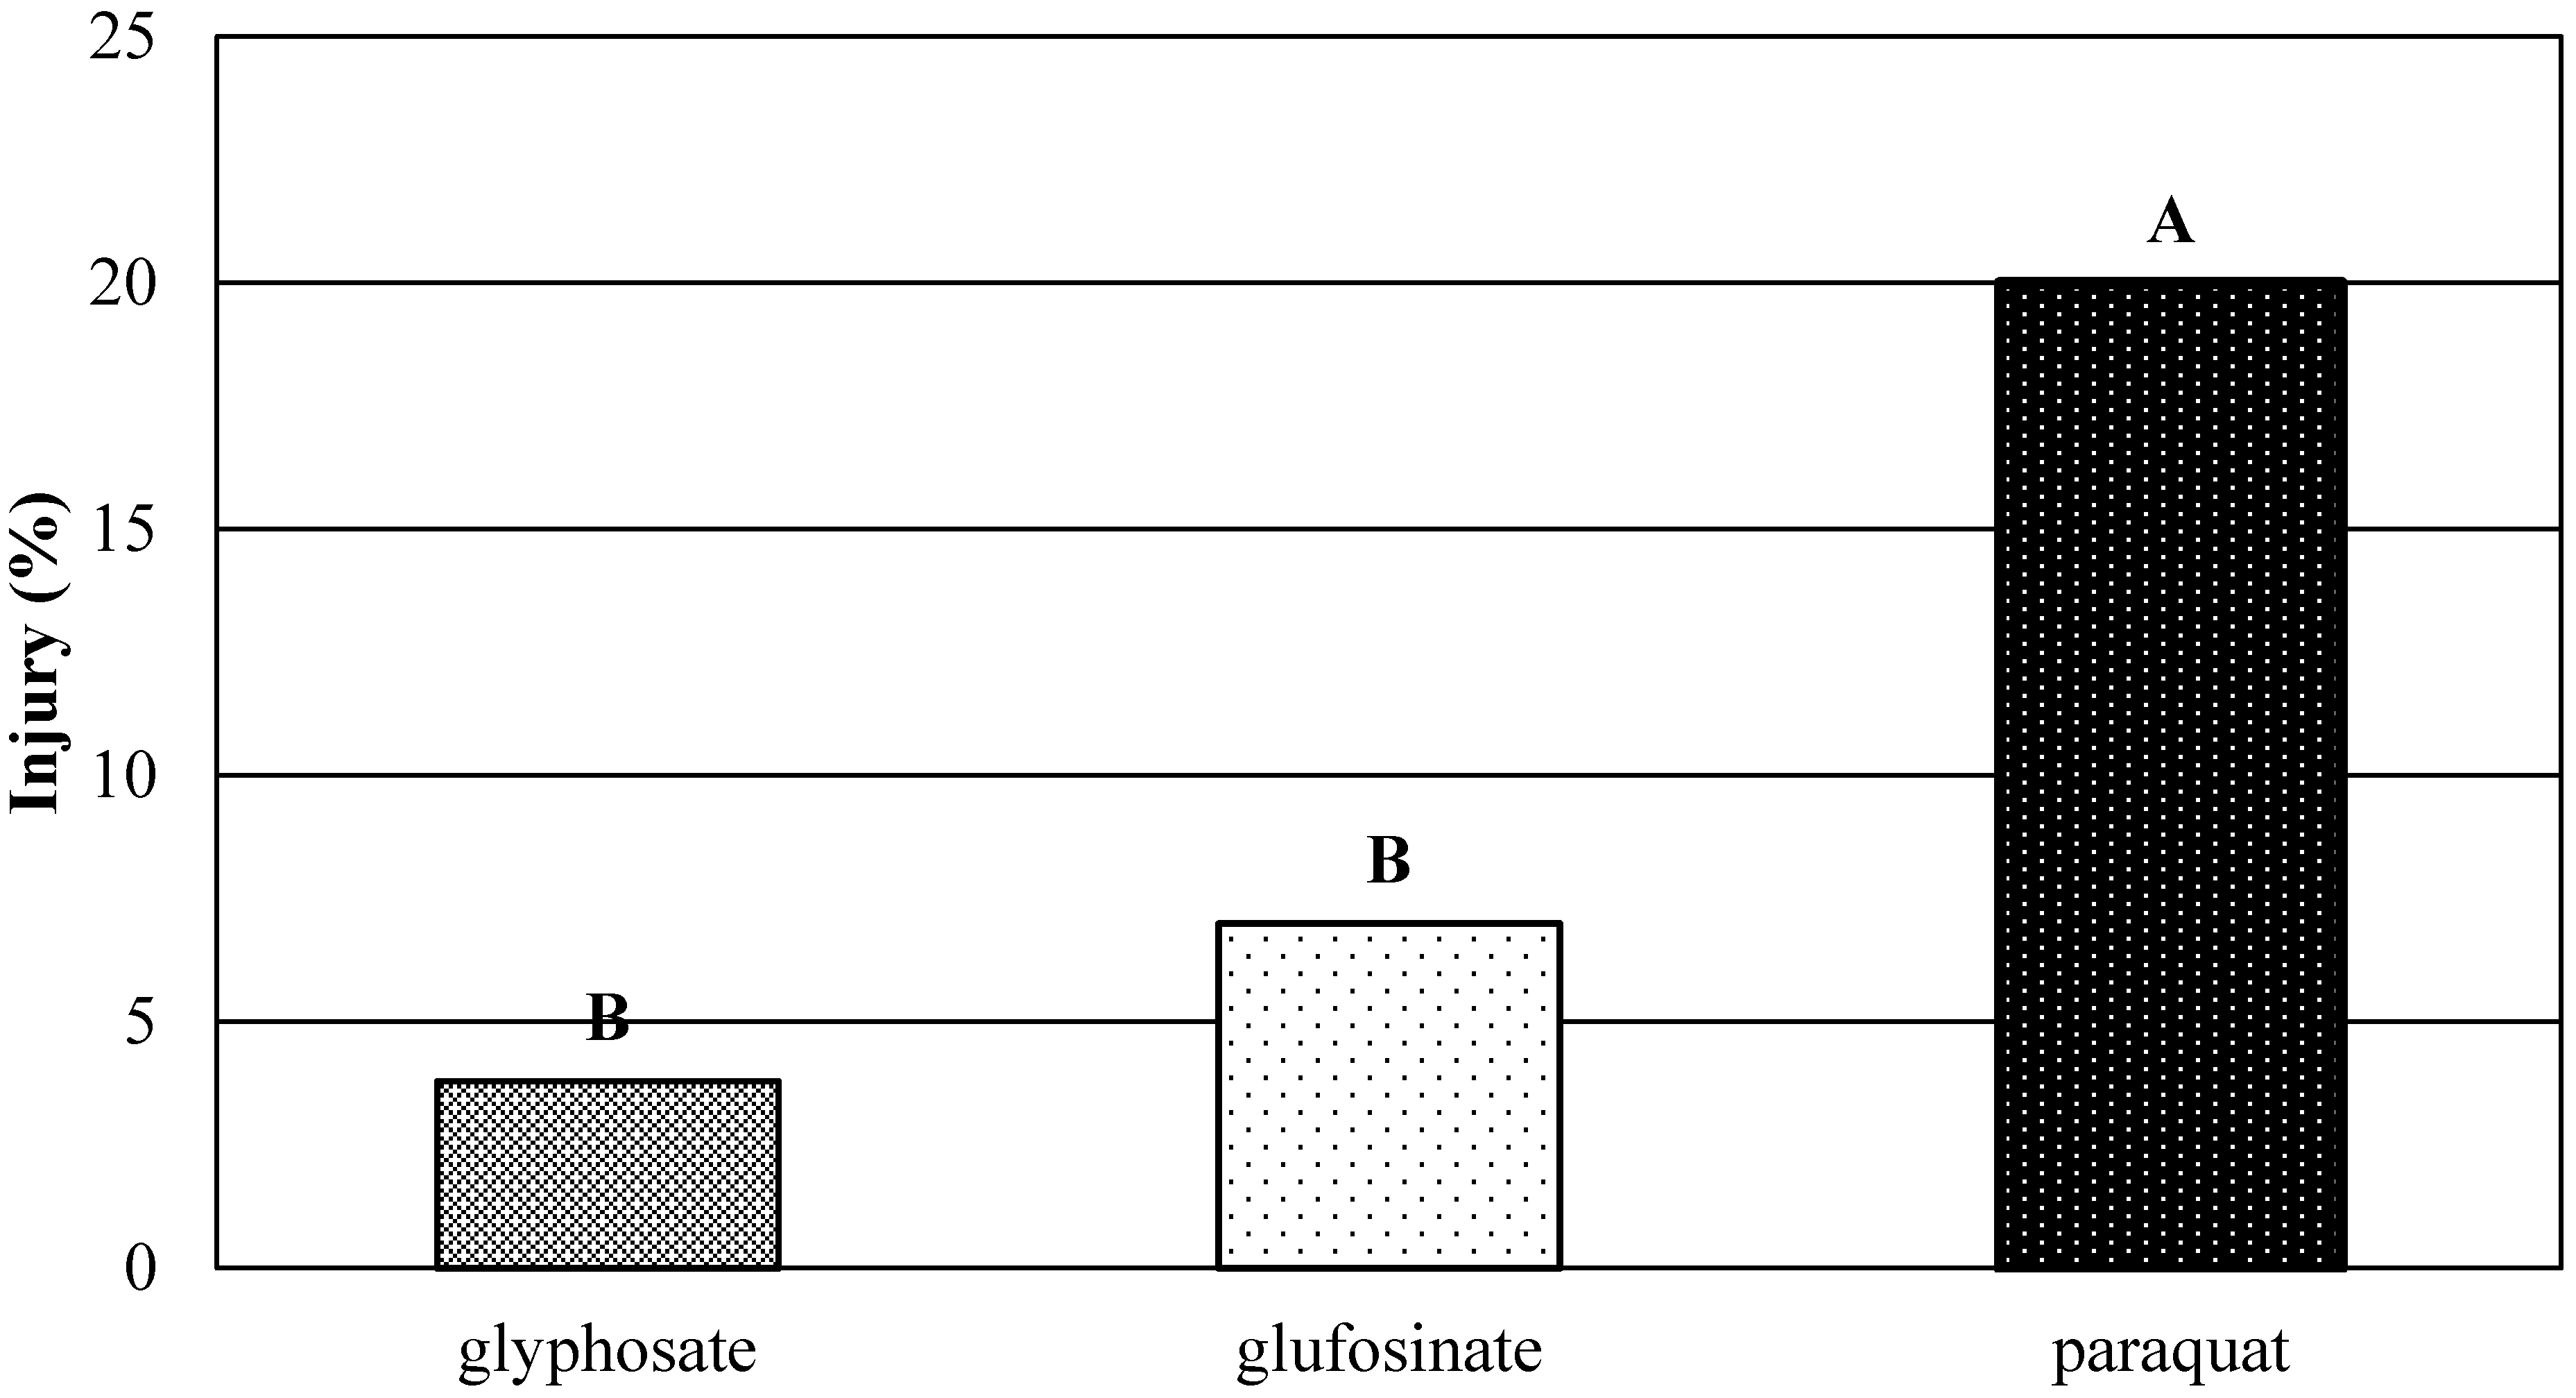
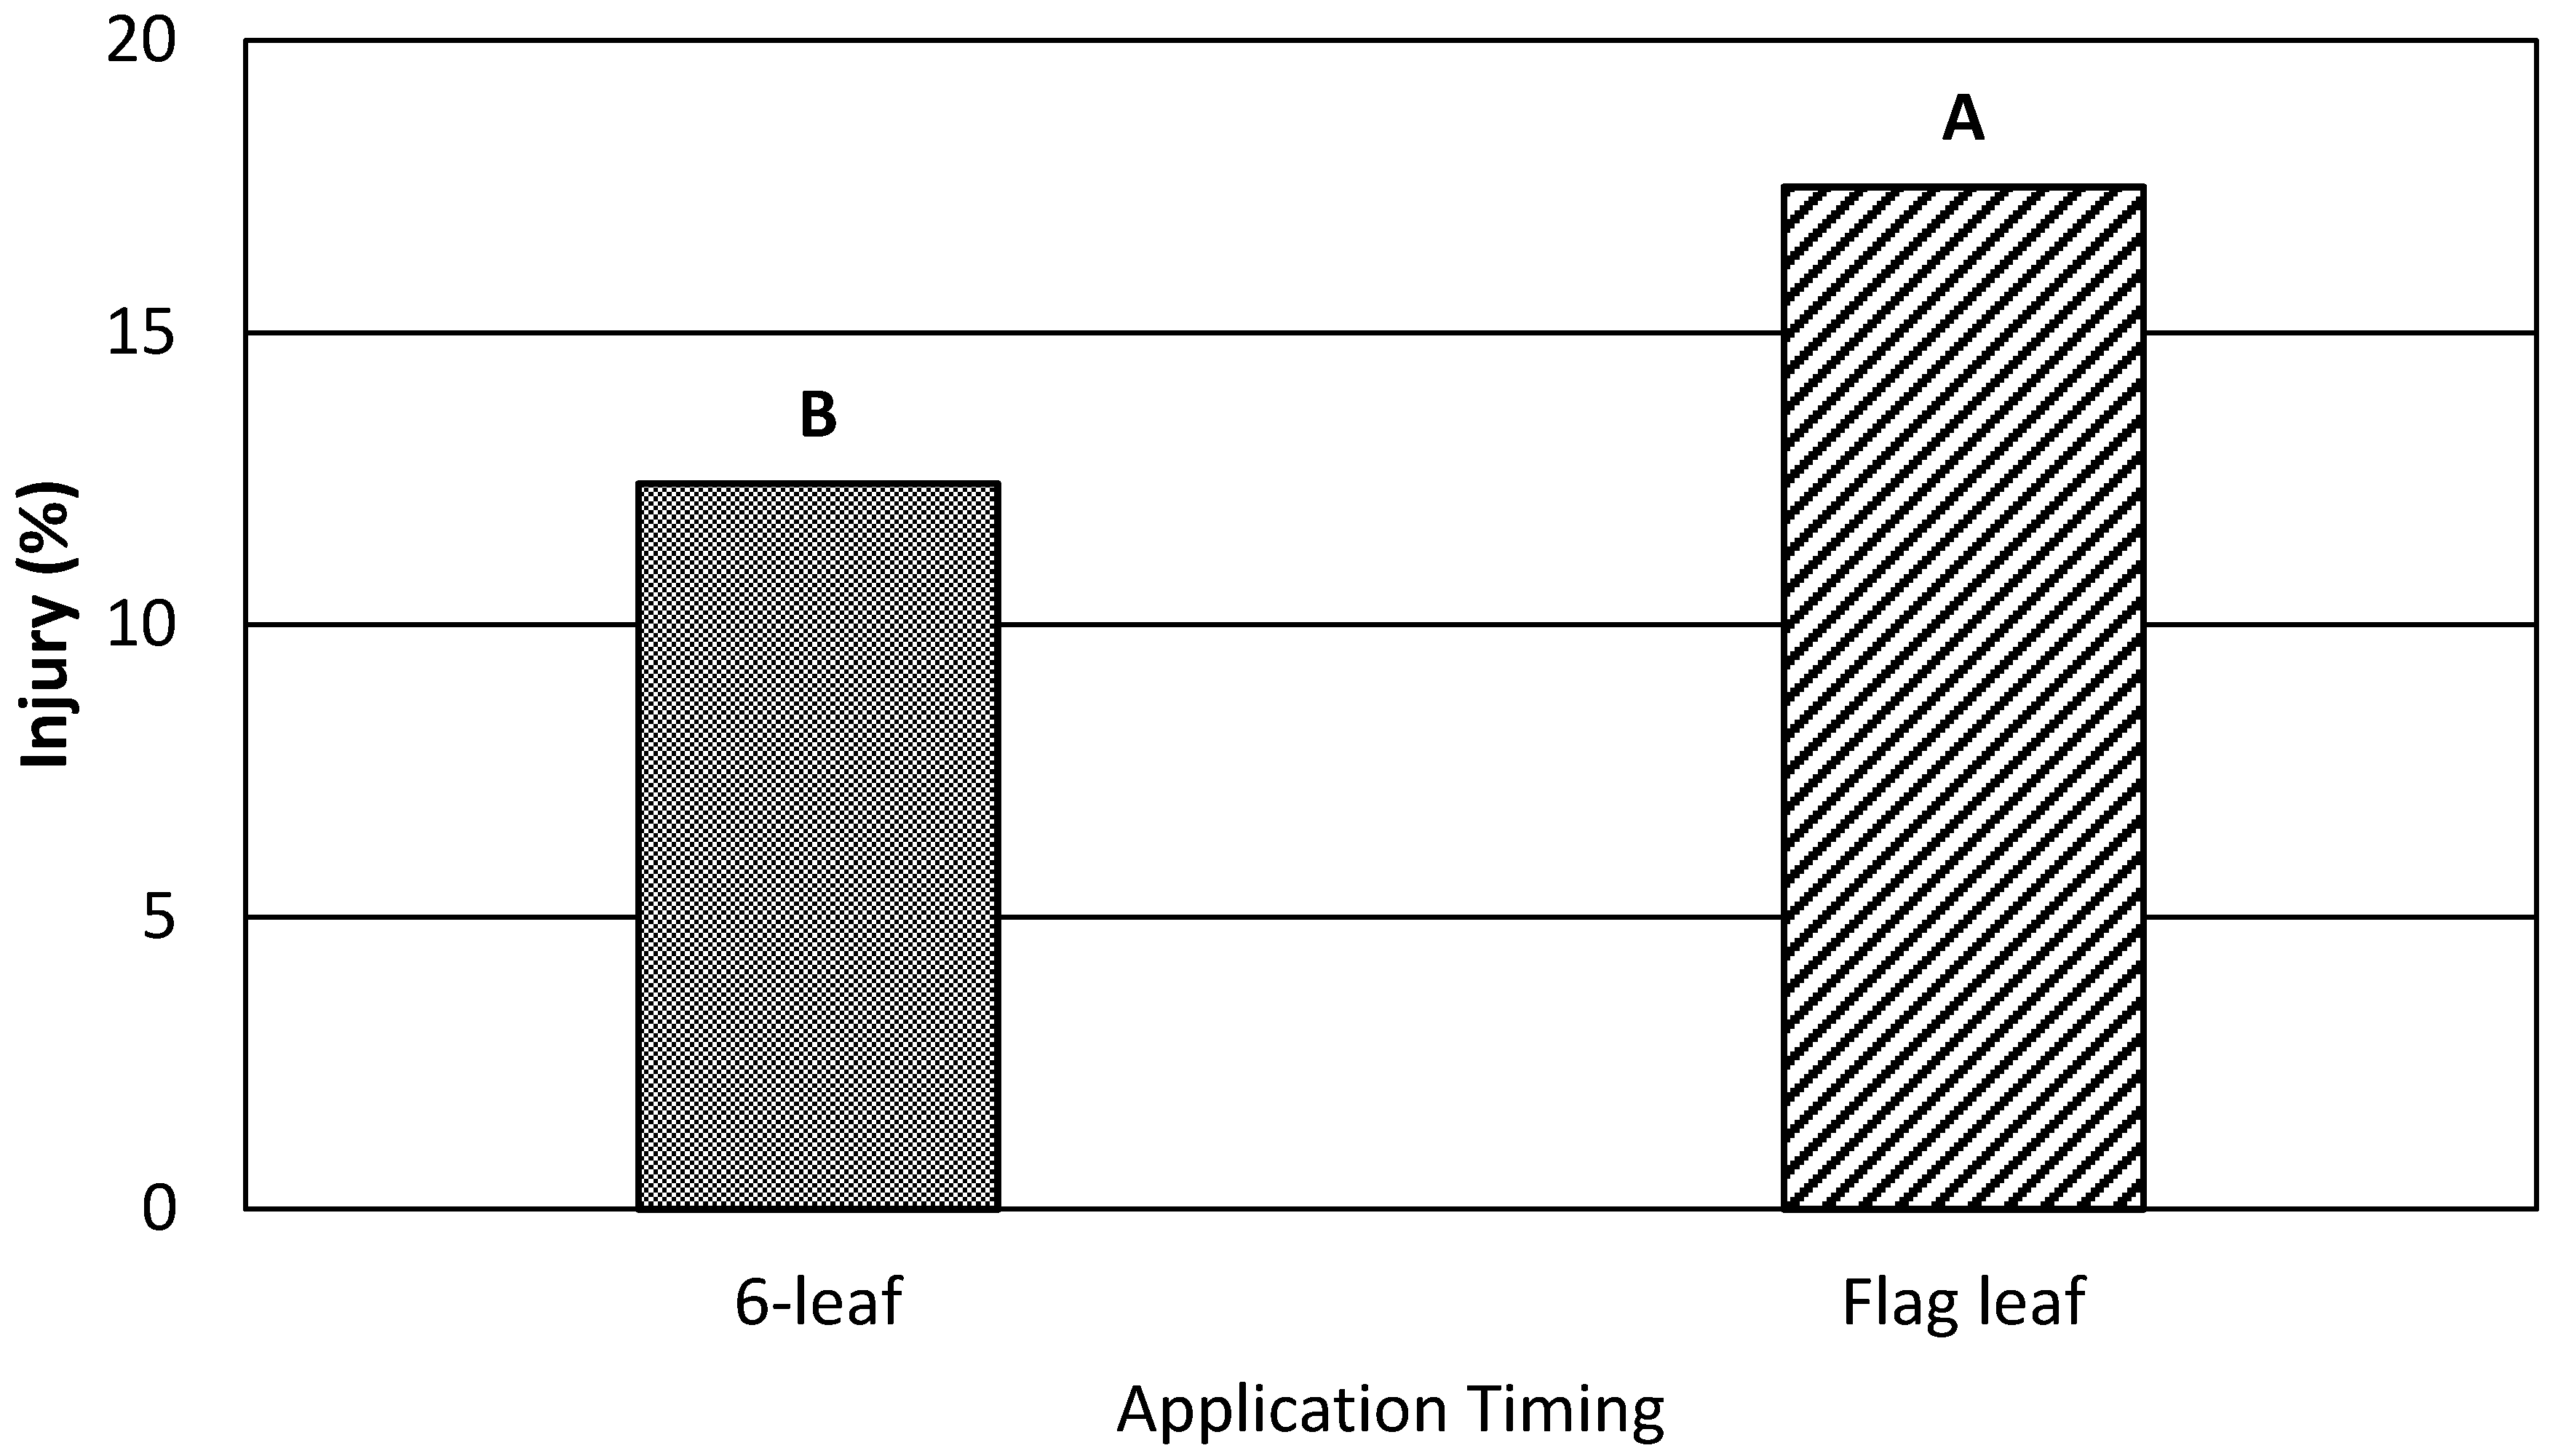
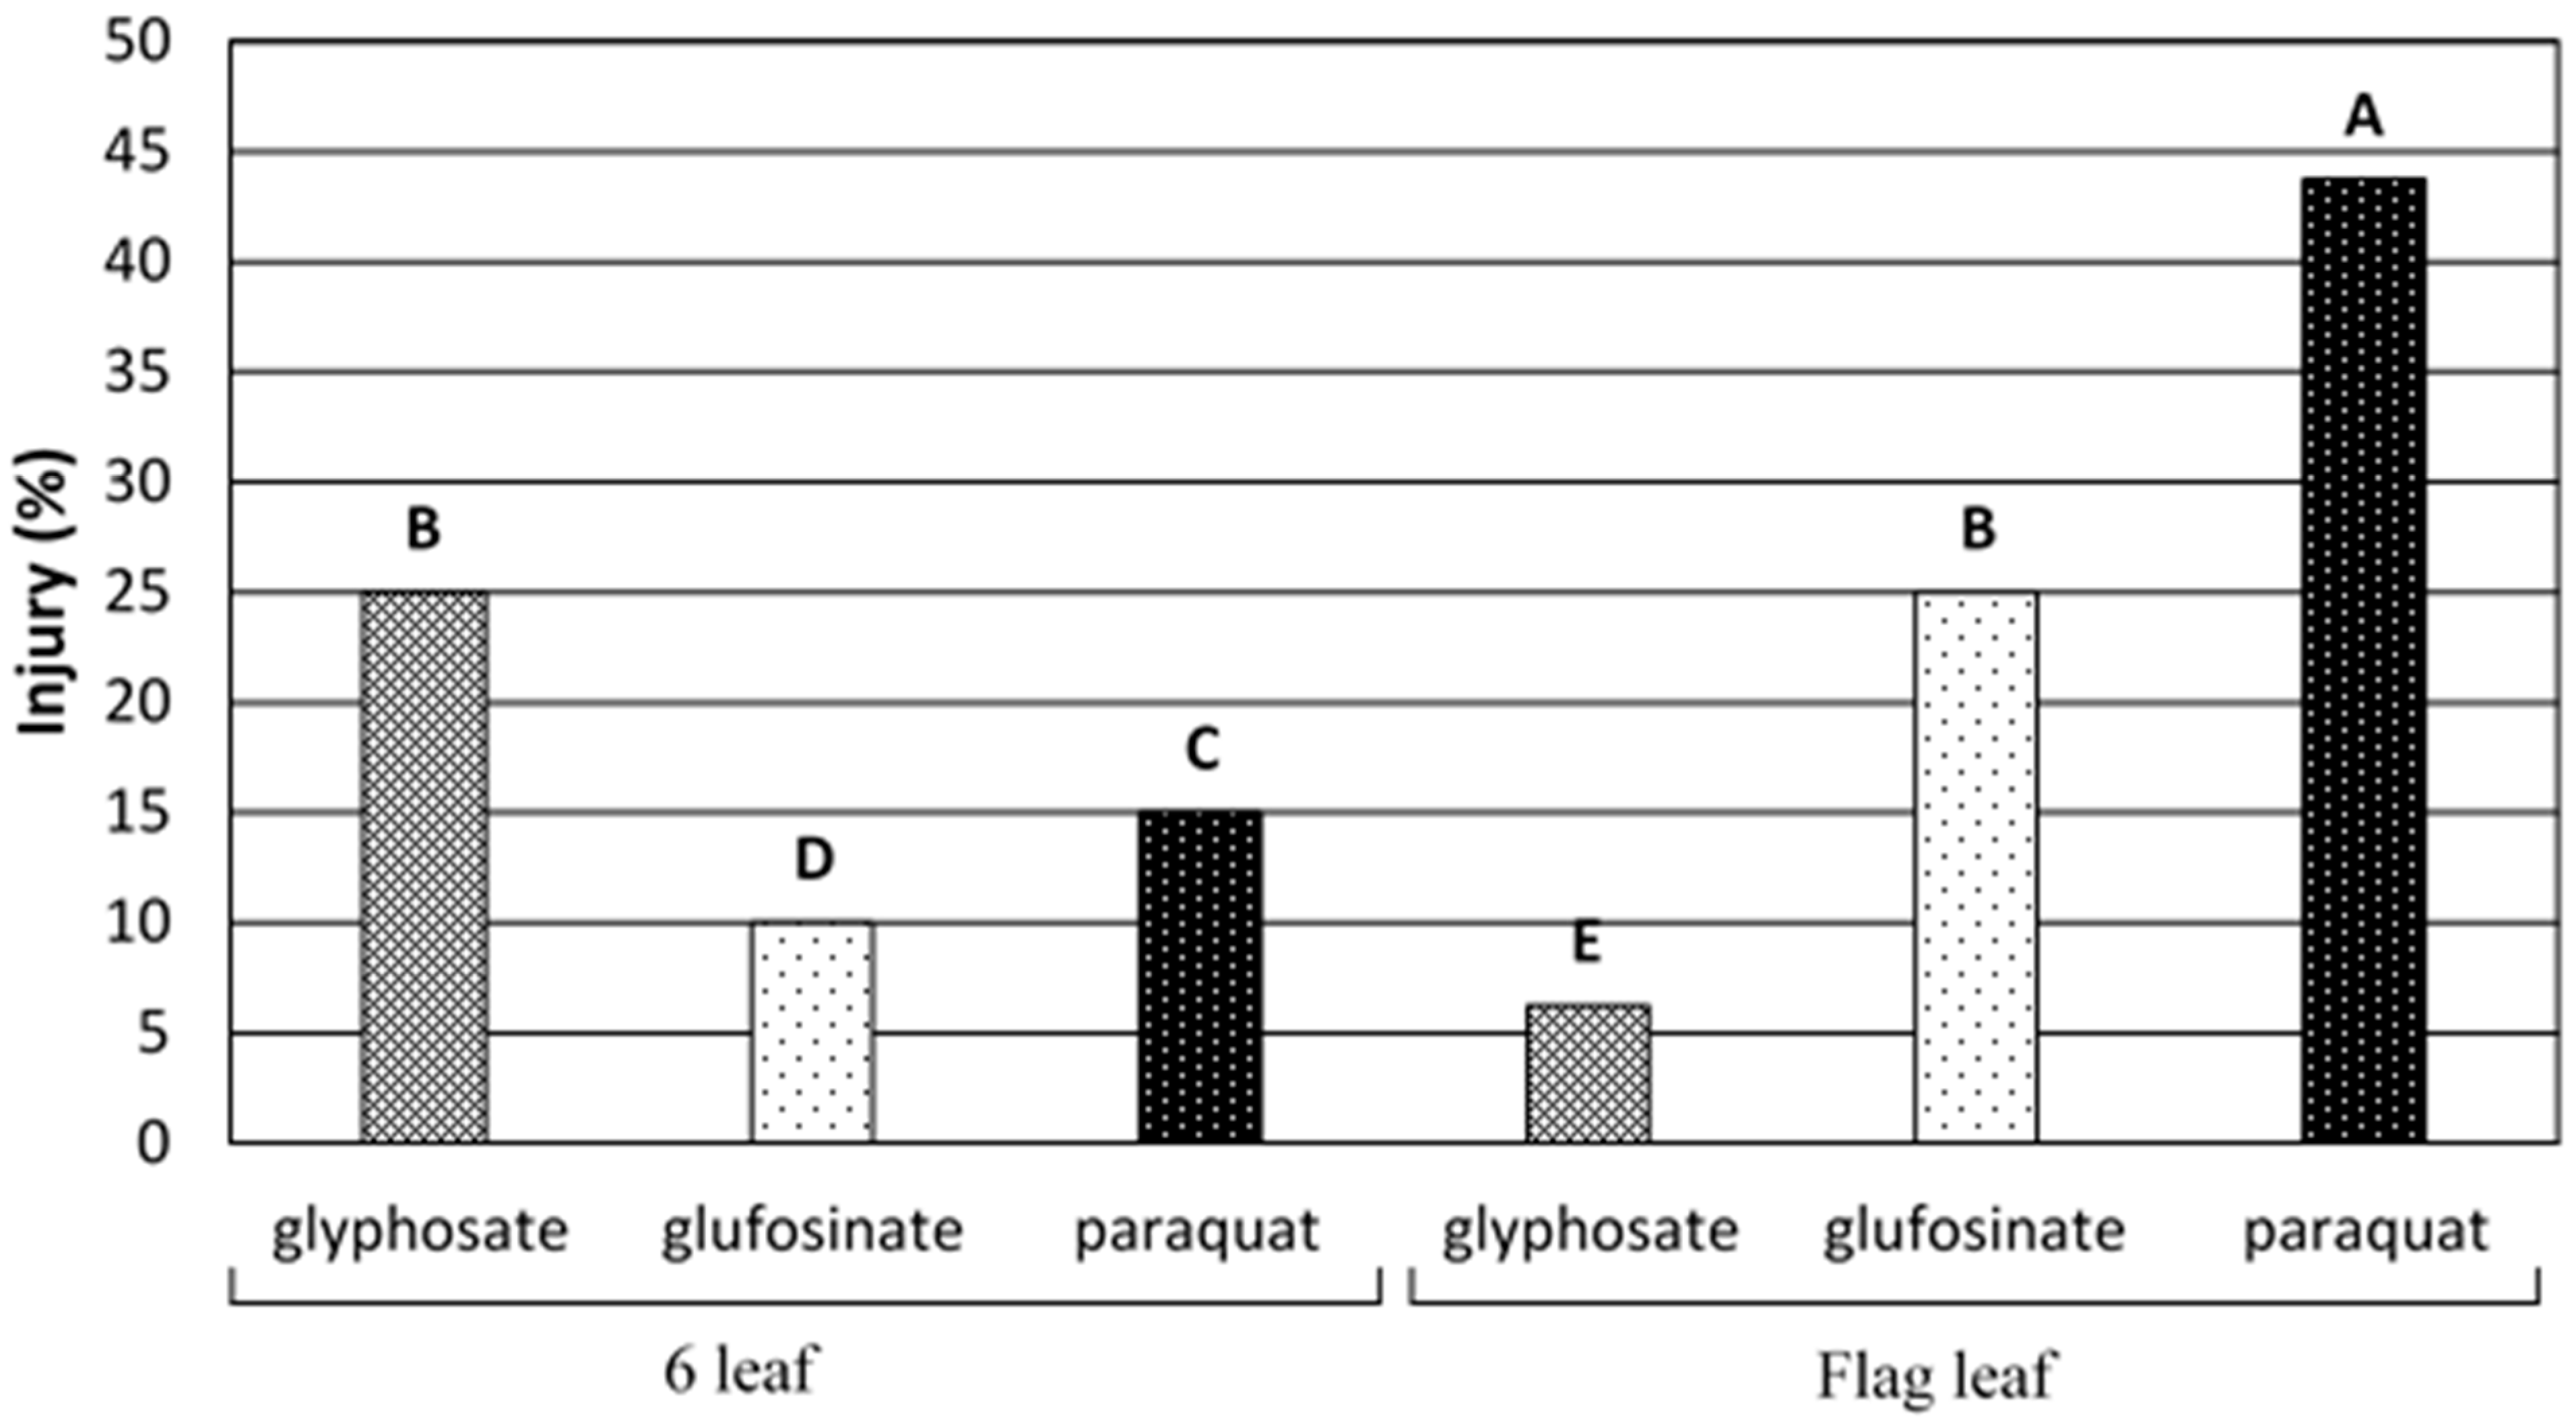
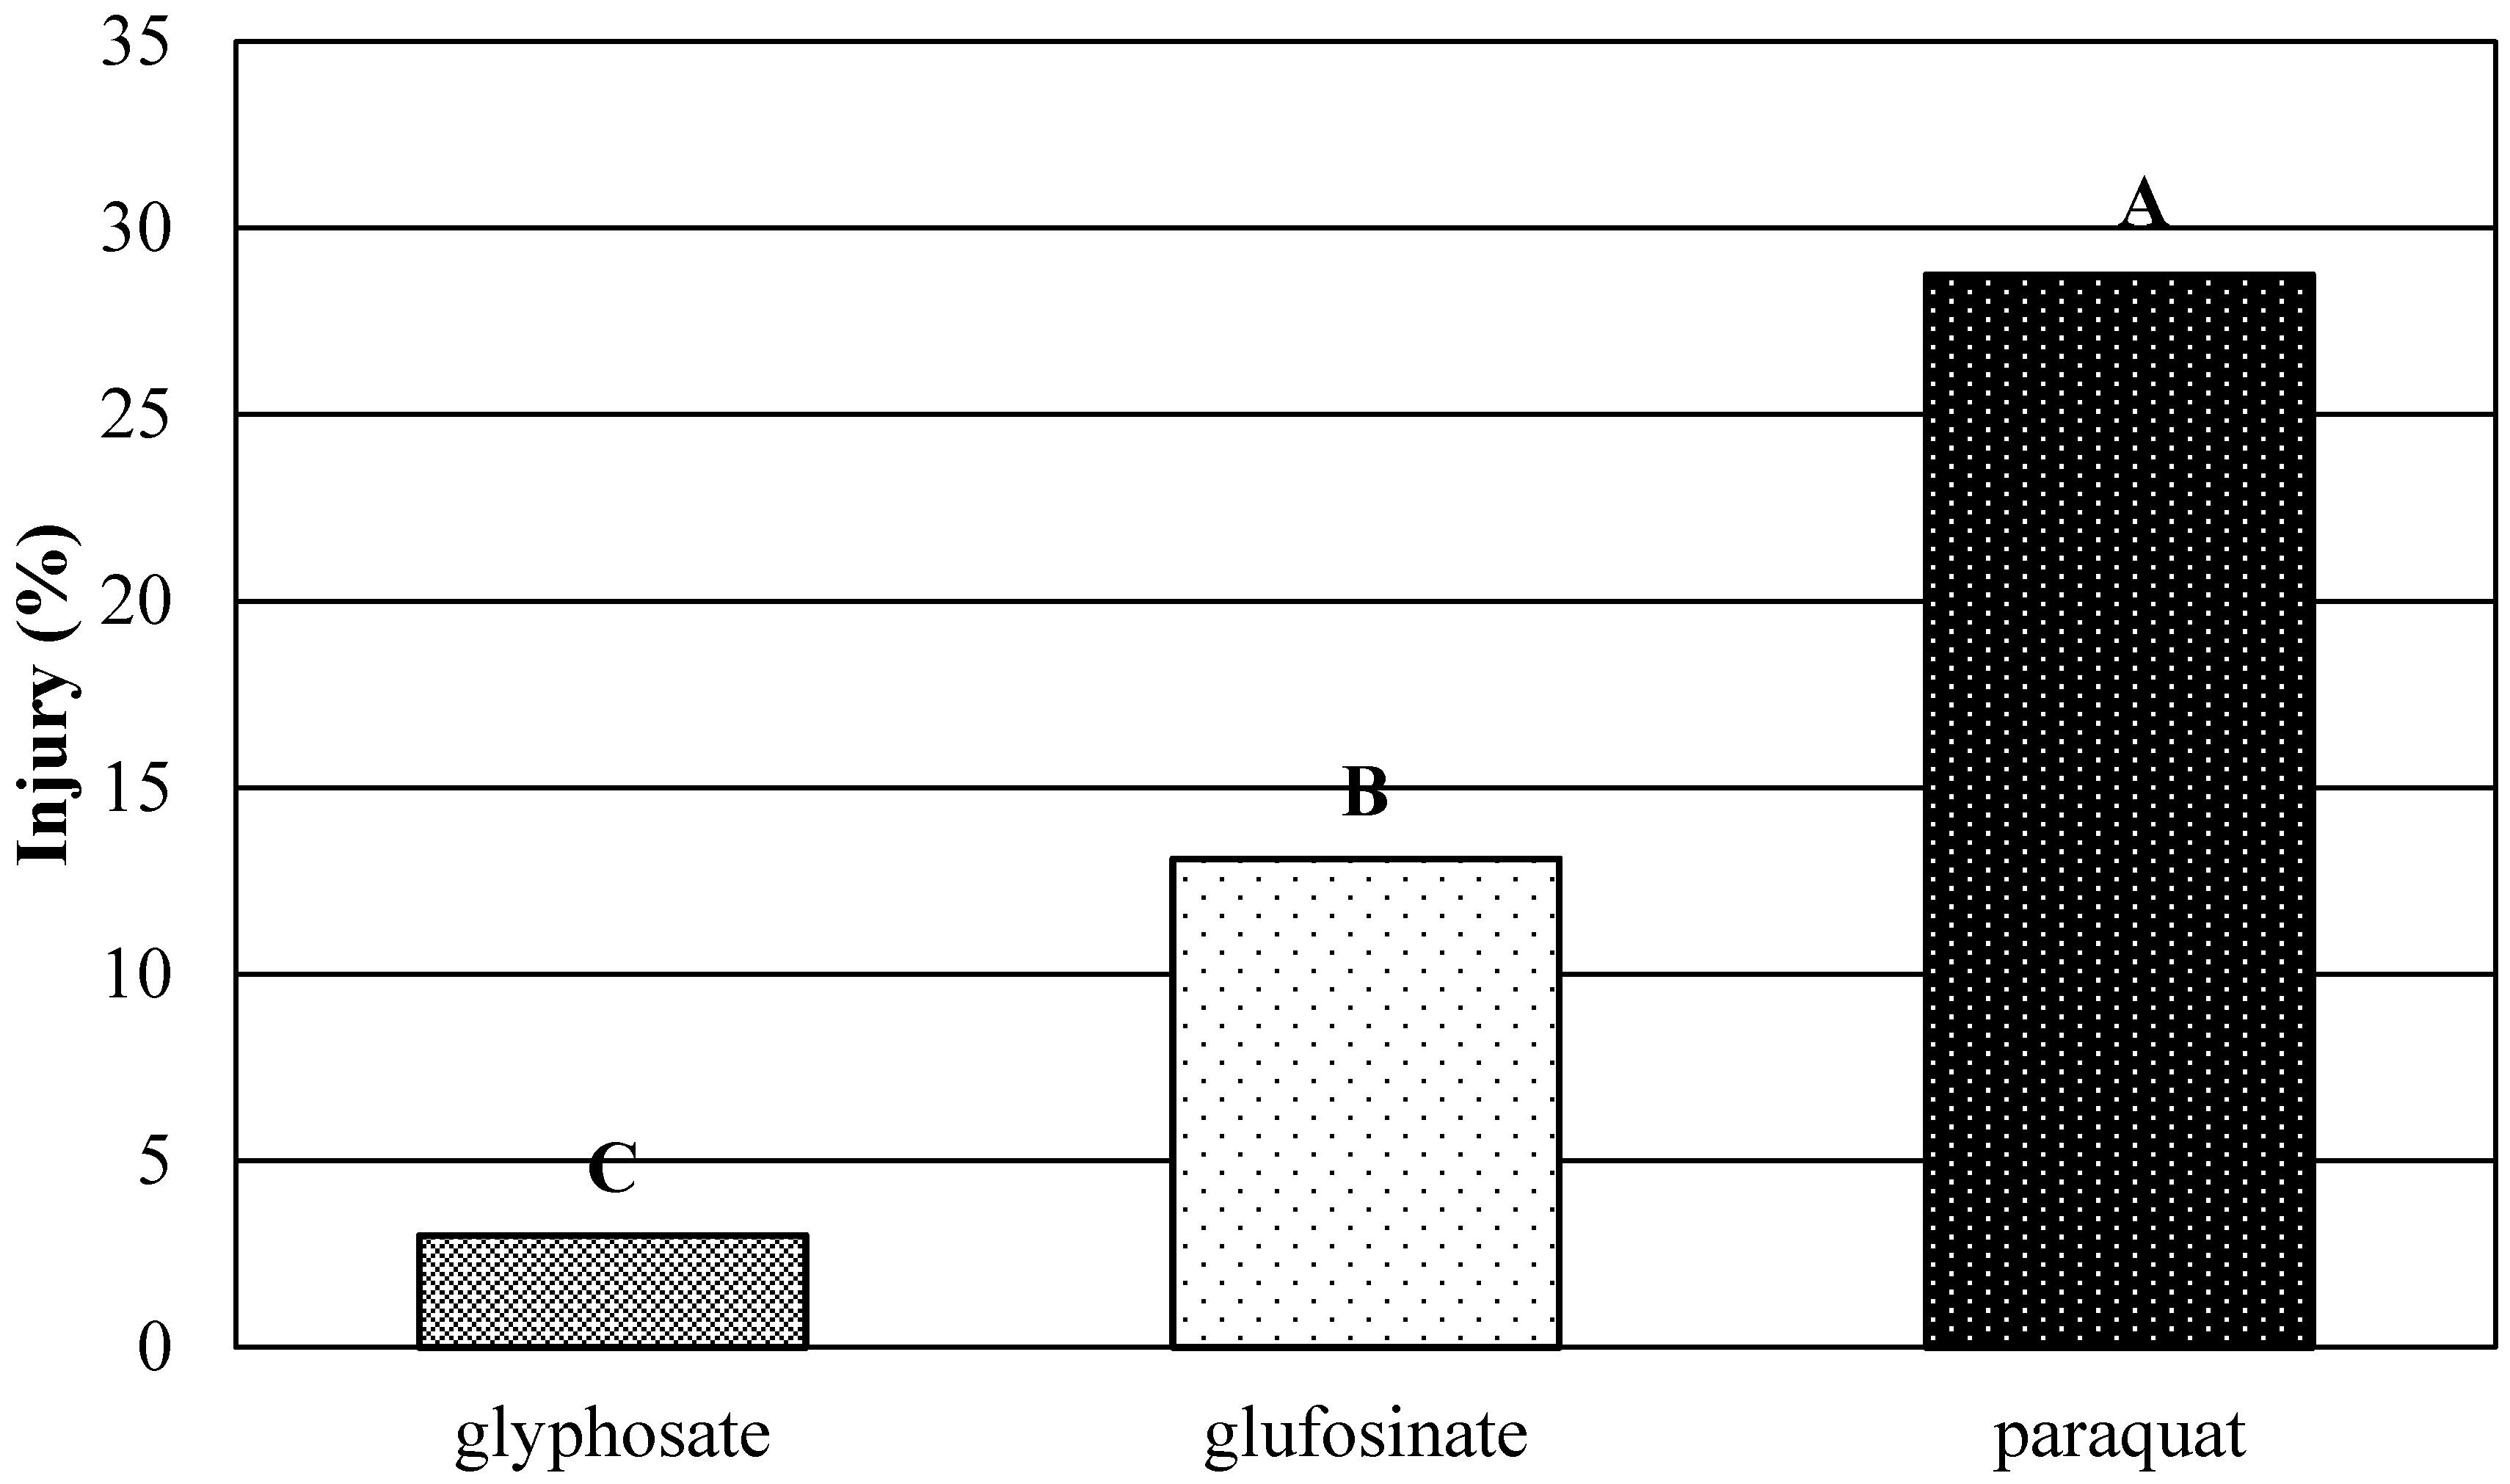
3.1. 2017
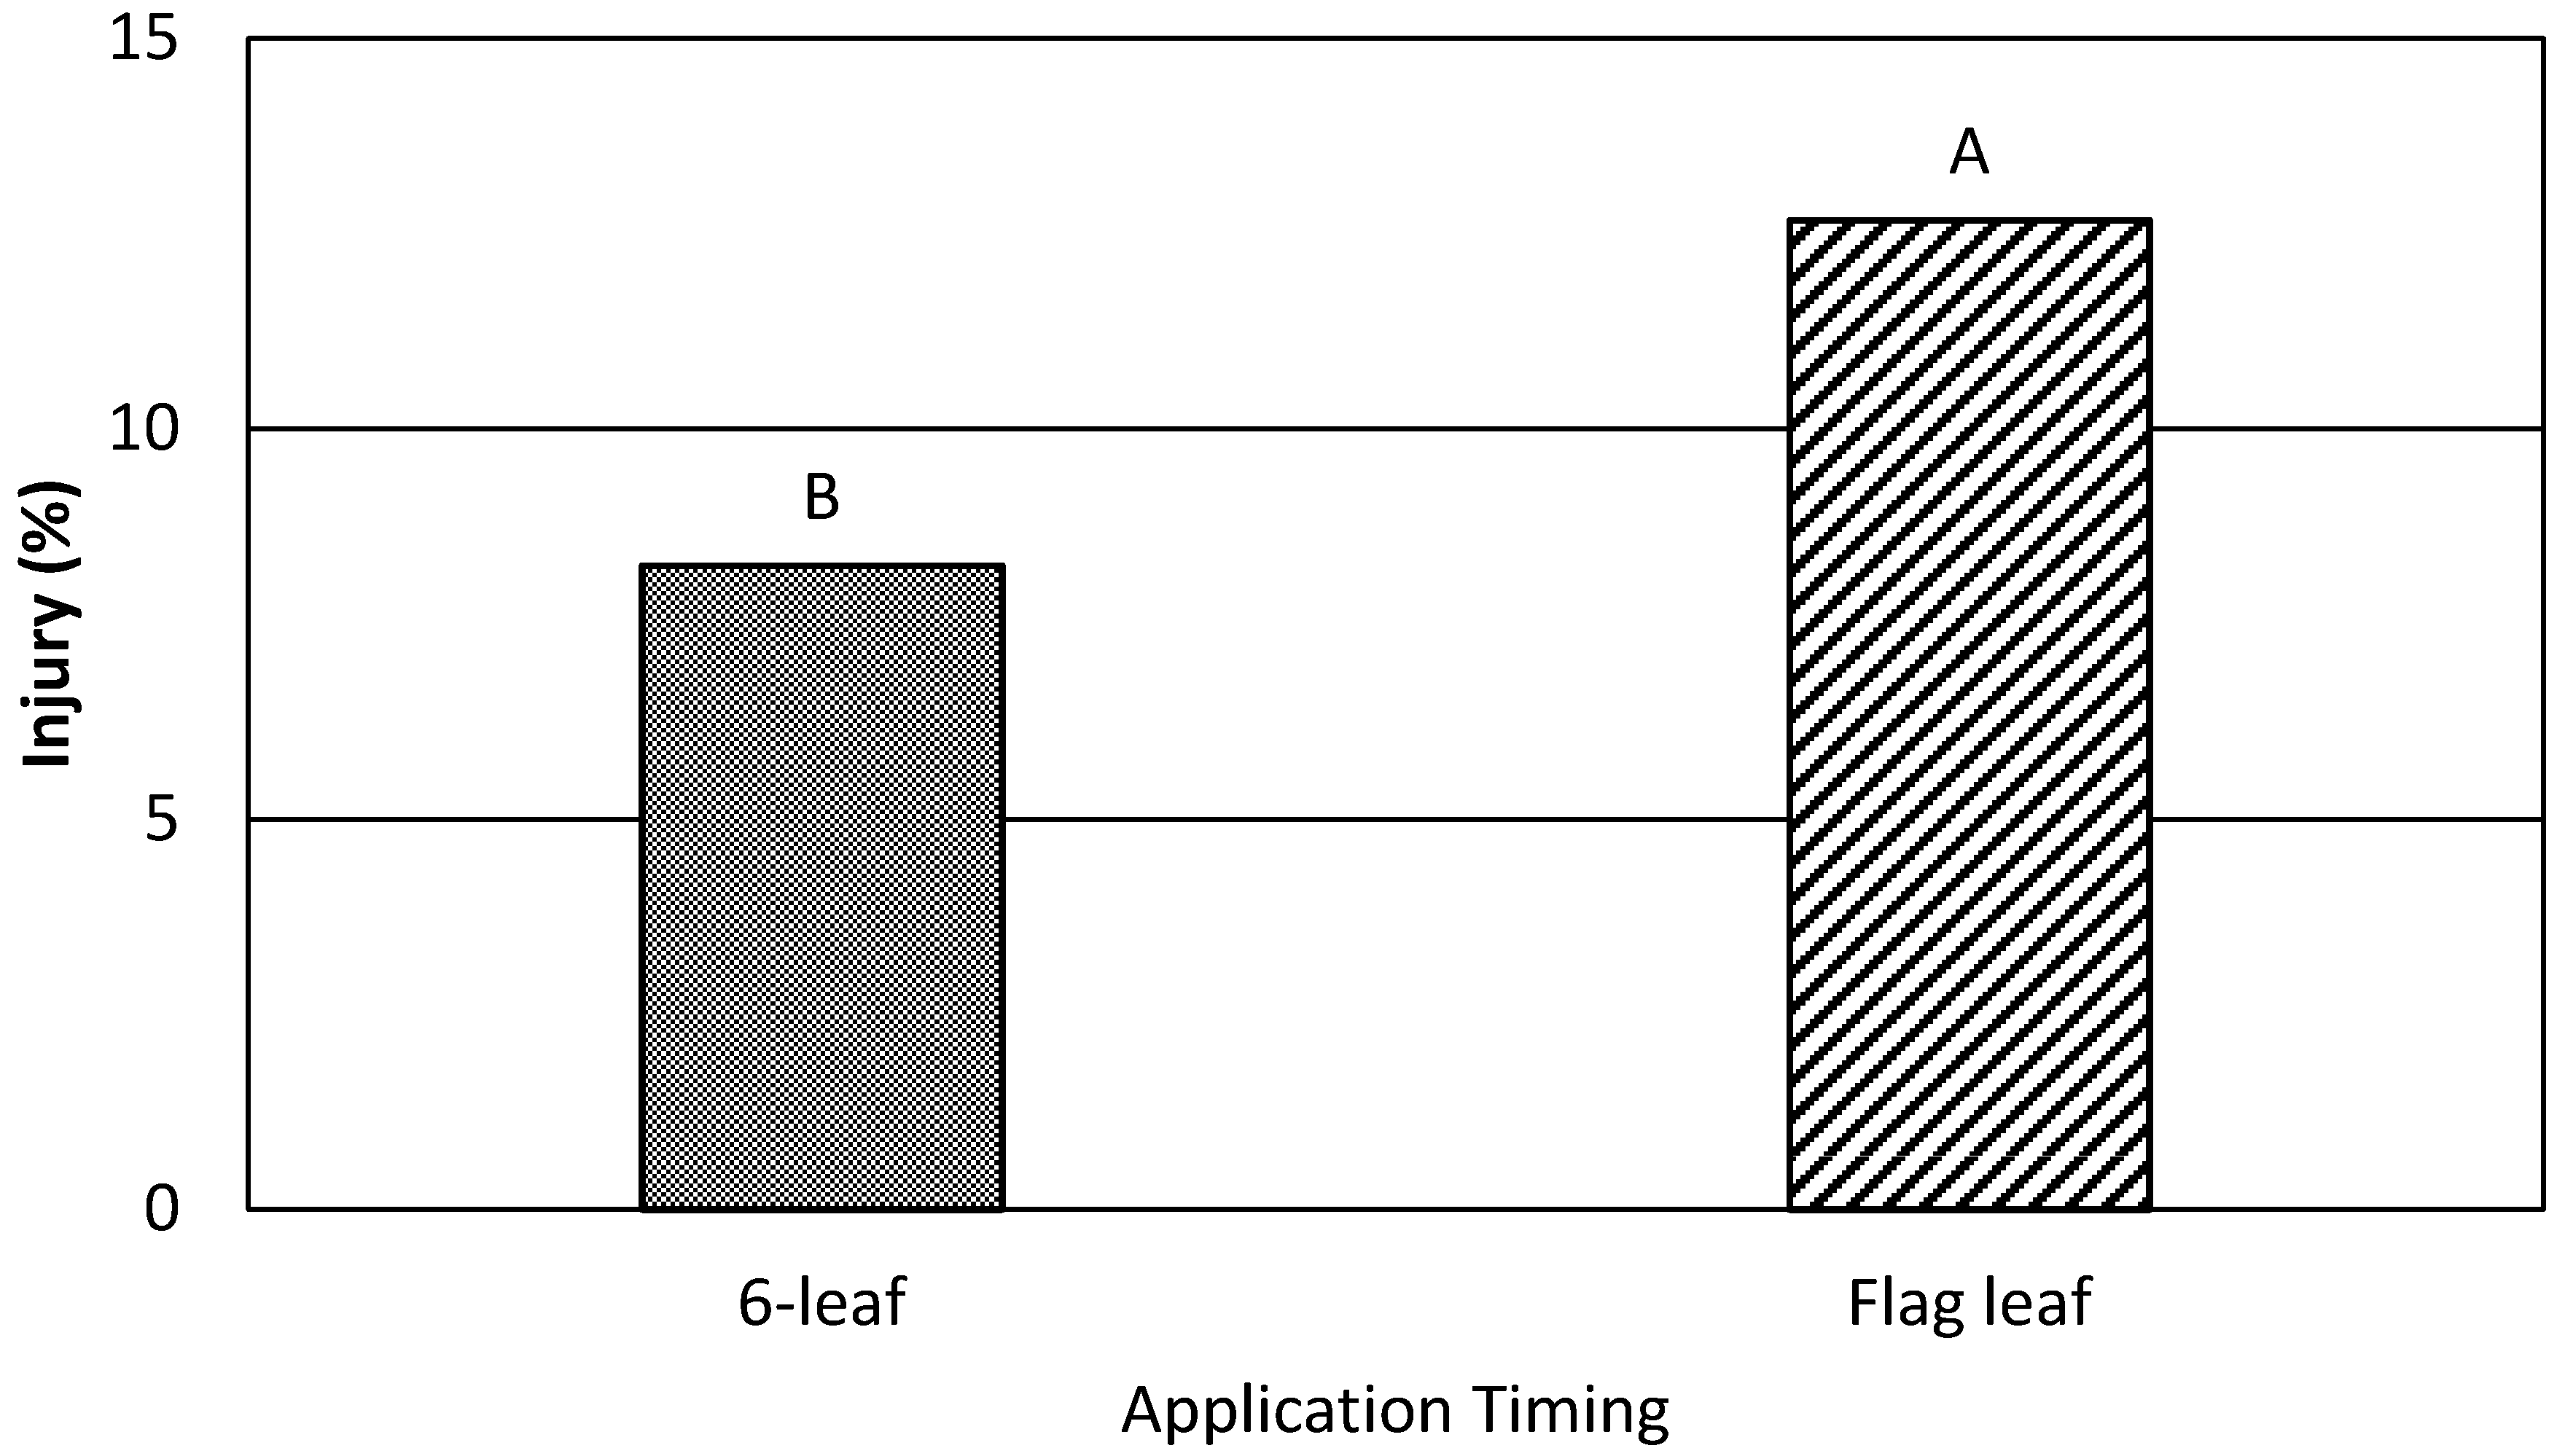
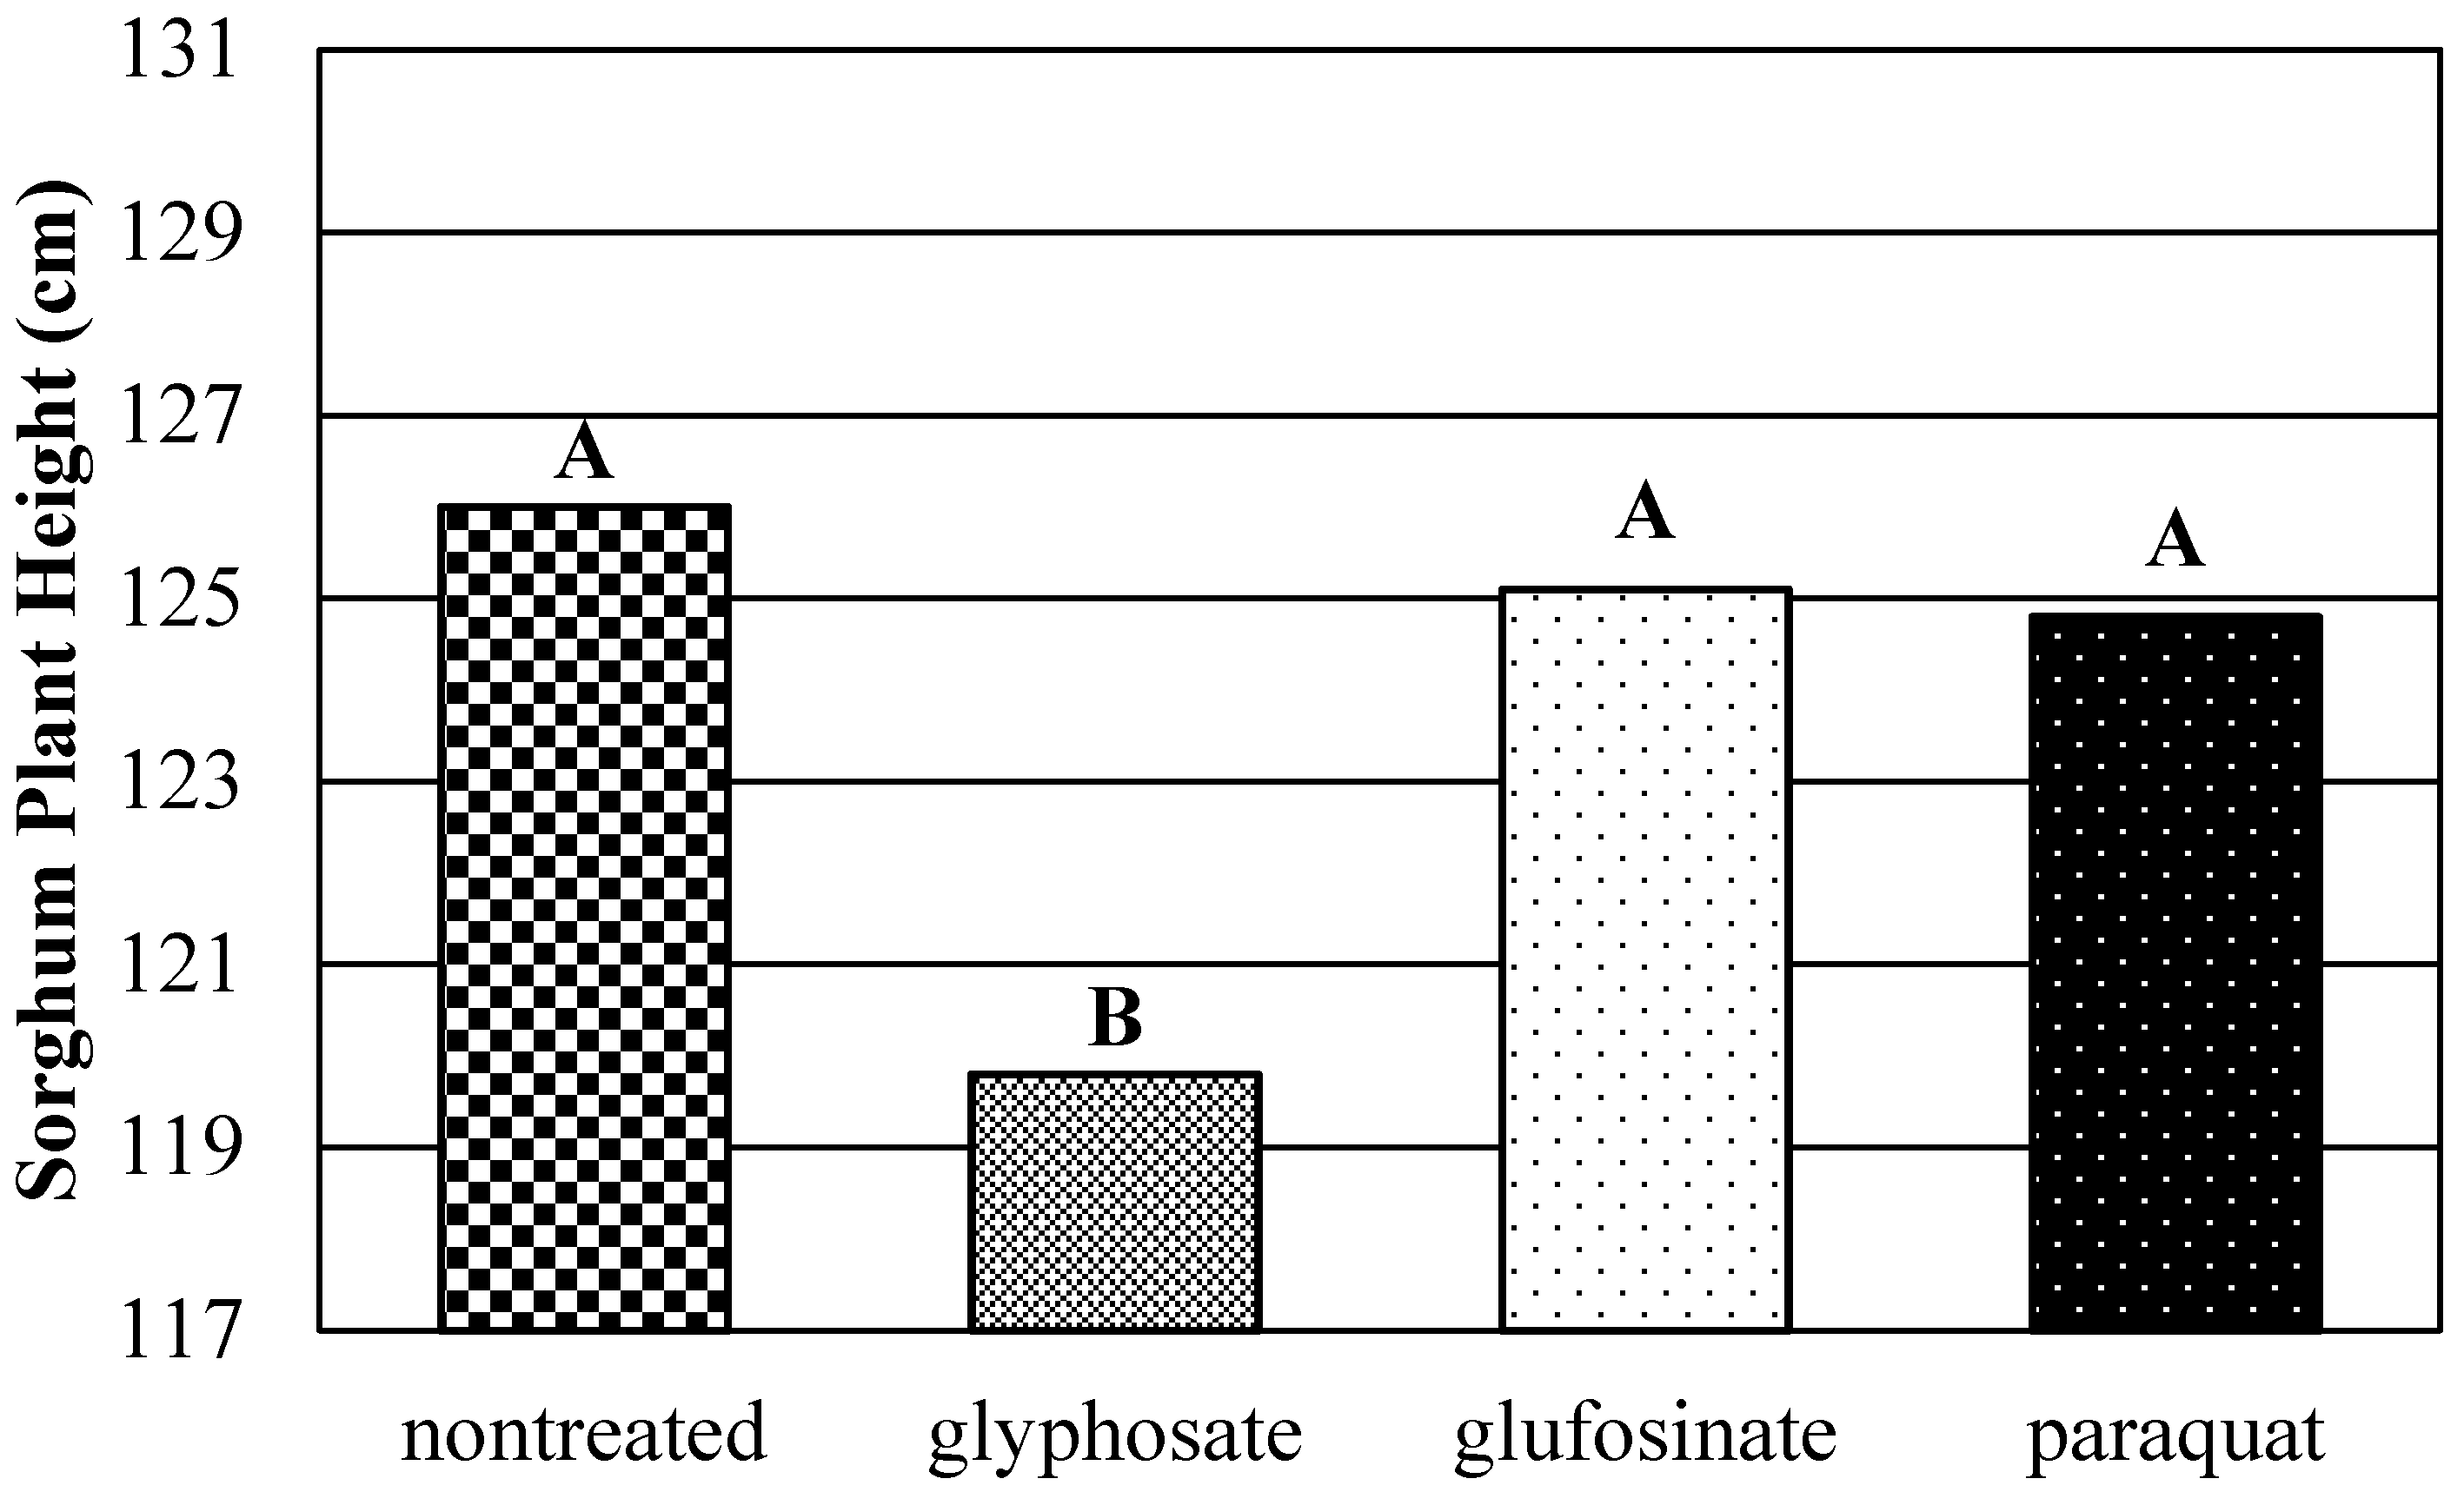
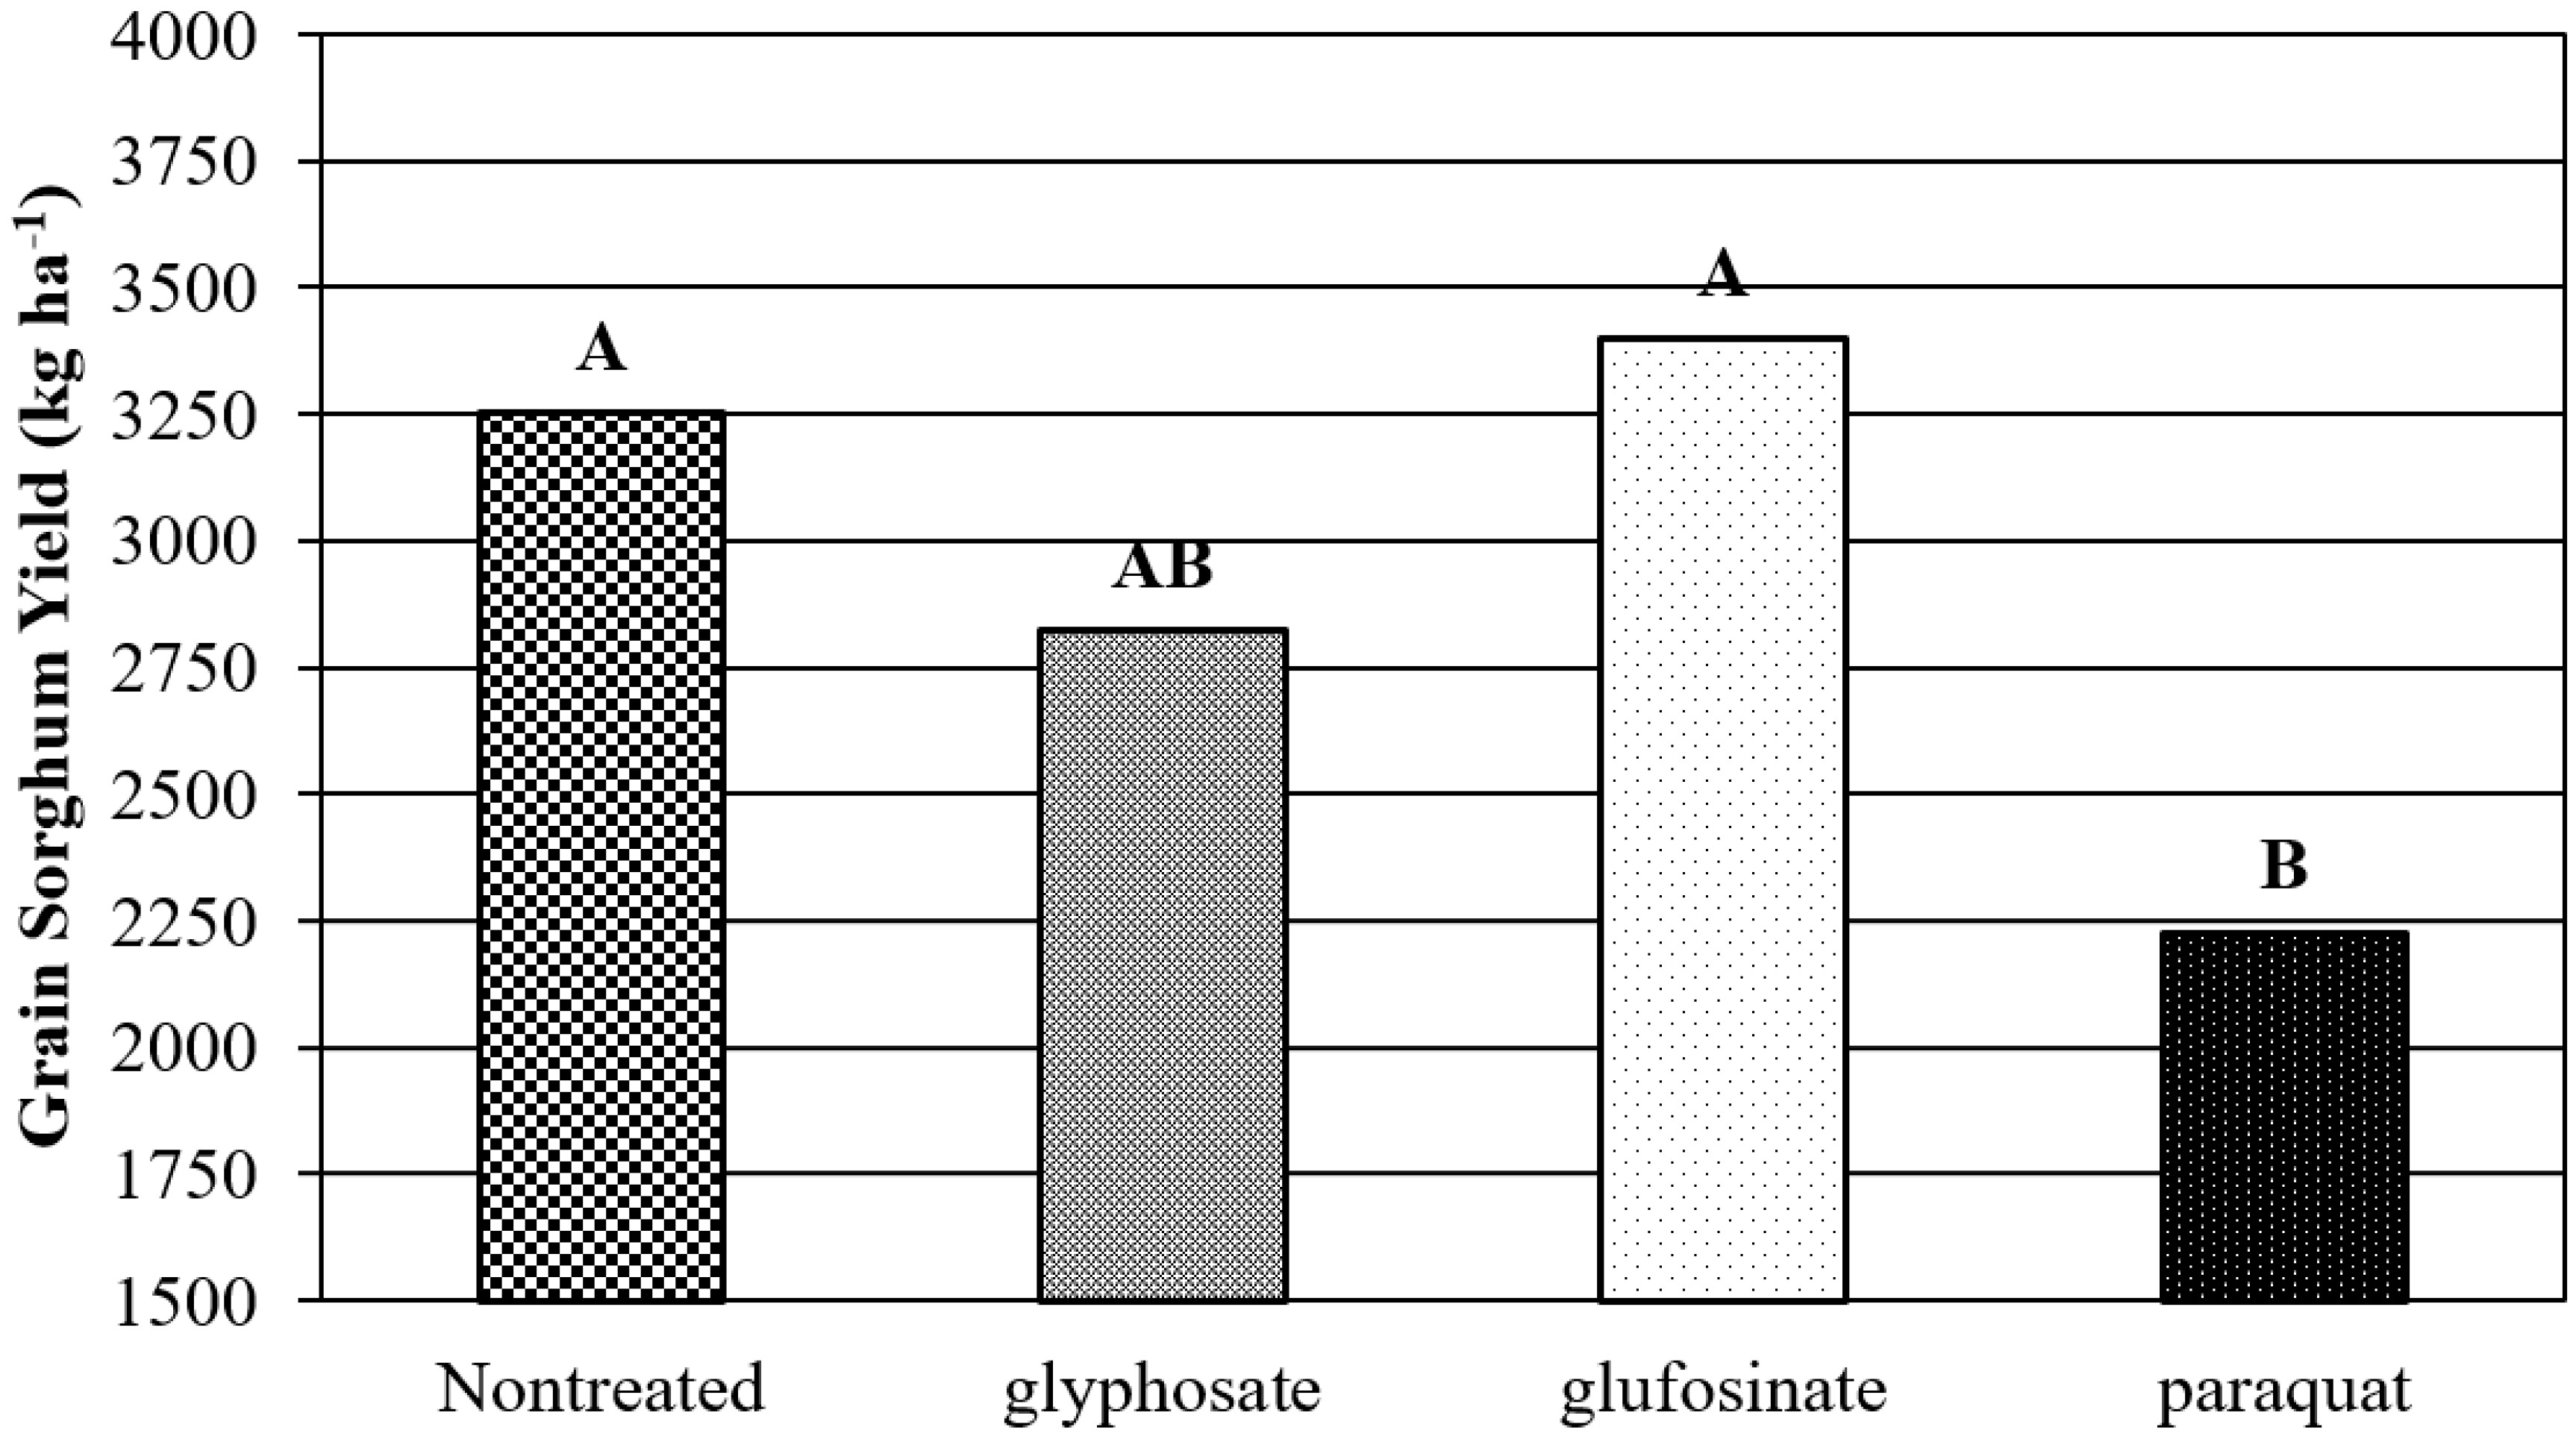
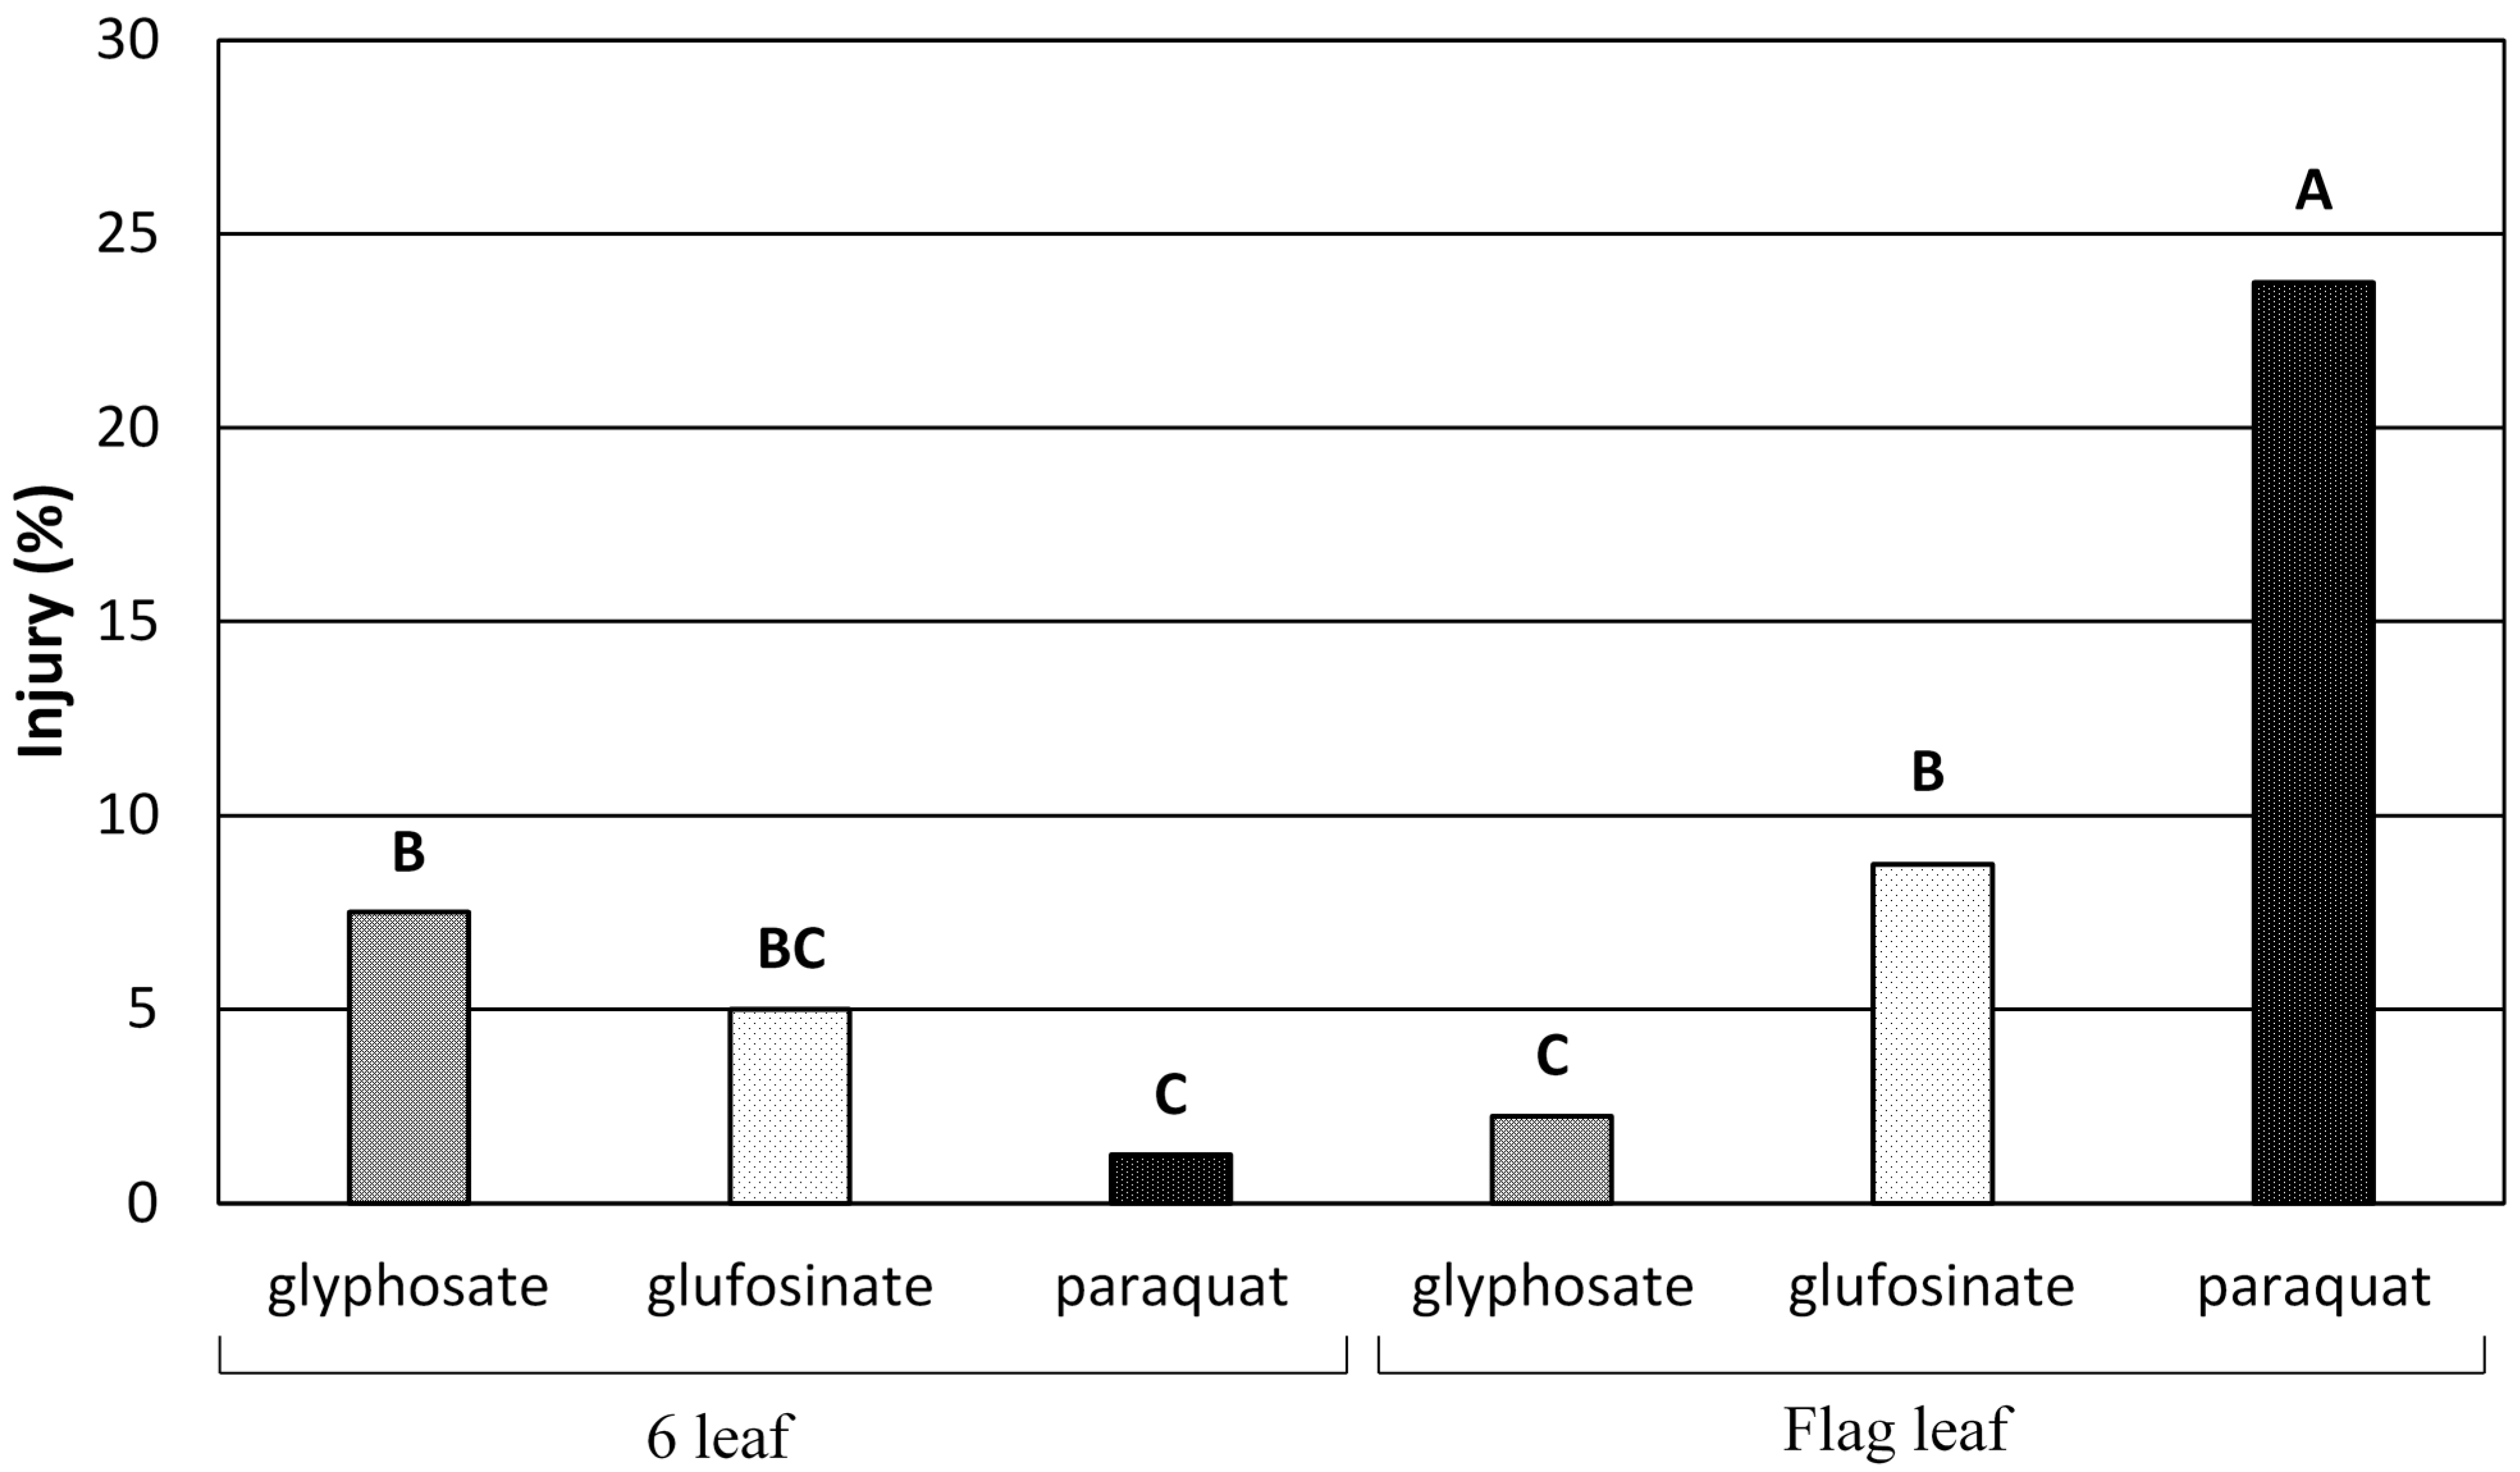
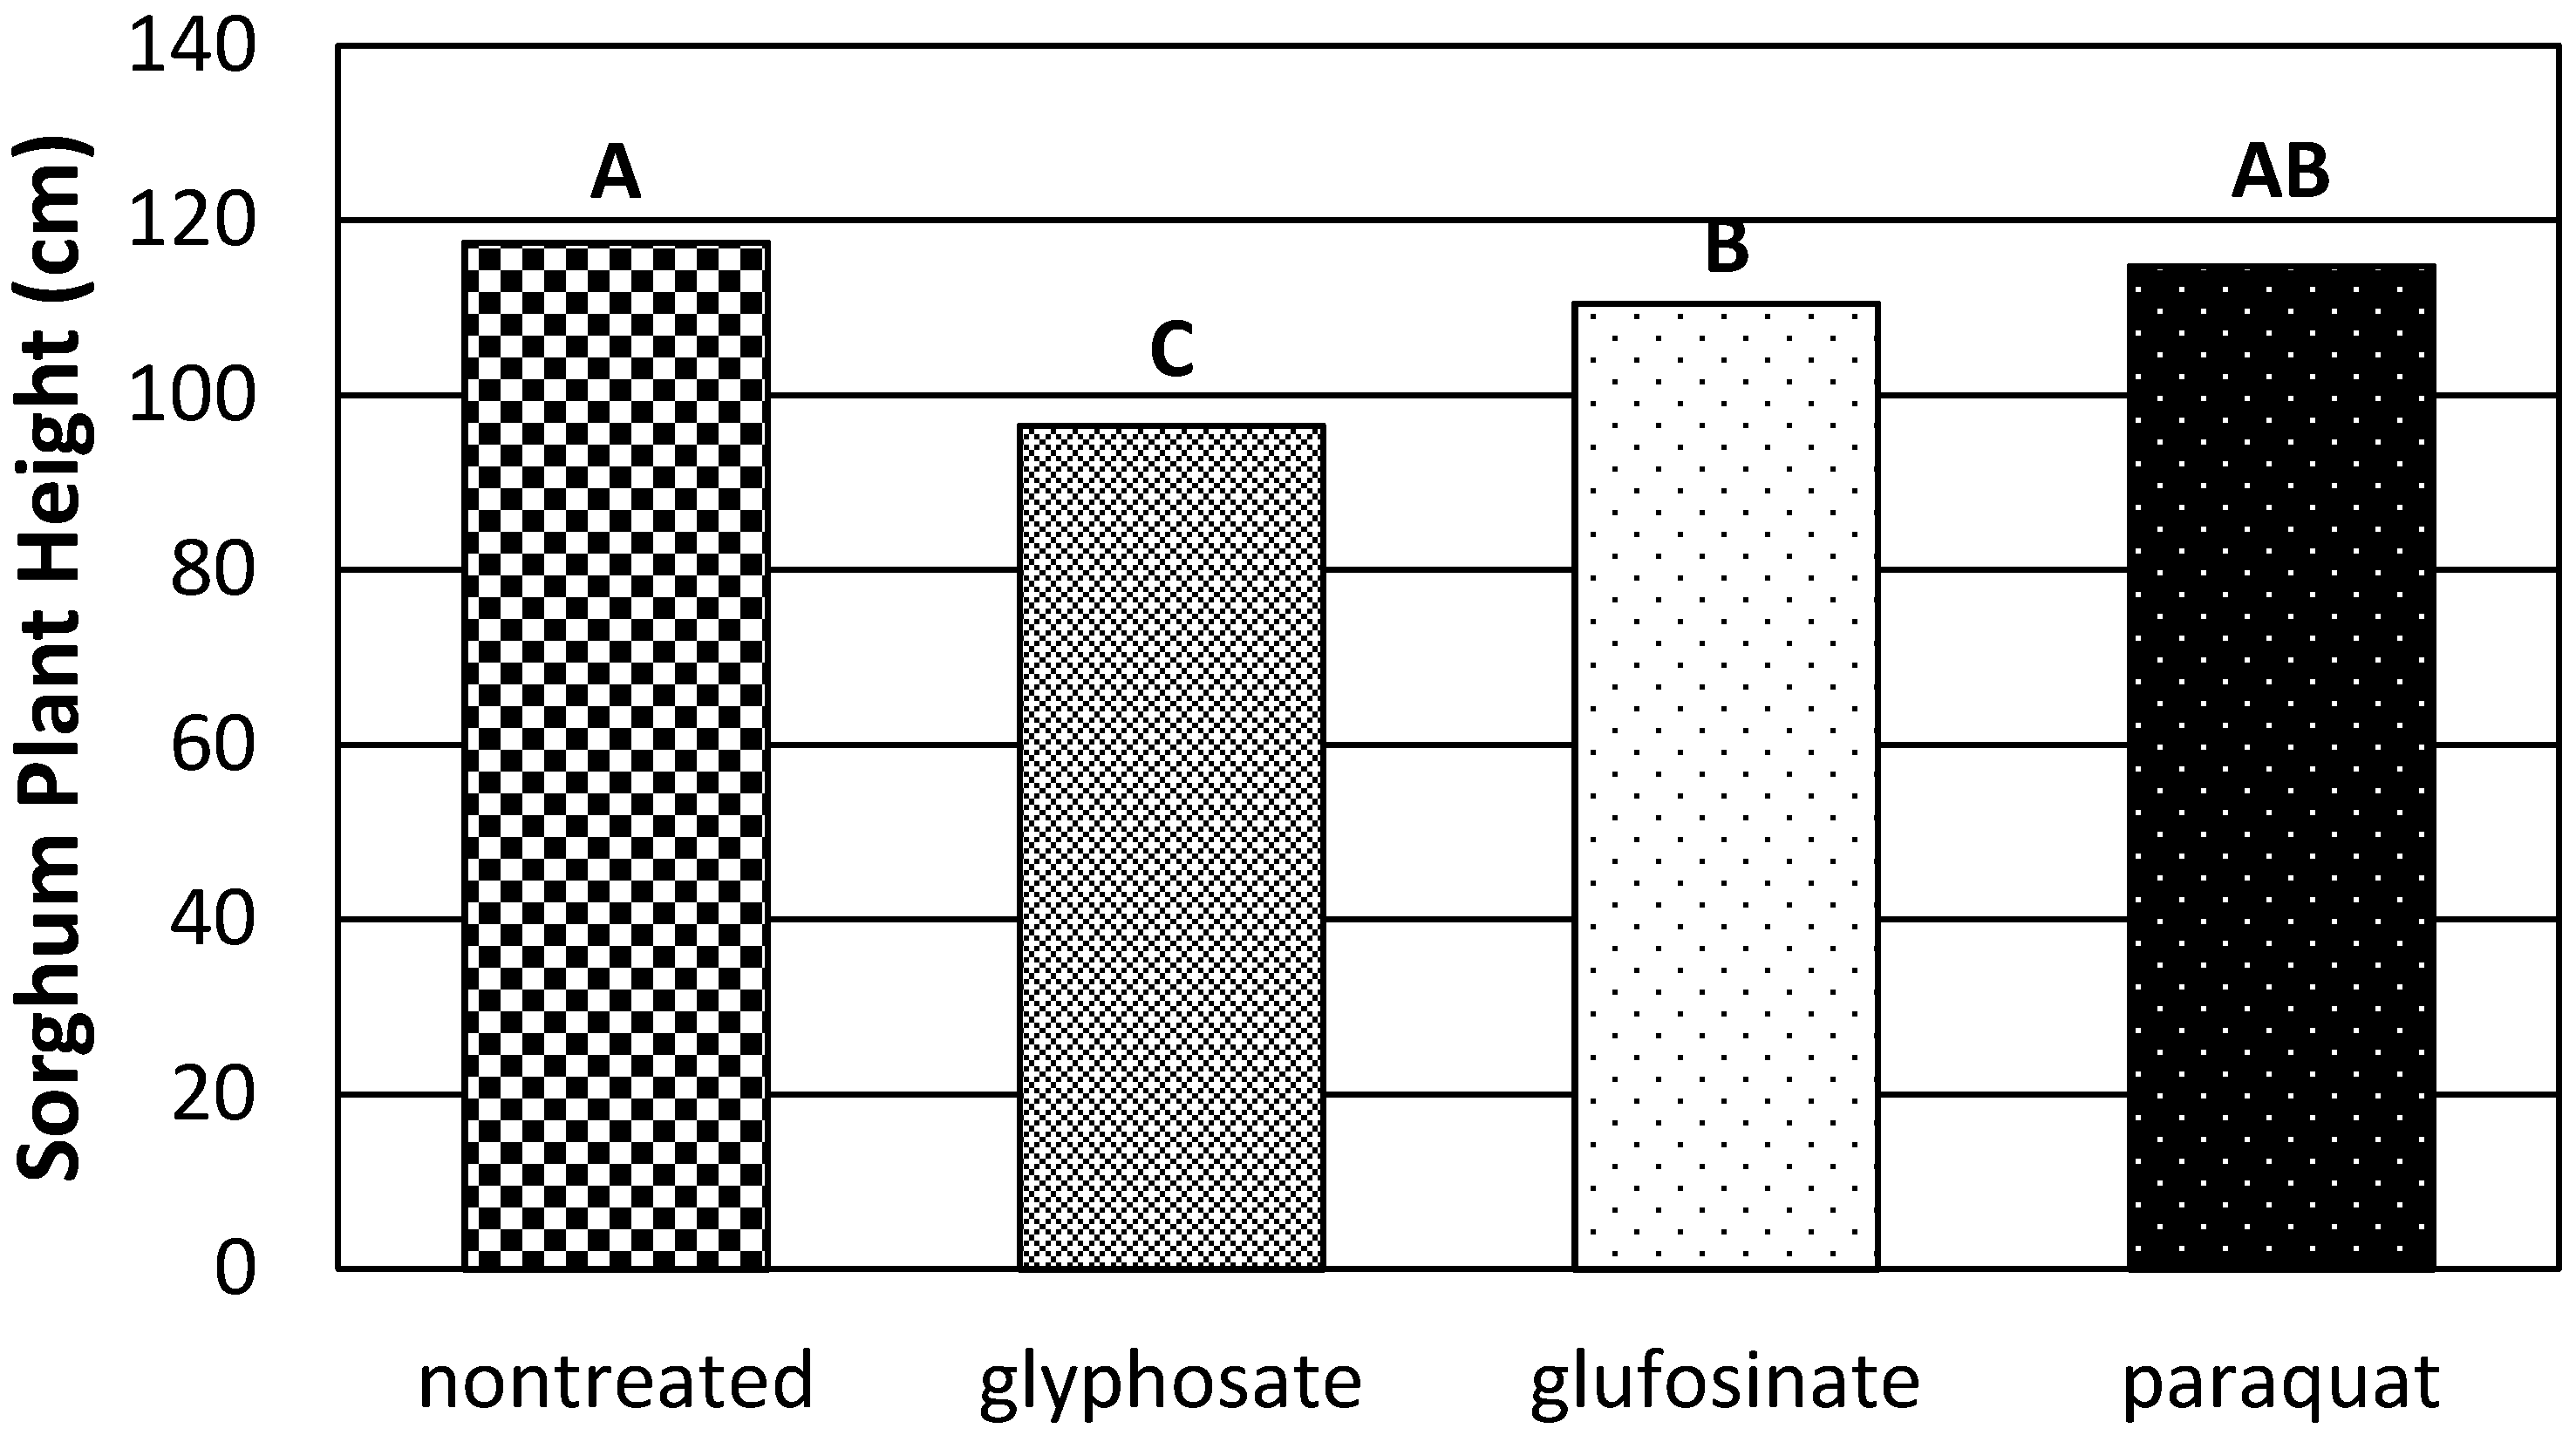
3.2. 2018
4. Conclusions
Author Contributions
Acknowledgments
Conflicts of Interest
References
- Smith, K.; Scott, B. Weed Control in Grain Sorghum. In Grain Sorghum Production Handbook; Cooperative Extension Service, University of Arkansas: Little Rock, AR, USA, 2010; pp. 47–49. [Google Scholar]
- Al-Khatib, K.; Claassen, M.M.; Stahlman, P.W.; Geier, P.W.; Regehr, D.L.; Duncan, S.R.; Heer, W.F. Grain sorghum response to simulated drift from glufosinate, glyphosate, imazethapyr, and sethoxydim 1. Weed Technol. 2003, 17, 261–265. [Google Scholar] [CrossRef]
- Deeds, Z.A.; Al-Khatib, K.; Peterson, D.E.; Stahlman, P.W. Wheat response to simulated drift of glyphosate and imazamox applied at two growth stages. Weed Technol. 2006, 20, 23–31. [Google Scholar] [CrossRef]
- Fletcher, J.S.; Pfleeger, T.G.; Ratsch, H.C.; Hayes, R. Potential impact of low levels of chlorsulfuron and other herbicides on growth and yield of nontarget plants. Environ. Toxicol. Chem. 1996, 15, 1189–1196. [Google Scholar] [CrossRef]
- Wall, D.A. Effect of crop growth stage on tolerance to low doses of thifensulfuron: Tribenuron. Weed Sci. 1997, 45, 538–545. [Google Scholar]
- Snipes, C.E.; Street, J.E.; Mueller, T.C. Cotton (Gossypium hirsutum) response to simulated triclopyr drift. Weed Technol. 1991, 5, 493–498. [Google Scholar] [CrossRef]
- Al-Khatib, K.; Peterson, D. Soybean (Glycine max) response to simulated drift from selected sulfonylurea herbicides, dicamba, glyphosate, and glufosinate. Weed Technol. 1999, 13, 264–270. [Google Scholar] [CrossRef]
- Al-Khatib, K.; Tamhane, A. Dry pea (Pisum sativum L.) response to low rates of selected foliar-and soil-applied sulfonylurea and growth regulator herbicides. Weed Technol. 1999, 13, 753–758. [Google Scholar] [CrossRef]
- Gealy, D.R.; Boerboom, C.M.; Ogg, A.G. Growth and yield of pea (Pisum sativum L.) and lentil (Lens culinaris L.) sprayed with low rates of sulfonylurea and phenoxy herbicides. Weed Sci. 1995, 43, 640–647. [Google Scholar]
- Schroeder, G.L.; Cole, D.F.; Dexter, A.G. Sugarbeet (Beta vulgaris L.) response to simulated herbicide spray drift. Weed Sci. 1983, 31, 831–836. [Google Scholar]
- Al-Khatib, K.; Parker, R.; Fuerst, E.P. Alfalfa (Medicago sativa) response to simulated herbicide spray drift. Weed Technol. 1992, 6, 956–960. [Google Scholar] [CrossRef]
- Al-Khatib, K.; Parker, R.; Fuerst, E.P. Wine grape (Vitis vinifera L.) response to simulated herbicide drift. Weed Technol. 1993, 7, 97–102. [Google Scholar] [CrossRef]
- Al-Khatib, K.; Parker, R.; Fuerst, E.P. Sweet cherry (Prunus avium) response to simulated drift from selected herbicides. Weed Technol. 1992, 6, 975–979. [Google Scholar] [CrossRef]
- Richard, E., Jr.; Hurst, H.; Wauchope, R. Effects of simulated MSMA drift on rice (Oryza sativa) growth and yield. Weed Sci. 1981, 29, 303–308. [Google Scholar]
- Gilreath, J.P.; Chase, C.A.; Locascio, S.J. Crop injury from sublethal rates of herbicide. I. Tomato. HortScience 2001, 36, 669–673. [Google Scholar] [CrossRef]
- Brown, L.R.; Robinson, D.E.; Young, B.G.; Loux, M.M.; Johnson, W.G.; Nurse, R.E.; Swanton, C.J.; Sikkema, P.H. Response of corn to simulated glyphosate drift followed by in-crop herbicides. Weed Technol. 2009, 23, 11–16. [Google Scholar] [CrossRef]
- Everitt, J.D.; Keeling, J.W. Cotton growth and yield response to simulated 2, 4-d and dicamba drift. Weed Technol. 2009, 23, 503–506. [Google Scholar] [CrossRef]
- Hurst, H.R. Cotton (Gossypium hirsutum) response to simulated drift from selected herbicides. Weed Sci. 1982, 30, 311–315. [Google Scholar]
- Lyon, L.L. Cotton and Grain Sorghum Response to Drift Rates of Glyphosate; Texas Tech University: Lubbock, TX, USA, 2004. [Google Scholar]
- Kurtz, M.E.; Street, J.E. Response of rice (Oryza sativa) to glyphosate applied to simulate drift. Weed Technol. 2003, 17, 234–238. [Google Scholar] [CrossRef]
- Ellis, J.M.; Griffin, J.L.; Linscombe, S.D.; Webster, E.P. Rice (Oryza sativa) and corn (Zea mays) response to simulated drift of glyphosate and glufosinate. Weed Technol. 2003, 17, 452–460. [Google Scholar] [CrossRef]


| Herbicide Treatments (Common Names) | Trade Name | Manufacturer |
|---|---|---|
| Glufosinate | Liberty | BASF Corporation, Research Triangle Park, NC, USA |
| Glyphosate | Roundup PowerMax | Monsanto Company, St. Louis, MO, USA |
| Paraquat | Gramoxone | Syngenta Crop Protection LLC, Greensboro, NC, USA |
| Month | Total Monthly Precipitation (mm) | |
|---|---|---|
| 2017 | 2018 | |
| May | 98 | 56 |
| June | 136 | 79 |
| July | 95 | 68 |
| August | 260 | 231 |
| September | 22 | 166 |
| October | 43 | 67 |
| November | 46 | 167 |
© 2019 by the authors. Licensee MDPI, Basel, Switzerland. This article is an open access article distributed under the terms and conditions of the Creative Commons Attribution (CC BY) license (http://creativecommons.org/licenses/by/4.0/).
Share and Cite
Hale, R.R.; Bararpour, T.; Kaur, G.; Seale, J.W.; Singh, B.; Wilkerson, T. Sensitivity and Recovery of Grain Sorghum to Simulated Drift Rates of Glyphosate, Glufosinate, and Paraquat. Agriculture 2019, 9, 70. https://doi.org/10.3390/agriculture9040070
Hale RR, Bararpour T, Kaur G, Seale JW, Singh B, Wilkerson T. Sensitivity and Recovery of Grain Sorghum to Simulated Drift Rates of Glyphosate, Glufosinate, and Paraquat. Agriculture. 2019; 9(4):70. https://doi.org/10.3390/agriculture9040070
Chicago/Turabian StyleHale, Ralph R., Taghi Bararpour, Gurpreet Kaur, John W. Seale, Bhupinder Singh, and Tessie Wilkerson. 2019. "Sensitivity and Recovery of Grain Sorghum to Simulated Drift Rates of Glyphosate, Glufosinate, and Paraquat" Agriculture 9, no. 4: 70. https://doi.org/10.3390/agriculture9040070
APA StyleHale, R. R., Bararpour, T., Kaur, G., Seale, J. W., Singh, B., & Wilkerson, T. (2019). Sensitivity and Recovery of Grain Sorghum to Simulated Drift Rates of Glyphosate, Glufosinate, and Paraquat. Agriculture, 9(4), 70. https://doi.org/10.3390/agriculture9040070