Article

Impacts of Irrigation Termination Date on Cotton Yield and Irrigation Requirement

1
Department of Biosystems and Agricultural Engineering, Oklahoma State University, Stillwater, OK 74078, USA
2
Formerly Southwest Research and Extension Center, Oklahoma State University, Altus, OK 73521, USA
*
Author to whom correspondence should be addressed.
Agriculture 2019, 9(2), 39; https://doi.org/10.3390/agriculture9020039
Submission received: 14 January 2019 / Revised: 3 February 2019 / Accepted: 16 February 2019 / Published: 19 February 2019
(This article belongs to the Special Issue Cotton Production and Quality Research)

Abstract

:
Optimization of cotton irrigation termination (IT) can lead to more efficient utilization and conservation of limited water resources in many cotton production areas across the U.S. This study evaluated the effects of three IT timings on yield, fiber quality, and irrigation requirements of irrigated cotton in southwest Oklahoma during three growing seasons. The results showed cotton yield increased with later IT dates, but this response was highly dependent on the amount and timing of late-season precipitation events. Only a few fiber quality parameters were significantly different among treatments, suggesting a more limited impact of IT on fiber quality. When averaged over the three study years, the lint yield was significantly different amongst all treatments, with an average increase of 347 kg ha−1 from the earliest to the latest IT. Additionally, the seed yield and the micronaire were similar for the two earlier IT treatments and significantly smaller than the values under the latest IT treatment. The differences in fiber uniformity and strength were also significant amongst IT treatments. Strong positive relationships were found between yield components and average late-season water content in the root zone. Lint and seed yields plateaued at an average late-season soil matric potential of about −30 kPa and had a quadratic decline as soil moisture depleted. When benchmarked against the latest IT treatment, the earlier IT treatments achieved average reductions of 16–28% in irrigation requirement. However, this water conservation was accompanied with considerable declines in yield components and micronaire and smaller declines in fiber length, uniformity, and strength.

1. Introduction

The United States (U.S.) is amongst the top cotton producers in the world, ranking third in production and first in exports [1,2]. Cotton is predominantly grown in the cotton belt region of the U.S., mostly in states below the 37° N latitude [3]. Among these, Oklahoma has been consistently listed as one of the leading cotton producing states, ranking fifth for the year 2017 [4]. Furthermore, cotton is the third most important field crop in Oklahoma and contributes significantly to the economy of this state [5,6]. More than 80% of cotton by area and production is cultivated in Southwest Oklahoma [7]. Due to the semi-arid climate of this region, irrigation plays an important role in sustaining the production and enhancing the market value of cotton [8].
Irrigation water resources in southwest Oklahoma are scarce due to several reasons. First, many local surface and groundwater resources have poor quality caused by dense salt deposits [9]. Osborn and Hardy [10] reported total dissolved solids (TDS) in the range of 1500 to 5000 mg L−1 in the Blaine aquifer, one of the major aquifers in the region. The critical TDS of irrigation water for cotton production is 3264 mg L−1, above which yield starts to decline [11]. The high salt levels found in irrigation water resources in southwest Oklahoma mostly originate from the abundant thick gypsum beds that have a high concentration of calcium and sulfate. These geological features have affected local rivers that supply most of the surface water resources in the region. For instance, Mittelstet et al. [9] reported heavy contamination of the North Fork of the Red River as water flows through salt deposits via its tributaries.
In addition to these water quality challenges, southwest Oklahoma has suffered severe droughts in recent years, and this has affected surface water availability [12]. The latest drought that occurred from 2010 to 2015 led to a significant decline of water level in Lake Altus-Lugert, which supplies the Lugert Altus Irrigation District (LAID), the largest irrigation district in southwest Oklahoma [13]. This water level decline resulted in the failure to release irrigation water from the lake since the water level had dropped below the intake to the main canal [13]. Consequently, cotton production experienced all-time low records during this period, with devastating impacts on the local economy. Moreover, water demand in the Lake Altus-Lugert catchment has been projected to increase by approximately 70 percent by 2060. Based on this forecast, southwest Oklahoma has been listed as a water resource “hot spot” in the state [14]. Other cotton production areas in the region, such as in the Texas Panhandle, face similar water scarcity challenges [15].
Considering the highlighted water resources issues in cotton production, it is imperative that producers employ irrigation practices that conserve water. Even though cotton has been reported to have relatively higher drought resistance and lower water requirement compared to other field crops [3], more ways to reduce cotton irrigation demand should be investigated. One approach is through optimizing the time of irrigation termination (IT), an important factor in cotton irrigation management that can boost crop maturity by accelerating boll opening, reducing boll rotting, and facilitating defoliation by inhibiting vegetative overgrowth [16,17,18].
Reba et al. [19] reported that water conservation could be realized following a precision IT based on growth stages and weather conditions without negatively affecting cotton lint yield. However, several studies have shown divergent views regarding the earliness of cotton IT without causing yield and quality losses. Monge [20] and Vories et al. [21] determined an optimal IT time of approximately 200-degree days (15.6 °C base temperature) after physiological cutout. They argued that irrigation beyond this point added neither yield nor profit. Conversely, Hogan [22] estimated an optimal IT time at 306-degree days after cutout and Buttar et al. [23] showed significant cotton yield increases with later IT. In another study where IT treatments ranged from two to six weeks after physiological cutout, Reeves [18] found contradictory results in different years. Cotton fiber quality improved in the later treatment in one year and the earlier treatment in another year. In the study by Karam et al. [17], termination at first open boll achieved higher yields compared to later termination treatments.
These variable results demonstrate the need to further investigate the effects of irrigation termination on cotton yield. This is also evident and in support of the study by Lascano et al. [24], who argued that even though there is an abundance of data on cotton yield response to the amount and timing of irrigation, very little information is available pertaining to the impact of irrigation termination timing on cotton yield and fiber quality. Vories et al. [21] made the same observation, particularly for the U.S. Mid-South region, and highlighted that more research on cotton IT could help improve management practices by cotton producers, and more importantly complement water conservation efforts in arid and semi-arid regions. The goal of this research was to evaluate the effects of variable irrigation termination timings on the quantity and quality of cotton yield in southwest Oklahoma. The more specific objectives were: (i) to determine the impact of three irrigation termination dates on cotton seed and lint yield, fiber quality, and irrigation requirement during three growing seasons; and, (ii) to explore the relationships between cotton yield and two key management parameters: heat units and end-of-season soil water content.

2. Materials and Methods

2.1. Study Area

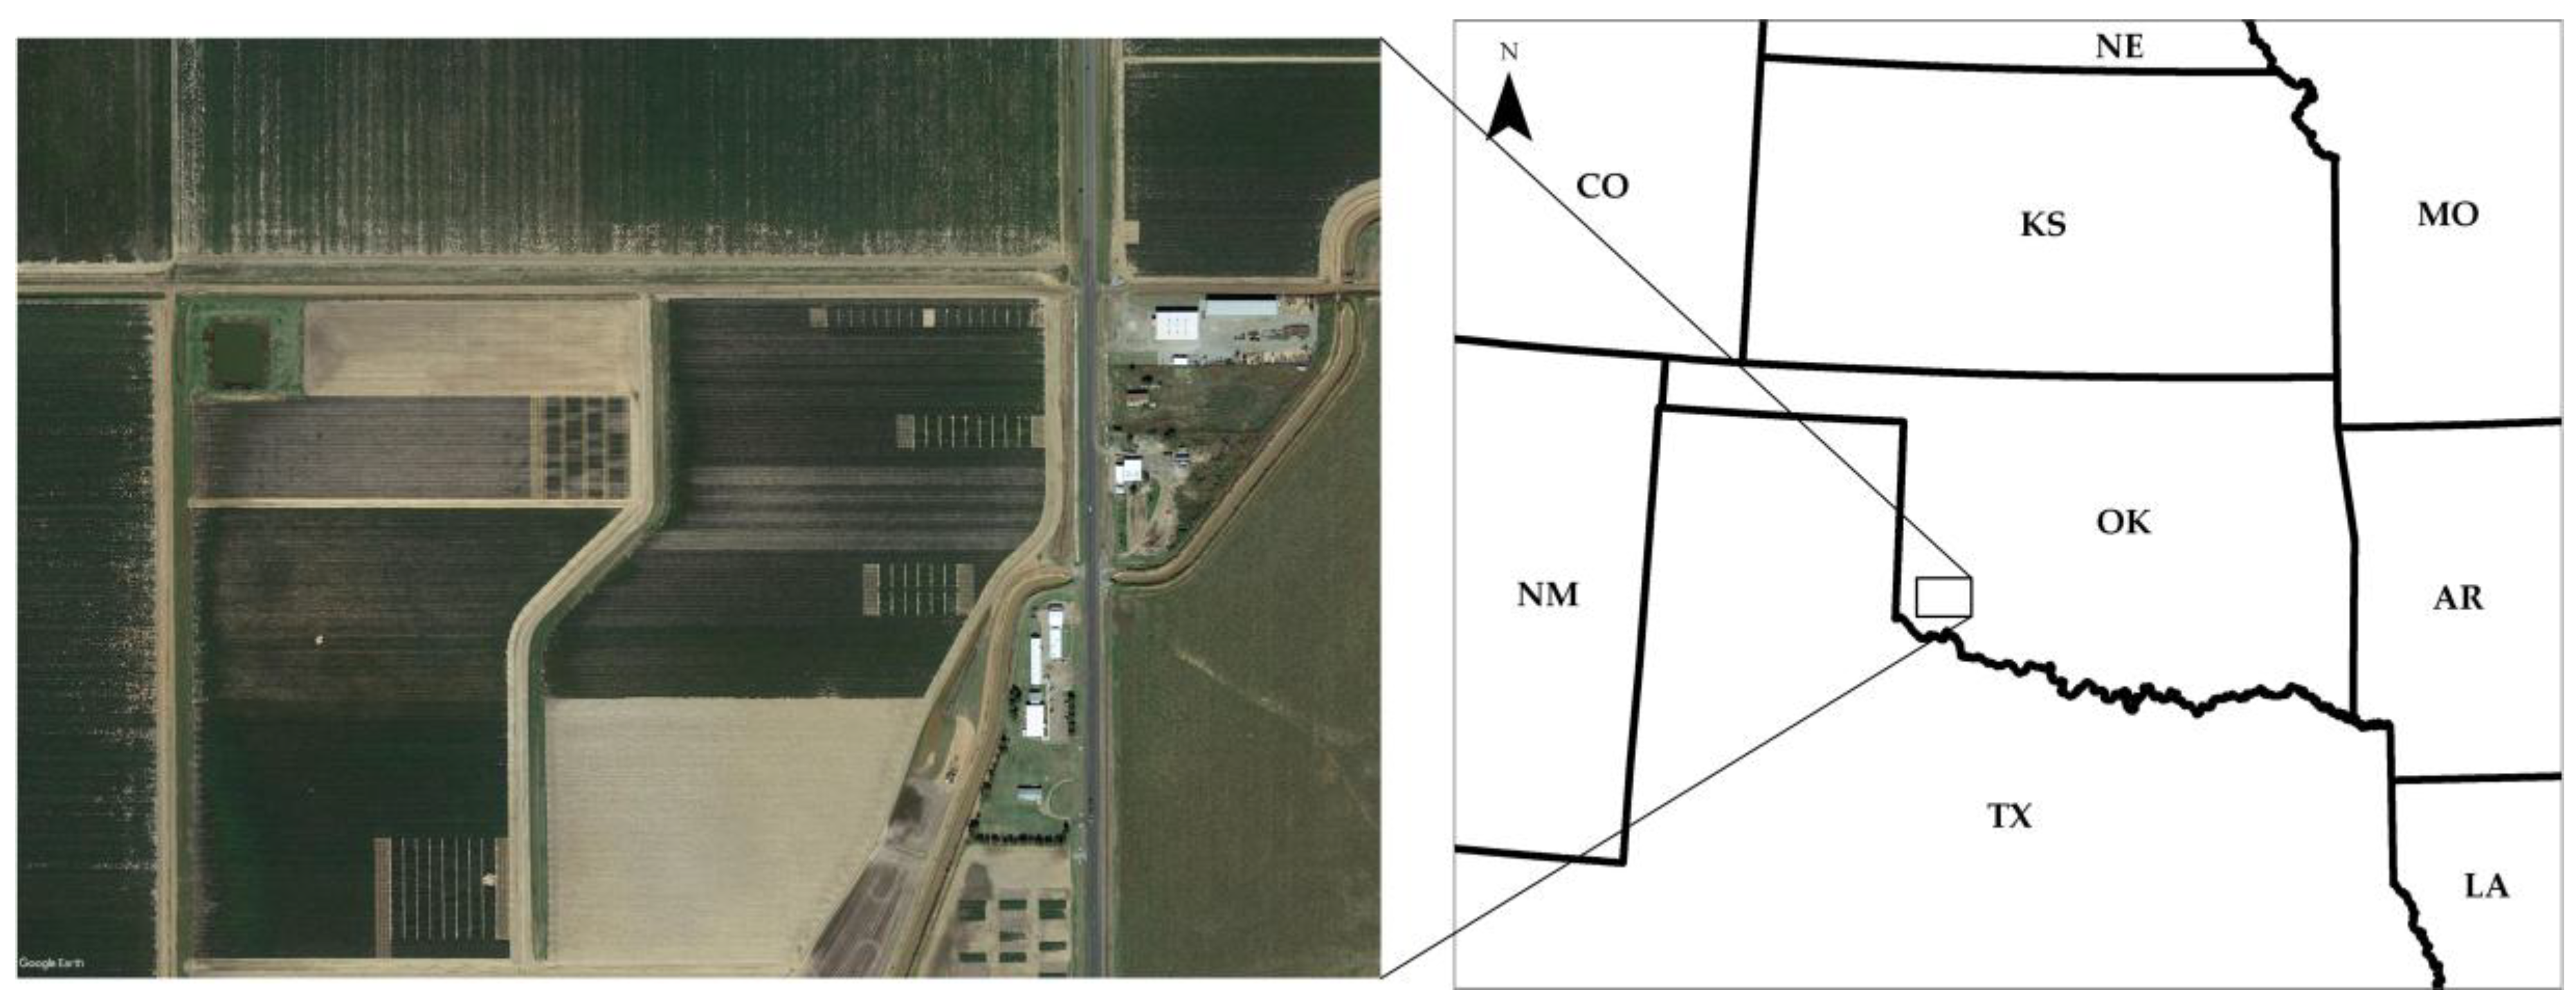
This study was conducted at the Oklahoma State University’s Southwest Research and Extension Center, near Altus, Oklahoma (Figure 1), during three years from 2015 to 2017. The area is within the Lugert-Altus Irrigation District, which delivers water to over 18,000 ha of irrigated land through a 435 km system of open canals [7]. The irrigation district draws its water from Lake Altus-Lugert, with a capacity of about 120 million m3 [7,13].
The study area has a sub-humid climate characterized by hot and dry summers [7]. The average annual rainfall is 638 mm. Table 1 presents the meteorological parameters for the three growing seasons (May–September) of the study, as well as the long-term averages. Weather data were acquired from the Oklahoma Mesonet station that is located within the borders of the same Research Center and about 700 m south of the research plots.
The soil of the research plots was Hollister silty clay loam (Fine, Smectitic, Thermic Typic Haplusterts), which is also the predominant soil in the irrigation district [25]. Chemical properties of the soil were determined from samples taken at different depths of the soil profile and analyzed at the Soil, Water, and Forage Analytical Laboratory at Oklahoma State University. Table 2 presents the mean electrical conductivity (EC), pH, and sodium adsorption ratio (SAR) for three soil layers.

2.2. Experimental Design

The field layout in this study followed a randomized block design, consisting of three treatments of weekly spaced irrigation termination (IT) dates, replicated three times in each of the growing seasons. The study targeted IT dates of August 16, August 23, and August 30, based on the usual irrigation season dates specified by the irrigation district in each year. Table 3 presents the actual dates of each IT treatment that were achieved during the study period.
Each replicate was comprised of 8-row plots of Deltapine DP 1044 B2RF cotton cultivar, resulting in 24 rows for every treatment. Normal fertilizer, insect, herbicide, plant growth regulator, and harvest aid management were carried out in all plots so that variations could be attributed solely to irrigation termination treatments. Each weekly irrigation event provided 76 mm of water via a furrow irrigation system. This irrigation approach (type and timing) is predominant in the Lugert-Altus Irrigation District. Table 4 shows planting and harvest dates and the final plant stand for each growing season.

2.3. Crop Measurements

Several crop parameters were estimated throughout the growing season, and after harvest and processing to determine the effects of IT on yield and fiber quality. Crop maturity was tracked during regular site visits using two common indicators of nodes above white flower (NAWF) and nodes above cracked boll (NACB). A NAWF of five is often used as an indicator of reaching physiological cutout, a stage when flower development ceases and boll development commences [26]. To determine cotton yield and quality parameters, the center 4 rows (15.2 m long) in each plot were harvested using a John Deere 482 modified plot stripper (without field cleaner). Grab samples were taken from each plot and were ginned on a plot gin. Cleaned lint, cottonseed, trash, and burs were collected and weighed to obtain lint turnout. Lint turnout for each plot was used to convert plot bur cotton weights to lint per hectare.
For fiber quality assessment, the ginned lint samples from each plot were sent to the Cotton Phenomics Laboratory at the Fiber and Biopolymer Research Institute at Texas Tech University for the high volume instrument (HVI) and advanced fiber information system (AFIS) analyses. HVI data produces several important fiber measurements that include micronaire, fiber length, uniformity, and fiber strength. Per Lascano et al. [24], micronaire is defined as the degree of fineness and maturity; and fiber length represents the average length of the longer half of the fibers. Uniformity is equivalent to the ratio between the average fiber length and the upper-half mean length of the fibers, expressed as a percentage. Fiber strength gives a measure of a force in grams required to break a 1000 m bundle of fibers. AFIS measures the neps content, short fiber content, fineness, and maturity ratio. The ratings of these quality parameters determine the value of cotton.
Finally, the economic value for lint was estimated by multiplying lint yield and the adjusted Commodity Credit Corporation (CCC) upland loan premiums and discounts. The adjusted loan rates were obtained using the Upland Cotton Loan Calculator program available on the Cotton Incorporated website and HVI factors determined as explained above. The rates for the 2018/2019 growing season were applied to all three years of study.

2.4. Soil Water Content

Soil water content was monitored on a weekly basis during the end of the growing season, beginning in early August and prior to the earliest IT date. The Watermark SS200 granular matrix sensors (Irrometer Inc., Riverside, CA, USA) were used along with handheld readers provided by the manufacturer. The sensors went through several cycles of soaking and drying and were then installed at depths of 0.25, 0.51, and 0.76 m below the soil surface on the fourth row of each plot. Watermark sensors provided an estimate of soil matric potential (SMP) at each depth. These estimates were averaged to achieve an equivalent SMP for the top 0.76 m of the soil. The relationship between soil water content and cotton yield was investigated to evaluate the performance of end-of-season soil moisture monitoring as a tool for conducting precision irrigation termination.

2.5. Statistical Analysis

The yield and fiber quality data were analyzed for each year and across the entire study period using the analysis of variance (ANOVA) at a significance level of 0.05 in SigmaPlot 14.0 [27]. To allow for pairwise comparisons among the means, the Fisher’s Least Significant Difference (LSD) was also calculated and reported [24].

3. Results and Discussion

3.1. Cotton Yield

The largest lint yield averaged over all three irrigation termination (IT) treatments was achieved in 2016, followed by 2017 and 2015 with estimates of 2006, 1214, and 1016 kg ha−1, respectively. The seed yields had a somewhat similar pattern, with average values of 2949, 1801, and 1882 kg ha−1 during the same years, respectively. This was consistent with the order of the total amounts of rainfall received in each of the three seasons, where 2016 recorded the largest amount, followed by 2017 and 2015 (Table 1). Bordovsky et al. [15] found similar cotton lint yields under full irrigation application in Texas Panhandle and reported that rainfall had a significant impact on lint yield.
The effect of rainfall amount and distribution was also evident in the response of cotton to IT treatments. In general, cotton lint and seed yield increased with later IT dates. However, this increase was not statistically significant in all years (Table 5). In 2015, the increase in cotton lint and seed yields with IT date was statistically different amongst all treatments. In this year, dry conditions occurred after the first IT treatment in August and persisted into September, which registered just 11 mm of rainfall, 16% of the long-term average for this month. The enhanced yield in IT3 appeared to be a result of the irrigation applied at the end of August, which provided better soil moisture conditions for crop growth during the hot and dry September experienced that year. These results are similar to the findings of Teague [28] in Arkansas, who observed significant differences in yield with each additional irrigation after cutout in a year characterized by a mid-season hot and dry period.
In contrast to 2015, there were no significant differences in cotton yield during the 2016 season. This season recorded average rainfall in August and twice the long-term average in September, which subdued the treatment effects on cotton performance. In 2017, August recorded almost twice the long-term average rainfall, affecting the treatment structure (only two IT treatments were possible). September rainfall in 2017 was near average. In this year, the IT3 resulted in a significant increase in cotton lint and seed yield compared to IT1 (Table 5).
The findings of the present study were in agreement with Reba et al. [19], who reported larger yields in wet years for furrow-irrigated cotton. Furthermore, various studies have highlighted the correlation between growing season rainfall distribution and cotton yield [29,30,31]. In particular, Cull et al. [29] reported a significant effect of late-season rainfall on the number of bolls set in cotton. In addition to rainfall, the length of the growing season may have contributed to the high yield attained in 2016. This season had the longest growing season in terms of calendar days and thermal time. The length of the growing season was shorter and comparable in 2015 and 2017, despite their differences in rainfall.
When data were combined over the three-year period, there were statistically significant differences in lint yield (p < 0.001) amongst all treatments. For seed yield, there was no statistically significant difference between IT1 and IT2 treatments (p = 0.056). However, both IT1 and IT2 were significantly smaller than IT3 (p < 0.001). Overall, the results of this study showed an increase in yield with increase in the length of the irrigation season. This was consistent with the results of Vories and Glover [32] and Teague [28]. On the other hand, Karam et al. [17] studied three IT timings at first open boll, early boll loading, and mid-boll loading under the semi-arid conditions of Lebanon and found a reduction in lint yield with later IT treatments. They argued that the decrease in yield caused by additional irrigations was due to reduced boll opening, which generally occurs in high water supply conditions.

3.2. Cotton Fiber Quality

The results indicated that except for 2015, HVI properties had mostly no significant differences among IT treatments (Table 6). The 2015 growing season had the smallest values of micronaire compared to 2016 and 2017, and the differences in this parameter among treatments were statistically significant. A number of previous studies have highlighted the increase of micronaire with late IT, and its susceptibility to environmental conditions including rainfall and temperature [24,33]. Teague [28] observed an increase in micronaire with each additional irrigation after cutout, in a year characterized by a hot and dry mid-season in Arkansas. In case of other HVI parameters (length, uniformity, and strength), IT2 and IT3 attained similar values that were significantly larger than those of IT1 in 2015. None of the HVI properties were significantly different across IT treatments in 2016. In 2017, one of the IT1 treatments achieved a significantly lower micronaire compared to IT3, but there was no significant difference in length, uniformity and strength qualities.
When samples from the three years were combined, the average micronaires in IT1 and IT2 were not significantly different, but both were smaller than in IT3. Even though the averages seemed very close, cotton uniformity was higher in IT2 and IT3 than in IT1. Although slight increases in fiber length and strength were observed with later IT treatments, there were no significant differences in these two properties across treatments. The results of this study are in agreement with previous studies conducted in Arizona [16] and in the U.S. Mid-South [21], where significant differences in fiber quality with irrigation termination timing were rarely observed.
Overall, the results of AFIS quality properties were similar to those of HVI, showing mostly no significant impact caused by the IT treatments (Table 7). Fiber fineness and maturity ratio were the only parameters that had significantly different values among IT treatments in 2015 and 2017. When the data from the three seasons were combined, IT date had no significant effect on any of the AFIS parameters.
Cotton yield and fiber quality data were used in estimating the economic value of lint. The variations in lint value were similar to those of lint yield, where the smallest value of 895 USD ha−1 was estimated for IT1 in 2015 season and the largest value of 2659 USD ha−1 belonged to IT3 in 2016 season. The impact of IT on lint value was most significant in 2015, with IT1 and IT2 resulting in 633 and 432 USD ha−1 less revenue compared to IT3. The reductions in revenue were smallest in 2016 at 179 and 192 USD ha−1 for the same two treatments, respectively. The 2017 season was in the middle, with 587 and 436 USD ha−1 less revenue for the two IT1 treatments when compared to IT3.

3.3. Heat Units

In this study, IT treatments were based on calendar dates with weekly intervals following the common practices and the irrigation delivery scheme in the study area. Nonetheless, the accumulated heat units (HU) prior to and after irrigation termination were estimated for each treatment to investigate the impact of thermal conditions on cotton yield. Previous studies have reported a direct influence of prevailing thermal conditions on the growth and development of cotton and recommended the use of degree heat units as a tool to make decisions about irrigation termination [24,30,34]. In the present study, variations in air temperatures, planting dates, and IT dates resulted in different HUs by each treatment amongst the three years. Table 8 presents the HUs accumulated during the three periods of planting to IT, cutout to IT, and IT to harvest in each year. Heat units were calculated based on a daily lower temperature threshold of 15.6 °C [3].
As shown in Table 8, the magnitude of heat units accumulated between IT and harvest decreased with increase in IT date since a smaller period was used in HU calculation for later IT treatments. For each treatment, the largest HU after IT was achieved in 2015 due to the hot and dry conditions of August and September in this season compared to others. Previous studies have generally targeted physiological cutout to be the first IT date [21,32]. Monge [20] included a treatment before physiological cutout (NAWF = 7.2) and latest treatments of 167–361 °C HU past cutout. In another study, Reeves [18] had the latest treatments of 378 and 538 °C HU past cutout during the first and the second year of study, respectively. In the present study, the earliest treatment (IT1) accumulated 13 to 80 °C HU past cutout among the three years, suggesting that despite using calendar dates, IT1 in this study occurred about the physiological cutout. The latest treatment (IT3) accumulated 186 to 213 °C HU past physiological cutout, similar to Monge [20].
Other studies have used different periods for HU-based irrigation termination. For example, Lascano et al. [24] evaluated three HUs of 890, 1000, and 1110 °C from emergence to IT over a 4-year period in the Texas High Plains. In this study, average HUs of 941, 1039, and 1111 °C were estimated from planting to IT for IT1, IT2, and IT3 treatments, respectively. Considering that cotton requires about 28 °C HUs from planting to emergence [26], the evaluated range of thermal times by Lascano et al. [24] was similar to the one implemented in the present study. Considering the entire growing season, cotton accumulated 1529, 1540, and 1466 HUs in 2015, 2016, and 2017, respectively, which are larger than the 1444 °C limit required for complete maturity according to Gowda et al. [3].
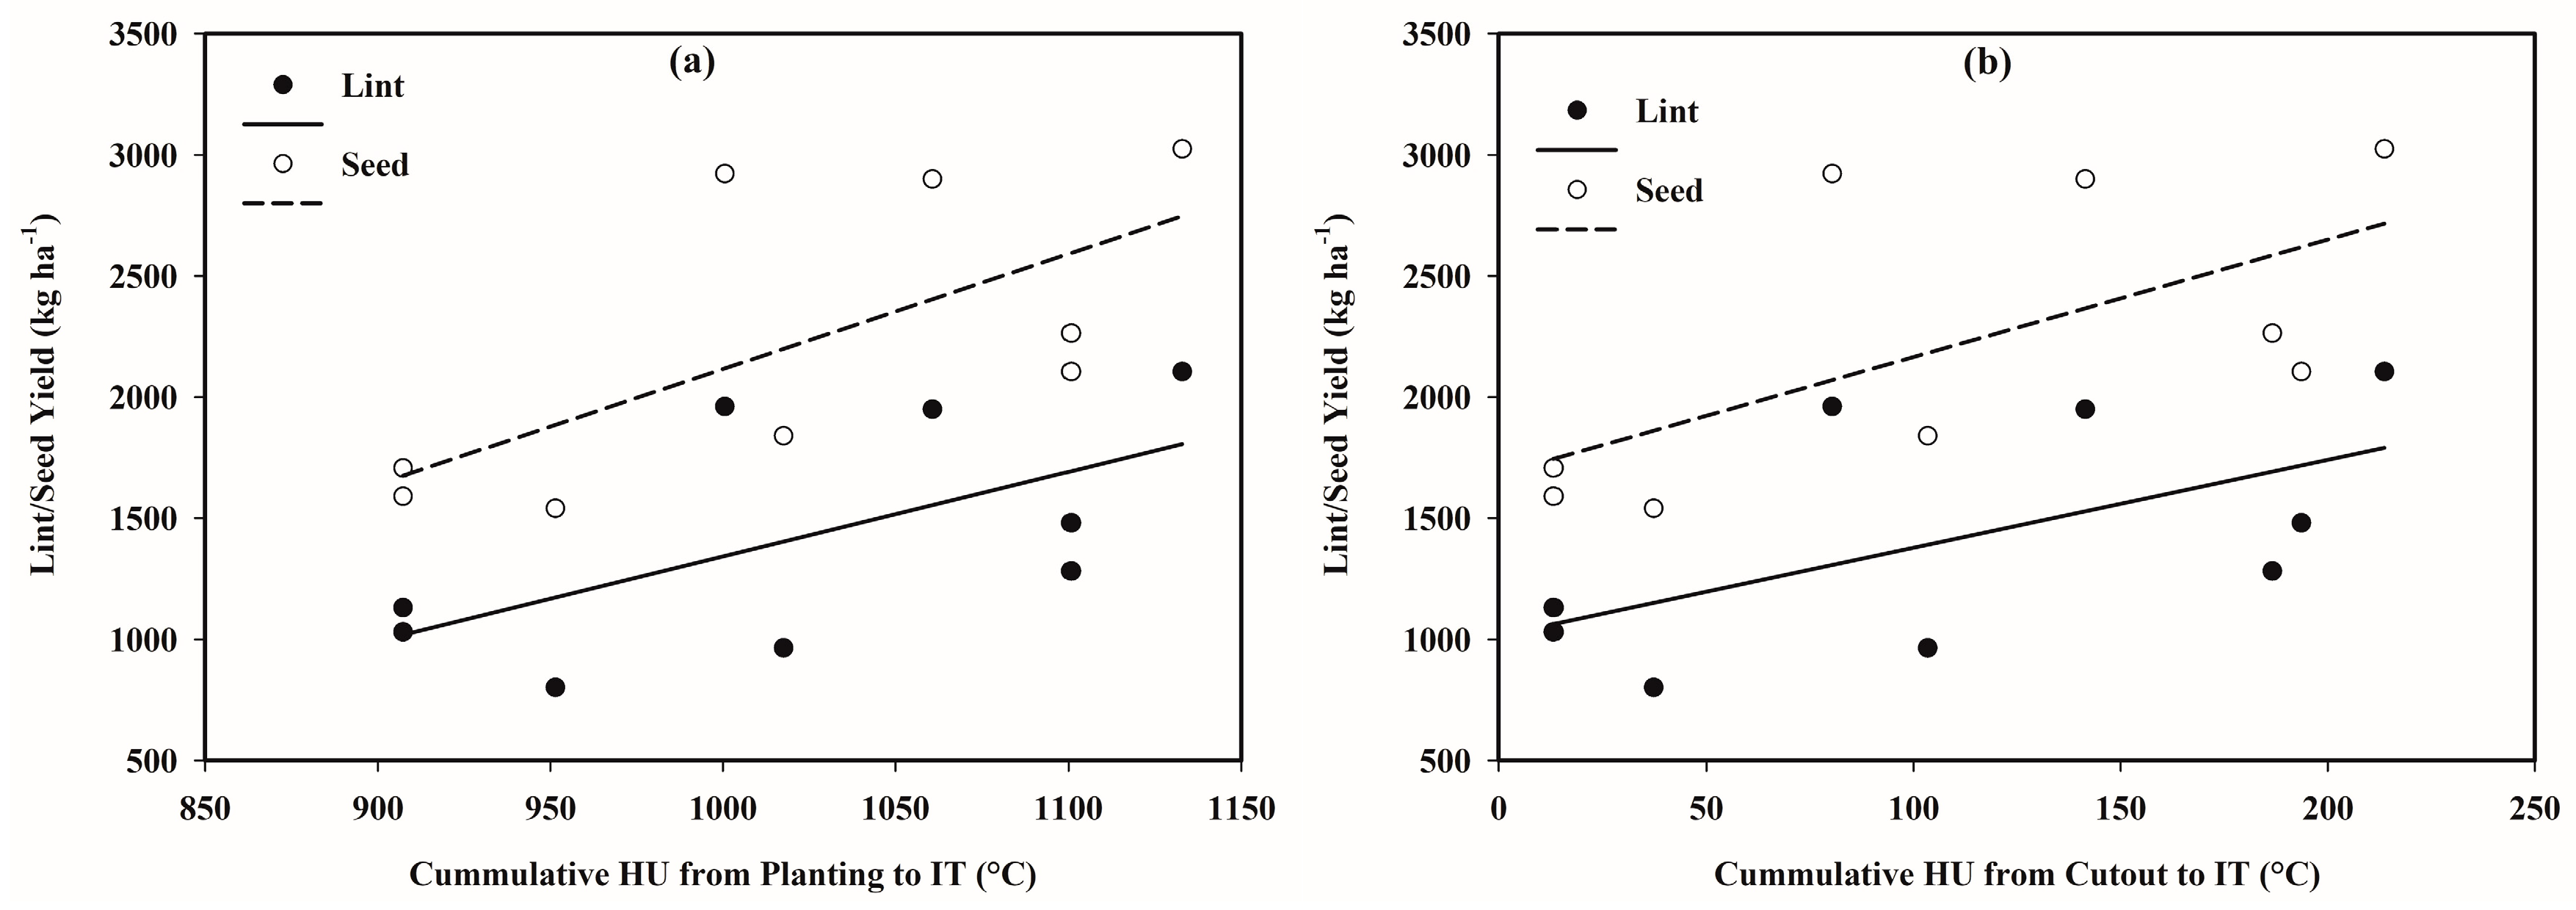
The linear regression models revealed weak positive relationships between cotton lint/seed yield and cumulative HUs during planting-IT and cutout-IT periods (Figure 2), with coefficients of determinations ranging from 0.34 to 0.45. However, the only regression model that was statistically significant was the one between seed yield and HUs during planting-IT (p = 0.047). Peng et al. [34] found that cotton yield was highly correlated to accumulated HUs when water availability was not a limiting factor. They also highlighted that water supply can alter the yield-HU relationship and observed no significant correlation between lint yield and HU under water stress in the Southern High Plains of Texas.

3.4. Soil Water Content

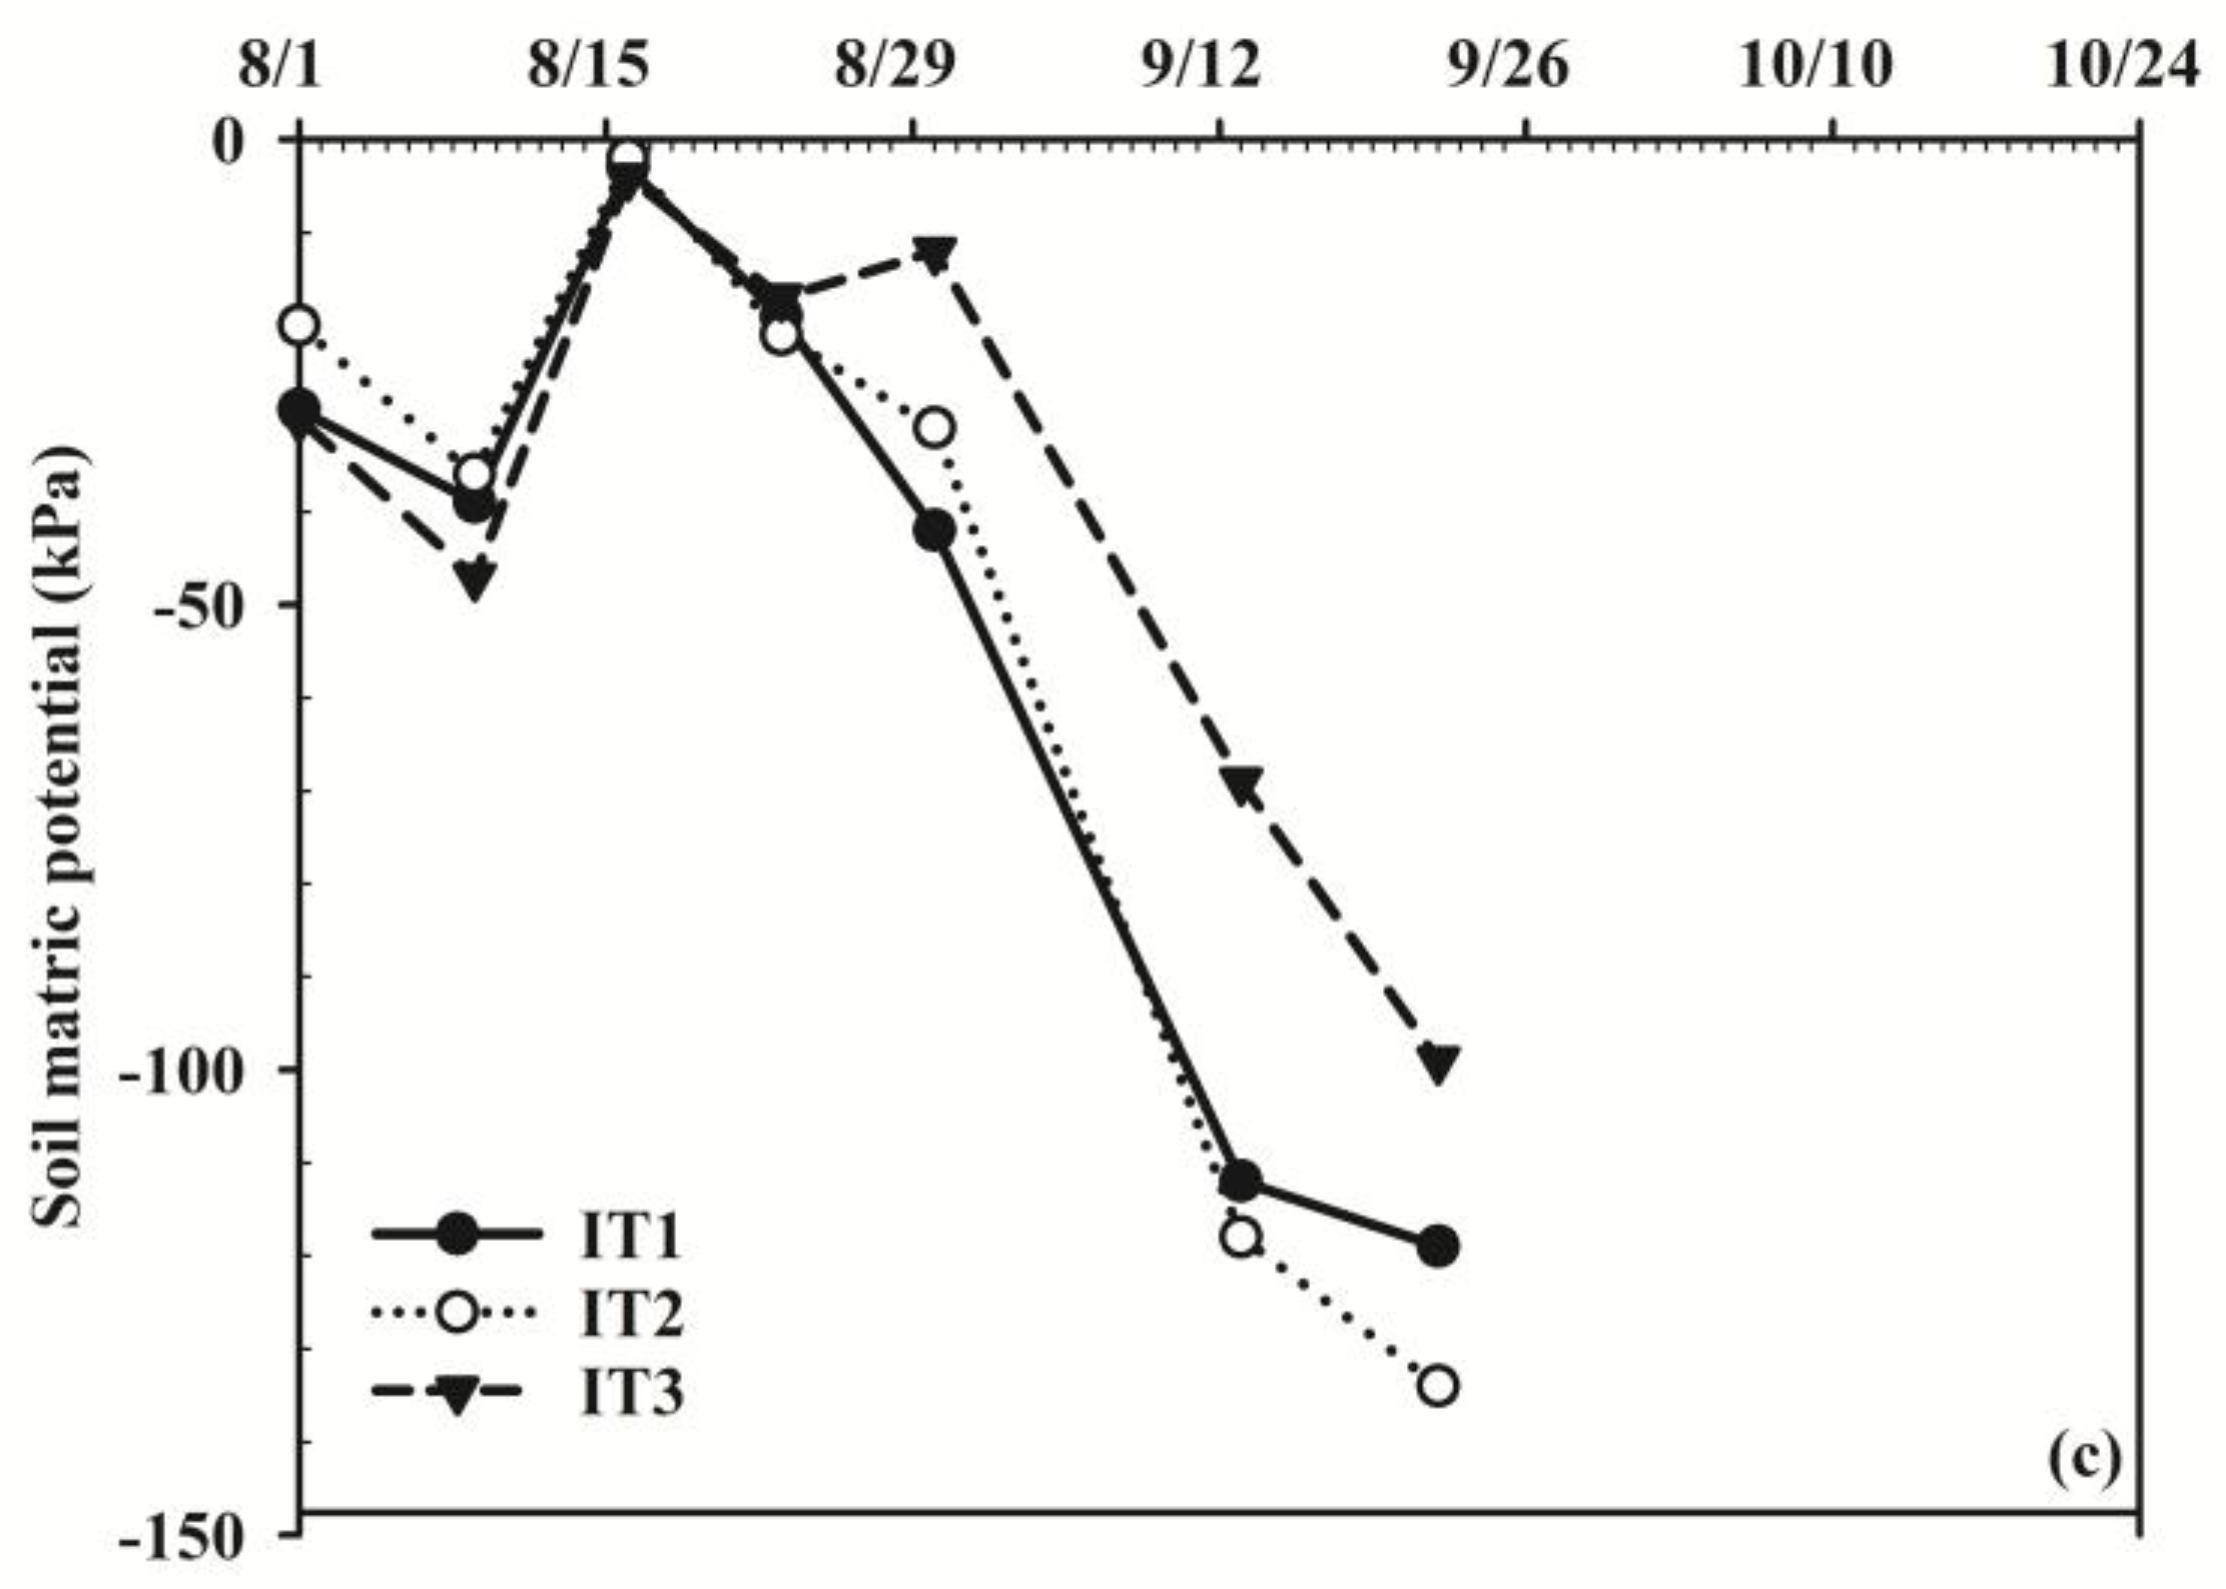
The root zone soil water content declined following IT dates for all treatments and years, but the rate of decline was significantly larger in 2015 and 2017 compared to 2016 (Figure 3). The range of observed soil matric potentials (SMP) was greater in 2015 and 2017, with driest IT treatments reaching approximately −140 kPa before harvest. In 2016, however, the driest IT treatment reached a SMP of −64 kPa due to above average rainfall events.
Thomson and Fisher [35] analyzed the relationship between root zone SMP and cotton yield in Mississippi Delta and reported that cotton should be irrigated at SMP of −60 kPa. The soil type of their experiment was clay in the Sharkey series, which is similar to the soil type in the present study. Assuming that their irrigation trigger point applies to this study, no irrigation was required after IT1 in 2016 since root zone SMP did not drop below this limit. In other words, the additional irrigations applied in IT2 and IT3 did not help with removing any water stress. This explains the lack of any significant difference in measured parameters among IT treatments in 2016. In contrast, soil water content was depleted well beyond the −60 kPa threshold in both 2015 and 2017, resulting in a larger response to IT treatments.
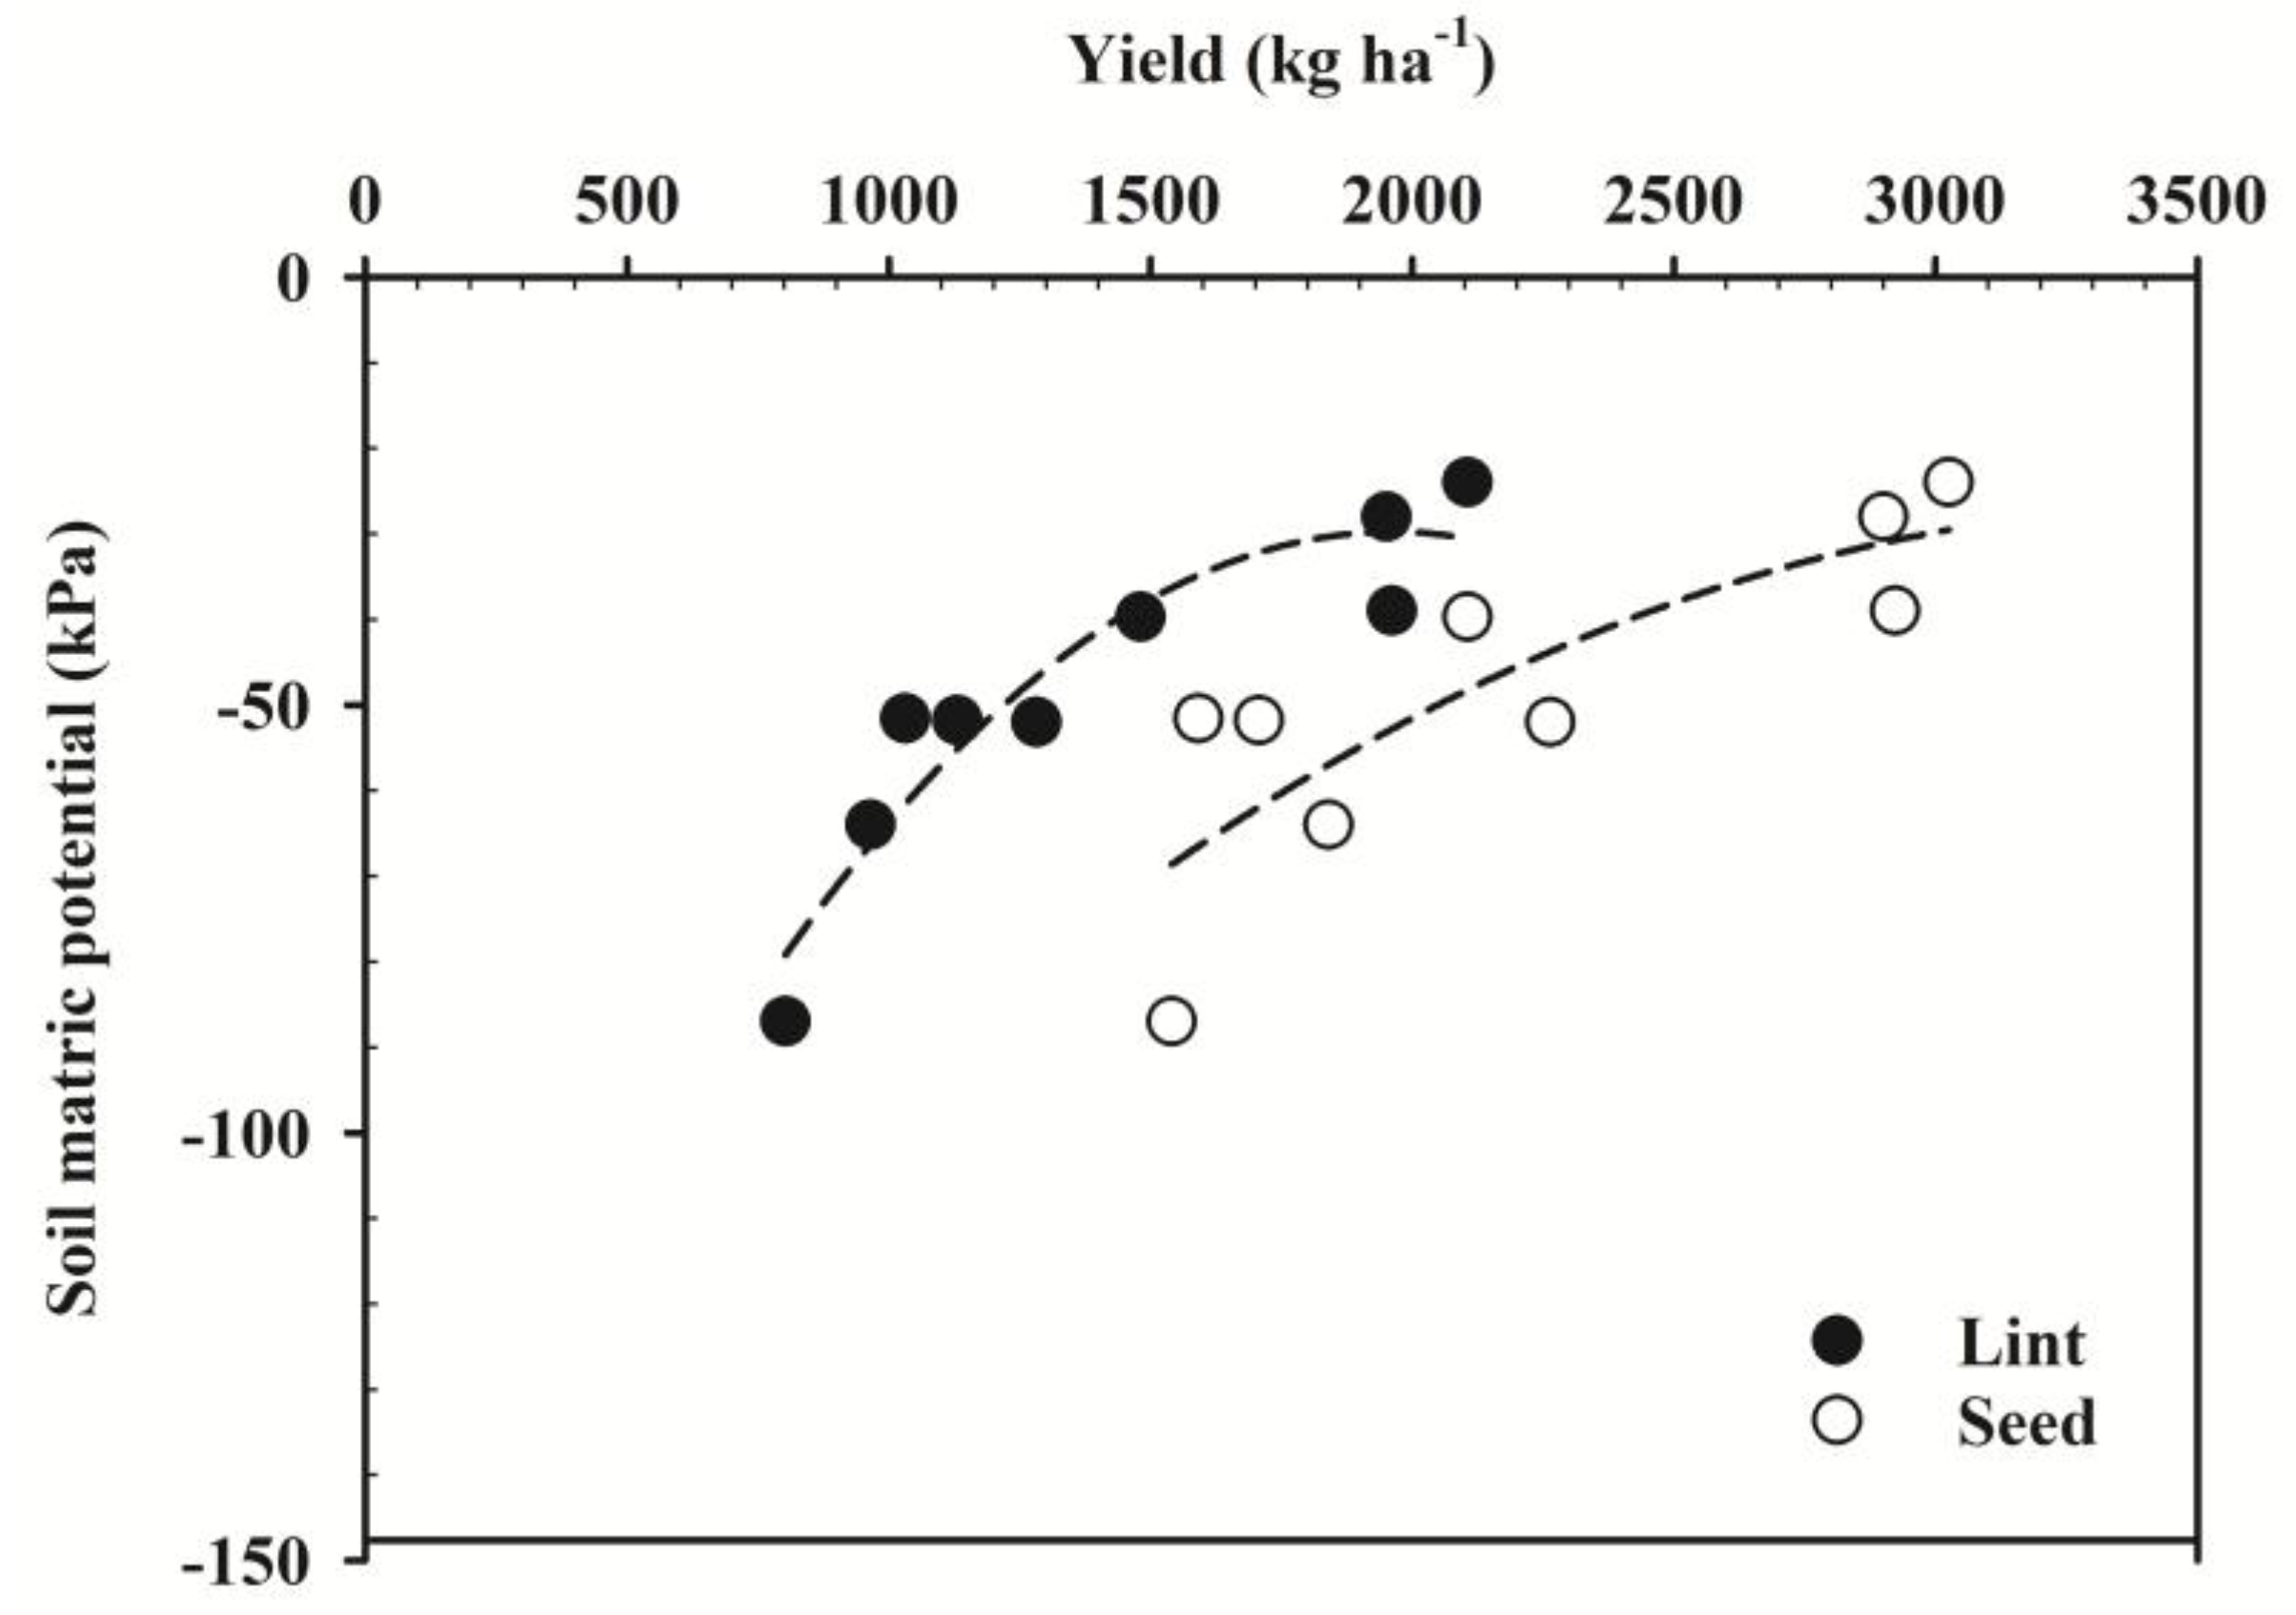
Plotting lint and seed yields against the average late-season SMP revealed strong relationships that had the form of quadratic equations with coefficients of determination (R2) of 0.89 and 0.67, respectively (Figure 4). The coefficients of developed quadratic equations are provided in Table 9. According to these relationships, lint and seed yields plateaued around average SMP of −30 kPa, which is close to the field capacity limit for most soils. Maintaining SMP at higher levels than −30 kPa would not result in improved cotton performance. Similar relationships have been reported between cotton yield and applied irrigation water in Turkey [36] and Texas [37] where cotton yield increased with applied water to a certain limit and then decreased if more water was applied, especially during late-season.
To the authors’ best knowledge, there is no published research investigating the effects of late-season soil water content on cotton yields. Previous studies have mostly explored yield response to applied water [36,37,38]. One advantage of developing yield-SMP relationships as opposed to yield-applied water relationships is that the former can be used as a decision-making tool by cotton producers in managing late-season cotton irrigation to achieve target levels of yield. As the results of the present study suggest, the maximum yield can be achieved when average soil moisture is kept around field capacity. However, some level of deficit irrigation may be either unavoidable due to water scarcity, or desirable due to the costs of purchasing and conveying (pumping and pressurizing) irrigation water. Under these conditions, producers can optimize deficit irrigation regimes by monitoring SMP to maximize water and energy savings and minimize yield losses.

3.5. Water Conservation

Since earlier irrigation termination can be used as a method to reduce cotton irrigation application and conserve water resources, the effects of variable termination dates on cotton performance and irrigation demand were further investigated. Table 10 presents changes in irrigation amount, cotton yield, lint value, and fiber quality for IT1 and IT2 treatments as percentages of the same parameters for the IT3 treatment (the latest termination date). Since the AFIS properties were not significantly different among the three IT treatments, they were not included in this analysis. When averaged across the three study years, reductions in all parameters were observed in response to earlier IT. In other words, irrigation water can be saved by earlier IT, but this will be achieved at the cost of lower lint and seed yields, lower micronaire, and potentially lower uniformity and strength.
Changes in studied parameters were highly variable among years and treatments. This large range of variations was mainly due to differences in the amount and timing of rainfall. Both the largest saving in irrigation and the smallest reduction in yield were achieved in 2016, which recorded above average rainfall. This suggests that late-season precipitation plays an important role in the effectiveness of IT practices. It also highlights the need for tools such as soil moisture monitoring to assist producers with making day-to-day decisions on irrigation management. When averaged over the three years of study that included significantly different rainfall amounts and patterns, 28 and 16% savings in irrigation applications were obtained with IT1 and IT2 treatments, respectively. However, these reductions in applied water resulted in similar percentages of declines in lint yield and lint value for the same IT treatments. Seed yield and micronaire were also impacted considerably, but fiber length, uniformity, and strength were minimally affected, with percent changes ranging from −3 to 1%. According to these findings, the yield declines associated with adopting earlier IT dates in the study area are so significant that render these practices economically unviable, unless revenue losses are compensated by economic gains in other areas. Two potential sources of economic gains caused by reducing irrigation applications are (i) increasing harvested area using the salvaged water; and, (ii) reducing pumping and conveyance costs, especially if the water sources (surface or ground) are located far from the application site.
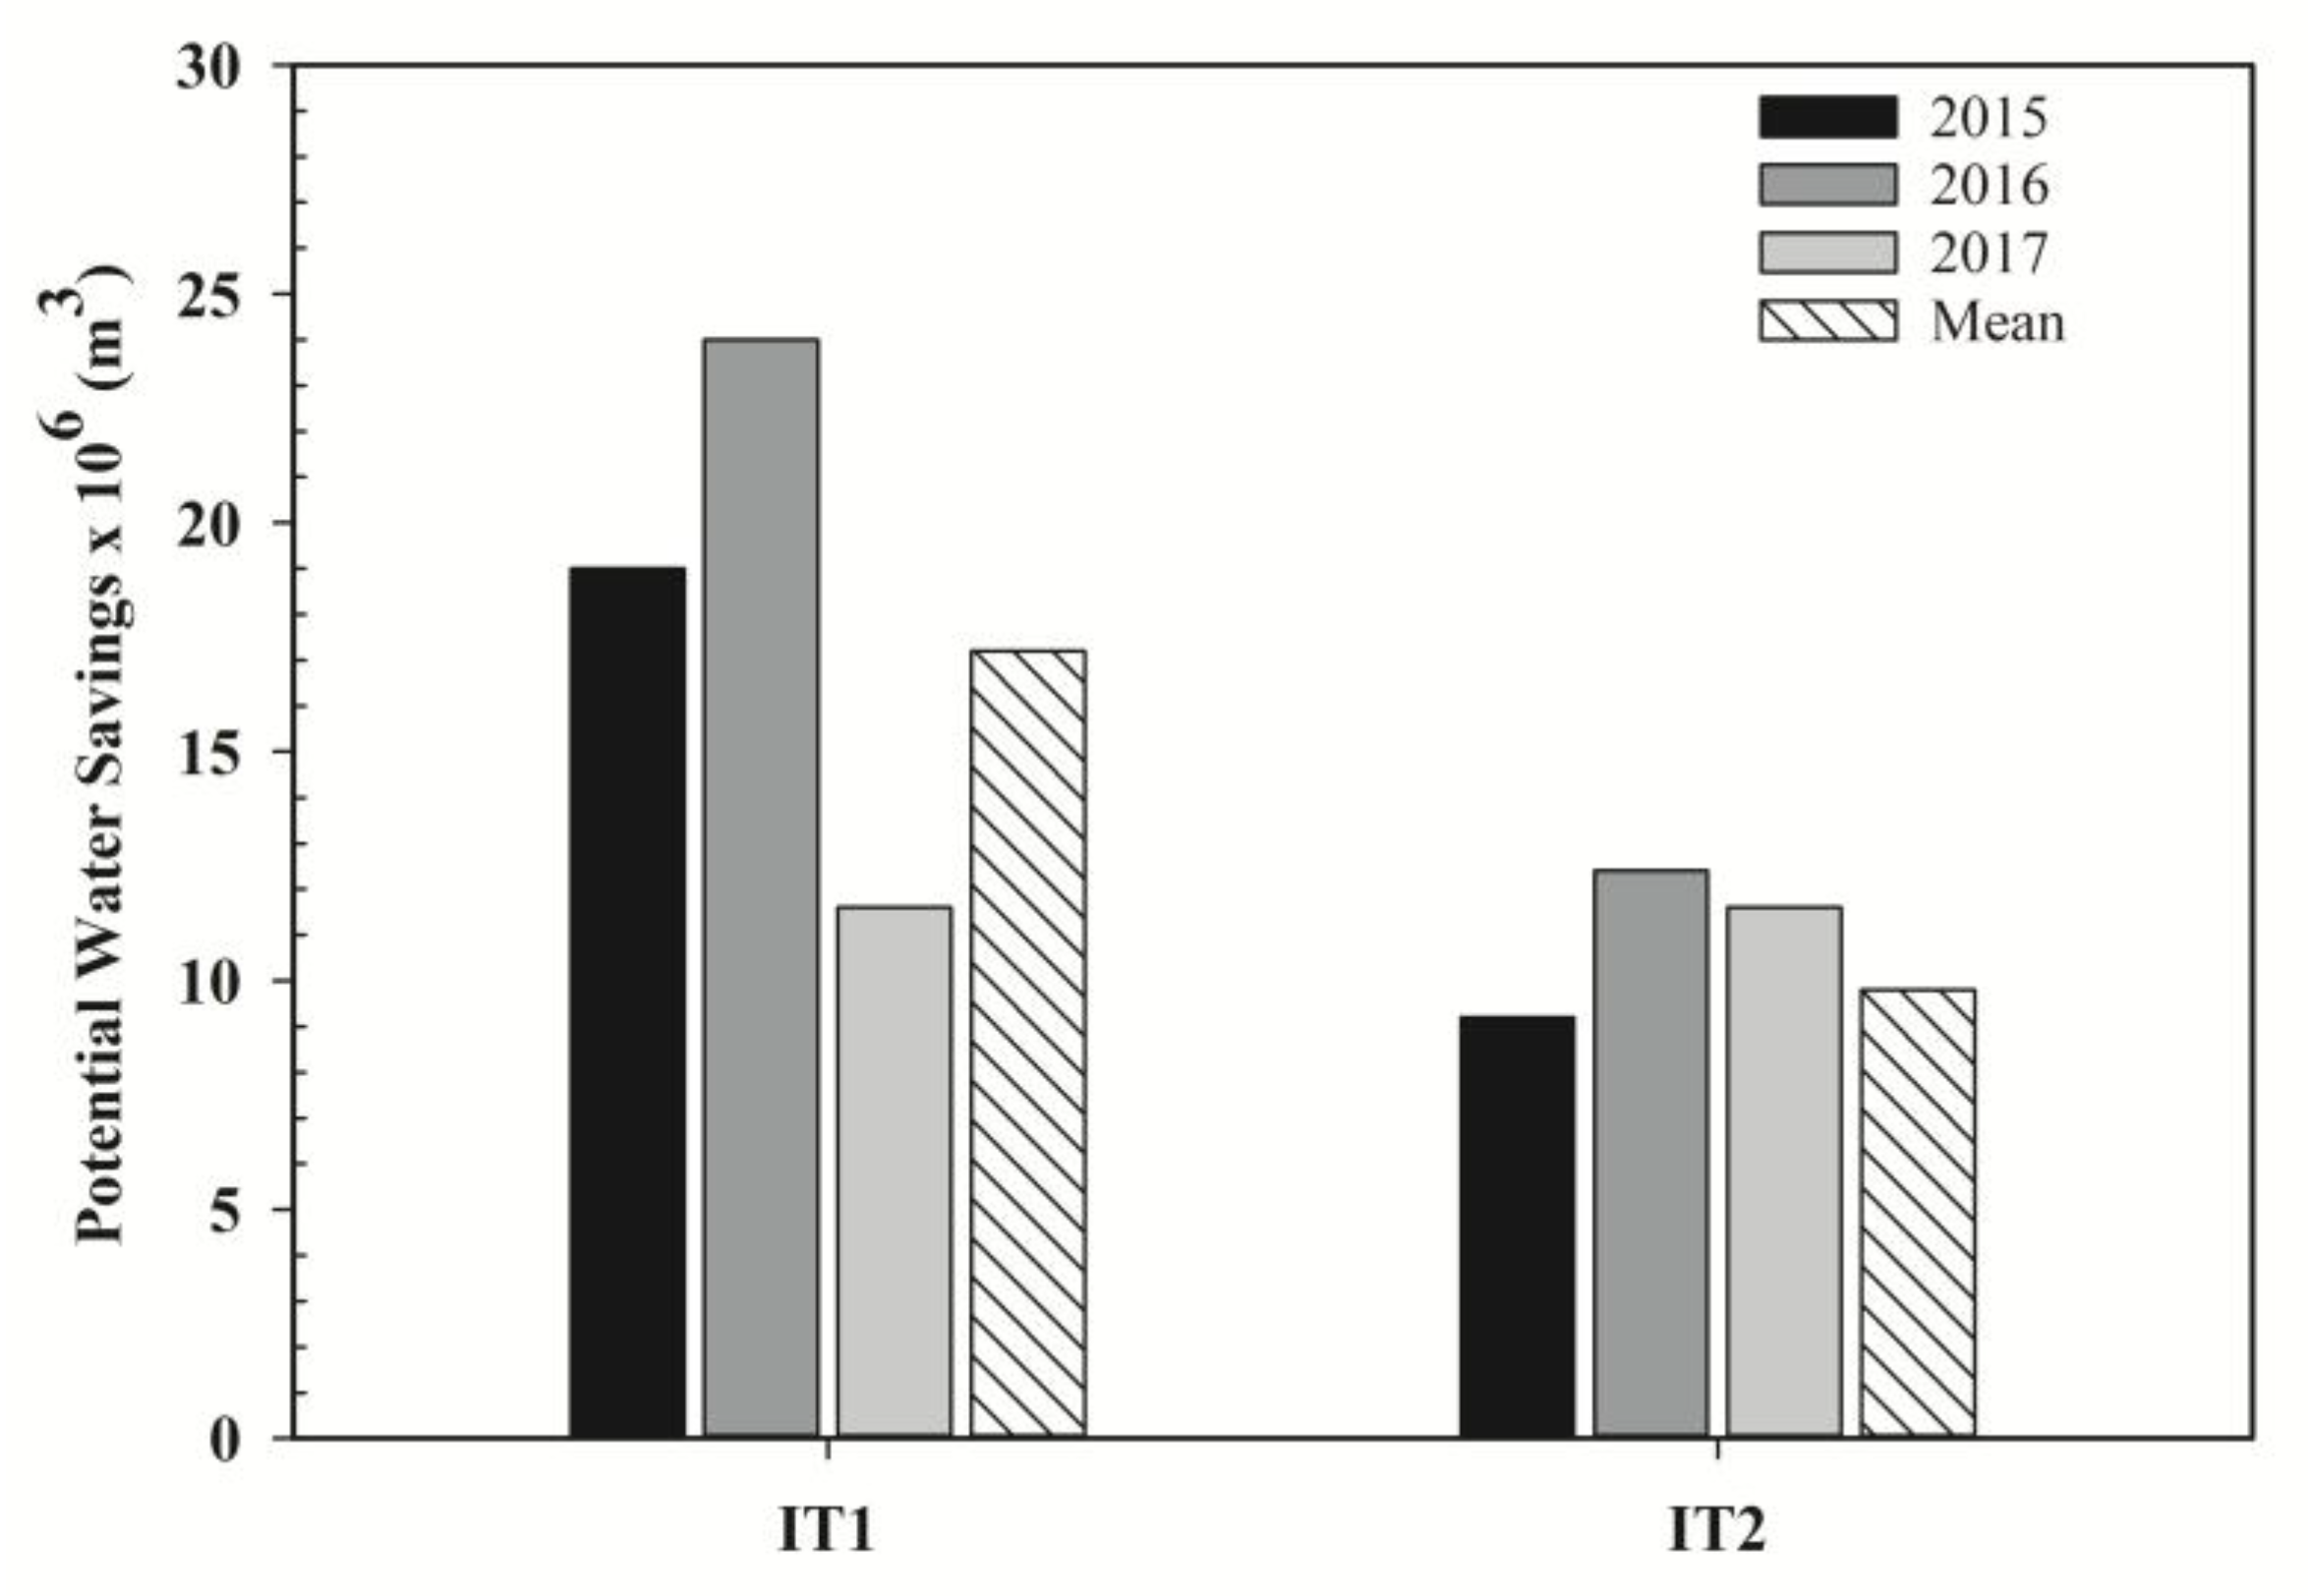
The potential water savings from adoption of IT and IT2 treatments can be extrapolated to the entire Lugert-Altus Irrigation District, using water release data from Lake Altus-Lugert. Total water releases were 65, 73, and 46 million m3 in 2015, 2016, and 2017, respectively [39]. The water delivery to the district is usually terminated around the end of August [5], which coincide with the IT3 timing in this study. Thus, the IT3 treatment was used as the benchmark for estimating the potential water savings across the district in each study year and on average. The estimated water savings ranged from 11.6 to 24.0 million m3 for IT1 and from 9.2 to 12.4 million m3 for IT2 during the study years. The average potential water savings for IT1 was 17.2 million m3, about 1.75 times larger than the average saving of 9.8 million m3 for IT2 (Figure 5).

4. Conclusions

The effects of variable irrigation termination (IT) dates on cotton yield, fiber quality and irrigation requirement were investigated in a field experiment in southwest Oklahoma during three growing seasons. Three weekly-spaced IT treatments were implemented in each year, with IT1 and IT3 treatments representing the earliest and the latest termination dates, respectively. The results showed a general increase in cotton yield with delaying of irrigation termination. However, the magnitude and statistical significance of this increase were largely dependent on the amount and distribution of late-season rainfall. A season characterized by hot and dry conditions during the months of August and September resulted in lint and seed yields that were significantly different amongst the IT treatments, whereas no difference was observed during a season with above normal rainfall. When averaged over the three seasons, lint yields were significantly different among all treatments. Seed yields for IT1 and IT2 were both similar to each other and significantly smaller than the yield of IT3. Late-season rainfall had a similar impact on fiber quality. On average, micronaire, uniformity, and strength were significantly impacted by IT treatments.
The relationships between cotton yield parameters and heat units accumulated from planting to IT and from physiological cutout to IT were positive, but weak and not significant, except in case of the seed yield and heat units from planting to IT. In contrast, strong positive relationships were found between cotton yield and root zone water content. The late-season soil matric potential can be monitored in the cotton root zone using soil moisture sensors and then used as a practical decision-making tool in optimizing IT management. When benchmarked against the latest IT treatment (IT3), the earlier treatments of IT1 and IT2 resulted in 28 and 16% reductions in applied irrigation amounts on average. However, these reductions were accompanied with similar percentages of declines in lint yield and value. Seed yield and micronaire were also impacted negatively, along with smaller declines in fiber length, uniformity, and strength. Additional research is needed to investigate the economic trade-offs between revenue losses from declined lint value and reductions in water and energy expenses when implementing earlier irrigation termination. Assuming all cotton producers within the major irrigation district in southwest Oklahoma adopt earlier IT practices, an average water savings of 17.2 and 9.8 million m3 can be achieved on a seasonal basis for IT1 and IT2 treatments, respectively. Future research should utilize long-term weather data in conjunction with additional tools such as crop growth models to further evaluate the effects of variable IT scenarios.
Author Contributions

Conceptualization, R.B. and S.T.; methodology, R.B. and S.T.; formal analysis, R.B., B.M. and S.T.; investigation, B.M., S.D. and S.T.; writing—original draft preparation, B.M., S.D. and S.T.; writing—review and editing, B.M., S.D., R.B. and S.T.; project administration, R.B. and S.T.; funding acquisition, S.T.

Funding

This material is based upon work supported by the Natural Resources Conservation Service, United States Department of Agriculture, under number 69-3A75-16-013. Additional funding was provided by Cotton Incorporated Oklahoma State Program under project number 15-657OK and by the Oklahoma Water Resources Center through the U.S. Geological Survey 104(b) grants program.

Acknowledgments

The authors are grateful to Jerry Goodson, Extension Assistant, and the Integrated Pest Management Program (Tom Royer) of Oklahoma Cooperative Extension Service for their support and assistance with the field work.

Conflicts of Interest

The authors declare no conflict of interest.

References

  1. Evett, S.R.; Howell, T.A.; Ibragimov, N.M.; Hunsaker, D.J. Cotton. In Crop Yield Response to Water; Steduto, P., Hsiao, T.C., Fereres, E., Raes, D., Eds.; Food and Agricultural Organization of the United Nations: Rome, Italy, 2012; Volume 66, pp. 154–161. [Google Scholar]
  2. National Cotton Council of America. Available online: http://www.cotton.org/econ/cropinfo/cropdata/rankings.cfm (accessed on 7 June 2008).
  3. Gowda, P.H.; Baumhardt, R.L.; Esparza, A.M.; Marek, T.H.; Howell, T.A. Suitability of Cotton as an Alternative Crop in the Ogallala Aquifer Region. Agron. J. 2007, 99, 1397–1403. [Google Scholar] [CrossRef] [Green Version]
  4. United States Department of Agriculture—National Agricultural Statistics Service. Available online: https://quickstats.nass.usda.gov/ (accessed on 22 May 2018).
  5. Strawn, J.C. Managemnet Practices, Issues and Problems of Cotton Procedures in Southwestern Oklahoma. Master’s Thesis, Oklahoma State University, Stillwater, Oklahoma, 1994. [Google Scholar]
  6. Franke, T.C.; Kelsey, K.D.; Royer, T.A. Pest Management Needs Assessment for Oklahoma Canola Producers; Division of Agricultural Sciences and Natural Resources, Oklahoma State University: Stillwater, OK, USA, 2009. [Google Scholar]
  7. Evers, A.J.M.; Elliott, R.L.; Stevens, E.W. Integrated decision making for reservoir, irrigation, and crop management. Agric. Syst. 1998, 58, 529–554. [Google Scholar] [CrossRef]
  8. Ziolkowska, J.R. Profitability of irrigation and value of water in Oklahoma and Texas agriculture. Int. J. Water Resour. Dev. 2018, 34, 944–960. [Google Scholar] [CrossRef]
  9. Mittelstet, A.R.; Storm, D.E.; Stoecker, A.L. Using SWAT to simulate crop yields and salinity levels in the North Fork River Basin, USA. Int. J. Agric. Biol. Eng. 2015, 8, 110–124. [Google Scholar]
  10. Osborn, N.I.; Hardy, R.H. Statewide Groundwater Vulnerability Map of Oklahoma; Oklahoma Water Resources Board: Oklahoma City, OK, USA, 1999. [Google Scholar]
  11. McFarland, M.L.; Lemon, R.; Stichler, C. Irrigation Water Quality: Critical Salt Levels for Peanuts, Cotton, Corn and Grain Sorghum; Texas Cooperative Extension: College Station, TX, USA, 2002. [Google Scholar]
  12. Taghvaeian, S.; Fox, G.; Boman, R.; Warren, J. Evaluating the Impact of Drought on Surface and Groundwater Dependent Irrigated Agriculture in Western Oklahoma. In Proceedings of the 2015 ASABE/IA Irrigation Symposium: Emerging Technologies for Sustainable Irrigation-A Tribute to the Career of Terry Howell, Sr. Conference Proceedings, Long Beach, CA, USA, 10–12 November 2015; pp. 1–8. [Google Scholar]
  13. Krueger, E.S.; Yimam, Y.T.; Ochsner, T.E. Human factors were dominant drivers of record low streamflow to a surface water irrigation district in the US southern Great Plains. Agric. Water Manag. 2017, 185, 93–104. [Google Scholar] [CrossRef]
  14. CDM Smith; OWRB. Incorporating Climate Change into Water Supply Planning and Yield Studies: A Demonstration and Comparison of Practical Methods; Oklahoma Water Resources Board: Oklahoma City, OK, USA, 2012. [Google Scholar]
  15. Bordovsky, J.P.; Mustian, J.T.; Ritchie, G.L.; Lewis, K.L. Cotton irrigation timing with variable seasonal irrigation capacities in the Texas South Plains. Appl. Eng. Agric. 2015, 31, 883–897. [Google Scholar] [CrossRef]
  16. Grimes, D.W.; Dickens, W.L. Dating Termination of Cotton Irrigation from Soil Water-Retention Characteristics 1. Agron. J. 1974, 66, 403–404. [Google Scholar] [CrossRef]
  17. Karam, F.; Lahoud, R.; Masaad, R.; Daccache, A.; Mounzer, O.; Rouphael, Y. Water use and lint yield response of drip irrigated cotton to the length of irrigation season. Agric. Water Manag. 2006, 85, 287–295. [Google Scholar] [CrossRef]
  18. Reeves, H. Effects of Irrigation Termination Date on Cotton Yield and Fiber Quality. Master’s Thesis, Texas Tech University, Lubbock, TX, USA, 2012. [Google Scholar]
  19. Reba, M.; Teague, T.; Vories, E. A retrospective review of cotton irrigation on a production farm in the Mid-South. J. Cotton Sci. 2014, 18, 137–144. [Google Scholar]
  20. Monge, J.J.; Teague, T.G.; Cochran, M.J.; Danforth, D.M. Economic Impacts of Termination Timing for Irrigation and Plant Bug Control; Arkansas Agricultural Experiment Station: Fayetteville, AR, USA, 2007. [Google Scholar]
  21. Vories, E.; Greene, J.; Teague, T.G.; Stewart, J.; Phipps, B.; Pringle, H.; Clawson, E.L.; Hogan, R.; O’Leary, P.; Griffin, T.W. Determining the optimum timing for the final furrow irrigation on Mid-South cotton. Appl. Eng. Agric. 2011, 27, 737–745. [Google Scholar] [CrossRef]
  22. Hogan, R., Jr.; Vories, E.D.; Greene, J.K.; Robertson, W.C.; Stewart, J.; Tacker, P. Economic effect of late irrigation on mid-south cotton. In Proceedings of the Beltwide Cotton Conference, New Orleans, LA, USA, 4–7 January 2005; pp. 4–7. [Google Scholar]
  23. Buttar, G.S.; Aujla, M.S.; Thind, H.S.; Singh, C.J.; Saini, K.S. Effect of timing of first and last irrigation on the yield and water use efficiency in cotton. Agric. Water Manag. 2007, 89, 236–242. [Google Scholar] [CrossRef]
  24. Lascano, R.J.; Baumhardt, R.L.; Goebel, T.S.; Baker, J.T.; Gitz, D.C., III. Irrigation Termination Thermal Time and Amount on Cotton Lint Yield and Fiber Quality. Open J. Soil Sci. 2017, 7, 216–234. [Google Scholar] [CrossRef]
  25. Larson, J.A.; Mapp, H.P.; Verhalen, L.M.; Banks, J.C. Adapting a cotton model for decision analyses: A yield-response evaluation. Agric. Syst. 1996, 50, 145–167. [Google Scholar] [CrossRef]
  26. Ritchie, G.L.; Bednarz, C.W.; Jost, P.H.; Brown, S.M. Cotton Growth and Development; University of Georgia Cooperative Extension: Athens, GA, USA, 2007. [Google Scholar]
  27. SigmaPlot for Windows, version 14.0; Systat Software, Inc.: San Jose, CA, USA, 2018.
  28. Teague, T.G. Final Irrigation Timing 2007–Cotman and Crop Termination in Arkansas Cotton; Arkansas Agricultural Experiment Station: Fayetteville, AR, USA, 2007. [Google Scholar]
  29. Cull, P.O.; Hearn, A.B.; Smith, R.C.G. Irrigation scheduling of cotton in a climate with uncertain rainfall. Irrig. Sci. 1981, 2, 127–140. [Google Scholar] [CrossRef]
  30. Cetin, O.; Basbag, S. Effects of climatic factors on cotton production in semi-arid regions—A review. Res Crop 2010, 11, 785–791. [Google Scholar]
  31. Snowden, C.; Ritchie, G.; Cave, J.; Keeling, W.; Rajan, N. Multiple Irrigation Levels Affect Boll Distribution, Yield, and Fiber Micronaire in Cotton. Agron. J. 2013, 105, 1536–1544. [Google Scholar] [CrossRef]
  32. Vories, E.D.; Glover, R.E. Effect of Irrigation Timing on Cotton Yield and Earliness; Arkansas Agricultural Experiment Station: Fayetteville, AR, USA, 2000. [Google Scholar]
  33. Silvertooth, J.; Galadima, A. Evaluation of Irrigation Termination Effects on Fiber Micronaire and Yield of Upland Cotton, 2000–2002; University of Arizona College of Agriculture and Life Sciences: Tucson, AZ, USA, 2003. [Google Scholar]
  34. Peng, S.; Krieg, D.R.; Hicks, S.K. Cotton lint yield response to accumulated heat units and soil water supply. Field Crop. Res. 1989, 19, 253–262. [Google Scholar] [CrossRef]
  35. Thomson, S.J. Calibration and Use of the UGA EASY Evaporation Pan for Low Frequency Sprinkler Irrigation of Cotton in a Clay Soil. J. Cotton Sci. 2006, 10, 1621–1628. [Google Scholar]
  36. Cetin, O.; Bilgel, L. Effects of different irrigation methods on shedding and yield of cotton. Agric. Water Manag. 2002, 54, 1–15. [Google Scholar] [CrossRef]
  37. Wanjura, D.F.; Upchurch, D.R.; Mahan, J.R.; Burke, J.J. Cotton yield and applied water relationships under drip irrigation. Agric. Water Manag. 2002, 55, 217–237. [Google Scholar] [CrossRef]
  38. Stone, J.F.; Nofziger, D.L. Water use and yields of cotton grown under wide-spaced furrow irrigation. Agric. Water Manag. 1993, 24, 27–38. [Google Scholar] [CrossRef]
  39. United States Army Corps of Engineers. Monthly Charts for Altus Lake, OK. Available online: http://www.swt-wc.usace.army.mil/ALTUcharts.html (accessed on 3 September 2018).
Figure 1. The research field and its location in southwest Oklahoma (Google Earth image).
Agriculture 09 00039 g001
Figure 2. Yield response to accumulated heat units from (a) Planting to IT and (b) Cutout to IT.
Agriculture 09 00039 g002
Figure 3. Treatment averages of soil matric potential in (a) 2015, (b) 2016 and (c) 2017.
Agriculture 09 00039 g003aAgriculture 09 00039 g003b
Figure 4. Yield response to soil matric potential.
Agriculture 09 00039 g004
Figure 5. Potential water savings through adoption of earlier irrigation terminations in the Lugert-Altus Irrigation District.
Agriculture 09 00039 g005
Table 1. Meteorological parameters for May–September during each of the three study years and the long-term (1981–2010) period.
Parameter201520162017Long-Term
Total Prec. 1 (mm)451525472409
Mean Rs 2 (MJ m−2)22.323.123.623.9
Min. Tair 3 (°C)19.319.118.518.5
Max. Tair (°C)32.531.831.633.1
Min. RH 4 (%)38.842.740.838.0
Max. RH (%)90.194.493.586.0
Mean U2 5 (m s−1)3.12.93.04.5
1 Annual precipitation; 2 Daily accumulation of solar radiation; 3 Daily air temperature; 4 Daily relative humidity; 5 Daily wind speed at 2.0 m above the ground.
Table 2. Chemical characteristics of topsoil at the study site.
Soil Layer (m)EC (dS m−1)pHSAR
0.0–0.154.08.08.7
0.15–0.309.37.88.7
0.30–0.4513.77.811.3
Table 3. Dates of actual irrigation termination (IT) for each treatment and year.
Treatment201520162017
IT117 August16 August10 August
IT224 August23 August10 August *
IT331 August30 August29 August
* The second IT date could not be achieved in 2017 due to continued precipitation.
Table 4. Planting and harvest dates and final plant stand (plant ha−1).
YearPlanting DateHarvest DatePlant Stand
20154 June12 November165,560
201628 May21 November101,313
201725 May1 November93,900
Table 5. Lint and seed yields for all treatments and years. Means followed by the same letter are not significantly different within years, at a 0.05 significance level according to the least significant difference (LSD).
TreatmentLint Yield (kg ha−1)Seed Yield (kg ha−1)
2015201620173-Year2015201620173-Year
IT1802 a1962 a1131 a1276 a1541 a2923 a1707 a2035 a
IT2965 b1951 a1031 * a1369 b1841 b2900 a1591* a2182 a
IT31282 c2106 a1481 b1623 c2264 c3025 a2106 b2465 b
p-value<0.0010.0870.001<0.001<0.0010.3690.003<0.001
LSD0.0549NS122 96NS184
IT: Irrigation termination; NS: Not significant; * Termination date was the same as for IT1.
Table 6. Cotton HVI properties. Within each year, means followed by the same letter are not significantly different at the 0.05 level.
Micronaire (Units)
Treatment2015201620173-Year
IT12.87 a4.40 a3.73 ab3.65 a
IT22.87 a4.40 a3.60 * a3.64 a
IT33.30 b4.47 a3.90 b3.89 b
p-value0.0180.9070.0350.021
LSD0.050.27NS0.20
Length (mm)
Treatment2015201620173-Year
IT128 a29 a29 a29 a
IT230 b29 a28 * a30 a
IT329 ab30 a29 a29 a
p-value0.0400.5850.3270.121
LSD0.050.02NSNS
Uniformity (%)
Treatment2015201620173-Year
IT180.7 a82.4 a82.0 a81.7 a
IT282.5 b82.7 a81.5 * a82.6 b
IT382.4 b83.4 a82.5 a82.8 b
p-value0.0350.2320.2790.007
LSD0.051.3NSNS
Strength (g tex−1)
Treatment2015201620173-Year
IT128.80 a31.80 a29.83 a30.02 a
IT230.80 b31.27 a29.37 * a30.89 ab
IT330.57 b31.33 a30.90 a30.93 b
p-value0.0080.6700.3010.079
LSD0.050.96NSNS
IT: Irrigation termination; NS: Not significant; * Termination date was the same as for IT1.
Table 7. Cotton advanced fiber information system (AFIS) properties. Within each year, means followed by the same letter are not significantly different at the 0.05 level according to the LSD.
Neps (Count g−1)
Treatment2015201620173-Year
IT1464.3 a181.0 a260.7 a309.8 a
IT2415.0 a219.7 a303.3 * a302.4 a
IT3414.0 a185.0 a248.7 a282.6 a
p-value0.7330.2600.2190.450
LSD0.05NSNSNS
Short Fiber Content (%)
Treatment2015201620173-Year
IT110.47 a8.50 a10.57 a10.29 a
IT29.67 a9.80 a12.93 * a10.38 a
IT310.40 a8.77 a11.07 a10.09 a
p-value0.8640.3150.2050.908
LSD0.05NSNSNS
Fineness (mtex)
Treatment2015201620173-Year
IT1143.0 a165.3 a164.3 a156.3 a
IT2144.3 ab163.0 a157.3 * b156.0 a
IT3152.0 b164.3 a165.7 a160.7 a
p-value0.0760.8710.0510.121
LSD0.05NSNSNS
Maturity Ratio (Units)
Treatment2015201620173-Year
IT10.827 a0.867 a0.840 ab0.839 a
IT20.837 a0.847 a0.817 * a0.838 a
IT30.833 a0.860 a0.847 b0.847 a
p-value0.7580.1740.0910.517
LSD0.05NSNSNS
IT: Irrigation termination; NS: Not significant; * Termination date was the same as for IT1.
Table 8. Cumulative heat units (HU) during different periods of the growing season.
YearTreatmentCumulative HU (°C)
Planting-ITCutout-ITIT-Harvest
2015IT195137578
IT21017103512
IT31100186429
2016IT1100080540
IT21060141480
IT31132213408
2017IT190713558
IT2 *90713558
IT31100193366
* Termination date was the same as for IT1.
Table 9. Coefficients of the quadratic equation: soil matric potential = a + b × yield + c × yield2.
Yield Parameterabc
Lint−171.2550.144−3.677 × 10⁻⁵
Seed−158.4030.075−1.057 × 10⁻⁵
Table 10. Percent changes in irrigation amount, lint and seed yields, lint value, and fiber quality relative to the IT3 treatment.
YearITIrrig.LintSeedLint ValueMic.LengthUnif.Strength
2015IT1−29−37−32−41−13−1−2−6
IT2−14−25−19−28−13+10+1
2016IT1−33−7−3−7−2−1−1+2
IT2−17−7−4−7−2−2−10
2017IT1−25−24−19−24−4+1−1−4
IT2 *−25−30−24−32−8−1−1−5
MeanIT1−28−25−20−26−7−1−1−3
IT2−16−16−11−18−8−1−11
IT: Irrigation termination; Irrig.: Irrigation; Mic.: Micronaire; Unif.: Uniformity; * Termination date was the same as for IT1.