Communication

Ecotone Dynamics and Stability from Soil Perspective: Forest-Agriculture Land Transition

1
Department of Geology and Soil Science, Mendel University in Brno, Zemědělská 1, 613 00 Brno, Czech Republic
2
Department of Production Engineering, Warsaw University of Life Sciences, 02-787 Warsaw, Poland
*
Author to whom correspondence should be addressed.
Agriculture 2019, 9(10), 228; https://doi.org/10.3390/agriculture9100228
Submission received: 26 August 2019 / Revised: 16 October 2019 / Accepted: 18 October 2019 / Published: 21 October 2019
(This article belongs to the Special Issue Soil Fertility)

Abstract

:
Topographic and edaphic gradients usually arrange ecotonal boundaries. Although the interrelationships between vegetation and edaphic factors are relevant in most types of ecotones, they are not adequately documented. The clearly defined forest-agriculture land ecotone at the Proklest experimental site of the Training Forest Enterprise (T.F.E), Masaryk Forest Křtiny, Czech Republic presents an opportunity to investigate these inter-relationships. Our aim was to determine ecotone effects reflected by changes in soil reaction and other soil physical properties across this clearly defined forest-agriculture land ecotone. We selected eleven sampling spots: four in the forest zone, four in the agriculture land, and three in the ecotone zone between the forest and agriculture land. Every month from April to November, soil samples were collected at a depth of 5 cm. All the soil samples collected were examined for minimal air capacity, actual and potential soil reaction, and maximum capillary water capacity. The forest soil was slightly more acidic when compared to the agriculture soil, with the ecotone zone recording the lowest pH value. The maximum capillary water capacity was higher in the forest region than in the agriculture land with a sharp decline in the ecotone zone where the lowest value was recorded. The minimum air capacity was much higher in the forest region than in the agriculture land. There was a marked decline in the ecotone region where the lowest value was observed. Our results highlight the importance of soil as a factor affecting the distribution of plant communities along ecotones.

1. Introduction

Ecotone has been defined, explained, and identified by many scientists in various ways [1,2,3]. In a nutshell and from a soil science point of view, they are dynamic boundaries where soil physical and chemical properties (e.g., pH, salinity, capillary water, air capacity) change gradually due to the change in habitat and biodiversity [4,5,6,7]. In recent years, ecotone is considered an imperative topic in ecological research since it is the most sensitive part of the interfered ecosystems lying between biomes. Natural ecotone is dynamic in nature and is very sensitive to environmental changes. It can shift location or grow weaker and stronger. Ecotone characteristics make it the most unstable part in any ecosystem. As reported by past studies, ecotones are more biologically diverse than nearby areas, which means they have a high conservation value [8,9,10,11,12,13]. However, there is a lack of strong evidence to support this claim or to refute it.
Most of the studies on ecotone biodiversity have been focused on plants, birds, small mammals, insects, and, to some extent, soil fauna [14,15,16]. Spatial variations of soil properties across ecotones will be key in validating ecotone-dependent changes due to alteration in biological diversity from the soil’s viewpoint. Land use for cropping purposes also has a significant effect on soil biochemical properties like soil pH, soil organic carbon, soil nitrogen, soil phosphorus, cation exchange capacity, and exchangeable bases [17]. The research by Rhoades (2005) on vegetation and soil characteristics across a forest ecotone provides some insight on the stability of the plant communities at forest glades. In Rhoades’s study, the transition zone showed a sharp decline in soil phosphorus and nitrogen levels. On the other hand, there was a rapid increase in soil pH and extractable cations across the transition area (from forest to glade) [17]. The pH changes at the forest edge per Rhoades’s study provides a suitable environment not only for certain plant species at the adjoining biomes but also for soil microbial communities [7,17,18].
Soil pH is one of the most important if not the most important soil property, since it greatly affects the absorption of nutrients from the soil [19,20,21]. Soil surveys conducted by researchers in recent and ancient forest stands revealed significantly lower pH values in recent forest stands as compared to the ancient forest stands [22]. It is possible to attribute the lower pH values to cultivation activities resulting in the vegetative difference between the ancient and recent forest stands. This confirms the effect of soil properties on vegetation types with changing biomes [23]. The soil’s ability to retain plant water (maximum capillary capacity) and the soil’s aeration capacity (minimum air capacity) are crucial soil properties in addition to the soil reaction [24,25,26] in determining soil productivity. The present research is focused on how these soil properties tend to change across the forest-agricultural field to explain the edge effects. Although this study and that of Marfo et al., 2019, [6] stem from the same project, they were conducted at different experimental sites of the Training Forest Enterprise (T.F.E), Masaryk Forest Křtiny with different research plans.

2. Materials and Methods

Maximum capillary water capacity, minimum air capacity, and soil reaction were selected for analyses to determine edge effects from the soil’s perspective. These soil properties were chosen because, together, they give an idea of the soil’s fertility and productivity.

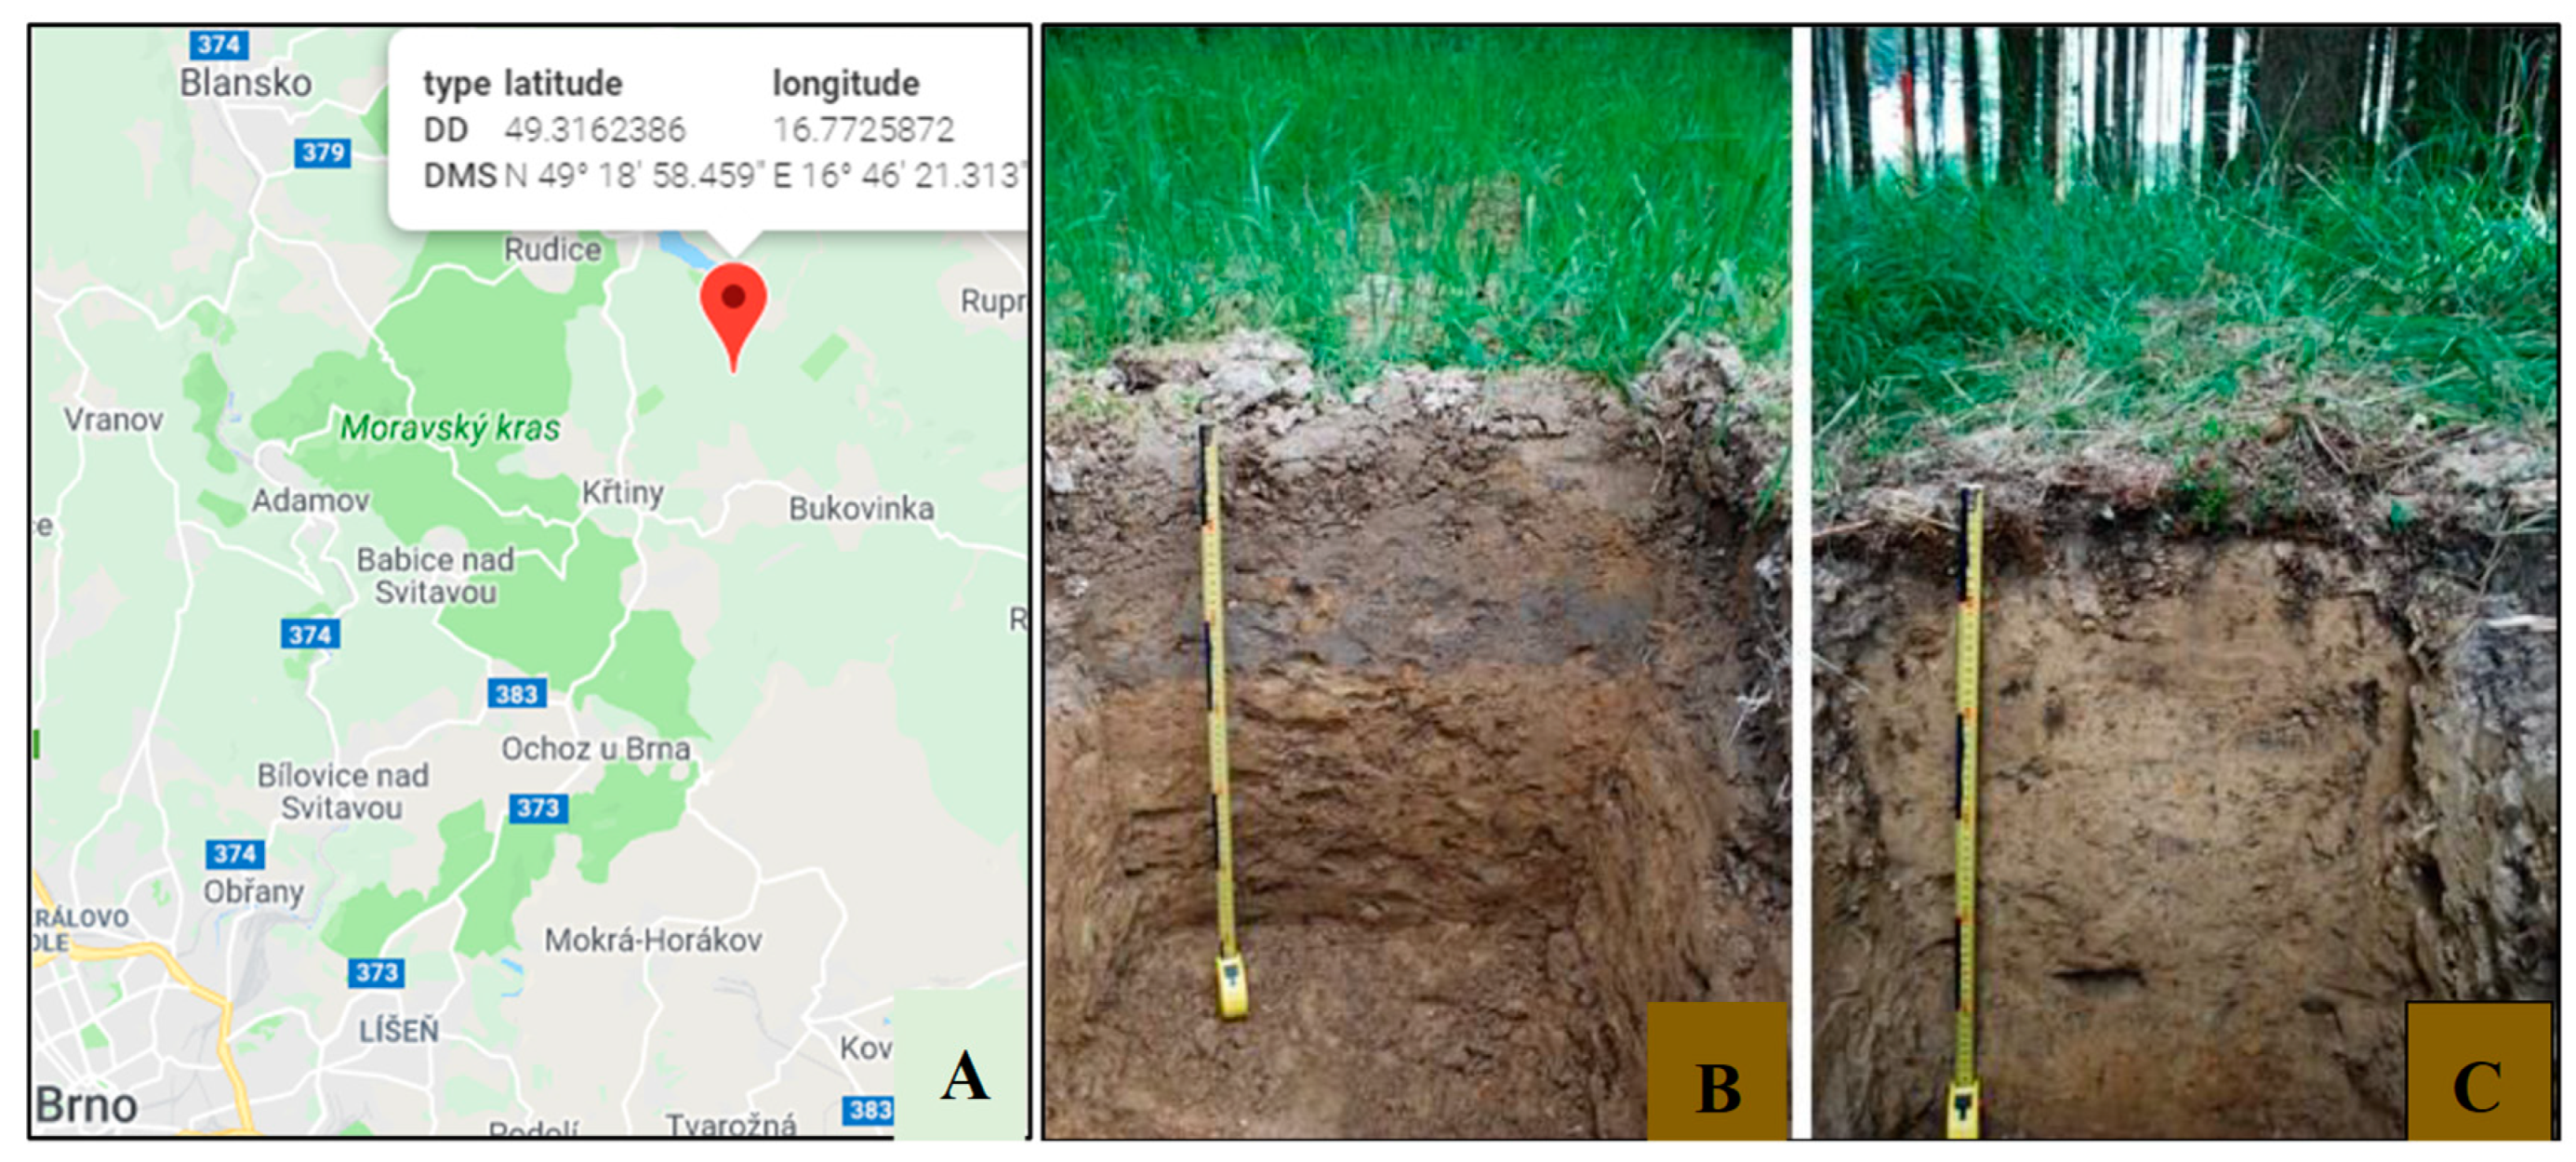
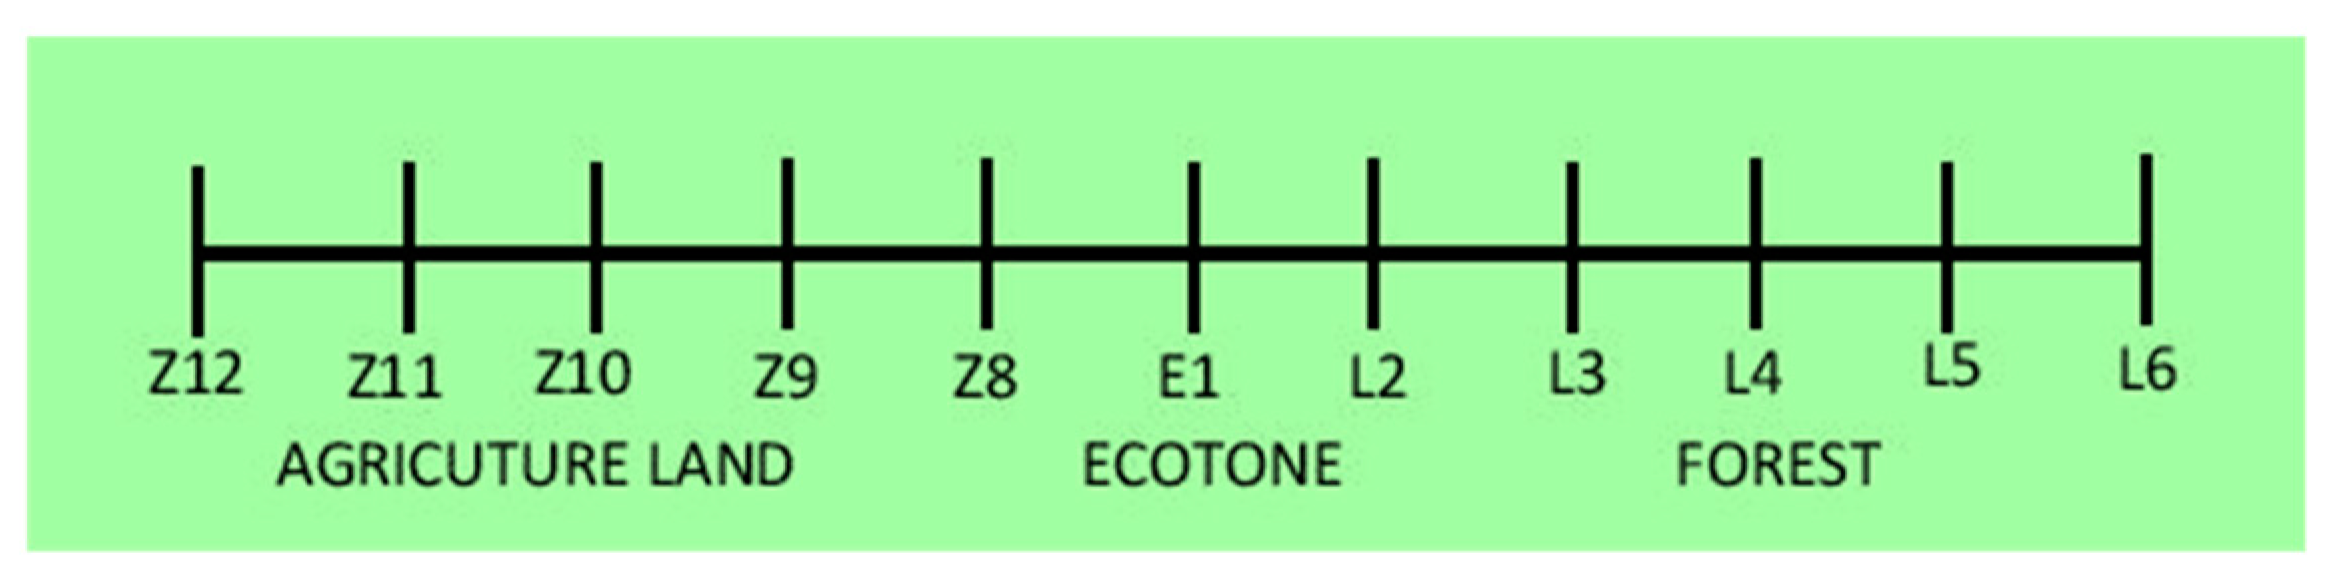
2.1. Sampling and Processing

Proklest experimental site of the Training Forest Enterprise (T.F.E), Masaryk Forest Křtiny, Czech Republic (GPS: 49.3162386N, 16.7725872E) was selected for the study (Figure 1B,C representing the soil profiles for the agriculture and forest sites, respectively). This forest—agriculture land ecotone is local, narrow, and the vegetation transition is visibly sharp.
Eleven sampling spots were selected at an interval of a 3-meter distance (Four spots in the agriculture land region, four spots in the forest region, and three ecotone spots). Sampling spots Z8 and L2 were at the boundary of the central spot (E1) and were considered part of the ecotone zone (Figure 2).
Sampling was done close to each spot at a depth of 5 cm from the Ah horizon. Samples were collected once a month from April to November 2015. The forest region is primarily composed of middle-aged Beech (Fagus) (33 years old, 550 m above sea level, 49.3162386N, 16.7725872E). The agriculture area was not under cultivation during the study period. The area had been ploughed and covered with fresh growing grass. However, it can be categorized as an arable land since it was mainly used to grow grains during the vegetative seasons of the year. Luvisols were the soils in both regions (forest and agriculture) [27,28,29]. The soil was sieved through a sieve of 5 mm and stored in a fridge at 4 °C [30]. Before the start of the experiments, the dry matter content of each soil sample was calculated, and the soil moisture content was maintained at 25%.

2.2. Physico-Chemical Analysis

According to the International Organization for Standardization (ISO 10390:2005) methodology, actual soil reaction and potential soil reaction were analyzed. The soil was homogenized with a 2-mm sieve and kept at 5 °C, and pH tested using the pHE-04 Glass Combination pH electrode. The soil reaction (pH) was measured using the two common methods (in water and 0.01 M CaCl2) [31]. According to Novak [32], maximum capillary water capacity and minimum air capacity were analyzed with minor modifications: soil samples collected from the Kopecky rings [33,34] were first weighed fresh, saturated for 24 h, given sufficient time to allow excess moisture to drain, weighed, and then dried to a constant weight (105 °C for 12 h). The following calculations were then used to determine the maximum capillary water capacity and the minimum air capacity.
Maximum capillary water capacity (ΘMKK):
Θ M K K =   m M K K m d v × 100
  • ΘMKK—maximum capillary water capacity (%)
  • mMKK—weight of the artificially saturated sample after 2 h of draining off moisture (g)
  • md—weight of the sample dried to the constant moisture (g)
  • V—sample volume in Kopecky’s soil sample ring (cm3)
Minimum air capacity (AMKK)
  • AMKK = PΘMKK
  • AMKK—minimum air capacity (%)
  • P—porosity (%)
  • ΘMKK—maximum capillary water capacity (%)
Porosity
P =   p s p d p s × 100
  • P—porosity (%)
  • p s —specific weight (g·cm3)
  • p d —bulk density (g·cm3)
Specific weight
p s =   m 1 [ m , + m 2 ] m 3
  • p S —specific weight (g·cm3)
  • m1—weight of soil sample dried to a constant weight (g)
  • m2—weight of pycnometer with distilled water (g)
  • m3—weight of pycnometer with the sample after boiling and distilled water (g)
Bulk density
p d =   c a v
  • p d —bulk density (g·cm3)
  • c—weight of Kopecky’s ring with lids and soil sample dried to a constant weight (g)
  • a—weight of Kopecky’s soil sample ring with lids (g)
  • V—volume of the Kopecky’s soil sample ring (cm3)

2.3. Statistical Analysis
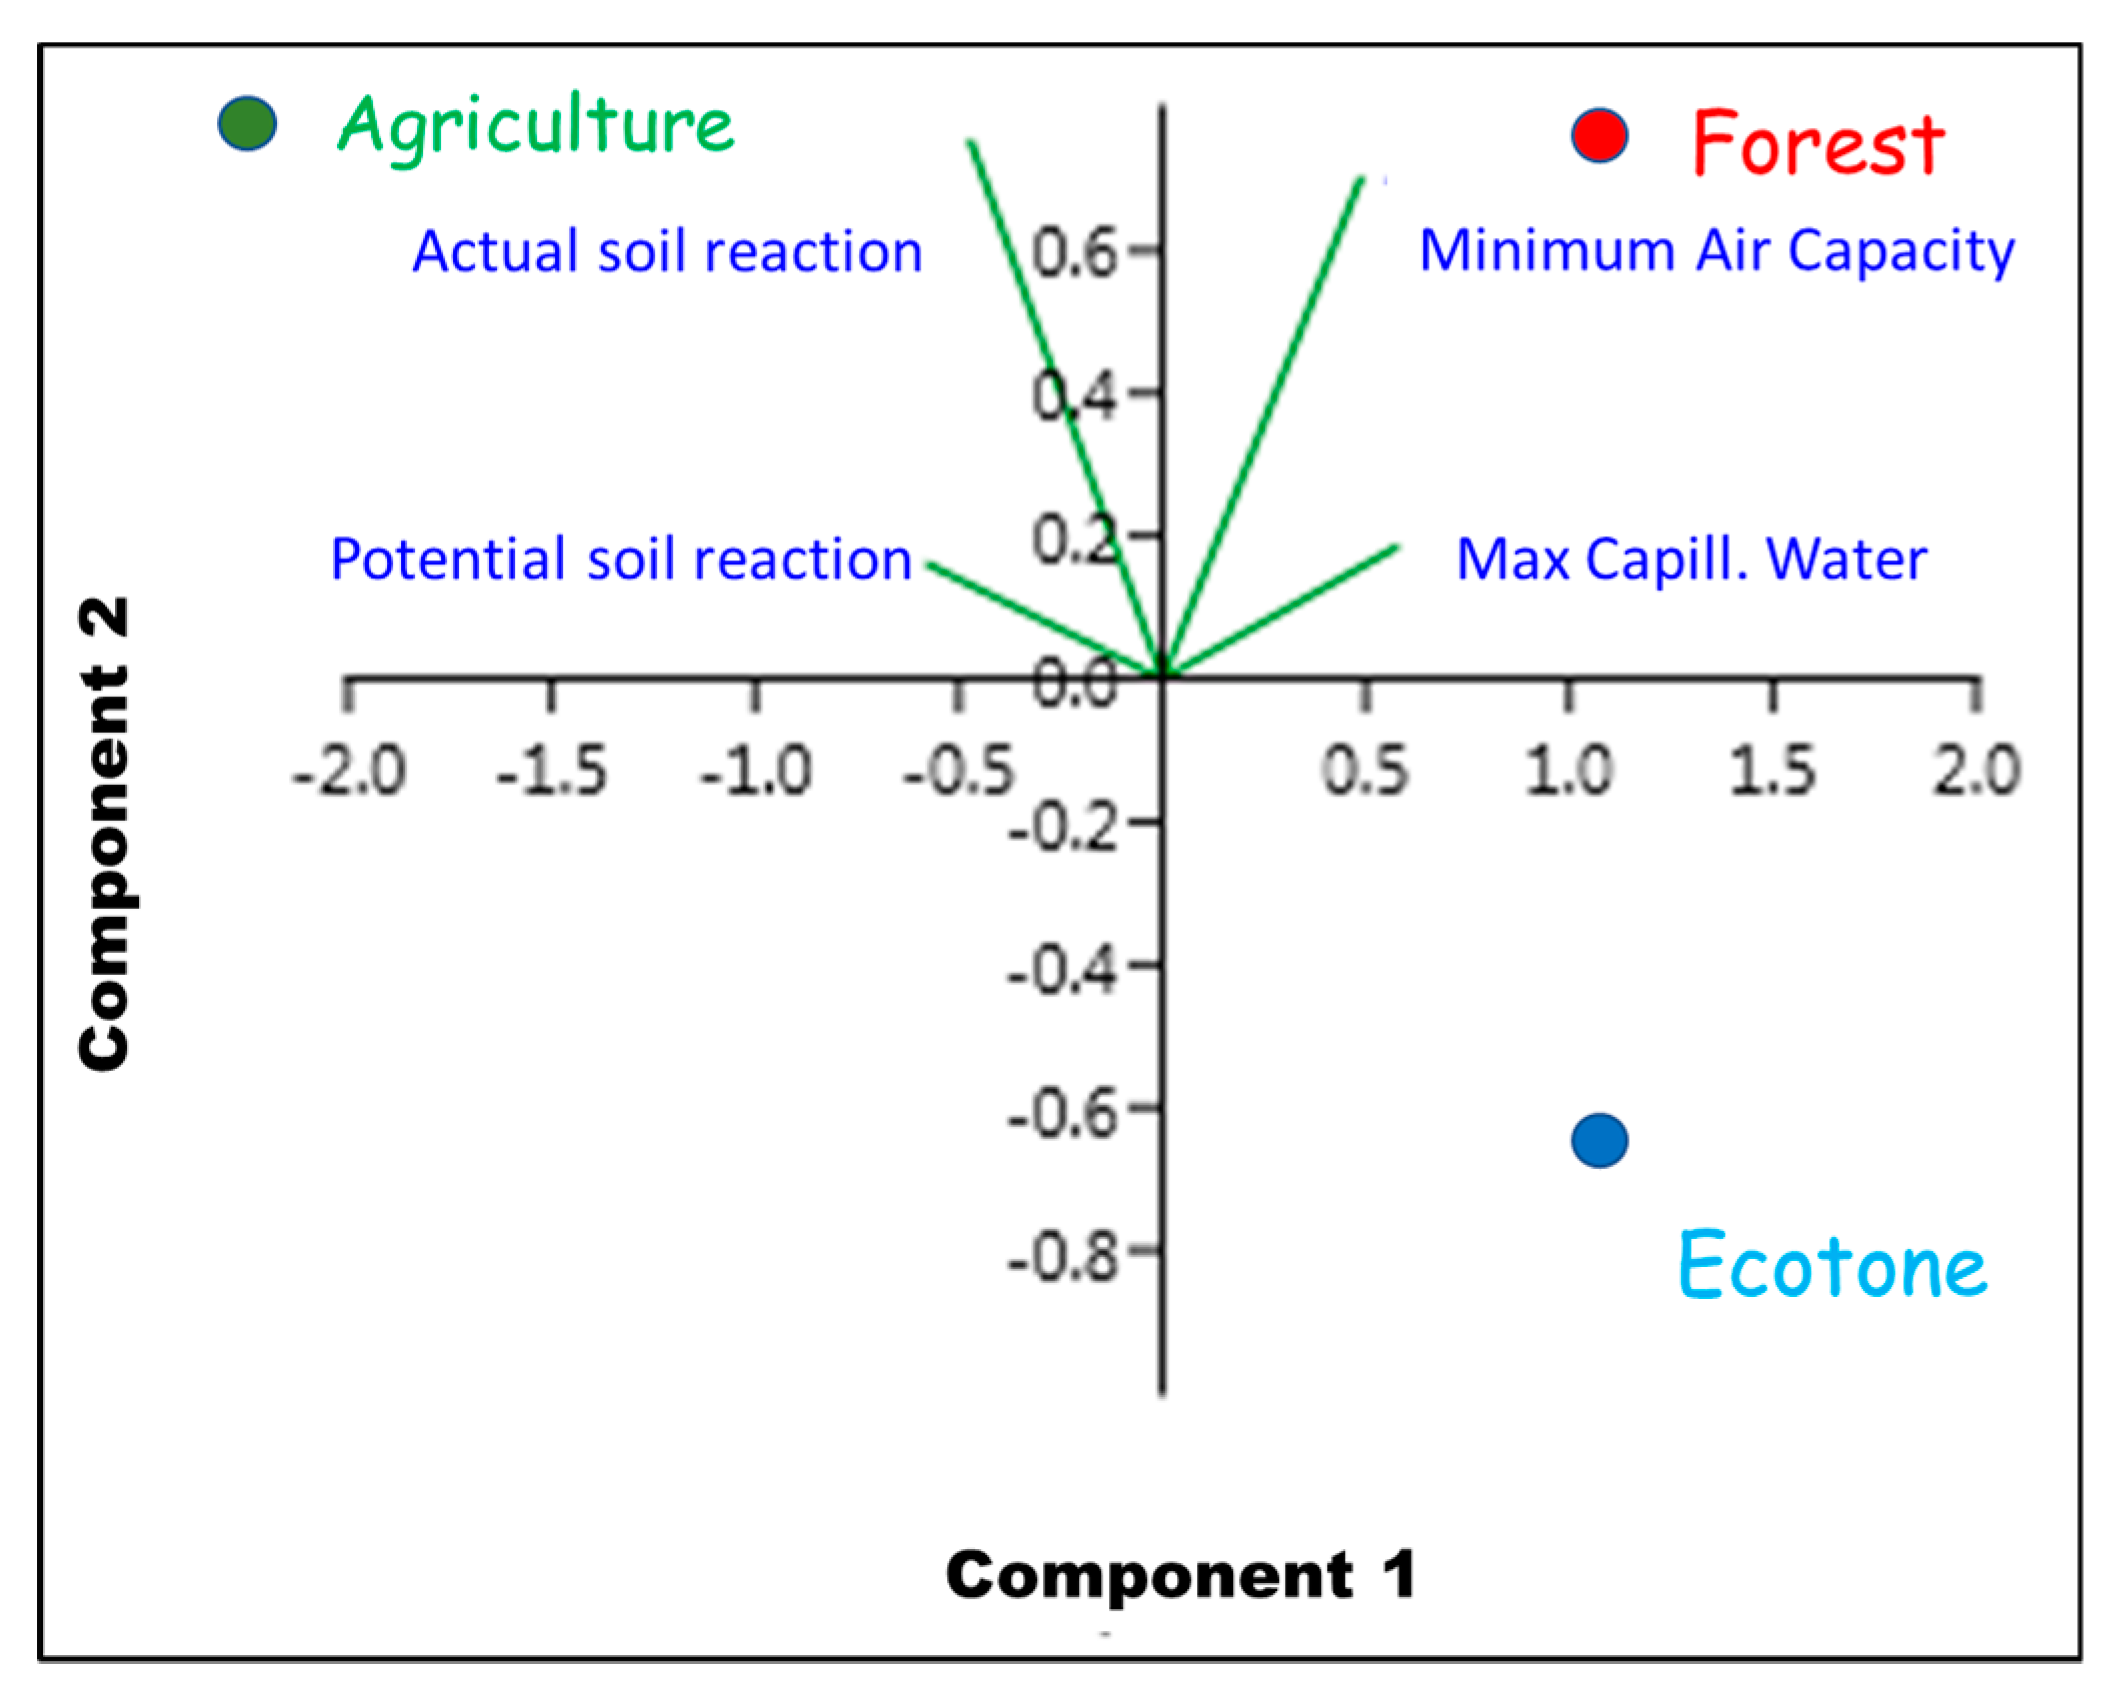
Checks on any significant site, time, and interaction (site × time) effect on data variability were done using the two-way variance analysis (ANOVA, site × time). In addition, Tukey’s HSD (honestly significant difference) test at p < 0.05 level of significance was used to analyze individual effects of each factor in multiple pair comparisons of means. The processing of statistical data was performed using Past 3.1.3 (Øyvind Hammer, Natural History Museum, University of Oslo, Norway).

3. Results

Two-way ANOVA results showed that sampling site, time, and their interactions significantly affected soil properties (Table 1).
Comparisons of experimental data obtained from forest, ecotone, and agriculture land show significant differences in the values of potential soil reaction between the forest and ecotone, ecotone and agriculture land, forest, and agriculture for the month of April, June, and November. Significant differences between ecotone and agriculture land, forest, and agriculture land were also recorded for the month of May, July, August, September, and October (Table 2). Similar trends were observed for actual soil reaction, maximum capillary water, and minimum air capacity.
The potential soil reaction (pH) ranged from 3.08 to 4.64. The highest value was measured in the agriculture land during July, while the lowest value was recorded in the ecotone region during October (Table 2). Pairwise comparison from April to November showed that soil pH was significantly decreasing from agriculture land toward the ecotone forest sites throughout the year (Figure 3).
The actual potential reaction (pH) ranged from 2.48 to 3.79. The highest value was measured in the agriculture land during June, while the lowest value was recorded in the ecotone region during April. A pairwise comparison from April to November showed that actual soil pH also followed the same trend as potential soil reaction (Figure 3).
Maximum capillary water capacity ranged from 29.78 to 2.21. The highest value was measured in the forest region in April, while the lowest value was recorded in the agriculture region in August (Table 2). A pairwise comparison from April to November showed maximum capillary water capacity significantly decreasing from the forest sites toward the agriculture sites throughout the year (Figure 3).
Minimum air capacity ranged from 50.01 to 32.54. The highest value was measured in the forest region in October, while the lowest value was recorded in the ecotone region in May (Table 2). The forest region shows a maximum value for minimum air capacity (Table 2). A pairwise comparison from April to November showed minimum air capacity significantly decreasing from the forest sites toward the agricultural sites (Figure 3).
Principal component analysis (PCA) for treatment versus soil is depicted in Figure 4. In this case, parameters clustering together show a similar trend, and the extent of similarity is based on the distance between them. The forest, ecotone, and agriculture sites fell on different quadrants of the PCA chart. Therefore, we can conclude that they behaved in a different way.

4. Discussion

The effect of sampling site and time on soil reaction variations, maximum capillary capacity, and minimum air capacity were observed in this study across a forest-agriculture land ecotone. The forest region’s soil was slightly more acidic than the agriculture land [35]. This trend was also observed in our previous research in the ‘Ecotone Dynamics and Stability from Soil Scientific Point of View’ report where the findings show that the forest region was much more acidic when compared to the meadow area [6]. The agriculture land being slightly less acidic than the forest area in this present study, can be attributed to fertilization due to crop production. It should also be noted that the topsoil of arable lands contain much fewer iron-bearing minerals compared to that of forest soils as a result of ploughing [36]. This outcome supports Balota et al. (2015) research on soil quality of the forest converted to perennial cropping versus annuals with the latter recording lower acidity due to various factors including fertilization [37].
However, the trend in the soil pH variations approaches the ecotone site since it depicts the edge effect with the ecotone zone registering the lowest pH value for both actual and potential acidity. Although the maximum capillary water capacity values recorded for both biomes fell within the strong water-holding capacity category [38], the forest region was higher than that of the agriculture land. However, at the ecotone spot, there was a sharp decline recording the lowest value. This can be linked to the edge effect.
The minimum air capacity was much higher in the forest region than in the agriculture land since the structure of agriculture soils are more compacted [39]. The cumulative average recorded for the agriculture land signals poorly aerated soils with low humus levels and low microbial activity [38]. There was a marked decline in the ecotone region where the lowest value is observed by typifying the edge effect.
The maximum capillary water capacity and the minimum air capacity results obtained with the forest region, by recording the highest cumulative value, confirm high microbial activities. This agrees with previous studies by showing a significant positive effect of decreasing soil disturbance on microbial biomass [37,40]. Entry of different xenobiotic compounds adversely affect the ecotone dynamics [36,41,42,43] by altering soil enzyme activity [44,45,46,47,48].
The trend of abrupt changes in the soil properties when the ecotone zone is approached confirms the existence of the edge effect, which supports our previous study on how these same soil properties vary across a forest-meadow ecotone [6]. This study also supports the ecotone research by Munroe [49] and Rhoades [17], which showed sharp changes in soil properties across the forest–grassland ecotone.

5. Conclusions

The main feature of the research is the distinct variations in the values of the measured soil properties at the forest, ecotone, and agriculture land. The recorded values of soil reaction, maximum capillary capacity, and minimum air capacity at the ecotone zone were distinct from the adjoining biomes (forest and agriculture land), which indicates the uniqueness of the ecotone. Our results show the soil’s influence on plant distribution across ecotones. This can be seen from the trend of sudden changes in the values of the soil reaction and the physical soil characteristics (maximum capillary water capacity and minimum air capacity), as the ecotone area is approached. This affirms the distinctness of ecotones and acclaimed assertion of being biologically diverse. We conclude that edaphic variables present valuable information for understanding ecotonal or edge effects. Therefore, a thorough edaphological analysis should be made part of any landscape-scale vegetation research dealing with ecotones.

Author Contributions

T.D.M.: conceptualization, methodology, validation, formal analysis, investigation, resources, writing—original draft preparation. R.D.: writing—review and editing, software, and data curation. V.V.: supervision, project administration. A.E.: investigation, visualization, software.

Funding

The Technology agency of the Czech Republic (TAČR), project no. TA04020888, “Contactless monitoring and spatio-temporally modelling variability of selected different soil characteristics” supported this work.

Conflicts of Interest

The authors declare no conflict of interest.

References

  1. Ejsmont-Karabin, J. Is sandy beach of the lake an ecotone? Psammon Rotifera in a mesotrophic Lake Kuc (Masurian Lakeland, Northern Poland). Pol. J. Ecol. 2003, 51, 219–224. [Google Scholar]
  2. Hufkens, K.; Scheunders, P.; Ceulemans, R. Ecotones in vegetation ecology: Methodologies and definitions revisited. Ecol. Res. 2009, 24, 977–986. [Google Scholar] [CrossRef]
  3. Verry, E.S.; Dolloff, C.A.; Manning, M.E. Riparian ecotone: A functional definition and delineation for resource assessment. Water Air Soil Pollut. Focus 2004, 4, 67–94. [Google Scholar] [CrossRef]
  4. Bestelmeyer, B.T.; Ward, J.P.; Havstad, K.M. Soil-geomorphic heterogeneity governs patchy vegetation dynamics at an arid ecotone. Ecology 2006, 87, 963–973. [Google Scholar] [CrossRef]
  5. Casalini, A.I.; Bouza, P.J.; Bisigato, A.J. Geomorphology, soil and vegetation patterns in an arid ecotone. Catena 2019, 174, 353–361. [Google Scholar] [CrossRef]
  6. Marfo, T.D.; Datta, R.; Pathan, S.I.; Vranová, V. Ecotone Dynamics and Stability from Soil Scientific Point of View. Diversity 2019, 11, 53. [Google Scholar] [CrossRef]
  7. Marfo, T.D.; Resjek, K.; Vranova, V. Spatial variations in soil properties across ecotones: A short review. Bull. Geogr. Phys. Geogr. Ser. 2018, 14, 71–77. [Google Scholar] [CrossRef]
  8. Attua, E.M.; Pabi, O. Tree species composition, richness and diversity in the northern forest-savanna ecotone of Ghana. J. Appl. Biosci. 2013, 69, 5437–5448. [Google Scholar] [CrossRef]
  9. Hansen, A.J.; DiCastri, F. Landscape Boundaries: Consequences for Biotic Diversity and Ecological Flows; Springer Science & Business Media: Berlin, Germany, 2012; Volume 92. [Google Scholar]
  10. Hauck, M.; Javkhlan, S.; Lkhagvadorj, D.; Bayartogtokh, B.; Dulamsuren, C.; Leuschner, C. Edge and land-use effects on epiphytic lichen diversity in the forest-steppe ecotone of the Mongolian Altai. Flora-Morphol. Distrib. Funct. Ecol. Plants 2012, 207, 450–458. [Google Scholar] [CrossRef]
  11. Korpela, E.-L.; Hyvönen, T.; Kuussaari, M. Logging in boreal field-forest ecotones promotes flower-visiting insect diversity and modifies insect community composition. Insect Conserv. Divers. 2015, 8, 152–162. [Google Scholar] [CrossRef]
  12. Pe’er, G.; van Maanen, C.; Turbé, A.; Matsinos, Y.G.; Kark, S. Butterfly diversity at the ecotone between agricultural and semi-natural habitats across a climatic gradient. Divers. Distrib. 2011, 17, 1186–1197. [Google Scholar] [CrossRef]
  13. Ray, G.C.; Bruce, P.H. Coastal zone ecotones. In Landscape Boundaries; Springer: New York, NY, USA, 1992; pp. 403–420. [Google Scholar]
  14. Hansen, A.J.; Risser, P.G.; di Castri, F. Epilogue: Biodiversity and ecological flows across ecotones. In Landscape Boundaries; Springer: New York, NY, USA, 1992; pp. 423–438. [Google Scholar]
  15. Smith, T.B.; Wayne, R.K.; Girman, D.J.; Bruford, M.W. A role for ecotones in generating rainforest biodiversity. Science 1997, 276, 1855–1857. [Google Scholar] [CrossRef]
  16. Ward, J.V.; Tockner, K.; Schiemer, F. Biodiversity of floodplain river ecosystems: Ecotones and connectivity1. River Res. Appl. 1999, 15, 125–139. [Google Scholar] [CrossRef]
  17. Rhoades, C.C.; Miller, S.P.; Skinner, D.L. Forest vegetation and soil patterns across glade-forest ecotones in the Knobs region of northeastern Kentucky, USA. Am. Midl. Nat. 2005, 154, 1–11. [Google Scholar] [CrossRef]
  18. Burley, S.T.; Harper, K.A.; Lundholm, J.T. Vegetation composition, structure and soil properties across coastal forest-barren ecotones. Plant Ecol. 2010, 211, 279–296. [Google Scholar] [CrossRef]
  19. Alam, S.M.; Naqvi, S.S.M.; Ansari, R. Impact of soil pH on nutrient uptake by crop plants. Handb. Plant Crop Stress 1999, 2, 51–60. [Google Scholar]
  20. Schofield, R.K.; Taylor, A.W. The Measurement of Soil pH 1. SSSAJ 1955, 19, 164–167. [Google Scholar] [CrossRef]
  21. Harter, R.D. Effect of Soil pH on Adsorption of Lead, Copper, Zinc, and Nickel 1. SSSAJ 1983, 47, 47–51. [Google Scholar] [CrossRef]
  22. Bossuyt, B.; Hermy, M.; Deckers, J. Migration of herbaceous plant species across ancient-recent forest ecotones in central Belgium. J. Ecol. 1999, 87, 629–638. [Google Scholar] [CrossRef]
  23. Jiao, F. Changes in soil properties across chronosequence of vegetation restoration. Catena 2011, 82, 110–116. [Google Scholar] [CrossRef]
  24. Grable, A.R. Soil aeration and plant growth. In Advances in Agronomy; Academic Press: Cambridge, MA, USA, 1966; Volume 18, pp. 57–106. [Google Scholar]
  25. Lal, R. Soil structure and sustainability. J. Sustain. Agric. 1991, 1, 67–92. [Google Scholar] [CrossRef]
  26. Doran, J.W. Defining & assessing soil quality. In Defining Soil Quality for a Sustainable Environment Definingsoilqua; American Society of Agronomy: Madison, WI, USA, 1994; pp. 1–21. [Google Scholar]
  27. Holden, N.M. Description and classification of soil structure using distance transform data. Eur. J. Soil Sci. 2001, 52, 529–545. [Google Scholar] [CrossRef]
  28. Leopold, M.; Hürkamp, K.; Völkel, J.; Schmotz, K. Black soils, sediments and brown calcic luvisols: A pedological description of a newly discovered neolithic ring ditch system at Stephansposching, Eastern Bavaria, Germany. Quat. Int. 2011, 243, 293–304. [Google Scholar] [CrossRef]
  29. Schöning, I.; Kögel-Knabner, I. Chemical composition of young and old carbon pools throughout Cambisol and Luvisol profiles under forests. Soil Biol. Biochem. 2006, 38, 2411–2424. [Google Scholar] [CrossRef]
  30. Datta, R.; Vranová, V.; Pavelka, M.; Rejšek, K.; Formánek, P. Effect of soil sieving on respiration induced by low-molecular-weight substrates. Int. Agrophys. 2014, 28, 119–124. [Google Scholar] [CrossRef] [Green Version]
  31. ISO. ISO 10390: 2005 Soil Quality—Determination of pH 2005; ISO: Geneva, Switzerland, 2005. [Google Scholar]
  32. Winters, A.; Harland, M. Preparation of Soil Samples for Pipette Analysis. J. Am. Soc. Agron. 1930, 22, 771–780. [Google Scholar] [CrossRef]
  33. Folegatti, M.V.; Brasil, R.P.C.D.; Blanco, F.F. Sampling equipament for soil bulk density determination tested in a Kandiudalfic Eutrudox and a Typic Hapludox. Sci. Agric. 2001, 58, 833–838. [Google Scholar] [CrossRef] [Green Version]
  34. Winters, A.; Harland, M.B. Preparation of Soil Samples for Pipette Analysis. 1930. Available online: https://dl.sciencesocieties.org/publications/aj/abstracts/22/9/AJ0220090771?access=0&view=pdf (accessed on 15 February 2019).
  35. Falkengren, G.U. Long-term changes in pH of forest soils in southern Sweden. Environ. Pollut. 1987, 43, 79–90. [Google Scholar] [CrossRef]
  36. Magiera, T.; Zawadzki, J. Using of high-resolution topsoil magnetic screening for assessment of dust deposition: Comparison of forest and arable soil datasets. Environ. Monit. Assess. 2007, 125, 19–28. [Google Scholar] [CrossRef]
  37. Balota, E.L.; Yada, I.F.U.; Amaral, H.F.; Nakatani, A.S.; Hungria, M.; Dick, R.P.; Coyne, M.S. Soil quality in relation to forest conversion to perennial or annual cropping in southern Brazil. Rev. Bras. Ciênc. Solo 2015, 39, 1003–1014. [Google Scholar] [CrossRef]
  38. Rejšek, K. Lesnická Pedologie: Cvičení; Mendelova zemědělská a lesnická univerzita: Brně, Czechia, 1999; ISBN 978-80-7157-352-4. [Google Scholar]
  39. Lucas-Borja, M.E.; Zema, D.A.; Plaza-álvarez, P.A.; Zupanc, V.; Baartman, J.; Sagra, J.; González-Romero, J.; Moya, D.; de las Heras, J. Effects of different land uses (abandoned farmland, intensive agriculture and forest) on soil hydrological properties in Southern Spain. Water 2019, 11, 503. [Google Scholar] [CrossRef]
  40. Frazão, L.A.; de Cassia Piccolo, M.; Feigl, B.J.; Cerri, C.C.; Cerri, C.E.P. Inorganic nitrogen, microbial biomass and microbial activity of a sandy Brazilian Cerrado soil under different land uses. Agric. Ecosyst. Environ. 2010, 135, 161–167. [Google Scholar] [CrossRef]
  41. Molaei, A.; Lakzian, A.; Datta, R.; Haghnia, G.; Astaraei, A.; Rasouli-Sadaghiani, M.; Ceccherini, M.T. Impact of chlortetracycline and sulfapyridine antibiotics on soil enzyme activities. Int. Agrophys. 2017, 31, 499–505. [Google Scholar] [CrossRef] [Green Version]
  42. Molaei, A.; Lakzian, A.; Haghnia, G.; Astaraei, A.; Rasouli-Sadaghiani, M.; Ceccherini, M.T.; Datta, R. Assessment of some cultural experimental methods to study the effects of antibiotics on microbial activities in a soil: An incubation study. PLoS ONE 2017, 12, 180663. [Google Scholar] [CrossRef] [PubMed]
  43. Marfo, T.D.; Datta, R.; Lojkova, L.; Janous, D.; Pavelka, M.; Formanek, P. Limitation of Activity of Acid Phosphomonoesterase in Soils; Springer: Wien, Austria, 2015; Volume 47, p. 1691. [Google Scholar]
  44. Lojkova, L.; Datta, R.; Sajna, M.; Marfo, T.D.; Janous, D.; Pavelka, M.; Formanek, P. Limitation of Proteolysis in Soils of Forests and Other Types of Ecosystems by Diffusion of Substrate; Springer: Wien, Austria, 2015; Volume 47, pp. 1690–1691. [Google Scholar]
  45. Datta, R.; Anand, S.; Moulick, A.; Baraniya, D.; Pathan, S.I.; Rejsek, K.; Vranova, V.; Sharma, M.; Sharma, D.; Kelkar, A.; et al. How enzymes are adsorbed on soil solid phase and factors limiting its activity: A Review. Int. Agrophys. 2017, 31, 287–302. [Google Scholar] [CrossRef]
  46. Datta, R.; Kelkar, A.; Baraniya, D.; Molaei, A.; Moulick, A.; Meena, R.; Formanek, P. Enzymatic degradation of lignin in soil: A review. Sustainability 2017, 9, 1163. [Google Scholar] [CrossRef]
  47. Yadav, G.; Datta, R.; Imran Pathan, S.; Lal, R.; Meena, R.; Babu, S.; Das, A.; Bhowmik, S.; Datta, M.; Saha, P. Effects of Conservation Tillage and Nutrient Management Practices on Soil Fertility and Productivity of Rice (Oryza sativa L.)–Rice System in North Eastern Region of India. Sustainability 2017, 9, 1816. [Google Scholar] [CrossRef]
  48. Datta, R.; Baraniya, D.; Wang, Y.-F.; Kelkar, A.; Meena, R.; Yadav, G.; Teresa Ceccherini, M.; Formanek, P. Amino Acid: Its Dual Role as Nutrient and Scavenger of Free Radicals in Soil. Sustainability 2017, 9, 1402. [Google Scholar] [CrossRef]
  49. Munroe, J.S. Physical, chemical, and thermal properties of soils across a forest-meadow ecotone in the Uinta Mountains, Northeastern Utah, USA. Arct. Antarct. Alp. Res. 2012, 44, 95–106. [Google Scholar] [CrossRef]
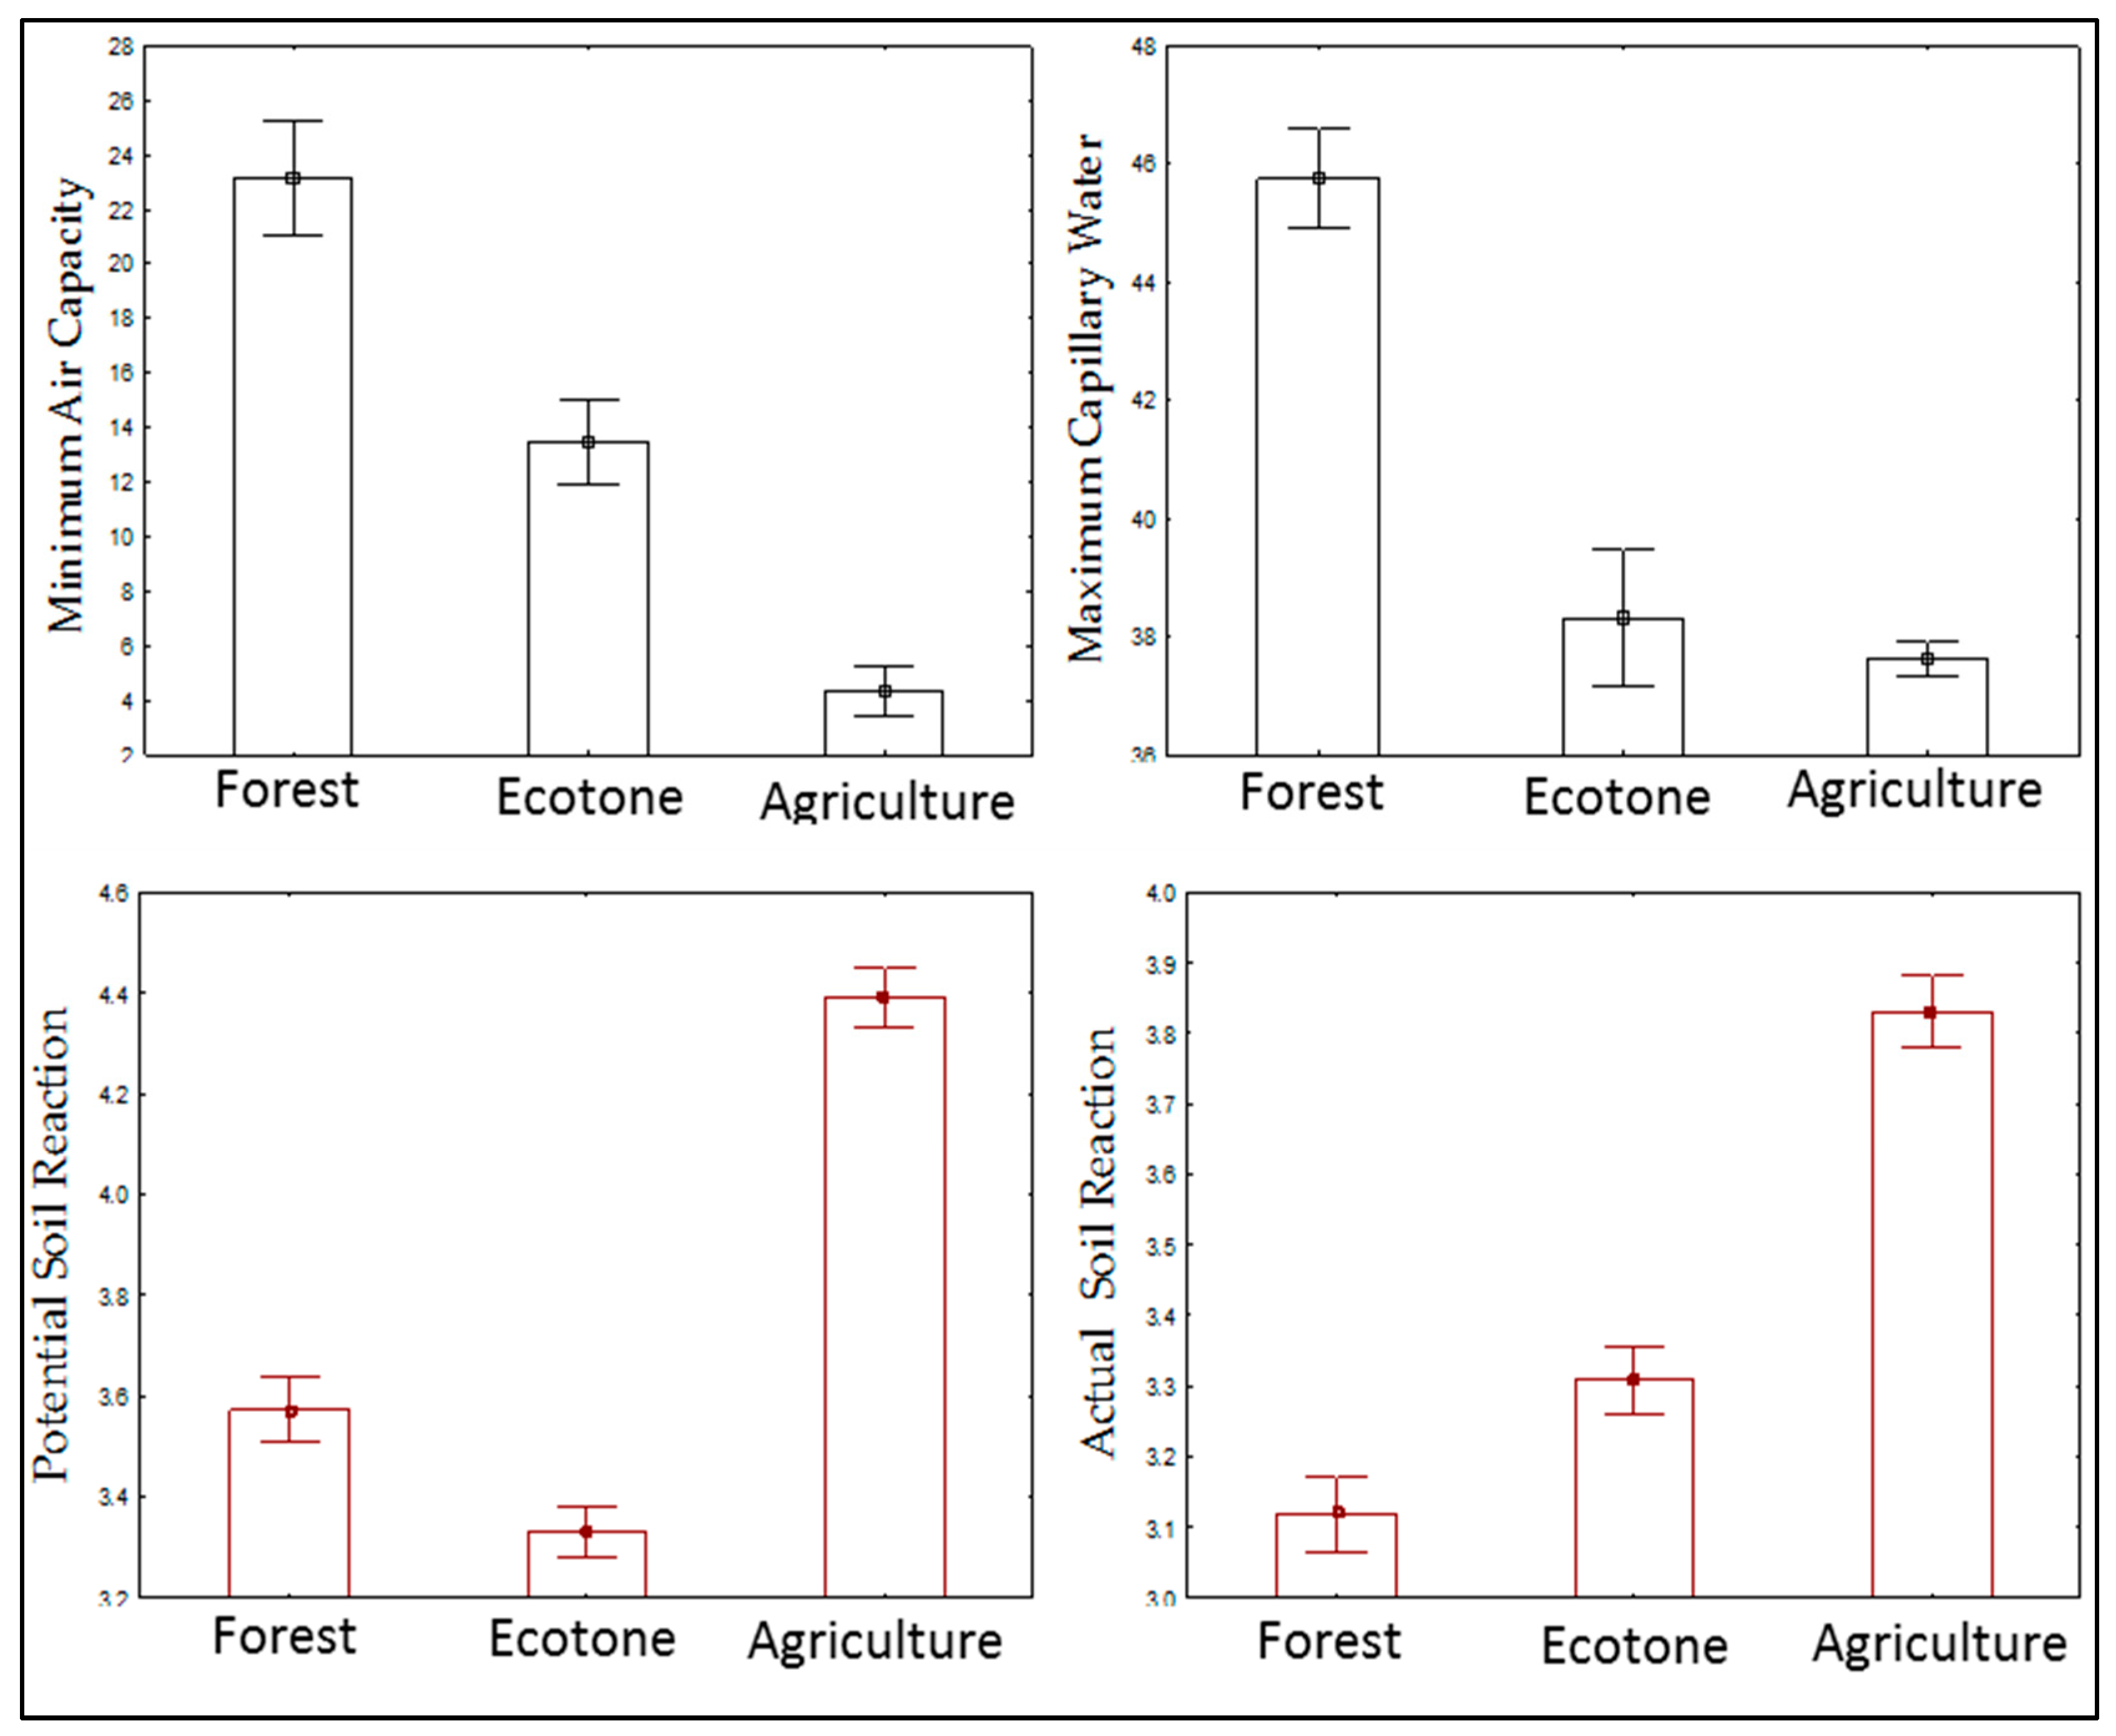
Figure 1. (A) Research site map, (B) Agriculture land, (C) Forest region.
Agriculture 09 00228 g001
Figure 2. Study spots distribution scheme.
Agriculture 09 00228 g002
Figure 3. Comparative illustration of the seven-month trend obtained from the forest ecotone and agriculture site.
Agriculture 09 00228 g003
Figure 4. PCA run on values of a potential soil reaction, actual soil reaction, minimum air capacity, and maximum capillary water capacity, after being obtained from an experiment run on three different locations (forest, ecotone, and agriculture sites). Correlation of the variables with components 1 and 2, PC1 = 83.25%, and PC2 = 16.74%. In this case, green dots represent the agriculture land. Red dots represent the forest, and blue dots represent ecotone.
Agriculture 09 00228 g004
Table 1. Main effects due to sampling time, sampling site, and their interaction on the variability of selected chemical variables. Values are F-values (F-stat) from two-way ANOVA (Time × Site) with the corresponding p level and statistical significance. (* = p < 0.05, ** = p < 0.01, *** = p < 0.001).
FactordfPotential Soil ReactionActual Soil ReactionMaximum Capillary WaterMinimum Air Capacity
Time 731.81***31.07***25.45***61.24***
Site2396.51***290.73***950.10***294.40***
Time × Site141.87**6.21***15.87***17.15***
Table 2. Variation of selected soil properties across the forest ecotone agriculture land during the year. Data represent means and errors (mean ± SE, n = 3−9). Significant differences within each time are indicated in the bold script (in a column) (One-way ANOVA followed by Tukey post hoc test, p < 0.05).
Time
AprilMayJuneJulyAugustSeptemberOctoberNovember
Potential Soil ReactionForest3.71 ± 0.053.63 ± 0.023.49 ± 0.033.55 ± 0.063.27 ± 0.043.45 ± 0.053.21 ± 0.014.24 ± 0.01
Ecotone3.23 ± 0.073.43 ± 0.043.23 ± 0.063.33 ± 0.083.14 ± 0.043.36 ± 0.153.08 ± 0.043.81 ± 0.04
Agriculture Land4.44 ± 0.024.35 ± 0.094.29 ± 0.044.64 ± 0.104.1 ± 0.034.48 ± 0.24.01 ± 0.054.8 ± 0.03
Actual Soil ReactionForest2.66 ± 0.052.87 ± 0.063.1 ± 0.033.06 ± 0.052.98 ± 0.013.03 ± 0.052.94 ± 0.053.24 ± 0.05
Ecotone2.48 ± 0.123.35 ± 0.073.15 ± 0.043.27 ± 0.033.16 ± 0.023.24 ± 0.133.07 ± 0.033.73 ± 0.04
Agriculture Land3.43 ± 0.023.75 ± 0.0113.79 ± 0.063.75 ± 0.043.65 ± 0.023.75 ± 0.023.78 ± 0.053.71 ± 0.07
Minimum Air CapacityForest29.78 ± 1.222.25 ± 1.0523.95 ± 2.928.4 ± 0.926.06 ± 0.1717.07 ± 0.7116.53 ± 0.5221.1 ± 1.12
Ecotone13.08 ± 0.4618.96 ± 0.716.17 ± 0.5212.65 ± 0.2612.33 ± 0.486.33 ± 0.1311.89 ± 0.1416.51 ± 0.36
Agriculture Land4.42 ± 0.545.2 ± 0.0223.22 ± 0.534.02 ± 0.282.21 ± 0.353.97 ± 0.403 ± 0.408.84 ± 0.92
Maximum Capillary
Water
Forest45.73 ± 1.1644.36 ± 0.3448.93 ± 0.5738.62 ± 0.2140.79 ± 0.5448.85 ± 0.4950.01 ± 0.6748.74 ± 1.52
Ecotone33.57 ± 0.5132.54 ± 1.6044.61 ± 0.7233.05 ± 0.5232.77 ± 0.5041.56 ± 0.3244.15 ± 0.4144.31 ± 0.62
Agriculture Land38.31 ± 1.1738.3 ± 0.1139.47 ± 0.4235.63 ± 0.4537.54 ± 0.7438.03 ± 0.2237.27 ± 0.8336.53 ±0.63

