Abstract
In Mediterranean environments the adoption of Conservation Agriculture (CA) would allow growers to achieve environmental, agronomic and economic sustainability. We investigated the effect of different combination of crop establishment treatments and crop sequence (conventional tillage (CT) and durum wheat monocropping (WW); conventional tillage (CT) and durum wheat following faba beans (WF); zero tillage (ZT) and durum wheat monocropping (WW); zero tillage (ZF) and durum wheat following faba beans (WF) on yield, grain quality traits as well as on disease incidence and severity in durum wheat (var. Saragolla). The results of two years of data of a long-term experiment (seven-year experiment; split-plot design) are discussed. The CA approach (ZT + WF), which always induced the highest grain yields (6.1 t ha−1 and 3.3 t ha−1 in 2016 and 2017) thanks to an increased number of spikes m−2 (296 vs. 269 and 303 vs. 287 spikes m−2 in 2016 and 2017, respectively) as well as a more pronounced ear length, demonstrated significantly positive influences in terms of grain quality. It promoted grain protein accumulation (12.1% for ZT + WF vs. 11.4% for ZT + WW and 12.4% for ZT + WF vs. 10.6% for ZT + WW in 2016 and 2017) and improved the gluten quality (in terms of sodium dodecyl sulphate (SDS) sedimentation test) and colour of the grain. The abundance of crop residues determined a higher incidence and severity of Zymoseptoria tritici leaf symptoms under the CA system; nevertheless, the late appearance of infection was the main reason for not affecting yield and quality traits. The presence of faba beans (WF) in the rotation significantly reduced leaf symptoms in Z. tritici.
1. Introduction
The farms of the inner hilly, not irrigated Mediterranean environments, are characterized by low and erratic rainfall distribution, with high temperatures often occurring at the beginning of May. Here farmers typically rely exclusively on durum wheat (Triticum turgidum L. subsp. durum (Desf.) Husn.) monocropping or short rotations of durum wheat‒sunflower or durum wheat‒barley. Moreover, crop establishment treatment is characterized by the sole application of a conventional approach, characterized by several tillage applications for seed-bed preparation, including deep ploughing to 0.45 m. Such agronomic management has led to severe soil loss, organic matter depletion, CO2 release and biodiversity constraints, as demonstrated by several studies [1,2,3]. Soil fertility reduction, in combination with climatic change, has negatively influenced durum wheat performance over time [4], with significant instability of yields and quality traits.
A way to merge economic with social and environmental sustainability is represented by the adoption of Conservation Agriculture (CA), an agronomic system developed to prevent soil erosion and compaction, and to lower the costs of cultivation practices [5]. It includes zero tillage, maintaining crop residues in the field, and adoption of the use of cover crops as well as crop rotation [6,7]: as a result, soil layers are not reversed and crop residues and organic fertilizers are not incorporated in the processed layer [8]. Several studies have demonstrated that the balance between CO2 emitted and captured is optimized [9,10], soil organic matter, edaphic biodiversity and water retention are increased [11,12], and the bioavailability of nutrients as well as the whole fertility of soil are improved [13] with a consequent reduction of management costs [14].
Nevertheless, some concerns need to be addressed when CA is firstly introduced; they principally relate to the possible diffusion of durum wheat diseases, unstable yields and seeds’ technological quality [15]. A greater severity of diseases under CA is often attributed to the abundance of crop residues and to continuously moist soil conditions, which allow for the survival and distribution of pathogen inoculum. At a global level, and especially in Europe due to the low adoption of CA, only a few studies have been carried out on diseases in durum wheat managed according to these techniques [16] as well as on quality traits, and the results are sometimes contradictory. Data from Western Europe indicate lower yield and durum wheat quality decrease (8.5% less) when no tillage (NT) is compared to conventional tillage (CT). In Canada, studies on the effects of CA on disease incidence have highlighted the significant influence of wheat varieties and environmental conditions [17]. Also, data collected in Australia suggest some improvements of CA techniques to reduce the effects of pedoclimatic conditions [18,19]. Previous work had stated that reduced tillage increased the presence of soilborne pathogens due to the favourable environmental conditions offered by cover crops and residue accumulations [20,21]. On the other hand, the higher soil microbial activity achieved under CA should decrease the virulence of the pathogens [22].
Cover crops and residue management, enhanced for their effect on carbon and nutrient (especially N) dynamics in soil [23,24], could play a key role in improving technological and physiological traits and yield, especially in depleted soils; changes in N accumulation and release would modify nitrogen (N) uptake efficiency and synchronization [25,26,27]. Data regarding the effect of CA practices on such aspects are missing.
Therefore, with this study undertaken in a Mediterranean environment and based on a seven-year experiment combining two tillage practices (conventional tillage (CT) and zero tillage (ZT)) with two crop sequences (durum wheat monocropping (WW) and durum wheat‒faba beans (WF)), we tested the hypotheses that:
- The CA approach would not negatively affect yields or the technological profile of kernels of durum wheat;
- The incidence and severity of fungal diseases and their possible influence on the yield and technological traits of durum wheat would be lowered by including faba beans in the rotation.
2. Materials and Methods
2.1. Site Description
One long-term field experiment has been carried out in Teramo (Mosciano Sant’Angelo, Italy, 42°42′ N, 13°52′ E, 101 m a.s.l.). The area is characterized by a typical Mediterranean climate with a mean annual rainfall, recorded over a 58-year period, of 732 mm, concentrated mainly between October and April. The mean of the maximum temperature ranges from 11 °C to 29 °C, while the mean of the temperature minimum is from 2 °C to 17 °C. The main soil characteristics are as follows: 23% sand, 45% silt, 32% clay, pH 8.1, 19.0% total CaCO3 and 10.6% active CaCO3. Meteorological data were recorded with a meteorological station situated ~1 km from the experimental field.
2.2. Experimental Design and Agronomic Practices
The experiment consists in two crop establishment systems and two crop sequences arranged on a split-plot design with three replications: tillage systems represent the main plots, while crop sequences are the sub-plots. CT and ZT were established in the same experimental field (15,000 m2), opportunely arranged to avoid any overlays during crop operations. They were imposed starting from the beginning of the experimentation (2010–2011); consequently, for ZT treatments, a six/seven-year period of conversion (2010–2016/2017) was achieved, respecting the requirements of the CT system standards to ensure reliable long-term production goals [28]. CT management included ploughing, complete soil inversion to 45-cm depth during the summer, with secondary tillage in autumn. ZT involved no soil disturbance with previous-crop residue retention and a glyphosate (45%) application at the rate of 2 L ha−1, two weeks before sowing.
For each crop establishment treatment, CT and ZT, two different crop sequences (sub-plots) were randomly adopted: (i) durum wheat monocropping (WW); and (ii) durum wheat following faba beans (WF). Each rotational area (sub-plot) was obtained by splitting each tillage system (main plot) into areas of equal size (1200 m2) hosting both crop sequences every year. The combination ZT + WF allowed for the application of all principles of CA.
The cultivars “Achille” and “Scuro di Torre Lama” were sown up to the 2014–2015 cropping season for durum wheat and faba beans, respectively, and then replaced by “Saragolla” and “Protabath” during the 2016 and 2017 experimental periods. In the ZT approach, durum wheat was always sown in autumn, in particular on 7th December and 23rd November in 2016 and 2017, respectively, with a direct seeder (Gaspardo Direttissima, Gruppo Maschio Gaspardo S.p.A., Campodarsego, PD, Italy), at a seeding rate of 350 seeds m−2. Nitrogen fertilizer was applied as ammonium nitrate in two applications at the whole rate of 150 kg N ha−1, split in half on 22 March 2016 and 28 March 2017 at the beginning of stem elongation and half on 18 April 2016 and on 20 April 2017, at the emergence of the complete head. No other fertilizer was applied.
Immediately after sowing, the amount of crop residue (thickness (cm) and weight (t ha−1)) was measured for the different crop (WW and WF) sequence under zero tillage condition. Measures were taken for each windows plot, on a surface of 25 cm2.
2.3. Yield and Merceological Parameters
At harvesting (23 June and 19 June for 2016 and 2017, respectively), yield components and several commercial and technological quality parameters were determined. One square meter per each plot was harvested manually and grain yield measured at 13% moisture content. The number of spikes per unit area was estimated by counting spikes along a one square meter plot surface and 15 spikes per plot were collected for ear length and plant height determination; measurements were taken from the soil to the top of the spike. Thousand kernel weight (TKW) was calculated as the mean weight of three sets of 100 grains per plot and specific weight, expressed as kg hl−1, was measured with a Shopper chondrometer.
2.4. Grain Quality Analysis
Grain sub-samples collected from each windows plot were milled with Knifetec TM 1095 (Foss, Hillerød, Denmark) to obtain a fine powder and wholemeal flour was used to evaluate some quality-related parameters. Grain N content was determined by the standard Kjeldahl method. Grain protein concentration (GPC, %) was multiplied by 5.7 [29] and expressed on a dry weight basis. An SDS sedimentation volume test using 0.6 g of a flour sample was performed as an indicator of gluten strength.
Grain yellow index was determined using a Minolta Chroma Meter colorimeter for colour space measurements, while carotenoid pigments were evaluated by extraction in a solution of n-butanol saturated with water in samples of 50 mg of flour and measured in a spectrophotometer at 435 nm.
Ash content was determined by incineration in a muffle oven at 550 °C over night.
2.5. Survey of Symptoms of Fungal Diseases
For each treatments (CT + WW, CT + WF, ZT + WW, ZT + WF), visual assessments of fungal disease symptoms were carried out. In each treatments three plots were selected (each of which represented a repetition). Each plot measured 16 m2 and was appropriately spaced from the others. Two surveys were carried out on 22 May 2016 and 26 May 2017, when durum wheat was at phenological stages of hard dough. For each plot, leaf symptom incidence was calculated by dividing the number of symptomatic plants by the number of standing plants. The severity of leaf symptoms was calculated by assigning each plant a percentage value obtained from the ratio of the attacked surface vs. the whole plant surface. Percent disease severity was calculated from the McKinney index as follows: ΣN × 100/(Y × Z) where ΣN = sum of severity rating in each plant; Y = number of standing plants, Z = 100, which is the maximum rating in the disease assessment scale [30].
2.6. Isolation of Pathogens from Symptomatic Leaves
On 26 May 2017, 15 plants showing symptoms of fungal disease were collected from each plot of the four groups and transferred to the laboratory, where two leaves per plant were harvested. Thus, each of the four groups was represented by a set of 90 leaves. Each leaf was subsequently separated into 2–3 sections of about 7–9 cm and collocated in 14-cm Petri plates in which was previously placed a disc of tissue paper wetted with distilled water, to create a moist incubation chamber. The leaf sections of each group have been kept separate in order of point out possible differences in the detected microflora. The plates were then kept at 20 ± 2 °C with a photoperiod of 12 h of light. After 24, 48, 72 and 96 h, the leaf samples were monitored with a Leica DMRM 301-371.010 (Leica, Buffalo Grove, IL, USA) combained with a digital camera Leica DFC295 (2048 × 1536 pixel), magnification of 40×, to assess the presence of fungal propagules and proceed to pathogen identification. Images were processed with the software Leica Application Suite (LAS), V4.1 (Leica, Buffalo Grove, IL, USA). After 24–48 h, some of the pycnidia observed on the lesions of the symptomatic leaves had formed conidial cirrhi. All these cirrhi were collected, covered with a drop of sterile water, fixed on slides and observed under the optical microscope to verify the presence of conidia. After 72–96 h the formation of additional cirrhi was noted; moreover, some of the pycnidia (3–4 per leaf portion), which had not generated cirrhi, were collected, placed on slides containing a few drops of sterile water and crushed with another slide. Each crushed pycnidium was observed under the optical microscope.
2.7. Statistical Analysis
To test (F-test) the effects of crop establishment treatment (main factor) and crop sequences (secondary factor) on each parameter, a two-way analysis of variance (ANOVA) was applied using a randomized blocks design. If the ANOVA detected significant differences, the means were compared based on the standard error of the difference (SED) between means. All the statistical analyses were performed using R software [31].
3. Results
3.1. Meteorological Data and Soil Characteristics
The amount and distribution of rainfall and the range of monthly averages of temperatures registered during the two experiments are reported in Figure 1. During the period from anthesis to the end of grain filling (March–May), rainfall was 248 mm in 2016 and 145 mm in 2017 (about 50% less). Differences also emerged during the vegetative phase: in 2016, between sowing and anthesis, crops received 262.4 mm of rain while in 2017 they received 505.2 mm, mainly concentrated in January. Although the average monthly temperature of the whole cropping cycle was almost the same (15.3 and 15 °C for 2016 and 2017, respectively), during the reproductive period the values for the second year were generally higher (16.1 and 17.2 °C in 2016 and 2017, respectively).
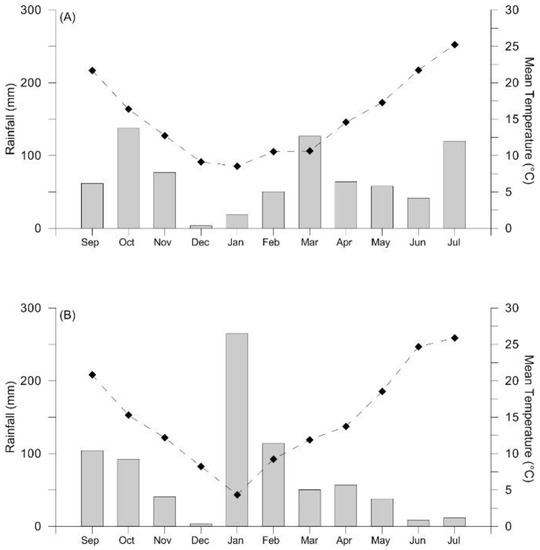
Figure 1.
Means of monthly rainfall (bars) and temperatures (symbols) registered during the durum wheat crop cycle in two different growing seasons, 2015–2016 (A) and 2016–2017 (B), at Mosciano Sant’Angelo, Teramo.
3.2. Yield and Yield Components
Data regarding grain yield, ears m−2, ear length and plant height for the different combinations of crop establishment treatment and crop sequence are presented in Table 1.

Table 1.
Influence of different combination of crop establishment treatment and crop sequence on durum wheat yield (t ha−1), number of spikes per square meter (ears, num m−2), ear length (cm) and plant height (cm), recorded at harvesting in 2016 and 2017.
Higher yield values were registered in 2016 (5.6 t ha−1 vs. 3.2 t ha−1 in 2016 and 2017, respectively), when we also observed significant differences between treatments. The combination ZT + WF gave the highest value (6.1 t ha−1), while the other treatments were broadly similar. The higher yields were related to a significant increase in the number of ears m−2: in both years the ZT + WF combination gave the highest values (296 and 303 spikes m−2), while CT + WW was the lowest (255 and 262 spikes m−2). Moreover, regarding ear length, crop sequence produced significant results in 2016, with WF exhibiting the highest value (7.53 vs. 7.29 cm for WF and WW, respectively), with crop establishment treatment in 2017 with ZT showing 6.57 cm and CT 6.19 cm. In 2016 in general, wheat plants reached higher heights than 2017 and no significant differences were induced by the different treatments.
3.3. Grain Quality Traits
TKW and specific weight values are shown in Table 2; for this variable no significant differences were registered between groups. In general, higher values were obtained in 2016 for both TKW (73.7 and 54.7 g in 2016 and 2017, respectively) and specific weight (84.8 vs. 81.6 Kg hl−1 in 2016 and 2017, respectively).
Table 2.
TKW (g) and specific weight (kg hl−1) of durum wheat affected by different combinations of crop establishment treatment and crop sequence, in 2016 and 2017.
GPC was significantly increased by the WF sequence, which induced significantly higher values in both years (12.1% vs. 11.0% and 12.2% vs. 10.3% in 2016 and 2017, respectively) (Table 3); crop establishment treatment did not induce any significant differences. The SDS collected values are shown in Table 3. Significant differences were only observed in 2016 for both treatments, crop establishment treatment and crop sequences. ZT exhibited higher values than CT (3.6 vs. 3.4 mL) and WF than WW (3.8 vs. 3.4 mL). Yellow index (YI) was always increased by WF with respect to WW (Table 3), while the effect of crop establishment treatment registered a significant interaction with crop sequence. In particular, when ZT was combined with WF it always gave higher YI values than CT; moreover, the ZT + WW combination did not induce any higher YI value than CT. Carotenoid and ash concentrations do not seem to be influenced by crop establishment treatment or crop sequence treatments (Table 3).
Table 3.
Influence of different combinations of crop establishment treatment and crop sequence on durum wheat quality traits: grain protein concentration (GPC, % s.s.), SDS sedimentation test (SDS, mL), yellow index (%), carotenoid (µg g−1), and ash (%) recorded at harvesting in 2016 and 2017.
3.4. Survey of Symptoms of Fungal Diseases
The monitored durum wheat plants showed the same symptoms on the leaves. These symptoms were chlorosis and necrosis, apparently attributable to Zymoseptoria tritici (Desm.) Quaedvlieg & Crous. Any alteration in the grain was noted. In 2016, all treatments showed higher incidence and severity of leaf symptoms than in 2017 (Table 4).
Table 4.
Incidence and severity of Septoria tritici blotch (Zymoseptoria tritici) leaf symptoms in durum wheat subjected to different combinations of crop establishment treatment and crop sequence in 2016 and 2017.
ZT showed significantly higher incidence and severity of symptoms with respect to CT treatments in both 2016 and 2017 (Table 4). ZT + WW plots always registered higher incidence values—54.47% and 38.54% with respect to ZT + WF, 28.43% and 19.89%, in 2016 and 2017, respectively (Table 4).
In the ZT plots, the introduction of rotation with faba beans (WF) was much more effective at lowering the severity of symptoms, which was 15.48% and 3.48% in 2016, and 7.11% and 2.65% in 2017, in ZT + WW and ZT + WF, respectively (Table 4).
In the CT plots, the introduction of WF was less effective at reducing leaf symptoms with respect to ZT plots. In 2016, differences of symptom incidence between CT + WF and CT + WW were not significant, while symptom severity was significantly different: 0.70% in CT + WF and 2.03% in CT + WW (Table 4). In 2017, no differences were observed between CT + WF and CT + WW in terms of incidence or severity.
3.5. Isolation of Pathogens from Symptomatic Leaves
In the laboratory, microscope observations of leaf samples coming from the four groups investigated made it possible to highlight the presence of pycnidia on the lesioned surface of the leaves, varying from 26 to 35 per cm2 on the damaged leaf surface (Figure 2A).
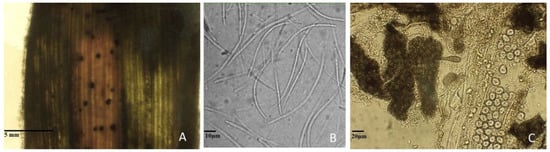
Figure 2.
(A) Pycnidia of Zymoseptoria tritici on natural infected durum wheat leaf. (B) Asexual spores (conidia) of Zymoseptoria tritici. (C) Crushed pycnidia collected from natural infected durum wheat leaf.
No difference was recorded in the number of pycnidia, either fertile or sterile. At 24–48 h, for every fragment of injured leaf, 13–15% of pycnidia showed cirrus formation. In subsequent observations, no further formation of cirrhi from the pycnidia present on the damaged leaves was noticed. The subsequent observations of cirrhi under the microscope confirm the presence of conidia, morphologically attributable to Zymoseptoria tritici [32,33] (Figure 2B). The crushing on the slide of the pycnidia, taken at 72–96 h, in the damaged leaf portions, and the subsequent observation under the microscope, did not allow us to observe any propagation element inside the corpuscle (Figure 2C).
4. Discussion
The application of ZT allows for the building up of a permanent soil cover, which becomes fundamental in areas where rainfall is scarce and erratic, with drought frequently occurring during grain filling of durum wheat. In comparison with CT, characterized by bare soils due to continuous inversion of upper layers, ZT allows for a mulch accumulation 0.93 cm thick, corresponding to about 2.00 t ha−1 on average. Furthermore, the results are even better under WW (1.40 vs. 0.46 cm, about 3.06 vs. 0.95 t ha−1), although it has to be considered that the residues from the ZT + WF combination are composed of a mixture of straw and faba beans, which, once in the soil, behaves differently than the pure straw mulch accumulated under WW. The quicker decomposition of the ZT + WF favours a fast and more abundant release of several nutrients [34], as in the case of K+ [35], and produces higher N amounts, enhancing the N-fixing process in the presence of faba beans [36].
Under such soil-ameliorated conditions, i.e., increased rainfall infiltration, reduced evaporation rates [27,37] and better nutrient availability (especially N, under WF), yields as well as some technological traits of durum wheat have improved. Yields increased, especially in dryer years, confirming the effectiveness of the CA approach in terms of water and N soil availability. According to Carr et al. [38], single grain weight is not affected by tillage systems, although De Vita et al. [39] and Di Fonzo et al. [40] reported higher grain weight under no-till, possibly due to soil water and N being conserved [41]. The variability of climatic conditions made it difficult to distinguish a clear trend for TKW and hectolitre weight. Moreover, the previous findings are fairly contradictory: some researchers indicate higher hectolitre weight under no-till [39,40,41], while others report no influence of tillage systems on TKW [36,42]. In any case, Royo et al. [43] indicate that water deficit occurring during the reproduction stage reduces both the duration and the rate of grain filling as well as the mean grain weight.
The quality of end-products of the durum wheat chain is strongly related to that of grains, and results from a genotype × environment interaction. In particular, grain protein concentration and gluten quality are of primary importance for the production of pasta [44,45,46], mainly consumed in European and North American countries. Our work indicates that residue management and crop establishment treatment significantly affect GPC and protein quality, although limited and controversial results are found in the literature; Carr et al. [38] reported no effect, while López-Bellido et al. [41] indicated that conventional tillage induced higher GPC than no-till. Probably such inconsistency was due to difference in growing and crop management conditions [47]. Our results confirm that conservation agriculture increases both GPC and its quality [39,40] under favourable environmental conditions (Mediterranean environments) [48,49]. Nevertheless, the erratic rainfall distribution induces variability in such traits, which was effectively softened by CA system application. Moreover, positive correlations were found between GPC and SDS volume [46,50], indicating that increasing GPC through the CA approach could in turn lead to an increase in gluten strength and quality. Crop residue management has also been demonstrated to be a useful strategy to improve the colour of the grain, known to depend not only on genetic factors but also on growing conditions [51,52,53], which has important implications for the marketing of durum wheat-based products.
The lower expression of Z. tritici symptoms under CT is probably due to the absence of crop residues and consequently to the reduced inoculum of the fungus [13,21]. However, under ZT the higher expression of the symptoms of Z. tritici did not affect the quantitative and qualitative characteristics of the grain [18]. Crop rotation caused a consistent reduction in leaf symptoms under ZT treatments in both years [18,54], although the grain characteristics of ZT + WW were not dissimilar to those of ZT + WF. In plants affected by the disease, no direct damage to grain was found because of the delayed appearance of the infection (end of May), meaning there was no adverse effect on wheat during the earlier stages, when starch is accumulated in stem and roots and remobilized later on, and contributing to the grain filling to the extent of 20% [55,56].
In seasons with low rain at the end of the crop cycle (2017), cirrhi developed from pycnidia located on the leaves were very scarce [32,57], inducing a decrease in the cycles of infection; nevertheless, the late disease appearance seems to be the main reason for the low effect on yields, as demonstrated in 2016, when climate conditions were favourable to disease symptom expression [57].
Since the evaluations of the quantitative and qualitative characteristics of the grain were carried out by collecting both healthy and symptomatic plants, any damage to grains in infected plants may not be relevant to the final yield.
5. Conclusions
Our work proves that under a Mediterranean climate the application of CA principles has full benefits after a six/seven-year period of adoption. In particular:
- Under CA higher yield as well as higher GPC accumulation in kernels are achieved thanks to the improved soil water and nutrient availability.
- The inclusion of faba beans (WF) within the rotation caused a consistent reduction in leaf symptoms of Z. tritici in ZT treatments, normally subjected to the diffusion of durum wheat diseases. However, the late appearance of the infection appeared to be decisive in avoiding yield damages.
Further study is needed to individuate strategies for fungal infection avoidance or delay, thus combining the positive effects of CA techniques with a sanitary status in order to preserve grain quality and quantitative traits.
Author Contributions
F.C., F.S and M.P. conceptualization; F.C., F.S., S.D., G.P. and A.G. data curation; S.D., G.P., S.D.M. and E.G.M. formal and analysis; F.S., S.D.M. and E.G.M. Investigation; A.G. Methodology; M.P. Supervision; M.P. Validation; S.D., G.P. and A.G. Writing—original draft; F.C. and F.S. Writing—review & editing.
Funding
This research received no external funding.
Conflicts of Interest
The authors declare no conflict of interest.
References
- Dal Ferro, N.; Sartori, L.; Simonetti, G.; Berti, A.; Morari, F. Soil macro-and microstructure as affected by different tillage systems and their effects on maize root growth. Soil Till. Res. 2014, 140, 55–65. [Google Scholar] [CrossRef]
- Shao, Y.; Xie, Y.; Wang, C.; Yue, J.; Yao, Y.; Li, X.; Guo, T. Effects of different soil conservation tillage approaches on soil nutrients, water use and wheat-maize yield in rainfed dry-land regions of North China. Eur. J. Agron. 2016, 81, 37–45. [Google Scholar] [CrossRef]
- Lopez-Bellido, R.J.; Muñoz-Romero, V.; Lopez-Bellido, F.J.; Guzman, C.; Lopez-Bellido, L. Crack formation in a mediterranean rainfed Vertisol: Effects of tillage and crop rotation. Geoderma 2016, 281, 127–132. [Google Scholar] [CrossRef]
- Anderson, W.K.; Impiglia, A. Management of dryland wheat. In Bread Wheat; FAO: Rome, Italy, 2002; ISBN 92-5-104809-6. [Google Scholar]
- Friedrich, T. Conservation Agriculture as a means of achieving sustainable intensification of crop production. Agric. Dev. 2013, 19, 7–11. [Google Scholar]
- Farooq, M.; Siddique, K.H.M. Conservation agriculture: Concepts, brief history, and impacts on agricultural systems. In Conservation Agriculture; Springer International Publishing: Basel, Switzerland, 2015; pp. 3–17. ISBN 978-3-319-11619-8. [Google Scholar]
- Ranaivoson, L.; Naudin, K.; Ripoche, A.; Affholder, F.; Rabeharisoa, L.; Corbeels, M. Agro-ecological functions of crop residues under conservation agriculture. A review. Agron. Sustain. Dev. 2017, 37. [Google Scholar] [CrossRef]
- Hobbs, P.R.; Sayre, K.; Gupta, R. The role of conservation agriculture in sustainable agriculture. Philos. Trans. R. Soc. B Biol. Sci. 2008, 363, 543–555. [Google Scholar] [CrossRef] [PubMed]
- Corsi, S.; Friedrich, T.; Kassam, A.; Pisante, M. A Review of Carbon Sequestration through Conservation Agriculture. In Proceedings of the International Symposium on Managing Soils for Food Security and Climate Change Adaptation and Mitigation; Food and Agriculture Organization of the United Nations: Rome, Italy, 2014; pp. 205–207. [Google Scholar]
- Lal, R. Sequestering carbon and increasing productivity by conservation agriculture. J. Soil Water Conserv. 2015, 70, 55A–62A. [Google Scholar] [CrossRef]
- Powlson, D.S.; Stirling, C.M.; Jat, M.L.; Gerard, B.G.; Palm, C.A.; Sanchez, P.A.; Cassman, K.G. Limited potential of no-till agriculture for climate change mitigation. Nat. Clim. Chang. 2014, 4, 678–683. [Google Scholar] [CrossRef]
- Henneron, L.; Bernard, L.; Hedde, M.; Pelosi, C.; Villenave, C.; Chenu, C.; Bertrand, M.; Girardin, C.; Blanchart, E. Fourteen years of evidence for positive effects of conservation agriculture and organic farming on soil life. Agron. Sustain. Dev. 2014, 35, 169–181. [Google Scholar] [CrossRef]
- Pittelkow, C.M.; Liang, X.; Linquist, B.A.; Groenigen, L.J.; Van Lee, J.; Lundy, M.E.; Van Gestel, N.; Six, J.; Venterea, R.T.; Van Kessel, C. Productivity limits and potentials of the principles of conservation agriculture. Nature 2015, 517, 365–368. [Google Scholar] [CrossRef] [PubMed]
- Kumar, K.; Goh, K.M. Crop Residues and Management Practices: Effects on Soil Quality, Soil Nitrogen Dynamics, Crop Yield, and Nitrogen Recovery. Adv. Agron. 1999, 68, 197–319. [Google Scholar] [CrossRef]
- Knowler, D.; Bradshaw, B. Farmers’ adoption of conservation agriculture: A review and synthesis of recent research. Food Policy 2007, 32, 25–48. [Google Scholar] [CrossRef]
- Holland, J.M. The environmental consequences of adopting conservation tillage in Europe: Reviewing the evidence. Agric. Ecosyst. Environ. 2004, 103, 1–25. [Google Scholar] [CrossRef]
- Gilbert, J.; Woods, S.M. Leaf spot diseases of spring wheat in southern Manitoba farm fields under conventional and conservation tillage. Can. J. Plant Sci. 2001, 81, 551–559. [Google Scholar] [CrossRef]
- Van den Putte, A.; Govers, G.; Diels, J.; Gillijns, K.; Demuzere, M. Assessing the effect of soil tillage on crop growth: A meta-regression analysis on European crop yields under conservation agriculture. Eur. J. Agron. 2010, 33, 231–241. [Google Scholar] [CrossRef]
- Kirkegaard, J.A.; Conyers, M.K.; Hunt, J.R.; Kirkby, C.A.; Watt, M.; Rebetzke, G.J. Sense and nonsense in conservation agriculture: Principles, pragmatism and productivity in Australian mixed farming systems. Agric. Ecosyst. Environ. 2014, 187, 133–145. [Google Scholar] [CrossRef]
- Bailey, K.L. Diseases under conservation tillage systems. Can. J. Plant Sci. 1996, 76, 635–639. [Google Scholar] [CrossRef]
- Bockus, W.W.; Shroyer, J.P. The Impact of Reduced Tillage on Soilborne Plant Pathogens. Annu. Rev. Phytopathol. 1998, 36, 485–500. [Google Scholar] [CrossRef] [PubMed]
- Sturz, A.V.; Carter, M.R.; Johnston, H.W. A review of plant disease, pathogen interactions and microbial antagonism under conservation tillage in temperate humid agriculture. Soil Tillage Res. 1997, 41, 169–189. [Google Scholar] [CrossRef]
- Gao, Y.; Li, Y.; Zhang, J.; Liu, W.; Dang, Z.; Cao, W.; Qiang, Q. Effects of mulch, N fertilizer, and plant density on wheat yield, wheat nitrogen uptake, and residual soil nitrate in a dryland area of China. Nutr. Cycl. Agroecosyst. 2009, 85, 109–121. [Google Scholar] [CrossRef]
- Galieni, A.; Stagnari, F.; Visioli, G.; Marmiroli, N.; Speca, S.; Angelozzi, G.; D’Egidio, S.; Pisante, M. Nitrogen fertilisation of durum wheat: A case of study in mediterranean area during transition to conservation agriculture. Ital. J. Agron. 2016, 11, 12–23. [Google Scholar] [CrossRef]
- Cherr, C.M.; Scholberg, J.M.S.; McSorley, R. Green manure approaches to crop production: A synthesis. Agron. J. 2006, 98, 302–319. [Google Scholar] [CrossRef]
- Stagnari, F.; Pisante, M. Managing faba-bean residues to enhance the fruit quality of the melon (Cucumis melo L.) crop. Sci. Hortic. 2010, 126, 317–323. [Google Scholar] [CrossRef]
- Stagnari, F.; Galieni, A.; Speca, S.; Cafiero, G.; Pisante, M. Effects of straw mulch on growth and yield of durum wheat during transition to Conservation Agriculture in Mediterranean environment. Field Crops Res. 2014, 167, 51–63. [Google Scholar] [CrossRef]
- Govaerts, B.; Sayre, K.D.; Deckers, J. Stable high yields with zero tillage and permanent bed planting? Field Crops Res. 2005, 94, 33–42. [Google Scholar] [CrossRef]
- Sosulski, F.W.; Imafidon, G.I. Amino acid composition and nitrogen-to-protein conversion factors for animal and plant foods. J. Agric. Food Chem. 1990, 38, 1351–1356. [Google Scholar] [CrossRef]
- McKinney, H.H. A new system of grading plant diseases. J. Agric. Res. 1923, 26, 195–218. [Google Scholar]
- R Core Team. R: A Language and Environment for Statistical Computing; R Foundation for Statistical Computing: Vienna, Austria, 2017. [Google Scholar]
- Kema, G.H.J.; Annone, J.G. In vitro production of pycnidia by Septoria tritici. Neth. J. Plant Pathol. 1991, 97, 65–72. [Google Scholar] [CrossRef]
- Quaedvlieg, W.; Kema, G.H.J.; Groenewald, J.Z.; Verkley, G.J.M.; Seifbarghi, S.; Razavi, M.; Mirzadi Gohari, A.; Mehrabi, R.; Crous, P.W. Zymoseptoria gen. nov.: A new genus to accommodate Septoria-like species occurring on graminicolous hosts. Persoonia Mol. Phylogeny Evol. Fungi 2011, 26, 57–69. [Google Scholar] [CrossRef] [PubMed]
- Tukey, R.B.; Schoff, E.L. Influence of different mulching materials upon the soil environment. Am. Soc. Hort. Sci. 1963, 82, 68–76. [Google Scholar]
- Lupwayi, B.N.Z.; Clayton, G.W.; Harker, K.N.; Turkington, T.K.; Johnston, A.M. Impact of Crop Residue Type on Potassium Release. Better Crops 2005, 89, 14–15. [Google Scholar]
- Van Kessel, C.; Hartley, C. Agricultural management of grain legumes: Has it led to an increase in nitrogen fixation? Field Crops Res. 2000, 65, 165–181. [Google Scholar] [CrossRef]
- Scott, B.J.; Eberbach, P.L.; Evans, J.; Wade, L.J. Stubble Retention in Cropping Systems in Southern Australia: Benefits and Challenges; Industry and Investment NSW: Wagga Wagga, Australia, 2010; ISBN 9781742560205.
- Carr, P.M.; Horsley, R.D.; Poland, W.W. Tillage and seeding rate effects on wheat cultivars. Crop Sci. 2003, 43, 202–209. [Google Scholar] [CrossRef]
- De Vita, P.; Di Paolo, E.; Fecondo, G.; Di Fonzo, N.; Pisante, M. No-tillage and conventional tillage effects on durum wheat yield, grain quality and soil moisture content in southern Italy. Soil Tillage Res. 2007, 92, 69–78. [Google Scholar] [CrossRef]
- Di Fonzo, N.; De Vita, P.; Gallo, A.; Fares, C.; Paladino, O.; Trocoli, A. Crop management efficiency as a tool to improve durum wheat quality in Mediterranean areas. In Durum Wheat, Semolina and Pasta Quality. Recent Achievements and New Trends; Abecassis, J., Autran, J.C., Feillet, P., Eds.; INRA: Paris, France, 2001; Le Colloques n. 99; pp. 67–82. [Google Scholar]
- López-Bellido, L.; Fuentes, M.; Castillo, J.E.; López-Garrido, F.J. Effects of tillage, crop rotation and nitrogen fertilization on wheat-grain quality grown under reinfed Mediterranean conditions. Field Crops Res. 1998, 57, 265–276. [Google Scholar] [CrossRef]
- Cox, D.J.; Shelton, D.R. Genotipe-by-tillage interactions in hard red winter wheat quality evaluation. Agron. J. 1992, 84, 627–630. [Google Scholar] [CrossRef]
- Royo, C.; Abaza, M.; Blanco, R.; del Moral, L.F.G. Triticale grain growth and morphometry as affected by drought stress, late sowing and simulated drought stress. Aust. J. Plant Physiol. 2000, 27, 1051–1059. [Google Scholar] [CrossRef]
- López-Bellido, R.J.; López-Bellido, L. Efficiency of nitrogen in wheat under Mediterranean conditions: Effect of tillage, crop rotation and N fertilization. Field Crops Res. 2001, 71, 31–46. [Google Scholar] [CrossRef]
- D’Egidio, M.G.; Mariani, B.M.; Nardi, S.; Novaro, P.; Cubadda, R. Chemical and technological variables and their relationships: A predictive equation for pasta cooking quality. Cereal Chem. 1990, 67, 275–281. [Google Scholar]
- Novaro, P.; D’Egidio, M.G.; Mariani, B.M.; Nardi, S. Combined effect of protein content and high-temperature drying systems on pasta cooking quality. Cereal Chem. 1993, 70, 716–719. [Google Scholar]
- Rieger, S.; Richner, W.; Streit, B.; Frossard, E.; Liedgens, M. Growth, yield, and yield components of winter wheat and the effects of tillage intensity, preceding crops, and N fertilisation. Eur. J. Agron. 2008, 28, 405–411. [Google Scholar] [CrossRef]
- Lloveras, J.; López, A.; Ferrán, J.; Espachs, S.; Solsona, J. Bread-making wheat and soil nitrate as affected by nitrogen fertilization in irrigated Mediterranean conditions. Agron. J. 2001, 93, 1183–1190. [Google Scholar] [CrossRef]
- Abad, A.; Lloveras, J.; Michelena, A. Nitrogen fertilization and foliar urea effects on durum wheat yield and quality and on residual soil nitrate in irrigated Mediterranean conditions. Field Crops Res. 2004, 87, 257–269. [Google Scholar] [CrossRef]
- Bechere, E.; Peña, R.J.; Mitiku, D. Glutenin composition, quality characteristics, and agronomic attributes of durum wheat cultivars released in Ethiopia. Afr. Crop Sci. J. 2002, 2, 173–182. [Google Scholar] [CrossRef]
- Hentschel, V.; Kranl, K.; Hollmann, J.; Lindhauer, M.G.; Böhm, V.; Bitsch, R. Spectrophotometric determination of yellow pigment content and evaluation of carotenoids by high-performance liquid chromatography in durum wheat grain. J. Agric. Food Chem. 2002, 50, 6663–6668. [Google Scholar] [CrossRef] [PubMed]
- Guler, M. Irrigation effects on quality characteristics of durum wheat. Can. J. Plant Sci. 2003, 83, 327–331. [Google Scholar] [CrossRef]
- Clarke, F.R.; Clarke, J.M.; McCaig, T.N.; Knox, R.E.; DePauw, R.M. Inheritance of yellow pigment concentration in seven durum wheat crosses. Can. J. Plant Sci. 2006, 86, 133–141. [Google Scholar] [CrossRef]
- Page, K.; Dang, Y.; Dalal, R. Impacts of conservation tillage on soil quality, including soil-borne crop diseases, with a focus on semi-arid grain cropping systems. Aust. Plant Pathol. 2013, 42, 363–377. [Google Scholar] [CrossRef]
- Ponomarenko, A.; Goodwin, S.B.; Kema, G.H.J. Septoria tritici blotch (STB) of wheat. Plant Health Instr. 2011. [Google Scholar] [CrossRef]
- AHDB Cereals & Oilseeds. Foliar Diseases-Septoria tritici. Wheat Disease Management Guide; AHDB Cereals & Oilseeds: Warwickshire, UK, 2016. [Google Scholar]
- Te Beest, D.E.; Shaw, M.W.; Paveley, N.D.; Van Den Bosch, F. Evaluation of a predictive model for Mycosphaerella graminicola for economic and environmental benefits. Plant Pathol. 2009, 58, 1001–1009. [Google Scholar] [CrossRef]
© 2018 by the authors. Licensee MDPI, Basel, Switzerland. This article is an open access article distributed under the terms and conditions of the Creative Commons Attribution (CC BY) license (http://creativecommons.org/licenses/by/4.0/).