Article

Patterns of Genetic Diversity and Implications for In Situ Conservation of Wild Celery (Apium graveolens L. ssp. graveolens)

Julius Kühn-Institut (JKI), Federal Research Centre for Cultivated Plants, Institute for Breeding Research on Agricultural Crops, Erwin-Baur-Str. 27, 06484 Quedlinburg, Germany
*
Author to whom correspondence should be addressed.
Agriculture 2018, 8(9), 129; https://doi.org/10.3390/agriculture8090129
Submission received: 26 May 2018 / Revised: 13 August 2018 / Accepted: 16 August 2018 / Published: 22 August 2018
(This article belongs to the Special Issue Biodiversity of Vegetable Crops, A Living Heritage)

Abstract

:
In Germany, the wild ancestor (Apium graveolens L. ssp. graveolens) of celery and celeriac is threatened by genetic erosion. Seventy-eight potentially suitable genetic reserve sites representing differing ecogeographic units were assessed with regard to the conservation status of the populations. At 27 of the 78 sites, 30 individual plants were sampled and genetically analyzed with 16 polymorphic microsatellite makers. The Discriminant Analysis of Principal Components (DAPC) was applied to identify clusters of genetically similar individuals. In most cases (25 out of 27 occurrences) individuals clustered into groups according to their sampling site. Next to three clearly separated occurrences (AgG, AgUW, AgFEH) two large groups of inland and Baltic Sea coast occurrences, respectively, were recognized. Occurrences from the coastal part of the distribution area were interspersed into the group of inland occurrences and vice versa. The genetic distribution pattern is therefore complex. The complementary compositional genetic differentiation Δj was calculated to identify the Most Appropriate Wild Populations (MAWP) for the establishment of genetic reserves. Altogether 15 sites are recommended to form a genetic reserve network. This organisational structure appears suitable for promoting the in situ conservation of intraspecific genetic diversity and the species’ adaptability. As seed samples of each MAWP will be stored in a genebank, the network would likewise contribute to the long-term ex situ conservation of genetic resources for plant breeding.

1. Introduction

Celery (Apium graveolens L. var. dulce) and celeriac (Apium graveolens L. var. rapaceum) have significant global economic importance. The total production value of celery amounted 458 million US$ in the USA in the year 2013 [1]. In the European Union (EU-28) celery/celeriac was grown on an average of 8125 ha within the period from 2011–2016 [2]. Due to cultural preferences, different crop types are grown and consumed. A. graveolens var. rapaceum forms aromatic tubers which can be stored as a winter vegetable and which is grown in the colder regions of Central and Eastern Europe. Consumers in Western Europe, the Mediterranean region, India, China, and the USA prefer the petiole celery (var. dulce). A further variety (var. secalinum) is used as a spice. Processed dried leaves or seeds are an important component of condiments [3,4].
All modern celery varieties have been derived from only two forms (‘White Plume’ and ‘Giant Pascal’) [5]. According to Melchinger and Lübberstedt [6] and Domblides et al. (cit. in [7]) the genetic base of celery breeding is small and may therefore impede further breeding progress. Wang et al. [8] developed sequence related amplified polymorphism (SRAP) markers and used them along with microsatellite markers (SSR) published by Acquadro et al. [9] to investigate the genetic differences between European and Chinese celery varieties (var. dulce). They detected a unique genetic signature within the Chinese germplasm [8]. Using transcriptome sequences Fu et al. [10,11] developed a large set of EST-SSR to study genetic diversity within the cultivated species.
European genebanks conserve 830 accessions of cultivated Apium germplasm [12]. A large number of ex situ accessions but also a limited number of landraces maintained by farmers in traditional seed supply systems [7] is available for base-broadening. Spoor and Simmonds discern between two base-broadening efforts: the incorporation approach aims at increasing the genetic variability of the genetic background while the introgression approach involves the transfer of specific genes from a donor into the breeding material by crossing and backcrossing [13].
Introgression programmes commonly target distinct quality and resistance traits. Because celery consumption can provoke severe allergic reactions, foods and condiments containing celery must be clearly marked as such. Non-specific lipid transfer proteins (nsLTP) designated Api g 1 [14], Api g 2 [15] and Api g 6 [16] trigger the allergic reaction. The development of celery varieties which do not cause allergic reaction would be an important objective of quality breeding. However, non-allergic variants of cultivated forms or wild species have not yet been discovered.
As for most crops, breeding of pest- and disease-resistant celery varieties is an important aim for two reasons. Global trade and climate change promote the spread of new pests and diseases. Additionally, at the same time the acceptance for chemical plant protection is decreasing. Therefore, breeding of resistant varieties becomes increasingly important. Ochoa and Quiros used A. panul Reiche and A. chilense Hook. and Arn. to improve the resistance of the crop to the leaf spot disease (Septoria apicola Speg. f.s. apii) [17]. A. prostratum Labill. ex Vent is resistant to Spodoptera exigua Hübner, the beet army worm the larvae of which damage the leaves [18]. Helosciadium nodiflorum (L.) W. D. J. Koch (Syn. A. nodiflorum L.) is characterized by a resistance inhibiting the development of the leaf miner Lyriomiza trifolii Burgess beyond the larvae stage [19,20].
For A. graveolens ssp. graveolens (2n = 22) [21], the close wild relative of celery/celeriac, information on traits of interest to breeders is not available. European genebanks conserve only 51 accessions of this species (sample status wild) of which 59% were collected and are conserved in Portugal. The remaining 41% of the European holding is shared by genebanks in Azerbaijan, Czech Republic, Germany, Israel, Spain and the United Kingdom [12].
The species is native to most of Europe, North Africa, Siberia and the Caucasus and has been reported by a total of 56 countries to be located in these regions [22]. Obviously, the current holding does not at all cover the full range of ecogeographic variation of the distribution area. Further collecting of wild A. graveolens is required to capture a representative sample of genetic diversity of the species. A start was made in Germany in the context of a project aiming at the establishment of genetic reserves for four native wild celery species, namely A. graveolens L. ssp. graveolens, Helosciadium repens (Jacq.) W. D. J. Koch (Syn. A. repens (Jacq.) Lag.), H. nodiflorum (Syn. A. nodiflorum L.) and H. inundatum (L.) W. D. J. Koch (Syn. A. inundatum (L.) Rchb.f.) [23].
A. graveolens ssp. graveolens mainly occurs in northern and central Germany. In the northern part A. graveolens can be found in the hinterland of the coast on salt meadows and saline pasture land as well as in brackish water stands of Phragmites australis [24,25]. In the central part the species grows around natural salt water springs, along saline creeks or on wet sites at the foot of salty spoil heaps [26,27,28].
The ultimate goal of the project consists in the establishment of a network of persons and institutions managing a set of genetic reserve sites in Germany. A European group of researchers is pursuing similar interests within the framework of the Farmer’s Pride project [29]. We expect that the national and European activity will contribute to the development of an integrated European crop wild relative conservation strategy as outlined in the concept paper by Maxted et al. [30].
A genetic reserve is defined as “The location, management and monitoring of genetic diversity in natural populations within defined areas designated for long-term active conservation” [31]. It is a conservation procedure combining the dynamic conservation of a population in the habitat (in situ) with the static preservation of a sample taken from the population in a genebank (ex situ). According to the proposed quality standards for genetic reserves, Most Appropriate (crop) Wild (relative) Populations (MAWP) [30] have to be identified through a rigorous scientific process which includes the genetic characterization of populations of the target taxon [32]. The genetic analysis is required to determine those populations representing altogether the genetic diversity of the target taxon best. Populations need to fulfil additional quality criteria in order to be proposed as MAWP. The population should exist at the location for at least ten years (native or introduced), contain specific traits of interest, be managed according to the minimum quality standards for genetic reserve conservation proposed by Iriondo et al. [32] and nominated as MAWP by a responsible national agency [30].
Kell et al. suggested a stepwise procedure to identify suitable genetic reserve sites [33]. The stepwise decision-making process ends with the designation of genetic reserve sites for a set of MAWPs and the creation of MAWP accessions for ex situ conservation and use. The objectives of our study were (i) to analyze the genetic structures within a collection of A. graveolens ssp. graveolens, (ii) to identify MAWPs based on the representativity or uniqueness of the genetic composition of occurrences and (iii) to locate sites within the German distribution area suited for the establishment of genetic reserves.
Generally, species are subdivided into plant groups more or less strongly connected by gene flow. Declining gene flow with increasing spatial distance between occurrences combined with adaptation to specific local environmental conditions can result in genetic differentiation between occurrences. In addition, genetic drift caused by local extinction and re-establishment of occurrences shapes their genetic composition [34]. Molecular genetic tools have been extensively used to study patterns of genetic diversity in many species [35]. The development of molecular markers for celery started in 1984 [36]. Huestis et al. [37] developed 21 RFLP markers and mapped them to eight linkage groups. Until recently, the development of a greater number of genetic markers for a crop of limited global economic importance based on whole-genome sequences seemed infeasible due to the large genome size of 3 × 10⁹ bp [10]. This assumption was outdated quickly. Rapid technological progress allowed sequencing the whole genome of ‘Q2-JN11’ celery, a highly inbred line of ‘Jinnan Shiqin’. The online database of the whole-genome sequences, CeleryDB, was constructed and the sequence information made available to the research community [38]. Sequences of unigenes described by Li et al. [39] are available in the celery database and can serve as a reference base to identify trait-associated single nucleotide polymorphism and additional SSR markers. The technological advancements allowed the authors of Reference [10] to analyze a large set of transcriptome sequences and to develop a set of EST-SSRs for breeding research and population genetics. The latter deals with the analysis of the distribution of genetic variation within and between populations.
Our study was initiated to support in situ conservation actions. To this end we determined the structures of genetic diversity within the sampled material as well as the differences in trait distribution between occurrences. The latter measurement of genetic variation is termed compositional differentiation and is of particular relevance because it allows the identification of MAWP candidates [40,41].

2. Results

In Germany, A. graveolens is mainly distributed in the coastal region of the Baltic Sea and in the centre of Germany where the species occurs in haline marshlands. The genetic differences between 27 occurrences sampled in the distribution area (Table 1) were analyzed with 16 SSR markers to identify candidate MAWPs and sites suited for the establishment of genetic reserves. The descriptive marker parameters are presented in Table 2. The number of distinct alleles ranges between 4 (marker Fn09) and 18 (marker ECMS6, QC43), and the polymorphic information content (PIC) ranges between 0.042 (marker Fn100) and 0.803 (marker ECMS39). Mostly, high PIC values indicate appropriateness of respective markers for genetic analyses. The observed heterozygosity (Ho) ranges between 0.005 (Fn100) and 0.963 (QC75) and the expected (He) heterozygosity between 0.042 (Fn100) and 0.826 (ECMS39).
The Hardy–Weinberg principle (HWP) provides the theoretical framework within which genetic variation has been analyzed by many research groups dealing with similar subjects. Therefore, the Chi2-test was performed for each of the 432 combinations (27 occurrences × 16 markers) to test if the HWP holds for each of the combinations. 143 combinations were invariable. Out of the remaining combinations, 208 deviated significantly from HWP and only 81 combinations (about 19%) were in Hardy–Weinberg equilibrium (detailed results not presented here). Since a high number of combinations deviated from HWP, the genetic distance and genetic differentiation among the 27 occurrences was analyzed using the measure of Δ [43] and the software DifferInt [41].
Within the whole data set (790 individuals × 16 markers), 125 distinct alleles (excluding null alleles), 156 distinct single-locus types and 637 distinct multi-locus types were identified. Within occurrences, specific multi-locus genotypes were found to be duplicated between 2 and 18 times indicating self-fertilisation or preferential pairing within half- or full-sib families. The degree of inbreeding within an occurrence can be assessed by calculating the FIS-index which is a measure of within population deficit of heterozygotes [44]. FIS ranged between −0.167 (occurrence AgG) and 0.558 (occurrence AgFRI) whereby a negative value indicates excess of heterozygotes and a positive value an excess of homozygotes within the occurrence. Five of the 27 occurrences show an excess of heterozygotes while 22 are characterized by an excess of homozygotes (Table 3).
A Discriminant Analysis of Principal Components (DAPC) [45] was performed to determine the genetic structures within the sampled material (Figure 1). Genetic data from 757 of the 790 A. graveolens individuals that had been analyzed with 16 SSR markers were used for the calculation. These individuals correspond to 27 occurrences sampled in Germany (Figure 2). Thirty-three individuals having a null allele at any of the marker loci were excluded (see chapter Material and Methods). The DAPC revealed a much clearer separation of populations (Figure 1) than a single principle component analysis performed with DARwin [46] (data not shown). The first two axes plotted account for 46% of the observed variance. Individuals form interpretable clusters. They are arranged in two major groups and three offside occurrences AgG, AgUW and AgFEH corresponding to Baltic Sea coastal habitats. One major group is comprised of mainly coastal occurrences (AgWU, AgDA, AgHEU, AgHID, AgOEH and AgDZ) and appears more condensed (Figure 1, left part). This group also includes inland occurrences (AgSL, AgFRI, AgZIE, AGROS, AgBEN). The other major group of occurrences exhibits a greater range and harbours mainly inland occurrences (Figure 1, right part) (AgJX, AgHES, AgSK, AgBBG, AgSUE, AgHEC, AgBW, and AgWA). The coastal occurrence AgEICH, AgKREM and AgSEHL are interspersed in the second major group in the lower right part of the scatter plot. The genetic structure revealed by DAPC analysis is therefore only partly in accordance with the geographic origin of the samples. The correlation between genetic clustering and the geographic origin of individual plants was further investigated by the K-means ex nihilo clustering method. Based solely on the genetic data the clusters identified correspond to the individual occurrences except for only one cluster harbouring individuals from neighbouring inland occurrences AgHEC and AgSUE and another one with coastal occurrences AgFEH and AgHID (data not shown).
The application of the genetic reserve conservation technique requires the choice of populations on the basis of the genetic representativity or uniqueness in relation to all analyzed populations [41]. In seed propagated species, under natural conditions, the parent population passes genes or gene complexes with their specific alleles to the next generation. Therefore, the recommendation of populations for conservation of a seed propagated species has to be based on the analyses of compositional genetic differentiation (Δj) at the gene pool level. Next to Δj, quality criteria for genetic reserves suggested by Iriondo et al. [32] were applied to identify MAWP (Table 1).
The measure Δj, marked in the snail diagram by the radius length of a sector, was calculated to assess the contribution of each occurrence to genetic differentiation. The result is summarized in Figure 3. The mean genetic differentiation ΔSD is the average of the 27 radii and is marked by the circle in the diagram. The mean complementary genetic differentiation is ΔSD = 0.3688. AgHEC (Δj = 0.2513) represents the genetic composition of the pooled remaining 26 occurrences best while the genetic composition of AgWA (Δj = 0.4776) deviates from its complement most. The Δj values of the other 25 occurrences decreases in small steps clockwise from AgG to AgROS. The difference between the Δj-values of two occurrences depicted next to each other in clockwise sense is never larger than 0.034, i.e., less than 3.4% of the maximal possible sector radius length, and for most of the occurrences (20 out of 27) smaller than 1%. This means that neighbouring occurrences differ only slightly in their contribution to genetic differentiation.
The genetic reserve conservation technique includes by definition the active management of a MAWP. Knowledge of the reproductive system of the species is required to understand how site management interventions influence the genetic composition and the development of genetic diversity of a population at a specific site over time. Information on genetic bottlenecks caused by extinction and re-colonization events in the past can likewise improve the operation of genetic reserves. Site-specific selection pressure can change the distribution of alleles over populations within the species gene pool. The effect of selection and other forces influencing the genetic composition of populations show up as differences in the genetic composition among populations and are expressed as deviation from the HWP. The possible causes for deviations from the HWP can be investigated by permutation analyses [41].
In the first permutation analysis, all alleles at each locus were permuted among the individuals within populations. The permutation test was performed to investigate the influence of the reproductive system on the distribution of alleles within A. graveolens populations. In an ideal panmictic population alleles associate at single loci (homologous association) independent of the allelic type (fragment length). The observed mean differentiation increased from the gene pool (ΔSD = 0.3688), and mean single-locus (ΔSD = 0.3771, p = 0.0) to the multi-locus level (ΔSD = 0.4001, p = 0.0) of genetic integration (Table 4). The ΔSD-value observed at the mean single-locus level of genetic integration is outside the range of the 95% confidence interval as is the ΔSD-value observed at the multi-locus level, i.e., the observed values are not part of the majority of the ΔSD-values calculated from data sets generated by 10,000 random permutations. At the mean single-locus, and multi-locus level the observed ΔSD-value is smaller than 95% of all the ΔSD-values generated by permutations. The mean differentiation at higher levels of genetic integration is less than could be expected from random gene association. The hypothesis that linkage equilibrium or HWE exists and that gene associations are created within populations independently of the allelic type at each locus is to be rejected [41].
The presence of a specific genotype within a population can either be incidental, the effect of selection within a population or the result of migration between populations. In the second permutation analysis all individual genotypes with their genetic types were randomly permuted among the occurrences. The hypothesis that forces that assign individuals to populations do this independently of their genetic types at a given level of genetic integration was tested. At all integration levels the observed ΔSD-value was significantly higher than those resulting from 10,000 random permutations, i.e., the differentiation among occurrences was higher than could be expected from random association of genotypes to occurrences. In other words, individual genotypes are not randomly distributed across the 27 occurrences. If we define the 27 occurrences as subpopulations of meta-population, it can be concluded that a significant genetic differentiation between subpopulations exists. As the occurrences were sampled at large geographic distances (see Figure 2) this finding can rather be explained by a site-specific genotypic selection and adaptational differentiation than by migration.

3. Discussion

Microsatellite markers have been widely applied to study patterns of genetic diversity of a species and to select and recommend populations for conservation purposes [47,48]. We succeeded to identify 16 polymorphic microsatellite markers. This marker set was used to characterize the genetic diversity of 27 A. graveolens ssp. graveolens occurrences. In the present study, the genetic distance measure Δ was used to quantify the contribution of each of the 27 occurrences to differentiation. The occurrence AgHEC proved to be most suitable to represent the genetic diversity of the remaining 26 occurrences and was identified as MAWP. The genetic composition of AgWA differed most from its complement. This specific diversity pattern can be interpreted as site-specific adaptation which makes AgWA a candidate for gene conservation measures. For several reasons, further 13 occurrences were selected as candidate MAWP. Microsatellite markers are very well-suited to assess the impact of selection and other evolutionary forces on the structure of genetic diversity of a species. However, they do not detect adaptive trait variation. In order to increase the chance of capturing adaptive trait variation, occurrences from each of the ecogeographic units were chosen. If several occurrences originated from the same ecogeographic unit, the one with the largest population size was nominated as MAWP. Preference was also given to sites already managed by local conservation agencies (see Table 1, LabID in bold letter type and Figure 2, black triangles). However, the nomination of 15 occurrences by no means devalues the remaining 12 occurrences. According to the definition of a genetic reserve, the population will actively be managed to maintain or, if necessary, improve the status of the target population. Active management requires financial resources which are always limited. The nomination of a limited number of MAWP is a pragmatic approach and helps spending financial resources efficiently. If, for whatever reason, a genetic reserve gets lost, it can be replaced by one of the occurrences with a similar Δj-value. This pragmatic approach is feasible as the differences between the Δj-values of occurrences ordered on the snail diagram next to each other is often less than 1% (Figure 3).
The mean genetic differentiation within the set of 27 occurrences is lower than ΔSD = 0.5 (ΔSD = 0 signifies no differentiation, ΔSD = 1 signifies complete differentiation) at all levels of genetic integration (gene pool level: ΔSD = 0.3688, mean single-locus level: ΔSD = 0.377, multi-locus level: ΔSD = 0.4001) although plants were sampled over a north-south distance of 680 km between the location Hiddensee and the location Ubstadt-Weiher near Karlsruhe. The reason for the lower genetic differentiation in A. graveolens ssp. graveolens as compared to Helosciadium nodiflorum, a wild celery species sampled in a much smaller distribution area [49], is unknown. Future investigations of the long-distance distribution mechanisms may help explaining this observation.
A. graveolens ssp. graveolens occurs wild as a halophilous marsh plant along sea coasts which likely is the primary distributions area. With the development of farm land at the expense of forest land over the past 1400 years [50] a secondary distribution area, the inland salt marshes, evolved. It can be assumed that the species migrated from the primary distribution area and colonized inland salt marshes in Germany. Inland saline and wet biotopes either developed naturally around salty springs (occurrence AgSUE) or result from salt mining activities (AgWA) where the species can be found at wet places close to soil heaps left over from potassium mining. These sites are like geographically isolated islands.
The DAPC analysis showed two major groups of occurrences: a costal and an inland group. The coastal group contains occurrences from inland sites and vice versa (Figure 1). For the time being this pattern is difficult to explain. The role of past colonization events, as well as factors shaping genetic diversity of A. graveolens ssp. graveolens today (migration, site specific selection pressure leading to adaptational differentiation, demographic fluctuations as a result of site-specific management actions) is not yet understood and deserves future research.
In two cases genetic signatures of migration between occurrences might exist. The K-means ex nihilo clustering method sorted almost all individuals of AgSUE and AgHEC into a single cluster. The plants were sampled at about 20 km distance in a landscape named Sülzetal (“Sülze” means salty water, “Tal” means valley) which makes exchange of seeds carried by animals between both sites more likely. The distance between occurrences AgFEH and AgHID growing on the Baltic Sea islands Fehmarn and Hiddensee, respectively, is 140 km (Figure 2). Both islands are important resting places in the autumn and spring for migrating birds. The allocation of 15 AgHID individuals to the AgFEH cluster could be interpreted as genetic signature of long-range seed transportation by birds. However, as long as no information on seed dispersal mechanisms in wild celery is available, this assumption remains a working hypothesis.
Some sites are not managed (e.g., AgWA) while others are grazed extensively (AgSUE) or mowed in late summer to maintain or improve the conservation status of the occurrence. If such management interventions happen only sporadically, the populations will undergo strong demographic changes from one generation to the next. We interpret the excess of homozygotes and heterozygotes, respectively (Table 3), as the genetic signature of an unstable demographic development of the occurrences resulting in the foundation of smaller groups of full or half-sib plants scattered over the site. A. graveolens ssp. graveolens is a self-compatible, insect pollinated species [51] and preferential pairing between closely related plants is therefore possible. Out of the 27 analyzed occurrences, 22 showed excess of homozygotes. As indicated by the permutation analysis, gene associations are created within occurrences dependent of the allelic type at each locus (Table 4, upper part). Self-pollination or mating between closely related individuals is therefore a likely explanation of this finding.
Iriondo et al. proposed quality standards to support practitioners involved in the design and management of genetic reserve. The population size is an important quality and selection criterion and should be large enough to sustain the long-term population viability [32]. Estimates of the demographic and genetic minimum viable population (MVP) for A. graveolens ssp. graveolens could not be found in the literature. However, animal genetic resources experts dealt with a similar problem already. Animal breeds are classified into four categories depending on their current effective population size whereby populations with an effective population size of Ne > 1000 individuals are considered not threatened. If Ne is within the range of 200 to 1000 individuals, populations are monitored and if the number of adult males sinks below 100 individuals, genetic conservation actions are initiated [52]. This approach can be transferred to plant genetic resources management programmes as it was derived from calculations of the increase of inbreeding depending on the allele frequency and the number of generations of random mating within populations of a given Ne and holds for any species. In order to meet the quality standards and as a first pragmatic recommendation for genetic reserve managers, the Ne of an A. graveolens ssp. graveolens population should not drop below a size of 1000 flowering individuals in a genetic reserve site. Sites like AgZIE with a population size of several hundred individuals fall already into this category while sites like AgWA do not. At AgWA interventions are required to enlarge the population area which will promote the spread of the occurrence and the increase of the population size. Although an effective population size of between 200 and 1000 individuals seems too high, it is achievable if the 15 recommended sites are managed accordingly. Future research projects could include occurrences from the whole European distribution area as to find occurrences in partner countries which genetically complement the suggested network of 15 sites for A. graveolens ssp. graveolens in Germany. By doing so, a European ex situ collection of wild A. graveolens ssp. graveolens accessions can be built representing a maximum of genetic diversity with a minimum of accessions.
Just today, when crop wild relatives are needed as sources of novel genetic variation more than ever before [53], the loss of species continues largely unrestrained [54,55]. Anthropogenic climate change has impact on plant species and may cause genetic erosion within species. Parmesan and Hanley [56] reviewed five global meta-analyses from long-term observational data on wild plant species and found that 44–65% of all investigated species show significant long-term change in phenologies, distribution, abundance and morphology. The changes correlated significantly with local or regional climate change patterns observed within the distribution area. To what extent climate change will jeopardize the long-term viability of specific species depends inter alia on the ability and speed of the species to migrate and colonize new sites [57]. In view of the relatively short period left, scientists call for the reinforcement of ex situ collecting activities to close gaps in genebanks and save germplasm for future generations [58]. This approach is justified as we have apparently no choice but to store the genetic resources of plant species in deep freezers and to reintroduce the material when mankind has overcome the climate crisis or any other devastating event. Ex situ conservation is one option. The better option is to develop and implement a conservation strategy which combines ex situ preservation of germplasm in genebanks with the maintenance of populations of the species in their natural habitat “in situ” where they have developed their specific traits [59,60]. There are two main differences between the in situ and the ex situ conservation approach. The management of a crop wild relative population in genetic reserves, such as the ones to be suggested for the establishment of A. graveolens ssp. graveolens, by definition includes the maintenance of favourable habitat conditions so that the target species can reproduce, adapt to changing growing conditions and evolve. The genetic reserve conservation technique [31] combines the best components of the ex situ and in situ conservation strategy and is a core element of the concept for in situ conservation of crop wild relatives in Europe endorsed by the steering committee of the European Cooperative Programme for Plant Genetic Resources (ECPGR) [30,61].
As compared to ex situ conservation, in situ conservation is a rather young research domain. If the distribution ranges of species shift as predicted it obviously will have important practical consequences for the genetic reserve management [57]. Climate change may also negatively affect A. graveolens ssp. graveolens within the European distribution area in the next 50 years [62,63]. A forecast of possible impacts of climate change on wild celery populations still is constrained by a shortage of high quality distribution data which can be used for modelling [64]. Furthermore, the reaction of plant species to climate change is more complex than thought before. Therefore, Parmesan and Hanley [56] called for the development of coordinated experiments across networks of field sites to better understand the response of species. The networks are not just a set of sites of plant populations but also a network of institutions and people who can record long-term data series on changes in phenologies, distribution, demography as well as genetic changes. Data required to forecast changes based on causal relations between the characteristics of a species and climate factors with a given statistical probability can be recorded by species-specific genetic reserves networks such as the one suggested for wild celery.
The flow chart (Figure 4) illustrates how the establishment of a genetic reserve network in Germany can be organised [23]. It summarizes experiences of a model and demonstration project. The whole process starts with the gathering of distribution data which are combined and processed (Steps 1 and 2). The existence of the plant species at selected sites is then confirmed by experts in the various Laender, material for genetic analysis is sampled and analyzed (Steps 3–5), the results and recommendations are discussed with stakeholders, the genetic reserve sites planned and the genetic reserve is finally established (Steps 6–8). Partners willing to contribute to the management of a specific genetic reserve site sign an agreement. Finally, their contribution to the management of a genetic reserve is acknowledged in a certificate issued by the Ministry of Food and Agriculture. The process can be divided into an information phase (Steps 1–5) and participatory project planning phase (Steps 6–8). Right from the beginning potential stakeholders are involved in the project planning and implementation, and are kept informed. A structured and open-result discussion with stakeholders is an important element of the procedure.
Next to these biological and scientific advantages of the in situ conservation approach the role of genetic reserves in public awareness building cannot be overemphasized. Genetic reserves are conservation projects that require the support and active collaboration of local people without which a genetic reserve can neither be established nor maintained over a longer period. Local communities can easily be convinced that genetic reserves contribute to food security and serve people. Genetic reserves are therefore not only a means of maintaining the environmental conditions under which economically important plant species can continue to evolve. The planning process is also a means for raising public awareness regarding the relationship of climate change, nature and species conservation, breeding progress and food security.

4. Material and Methods

Distribution data of A. graveolens ssp. graveolens were provided by nature conservation agencies in Germany. A list of 690 sites where the species was sighted over the past decades was compiled. Sites located in differing ecogeographic units (as defined by Reference [42]) were tagged in the project database in order to increase the chance of capturing a wide range of adaptive trait variation. Among the tagged sites those with information on the population size or on social factors such as the potential support of the genetic reserve concept by local people were chosen. Altogether 78 sites located in nine of the 16 German Federal Laender were finally visited and assessed by contractors. The presence of A. graveolens was confirmed for 64 sites in the year 2015. Based on the contractor’s report (plant number higher than 30 individuals, suitability of the site as genetic reserve) and representation of the highest possible number of differing ecogeographic units, 27 sites were chosen, and leaf samples taken in 2016. At 24 sites up to 30 individuals were sampled as planned while only 27, 23, and 21 individuals could be sampled at the site AgHE, AgDA, and AgSL, respectively. About half of the samples were taken in the coastal region of the Baltic Sea and in the centre of Germany, respectively. The geographic origin of the material and the sample codes are given in Table 1.
In this paper we denote a group of plants growing at a specific site as “occurrence” as it is not known whether any of the occurrences (generally called subpopulation) or the ensemble of all studied occurrences (generally called meta-population) fulfils the definition of the term population given by Kleinschmit et al. [65]. Instead of postulating the existence of populations we preferred to use an unbiased term which is also used by the Global Biological Information Facility (GBIF) in the sense of a sighting or sampling of a species [66].
Genomic DNA was extracted from 5 mg dried leaf material after vigorous homogenization in a mixer-mill disruptor with the innuPREP Plant DNA Kit (Analytik Jena AG, Jena, Germany) using lysis solution SLS according to the manufacturer instruction. DNA amplification was carried out in a total volume of 10 µL. The labelling of PCR products in one reaction was performed with three primers. The PCR mix contained 25 ng template DNA, 1.5 mM MgCl2, 200 µM of each dNTP, 0.05 µM of a sequence-specific forward primer with M13 tail at its 5′ end, 0.17 µM of a sequence-specific reverse primer, 0.035 µM of the universal fluorescent-labelled (dye: D2, D3, D4) M13 primer and 0.5 U Taq DNA polymerase. Therefore, a multiplexing could be performed depending on the used marker. A touch-down PCR profile (TD 58–52 °C) was generally used as described by Nachtigall et al. [67]. The PCR products were separated and detected by using a capillary electrophoresis GeXP Genetic Analysis System (GenomeLabTM, AB Sciex Germany GmbH, Darmstadt, Germany). Fragment sizes were determined and documented in a database developed by Enders [68]. The analysis of a probe was once repeated in case of the absence of a fragment. If the fragment remained absent, the allele was recorded as a null allele.
Thirty-eight published SSR markers [9,10,11] were screened to identify polymorphic markers. To this end a total of 30 plants (three populations of different geographic origin × 10 individuals) were used. Sixteen polymorphic markers were detected and used to genotype up to 30 individuals per occurrence giving a set of 12,640 data points. The markers were derived from coding DNA-sequences and should contain functional information [10]. Since none of 16 SSR markers have been mapped it is not known how well linkage groups are represented. The complete set of SSR marker data is available as open access document [69]. The SAS ProcAllele (SAS 9.4) procedure was used to calculate descriptive genetic parameters (Table 2). For each occurrence/SSR marker combination the deviation from the Hardy–Weinberg principle (HWP) was tested with the Chi2-test (p = 0.05) using SAS ProcAllele and the result either indicated as HWE (in equilibrium) or HWD (in disequilibrium). The index FIS was calculated using FSTAT 2.9.3 [44] to assess the excess of heterozygotes or homozygotes in a given occurrence.
In order to investigate the genetic structures within the research material, a Discriminant Analysis of Principal Components (DAPC) [45] was performed by using R version 3.5.1 [70] and the package adegenet version 2.1.1 [71]. The DAPC applies a multivariate method that maximises between-group and minimizes within-group components of genetic variation. A Structure [72] input file carrying genotypic information and population assignments was converted into a genind object using the read.structure function. A DAPC analysis was subsequently performed using the dapc function with 28 PCs explaining 89% of the total variance and 5 retained discriminant functions. The scatter.dapc function was employed to visualize individuals and clusters. In addition, K-means clustering was used by applying the function find.clusters to infer 27 genetic clusters from the genetic data ex nihilo without prior population information.
The genetic distance and genetic differentiation were calculated using the measure Δ [43]. The measure Δ is free of model assumptions such as the presence of large, random mating populations in Hardy–Weinberg equilibrium. The measure Δ ranges between 0 and 1. It can be used to calculate the complementary compositional differentiation within a set of several populations whereby Δj is the contribution of the jth populations to genetic differentiation. Δj is the genetic distance of the jth population to the pooled remainder (“the complement”). ΔSD quantifies the average degree to which all populations differ from their complements. The computer programme DifferInt [41] was used for the statistical analysis of the data set. Only a few null alleles were detected, and 33 individuals were excluded from the data set prior to running the computer programme DifferInt. This computer programme is applicable to a set of co-dominant marker data without null alleles. Null alleles can be included in the analysis, but then results must be interpreted as phenotypic differences [73]. A significant advantage of this measure is that it allows the analysis of patterns of genetic differentiation in a set of occurrences at different levels of genetic integration, whereby the term “genetic integration” designates the arrangement of alleles into single-locus diplotypes and genes with their specific alleles into multi-locus genotypes [40]. The differentiation measure was obtained for three levels of genetic integration, namely the gene pool level, i.e., all alleles at one or more loci and the single-locus genotypes, the mean single-locus level. These two are characterized by locus and allelic state. The highest level of genetic integration is the multi-locus level. The multi-locus genotypes (individual plants) are characterized by the allelic states at all loci [41].
The differentiation patterns can be visualized by a differentiation snail, which is a pie-like chart. A sector of the chart represents one of the occurrences. The radius of its sector equals the contribution of this occurrence to differentiation. The sectors are arranged according to the radius lengths starting with the largest radius at 12:00 h. The sector with the second largest radius is placed to the right followed by the remaining in decreasing order depending of the individual radius length. The circle in the differentiation snail (Figure 3) is equal to the weighted mean of the sector radii and marks ΔSD. The ΔSD-value is also shown on the bar next to the snail graph. Occurrences representing the complement perfectly are characterized by Δj = 0 while occurrences sharing none of the genetic types with the complement in common are indicated by Δj = 1 [41]. Two different kinds of occurrences are of special interest for genetic conservation measures. The occurrence with the lowest contribution represents the composition of its complement best while the occurrence with the highest value has a genetic composition deviating from its complement [41,43].
The experimental data were used to derive information of the likely causes of the observed genetic differentiation. To this end ten thousand new data sets were generated by random permutation of all genes (alleles) at each locus among the individuals within each occurrence using DifferInt. To test the hypothesis that forces within occurrences create gene associations in individuals at a given level of integration do this independently of the allelic type at each locus, the genes within each population were randomly permuted among the individuals within each occurrence. If the p-value is of the observed differentiation is exceptionally small, i.e., smaller than p = 0.05, the hypothesis is rejected.
The term “gene association” denotes the non-random combination of alleles to genotypes at single loci (homologous association) or the non-random combination of single-locus genotypes to multi-locus genotypes (nonhomologous association) [41]. If alleles of a gene as well as different genes with their alleles associate non-randomly, there is linkage disequilibrium (LD) which has similarities to the HWD [74]. HWD exists when the frequency of homozygotes or heterozygotes within a population is higher or lower than what would be expected if the alleles and genes associate randomly. The first permutation test shows deviations from random distribution patterns at a specific significance level. Significant deviations indicate LD and HWD.
In a second permutation analysis all individuals together with their multi-locus types were randomly permuted among the populations. To test the hypothesis that forces that associate individuals with occurrences do this independently of their genetic type at a given level of integration the individuals were randomly permuted among the occurrences. If the p-value of the observed differentiation is exceptionally small, i.e., smaller than p = 0.05, the hypothesis is rejected. Deviations from random distribution patterns indicate the existence of population structures created by migration, selection, genetic linkage, the mating system or a combination thereof.

Author Contributions

M.B. coordinated and documented the field work. M.N. supervised the laboratory work, documented and processed the raw data. U.S. applied the various statistical software packages and assisted the data processing. L.F. supervised the work, interpreted the results and drafted the paper. All persons contributed to the writing of the paper.

Funding

This research was funded by the Bundesministerium für Ernährung und Landwirtschaft (BMEL) through the Bundesanstalt für Landwirtschaft und Ernährung (BLE), Bonn, Grant Number 2814BM110.

Acknowledgments

Information on the sites and status of the A. graveolens occurrences were recorded and reported by Joachim Daumann, Heiko Grell, Dietrich Hanspach, Klaus Hemm, Alexandra Kehl, Anselm Krumbiegel, Christof Martin, Ulrich Meyer-Spethmann, Heike Ringel who also provided leaf samples for genetic analysis. Ralph Engelmann developed a software tool for free which allowed us to produce colored snail diagrams. Peter Wehling and Lorenz Bülow reviewed an advanced draft of the paper. Lorenz Bülow performed the DAPC analysis and provided further valuable help. The research work would not have been possible without the excellent laboratory work of Petra Hertling. We are also grateful for the critical comments and suggestions of four anonymous reviewers and in particular to Peter Civan.

Conflicts of Interest

The authors have no conflicts of interest to declare.

References

  1. AGMRC (Agricultural Marketing Resource Center). Available online: http://www.agmrc.org/ (accessed on 16 February 2017).
  2. EU (European Union); EuroStat. Your Key to European Statistics. Available online: http://ec.europa.eu/eurostat/web/main/home (accessed on 16 February 2017).
  3. Schultze-Motel, J. Rudolf Mansfelds Verzeichnis Landwirtschaftlich und Gärtnerisch Kultivierter Pflanzenarten, 2nd ed.; Akademie Verlag: Berlin, Germany, 1986; pp. 999–1001. ISBN 3-05-500-164-8. [Google Scholar]
  4. Solberg, S.Ø. Celery. In Leaf Medicinal Herbs: Botany, Chemistry, Postharvest Technology and Uses; Ambrose, D.C.P., Manickavasagan, A., Naik, R., Eds.; CAP International: Wallingford, UK, 2016; pp. 74–84. ISBN 9781780645599. [Google Scholar]
  5. Barbour, J.D. Vegetable Crops. Search for Arthropod Resistance in Genetic Resources. In Global Plant Genetic Resources for Insect-Resistant Crops, 1st ed.; Clement, S.L., Quisenberry, S.S., Eds.; CRC Press: Boca Raton, FL, USA, 1998; pp. 171–189. ISBN 0-84932695-8. [Google Scholar]
  6. Melchinger, A.E.; Lübberstedt, T. Abschlussbericht zum GFP-Forschungsvorhaben ghg 1/98 (97 HS 044). Sortendifferenzierung und Verwandtschaftsuntersuchungen bei Feldsalat (Valerianella locusta L.), Radies (Raphanus sativus L.) und Knollensellerie (Apium graveolens L.) mit Hilfe PCR-Gestützter Genetischer Marker; Final report of the GFP research project ghg 1/98 (97 HS 044). Variety differentiation and investigation of the relationships in corn salad (Valerianella locusta L.), radish (Raphanus sativus L.) and celeriac (Apium graveolens L.) using PCR-based genetic marker; Universität Hohenheim, Institut für Pflanzenzüchtung, Saatgutforschung und Populationsgenetik, Lehrstuhl Angewandte Genetik und Pflanzenzüchtung: Stuttgart, Germany, 2003. [Google Scholar]
  7. Torricelli, R.; Tiranti, B.; Spataro, G.; Castellini, G.; Albertini, E.; Falcinelli, M.; Negri, V. Differentiation and structure of an Italian landrace of celery (Apium graveolens L.): Inferences for on farm conservation. Genet. Resour. Crop Evol. 2013, 60, 995–1006. [Google Scholar] [CrossRef]
  8. Wang, S.; Yang, W.; Shen, H. Genetic diversity in Apium graveolens and related species revealed by SRAP and SSR markers. Sci. Hortic. 2011, 129, 1–8. [Google Scholar] [CrossRef]
  9. Acquadro, A.; Magurno, F.; Portis, E.; Lanteri, S. dbEST-derived microsatellite markers in celery (Apium graveolens L. var. dulce). Mol. Ecol. Notes 2006, 6, 1080–1082. [Google Scholar] [CrossRef]
  10. Fu, N.; Wang, Q.; Shen, H.-L. De Novo Assembly, Gene Annotation and Marker Development Using Illumina Paired-End Transcriptome Sequences in Celery (Apium graveolens L.). PLoS ONE 2013, 8, e57686. [Google Scholar] [CrossRef] [PubMed]
  11. Fu, N.; Wang, P.-Y.; Liu, X.-D.; Shen, H.-L. Use of EST-SSR Markers for Evaluating Genetic Diversity and Fingerprinting Celery (Apium graveolens L.) Cultivars. Molecules 2014, 19, 1939–1955. [Google Scholar] [CrossRef] [PubMed]
  12. EURISCO. The European Search Catalogue for Plant Genetic Resources. Available online: http://eurisco.ecpgr.org (accessed on 8 May 2018).
  13. Spoor, W.; Simmonds, N.W. Base-broadening: Introgression and incorporation. In Broadening the Genetic Base of Crop Production; Cooper, H.D., Spillane, C., Hodgkin, T., Eds.; CAP International: Wallingford, UK, 2001; pp. 71–79. ISBN 0-85199-411-3. [Google Scholar]
  14. Breiteneder, H.; Hoffmann-Sommergruber, K.; O’Riordain, G.; Susani, M.; Ahorn, H.; Ebner, C.; Kraft, D.; Scheiner, O. Molecular Characterization of Api g 1, the Major Allergen of Celery (Apium graveolens), and its Immunological and Structural Relationships to a Group of 17kDa Tree Pollen Allergens. Eur. J. Biochem. 1995, 233, 484–489. [Google Scholar] [CrossRef] [PubMed]
  15. Gadermaier, G.; Egger, M.; Girbl, T.; Erler, A.; Harrer, A.; Vejvar, E.; Liso, M.; Richter, K.; Zuidmeer, L.; Mari, A.; et al. Molecular characterization of Api g 2, a novel allergenic member of the lipid-transfer protein 1 family from celery stalks. Mol. Nutr. Food Res. 2011, 55, 568–577. [Google Scholar] [CrossRef] [PubMed]
  16. Vejvar, E.; Himly, M.; Briza, P.; Eichhorn, S.; Ebner, C.; Hemmer, W.; Ferreira, F.; Gadermaier, G. Allergenic relevance of nonspecific lipid transfer proteins 2: Identification and characterization of Api g 6 from celery tuber as representative of a novel IgE-binding protein family. Mol. Nutr. Food Res. 2013, 57, 2061–2070. [Google Scholar] [CrossRef] [PubMed]
  17. Ochoa, O.; Quiros, C.F. Apium wild species: Novel sources for resistance to late blight in celery. Plant Breed. 1989, 102, 317–321. [Google Scholar] [CrossRef]
  18. Diawara, M.M.; Trumble, J.; Quiros, C.F.; Millar, J.G. Resistance to Spodoptera exigua in Apium prostratum. Entomol. Exp. Appl. 1992, 64, 125–133. [Google Scholar] [CrossRef]
  19. Trumble, J.T.; Dercks, W.; Quiros, C.F.; Beier, R.C. Host plant resistance and linear furanocoumarin content of Apium accessions. J. Econ. Entomol. 1990, 88, 519–525. [Google Scholar] [CrossRef]
  20. Trumble, J.T.; Diawara, M.M.; Quiros, C.F. Breeding resistance in Apium graveolens to Liriomyza trifolii: Antibiosis and linear furanocoumarin content. Acta Hortic. 2000, 513, 29–38. [Google Scholar] [CrossRef]
  21. Constance, L.; Chuang, T.-L.; Bell, C.R. Chromosome numbers in Umbelliferae. V. Am. J. Bot. 1976, 63, 608–625. [Google Scholar] [CrossRef]
  22. IUCN (International Union for Conservation of Nature and Natural Resources). The IUCN Red List of Threatened Species. Available online: http://www.iucnredlist.org/details/164203/0 (accessed on 8 May 2018).
  23. Frese, L.; Bönisch, M.; Herden, T.; Zander, M.; Friesen, N. In-situ-Erhaltung von Wildselleriearten. Ein Beispiel für genetische Ressourcen von Wildlebenden Verwandten von Kulturarten (WVK-Arten). Nat. Prot. Landsc. Plan. 2018, 50, 155–163. [Google Scholar]
  24. Berg, C.; Dengler, J.; Abdank, A.; Isermann, M. Die Pflanzengesellschaften Mecklenburg-Vorpommerns und ihre Gefährdung; Textband; Landesamt für Umwelt, Naturschutz und Geologie Mecklenburg-Vorpommern, Weißdorn-Verlag: Jena, Germany, 2004; ISBN 3-936055-03-3. [Google Scholar]
  25. Preising, E.; Vahle, H.C.; Brandes, D.; Hofmeister, H.; Tüxen, J.; Weber, H.E. Die Pflanzengesellschaften Niedersachsens—Bestandsentwicklung, Gefährdung und Schutzprobleme Salzpflanzengesellschaften der Meeresküste und des Binnenlandes; Naturschutz und Landschaftspflege in Niedersachsen; Niedersächsische Landesverwaltungsamt—Fachbehörde für Naturschutz: Hannover, Germany, 1990; ISBN 392232150X. [Google Scholar]
  26. Bettinger, A. Die Binnensalzstellen in Lothringen, im Saarland und in Rheinland-Pfalz. In Binnensalzstellen Mitteleuropas. Internationale Tagung, Bad Frankenhausen, Germany, 8–10 September 2005; Thüringer Ministerium für Landwirtschaft, Naturschutz und Umwelt: Erfurt, Germany, 2007; pp. 143–148. [Google Scholar]
  27. Böttcher, H. Das EU-Life-Natur-Projekt, Erhaltung und Entwicklung der Binnensalzstellen Nordthüringens (2003–2008). In Binnensalzstellen Mitteleuropas. Internationale Tagung, Bad Frankenhausen, Germany, 8–10. September 2005; Thüringer Ministerium für Landwirtschaft, Naturschutz und Umwelt: Erfurt, Germany, 2007; pp. 54–62. [Google Scholar]
  28. Herrmann, A. Binnensalzstellen in Brandenburg—Verbreitung und Zustand salzbeeinflusster Lebensräume. In Binnensalzstellen Mitteleuropas. Internationale Tagung, Bad Frankenhausen, Germany, 8–10. September 2005; Thüringer Ministerium für Landwirtschaft, Naturschutz und Umwelt: Erfurt, Germany, 2007; pp. 135–142. [Google Scholar]
  29. Kell, S. Farmer’s Pride. Conserving Plant Diversity for Future Generations. Available online: http://www.farmerspride.eu/ (accessed on 8 May 2018).
  30. Maxted, N.; Avagyan, A.; Frese, L.; Iriondo, J.M.; Magos Brehm, J.; Singer, A.; Kell, S.P. ECPGR Concept for in situ Conservation of Crop Wild Relatives in Europe; European Cooperative Programme for Plant Genetic Resources: Rome, Italy, 2015. [Google Scholar]
  31. Maxted, N.; Hawkes, J.G.; Ford-Lloyd, B.V.; Williams, J.T. A practical model for in situ genetic conservation. In Plant Genetic Conservation: The in situ Approach; Maxted, N., Ford-Lloyd, B.V., Hawkes, J.G., Eds.; Kluwer Academic Publishers: Dordrecht, The Netherlands, 1997; pp. 339–364. ISBN 0-412-63400-7. [Google Scholar]
  32. Iriondo, J.M.; Maxted, N.; Kell, S.; Ford-Lloyd, B.V.; Lara-Romero, C.; Labokas, J.; Magos Brehm, J. Quality Standards for Genetic Reserve Conservation of Crop Wild Relatives. In Agrobiodiversity Conserving: Securing the Diversity of Crop Wild Relatives and Landraces; Maxted, N., Dulloo, M.E., Ford-Lloyd, B.V., Frese, L., Iriondo, J.M., Pinheiro de Carvalho, M.Â.A., Eds.; CAB International: Wallingford, UK, 2012; pp. 72–77. [Google Scholar]
  33. Kell, S.; Maxted, N.; Frese, L.; Iriondo, J.M. In situ conservation of crop wild relatives: A strategy for identifying priority genetic reserves sites. In Agrobiodiversity Conservation: Securing the Diversity of Crop Wild Relatives and Landraces; Maxted, N., Dulloo, M.E., Ford-Lloyd, B.V., Frese, L., Iriondo, J.M., Pinheiro de Carvalho, M.Â.A., Eds.; CAB International: Wallingford, UK, 2012; pp. 7–19. [Google Scholar]
  34. Manel, S.; Schwartz, M.K.; Luikart, G.; Taberlet, P. Landscape genetics: Combining landscape ecology and population genetics. Trends Ecol. Evol. 2003, 18, 189–197. [Google Scholar] [CrossRef]
  35. Hodel, R.G.J.; Segovia-Salcedo, M.C.; Landis, J.B.; Crowl, A.A.; Sun, M. The report of my death was an exaggeration: A review for researchers using microsatellites in the 21st century. Appl. Plant Sci. 2016, 4. [Google Scholar] [CrossRef] [PubMed]
  36. Arus, P.; Orton, T.J. Inheritance patterns and linkage relationships of eight genes of celery. J. Hered. 1984, 75, 11–14. [Google Scholar] [CrossRef]
  37. Huestis, G.M.; McGrath, J.M.; Quiros, C.F. Development of genetic markers in celery based on restriction fragment length polymorphisms. Theor. Appl. Genet. 1993, 85, 889–896. [Google Scholar] [CrossRef] [PubMed]
  38. Feng, K.; Hou, X.-L.; Li, M.-Y.; Jiang, Q.; Xu, Z.-S.; Liu, J.-X.; Xiong, A.-S. CeleryDB: A genomic database for celery. Database 2018, 1–8. [Google Scholar] [CrossRef] [PubMed]
  39. Li, M.Y.; Wang, F.; Jiang, Q.; Ma, J.; Xiong, A.-S. Identification of SSRs and differentially expressed genes in two cultivars of celery (Apium graveolens L.) by deep transcriptome sequencing. Hortic. Res. 2014, 1. [Google Scholar] [CrossRef] [PubMed]
  40. Gillet, E.M.; Gregorius, H.-R. Measuring differentiation among populations at different levels of genetic integration. BMC Genet. 2008, 9, 60. [Google Scholar] [CrossRef] [PubMed]
  41. Gillet, E.M. DifferInt: Compositional differentiation among populations at three levels of genetic integration. Mol. Ecol. Resour. 2013, 13, 953–964. [Google Scholar] [CrossRef] [PubMed]
  42. Meynen, E.; Schmithüsen, J. Handbuch der Naturräumlichen Gliederung Deutschlands/Unter Mitwirkung des Zentralausschusses für Deutsche Landeskunde, 1953–1962; Bundesanstalt für Landeskunde und Raumforschung: Bad Godesberg, Germany, 1962. [Google Scholar]
  43. Gregorius, H.-R.; Gillet, E.M.; Ziehe, M. Measuring Differences of Trait Distributions between Populations. Biom. J. 2003, 45, 959–973. [Google Scholar] [CrossRef]
  44. Goudet, J. FSTAT (Version 1.2): A computer program to calculate F-statistics. J. Hered. 1995, 86, 485–486. [Google Scholar] [CrossRef]
  45. Jombart, T.; Devillard, S.; Balloux, F. Discriminant analysis of principal components: A new method for the analysis of genetically structured populations. BMC Genet. 2010, 11, 94. [Google Scholar] [CrossRef] [PubMed]
  46. Perrier, X.; Jacquemound-Collet, J.P. DARwin5, Version 5.0.158 Software. Available online: http://darwin.cirad.fr/darwin (accessed on 10 October 2010).
  47. Fievet, V.; Touzet, P.; Arnaud, J.-F.; Cuguen, J. Spatial analysis of nuclear and cytoplasmic DNA diversity in wild sea beet (Beta vulgaris ssp. maritima) populations: Do marine currents shape the genetic structure? Mol. Ecol. 2007, 16, 1847–1864. [Google Scholar] [PubMed]
  48. Petit, R.J.; El Mousadik, A.; Pons, O. Identifying populations for conservation on the basis of genetic markers. Conserv. Biol. 1998, 12, 844–855. [Google Scholar] [CrossRef]
  49. Zander, M.; Albrecht Daniel Thaer-Institut für Agrar- und Gartenbauwissenschaften, Urbane Ökophysiologie der Pflanzen, Humboldt-Universität zu Berlin, Berlin, Germany. Personal communication, 2018.
  50. Piorr, H.-P. Entwicklung der pflanzenbaulichen Flächennutzung in den Agrarlandschaften Deutschlands. In Biologische Vielfalt mit der Land- und Forstwirtschaft? Welling, P., Ed.; Reihe A: Angewandte Wissenschaft; Schriftenreihe des Bundesministeriums für Verbraucherschutz, Ernährung und Landwirtschaft: Bonn, Germany, 2002; pp. 127–135. [Google Scholar]
  51. Klotz, S.; Kühn, I.; Durka, W. BIOLFLOR—Eine Datenbank zu biologisch-ökologischen Merkmalen der Gefäßpflanzen in Deutschland. In Schriftenreihe für Vegetationskunde 38; Bundesamt für Naturschutz: Bad Godesberg, Germany, 2002. [Google Scholar]
  52. BMVEL (Bundesministerium für Verbraucherschutz, Ernährung und Landwirtschaft). Tiergenetische Ressourcen; Nationales Fachprogramm: Bonn, Germany, 2004. [Google Scholar]
  53. Wehling, P.; Scholz, M.; Ruge-Wehling, B.; Hackauf, B.; Frese, L. Anpassung landwirtschaftlicher Kulturarten an den Klimawandel—Optionen aus Sicht der Züchtungsforschung. J. Cultiv. Plants 2017, 69, 47–50. [Google Scholar] [CrossRef]
  54. Bilz, M.; Kell, S.; Maxted, N.; Lansdown, R.V. European Red List of Vascular Plants; Office of the European Union: Luxembourg, 2011. [Google Scholar]
  55. EU (European Union). Halbzeitbewertung der EU-Biodiversitätsstrategie. Natura 2000, 2016, 39. [Google Scholar]
  56. Parmesan, C.; Hanley, M.E. Plants and climate change: Complexities and surprises. Ann. Bot. 2015, 116, 849–864. [Google Scholar] [CrossRef] [PubMed]
  57. Araujo, M.B.; Cabeza, M.; Thuiller, W.; Hannah, L.; Williams, P.H. Would climate change drive species out of reserves? An assessment of existing reserve-selection methods. Glob. Chang. Biol. 2004, 10, 1618–1626. [Google Scholar] [CrossRef]
  58. Castaneda-Alvarez, N.P.; Khoury, C.K.; Achicanoy, H.A.; Bernau, V.; Dempewolf, H.; Eastwood, R.J.; Guarino, L.; Harker, R.H.; Jarvis, A.; Maxted, N.; et al. Global conservation priorities for crop wild relatives. Nat. Plants 2016, 2. [Google Scholar] [CrossRef] [PubMed]
  59. CBD (Convention on Biological Diversity). Convention on Biological Diversity; Convention on Biological Diversity: Montreal, QC, Canada, 1992. [Google Scholar]
  60. FAO (Food and Agriculture Organization). International Treaty on Plant Genetic Resources for Food and Agriculture. Available online: http://www.planttreaty.org/ (accessed on 16 February 2017).
  61. ECPGR (European Cooperative Programme for Plant Genetic Resources). The ECPGR Concept for in situ Conservation of Crop Wild Relatives in Europe. Available online: http://www.ecpgr.cgiar.org/working-groups/wild-species-conservation/ (accessed on 20 June 2017).
  62. CWRnl. Crop Wild Relatives (CWR) in the Netherlands. Available online: https://www.cwrnl.nl/nl/CWRnl/CWRspergewas/Apium-graveolens-L.htm (accessed on 8 May 2018).
  63. Aguirre-Gutiérrez, J.; van Treuren, R.; Hoekstra, R.; van Hintum, T.J.L. Crop wild relatives range shifts and conservation in Europe under climate change. Divers. Distrib. 2017, 23. [Google Scholar] [CrossRef]
  64. Hoekstra, R.; Centre for Genetic Resources, Droevendaalsesteeg 1, Building 107, 6708 PB Wageningen, The Netherlands. Personal communication, 2017.
  65. Kleinschmit, J.R.G.; Kownatzki, D.; Gregorius, H.-R. Adaptational characteristics of autochthonous populations—Consequences for provenance delineation. For. Ecol. Manag. 2004, 197, 213–224. [Google Scholar] [CrossRef]
  66. GBIF (Global Biological Information Facility). Available online: https://www.gbif.org/species/search (accessed on 8 August 2018).
  67. Nachtigall, N.; Bülow, L.; Schubert, J.; Frese, L. Development of SSR Markers for the Genus Patellifolia (Chenopodiaceae). Appl. Plant Sci. 2016, 4, 8. [Google Scholar] [CrossRef] [PubMed]
  68. Enders, M. Entwicklung und Anwendung Molekularer und Informatorischer Werkzeuge zum Genetischen Monitoring bei Wildrüben; Diplomarbeit im Fach Bioinformatik, Martin-Luther-Universität Halle-Wittenberg, Naturwissenschaftliche Fakultät III, Institut für Informatik: Halle, Germany, 2010. [Google Scholar]
  69. Nachtigall, M.; Frese, L.; Bönisch, M. Microsatellite Marker Data of Apium graveolens L. ssp. graveolens; Open Agrar Repositorium: Quedlinburg, Germany, 2018. [Google Scholar]
  70. R Core Team. R: A Language and Environment for Statistical Computing, version 3.5.1; R Foundation for Statistical Computing: Vienna, Austria, 2013; Available online: https://www.R-project.org (accessed on 8 August 2018).
  71. Jombart, T. Adegenet: A R package for the multivariate analysis of genetic markers. Bioinformatics 2008, 24, 1403–1405. [Google Scholar] [CrossRef] [PubMed]
  72. Pritchard, J.K.; Stephens, M.; Donnelly, P. Inference of population structure using multilocus genotype data. Genetics 2000, 155, 945–959. [Google Scholar] [PubMed]
  73. Gillet, E.M. DifferInt Compositional Differentiation among Populations at Three Levels of Genetic Integration. User Manual. Available online: http://www.uni-goettingen.de/forstgenetik/differint (accessed on 17 November 2016).
  74. Slatkin, M. Linkage disequilibrium—Understanding the evolutionary past and mapping the medical future. Nat. Rev. Genet. 2008, 9, 477–485. [Google Scholar] [CrossRef] [PubMed]
Figure 1. The scatter plot of the Discriminant Analysis of Principal Components (DAPC) shows the genetic structure within the collection of 27 occurrences of A. graveolens ssp. graveolens. Colors refer to the ecogeographic unit where the occurrence was sampled. Agriculture 08 00129 i001 = Weser-Aller-Flachland, Agriculture 08 00129 i002 = Nordmecklenburgisches Flachland, Agriculture 08 00129 i003 = Schleswig-Holsteinisches Hügelland, Agriculture 08 00129 i004 = Osthessisches Bergland, Agriculture 08 00129 i005 = Mecklenburgisch-Vorpommersches Küstengebiet, Agriculture 08 00129 i006 = Mecklenburgische Seenplatte, Agriculture 08 00129 i007 = Mittelbrandenburgische Platten und Niederungen, Agriculture 08 00129 i008 = Gäuplatten im Neckar- und Tauberland, Agriculture 08 00129 i009 = Weser-Leinebergland, Agriculture 08 00129 i010 = Mitteldeutsches Schwarzerdegebiet, Agriculture 08 00129 i011 = Elbtalniederung, Agriculture 08 00129 i012 = Nördliches Harzvorland, Agriculture 08 00129 i013 = Westfälische Tieflandsbucht, Agriculture 08 00129 i014 = Thüringer Becken und Randplatten.
Agriculture 08 00129 g001
Figure 2. Map showing the locations of the 27 occurrences. A black triangle marks the 15 Most Appropriate Wild Populations (MAWP) while a black dot marks the remaining 12 occurrences. The location names are given in Table 1.
Agriculture 08 00129 g002
Figure 3. Snail diagram showing the differentiation between 27 occurrences of A. graveolens at the gene pool level. A sector represents one of the occurrences. The side length of a sector quantifies the contribution of each occurrence to differentiation. The grey circle marks the mean differentiation and the average of all 27 radii length. Colors refer to the ecogeographic unit where the occurrence was sampled. Identical colors were used in Figure 1.
Agriculture 08 00129 g003
Figure 4. The flow diagram illustrates the procedure of establishing species-specific genetic networks in Germany.
Agriculture 08 00129 g004
Table 1. Geographic origin of 27 occurrences of Apium graveolens sampled in Germany. The laboratory and population identifier as well as the number of plants analyzed with 16 SSR markers is presented. The term ecogeographic unit relates to the German term “Naturraum 3. Grades” [42]. The laboratory identifiers in bold letter type mark Most Appropriate Wild Populations (MAWP). Arguments for and against the MAWP nomination are given in the last column.
LabIDPopulation IDLocationEcogeographic UnitNo. of Analyzed IndividualsArguments For or Against the Nomination as Candidate MAWPs
AgBWBW-UB-20150728-0934Baden-Württemberg: Ubstadt-Weiher (samples from ex situ cultivation in Botanical Garden of KIT and Tübingen)Gäuplatten im Neckar- und Tauberland30The only representative of the ecogeographic unit, most southern occurrence in Germany, site management exists already
AgSEHLSH-SEHL-20150824-0900, -1000Schleswig-Holstein: SehlendorfSchleswig-Holsteinisches Hügelland30Adjustment of management would be required
AgEICHSH-EICH-20150824-1000, -1010, -1100, -1110, -1120, -1200Schleswig-Holstein: EichholzniederungSchleswig-Holsteinisches Hügelland30Large site and population size, site management exists already
AgKREMSH-KREM-20150902-1315, -1500, -1510, -1520Schleswig-Holstein: NeustadtSchleswig-Holsteinisches Hügelland30Within the same ecogeographic unit AgEICH matches genetic reserves quality criteria better than AgKREM
AgFEHSH-FEH-20150902-1000, -1010, -1020Schleswig-Holstein: FehmarnSchleswig-Holsteinisches Hügelland30Within the same ecogeographic unit AgEICH matches genetic reserves quality criteria better than AgFEH
AgOEHSH-OEH-20150826-1200, 1300, -1320, -1330, -1340, -1350, -1400Schleswig-Holstein: SchleimündungSchleswig-Holsteinisches Hügelland30Within the same ecogeographic unit AgEICH matches genetic reserves quality criteria better than AgOEH
AgBBGBbg-JÜ-20150727-1739Brandenburg: GröbenMittelbrandenburgische Platten und Niederungen30The only representative of the ecogeographic unit, site management exists already
AgFRIST-FRIED-20150621-1437Sachsen-Anhalt: FriedeburgMitteldeutsches Schwarzerdegebiet30Within the same ecogeographic unit AgHEC matches genetic reserves quality criteria better than AgFRI
AgWAST-WALBE-20150720-1304Sachsen-Anhalt: WalbeckWeser-Aller-Flachland30The only representative of the natural region, highest deviation in genetic composition from the complement
AgHECST-HECBE-20150709-0957, ST-HECSA-20150709-0854Sachsen-Anhalt: HecklingenMitteldeutsches Schwarzerdegebiet30Represents the genetic composition of the complement best, site management exists already
AgZIEST-ZIELI-20150709-1223Sachsen-Anhalt: ZielitzElbtalniederung30The only representative of the ecogeographic unit
AgSUEST-SÜLLW-20150714-1054, ST-SÜLNO-20150714-1003Sachen-Anhalt: SülldorfMitteldeutsches Schwarzerdegebiet30Large site and population size, site management exists already
AgROSST-ROSSL-20150702-1029Thüringen/Sachsen-Anhalt: RoßlebenThüringer Becken und Randplatten30The only representative of the ecogeographic unit
AgBENST-BENWÜ-20150702-0828Sachsen-Anhalt: BennstedtMitteldeutsches Schwarzerdegebiet30Within the same ecogeographic unit AgHEC matches genetic reserves quality criteria better than AgBEN
AgWUMV-WU-20150824-1100Mecklenburg-Vorpommern: Halbinsel WustrowMecklenburgisch-Vorpommersches Küstengebiet30Large site and population, best representative of the ecogeographic unit
AgDAMV-DA-20150901-0900Mecklenburg-Vorpommern: DabitzMecklenburgisch-Vorpommersches Küstengebiet23Critically small population size. Within the same ecogeographic unit AgDZ matches genetic reserves quality criteria better than AgDA
AgDZMV-DSZ-20150903-1430Mecklenburg-Vorpommern: DassowMecklenburgische Seenplatte30Best representative of the ecogeographic unit
AgUWMV-UW-20150902-1000Mecklenburg-Vorpommern: RostockMecklenburgisch-Vorpommersches Küstengebiet30Within the same ecogeographic unit AgDZ matches genetic reserves quality criteria better than AgUW
AgHEUMV-HEU-20150921-1600Mecklenburg-Vorpommern: Bodden bei RügenMecklenburgisch-Vorpommersches Küstengebiet30Access to population is complicated. Within the same ecogeographic unit AgDZ matches genetic reserves quality criteria better than AgHEU
AgGMV-G-20150831-1200Mecklenburg-Vorpommern: GristowNordostmecklenburgisches Flachland30The only representative of the ecogeographic unit
AgHIDMV-HiABs-20150912-1400Mecklenburg-Vorpommern: HiddenseeMecklenburgisch-Vorpommersches Küstengebiet30Within the same ecogeographic unit AgDZ matches genetic reserves quality criteria better than AgHID
AgSLMV-Sü-20150902-1540Mecklenburg-Vorpommern: SültenMecklenburgische Seenplatte20Critically small population size. Within the same ecogeographic unit AgDZ matches genetic reserves quality criteria better than AgSL
AgSKNRW-SK-20180818-1530Nordrhein-Westfalen: SalzkottenWestfälische Tieflandsbucht30The only representative of the ecogeographic unit, site management exists already
AgGOENI-GÖ-20150825-1000Niedersachsen: Nörten-HardenbergWeser-Leinebergland30Within the same ecogeographic unit AgHI matches genetic reserves quality criteria better than AgGOE
AgHINI-HI-20150824-1600Niedersachsen: HildesheimWeser-Leinebergland30Best representative of the ecogeographic unit
AgJXNI-JX-20150724-1100Niedersachsen: JerxheimNördliches Harzvorland30The only representative of the ecogeographic unit
AgHESHE-BS-20150925-1020Hessen: Bad SalzhausenOsthessisches Bergland27The only representative of the ecogeographic unit, site management exists already
Table 2. The marker name, the total number of analyzed plants, the number of distinct alleles, the polymorphic information content (PIC), observed (Ho) and expected heterozygosity (He) is presented.
LocusNumber of IndividualsNumber of AllelesPolymorphic Information Content (PIC)Observed Heterozygosity (Ho)Expected Heterozygosity (He)
ECMS01 (1)79070.7330.2910.769
ECMS1179090.7740.5230.801
ECMS1379080.1930.0660.203
ECMS0279080.4340.1280.502
ECMS2379080.3840.1680.442
ECMS39790130.8030.1670.826
ECMS06790180.7740.2050.799
ECMS0979080.4570.1010.556
Fn09 (2)79040.1090.0570.112
Fn10079060.0420.0050.042
Fn6279080.1630.0100.169
QC28 (3)79060.7340.1150.772
QC43790180.6410.0750.667
QC5379050.2860.0440.310
QC7579070.4320.9630.538
QC8679050.3640.0990.399
Detailed marker information was published for the (1) ECMS, (2) Fn series and for the (3) QC series by References [9,10,11].
Table 3. FIS-values calculated over 16 markers for each of the 27 occurrences. The LabID is presented in bold letter type.
LabIDAgBBGAgBENAgBWAgDAAgDZAgEICHAgFEH
FIS0.043−0.1450.1510.430.4360.377−0.016
LabIDAgFRIAgGAgGOEAgHECAgHESAgHEUAgHI
FIS0.558−0.1670.3630.2310.441−0.0060.099
LabIDAgHIDAgJXAgKREMAgOEHAgROSAgSEHLAgSK
FIS0.390.1740.3380.4440.2650.5080.054
LabIDAgSLAgSUEAgUWAgWAAgWUAgZIE
FIS0.1370.3530.348−0.080.490.14
Table 4. Permutation analysis of alleles over individuals within occurrences and of all individual genotypes among occurrences. The values are based on 10,000 permutations for all 16 loci. The observed ΔSD value is shown for the three integration levels. The calculated minimum and maximum ΔSD values, the 95% confidence interval as well as the permutation (p) values are shown. The symbols **-> (upper part of the distribution) and **<- (lower part of the distribution) indicate that fewer than 1% and more than 99% of the permutations yielded ΔSD values that are significantly equal or greater than the observed distance. ** = p ≤ 0.01.
PermutationsObserved ΔSD ValuesMin0.95 Confidence IntervalMaxp Value
Alleles over individuals within occurrences
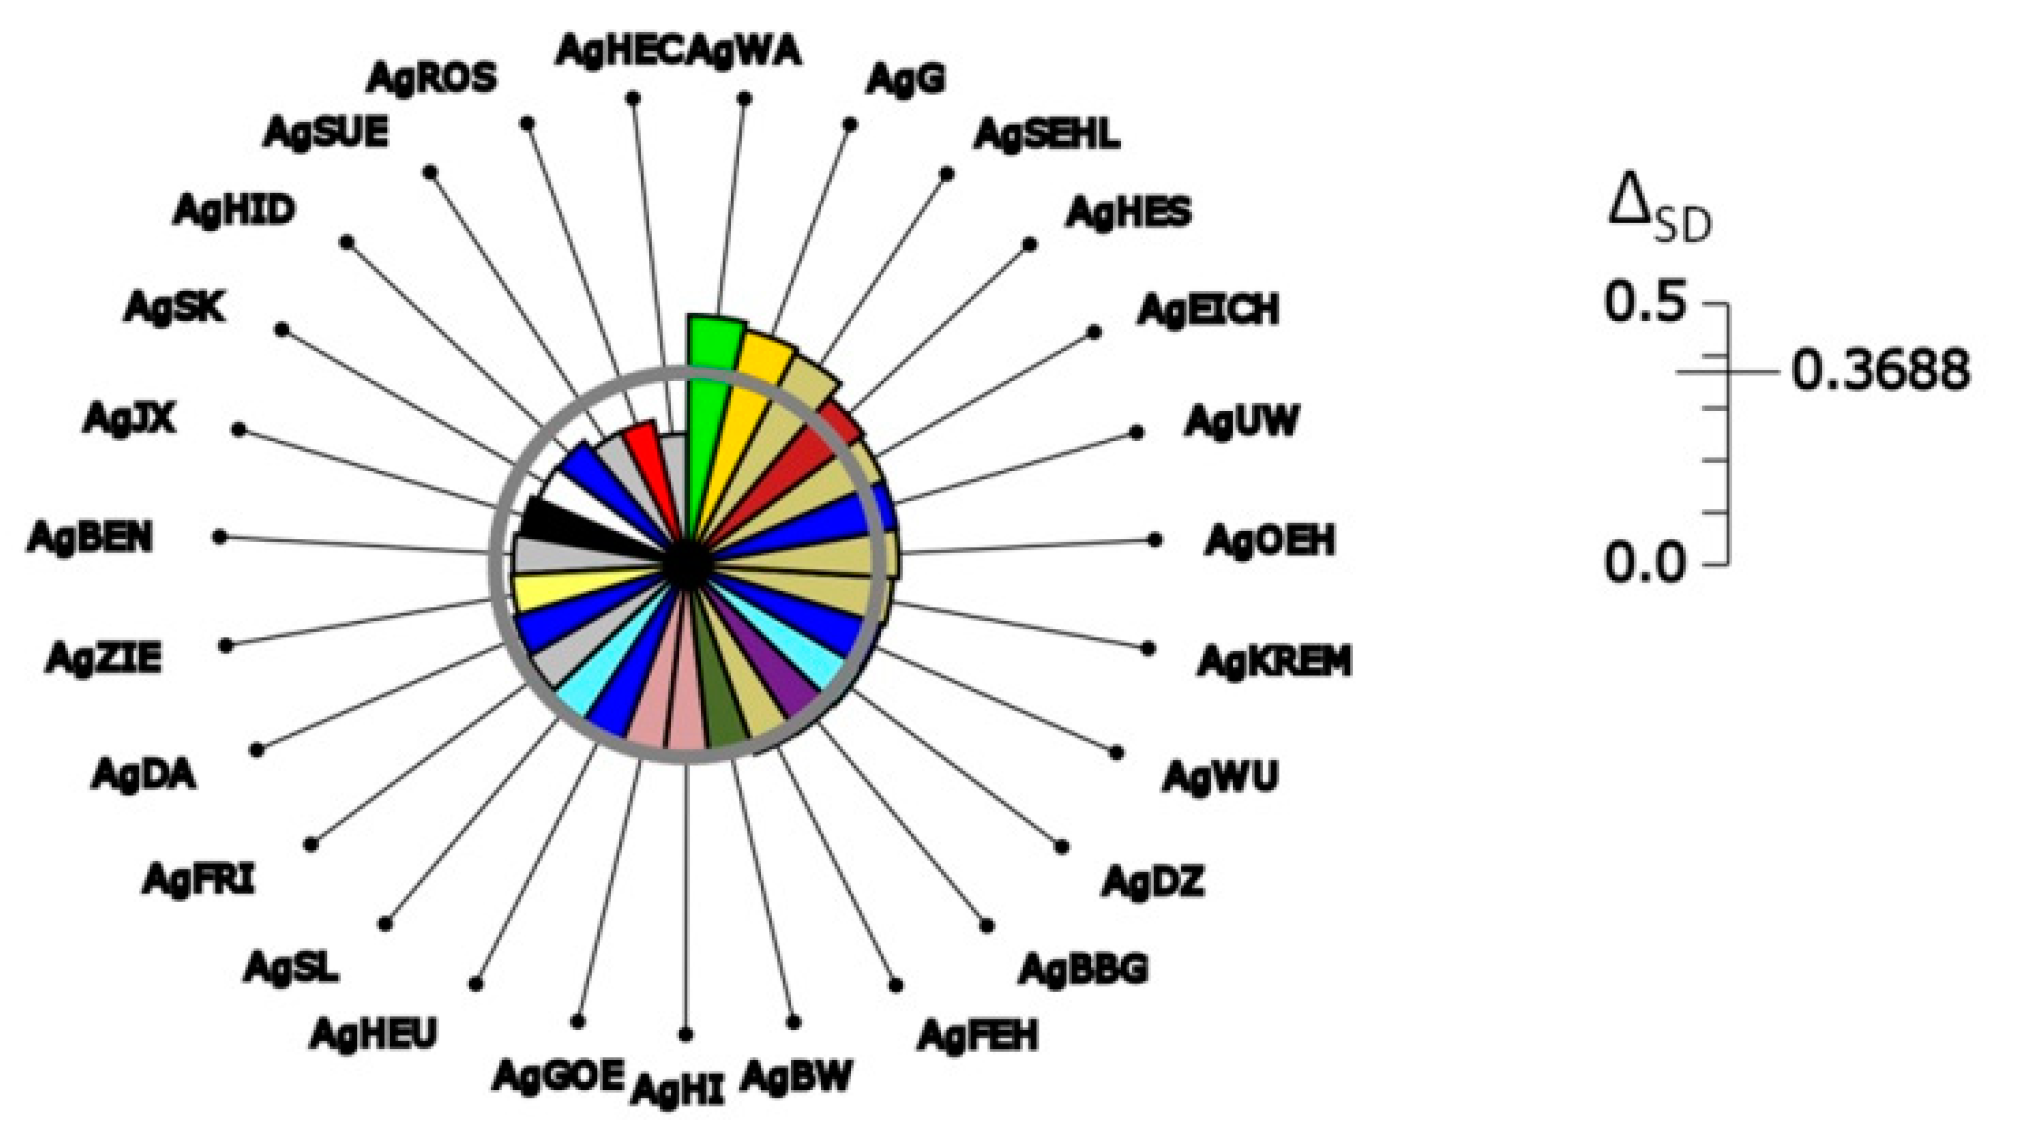
Gene pool level0.3688 not affected
Mean single-locus genotypes0.37710.37820.3790; 0.38100.38211.0000 **<-
Multi-locus genotypes0.40010.40600.4066; 0.40800.40851.0000 **<-
All individual genotypes among occurrences
Gene pool level0.36880.09600.1001; 0.11020.11630.0000 **->
Mean single-locus genotypes0.37710.10920.1129; 0.12270.12860.0000 **->
Multi-locus genotypes0.40010.22520.2284; 0.23590.24150.0000 **->

