1. Introduction
The Food and Agriculture Organization [
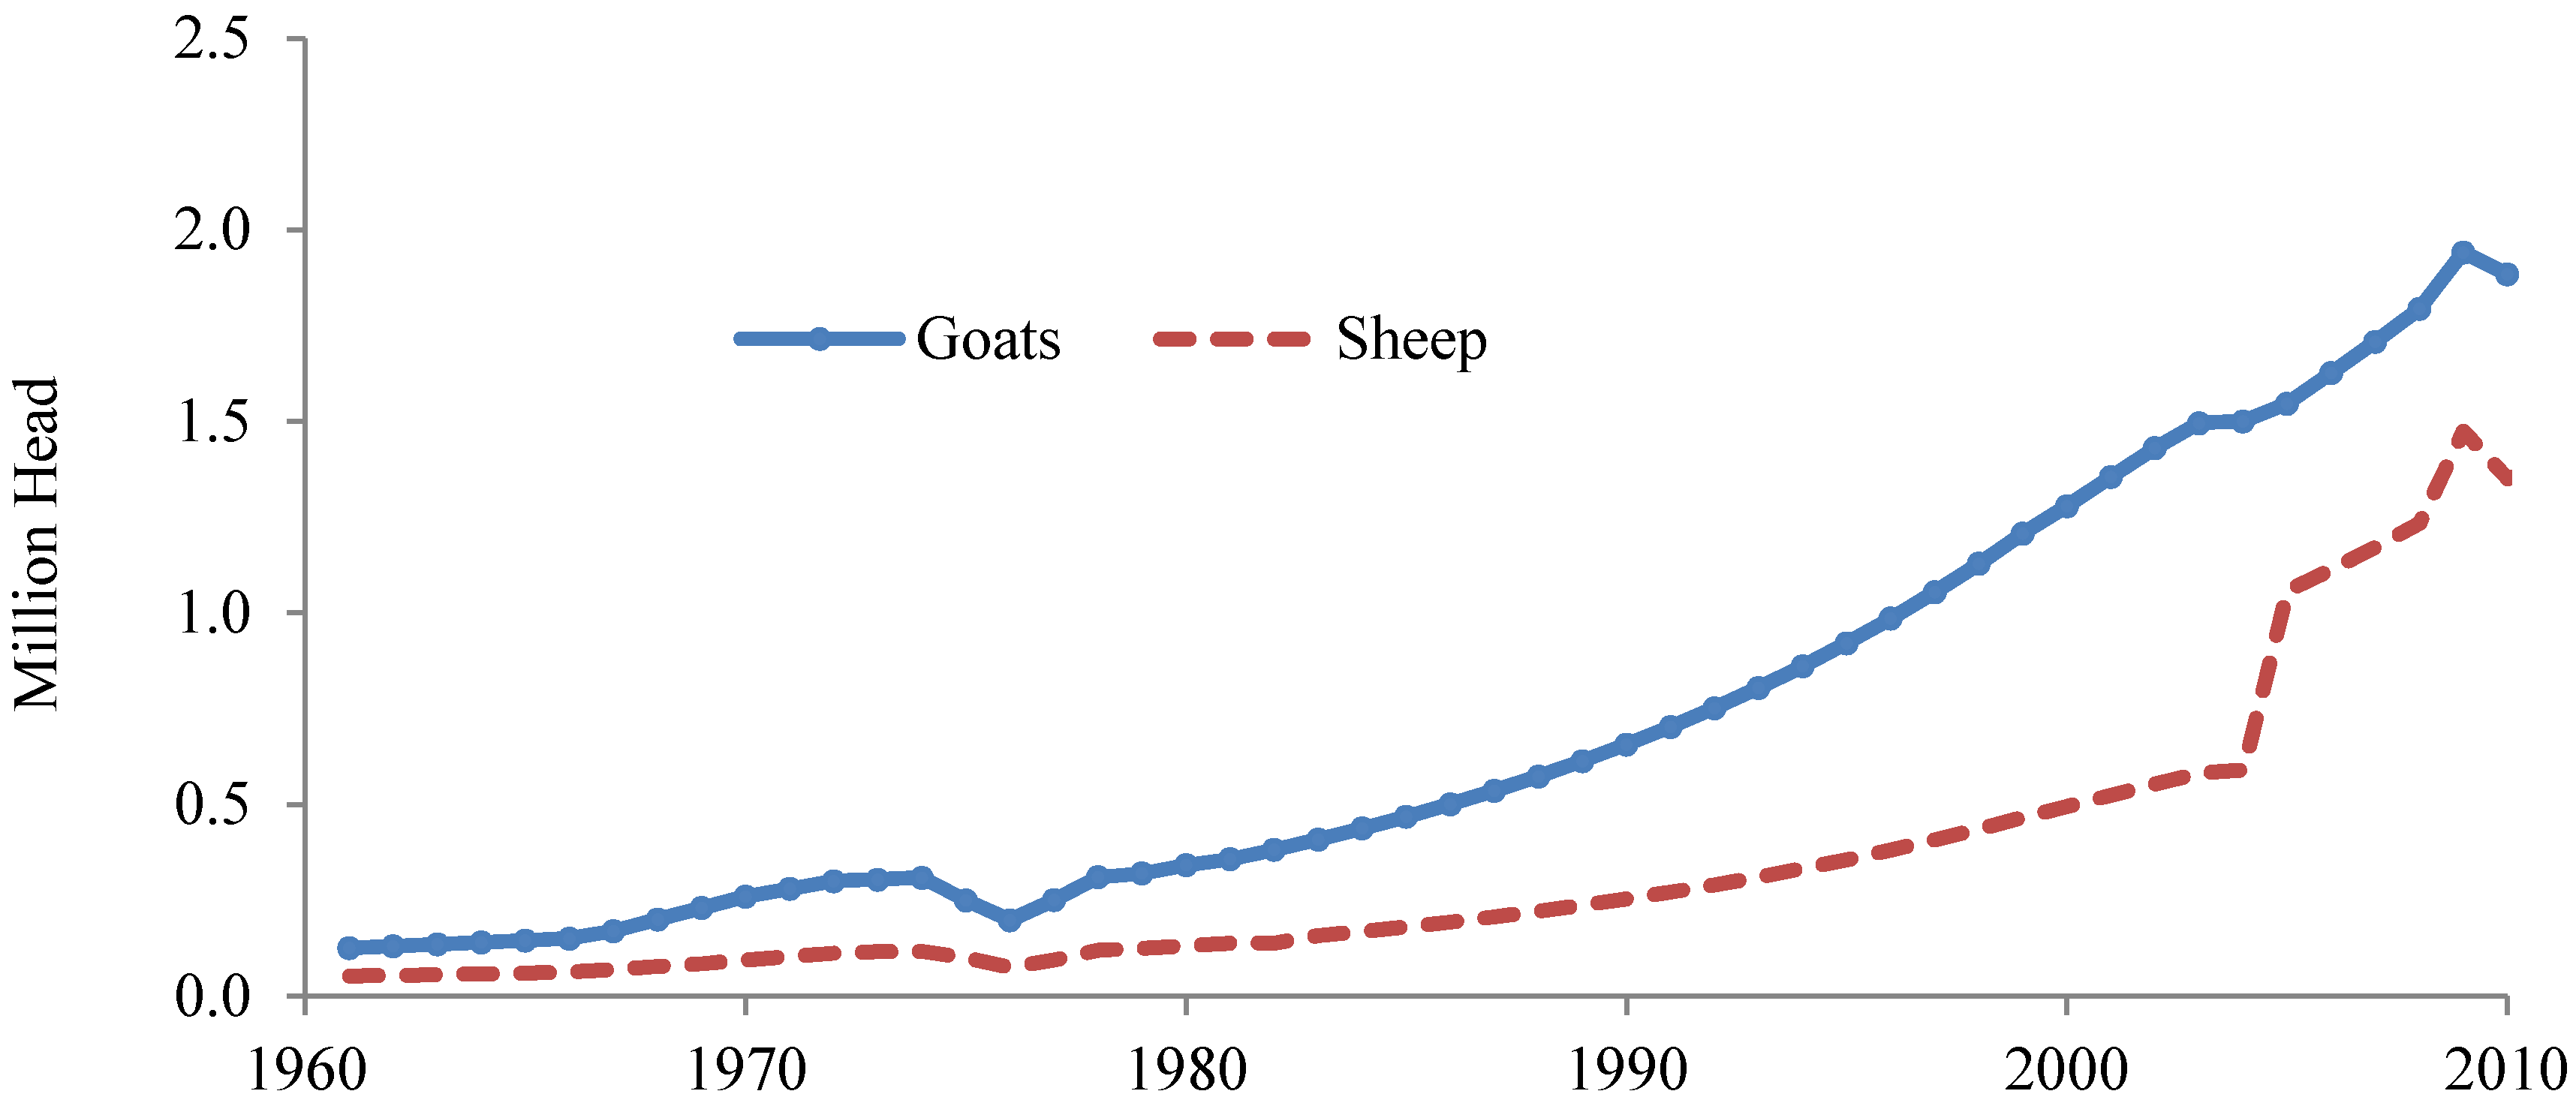
1] estimates that sheep and goat stocks in the United Arab Emirates increased from 52 thousand in 1960 to 1.5 million in 2010 for sheep and from 125 thousand in 1960 to 2 million in 2010 for goats (
Figure 1). Meanwhile, the United Arab Emirates (UAE) imports more than 82% of its overall meat needs. Imports of mutton and goat meat represents 44% of the total supply in the country, leaving 56% of consumption satisfied from local production in 2009. Red-meat production, consumption, prices and trade in the UAE are currently issues of high importance to the food security policy makers in the UAE government. The UAE imports red meat from Australia, New Zealand, India, Pakistan and other countries to fill an increasing demand gap due to increasing per-capita national income, which has led, in turn, to increasing consumption and demand for red meat.
Figure 1.
Number of sheep and goat stock in the United Arab Emirates 1960–2010.
Figure 1.
Number of sheep and goat stock in the United Arab Emirates 1960–2010.
Source: Food and Agriculture Organization (FAO), 2013 [
1].
Furthermore, similar to many other countries, the UAE has witnessed an increasing global and domestic emphasis on some important meat production and consumption attributes, such as meat products’ quality and safety, in addition to environmental concerns. The UAE possesses relatively limited agricultural resources due to being in a typical arid region. With such limited agricultural resources, agricultural policies ought to address such issues as food security along with issues relevant to resource conservation. The current use of such scarce resources may lead to either economic overutilization or underutilization with possibilities of irreversible consequences. The UAE policy makers are working towards initiating and acquiring an accurate and comprehensive information system and building technical, economic and risk indicators to help producers of the red meat subsector. The UAE’s Ministry of Environment and Water (MOEW) [
2] is in the process of building a database for input use in the country’s livestock sector.
The Arab Organization for Agricultural Development (AOAD) [
3] showed that the United Arab Emirates self-sufficiency ratio (SSR) of red meat declined in the last four decades from 83.25% in 1982 to less than 2% in 2011. Increased mutton and goat meat production and productivity (meat produced per head) in the UAE play a vital role in reducing the self-sufficiency gap and stabilizing output prices.
The following section includes a review of studies that have addressed the technical, allocative and/or stochastic efficiency of sheep and goats. This section also summarizes studies that address policy options in response to reduced inefficiency, such as sheep and goat production system intensification. Zaibet
et al. [
4] investigated goat production impacts on socio-economic performance and development in Oman. The study considered a goat production system in a hill-country farming community located in the interior region. The area included forty villages with an average of ten families in each village where goats are raised for rural households. The authors used a data envelopment analysis (DEA) approach. DEA is a mathematical programming methodology that provides a non-parametric measure of relative efficiency. Then, the authors used two-stage ordinary least squares (OLS) to determine the components of the technical efficiency. Their research found that non-farm income and feeding costs are influential variables. Meanwhile, variables, such as farm size, flock size and family labor, were found to be non-influential variables in predicting changes in technical efficiency.
Hadley [
5] studied the patterns of technical efficiency and technical change at the farm level in England and Wales. The objective of this study was predicting the relative technical efficiency of individual farms and explaining the differences in efficiency levels between these farms. Data for this research were obtained from the Farm Business Survey published by Defra and the National Assembly for Wales for the period 1982–2002. Farm products included in the survey were cereal, dairy, sheep, beef, poultry, pigs, as well as mixed farm products. Hadley’s study applied the stochastic frontier and inefficiency effects models. The analysis showed that farms of all types are efficient and largely operate close to the production frontier.
Pérez
et al. [
6] offered a technical note on the technical efficiency of meat sheep production in Spain. The authors surveyed 49 farms in Aragon, Spain, where 3.5 million lambs are fattened per year on about 8000 sheep farms. The authors estimated Cobb-Douglas frontier production functions to estimate technical efficiency. In this study, the authors considered feed costs, capital depreciation and labor costs as the explanatory variables. One would notice the sample in this study to be very small relative to the total farms in the country (49 farms out of 8000 farms, or 0.6%). However, the study highlighted the importance of sheep production costs, including inputs cost, as well as the sheep product market seasonality.
Villano
et al. [
7] measured regional productivity differences in the Australian wool industry using a metafrontier approach. Explanatory variables, such as feed/pasture, health, marketing and labor, were considered to explore the technical efficiency in each of the four selected regions using stochastic frontier functions. The study found that technical efficiency differences between the four regions are due to environment and agricultural extension services that were provided to sheep and goat farm owners.
Suresh
et al. [
8] studied the returns and economic efficiency of sheep farming in the semi-arid region of Rajasthan, India, based on the collection of field data relying on a survey questionnaire from 107 sheep farmers who reside within 20 villages during March 2005. The authors used a stochastic frontier model to analyze such economic efficiency. The authors found overall average economic efficiency to be 75 percent. Furthermore, the authors noticed that more than two thirds of the farmers are witnessing economic efficiency in the range of 70–85 percent.
Shomo
et al. [
9] analyzed the sources of technical efficiency of sheep production systems in dry areas in Syria using the results of a survey carried out in 2002. They applied stochastic frontier and maximum likelihood estimation to find that technical efficiency in the sheep production in Syria ranges from 0.67 to 0.97. The authors concluded that flock size is a key factor in determining technical efficiency. The authors also recommended that producers should be encouraged to shift from traditional systems to intensive systems to increase technical efficiency.
Furesi
et al. [
10] analyzed the technical efficiency in the sheep industry for producing sheep milk in Sardinia (Italy). This study collected panel data from 36 sheep firms that produce sheep milk during 2004 to 2009. A stochastic frontier approach was used by Furesi
et al. to assess the possibility of technical improvements in productivity. Technical efficiency was found to be 0.933 in these farms. The study included both private and cooperative farms and found significant differences between the two groups (0.93 for private firms and 0.88 for cooperative firms).
Economides [
11] defined the sheep and goat intensive system to be the system that involves confinement of the flock with only limited grazing, for the goal of producing heavier lambs and kids. Such a system requires rationing of feed that utilizes available forage effectively, heavier use of appropriate (to the species and age of the animal) concentrates, a high level of veterinary care, better sheltering and feeding facilities and use of an automated system for handling inputs, animals and animals’ products. However, such a system requires trained labor and increased management skills. Otherwise, investment may lead to low returns and probably high economic losses. Furthermore, Economides’ [
11] study indicated that if an intensive system for sheep and goats is successful, several advantages would be gained. Efficient use of inputs, including feed, labor and veterinary medicine, a steady supply of meat production and higher quality of final products justifies the initial investment in such intensive or semi-intensive systems.
Kumar [
12], Sultana
et al. [
13] and Abdelqader
et al. [
14] studied the potential impacts of adapting sheep and goats in semi-intensive and intensive systems in similar arid regions to the UAE arid land. Kumar [
12] concludes that goat rearing in India is rewarding in both semi-intensive and intensive systems. Sultana
et al. [
13] found that semi-intensive feeding systems were found to be more efficient, testing native sheep species in Bangladesh. However, the authors found that the intensive system is more efficient using lamb survivability criteria. Meanwhile, Abdelgader [
14], investigating the length of productive life (LPL) of Awassi and Najdi ewes species in intensive production systems in the northern part of the Arabian Peninsula, found that variation in such LPL is due to differences in breed, management practices and flock effects. Furthermore, the authors found that the Awassi ewe breed fits the intensive system more than the Najdi breed and can survive longer. These studies’ findings showed the positive potential for increased technical efficiency of the intensive sheep and goat farming under an arid land environment.
Previous studies covered in this research all agreed about using the stochastic frontier production functions in order to enable discovering sources of technical and allocative inefficiency. The selection of variables to analyze sources of technical efficiency widely differs from one study to another, which indicates that no single set of variable fits all research problems. Our study selected a larger number of variables to analyze sources of technical inefficiency relative to the previous studies (i.e., flock size, owner’s years of experience, animal breed, total operational cost, land size and costs of concentrates).
The objectives of this research are: (1) to obtain the baseline information on the existing mixed-animal farms; (2) to determine the production efficiency of input use and the corresponding price efficiency; (3) to estimate stochastic analysis parameters, including out of control random unknown parameters that account for technical inefficiency in the production functions; (4) to understand the sources of such technical inefficiency; and (5) to use research results to find and propose possible alternatives for decision makers to address technical inefficiency in the UAE sheep and goat subsector.
3. Results and Discussion
Survey results also revealed that sheep and goat farms are 86% and 14% of all sheep and goat farms, respectively, in the Al-Ain Region, Abu-Dhabi area and the Western Region of the Abu Dhabi Emirate. The majority of sheep and goat farms (428 farms out of 661 sample farms) were in operation for 10 years or less. The typical sheep flock structure was dominated by ewes; whereas doe’s dominated the goat flocks. The average value products (market price) for sheep and goats were AED 116 and AED 93 per head, respectively (USD 1 = AED 3.675). Almost all farmers (99%) claimed that the farm is carrying the right capacity. Fifty seven percent of the farmers claimed they supply adult animals with concentrates. Fifty one percent of the water needs for both sheep and goats were supplied through tanks, followed by the Al-Ain Distribution Company (29%) and groundwater (20%). Meanwhile, 70% of the sheep and goat farmers reported that they seek veterinary services when animals get sick. The main three health control measures adopted in sheep/goat farms are vaccination (76%), dipping (68%) and dew arming (68%). Whereas 94% of farmers reported that they do not do animal identification, the 6% who reported that they used identification claimed using the ear-tagging method. Fifty six percent of sheep/goat farmers reported culling of sheep and goats from flocks for health reasons. Seventy nine percent of farmers reported having shades for each group of animals, with more emphasis on the newly born (61%). Sources of price information were 9%, 8% and 9% from other farms, the government and negotiations with buyers, respectively. The reported annual total production of sheep and goats by number were 7661 and 5845 animals, respectively, with coefficients of variation of 135% for sheep and 120% for goats. Ten percent of sheep/goat farmers reported meeting market demands, whereas 38% claimed they do not, and 52% did not respond to that question (Sherif
et al. [
21]).
The results section of this study proceed to include descriptive statistics of the research variables, technical efficiency results, allocative efficiency results and the stochastic analysis results to explore and analyze factors that influence technical, allocative (price) and uncertainty in sheep and goat production in Abu-Dhabi Emirate, UAE.
This research paper expands on the Sherif [
21] conference proceeding paper to include stochastic frontier analysis utilizing the approach proposed by Coelli
et al. [
18]. Using the stochastic frontier methodology has an advantage over the deterministic approach in that it enables estimation of the technical efficiency distribution, as well as the inclusion of technical inefficiency sources. The deterministic approach uses the average of estimated technical efficiency and allocative efficiency for the overall sample without revealing information about technical efficiency at the specific farm in the study’s sample. However, the stochastic frontier approach estimates technical efficiency at each farm and further shows the distribution of technical efficiency across all of the sample farms. Another advantage of the frontier approach is that it enables the analysis to further analyze the sources (e.g., species, feed or labor) of inefficiency. Stochastic efficiency analysis considers the analysis of both known uncertainty due to technical inefficiency and unknown sources of uncertainty. The stochastic component of this research was carried out using FRONTIER, version 4.1 software prepared by Coelli [
22], for the Center for Efficiency and Productivity Analysis (CEPA).
3.1. Sheep Deterministic Model: Technical Efficiency
The following is the production function specification for sheep in Abu-Dhabi Emirate:
Equation (5) displays the estimated log-log production function for sheep, where
Y is the number of sheep (head produced/day), Rhodes and alfalfa are measured in tons/day, and wheat bran, barley, corn, wheat, wheat concentrate, minerals and vitamins are all measured in kilograms/day; labor is measured in thousand hours/year, and water is measured as cost in AED/year. The model’s
F-ratio was 287.557 (model statistically significant), adjusted
R-squared = 0.827 (all of the estimated variables explain 82.7% of the variations in the level of output); and the significant variables in the above estimated equation at less than the 1% level are Rhodes, alfalfa, wheat bran, wheat, protein concentrate, labor and water. The Standardized beta coefficients showed that the most prominent variables in affecting the level of output are, respectively labor, alfalfa, protein concentrate, wheat bran, water, wheat and Rhodes (Sherif
et al. [
21]).
3.2. Sheep Deterministic Model: Allocative (Price) Efficiency
The ratio of the marginal value product of input
X (MVP
x) and input price of
x (P
x) was calculated for each significant input to test the null hypothesis that it is equal to one.
Table 2 shows the results obtained for all of the significant inputs in the estimated log-log function where: MVP
x = marginal value product of the variable input
X, P
x is the average unit price of the variable input
X and MVP
x is equal to (E
X × P
y × (
Y/
X)); where: E
X is elasticity of production of the variable input
X, P
Y is the average output price in AED,
Y is the average level of output and
X is the average level of the variable input
X. According to the marginal economic production theory; if MVP
x/P
x < 1, input is overutilized; if MVP
x/P
x = 1, input is optimally utilized; and If MVP
x/P
x > 1, input is underutilized (Hall [
23]).
Table 2 summarizes the allocative efficiency results of the variable inputs used in the production of sheep. Water was not included, because it was calculated as a monetary value per year and not as a physical amount, due to lack of data on the physical amounts. The table shows that all of the prominent variable inputs are overutilized as their MVP
x compared to their corresponding prices, P
x, are less than one. Moreover, an elasticity of production of Rhodes, for instance, of 0.053 means that if the input level increases by 100%, output would increase by 5.3%, and so on, for the remainder of the regression coefficients (Sherif
et al. [
21]).
3.3. Goat Deterministic Model: Technical Efficiency
The following is the production function specification for goats in Abu-Dhabi Emirate:
Equation (6) displays the estimated log-log production function for goats, where
Y is the number of goats (head produced/day), and all of the variable inputs are defined and measured in the same units used in the estimation of the sheep production function. The model’s
F-ratio is 26.346, adjusted
R-squared = 0.297; and the significant variables in the above estimated equation at less than the 1% level are alfalfa, wheat bran, wheat and protein concentrate. Labor and water, however, were highly significant at less than the 1% level, but with unexpected negative signs. This could be due to overutilization of these two inputs due to recruiting cheap expatriate labor. The standardized beta coefficients showed that the most prominent variables in affecting the level of goat output are, respectively, alfalfa, wheat bran, protein concentrate and wheat (Sherif
et al. [
21]).
Table 2.
Allocative efficiency of the significant inputs used in the production of sheep. MVP, marginal value product; AED, Arab Emirates Dirham.
Table 2.
Allocative efficiency of the significant inputs used in the production of sheep. MVP, marginal value product; AED, Arab Emirates Dirham.
| Input | Unit | Coefficient | Output Price | Average | Average | Marginal | Input | MVPx/Px |
|---|
| (PY) | (Y) | (X) | Value Product (MVP) | Market Price (Px) (AED) |
|---|
| Rhodes | Ton | 0.053 | 116 | 122 | 8 | (MVP) | 400.9 | 0.23 |
| Alfalfa | Ton | 0.289 | 116 | 122 | 47 | 87 | 322.6 | 0.27 |
| Wheat Bran | kg | 0.122 | 116 | 122 | 4380 | 0.4 | 0.8 | 0.53 |
| Wheat | kg | 0.066 | 116 | 122 | 1825 | 0.5 | 1 | 0.51 |
| Protein Concentrate | kg | 0.121 | 116 | 122 | 2920 | 0.6 | 0.8 | 0.78 |
| Labor | 1000 h | 0.388 | 116 | 122 | 2.9 | 1919.9 | 3400.0 | 0.56 |
3.4. Goat Deterministic Model: Allocative (Price) Efficiency
Table 3 summarizes the allocative efficiency results of the variable inputs used in the production of goats. MVP
x/P
x shows that alfalfa is over-utilized. However, all other inputs (wheat bran, wheat and protein concentrates) are underutilized.
Deterministic models for sheep and goats in the UAE, Abu-Dhabi, were used primarily to estimate overall technical efficiency and allocative efficiency and to serve in step to include the stochastic component analysis. The stochastic component includes both the random variable due to the unknown and the technical efficiency component, which is further investigated in the stochastic analysis section later. Deterministic models are the first step to narrow down the explanatory variables. Only significant variables from deterministic models are considered for the stochastic frontier.
Table 3.
Allocative efficiency of inputs for goats. MVP, marginal value product.
Table 3.
Allocative efficiency of inputs for goats. MVP, marginal value product.
| Input | Unit | Coefficient | Output Price (PY) | Average
(Y) | Average
(X) | Marginal Value Product (MVPx) | Input Market Price (Px) | MVPx/Px |
|---|
| Alfalfa | Ton | 0.395 | 93 | 106 | 45 | 86.5 | 322.6 | 0.27 |
| Wheat Bran | kg | 0.280 | 93 | 106 | 3285 | 0.8 | 0.8 | 1.12 |
| Wheat | kg | 0.196 | 93 | 106 | 1095 | 1.8 | 1 | 1.76 |
| Protein Concentrate | kg | 0.296 | 93 | 106 | 2190 | 1.3 | 0.8 | 1.78 |
3.5. Sheep Stochastic Frontier: Maximum Likelihood Estimates
Table 4 summarizes the sheep stochastic frontier production function using maximum likelihood estimates. These results show the expected positive signs for all of the selected explanatory variables and that all of these variables are significant. These estimates indicate that all coefficients on explanatory variables are smaller than those of the deterministic model results. This is due to the fact that technical efficiency is now accounted for as its own variable, and the stochastic model also considers variability due to out of control conditions: stochastic variability (e.g., due to changes in climate). For example, MLEs show that increasing Rhodes by 1% causes the sheep number produced in the flock to increase by 0.02%. The gamma coefficient indicates that variation in the composite error term that is due to the inefficiency component (equal to 0.56). In other words, for sheep in the UAE, 56% of the variation in the error term is due to inefficiency.
3.6. Goats Stochastic Frontier: Maximum Likelihood Estimates
Table 5 shows the results for the goats’ stochastic frontier production function using the maximum likelihood estimates. Different from the sheep model’s results, using wheat to feed the goats is found to be insignificant (
T-value = 1.5). The goats’ stochastic model results indicate that increasing alfalfa by 1% causes the number of goats produced in the flock to increase by 0.16%. The gamma coefficient indicates that variation in the composite error term that is due to inefficiency component (equal to 0.97). In other words, for goats in the UAE, 97% of the variation in the error term is due to inefficiency.
Table 4.
Sheep maximum likelihood estimates: stochastic production frontier.
Table 4.
Sheep maximum likelihood estimates: stochastic production frontier.
| Variable | Overall Model
Fitness | Coefficient | Standard Error | T-Ratio |
|---|
| Constant | | 0.16 | 0.16 | 9.48 |
| Rhodes (ton) | | 0.02 | 0.02 | 3.43 |
| Alfalfa (ton) | | 0.03 | 0.03 | 17.55 |
| Wheat Bran (kg) | | 0.02 | 0.02 | 4.67 |
| Wheat (kg) | | 0.03 | 0.03 | 2.74 |
| Protein Concentrates (kg) | | 0.02 | 0.02 | 4.16 |
| Labor (1000 h) | | 0.04 | 0.04 | 19.14 |
| Sigma-squared | | 0.13 | 0.13 | 6.93 |
| Gamma | 0.56 | 0.13 | 0.13 | 4.45 |
Table 5.
Goat maximum likelihood estimates: stochastic frontier production frontier.
Table 5.
Goat maximum likelihood estimates: stochastic frontier production frontier.
| Variable | Coefficient | Standard Error | T-Ratio |
|---|
| Constant | 5.06 | 0.09 | 54.39 |
| Alfalfa | 0.16 | 0.03 | 5.62 |
| Wheat Bran | 0.07 | 0.03 | 2.04 |
| Wheat | 0.07 | 0.04 | 1.50 |
| Protein Concentrates | 0.09 | 0.03 | 2.65 |
| Gamma | 0.97 | | |
3.7. Comparison of Sheep and Goats Technical Efficiencies
Table 6 below summarizes the sheep and goat technical efficiencies and descriptive statistics.
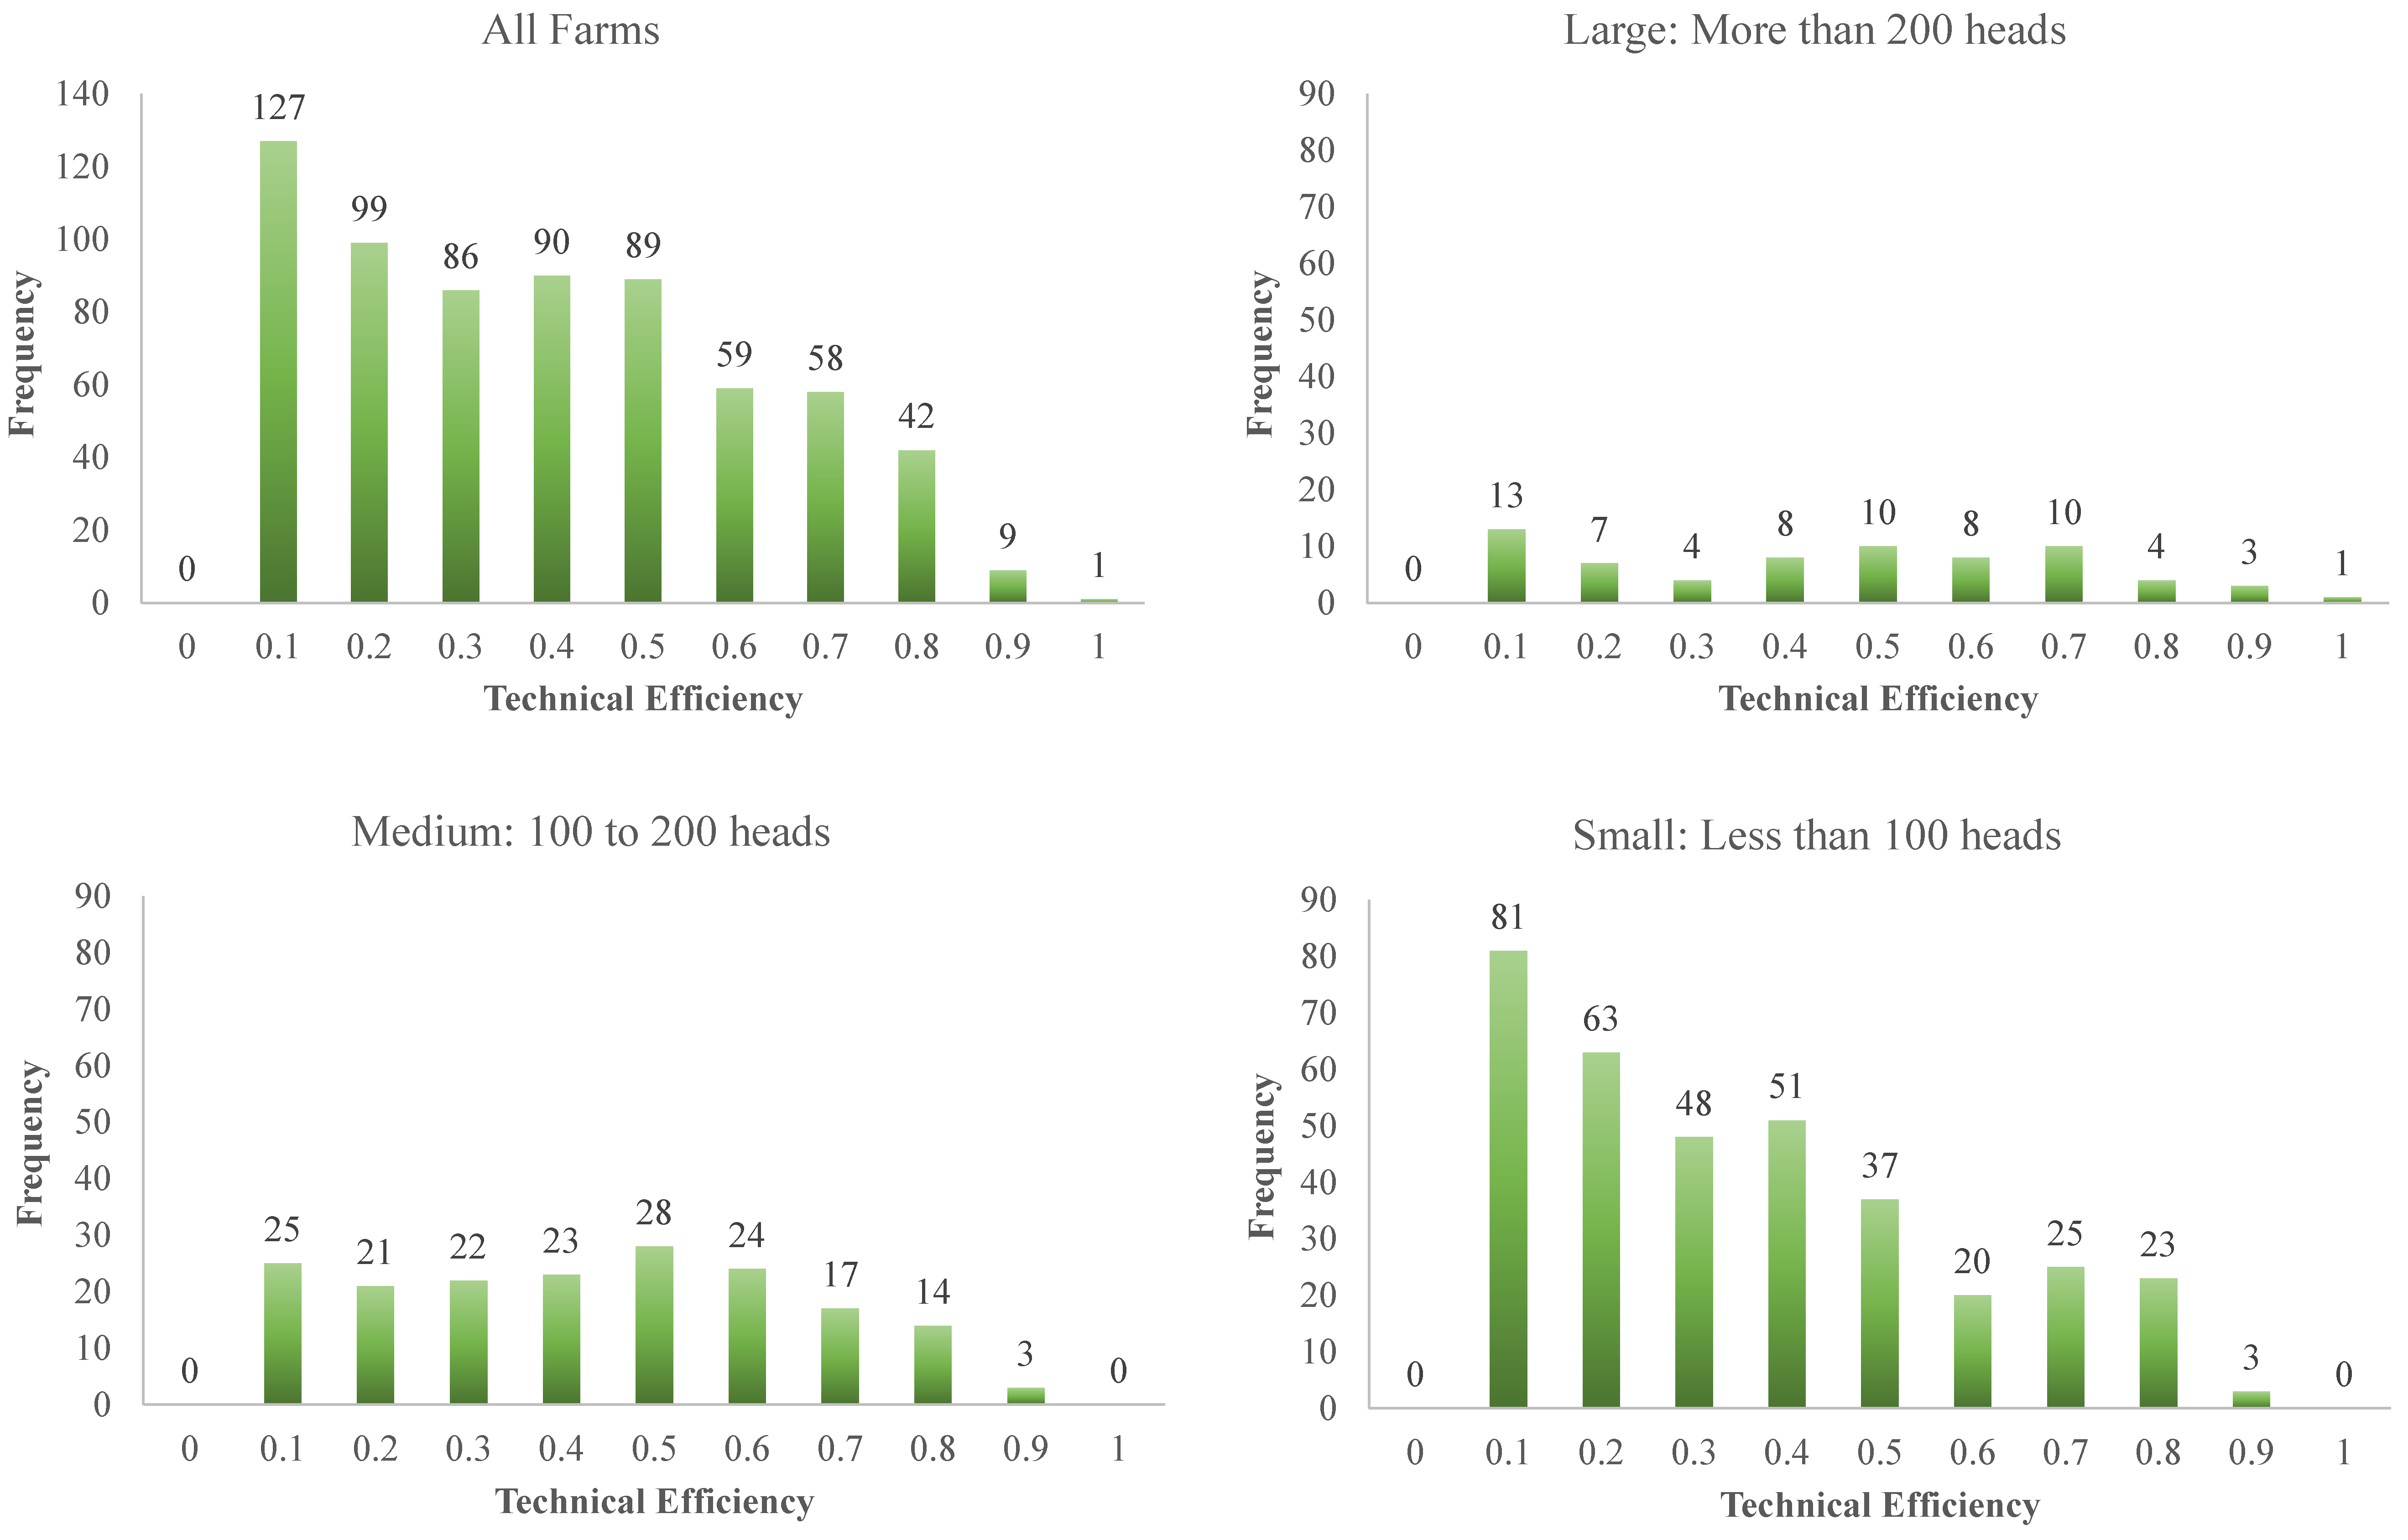
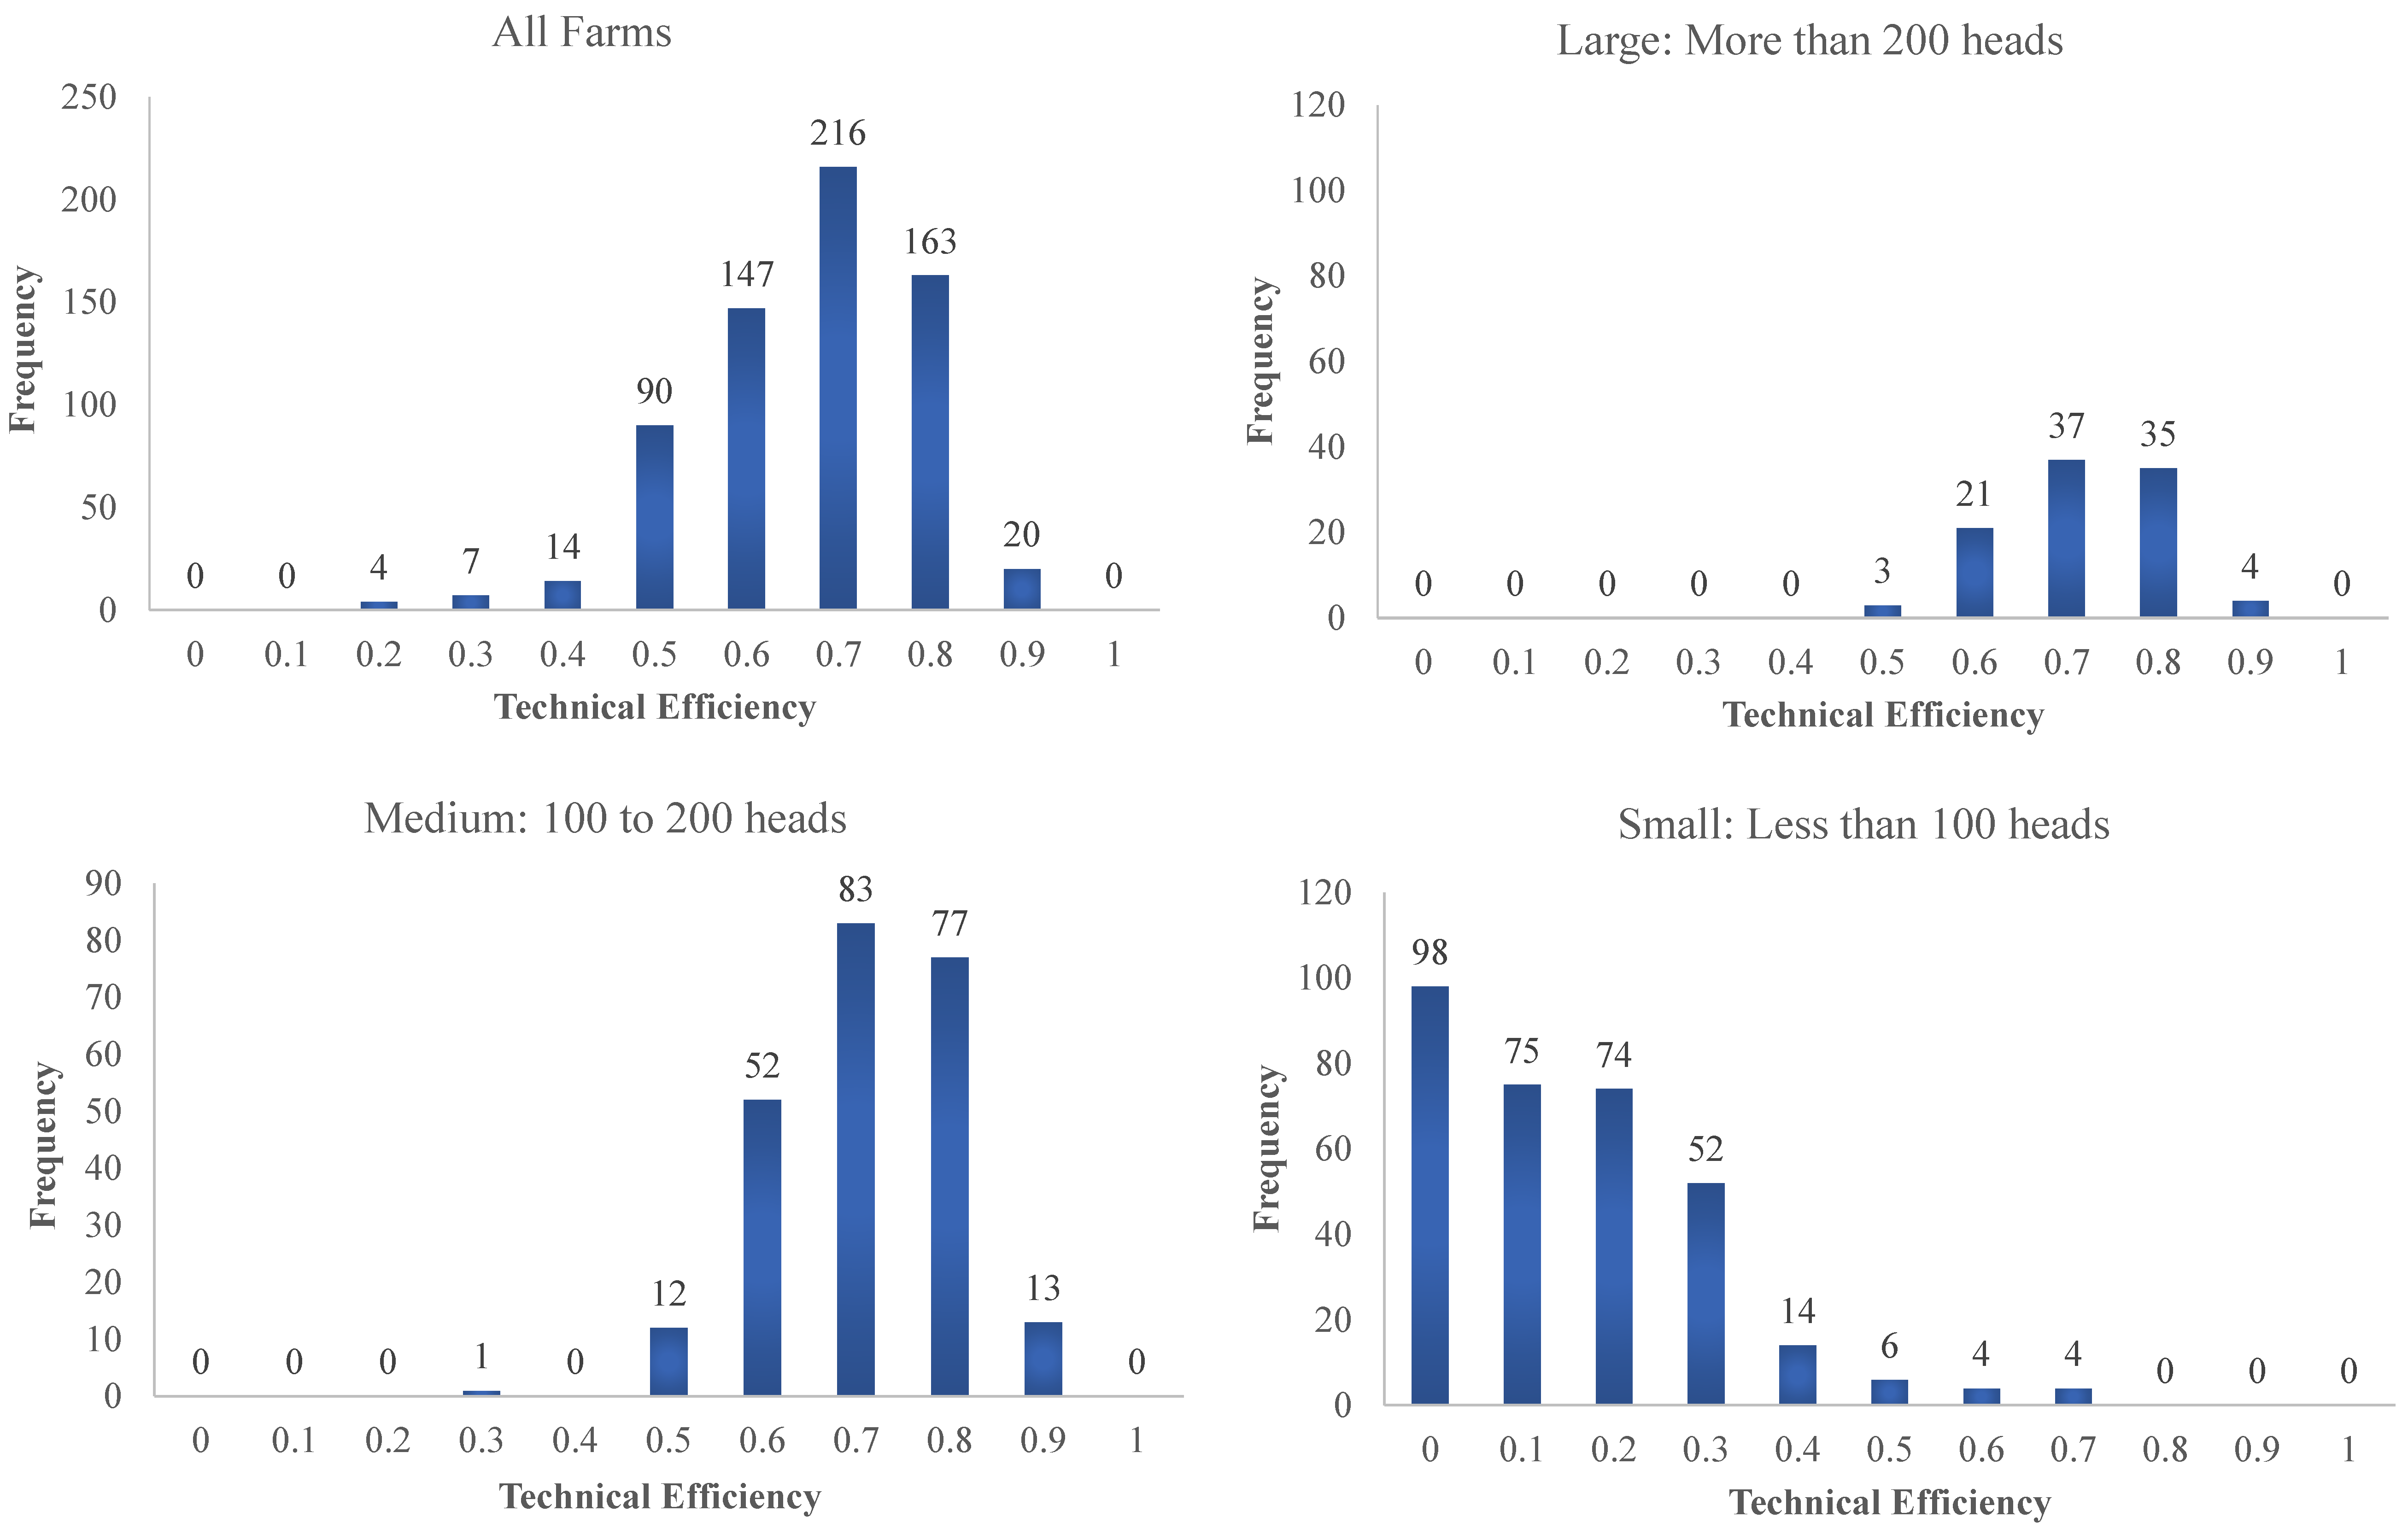
Figure 1 below compares the histograms for the sheep and goat technical efficiencies. Overall, average technical efficiency was found to be 0.62 for sheep and only 0.34 for goats. These descriptive statistics show that sheep technical efficiency compared to goats’ technical efficiency is double on average. Furthermore, the distribution of goats’ technical efficiency is skewed to the left (low) compared to the sheep technical efficiency distribution, which is slightly skewed to the right (high) (
Figure 2 and
Figure 3). These results show that sheep’s production technical efficiency is higher than goats’ production technical efficiency overall.
Table 6.
Descriptive statistics of technical efficiencies parameters for sheep and goats.
Table 6.
Descriptive statistics of technical efficiencies parameters for sheep and goats.
| Indicator | Sheep | Goats |
|---|
| Mean | 0.62 | 0.34 |
| Median | 0.64 | 0.32 |
| Mode | 0.45 | 0.01 |
| Standard Deviation | 0.12 | 0.23 |
| Minimum | 0.15 | 0.00 |
| Maximum | 0.86 | 0.91 |
| Range (Maximum–Minimum) | 0.71 | 0.91 |
| Coefficient of Variation | 20% | 69% |
Figure 2.
Sheep technical efficiency distribution.
Figure 2.
Sheep technical efficiency distribution.
Figure 3.
Goat technical efficiency distribution histograms.
Figure 3.
Goat technical efficiency distribution histograms.
The technical efficiency distribution for the three sizes (large, more than 200 heads; medium, 100–200 heads; and small, less than 100 heads) of sheep is depicted in
Figure 2, which shows that sheep technical efficiency is distributed, as expected, with higher technical efficiency for the large sized flocks. However, the distribution of goats’ technical efficiency does not show similar results to the sheep distribution. For example, medium sized flocks (100–200 heads) of goats showed a higher technical efficiency level relative to the large sized flocks. This indicates that other than the flock size, the feeding system, owner years of experience and management practices may have more influence on goat production efficiency.
Descriptive statistics on goats showed that technical efficiency had a larger range (0.91) compared to (0.71) for sheep.
Table 7 further indicates that only nine of the sheep farms have a technical efficiency coefficient of 0.25 or less compared to 270 goats farms. On the other end, 80 sheep farms and only 33 goat farms showed more than a 0.75 technical efficiency coefficient. There is also a large difference between the number of sheep and goat farms within the other ranges of technical efficiency coefficients, with sheep farms showing a higher number of farms on both the range of 0.26 to 0.5 and 0.51 to 0.75. In brief, sheep farms that achieve over a 50% technical efficiency coefficient or higher are 82% of the sample compared to only 27% of the goat farms.
Table 7.
Number of sheep and goats farms at different levels of technical efficiency.
Table 7.
Number of sheep and goats farms at different levels of technical efficiency.
| Level of Technical Efficiency | Number of Farms |
|---|
| Sheep | % | Goats | % |
|---|
| 0.25 or Less | 9 | 1% | 270 | 41% |
| 0.26–0.5 | 106 | 16% | 221 | 33% |
| 0.51–0.75 | 466 | 70% | 137 | 21% |
| More Than 0.75 | 80 | 12% | 33 | 5% |
| Total | 661 | 100% | 661 | 100% |
3.8. Distribution of Technical Efficiency by Herd Size
Each of the sheep and goat farms in the sample is classified into three groups, large sized (more than 200 heads), medium (100–200 heads) and small (less than 100 heads). Technical efficiency distributions from the sheep histograms in
Figure 2 are showing a pattern of increasing efficiency as the flock size increases. The relationship between flock size and technical efficiency does not follow a specific pattern of increased efficiency when the size of the flock increases. For example, small and medium sized flocks shows relatively higher technical efficiency compared to the same sizes of sheep flocks. These results indicate that flock size is one of the influential factors relative to other factors and has a positive relationship with technical efficiency in sheep production systems. Other than flock size, factors, such as owners’ years of experience and management practices, are more influential on goats’ production system efficiency.
3.9. Sources of Technical Inefficiency in Sheep and Goats
Table 8 shows information on the investigation of the possible source of technical efficiency in sheep and goats in the Abu-Dhabi Emirate. These results indicate that flock size is the most influential factor relative to other factors and positively affecting technical efficiency. This is consistent with the concept of economies of size. Larger sized sheep and goat operations lead to economic benefits, as fixed costs are spread over a larger number of animals and increase the overall efficiency of the inputs used. Including the local breed in sheep was also found to be positively related to technical efficiency. However, this was not the case for goats, because no strong correlations were found between the difference in goat breed and or operation size, on one side, and the technical efficiency, on the other. Meanwhile, operating for more than 10 years, using concentrates in feeding ruminants and using vaccination to prevent disease spread variables were not found to be influential and positively correlated with increased technical efficiency.
All of the previous results above in relation to technical, allocative, stochastic efficiencies and sources of inefficiencies are used to draw conclusion, as well as to draw guidelines in a step to address policy options. Such conclusion and guidelines are included in the next section.
Table 8.
Sources of technical efficiency in sheep and goats: correlation coefficients.
Table 8.
Sources of technical efficiency in sheep and goats: correlation coefficients.
| Factor | Sheep | Goats |
|---|
| Flock Size | 0.30 | 0.18 |
| Operating for More Than 10 year | −0.11 | 0.03 |
| Local Breed Is Included | 0.22 | −0.07 |
| Using Concentrated Feed | −0.001 | −0.01 |
| Using Vaccination | 0.03 | 0.03 |
4. Conclusions
The current status of the United Arab Emirates’ meat production subsector reveals that the deficiency in the meat group to satisfy local demand is on the rise. The red meat deficit is increasing annually, which, in turn, has led to deterioration in annual self-sufficiency ratios, with the deficit value growing annually by rates higher than those of the growth in the country’s real Gross Domestic Product (GDP). The UAE government decided on adopting the resource-conservation type of policies. This study is focused on how to provide guidance to decision makers through identifying the current and ongoing use of scarce resources in the production of two important red meat sources; namely, sheep and goats. The venue was addressing the issue of input use economic efficiency. What increases the severity of the problem is the continuous rise in real per-capita incomes of the UAE citizens and a great number of expatriates that impose an ever-rising demand for red meat. Since the domestic production is insufficient, more importation is anticipated, implying a persistent and chronic decline in red meat self-sufficiency ratios.
In this study, marginal economic production theory, technical and allocative efficiency estimates and stochastic frontier methods were implemented to address input-use efficiency through the estimation of log-log production functions for sheep and goats separately. The study used the maximum likelihood estimate method to analyze stochastic efficiency and identify sources for such inefficiency in the UAE sheep and goat sector. The study concluded that the production of sheep and goats in the UAE, considered to be part of the UAE heritage, suffers from economic inefficiency of input use. Only one input, wheat bran, was found to be close to optimality in goat production. Other inputs were found to be either overutilized, like the case of sheep, or underutilized, like the case of goats. Moreover, the labor and water inputs, which were found to be positive and highly significant in impacting sheep production, were found to be significant and negatively impacting the level of goat production. Labor is commonly of the expatriate-low-wage type, and water is mostly subsidized by the government, both of which encourage UAE farm owners to overutilize. The estimated functions’ coefficients represent the elasticities of the production of the said inputs. Through these coefficients, the responsiveness of outputs to percentage changes in input levels was assessed. The highest impact of an input on output level was labor in the case of sheep and alfalfa in the case of goats, both of which were found to be overutilized. Results indicated the inefficiency of the inputs utilized for sheep and goats; where all of the inputs used in sheep production were overutilized; whereas those used in goat production were underutilized in two cases and overutilized in one case, with only one input being close to economic-use optimality.
This study’s results showed that, overall, average technical efficiency was found to be 0.62 for sheep and only 0.34 for goats. Technical efficiency coefficient distribution results indicate that about 82% of the sheep farms are achieving a 0.5 or more technical efficiency coefficient compared to only 27% of the goat farms. Results showed that 56% of the risk is due to technical inefficiencies’ in sheep production. However, 97% of the risk can be attributed to technical inefficiencies in goat production. Furthermore, flock size is found to be the most influential factor relative to other factors and positively affecting technical efficiency. Sources of inefficiency are attributed to flock size and breed in sheep and only flock size in goats.
Policy makers in the UAE should consider revising the forage subsidy in response to alarming signs of the increasing rate of water scarcity. Such water scarcity is worsening due to past direct subsides distributed to small and large ruminant producers in the country. With the ongoing trend of the UAE government on subsidy reduction for inputs for sheep and goat producers, it is expected that farmers will further reduce the inputs used for animal production in response to such expected policy changes. This research identified the overall low levels of technical efficiency, especially on the goat production subsector, and concluded that flock size and breed of sheep are the most influential factors affecting technical efficiency.
In response to the low technical, allocative efficiencies, lack of water for pasture and high level of uncertainty livestock, the sector’s policy makers in the UAE may consider several actions, including redirection of subsidies to the support of semi-intensive or intensive sheep and goat production programs, one the one hand. For producers, on the other hand, it is recommended to consider semi-intensive and intensive systems for small ruminant feeding, housing, healthcare and flock management in the UAE as a management option to address sheep and goat production systems’ low technical efficiency, low allocative efficiency and high uncertainty. Such intensive sheep and goat systems are necessary to optimize resource use and guarantee sustainable future production.


