Article

Split Nitrogen Application Timing Steers Rhizosphere Nitrifiers and Nitrogen Utilization in Wheat

1
College of Resources and Environment Science, Hebei Agricultural University, Baoding 071001, China
2
Key Laboratory for Farmland Eco-Environment of Hebei, Hebei Agricultural University, Baoding 071001, China
3
Green Intelligent Fertilizer Tripartite Integrated Base of Mindefu, Baoding 072450, China
*
Authors to whom correspondence should be addressed.
These authors contributed equally to this work.
Agriculture 2026, 16(9), 1006; https://doi.org/10.3390/agriculture16091006
Submission received: 25 March 2026 / Revised: 22 April 2026 / Accepted: 30 April 2026 / Published: 3 May 2026
(This article belongs to the Section Crop Production)

Abstract

Split nitrogen (N) application is an important agronomic measure for improving wheat yield and quality, yet how rhizosphere nitrogen-transforming microbes respond to split N strategies and the underlying mechanisms remain unclear. This study investigated the effects of six N treatments, including control, basal application, jointing-stage soil topdressing, and foliar applications at booting, anthesis, and 10 days post-anthesis, on the community structure and diversity of key rhizospheric nitrogen cyclers (ammonia-oxidizing archaea (AOA), ammonia-oxidizing bacteria (AOB), and nitrite-oxidizing bacteria (NOB)) in wheat. Results showed that AOB and NOB alpha diversity were significantly modified by split N application. N application at anthesis enhanced AOB richness and diversity more than the later application, while concurrently decreasing NOB diversity. Booting-stage application enriched Nitrosospira and Nitrosomonas in the AOB community, whereas anthesis application increased Nitrososphaera sp. JG1 in AOA, but decreased Candidatus Nitrospira inopinata in NOB. Redundancy analysis identified soil pH, moisture, organic carbon, and key enzyme activities as the main drivers of microbial community assembly. Although no significant differences were observed in key agronomic traits among treatments, the 10 days post-anthesis treatment showed numerically superior yield and N uptake. Notably, AOB community evenness was significantly positively correlated with grain yield, protein yield, and N uptake, whereas NOB community diversity showed negative correlations. These findings demonstrate that split N application, particularly late foliar spray at 10 days post-anthesis, can modulate soil physico-chemical properties to selectively shape nitrogen-transforming microbial communities (notably AOB) in the wheat rhizosphere. This study provides a theoretical foundation for designing precise N management strategies rooted in rhizosphere ecology, with the goal of simultaneously improving yield, grain quality, and nitrogen use efficiency.

1. Introduction

As a staple global food crop, securing the yield and quality of wheat is critically important [1]. Nitrogen (N) is a critical element in crop growth, serving as a vital agronomic practice for increasing grain yield and ensuring food security, with significant impacts on improving both yield and quality [2,3,4]. In field practice, however, conventional one-time basal N fertilization can result in overly dense tiller populations in the early wheat growth phase, followed by an insufficient N supply later, which compromises nitrogen uptake efficiency (NUE), final yield, and grain quality. An effective approach to address this issue involves delaying a fraction of the basal N dressing and supplementing it with foliar N sprays during the late growth stages. Foliar spraying is a rapid-response N management tactic for correcting late-stage nutritional deficits in wheat. Nutrients applied to the foliage are absorbed primarily through stomata, supplying the plant while minimizing N losses from denitrification and leaching [5]. Furthermore, it alleviates the reduced nutrient uptake associated with root senescence, and contributes positively to increasing grain protein content, improving NUE, and enhancing final grain quality [6].
In terrestrial ecosystems, N serves as the key growth-limiting nutrient, and its transformation from inert pools to plant-accessible forms is facilitated by soil microbes [7]. N fertilization impacts plants not only through direct nutrition but also by modulating the rhizosphere microbiome, thereby affecting soil N transformation and supply dynamics [8,9,10]. The rhizosphere is a hotspot for microbial activity, where rhizosphere microbes participate in nutrient transformation processes such as nitrification and N fixation around plant roots, and their community composition directly influences the plant’s capacity to mobilize and acquire nutrients [11]. The soil N cycle is microbially driven, with nitrification (the oxidation of ammonium to nitrate) being a pivotal step [12,13]. It is carried out collaboratively by key functional groups: ammonia-oxidizing archaea (AOA), ammonia-oxidizing bacteria (AOB), and nitrite-oxidizing bacteria (NOB) [14,15]. N application rates significantly alter the diversity and community composition of rhizosphere microbes. In the crop rhizosphere microbiome, N application beyond a certain level tends to enhance microbial abundance and diversity, subsequently impacting the community structure. Excessive N fertilization can significantly increase the abundance of nitrogen-fixing bacteria, ammonifying bacteria [16], and nitrifying bacteria [17], which enhances the rates of biological N fixation and ammonification. N fertilization stimulates organic acid secretion in the rhizosphere. The degradation of root exudates produces these acids, altering soil acid–base balance and directly shaping the structure and diversity of the soil microbiome. The resulting acidic conditions can adversely affect certain microorganisms, reducing overall microbial diversity [18]. Rational N fertilization management ensures that wheat fully utilizes N resources, thereby increasing crop yield and quality. Ample evidence demonstrates that N management strategies elevate wheat grain protein content. Specifically, delaying the application of a portion of N from early to later growth stages effectively enhances N uptake, boosts protein content, and improves the quality of bread wheat [19]. Delayed N application significantly enhances the N nutrient and chlorophyll content of flag leaf, retards the senescence of functional leaves in bread wheat [20,21,22], increases grain yield, and elevates both protein and wet gluten content in the grain, leading to superior quality [23,24]. Following wheat anthesis, foliar application of N fertilizer can promptly compensate for the insufficient nutrient uptake by roots, promote the translocation of more nutrients to grains, and improve N absorption and utilization by wheat leaves [25,26].
The influence of varied N fertilization regimes on the diversity and composition of key rhizospheric nitrogen-cycling microbial communities (such as AOA, AOB, and NOB), and their subsequent effects on crop growth, are not yet fully understood. Based on the research background mentioned above, we hypothesized that the split N application improves rhizosphere nitrifiers in wheat, which would alleviate late-season N deficiency of wheat to increase grain yield and protein yield, compared with one-time basal N application. To test our hypothesis, this study employed high-throughput sequencing to investigate the effects of N management on N uptake and utilization, yield, and protein content in wheat. Furthermore, this method was used to further analyze the correlations between the diversity and structure of rhizosphere nitrogen-transforming microbial communities and wheat yield and protein content, aiming to optimize N fertilizer strategies for wheat cultivation.

2. Materials and Methods

2.1. Experimental Site

The experiment was conducted from October 2020 to June 2022 at the experimental station of Hebei Agricultural University, located in Mazhuang Township, Xinji City, Hebei Province (37°47′ N, 115°17′ E, altitude 32 m). The site has a mean annual temperature of 12.5 °C, a mean annual sunshine duration of 2738 h, a frost-free period of 190 days, and a mean annual precipitation of 458.6 mm; the soil was classified as Calcaric Cambisols. Prior to wheat sowing, the topsoil had a pH of 8.68, organic matter content of 22.3 g/kg, total N of 1.6 g/kg, available phosphorus of 19.9 mg/kg, and available potassium of 164.5 mg/kg.

2.2. Experimental Design

The high-quality, strong-gluten winter wheat (Triticum aestivum L.) cultivar, Gaoyou 2018, was used as the test crop. Six treatments were designed (Table 1). T1 was a no-N treatment. Treatments T2–T6 received a basal N fertilizer of 90 kg N/ha. T2 received a topdressing of 120 kg N/ha broadcast to the soil at the jointing stage. T3 received 80 kg N/ha as a soil topdressing at the jointing stage. For T4, 80 kg N/ha was applied to the soil at jointing, followed by a foliar spray of 40 kg N/ha at the booting stage. Following an 80 kg N/ha soil application at the jointing stage, treatment T5 received a foliar spray of 40 kg N/ha at the anthesis stage. In T6, 80 kg N/ha was soil-applied at jointing, with a foliar spray of 40 kg N/ha applied 10 days after anthesis. All treatments were fertilized with a basal application of 100 kg P2O5/ha and 60 kg K2O/ha. A compound fertilizer (18-20-5, N-P2O5-K2O) served as the basal fertilizer, whereas urea (N > 46%) was used for the jointing-stage topdressing and foliar applications. Foliar sprays used a 1.5% urea solution. To avoid phytotoxicity, each scheduled foliar application was split into two sprays, applied on two consecutive days. All treatments were arranged in a randomized complete block design with four replications, and the area of the community is 60.5 square meters (5.5 m × 11 m). Two seasons of experiments were conducted during the trial period, and samples for measurement were collected in the second year. The 2020–2021 season wheat was sown on 10 October 2020 and harvested on 7 June 2021; the 2021–2022 season wheat was sown on 21 October 2020 and harvested on 8 June 2022. Wheat was sown at a rate of 255 kg/ha with a row spacing of 0.15 m. Seeds were coated before sowing with 27% difenoconazole · fludioxonil · thiamethoxam seed-coating suspension (3 mL/kg). A one-spray, three-prevention practice was applied to control the pest, disease and weed at the anthesis of wheat. The components and dosages included thiamethoxam 20 g, 5% cyhalothrin 30 g, chlorpyrifos 20 g, tebuconazole (430 g/L) 10 g, pyraclostrobin 20 g, water-soluble micronutrient fertilizer 20 g, and aerial application adjuvant 20 g with the agricultural drone.

2.3. Sampling and Measurements

2.3.1. Plant

At physiological maturity of wheat, aboveground plant samples from a 1 m section of a double row were randomly collected from areas with uniform stand and no gaps or doubles. The sampled plants were separated into stems, leaves, grains, and glumes for biomass and N content analysis of each component. The aboveground plant samples were dried at 70 °C to a constant weight. The dry weight of each organ was measured with a balance (0.01 g precision). Once confirmed, the samples of mature aboveground organs (stems, leaves, grains, and glumes) were pulverized with a high-speed grinder in preparation for total N content analysis of each organ. Total N content in the aerial parts (stems, leaves, grains, and glumes) of mature wheat plants was analyzed by the Kjeldahl method after sulfuric acid-hydrogen peroxide digestion [27].
Grain samples were also obtained at maturity. Spikes from a 2 m length of six contiguous rows were randomly harvested from areas of uniform growth within each plot for yield and quality assessment. Yield components—1000-grain weight, spike number per hectare, and grain number per spike—were measured using the second set of plant samples. Following threshing, the total grain weight was recorded. A grain counter was used to determine the 1000-grain weight, and moisture content was measured with a grain moisture analyzer. The grain yield was converted to a yield per unit area and then standardized to a moisture content of 12.5% [28].

2.3.2. Rhizosphere Soil

Samples of rhizosphere soil were collected 15 days post-anthesis in 2022. For each plot, several plants were dug up with a shovel. The loose bulk soil was shaken off the roots, which were then excised. Rhizosphere soil (approximately 50 g) was carefully brushed off the roots using a sterilized brush. This soil was mixed thoroughly and stored in a centrifuge tube as a single composite sample. The samples were stored at −80 °C until used for high-throughput sequencing of the rhizosphere microbial community.
Soil moisture content (SMC) of the rhizosphere samples was measured by the gravimetric (oven-drying) method. Soil pH was determined using a potentiometric method. The soil total N (STN) content was analyzed using the sulfuric acid digestion Kjeldahl method. Soil organic carbon (SOC) content was determined by the potassium dichromate oxidation (Walkley–Black) method. Activities of key nitrogen-cycling enzymes—ammonia monooxygenase (AMO), hydroxylamine oxidoreductase (HAO), and nitrite oxidoreductase (NXR)—in the rhizosphere soil were measured using a direct sandwich ELISA method [27].

2.3.3. Microbial Community Profiling

Community DNA from rhizosphere soil samples was subjected to paired-end sequencing on an Illumina platform by Shanghai Personal Biotechnology Co., Ltd,. Shanghai, China. The procedure was as follows: For genomic DNA extraction, samples were first removed from the refrigerator, 0.2–0.5 g of each sample was weighed into a centrifuge tube containing extraction lysis buffer, and then ground using a Tissuelyser-48 homogenizer (Shanghai Jingxin Industrial Development Co., Ltd., Shanghai, China). Nucleic acids were extracted from the pre-treated samples using the OMEGA Soil DNA Kit (D5635-02, Omega Bio-Tek, Norcross, GA, USA). After extraction, 0.8% agarose gel electrophoresis was used to estimate the molecular size of unknown DNA fragments based on their migration distance, and DNA concentration and purity were quantified using a Nanodrop instrument. Subsequently, PCR amplification was performed using genomic DNA as a template, targeting the selected sequencing regions. AOA was amplified with forward primer GACTACATMTTCTAYACWGAYTGGGC and reverse primer GGKGTCATRTATGGWGGYAAYGTTGG; AOB was amplified with forward primer GGGGTTTCTACTGGTGGT and reverse primer CCCCTCKGSAAAGCCTTCTTC; NOB was amplified with forward primer CAGACCGACGTGTGCGAAAG and reverse primer TCYACAAGGAACGGAAGGTC. After PCR amplification, the products were quantified using the Quant-iT PicoGreen dsDNA Assay Kit (Thermo Fisher Scientific Inc., Waltham, MA, USA), and the quantification was performed on a Microplate reader (BioTek Instruments Inc., Winooski, VT, USA, FLx800). The constructed library was then validated and sequenced. Bioinformatics analysis was performed with QIIME2 (version 2019.4) to denoise sequences into amplicon sequence variants (ASVs) and to determine their relative abundances. Alpha diversity indices (Chao1, Observed_species, Shannon, Simpson, Pielou_e, and Goods_coverage) were computed for each sample within the QIIME2 environment. Taxonomic assignment of ASVs provided the species composition for each sample across six levels: phylum, class, order, family, genus, and species. Taxonomic composition and abundance profiles were exported from QIIME2. Detailed methods are available in Liu’s research [29].

2.4. Data Calculation

Protein yield denotes the total protein mass harvested per unit land area. The specific formula is as follows:
Protein yield (kg/ha) = grain yield (kg/ha) × protein content (%)
Nitrogen uptake efficiency (NUE) represents the amount of N absorbed by the aboveground plant per 1 kg of N fertilizer applied, and the specific formula is as follows:
NUE (kg/kg) = Aboveground N accumulation (kg/ha)/N application rate (kg/ha)

2.5. Statistical Analysis

One-way analysis of variance (ANOVA) was performed using SPSS 25 software (SPSS 25.0, IBM, Armonk, NY, USA), followed by multiple comparisons using the least significant difference (LSD) test at the p < 0.05 significance level. The figures were generated with OriginPro 2022 (OriginLab Corporation, Northampton, MA, USA). Redundancy analysis (RDA) to visualize the relationship between the microbial community and soil environmental factors was performed using the Wekemo Wekincloud bioinformatics platform (https://www.bioincloud.tech, accessed on 9 November 2025.).

3. Results

3.1. Alpha Diversity of Rhizospheric Nitrogen-Transforming Microbes

3.1.1. Ammonia-Oxidizing Archaea

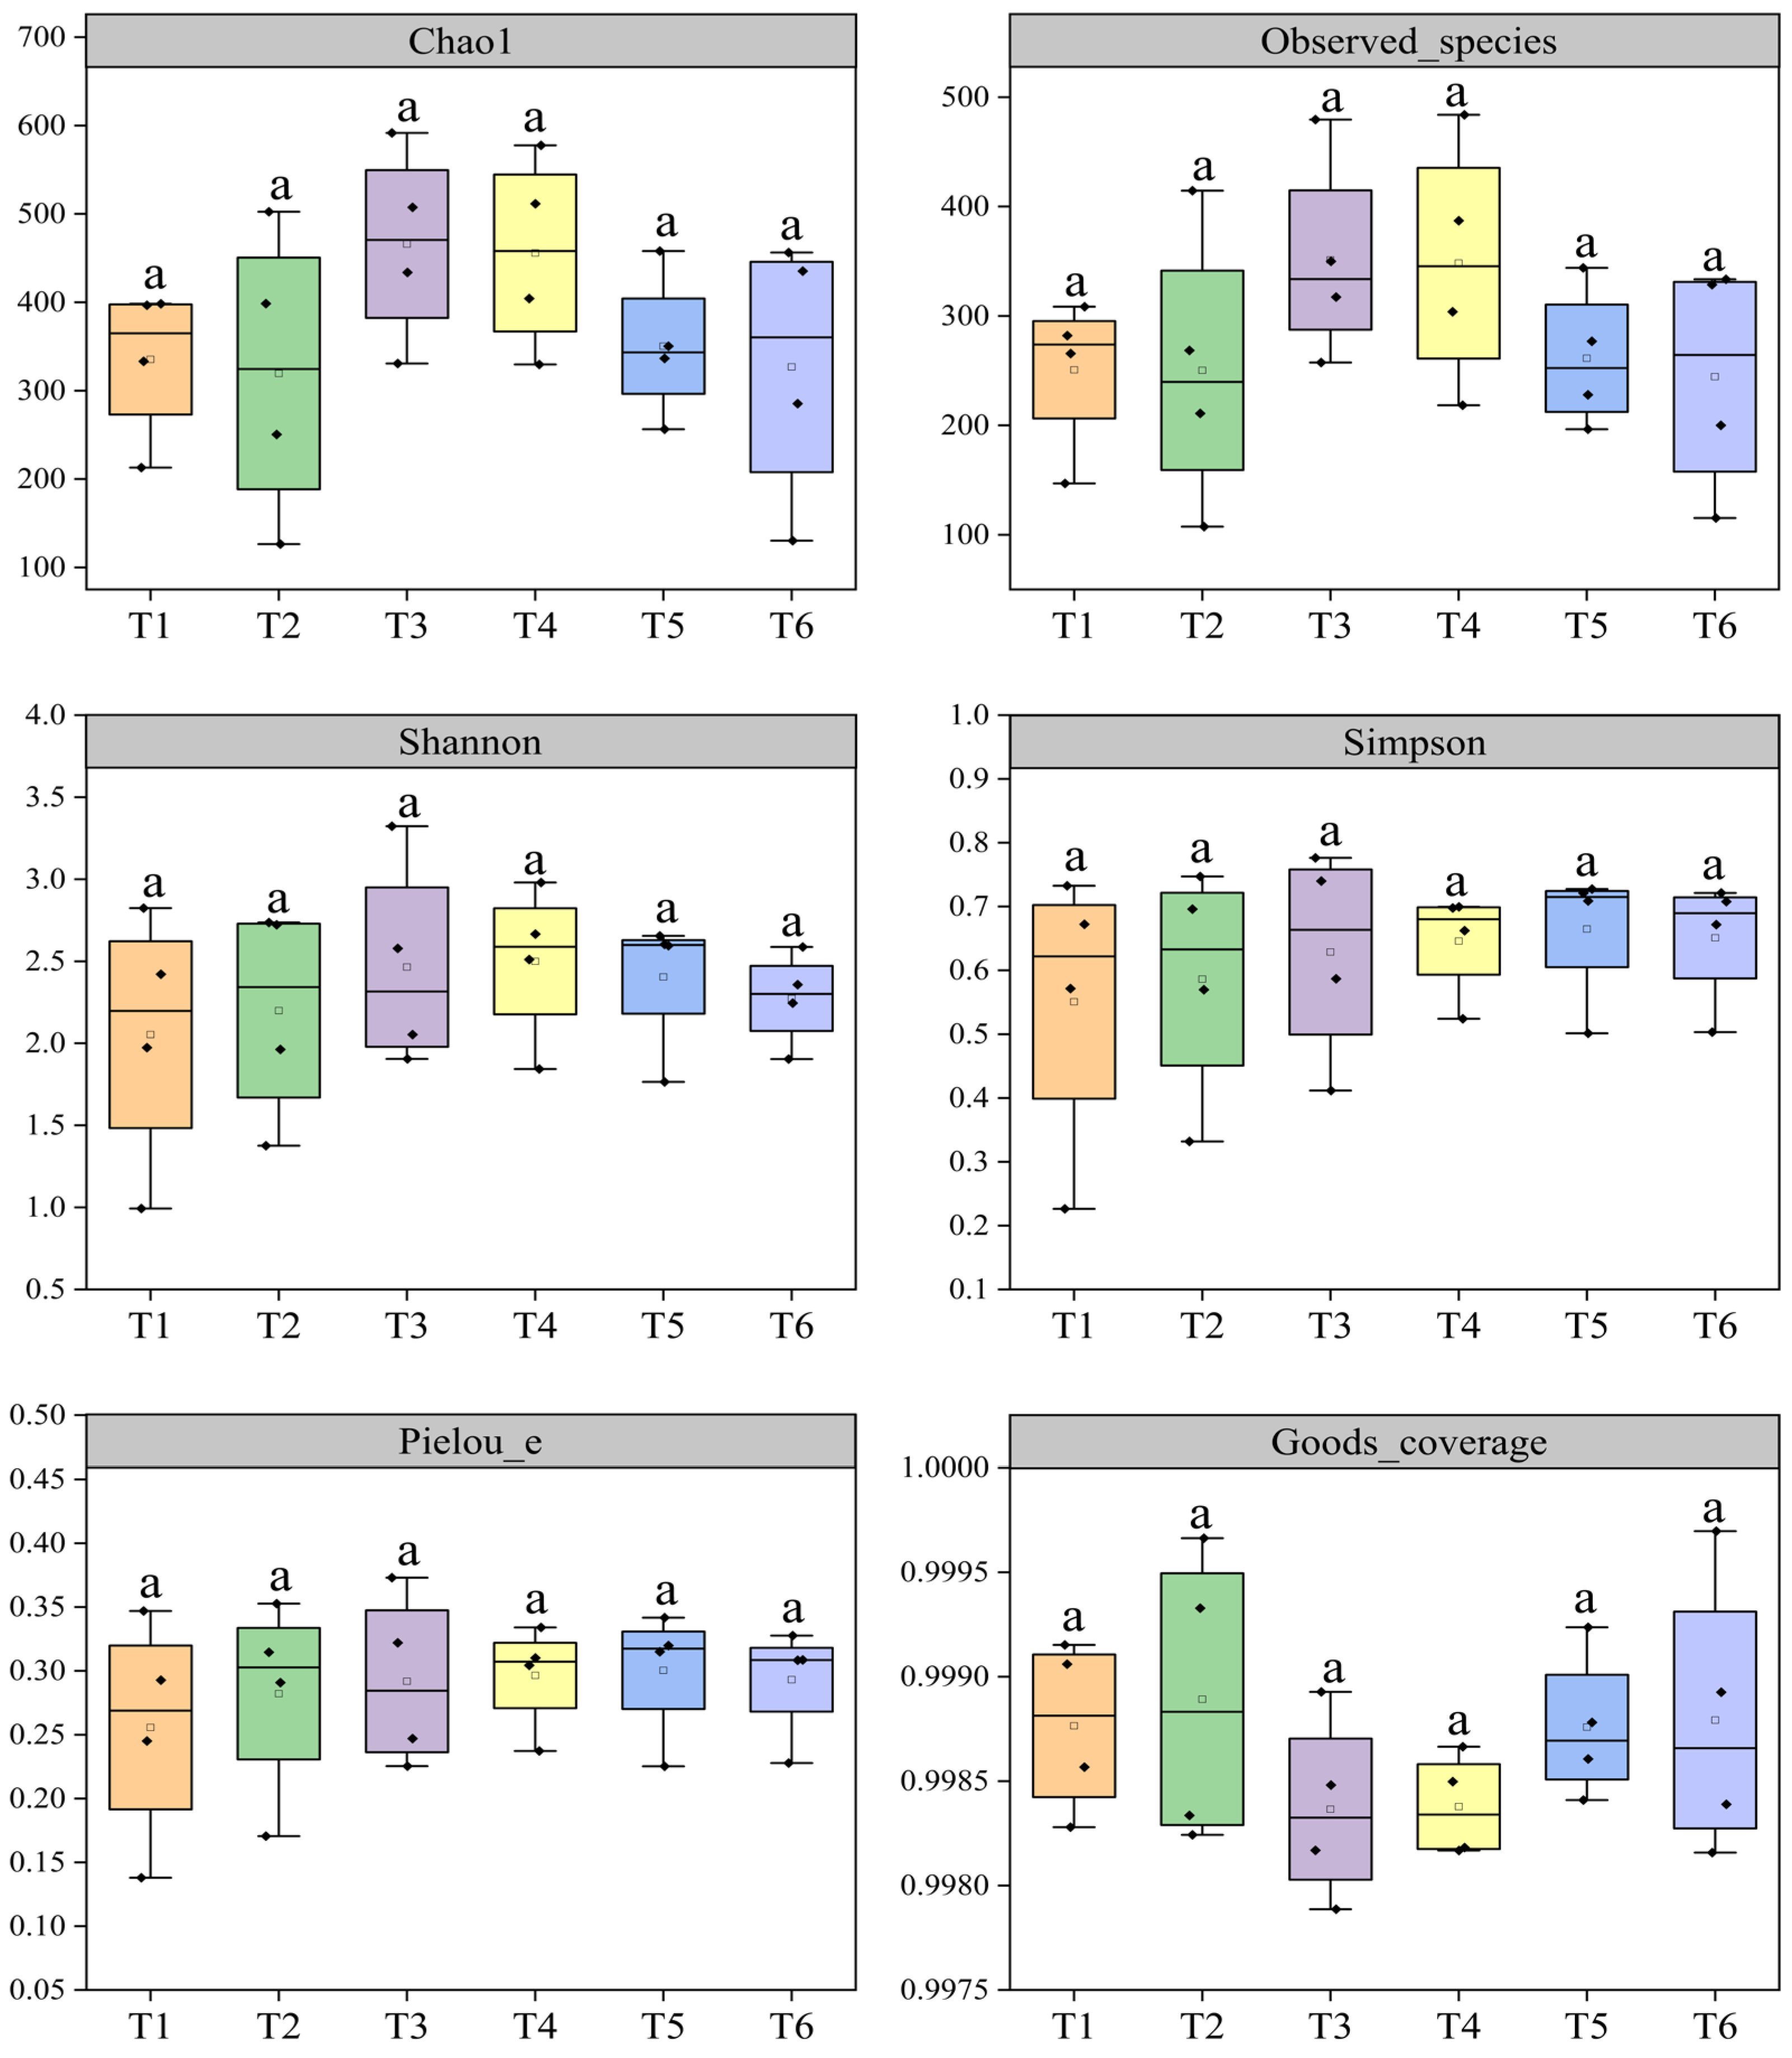
The Goods_coverage values of ammonia-oxidizing archaea (AOA), all greater than 99% across treatments, confirm that the sequencing depth was sufficient to capture the microbial diversity, ensuring the reliability of the results. No significant differences were observed in the Chao1, Observed_species, Shannon, Simpson, and Pielou_e indices, suggesting that splitting foliar N spray did not significantly alter the Alpha diversity of the rhizosphere AOA community (Figure 1).

3.1.2. Ammonia-Oxidizing Bacteria

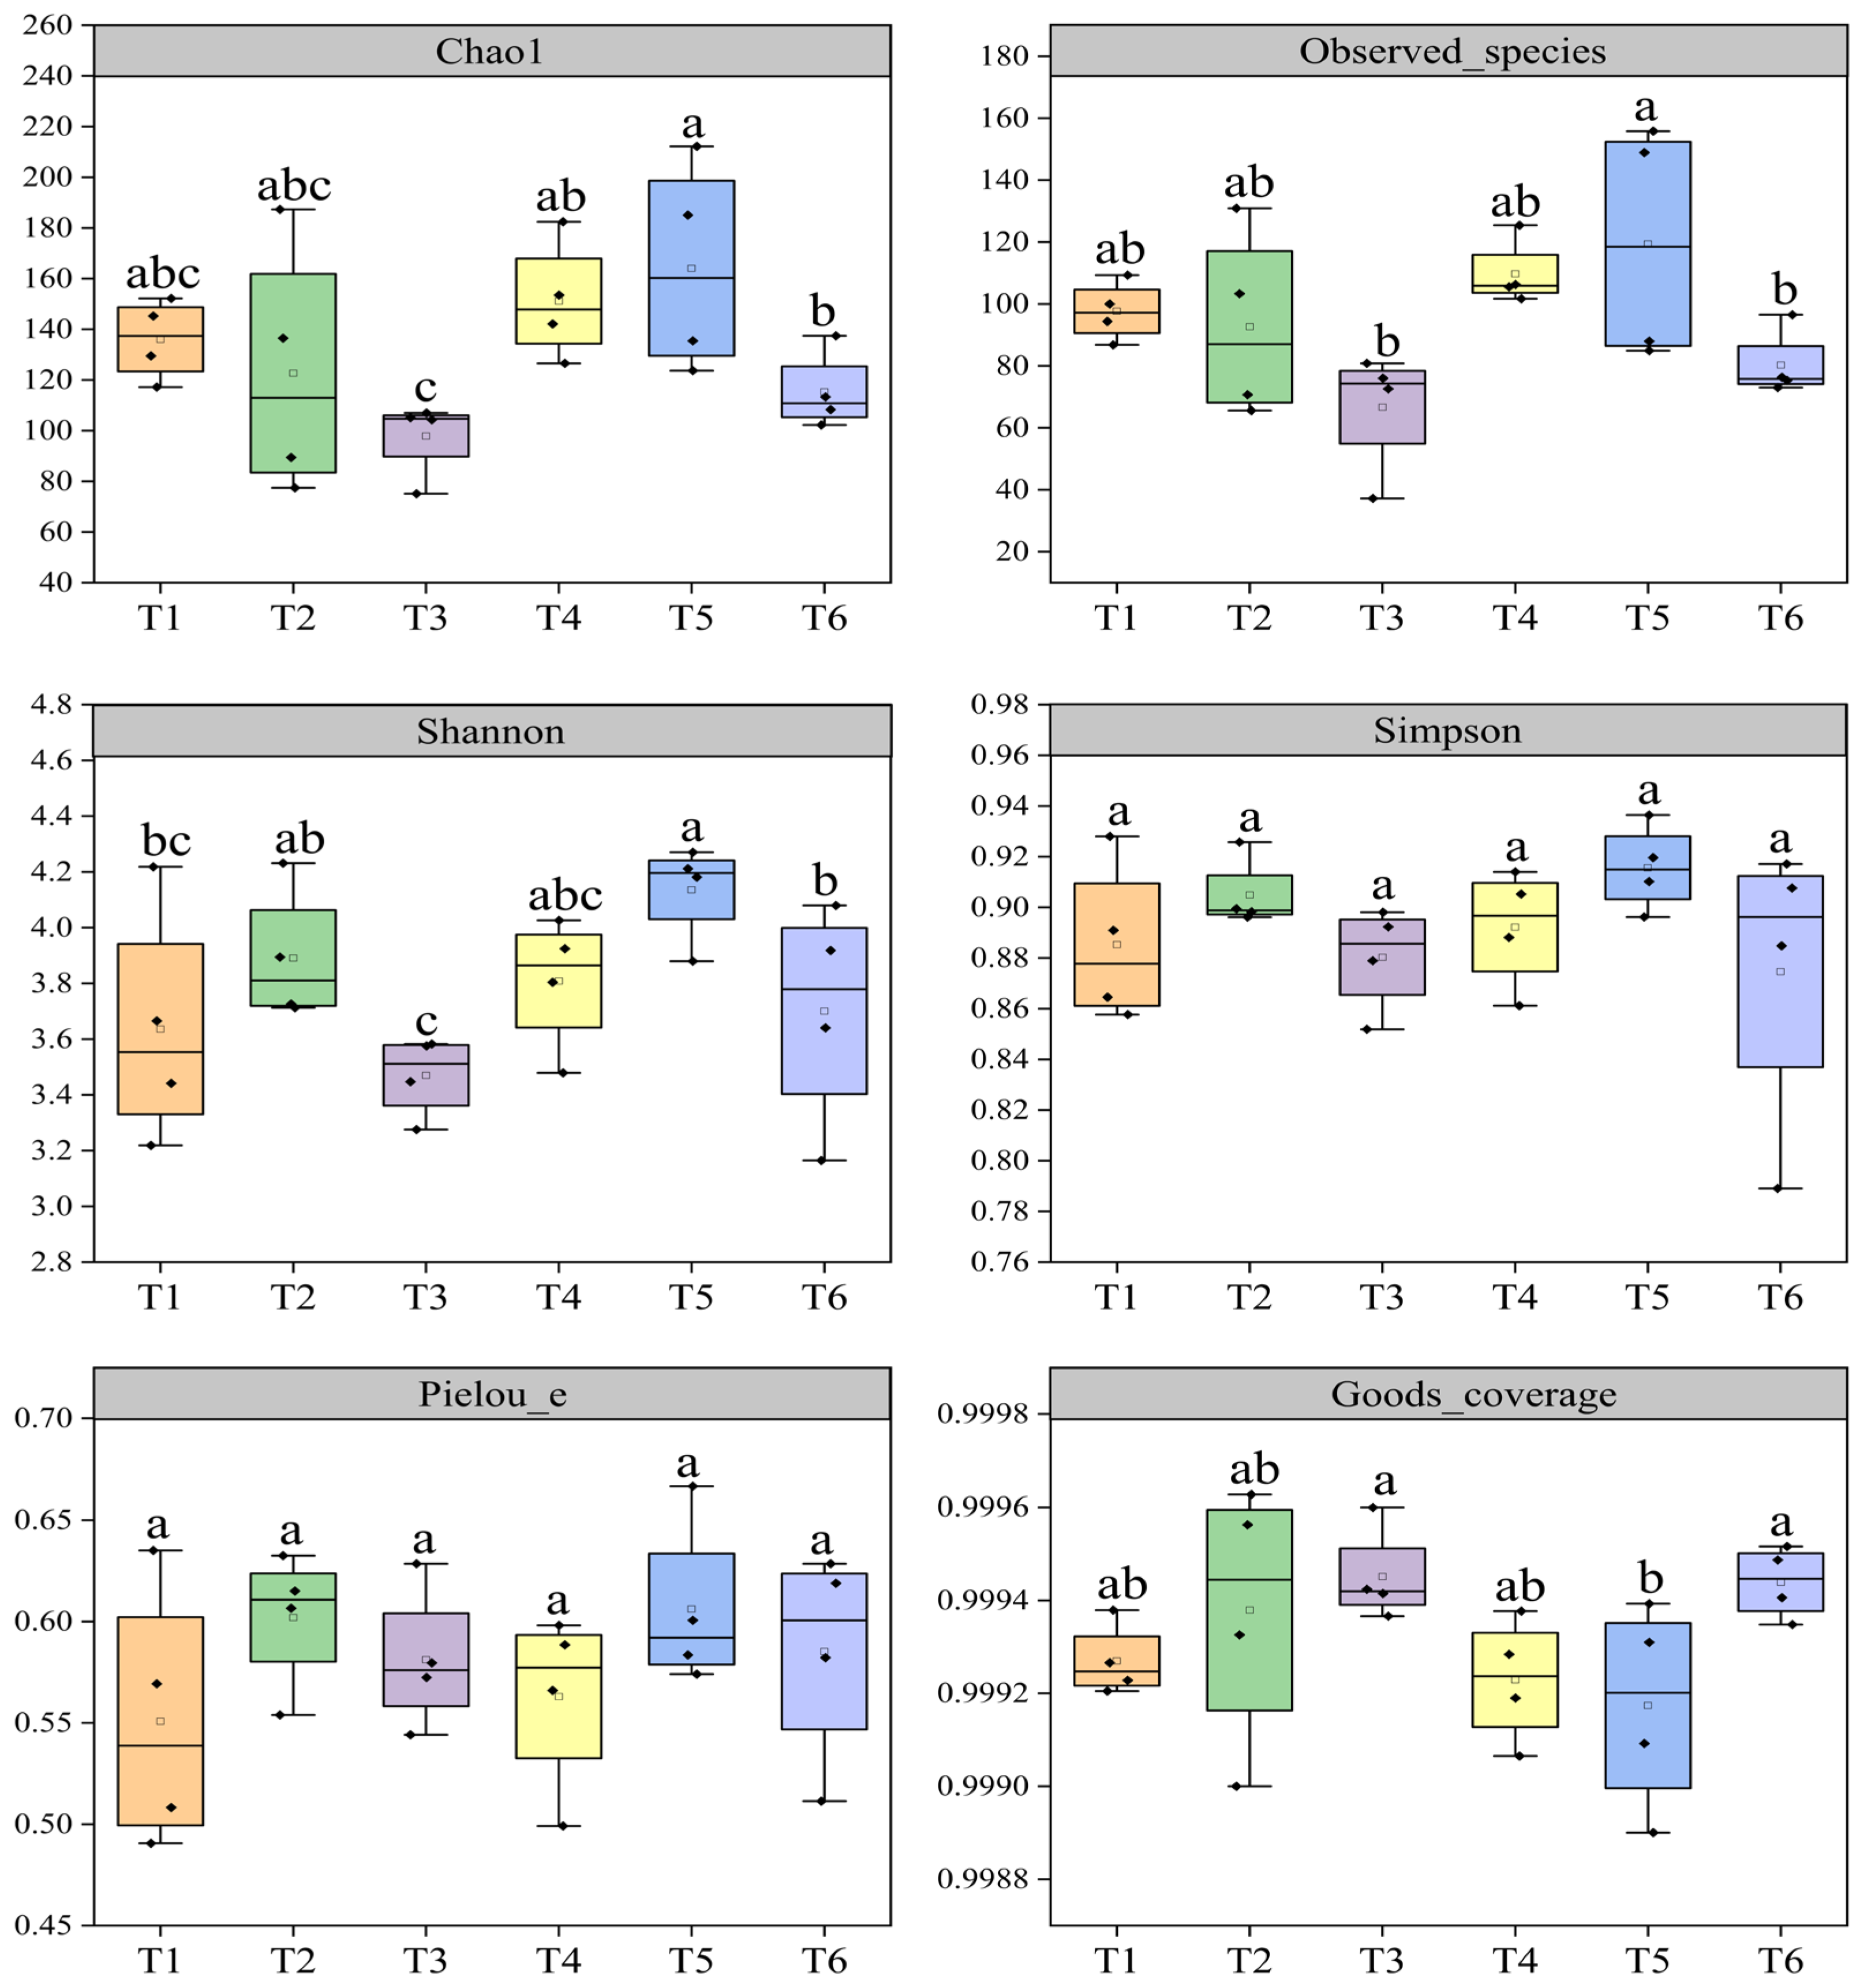
T5 showed a significantly higher Chao1 index compared to T6, while both T6 and T4 had significantly greater Chao1 indices than T3 (Figure 2). This suggests that foliar N spraying at flowering led to significantly higher bacterial ASV richness than spraying 15 days post-anthesis. Furthermore, spraying at booting or 10 days after anthesis resulted in greater ASV richness than the treatment with reduced soil N. The Observed_species index was significantly lower in T3 and T6 than in T5, demonstrating that both the reduced soil N and the late post-anthesis foliar spray treatments resulted in lower bacterial species richness than the foliar application at flowering. The Shannon index was significantly higher in T5 than in T6, and the Chao1 index was higher in T6 and T4 than in T3. These results indicate that bacterial community richness and evenness were significantly greater with foliar N at flowering compared to the later application. Moreover, foliar sprays at booting and 10 days after anthesis led to higher ASV richness and evenness than those under the low-N treatment. No significant differences were found for the Simpson and Pielou_e indices, suggesting that the overall diversity and evenness of the bacterial communities did not differ significantly among the treatments.

3.1.3. Nitrite-Oxidizing Bacteria

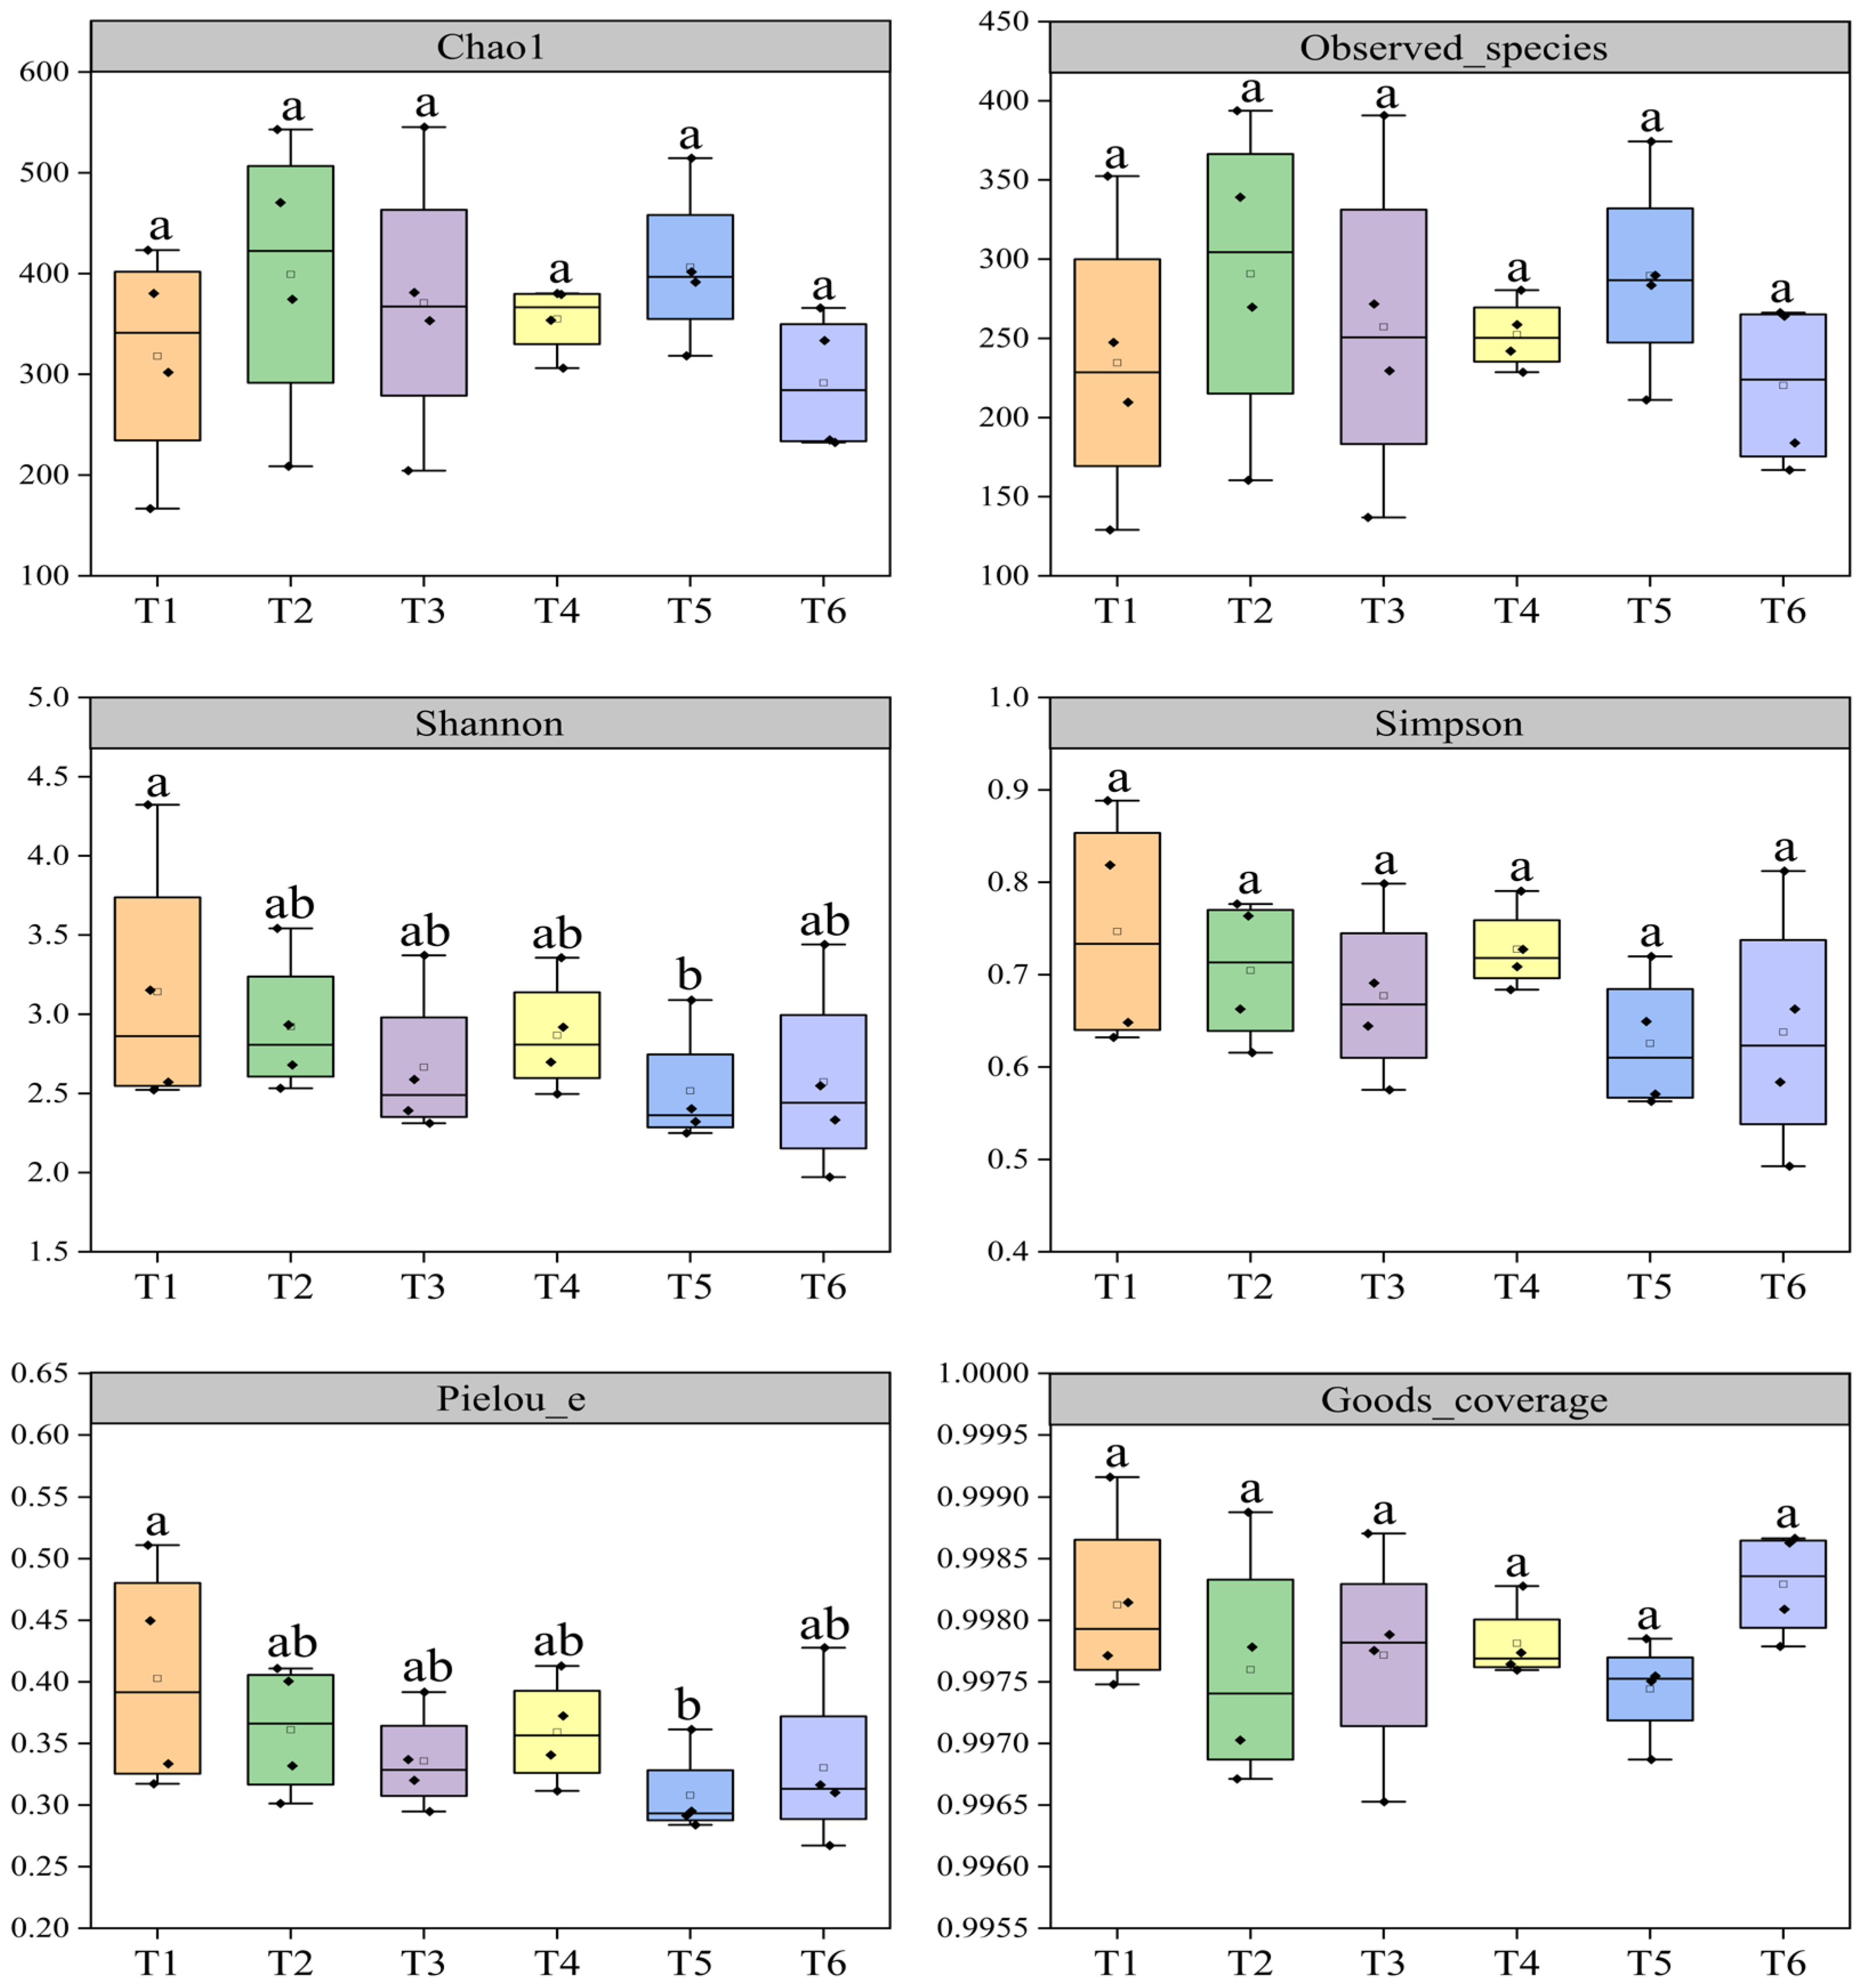
T1 showed significantly higher Shannon and Pielou-e indices than T5 (Figure 3). This demonstrates that the NOB community under the no-N treatment possessed significantly higher richness, evenness, and diversity than under the foliar spray treatment at anthesis. Thus, foliar N application at anthesis decreased NOB community richness and genetic diversity relative to the no-nitrogen treatment. No significant differences in these indices were found among the treatments that received foliar N at different timings. This indicates that the timing of the foliar N application did not significantly influence the Alpha diversity of the rhizosphere NOB community.

3.2. Community Structure of Rhizospheric Nitrogen-Transforming Microbes

3.2.1. Ammonia-Oxidizing Archaea

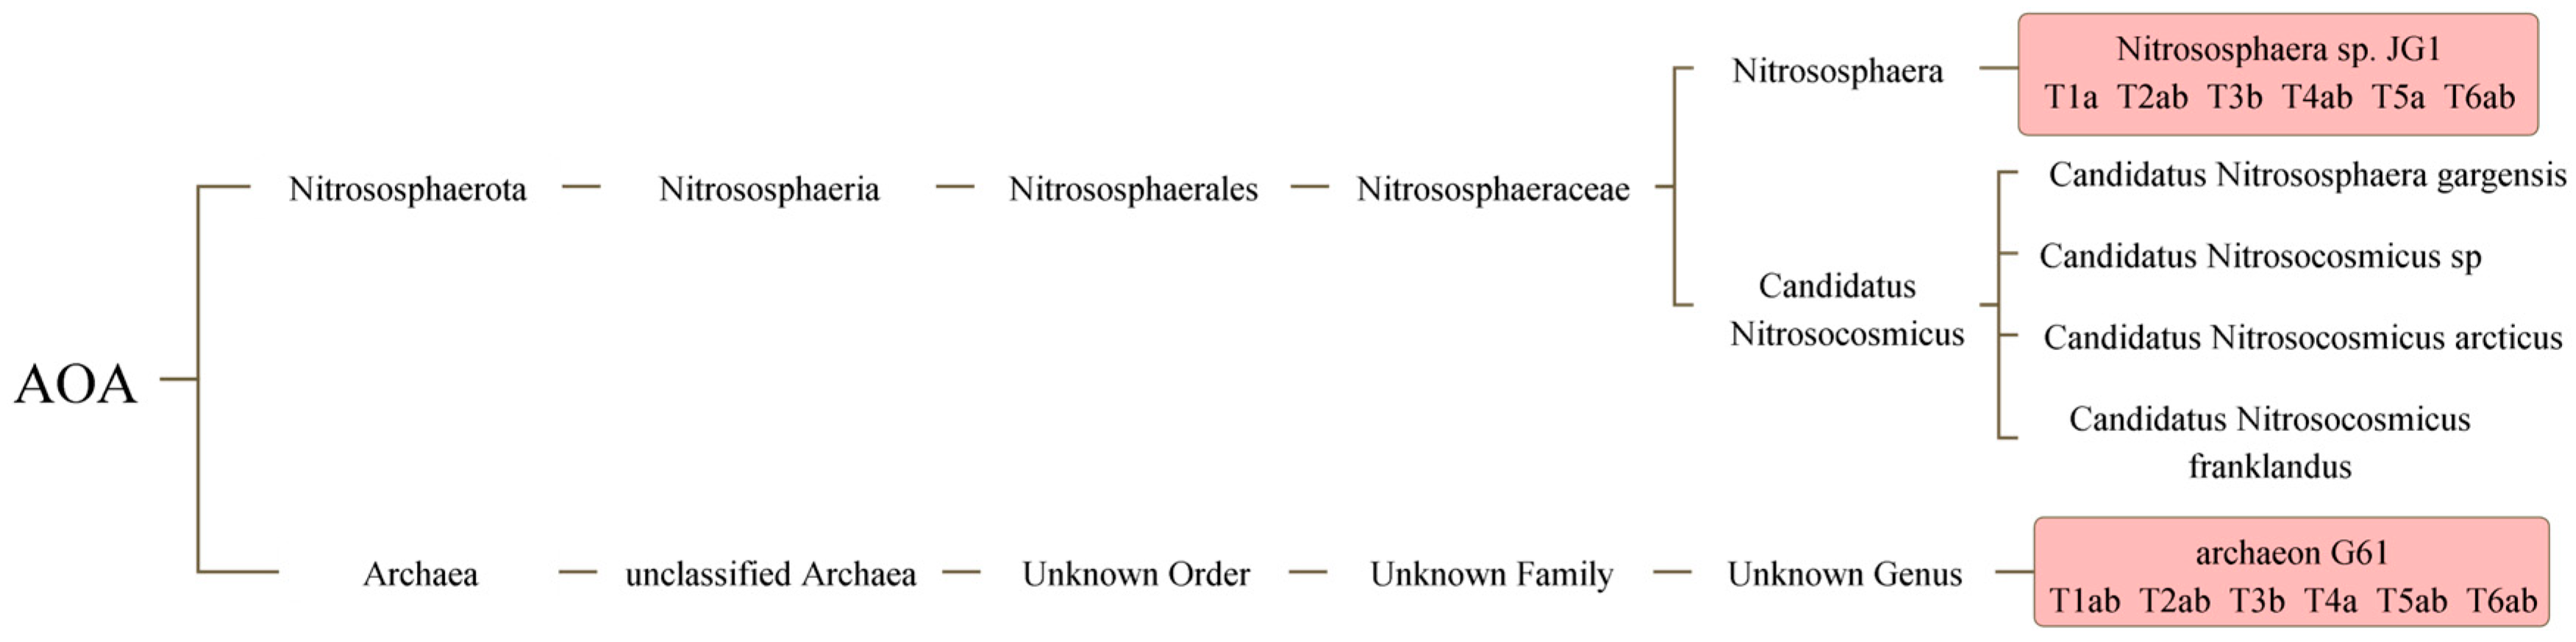
Composition and relative abundance tables for AOA were compiled across six taxonomic ranks (phylum to species) (Figure 4 and Figure S1). Within the top 20 most abundant taxa at each level, Nitrososphaerota (formerly Thaumarchaeota) was the sole phylum identified as AOA. Taxa were sorted at the phylum level and aggregated according to their lineage for visualization, as shown in Figure 4 below. The relative abundances of the phylum Nitrososphaerota, class Nitrososphaeria, order Nitrososphaerales, family Nitrososphaeraceae, genus Nitrososphaera, and the candidate genus Candidatus Nitrosocosmicus did not differ significantly across treatments. The relative abundance of Nitrososphaera sp. JG1 (N. sp. JG1) was significantly higher in T1 and T5 than in T3. This suggests that soil N application at jointing (T3) decreased its abundance relative to the no-N treatment (T1), while foliar N application at flowering (T5) reversed this effect, restoring its abundance to a level similar to T1. The relative abundances of the candidate species Ca. N. gargensis, Ca. N. sp., Ca. N. arcticus, and Ca. N. franklandus showed no significant variation among the N management treatments.
No significant treatment effects were found for the relative abundances of the phylum Archaea and the unclassified archaeal class. T4 exhibited a higher relative abundance of archaeon G61 compared to T3, suggesting that foliar N supplementation at the booting stage facilitated the enrichment of this archaeon.

3.2.2. Ammonia-Oxidizing Bacteria

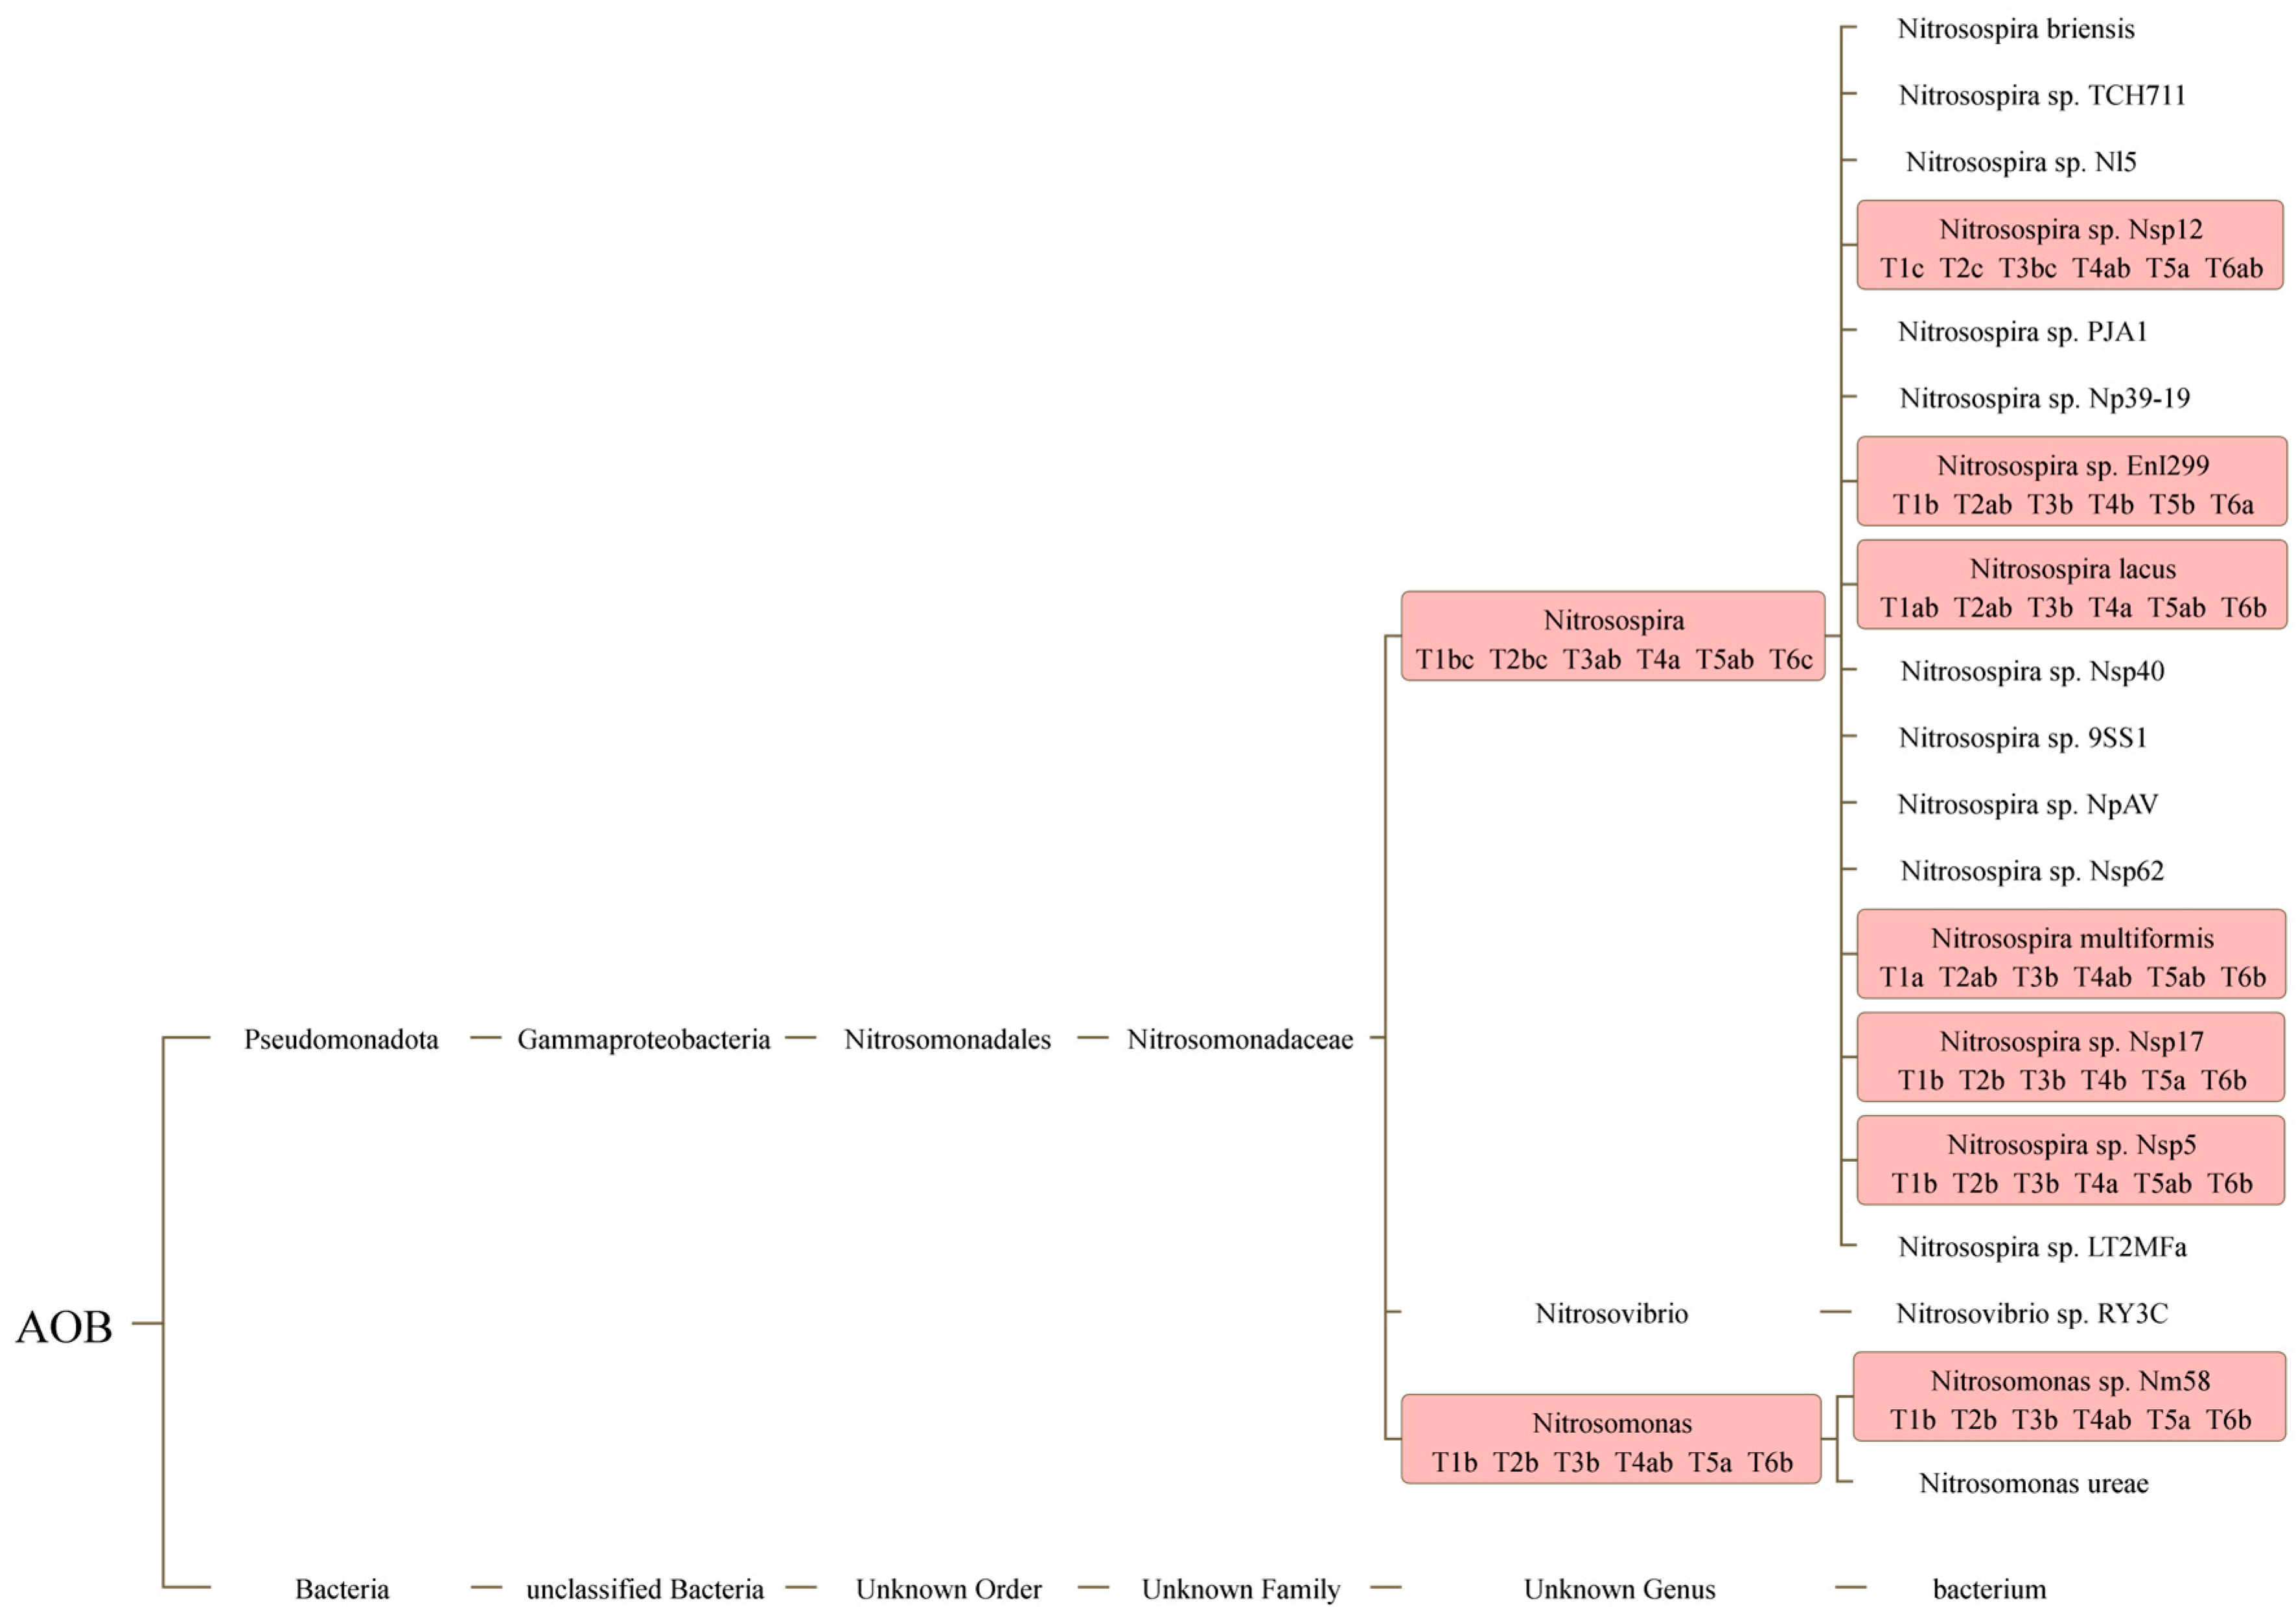
Composition and abundance tables for AOB were generated at six taxonomic levels (Figure 5 and Figure S2). Within the top 20 most abundant taxa at each level, Pseudomonadota (a phylum within Proteobacteria) was the sole phylum representing AOB. Taxa were sorted at the phylum level and visualized according to their taxonomic hierarchy, as shown in Figure 5. No significant differences were found among treatments for the relative abundances of the domain Bacteria, unclassified Bacteria at the class level, or the unspecified bacterium.
The relative abundance of Nitrosospira was significantly greater in T4 than in T1, T2, and T6, and greater in T3 and T5 than in T6. This suggests that shifting part of the N to foliar sprays at booting or flowering stages enriched Nitrosospira, whereas a later spray at 10 days post-anthesis brought its abundance back to the level seen without late foliar N. Nitrosospira sp. Nsp12 (N. sp. Nsp12) was more abundant in T5 than in T1, T2, and T3, and more abundant in T4 and T6 than in T1 and T2, demonstrating that foliar N application during later growth stages significantly stimulated this species. Nitrosospira sp. EnI299 was significantly more abundant in T6 than in T1, T3, T4, and T5, indicating that foliar spraying 10 days after anthesis specifically enriched this species compared to earlier spray timings. The relative abundance of Nitrosospira lacus was higher in T4 than in T3 and T6; its abundance under foliar N at the booting stage was significantly greater than under application at 10 days after anthesis.
The relative abundance of Nitrosospira multiformis was higher in the control (T1) than in T3 and T6. Nitrosospira sp. Nsp17 was most abundant in T5, significantly more so than in any other treatment, indicating that foliar N at anthesis specifically enriched this species. The relative abundance of Nitrosospira sp. Nsp5 was higher in T4 than in T1, T2, T3, and T6. This reinforced that postponing N to foliar application at booting or flowering increased Nitrosospira abundance, but delaying it to 10 days after anthesis reduced it to the level without late foliar N. Both Nitrosomonas and Nitrosomonas sp. Nm58 were more abundant in T5 than in T1, T2, T3, and T6. This showed that postponing N to foliar application at flowering significantly increased their abundances, whereas the latest application timing did not.

3.2.3. Nitrite-Oxidizing Bacteria

For each taxonomic rank, bar charts were generated for the 20 most abundant bacterial taxa (Figure 6 and Figure S3). Only two phyla, Nitrospirota and Pseudomonadota, were classified as NOB. Taxa were sorted at the phylum level and visualized according to their taxonomic hierarchy, as shown in Figure 6. The candidate species Candidatus Nitrospira inopinata (Ca. N. inopinata) was more abundant in T1 than in T5, indicating that foliar N spray at anthesis significantly decreased its relative abundance relative to the no-N treatment. The unspecified bacterium showed a higher relative abundance in T5 compared to T1.

3.3. Redundancy Analysis of Nitrogen-Transforming Microbes and Soil Properties in Rhizosphere

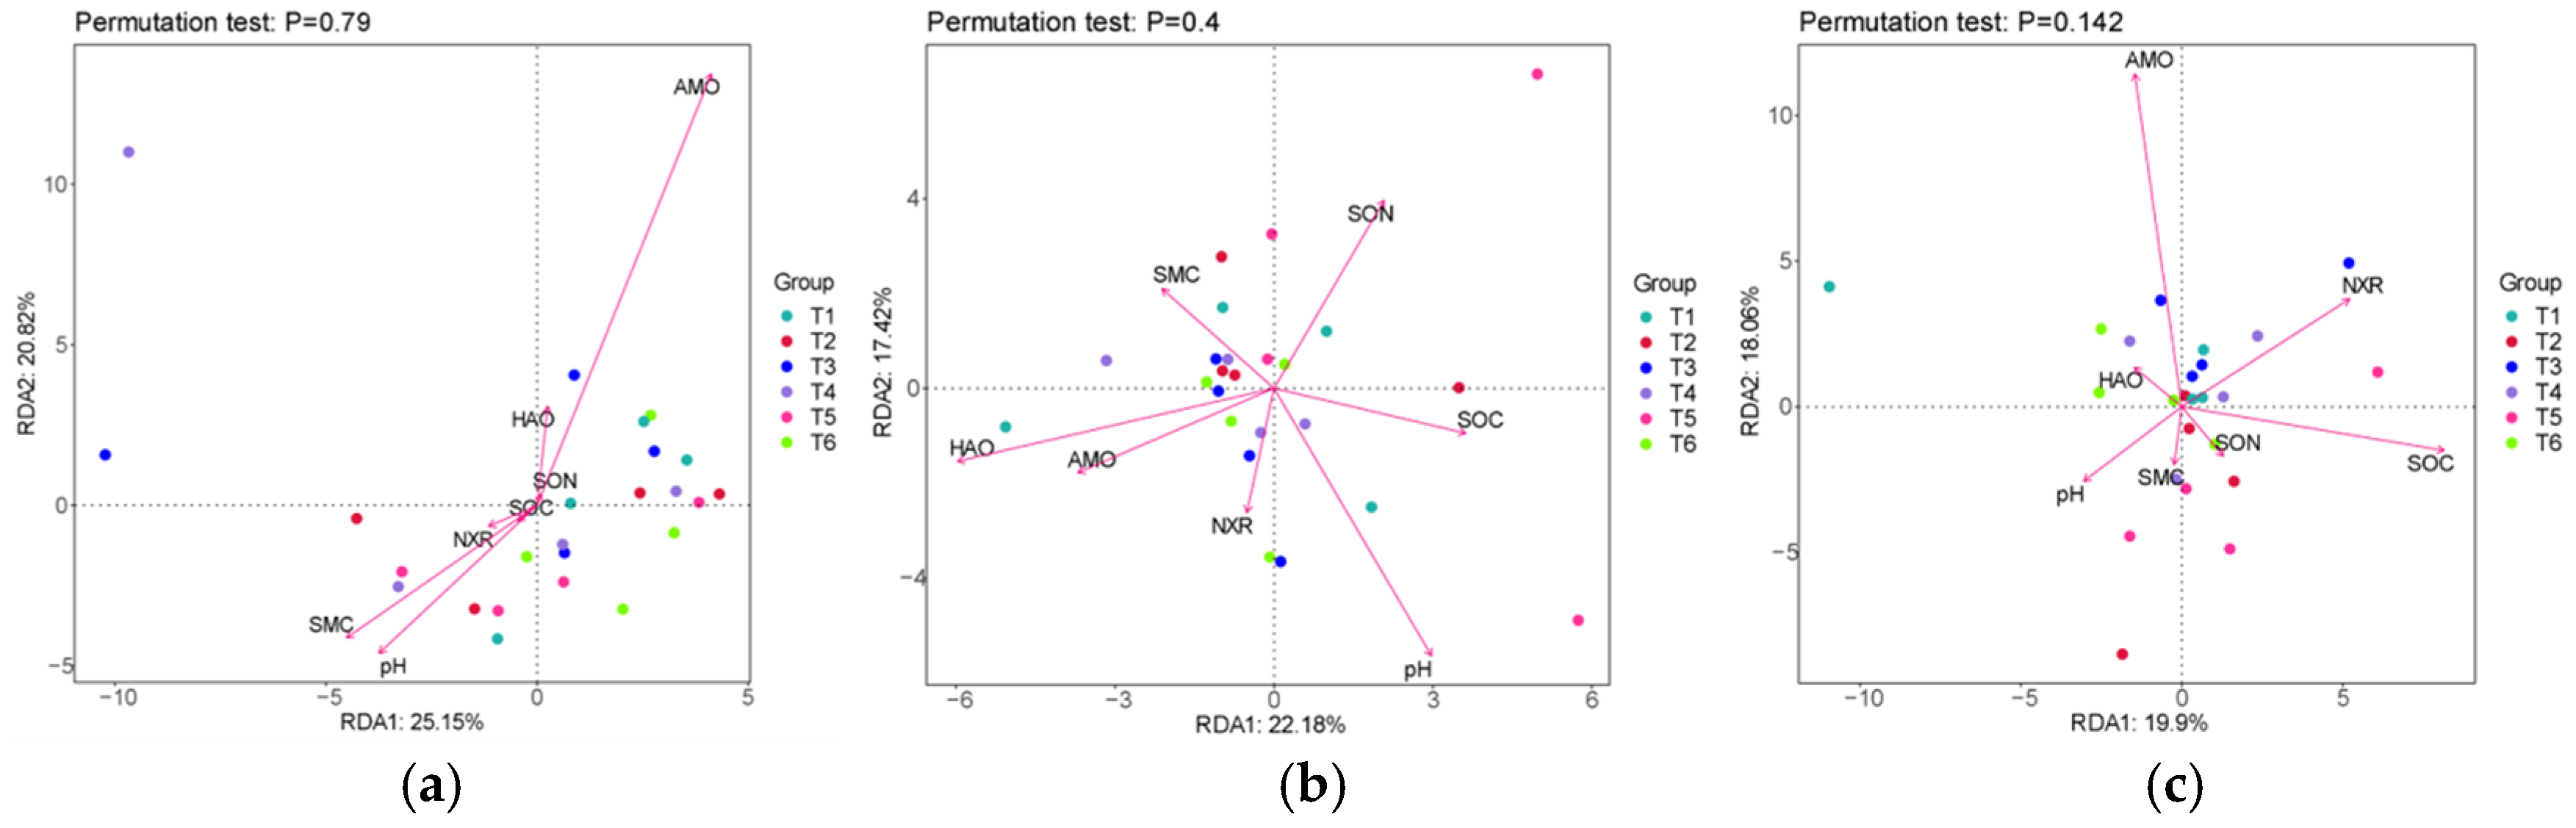
RDA at the ASV level for the rhizosphere AOA community and soil chemical properties showed that RDA1 explained 25.15% of the species variation, and RDA2 explained 20.82% (Figure 7a). SMC (R2 = 0.265, p = 0.037), pH (R2 = 0.257, p = 0.048), and AMO (R2 = 0.609, p = 0.001) were identified as significant drivers of AOA community variation, showing strong correlations with community composition. SOC, STN, HAO activity, and NXR activity did not significantly influence AOA community distribution.
For the AOB community, RDA1 and RDA2 explained 22.18% and 17.42%, respectively, of the compositional variation (Figure 7b). pH (R2 = 0.362, p = 0.018), AMO activity (R2 = 0.233, p = 0.049), and HAO activity (R2 = 0.350, p = 0.012) were three important environmental factors associated with AOB variation and showed significant correlations with the rhizosphere AOB community structure. STN also had a slight influence on AOB community (p = 0.056).
Analysis of the NOB community showed that RDA1 and RDA2 explained 19.90% and 18.06% of the species variation, respectively (Figure 7c). SOC (R2 = 0.420, p = 0.011), AMO activity (R2 = 0.584, p = 0.0005), and NXR activity (R2 = 0.324, p = 0.013) were significant factors driving NOB community variation. In contrast, SMC, STN, pH, and HAO activity did not show a significant influence on the NOB community distribution (p > 0.05).

3.4. Yield, Grain Quality, and Nitrogen Utilization

Yield, quality parameters, and N utilization metrics for winter wheat under different N timing strategies are presented in Table 2. Split N application maintained stable grain yields, which varied between 8067.50 kg/ha and 9344.02 kg/ha, while protein yield ranged from 396.65 to 1142.42 kg/ha. N fertilization significantly boosted grain yield by 40.33–45.01% and protein yield by 60.62–80.72% compared to the no-nitrogen treatment. While yields and protein yields did not differ significantly among N treatments, the foliar application at 10 days post-anthesis resulted in the numerically highest values, securing yield and protein output at levels equivalent to those without late-season N supplementation. N application significantly enhanced aboveground N uptake by 66.13–98.29% compared to the control. Foliar N applied 10 days after anthesis resulted in the highest N uptake, although the difference was not significant relative to the single basal application or other topdressing schedules. The NUE across treatments ranged from 1.09 to 1.27 kg/kg. Foliar N application at 10 days after anthesis ensured that winter wheat maintained a relatively high level of N uptake efficiency.

3.5. Correlation Analysis Between Nitrogen-Transforming Microbes and Crop

A positive, albeit non-significant, trend (R > 0.3) was observed between both the Pielou_e and Simpson indices and grain yield and protein yield, indicating a potential positive link between AOA community evenness and crop productivity (Table 3). For AOB, the Pielou_e index showed significant positive correlations with grain yield (R = 0.409, p < 0.05), protein yield (R = 0.488, p < 0.05), and aboveground N uptake (R = 0.440, p < 0.05). These results suggest that greater evenness in the AOB community is beneficial for yield formation, protein accumulation, and N acquisition in the crop. Multiple alpha-diversity indices of the NOB community were significantly negatively correlated with grain yield and protein yield. Additionally, while NOB diversity indices showed a negative trend with N uptake and N uptake efficiency, these relationships were not statistically significant. These findings suggest that, in this study context, higher diversity and evenness within the NOB community were linked to reduced crop yield and grain quality.
Within the AOA community, the relative abundance of archaeon G61 showed negative trends with all crop performance metrics, though these correlations were not significant (p > 0.05) (Table 4). N. sp. JG1 abundance was significantly negatively correlated with grain yield (p < 0.05) and exhibited non-significant negative correlations with protein yield, aboveground N uptake, and N uptake efficiency. These results indicate that an increase in the abundance of certain AOA taxa may be detrimental to crop productivity and N use.
The relative abundances of Nitrosospira and Nitrosomonas within the AOB community showed positive, yet non-significant, associations with all crop metrics. N. sp. Nsp12 exhibited a highly significant positive correlation with aboveground N uptake (p < 0.01) and a significant positive correlation with protein yield (p < 0.05), indicating its potential key role in enhancing N acquisition and yield components. The relative abundance of Nitrosospira multiformis was negatively correlated with all crop performance indicators. It showed a strong negative correlation with yield (p < 0.01) and a significant negative correlation with protein yield (p < 0.05), suggesting that a higher abundance of this species could suppress crop yield and N uptake.
In the NOB community, the relative abundance of the unclassified bacterium was significantly positively correlated with yield, protein yield (p < 0.05), and N uptake efficiency, and showed a positive trend with aboveground N uptake. Conversely, Ca. N. inopinata abundance was negatively associated with all crop indicators, demonstrating significant negative correlations with protein yield, aboveground N uptake, and N uptake efficiency.

4. Discussion

4.1. Effects of Split Nitrogen Application on Rhizospheric Nitrogen-Transforming Microbes

Split N application is an important management practice in crop production, exerting a significant impact on nitrifying communities within agricultural systems. Understanding how microbially mediated nitrification responds to N application helps assess fertilization efficiency and its environmental implications [30]. AOA and AOB are the primary mediators of ammonia oxidation, and shifts in their community composition directly affect nitrification rates [31], with important consequences for soil fertility and crop productivity [32]. Our results showed that N application strategies did not significantly alter the Alpha diversity of the rhizosphere AOA community, but significantly affected the alpha diversity of the AOB and NOB communities in the winter wheat rhizosphere. This would be attributed to the preference of AOA for oligotrophic and acidic environments, meaning N addition in the alkaline soil of this study did not drastically alter the AOA community [33]. Yuan’s study demonstrated that N application in acidic soils significantly affected the abundance and diversity of the AOA-amoA gene but not the AOB-amoA gene [34], which confirms the dominant role of AOA in regulating nitrification in acidic soils. The acid tolerance of AOA may be explained by their reportedly higher substrate (NH3) affinity compared to AOB [35]. Under acidic conditions where ammonia is predominantly protonated (NH4+), the available substrate concentration is low, favoring AOA with their high affinity [36]. Additionally, AOA possess unique biochemical and genetic characteristics that enable adaptation to low pH and oligotrophic conditions [37,38]. The Alpha diversity of AOB showed that foliar N spray at anthesis led to greater community richness and diversity than the later application. This demonstrates that AOB are more sensitive to N fertilization in agricultural soils compared to AOA, with their activity and community composition being more responsive [39]. It is established that AOA dominate nitrification in acidic soils, while AOB are the key drivers in neutral-alkaline soils—a finding supported by our study [40]. Given AOB’s preference for nutrient-rich, alkaline conditions, N management significantly influenced their community dynamics [41]. NOB Alpha diversity indicated that foliar N application at flowering significantly decreased community richness and evenness compared to the no-nitrogen treatment. Kong et al. reported a significant decrease in the abundance of Nitrobacter and Nitrospira NOB in fertilized plots, aligning with our observations [42]. A potential explanation is that NOB, responsible for the second nitrification step, depend on nitrite supplied by AOA and AOB, possibly leading to a delayed response to environmental perturbations [43]. Additionally, urea hydrolysis can transiently inhibit NOB growth and activity while accumulating nitrite [44], which could also explain the observed decline in NOB diversity and abundance.
The rhizosphere AOA community exhibited a simple structure in this experiment. While N topdressing at anthesis significantly altered the relative abundance of N. sp. JG1, no marked changes were observed for Nitrosopumilales and N. sp. JG1 across treatments receiving the same total N, reinforcing the notion of limited shifts in AOA community abundance in the alkaline soil of this study. Analysis of the AOB community identified Pseudomonadota as the most relatively abundant dominant phylum. Notably, the relative abundances of Nitrosospira and Nitrosomonas were significantly influenced by the timing of N application. Foliar N supplementation at booting enriched these genera, markedly boosting their relative abundance. Research by Zhao et al. demonstrated that N addition elevates the relative abundance of copiotrophs like Pseudomonadota, and enriches nitrifiers such as Nitrosomonas and Nitrosospira under high N conditions [45]. The findings of this experiment are consistent with the aforementioned conclusion. Foliar N application did not significantly alter the relative abundance of NOB in our study, corroborating Ouyang et al.’s report that N fertilization, regardless of source, does not influence the relative abundance of the NOB genus Nitrospira [46].
Environmental parameters, including soil pH, water content, nutrient availability, and enzyme activities, are critical factors shaping microbial growth and community dynamics [47,48,49]. RDA indicated that soil pH is a major determinant of the community composition for AOA, AOB, and NOB. The analysis also confirmed the established finding that AOB outcompete AOA in alkaline environments [34,50,51]. The key drivers varied for each functional group. AOA community structure was additionally shaped by SMC and SOC. AOB community dynamics were tightly linked to enzymatic activities in nitrification, like HAO. NOB community was influenced by a combination of SMC, SOC, pH, and NXR activity. Studies have shown that N addition under low-soil-moisture conditions can promote the accumulation of NH4+-N, thereby stimulating the activity of ammonia-oxidizing microorganisms and nitrification [34]. After the increase in organic carbon, the absolute abundances of both AOA-amoA and AOB-amoA genes increased significantly, supporting the regulatory role of soil organic carbon on nitrogen-transforming microbial communities [52]. The mineralization of organic matter can continuously produce low concentrations of NH3, meeting the growth requirements of AOA and serving as the primary substrate for ammonia oxidation, thereby stimulating AOA growth and enhancing AOA community diversity [53]. Similarly, an increase in SOC content can provide the energy and nutrients required for microbial proliferation, and AOB communities tend to thrive in nutrient-rich soils, thereby altering the AOB community structure [54]. Moreover, complete ammonia oxidizers (Comammox) have been identified, which harbor the genetic machinery for AMO, HAO, and NXR, allowing them to catalyze the complete oxidation of ammonium to nitrate [55,56]. Canonical nitrification, however, is a two-step process: AOB oxidize ammonia to nitrite using AMO and HAO, and NOB subsequently oxidize nitrite to nitrate using NXR [57,58]. The key enzymes AMO, HAO, and NXR, which are specific to AOB and NOB, are vital intracellular components that govern the activity of these nitrogen-cycling microbes.

4.2. Effects of Split N Application on Yield, Protein, and N Utilization of Winter Wheat

Our findings identify foliar N application 10 days post-anthesis as a critical window for split N management to ensure both yield stability and quality enhancement in winter wheat. Although grain and protein yields did not differ significantly among N treatments, the foliar spray at 10 days post-anthesis produced the highest mean values, securing yields and protein output at a level equivalent to that achieved without late-season N supplementation. Research has shown that as the timing of foliar N application is delayed to 10 days after anthesis, the yield recovers to the level of treatments receiving the same total N but without late foliar application. Our results are consistent with this finding, indicating that while split and late foliar N application do not significantly increase wheat yield, they ensure yield stability [59]. Late-season N application enhances post-anthesis dry matter accumulation. Wheat grain yield is sourced roughly one-third from pre-anthesis assimilates remobilized from vegetative tissues and two-thirds from current post-anthesis photosynthesis and its allocation to grains; enhancing post-anthesis dry matter production is likely a key route to higher grain yield [60], a mechanism that requires further elucidation in our experimental context.
Further analysis indicates that the advantage of foliar N application lies in optimizing the N partitioning ratio, thereby highlighting the advantage in protein yield. Post-anthesis foliar N topdressing in winter wheat facilitates N redistribution and acquisition, leading to a 15–20% increase in the proportion of N partitioned to the grain, which consequently improves grain protein concentration and grain quality [5]. We observed that grain protein yield increased progressively with higher rates of N fertilization. Among the three foliar application timings, protein yield tended to increase with later application, peaking at 10 days after anthesis. This confirms foliar N application at 10 days after anthesis as the optimal timing for a split N strategy targeting yield stability and quality enhancement, which is consistent with the above conclusions. This phenomenon may be related to the decline in root activity during the late growth stages, while leaves maintain relatively high metabolic activity. Foliar N application efficiently supplements N nutrition, directly supporting protein synthesis and accumulation in developing grains [61]. A similar study also concluded that late foliar N application significantly boosted grain protein content over no-late-application controls, with the 10 days after anthesis yielding the highest levels [59]. Gooding et al. demonstrate that foliar N application at flowering or two weeks thereafter is more effective for elevating grain protein concentration [62]. Research on split N applications (e.g., jointing + anthesis foliar spray) has shown that delaying N application improves both yield and quality, which aligns with and strengthens our findings [20].
Postponing and splitting N application can improve N uptake efficiency [63]. Foliar N at 10 days after anthesis resulted in the highest aboveground N uptake of a 23.73% compared to a single application, which was consistent with Ge’s report [64]. This enhancement is likely mediated by direct leaf N assimilation facilitated by the foliar spray. At 10 days post-anthesis, which is the early grain-filling period, leaves exhibit high physiological activity. Foliar N fertilization can be swiftly absorbed directly by the leaves, thereby minimizing N immobilization in soil and losses due to leaching [65]. The waxy sorghum also confirmed that postponing N application to 10 days after anthesis significantly increased N accumulation [66], indicating that this pattern has generality across different crops. While split N application did not significantly raise N uptake efficiency, applications at anthesis and 10 days after anthesis showed improved efficiency over the booting stage application, with 10 days after anthesis being most effective. This suggests late foliar N aids in recuperating and optimizing N uptake capacity, which is consistent with previous research findings [67].

4.3. Effects of Rhizosphere Microbes on Crop Growth

This study found that the Alpha diversity of nitrogen-transforming microbes exhibited distinct association patterns with winter wheat yield, protein yield, and N uptake metrics. The Pielou_e and Simpson indices of AOA showed a positive, non-significant trend with both yield and protein yield. This aligns with Li and Guo‘s conclusion that AOA activity is limited in alkaline soils, leading to a weak link between its diversity and crop productivity [68]. As AOA’s contribution to nitrification is often subordinate to AOB’s in fertile agricultural soils, its diversity shows no significant correlation with yield [69]. The positive trend between the Pielou_e index and yield parameters suggests that AOA community evenness might indirectly benefit crop growth, potentially by contributing to overall community stability in the rhizosphere. Notably, the abundance of N. sp. JG1 was significantly negatively correlated with grain yield. These findings suggest that while overall AOA diversity may not directly influence productivity, elevated abundances of specific taxa can be detrimental, potentially due to N competition between some nitrifying archaea and plants under high N availability [33].
The AOB community exhibited significant correlations with crop performance metrics. A significant positive correlation was found between the AOB Pielou_e index and yield, protein yield, and aboveground N uptake, implying that greater evenness in the AOB community facilitates N transformation and plant acquisition. Positive correlations were found between the relative abundances of the genera Nitrosospira and Nitrosomonas in AOB community and all crop metrics, implying that their enrichment could be beneficial for crop performance. The significant associations with N. sp. Nsp12 underscore its pivotal role in N cycling. Higher abundance of this species signals enhanced ammonia oxidation, facilitating plant N acquisition. It may benefit plants via multiple mechanisms, including the production of enzymes, hormones, and inorganic phosphate solubilization [70]. Nitrosospira multiformis showed significant negative correlations with yield and protein yield, indicating that significant functional differences may exist among different species within the same genus.
In comparison, multiple NOB diversity indices showed negative correlations with all crop metrics, significantly so for yield and protein yield, indicating that higher NOB diversity may be unfavorable for crop productivity. A 20-year long-term study demonstrated that under mineral N fertilization, both AOB and NOB collectively govern nitrification rates, which are tightly linked to crop yield [71]. Their finding that NOB abundance correlates positively with nitrification rate but negatively with plant N uptake efficiency resonates with our observed negative correlation between NOB Shannon index and yield. This may be because NOB operate downstream in nitrification, relying on nitrite from AOA/AOB. Despite their joint role in setting nitrification rates, intricate interactions and niche partitioning occur among nitrifier populations. An overly abundant or active NOB community could accelerate the conversion to nitrate, elevating leaching potential and consequently reducing the efficiency of crop N utilization [43]. Within the NOB community, the unclassified Bacterium showed significant positive correlations with yield, protein yield, and N uptake efficiency. In contrast, Ca. N. inopinata was significantly negatively correlated with protein yield, aboveground N uptake, and N uptake efficiency. The complete nitrification capability of Ca. N. inopinata, a Comammox organism, could drive excessively fast N conversion, potentially outpacing the plant’s capacity for N assimilation [72]. The positive role of the unclassified bacterium might be linked to N mineralization processes. Bacteria associated with NOB could indirectly enhance plant N uptake by modulating the transformations between different soil N pools.

5. Conclusions

Microbial diversity responded in a functional group-specific manner. Alpha diversity of the AOA community was not significantly affected, whereas the diversity of both AOB and NOB communities was significantly altered by split N application. Notably, N application at anthesis enhanced the richness and diversity of the AOB community more than the later application, while concurrently reducing the evenness and diversity of the NOB community. The abundance of key functional taxa was modulated in a treatment-specific manner. Split N application significantly changed the relative abundance of indicator species within each microbial guild. For instance, the relative abundance of N. sp. JG1 in AOA community, the genera Nitrosospira and Nitrosomonas in AOB community, and Ca. N. inopinata in NOB community were all sensitive to the timing of N application. In particular, N application at the booting stage significantly enriched Nitrosospira and Nitrosomonas. The reassembly of microbial communities was closely linked to soil edaphic factors. RDA revealed that soil pH, SMC, SOC, and key enzyme activities (AMO and HAO) were the main environmental drivers shaping these microbial communities. The AOB community composition was significantly associated with pH, AMO, and HAO activity, while the AOA and NOB communities were influenced by a broader set of factors, including SMC and SOC. A potential microbially mediated pathway was identified: Split N application can modulate soil properties (e.g., pH, moisture, and enzyme activity), which in turn selectively influences the community structure and abundance of key nitrogen-cycling microbes (notably AOB) in the rhizosphere, with potential consequences for soil N transformation processes. While this microbial reorganization did not directly translate into measurable gains in crop N uptake or yield in this experiment, it clearly delineates the intrinsic connections between fertilization management, the soil environment, microbial community structure, and nitrogen-cycling function. Viewed through a rhizosphere microecology lens, this work uncovers the microbial mechanisms underlying the regulation of soil N cycling by split N application. It outlines a pathway whereby N management strategies alter the soil chemicobiological environment, impact key functional microbial groups, and consequently modulate the N transformation pathway. These results inform precision N strategies that harness rhizosphere microbes to improve N use efficiency and wheat production. Since this study used a single strong-gluten cultivar, future work comparing cultivars with contrasting gluten strength is required to test whether the observed microbial patterns are genotype-specific. Furthermore, future work should focus on the long-term field validation of these microbial strategies for improving N uptake and yield, alongside exploring how functional gene expression relates to crop performance.

Supplementary Materials

The following supporting information can be downloaded at: https://www.mdpi.com/article/10.3390/agriculture16091006/s1, Figure S1: Community composition of AOA at various taxonomic levels in the rhizosphere soil; Figure S2: Community composition of AOB at various taxonomic levels in rhizosphere; Figure S3. Community composition of NOB at various taxonomic levels in rhizosphere soil.

Author Contributions

Conceptualization, H.X., C.X. and Y.W.; investigation, S.G., G.Y., S.L., W.W. (Wei Wu) and W.W. (Weiming Wang); software, S.G., W.W. (Weiming Wang), G.Y., W.W. (Wei Wu) and Y.W.; methodology, S.G., G.Y., S.L. and W.W. (Weiming Wang); formal analysis, S.G., G.Y., S.L. and W.W. (Wei Wu); visualization, S.G., G.Y., S.L., Y.W. and W.W. (Wei Wu); writing—original draft preparation, S.G. and G.Y.; writing—review and editing, S.G., G.Y., C.X. and H.X.; English polishing, H.X., C.X. and Y.W.; funding acquisition, H.X. and C.X. All authors have read and agreed to the published version of the manuscript.

Funding

This research was funded by the Jing-Jin-Ji Regional Integrated Environmental Improvement-National Science and Technology Major Project [2025ZD1205400, 2025ZD1205402].

Institutional Review Board Statement

Not applicable.

Data Availability Statement

The original contributions presented in this study are included in the article and Supplementary Material. Further inquiries can be directed to the corresponding authors.

Acknowledgments

We would like to express our gratitude to all the experts and teachers for their support and help with this experiment.

Conflicts of Interest

The authors declare no conflicts of interest.

Abbreviations

The following abbreviations are used in this manuscript:
NNitrogen
T1No-nitrogen application
T2Single topdressing applications of 120 kg ha−1 at the jointing stage
T3Single topdressing applications of 80 kg ha−1 at the jointing stage
T4Split topdressing applications combining 80 kg ha−1 at jointing with 40 kg ha−1 at the booting stage
T5Split topdressing applications combining 80 kg ha−1 at jointing with 40 kg ha−1 at the flowering stage
T6Split topdressing applications combining 80 kg ha−1 at jointing with 40 kg ha−1 at 10th day post-anthesis
NUENitrogen uptake efficiency
SMCSoil moisture content
SOCSoil organic carbon
STNSoil total nitrogen
AMOAmmonia monooxygenase
HAOHydroxylamine oxidoreductase
NXRNitrite oxidoreductase

References

  1. Lv, T.; Peng, S.; Liu, B.; Liu, Y.; Ding, Y. Planting suitability of China’s main grain crops under future climate change. Field Crops Res. 2023, 302, 109112. [Google Scholar] [CrossRef]
  2. Zörb, C.; Ludewig, U.; Hawkesford, M.J. Perspective on wheat yield and quality with reduced nitrogen supply. Trends Plant Sci. 2018, 23, 1029–1037. [Google Scholar] [CrossRef]
  3. Lv, M.; Chen, S.; Xin, S.; Tong, B.; Wang, S.; Xue, C.; Ma, W.; Wei, J. Effects of nitrogen application rate on yield, quality and soil nitrogen balance of winter wheat. J. Hebei Agric. Univ. 2019, 42, 9–15. [Google Scholar]
  4. Wang, L.; Wu, W.; Li, R.; Hu, J.; Yan, S.; Shao, Q.; Xu, F.; Zhang, C.; Zhou, Y.; Li, W. Effects of nitrogen rate on grain quality and nitrogen utilization of weak gluten wheat Acta Agric. Zhejiangensis 2021, 33, 777–784. [Google Scholar]
  5. Lyu, X.; Liu, Y.; Li, N.; Ku, L.; Hou, Y.; Wen, X. Foliar applications of various nitrogen (N) forms to winter wheat affect grain protein accumulation and quality via N metabolism and remobilization. Crop J. 2022, 10, 1165–1177. [Google Scholar] [CrossRef]
  6. Guo, R.; Qi, X.L.; Wang, H.W.; Zhang, Y.; Dong, H.B.; Zhang, J.Z. Effect analysis of foliar fertilizer applying on the yield and quality of strong gluten wheat. Hubei Agric. Sci. 2018, 57, 40–43. [Google Scholar]
  7. Moreau, D.; Bardgett, R.D.; Finlay, R.D.; Jones, D.L.; Philippot, L. A plant perspective on nitrogen cycling in the rhizosphere. Funct. Ecol. 2019, 33, 540–552. [Google Scholar] [CrossRef]
  8. Wang, D.; Ren, H. Microbial community in buckwheat rhizosphere with different nitrogen application rates. PeerJ 2023, 11, e15514. [Google Scholar] [CrossRef]
  9. Xing, M.; Zhang, Y.; Guan, C.; Guan, M. Effects of nitrogen application Rate on rhizosphere microbial diversity in oilseed rape (Brassica napus L.). Agronomy 2021, 11, 1539. [Google Scholar] [CrossRef]
  10. Liang, M.; Meng, W.; Chen, Z.; Shen, Y.; Liu, Y.; Shen, Y.; Liu, Z.; Nan, Z.; Xu, J.; Zhang, Z. Effects of nitrogen application levels on microbial community structure and diversity in peanut rhizosphere soil. Shandong Agric. Sci. 2023, 55, 78–83. [Google Scholar]
  11. Zhang, D.; Wang, C.; Li, X.; Yang, X.; Zhao, L.; Liu, L.; Zhu, C.; Li, R. Linking plant ecological stoichiometry with soil nutrient and bacterial communities in apple orchards. Appl. Soil Ecol. 2018, 126, 1–10. [Google Scholar] [CrossRef]
  12. Sahrawat, K.L. Factors affecting nitrification in soils. Commun. Soil Sci. Plant Anal. 2008, 39, 1436–1446. [Google Scholar] [CrossRef]
  13. Smith, J.M.; Chavez, F.P.; Francis, C.A. Ammonium uptake by phytoplankton regulates nitrification in the sunlit ocean. PLoS ONE 2014, 9, e108173. [Google Scholar] [CrossRef]
  14. Kuypers, M.M.; Marchant, H.K.; Kartal, B. The microbial nitrogen-cycling network. Nat. Rev. Microbiol. 2018, 16, 263–276. [Google Scholar] [CrossRef] [PubMed]
  15. Yang, K.; Luo, S.; Hu, L.; Chen, B.; Xie, Z.; Ma, B.; Ma, W.; Du, G.; Ma, X.; Roux, X.L. Responses of soil ammonia-oxidizing bacteria and archaea diversity to N, P and NP fertilization: Relationships with soil environmental variables and plant community diversity. Soil Biol. Biochem. 2020, 145, 107795. [Google Scholar] [CrossRef]
  16. Xu, R.Y.; Zuo, M.X.; Yuan, Y.L.; Sun, J.; Gu, W.J.; Lu, Y.S.; Xie, K.Z.; Xu, P.Z. Effects of nitrogen fertilizer dosage optimization on nitrogen uptake content and utilization efficiency and microbial function genes of nitrogen cycle in sweet corn. J. South. Agric. 2020, 51, 2919–2926. [Google Scholar]
  17. Wertz, S.; Leigh, A.K.; Grayston, S.J. Effects of long-term fertilization of forest soils on potential nitrification and on the abundance and community structure of ammonia oxidizers and nitrite oxidizers. FEMS Microbiol. Ecol. 2012, 79, 142–154. [Google Scholar] [CrossRef]
  18. Wang, C.; Liu, D.; Bai, E. Decreasing soil microbial diversity is associated with decreasing microbial biomass under nitrogen addition. Soil Biol. Biochem. 2018, 120, 126–133. [Google Scholar] [CrossRef]
  19. Li, J.; Wang, L.; Ren, L.K.; Liu, Y.H.; Cao, W.X.; Dai, T.B. Effect of sowing date, density and nitrogen management on grain yield and quality of winter wheat Lianmai 2. J. Triticeae Crops 2010, 30, 303–308. [Google Scholar]
  20. Cai, B.; Wang, M.; Ding, C.; Ren, H. Effects of nitrogen fertilizer regulation on grain yield and quality formation of strong gluten wheat. J. North. Agric. 2022, 50, 57–62. [Google Scholar]
  21. Dong, R.; Lv, H.; Zhang, B.; Zhang, Z.; Chen, W.; Liu, F. Effect of foliar application of nitrogen fertilizer on SPAD and yield of wheat. J. Triticeae Crops 2015, 35, 99–104. [Google Scholar]
  22. Blandino, M.; Pilati, A.; Reyneri, A. Effect of foliar treatments to durum wheat on flag leaf senescence, grain yield, quality and deoxynivalenol contamination in North Italy. Field Crops Res. 2009, 114, 214–222. [Google Scholar] [CrossRef]
  23. Wang, Y.; Yu, Z.; Li, X.; Yu, S. Effects of soil fertility and nitrogen application rate on nitrogen absorption and translocation, grain yield and grain protein content of wheat. Chin. J. Appl. Ecol. 2003, 14, 1868–1872. [Google Scholar]
  24. Abad, A.; Lloveras, J.; Michelena, A. Nitrogen fertilization and foliar urea effects on durum wheat yield and quality and on residual soil nitrate in irrigated Mediterranean conditions. Field Crops Res. 2004, 87, 257–269. [Google Scholar] [CrossRef]
  25. Shen, Q.; Xu, G. Absorption and Transport of foliar-applied urea-15N in wheat and maize. Acta Pedol. Sin. 2001, 38, 67–74. [Google Scholar]
  26. Zuo, Y.; Ma, D.; Ma, Y.; Zhang, B.; Guo, T. Effects of spraying nitrogen and zinc fertilizers after flowering on grain weight and nutritional quality of winter wheat. Agric. Sci. Technol. 2013, 14, 630–634, 650. [Google Scholar] [CrossRef]
  27. Bao, S.D. Agrochemical Analysis of Soils, 3rd ed.; China Agriculture Press: Beijing, China, 2000. [Google Scholar]
  28. Lv, X.D.; Sun, S.Y.; Li, Y.N.; Guo, J.; Wang, Y.Q.; Fu, X.; Ning, Y.P.; Peng, Z.P. Stratified fertilization by means of intelligent machine increases wheat yield and nutrient utilization in medium-low yield fields of North China. J. Plant Nutr. Fertil. 2025, 31, 657–670. [Google Scholar] [CrossRef]
  29. Liu, S.S. The Plastic Responses of Winter Wheat Rhizosphere Microbial Community to Nitrogen Fertilizer Management and Their Subsequent Effects on Yield and Quality. Master’s Thesis, Hebei Agricultural University, Baoding, China, 2023. [Google Scholar]
  30. Guo, Y.J.; Di, H.J.; Cameron, K.C.; Li, B. Effect of application rate of a nitrification inhibitor, dicyandiamide (DCD), on nitrification rate, and ammonia-oxidizing bacteria and archaea growth in a grazed pasture soil: An incubation study. J. Soils Sediments 2014, 14, 897–903. [Google Scholar] [CrossRef]
  31. Lin, Y.; Ye, G.; Ding, W.; Hu, H.W.; Zheng, Y.; Fan, J.; Wan, S.; Duan, C.; He, J.Z. Niche differentiation of comammox Nitrospira and canonical ammonia oxidizers in soil aggregate fractions following 27-year fertilizations. Agric. Ecosyst. Environ. 2020, 304, 107147. [Google Scholar] [CrossRef]
  32. Li, Y.; Chapman, S.; Nicol, G.; Yao, H. Nitrification and nitrifiers in acidic soils. Soil Biol. Biochem. 2018, 116, 290–301. [Google Scholar] [CrossRef]
  33. Alam, M.S.; Ren, G.D.; Lu, L.; Zheng, Y.; Peng, X.H.; Jia, Z.J. Conversion of upland to paddy field specifically alters the community structure of archaeal ammonia oxidizers in an acid soil. Biogeosciences 2013, 10, 5739–5753. [Google Scholar] [CrossRef]
  34. Yuan, X.C.; Zeng, Q.X.; Zhou, Q.; Ren, M.X.; Li, W.Z.; Chen, Y.T.; Lin, K.M.; Chen, Y.M. Differential seasonal effects of nitrogen addition on nitrification potential and ammonia-oxidizing microorganisms in soil of subtropical moso bamboo forests. Acta Ecol. Sin. 2024, 44, 10734–10744. [Google Scholar]
  35. Chen, H.; Feng, Y.; Zhou, J.; Xu, Z.; Lian, C.; Guo, Q. Root biomass distribution and seasonal variation of Phyllostachys edulis. Ecol. Environ. Sci. 2013, 22, 1678–1681. [Google Scholar]
  36. Martens-Habbena, W.; Berube, P.M.; Urakawa, H.; de la Torre, J.R.; Stahl, D.A. Ammonia oxidation kinetics determine niche separation of nitrifying Archaea and Bacteria. Nature 2009, 461, 976–979. [Google Scholar] [CrossRef]
  37. Valentine, D. Adaptations to energy stress dictate the ecology and evolution of the Archaea. Nat. Rev. Microbiol. 2007, 5, 316–323. [Google Scholar] [CrossRef]
  38. He, J.Z.; Hu, H.W.; Zhang, L.M. Current insights into the autotrophic thaumarchaeal ammonia oxidation in acidic soils. Soil Biol. Biochem. 2012, 55, 146–154. [Google Scholar] [CrossRef]
  39. Ouyang, Y.; Norton, J.M.; Stark, J.M.; Reeve, J.R.; Habteselassie, M.Y. Ammonia-oxidizing bacteria are more responsive than archaea to nitrogen source in an agricultural soil. Soil Biol. Biochem. 2016, 96, 4–15. [Google Scholar] [CrossRef]
  40. Shen, X.; Zhang, L.; Shen, J.; Li, L.; Yuan, C.; He, J. Nitrogen loading levels affect abundance and composition of soil ammonia oxidizing prokaryotes in semiarid temperate grassland. J. Soils Sediments 2011, 11, 1243–1252. [Google Scholar] [CrossRef]
  41. Shen, J.; Zhang, L.; Zhu, Y.; Zhang, J.; He, J. Abundance and composition of ammonia-oxidizing bacteria and ammonia-oxidizing archaea communities of an alkaline sandy loam. Environ. Microbiol. 2008, 10, 1601–1611. [Google Scholar] [CrossRef] [PubMed]
  42. Kong, Y.; Ling, N.; Xue, C.; Chen, H.; Ruan, Y.; Guo, J.; Zhu, C.; Wang, M.; Shen, Q.; Guo, S. Long-term fertilization regimes change soil nitrification potential by impacting active autotrophic ammonia oxidizers and nitrite oxidizers as assessed by DNA stable isotope probing. Environ. Microbiol. 2019, 21, 1224–1240. [Google Scholar] [CrossRef] [PubMed]
  43. Hu, L.X.; Jiang, X.J. Progress and prospectives of nitrite-oxidizing bacteria. J. Resour. Environ. 2025, 42, 11–21. [Google Scholar] [CrossRef]
  44. Jiang, Y.; Zhu, Y.; Lin, W.; Luo, J. Urea Fertilization significantly promotes nitrous oxide emissions from agricultural soils and is attributed to the short-term suppression of nitrite-oxidizing bacteria during urea hydrolysis. Microorganisms 2024, 12, 685. [Google Scholar] [CrossRef]
  45. Zhao, J.; Jiang, Y.; Ren, F.; Li, L.; Chen, H. Nitrogen and phosphorus additions reshape soil microbial metabolic functions in Qinghai-Tibetan Plateau alpine meadows. Soil Biol. Biochem. 2026, 213, 110026. [Google Scholar] [CrossRef]
  46. Ouyang, Y.; Norton, J. Nitrite oxidizer activity and community are more responsive than their abundance to ammonium-based fertilizer in an agricultural soil. Front. Microbiol. 2020, 11, 1736. [Google Scholar] [CrossRef] [PubMed]
  47. Zu, M.T.; Yuan, Y.D.; Zuo, J.J.; Sun, L.P.; Tao, J. Microbiota associated with the rhizosphere of Paeonia lactiflora Pall. (ornamental cultivar). Appl. Soil Ecol. 2022, 169, 104214. [Google Scholar] [CrossRef]
  48. Bogino, P.; Abod, A.; Nievas, F.; Giordano, W. Water-limiting conditions alter the structure and biofilm-forming ability of bacterial multispecies communities in the alfalfa rhizosphere. PLoS ONE 2013, 8, e79614. [Google Scholar] [CrossRef] [PubMed]
  49. Feng, H.L.; Xu, C.S.; He, H.H.; Zeng, Q.; Chen, N.; Li, X.L.; Ren, T.B.; Ji, X.M.; Liu, G.S. Effects of biochar on soil enzyme activities & the bacterial community and its mechanisms. Environ. Sci. 2021, 42, 422–432. [Google Scholar]
  50. Wang, X.L.; Zhu, F.; Yao, J.; Jiang, Y.J.; Wang, Y.; Ren, L.Y. Effects of long-term fertilization on community of ammonia oxidizers in acidic soil. J. Plant Nutr. Fertil. 2018, 24, 375–382. [Google Scholar]
  51. Zhang, M.M.; Wang, B.R.; Li, D.C.; He, J.Z.; Zhang, L.M. Effects of long-term N fertilizer application and liming on nitrification and ammonia oxidizers in acidic soils. Acta Ecol. Sin. 2015, 35, 6362–6370. [Google Scholar] [CrossRef][Green Version]
  52. Chu, C.; Wu, Z.Y.; Huang, Q.R.; Han, C.; Zhong, W.H. Effects of organic matter promotion on nitrogen-cycling genes and functional microorganisms in acidic red soil. Environ. Sci. 2020, 41, 2468–2475. [Google Scholar]
  53. Liu, H.Y.; Qin, S.Y.; Li, Y.; Zhao, P.; Nie, Z.J.; Liu, H.E. Comammox Nitrospira and AOB communities are more sensitive than AOA community to different fertilization strategies in a fluvo-aquic soil. Agric. Ecosyst. Environ. 2023, 342, 108224. [Google Scholar] [CrossRef]
  54. Xie, J.; Jiang, J.G.; Lu, J.; Dai, W.C.; Guo, H.R.; Chen, Y.X.; Huang, R.; Wang, Z.F.; Gao, M. Comammox and ammonia-oxidizing archaea dominated the nitrification under different nitrogen fertilizer levels in acid purple soil of Southwest China. Appl. Soil Ecol. 2025, 207, 105941. [Google Scholar] [CrossRef]
  55. Zhu, G.B.; Wang, X.M.; Wang, S.Y.; Yu, L.B.; Armanbek, G.; Yu, J.; Jiang, L.P.; Yuan, D.D.; Guo, Z.R.; Zhang, H.R. Towards a more labor-saving way in microbial ammonium oxidation: A review on complete ammonia oxidization (comammox). Sci. Total Environ. 2022, 829, 154590. [Google Scholar] [CrossRef]
  56. Koch, H.; van Kessel, M.; Lücker, S. Complete nitrification: Insights into the ecophysiology of comammox Nitrospira. Appl. Microbiol. Biotechnol. 2019, 103, 177–189. [Google Scholar] [CrossRef]
  57. Xu, J.; Mao, Y. From canonical nitrite oxidizing bacteria to complete ammonia oxidizer: Discovery and advances. Microbiol. China 2019, 46, 879–890. [Google Scholar]
  58. Wang, Y.; Zhao, W.; Bai, M.; Qin, Y. Research progress on ammonia oxidizing microorganisms: The discovery, nitrogen metabolic pathways, influencing factors and contribution rate. J. Environ. Chem. Eng. 2025, 13, 117477. [Google Scholar] [CrossRef]
  59. Zhang, J. Effects of late foliar N application on yield, quality and N uptake and utilization of wheat. Master’s Thesis, Hebei Agricultural University, Baoding, China, 2022. [Google Scholar]
  60. Yang, M. Effects of late nitrogen application on nitrogen utilization and processing quality of wheat. Master’s Thesis, Hebei Agricultural University, Baoding, China, 2020. [Google Scholar]
  61. Barraclough, P.B.; Lopez-Bellido, R.; Hawkesford, M.J. Genotypic variation in the uptake, partitioning and remobilisation of nitrogen during grain-filling in wheat. Field Crops Res. 2014, 156, 242–248. [Google Scholar] [CrossRef]
  62. Gooding, M.; Davies, W. Foliar urea fertilization of cereals: A review. Fert. Res. 1992, 32, 209–222. [Google Scholar] [CrossRef]
  63. Lv, G.; Mi, Y.; Chen, Y.; Sun, Y.; Wang, C.; Mu, Q.; Wu, K.; Qian, Z. Effects of nitrogen fertilizer application on nitrogen accumulation, dry matter accumulation, transport, and yield of maize. J. Maize Sci. 2021, 29, 128–137. [Google Scholar]
  64. Ge, X.; Yang, H.; Zhao, P.; Liu, J.; Zhang, Y. Effects of nitrogen top-dressing by stages on yield and post-flowering photosynthetic characteristics and nitrogen utilization of maize under shallow-buried drip irrigation. Chin. Agric. Sci. Bull. 2022, 38, 1–7. [Google Scholar]
  65. Zhang, Q.; Zhang, L.; Bi, H. Characteristics of nitrogen uptake, accumulation, and translocation in spring wheat cultivars and their relationship with grain protein. Acta Agron. Sin. 1997, 23, 712–718. [Google Scholar]
  66. Li, Q.; Gao, J.; Peng, Q.; Wang, C.; Zhou, L.; Zhang, G.; Zhao, Q.; Zhang, C.; Shao, M.; Luo, K.; et al. Effects of topdressing nitrogen rate and ratio at different growth stages on yield, nitrogen accumulation, translocation, and nitrogen use efficiency in waxy sorghum “Hongyingzi”. Soil Fert. Sci. China 2023, 9, 105–110. [Google Scholar]
  67. Zhang, J.; Fu, B.; Wu, W.; Xu, H.; Xue, C. Effects of foliar nitrogen topdressing timing on grain yield, protein content and nitrogen utilization of wheat. J. Hebei Agric. Univ. 2022, 45, 1–7+42. [Google Scholar]
  68. Li, X.; Guo, X. Effects of different nitrogen levels on ammonia oxidizing microorganisms in wheat rhizosphere soil. J. Henan Agric. Sci. 2020, 49, 69–76. [Google Scholar]
  69. Chinthalapudi, D.; Kingery, W.; Shanmugam, S. A review of plant-mediated and fertilization-induced shifts in ammonia oxidizers: Implications for nitrogen cycling in agroecosystems. Land 2025, 14, 1182. [Google Scholar] [CrossRef]
  70. Zhou, W.; Lv, D.; Qin, S. Research progress in interaction between plant and rhizosphere mi-croorganism. J. Jilin Agric. Univ. 2016, 38, 253–260. [Google Scholar]
  71. Yue, H.; Banerjee, S.; Liu, C.; Ren, Q.; Zhang, W.; Zhang, B.; Tian, X.; Wei, G.; Shu, D. Fertilizing-induced changes in the nitrifying microbiota associated with soil nitrification and crop yield. Sci. Total Environ. 2022, 841, 156752. [Google Scholar] [CrossRef]
  72. Daims, H.; Lebedeva, E.V.; Pjevac, P.; Han, P.; Herbold, C.; Albertsen, M.; Jehmlich, N.; Palatinszky, M.; Vierheilig, J.; Bulaev, A. Complete nitrification by Nitrospira bacteria. Nature 2015, 528, 504–509. [Google Scholar] [CrossRef] [PubMed]
Figure 1. Alpha diversity index of AOA community in rhizosphere soil. Note: The bar chart represents the average value ± standard error, and the lowercase letters indicate the differences between the treatments. Different lowercase letters indicate significant differences between treatments.
Agriculture 16 01006 g001
Figure 2. Alpha diversity index of AOB community in rhizosphere soil. Note: The bar chart represents the average value ± standard error, and the lowercase letters indicate the differences between the treatments. Different lowercase letters indicate significant differences between treatments.
Agriculture 16 01006 g002
Figure 3. Alpha diversity index of NOB community in rhizosphere soil. Note: The bar chart represents the average value ± standard error, and the lowercase letters indicate the differences between the treatments. Different lowercase letters indicate significant differences between treatments.
Agriculture 16 01006 g003
Figure 4. Significance testing of the relative abundance of AOA composition across taxonomic levels. Note: The red background indicates that there are differences in the microorganisms present in the treatment compartments. Different lowercase letters indicate significant differences between treatments.
Agriculture 16 01006 g004
Figure 5. Significance testing of the relative abundance of AOB composition across taxonomic levels. Note: The red background indicates that there are differences in the microorganisms present in the treatment compartments. Different lowercase letters indicate significant differences between treatments.
Agriculture 16 01006 g005
Figure 6. Significance testing of the relative abundance of NOB composition across taxonomic levels. Note: The red background indicates that there are differences in the microorganisms present in the treatment compartments. Different lowercase letters indicate significant differences between treatments.
Agriculture 16 01006 g006
Figure 7. Redundancy analysis of AOA (a), AOB (b), NOB (c) and soil properties in the rhizosphere. Note: Red arrows denote the measured environmental variables: rhizosphere soil moisture (SMC), soil organic carbon (SOC), soil total N (STN), pH, and the activities of ammonia monooxygenase (AMO), hydroxylamine oxidoreductase (HAO), and nitrite oxidoreductase (NXR). Data points are colored by treatment to show the corresponding rhizosphere microbial community distribution.
Agriculture 16 01006 g007
Table 1. Experimental design (kg N/ha).
TreatmentsPre-SowingJointing StageBooting StageAnthesis10 Days After
Anthesis
T100000
T290120000
T39080000
T490804000
T590800400
T690800040
Table 2. Yield, quality and N utilization of wheat under multiple N applications.
TreatmentsGrain Yield
kg/ha
Protein Yield
kg/ha
Aboveground N Uptake
kg/ha
NUE
kg/kg
T16114.38 ± 674.47 b576.83 ± 64.06 b130.29 ± 17.76 c-
T28828.39 ± 158.31 a1042.47 ± 37.10 a248.10 ± 12.69 ab1.18 ± 0.06 ab
T38613.11 ± 192.26 a926.51 ± 44.22 a216.44 ± 12.07 b1.27 ± 0.07 a
T48761.46 ± 267.84 a988.64 ± 32.36 a229.92 ± 10.70 ab1.09 ± 0.05 b
T58580.08 ± 262.45 a1033.96 ± 48.24 a248.09 ± 14.89 ab1.18 ± 0.07 ab
T68866.55 ± 130.37 a1059.56 ± 35.14 a258.35 ± 12.53 a1.23 ± 0.06 ab
Note: Different lowercase letters indicate significant differences between treatments.
Table 3. Correlation analysis between nitrogen-transforming microbes and crop yield, protein yield, and N utilization under split N application.
Nitrogen-Transforming MicrobesAlpha DiversityYield
(kg/ha)
Protein Yield
(kg/ha)
Aboveground N Uptake (kg/ha)NUE
(kg/kg)
AOAChao10.157−0.023−0.1100.053
Goods_coverage−0.1240.0570.120−0.024
Observed_species0.1620.000−0.0860.058
Pielou_e0.3430.3520.2740.198
Shannon0.3130.2700.1730.156
Simpson0.3680.3640.2770.187
AOBChao1−0.072−0.110−0.155−0.203
Goods_coverage0.1680.2200.2610.254
Observed_species−0.082−0.113−0.159−0.207
Pielou_e0.409 *0.488 *0.440 *0.324
Shannon0.2520.3070.2560.090
Simpson0.1850.2240.1430.058
NOBChao10.1130.1220.1660.233
Goods_coverage−0.159−0.146−0.185−0.248
Observed_species0.0390.0800.1420.204
Pielou_e−0.527 **−0.519 **−0.372−0.376
Shannon−0.461 *−0.439 *−0.296−0.269
Simpson−0.388−0.436 *−0.295−0.272
Note: * and ** denote significance at p < 0.05 and p < 0.01, respectively.
Table 4. Relationships between key nitrogen-transforming microbes and crop yield, protein yield, and N utilization under split N application.
Nitrogen-Convertible MicroorganismsDiverse MicrobiotaYield (kg/hm2)Protein Yield
(kg/hm2)
N Absorption Capacity
(kg/hm2)
NUE (kg/kg)
AOAarchaeon G61−0.060−0.095−0.063−0.102
Nitrososphaera sp. JG1−0.417 *−0.320−0.237−0.366
AOBNitrosospira0.2310.1580.0570.099
Nitrosomonas0.1330.1520.2600.180
Nitrosospira sp. Nsp120.3500.476 *0.515 **0.402
Nitrosospira sp. EnI2990.0980.1310.2480.178
Nitrosospira lacus−0.0210.0290.1270.061
Nitrosomonas sp. Nm580.1290.1520.2620.178
Nitrosospira multiformis−0.593 **−0.453 *−0.395−0.384
Nitrosospira sp. Nsp170.0710.1990.1540.119
Nitrosospira sp. Nsp50.1090.1480.1290.110
NOBbacterium0.415 *0.481 *0.3760.422 *
Candidatus Nitrospira inopinata−0.363−0.451 *−0.482 *−0.406 *
Note: * and ** denote significance at p < 0.05 and p < 0.01, respectively.
Disclaimer/Publisher’s Note: The statements, opinions and data contained in all publications are solely those of the individual author(s) and contributor(s) and not of MDPI and/or the editor(s). MDPI and/or the editor(s) disclaim responsibility for any injury to people or property resulting from any ideas, methods, instructions or products referred to in the content.