


Abstract
Cucumber Fusarium wilt, which is induced by the soil-borne pathogen Fusarium oxysporum f. sp. Cucumerinum (FOC), represents a highly destructive disease. Cucumber seedling grafted onto figleaf gourd (Cucurbita ficifolia Bouché) rootstock (CFC) demonstrated better resistance to FOC. However, the molecular mechanism underlying this enhanced disease resistance capability is largely unknown. To elucidate this, we performed transcriptome, small RNA, and degradome sequencing for leaves from CFC and self-grafted cucumbers (SGC) as controls, with and without FOC infections, respectively. Our results indicated that three NAC genes, all predicted as targets of csa-miR164, were significantly up-regulated in CFC after FOC infection. Co-transformation assay in Nicotiana benthamiana confirmed that csa-miR164f directly inhibits NAC2, and transient overexpression of NAC2 in cucumber enhanced resistance to FOC, supporting its positive role in defense. Therefore, our results suggest that three NACs, upregulated in CFC, as an alternative pathway, enhance the reactive oxygen species burst and hypersensitive response, which further elevates the resistance to FOC infection. These results provide new insights into the molecular basis for improved FOC resistance in CFC.
Keywords:
cucumber; figleaf gourd; cucumber fusarium wilt; fungi; FOC; NAC; miR164; high-throughput sequencing 1. Introduction
Cucumber (Cucumis sativus L.), a vine in the Cucurbitaceae family, is widely cultivated across China and ranks among the country’s main vegetables. According to the Food and Agriculture Organization of the United Nations (FAO) (https://www.fao.org/faostat/en/#data/QCL, accessed on 10 November 2025) preliminary estimates, China’s cucumber production reached approximately 68 million tons in 2024. Cucumber wilt is characterized as a severe, soil-borne fungal disease resulting from infection by Fusarium oxysporum f. sp. Cucumerinum (FOC) [1]. FOC infects cucumber roots, penetrates the root tissue, and spreads into the xylem, leading to the blockage of vascular bundles and conduits, hindering water and nutrient absorption, and/or producing phytotoxic metabolites such as fusaric acid [2] that disrupt host cell function and contribute to disease development [3]. The disease is particularly problematic in continuous greenhouse cultivation systems, where pathogen inoculum accumulates in the soil, leading to significant yield losses under favorable conditions (25–28 °C, high soil moisture) [1,4]. Although other formae speciales such as Fusarium oxysporum f. sp. radicis-cucumerinum (FORC) [5] can also infect cucumber, FOC is the predominant pathogen responsible for vascular wilt and systemic symptoms and was therefore the focus of this study. Long-term cultivation practices and research demonstrated that figleaf gourd (Cucurbita ficifolia Bouché, also called as “Black seeded” figleaf gourd) exhibited superior resistance to FOC [6]. Cucumber grafted onto figleaf gourd rootstock showed significantly enhanced FOC resistance [7,8,9], along with improved tolerance to low-temperature stress [10] and salinity [11,12], while also contributing to increased yield [11,12,13]. Therefore, cucumber grafted on figleaf gourd rootstock is widely used to prevent the wilt fungus from root infestation [7,8] and to improve the yield [11,12,13].
NAC transcription factors comprise a large plant-specific family with over 100 members per genome, playing key roles in development, stress responses, and hormone signaling [14,15,16,17]. They enhance disease resistance through multiple mechanisms, including direct activation of defense genes, modulation of phytohormone signaling, and regulation of ROS and HR [17]. For instance, overexpression of OsNAC60 [18] in rice, BnaNAC56 in Brassica napus [19], and tomato SlNAC35 [20] expressed in tobacco all trigger ROS accumulation and HR-like cell death, contributing to enhanced pathogen resistance. In wheat, 146 TaNAC genes are upregulated upon fungal infection, highlighting their involvement in defense reprogramming [21]. Notably, five NAC genes in figleaf gourd were significantly upregulated in response to FOC infection [6], suggesting a conserved role for NACs in wilt disease resistance.
MicroRNAs (miRNAs) are short non-coding RNA molecules that typically function by suppressing target genes at the post-transcriptional stage [22,23,24,25]. In plants, certain highly conserved miRNAs participate critically in development or stress adaptation through the regulation of transcription factors [23,24]. Plants modulate miRNA expression to cope with environmental challenges, facilitating adaptive responses [26,27]. In cucumber, modules such as miR319a-JRL3, miR6300-BEE1, miR6300-DAHP1, and miR6300-PERK2 have been implicated in wilt defense [28]. Notably, the miR164-NAC module is conserved across species: in Arabidopsis, miR164 negatively regulates NAC4 to fine-tune programmed cell death [29]; in rice, miR164a-OsNAC60 induction enhances disease resistance [18]; and in garlic, miR164a overexpression reinforces resistance to Fusarium basal rot [30]. However, whether and how miR164-NAC modules contribute to resistance in figleaf gourd-grafted cucumber against FOC infection remains largely unexplored.
Cucumber grafted with figleaf gourd significantly improved disease resistance, the molecular mechanism of which has not been clearly elucidated. We hypothesize that NACs may involve in the enhanced resistance in CFC-FOC. And NACs might be fine-tuned by miR-164 in the mean-time to avoid too strong activation of ROS. To test this hypothesis, we grafted cucumber onto figleaf gourd which was subsequently infested with FOC. Then, we took the leaves of figleaf gourd grafted cucumbers (CFCs) and self-grafted cucumbers (SGCs) as controls for transcriptome, small RNA, and degradome sequencing.
Three NAC genes, targeted by csa-miR164f, were significantly up-regulated in CFCs infested with FOC. Furthermore, co-transformation experiment confirmed that miR164f was directly inhibited NAC2 and transient overexpression of NAC2 in cucumber enhanced resistance to FOC, supporting its positive role in defense. These findings reveal that in CFC-FOC, a miR164f-NAC2-ROS regulatory axis was employed to enhance the resistance against FOC infection. This differs from the mechanisms revealed in previous studies, which focused on the roles played by pathogen-associated proteins—including chitinase, glucanase, and other hydrolases—and the physical barriers formed by robust root systems [31,32]. This study provides new insights into resistance in cucumber grafted on figleaf gourd.
2. Results
2.1. Plant Phenotypes and Physiological Indicators of Four Groups of Cucumber Samples
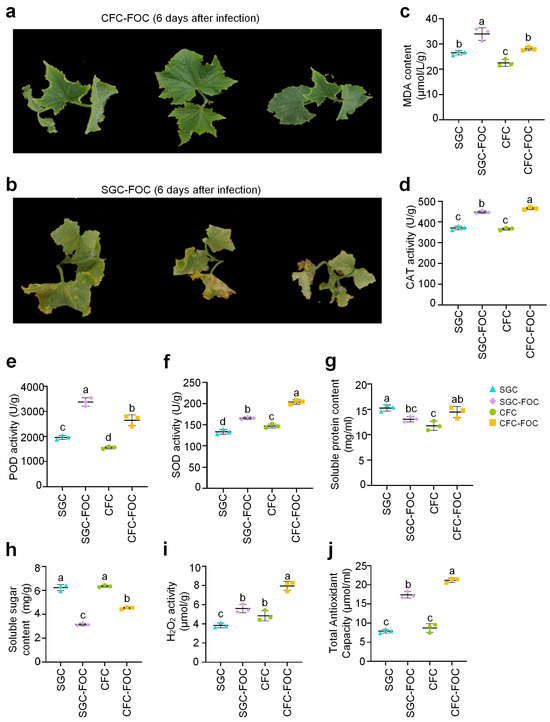
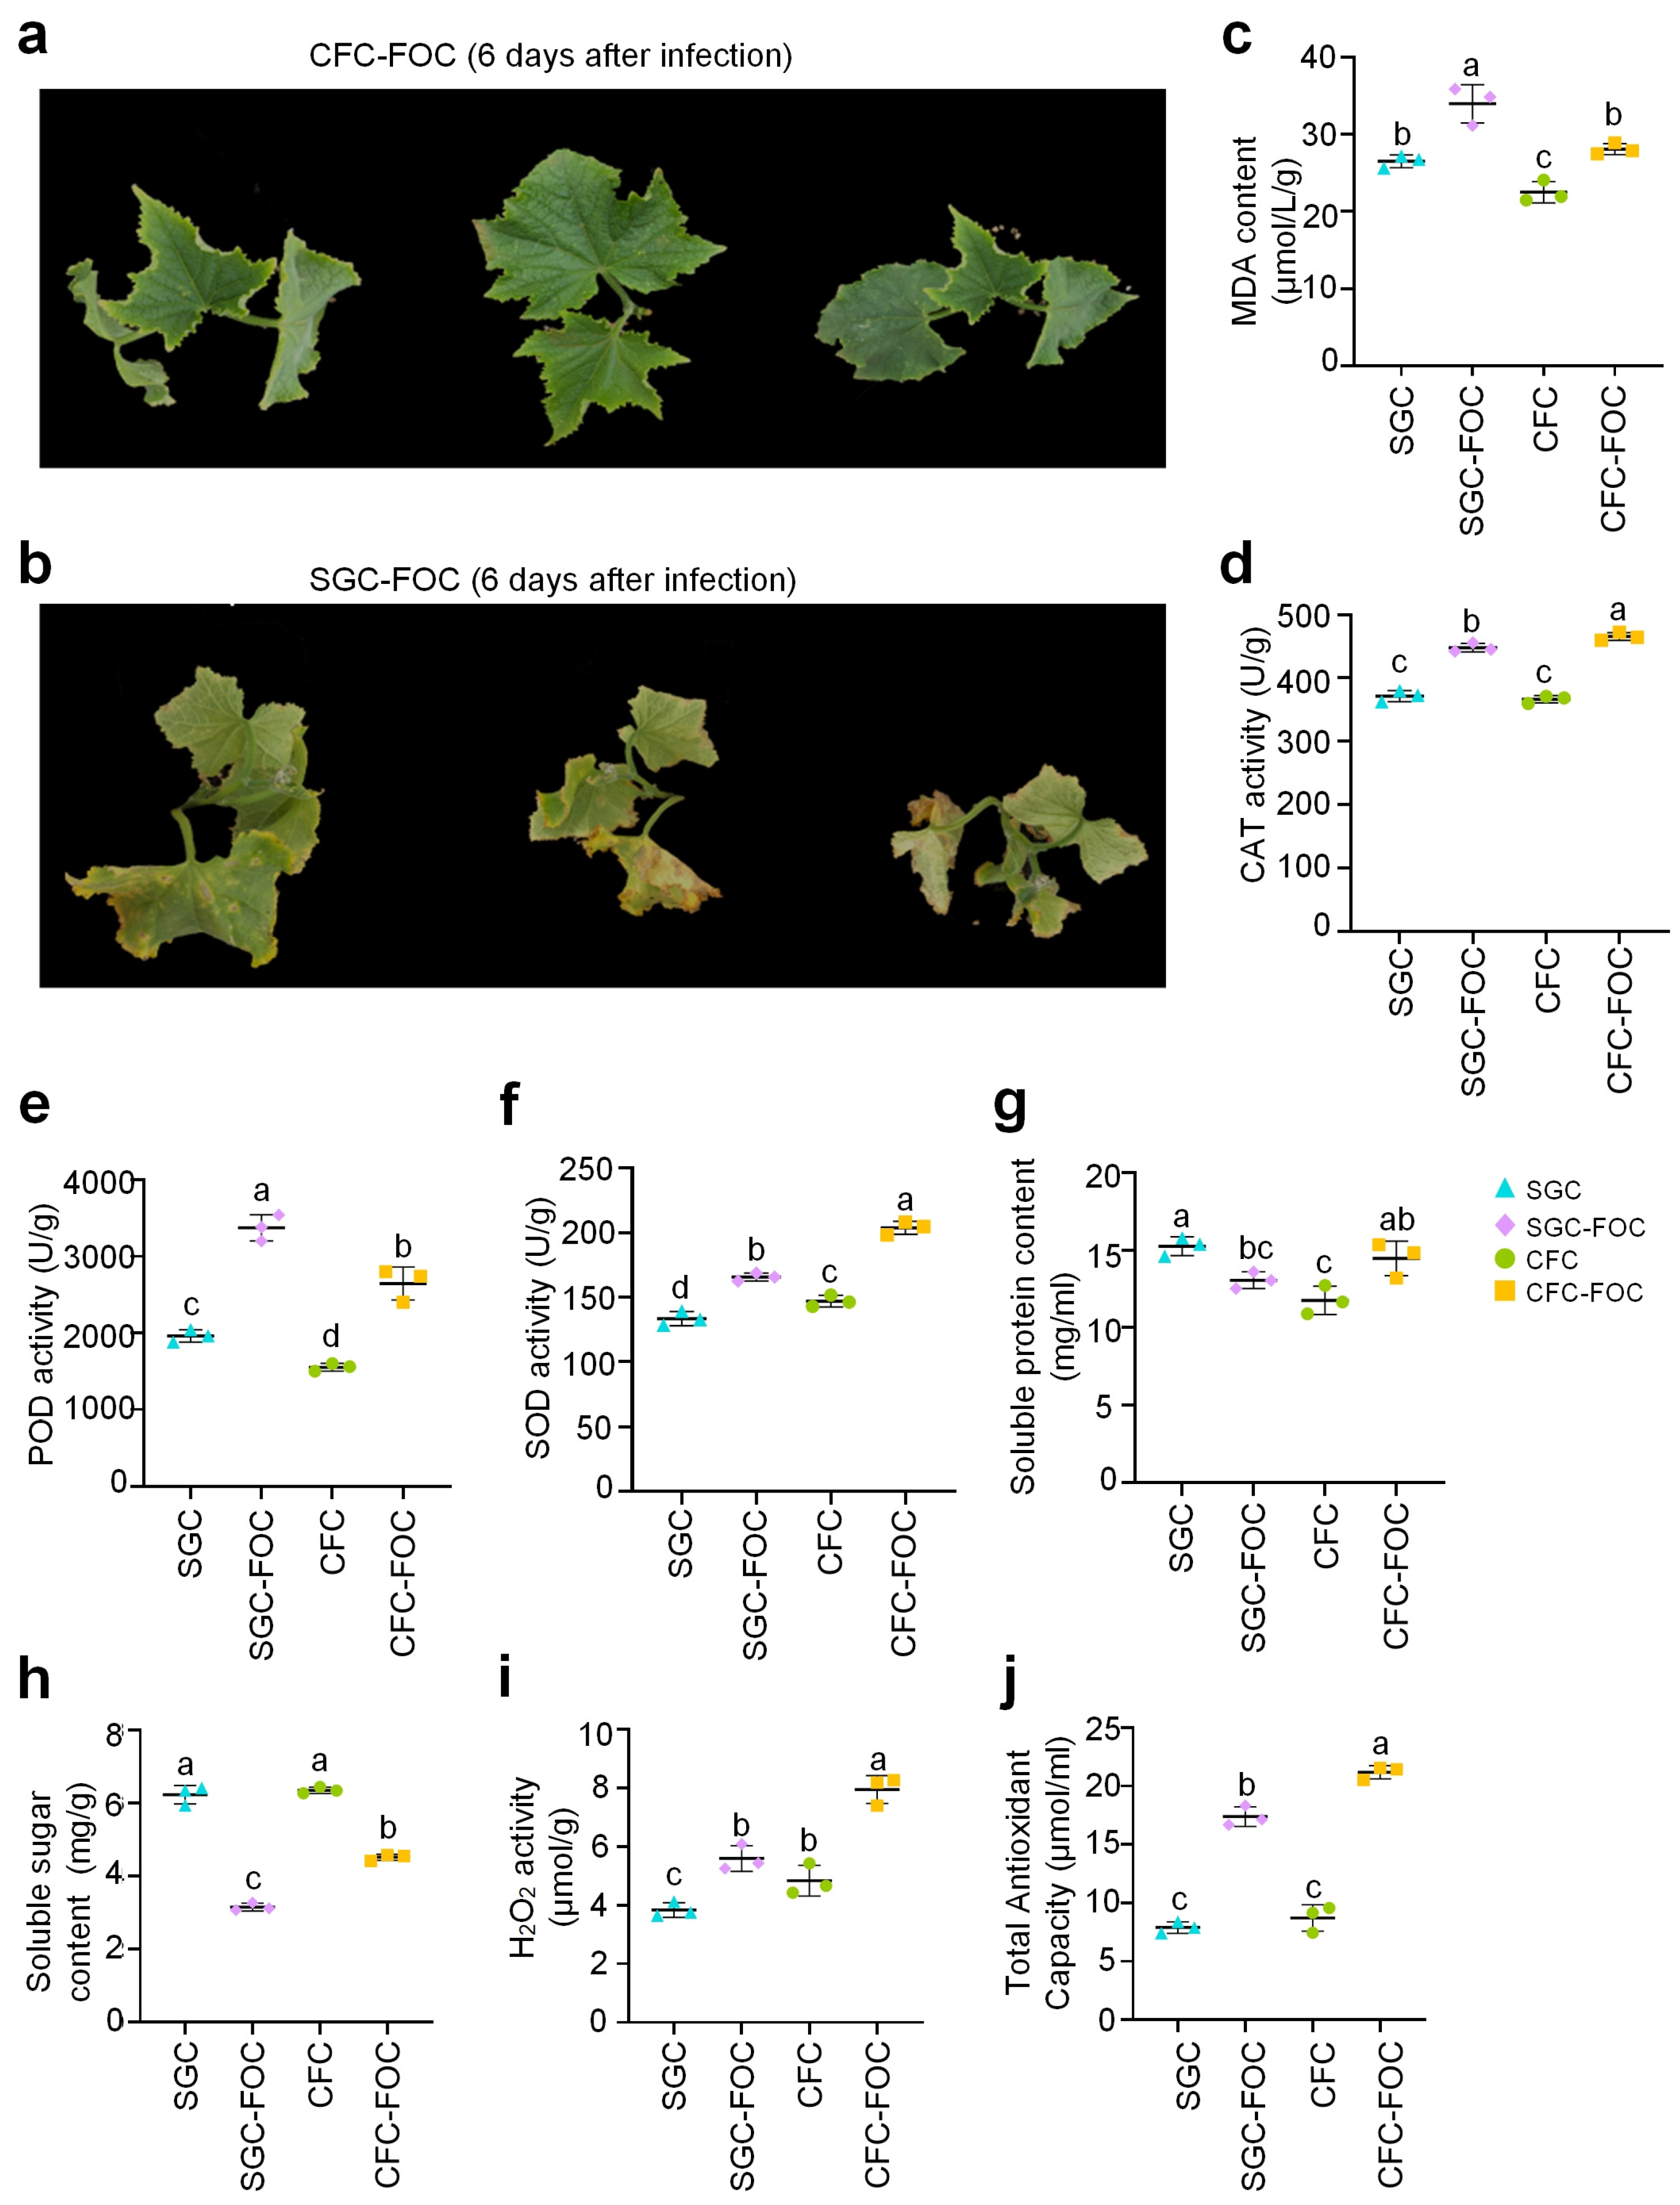
Four groups of cucumber leaf samples were prepared: SGC, SGC-FOC, CFC, and CFC-FOC. At 6 days post-inoculation, we observed the phenotypes and found that the CFC-FOC showed very stronger resistance compared to the SGC-FOC. The CFC-FOC were still green and fresh, whereas SGC-FOC plants exhibited wilting and yellowing (Figure 1a,b).
Figure 1.
Plant phenotypes and physiological indicators of four groups of cucumber samples. (a) CFC plants on the 6 day after infection of FOC. (b) SGC plants on the 6 day after infection of FOC. (c) MDA contents in leaves of the 4 groups. (d) CAT activities of leaves in the 4 groups. (e) POD activities in leaves of the 4 groups. (f) SOD activities in leaves of the 4 groups. (g) Soluble protein contents of leaves in the 4 groups. (h) Soluble sugar contents of leaves in the 4 groups. (i) The H2O2 contents in the leaves of the 4 groups. (j) Total antioxidant capacities of leaves in the 4 groups. In Part (c–j), middle lines represent mean values; error bars represent standard deviations of three biological replicates; lowercase letters indicate statistically significant differences between different groups (, Duncan’s multiple range tests). The source data of Part (c–j) are available in Supplementary Table S28.
We examined physiological indicators related to plant resistance and found that the MDA content of plants increased after infection with the pathogen (Figure 1c), and the degree of increase in SGC-FOC was higher than that in CFC-FOC (Figure 1c), indicating that SGC-FOC experienced more serious injuries. Physiological assays revealed distinct responses between CFC-FOC and SGC-FOC plants after FOC infection. In CFC-FOC, the activities of antioxidant enzymes (CAT and SOD) and total antioxidant capacity were significantly higher than those in SGC-FOC (Figure 1d, Figure 1f and Figure 1j, respectively). H2O2 content was also elevated in CFC-FOC (Figure 1i), suggesting enhanced oxidative burst in CFC-FOC. After FOC infection, soluble protein and soluble sugar contents decreased significantly in SGC-FOC compared to CFC-FOC (Figure 1g). Additionally, CFC-FOC plants exhibited less severe physiological changes than SGC-FOC plants across multiple parameters (Figure 1c,j). These results demonstrate that CFC-FOC plants exhibited reduced disease symptoms and less severe physiological damage compared to SGC-FOC plants, as evidenced by lower disease severity, reduced MDA accumulation, and higher antioxidant enzyme activities.
2.2. Identification of DEGs from Different Treatment Groups
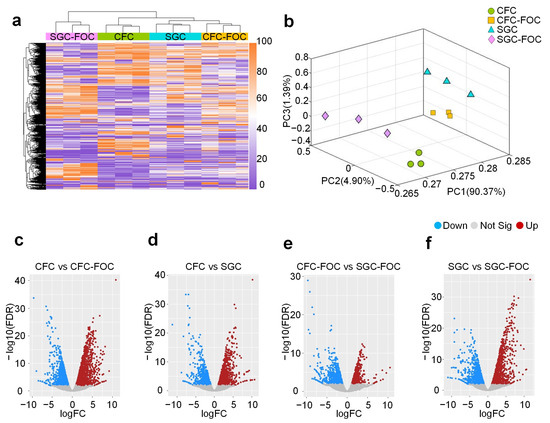
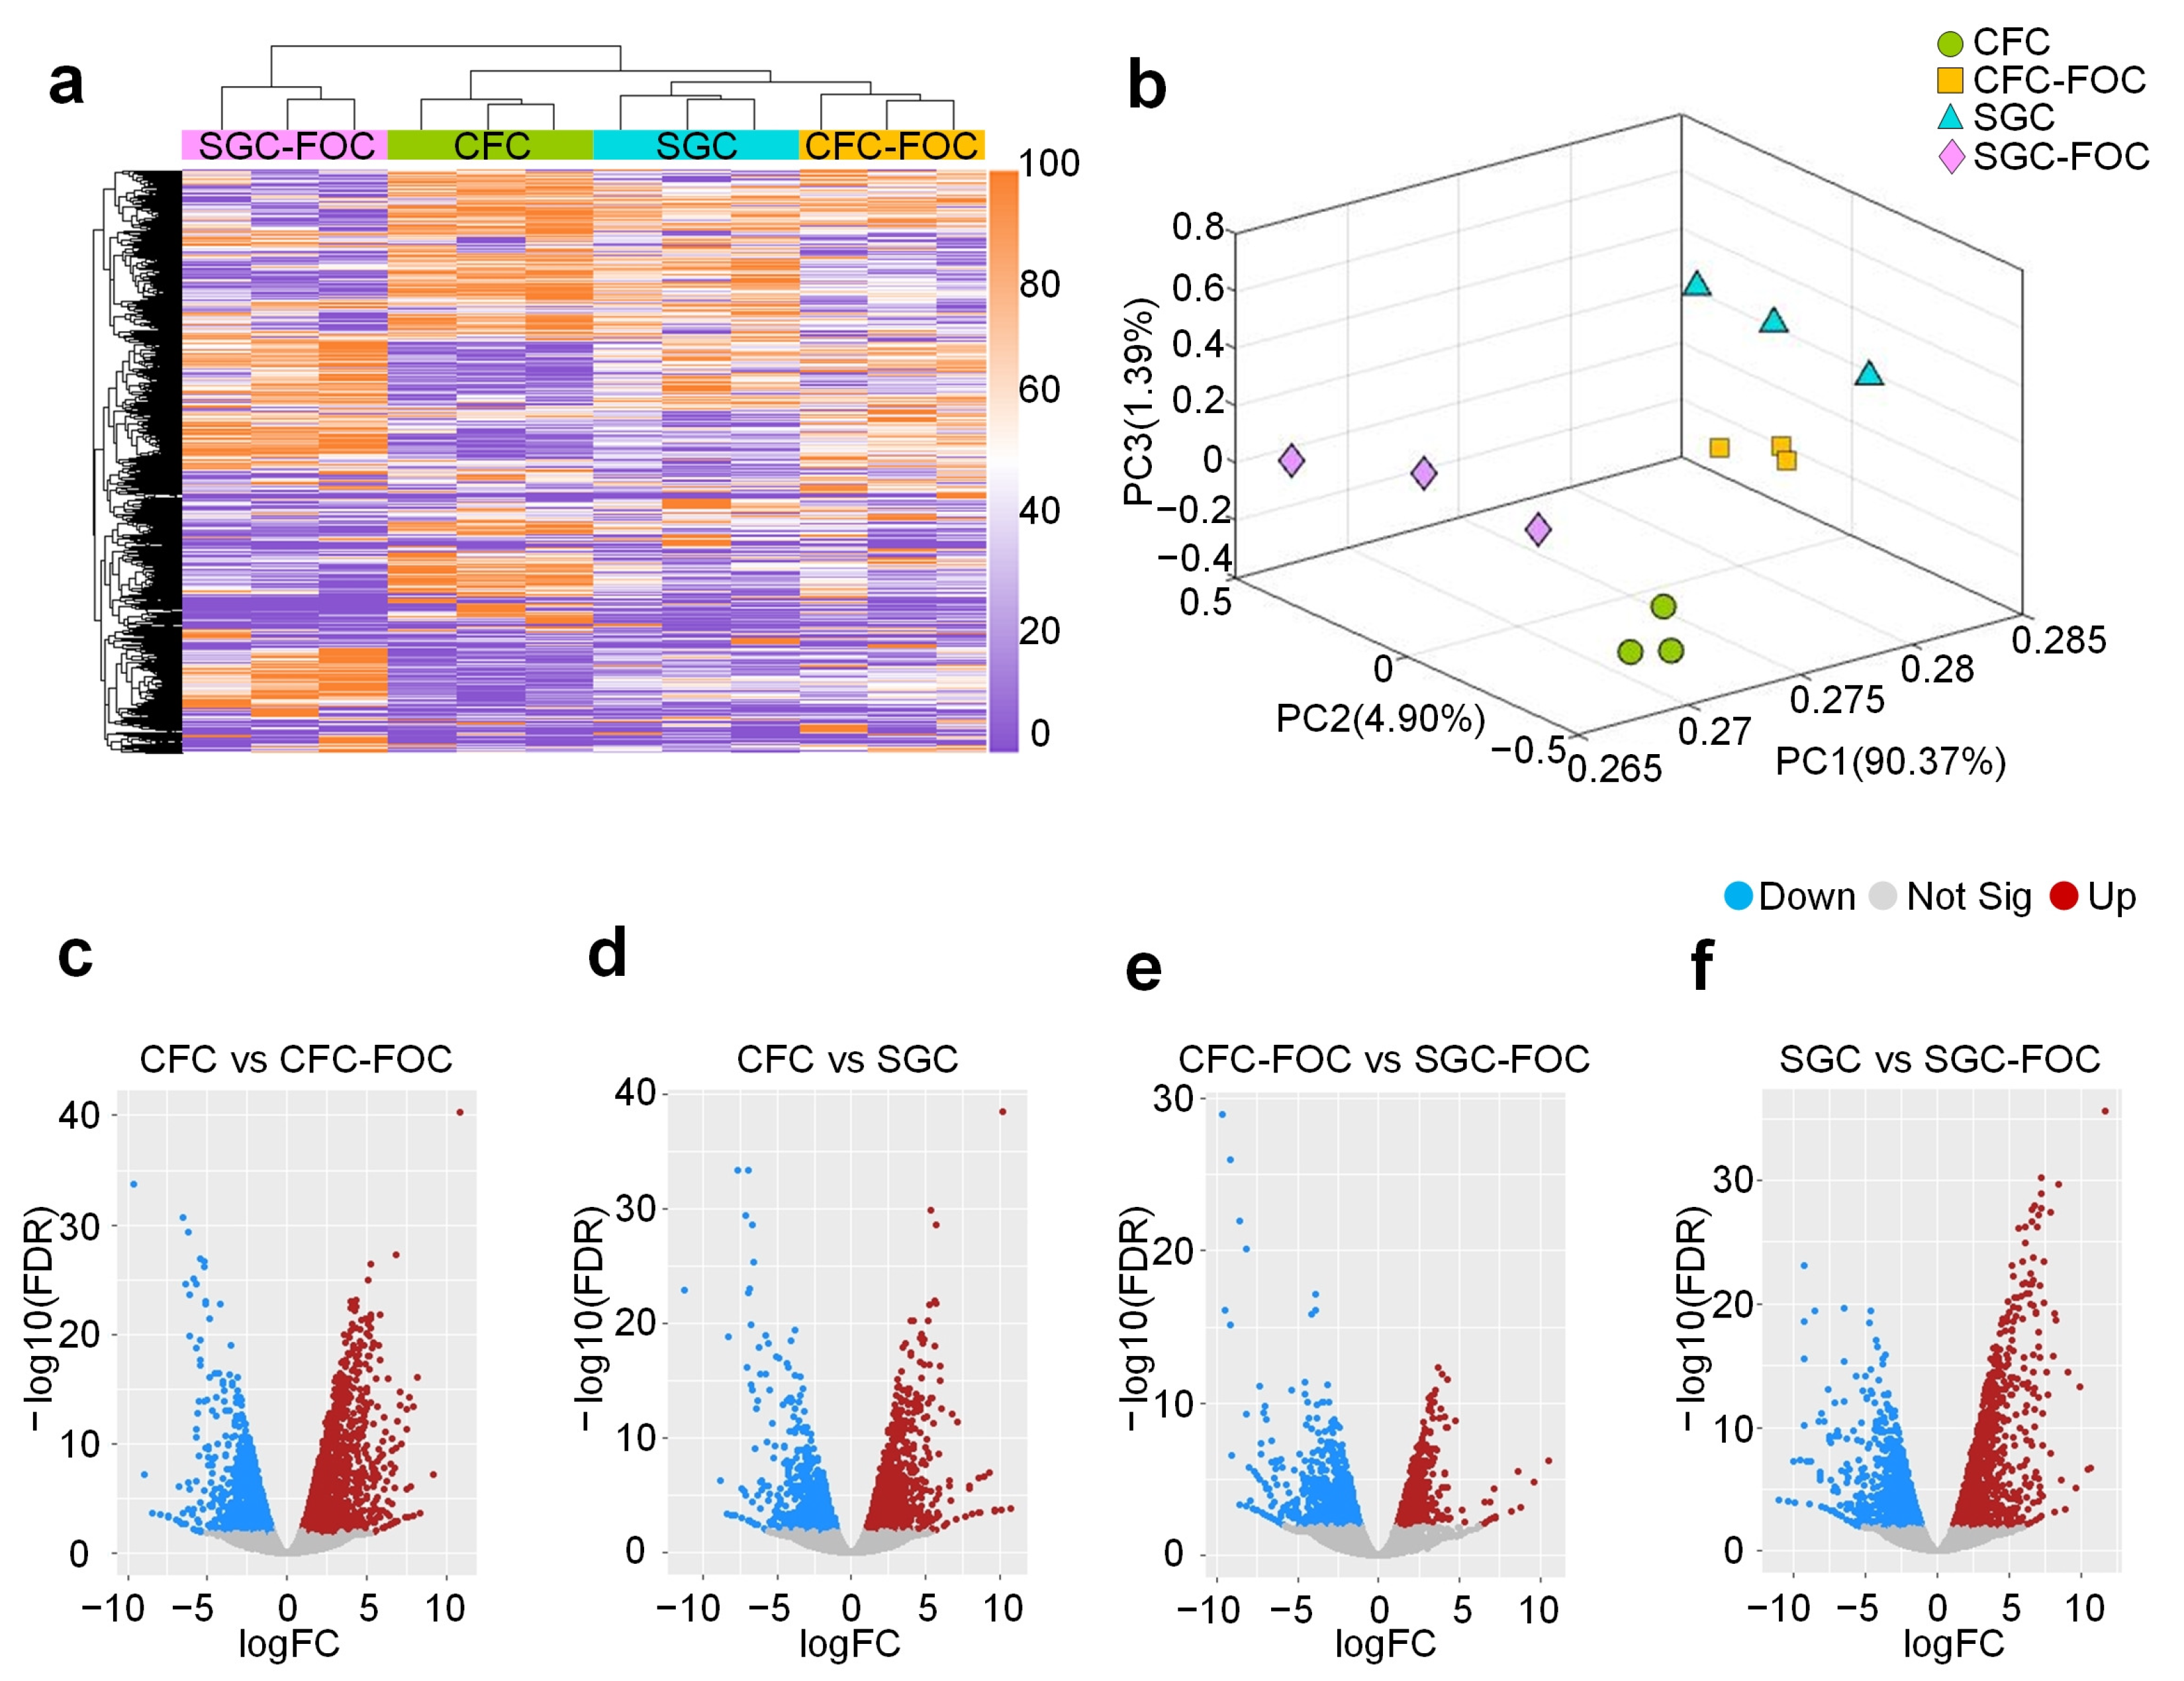
RNA-Seq profiles were produced for 3 replicates from the four groups of cucumber leaf samples, respectively. For each sample, we obtained over 17 million raw reads (Supplementary Table S1). After aligning these RNA-Seq profiles to cucumber genome, we found that over 93% of the obtained sequencing reads could be mapped to the reference genome used (Supplementary Table S1). To investigate the overall transcriptomic differences between the different samples after FOC treatments, we performed biclustering and PCA analysis using the gene expression values (FPKM) of all the samples. A clear clustering among the four sample groups was observed Figure 2a, and SGC-FOC showed the largest distance to other groups. The results of PCA (in Figure 2b) also showed that samples clustered tightly by group.
Figure 2.
Gene expression patterns of the 12 cucumber leave samples from the four groups. (a) The bi-clustering of genes expression profiles of the 12 cucumber samples from the 4 groups. The values shown are the log2(FPTM + 1) of the transcripts. (b) The PCA analysis of transcripts expression profiles of the 12 cucumber samples from the 4 groups. (c) DEGs when comparing their expression levels in CFC and CFC-FOC. (d) DEGs when comparing their expression levels in CFC and SGC. (e) DEGs when comparing their expression levels in CFC-FOC and SGC-FOC. (f) DEGs when comparing their expression levels in SGC and SGC-FOC. In Part (c–f), up- and down-regulated genes are shown in red and green dots, respectively. The source data of Part (a,b) are available in Table S29. The source data of Part (c–f) were available in Supplementary Tables S3–S6.
The four groups of samples were then screened for DEGs with edgeR (see Section 4 for details). In the comparison between CFC vs. CFC-FOC, 1458 down-regulated genes and 1688 up-regulated genes were found, respectively (Figure 2c and Supplementary Table S4). A comparison was made between SGC vs. SGC-FOC, 1523 down-regulated genes and 1083 up-regulated genes were found, respectively (Figure 2f and Supplementary Table S5). When comparing SGC to CFC to see the change of gene expression in leaves when the grafting to different rootstocks, 887 down-regulated genes and 1132 up-regulated genes were found (Figure 2d and Supplementary Table S6). We compared CFC-FOC to SGC-FOC and found 707 down-regulated genes and 502 up-regulated genes (Figure 2e and Supplementary Table S7).
2.3. Functional Analysis of DEGs
The DEGs mentioned above were applied to KOBAS (v3.0) [33] for KEGG pathway enrichment analysis. We found that the up-regulated genes in in the comparisons of CFC vs. CFC-FOC and SGC vs. SGC-FOC were significantly enriched in the pathways of plant-pathogen interactions, phenylpropanoid biosynthesis, phenylalanine metabolism, MAPK signaling pathway in plants, and biosynthesis of secondary metabolites (Supplementary Figure S1). These results suggested that in both CFC-FOC and SGC-FOC, some genes related resistance were upregulated to cope with the FOC infection. Down-regulated genes in both groups were significantly enriched in the ribosome, porphyrin and chlorophyll metabolism, and fatty acid elongation pathways (Supplementary Figure S1), suggesting that the normal growth of plants, in either CFC-FOC and SGC-FOC, were disturbed after FOC infection.
We focused on the plant pathogen interaction pathway and MAPK pathway, which play important roles in resistance of pathogen invasion [34]. At the timepoint evaluated, the plant pathogen interaction pathway and MAPK pathway appeared less induced in CFC-FOC (see Supplementary Figure S2). In the meantime, the CFC-FOC group shows much stronger resistance capabilities to FOC infection than the SGC-FOC group, as shown in Figure 1a,b. Together, these results indicate that the activation of these two pathways fail to prevent or weaken the FOC infection in SGC plants. Therefore, a different mechanism, other than activation of the plant pathogen interaction pathway and the MAPK pathway, should be employed by the CFC plants to cope with the FOC infection.
2.4. Analysis of NAC Genes After FOC Infection
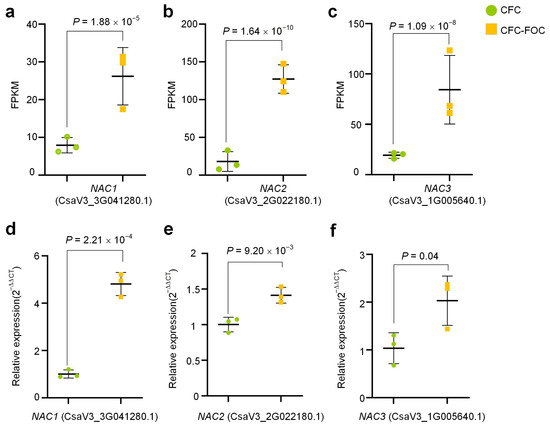
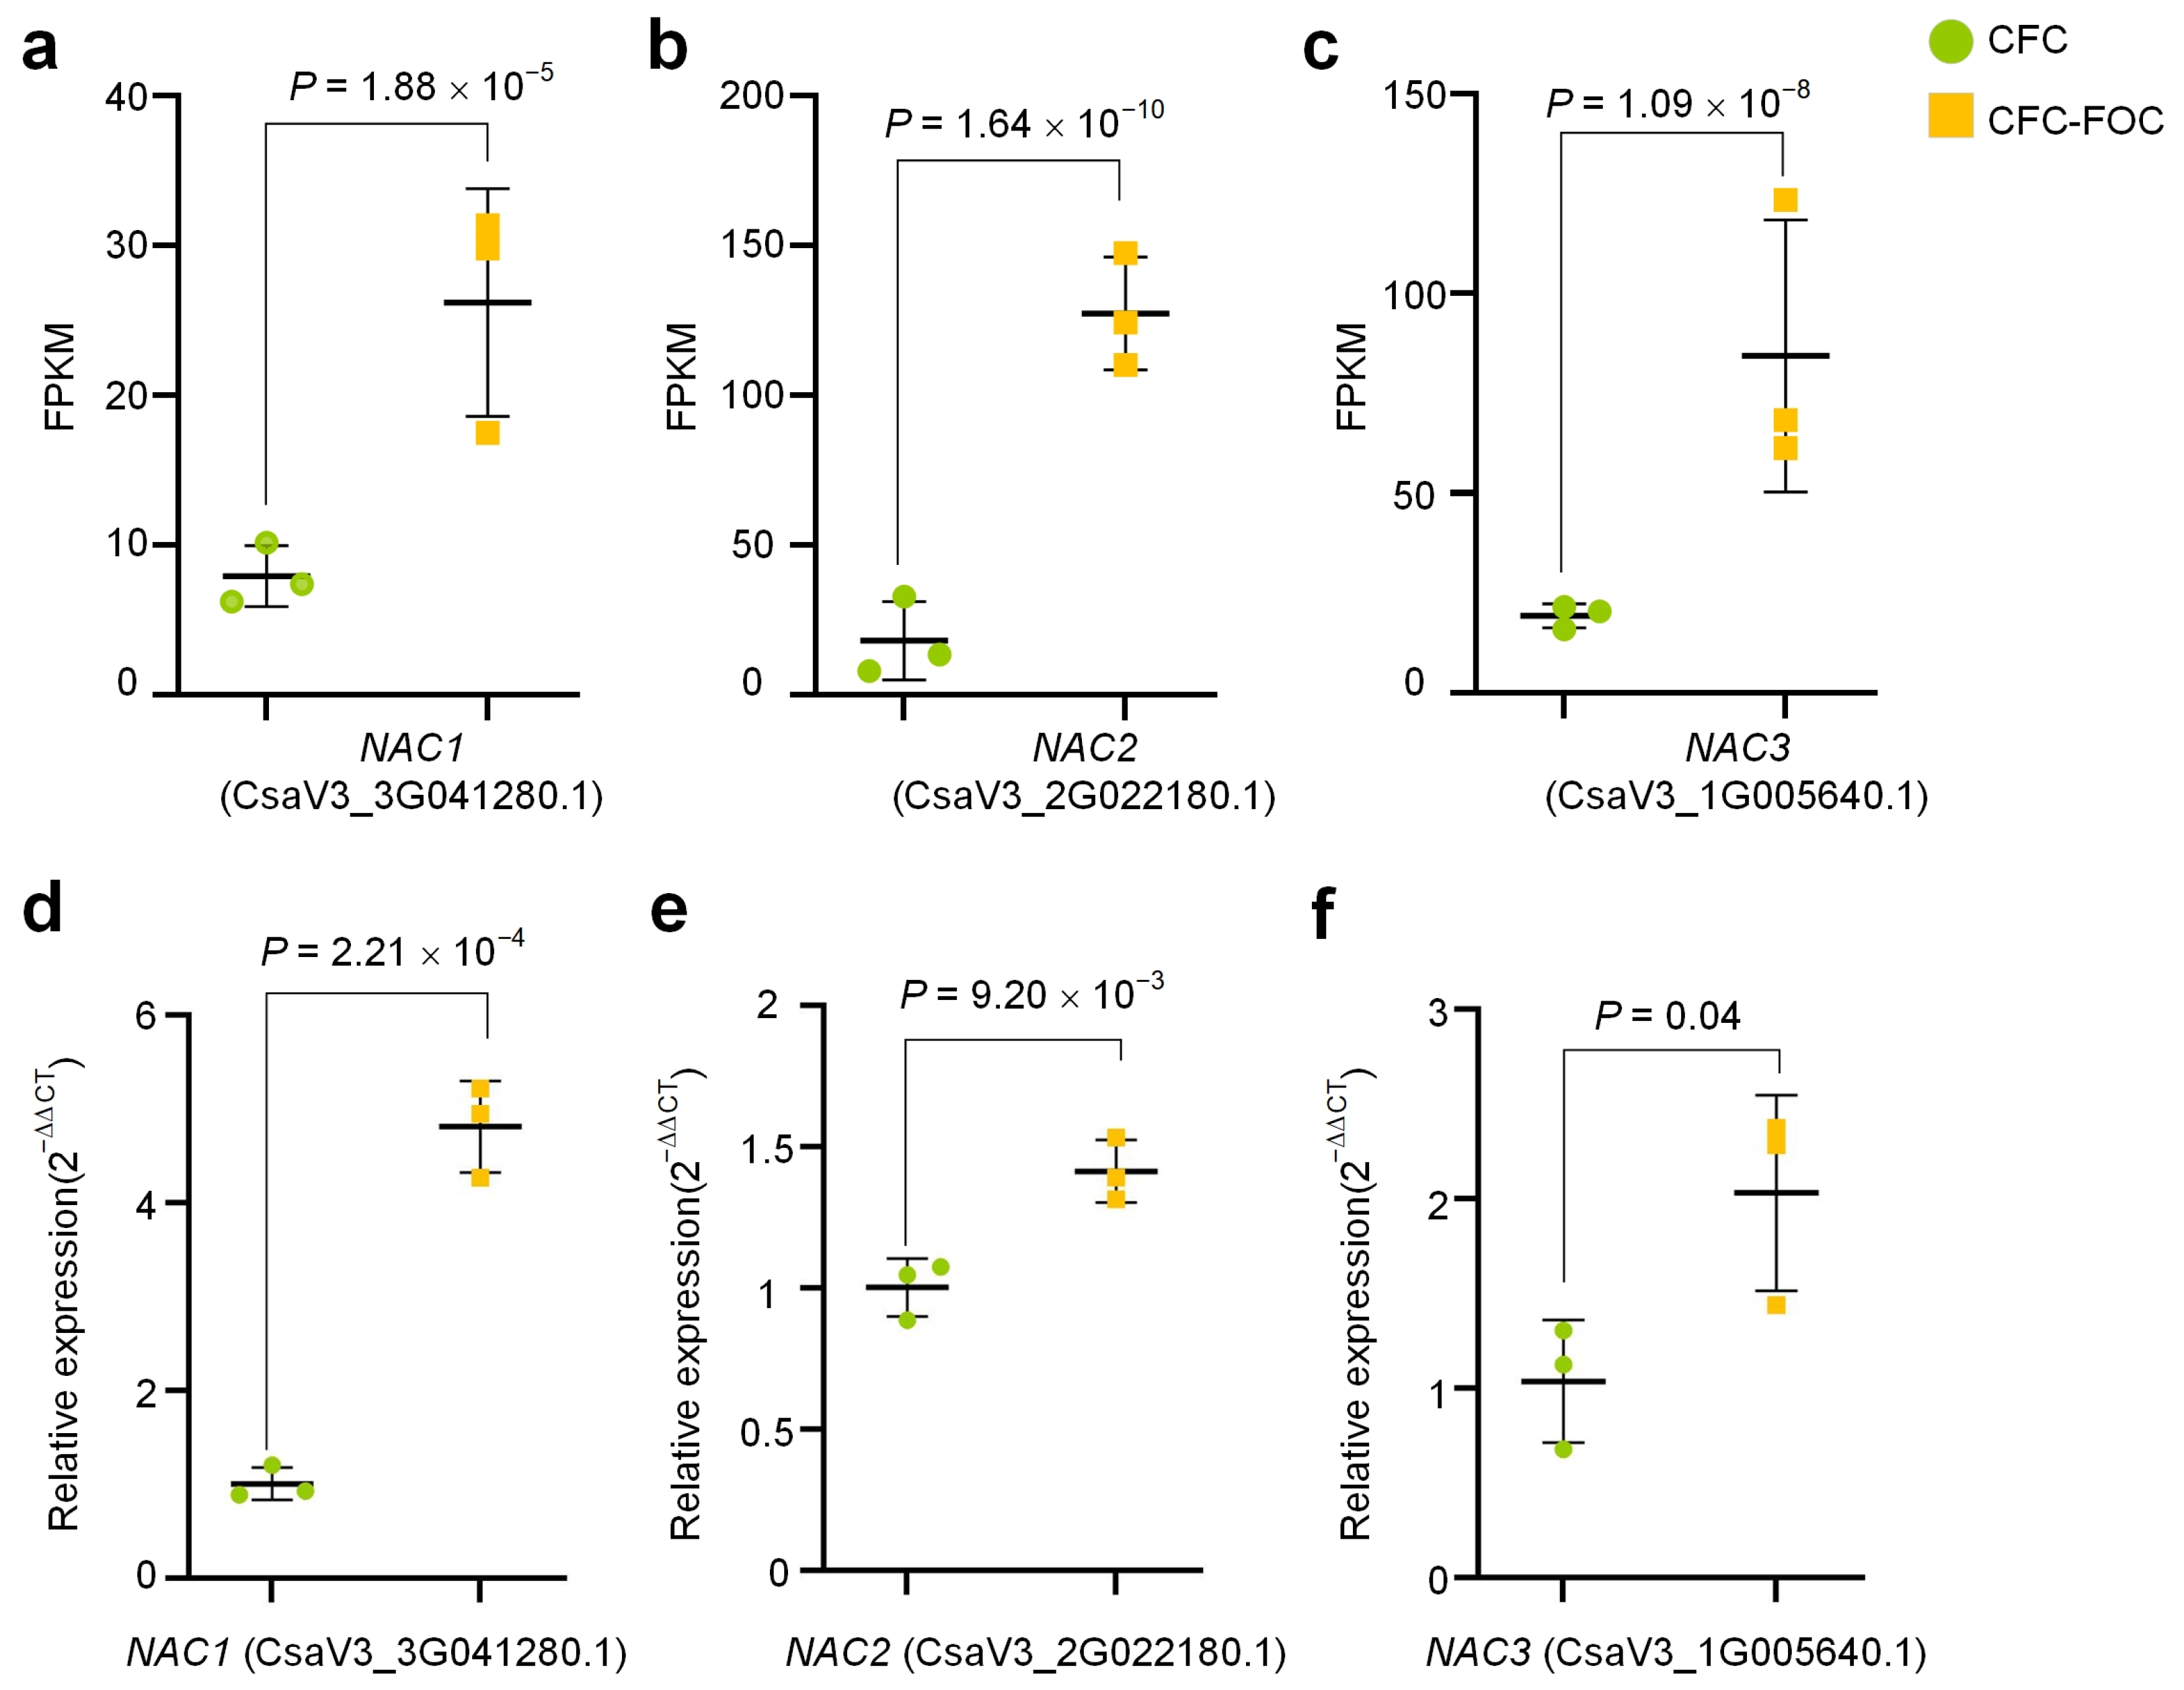
Because NACs were upregulated in figleaf gourds after FOC infection [6] and NACs played important roles in biotic stresses of plants [14,15,16,17], we examined the expression of NACs in our samples. We found that the expression levels of the 4 NACs (NAC1/2/3/5) were significantly upregulated in CFC-FOC compared to CFC in the RNA-Seq profiles (Figure 3a–c, and Supplementary Figure S7b). In qRT-PCR experiments, the expression levels of these 4 NACs were also notably higher in the CFC-FOC versus to CFC (Figure 3d–f and Supplementary Figure S7d), which were consistent with the results of RNA-Seq profiles. In addition, NAC4 was upregulated in CFC-FOC compared to CFC based on RNA-Seq profiles (), however it was significantly upregulated in CFC-FOC compared to CFC based on qRT-PCR results (see Supplementary Figures S7a and S7b, respectively). It was thus hypothesized that these 5 NACs played important roles in the resistance of CFC against FOC infection.
Figure 3.
The expression of 3 NAC genes in the CFC and CFC-ROC samples. (a–c) The expression of NAC1 (CsaV3_3G041280.1), NAC2 (CsaV3_2G022180.1) and NAC3 (CsaV3_1G005640.1) in the RNA-Seq profiles of the CFC and CFC-FOC samples, respectively. (d–f) The relative expression levels of the 3 NACs detected by qRT-PCR experiments in the CFC and CFC-FOC samples, respectively. The source data are available in Supplementary Table S30.
2.5. sRNA-seq Profiles from Different Groups of Samples
Because NAC were conserved targets of miR164 family, we thus generated small RNA sequencing profiles for the same samples of the four groups, i.e., SGC, SGC-FOC, CFC, and CFC-FOC, respectively. For each profile, we obtained over 24 million raw reads (Supplementary Table S8) and the quality of sRNA-seq reads were generally good after being examined with FASTQC [35]. Totally, 357,983,232 reads represented by 15,768,664 unique reads were obtained in these 12 sRNA-seq profiles (Supplementary Table S9). About 60% of the sequencing reads were successfully aligned to the reference genome, suggesting high-quality library construction. Length distribution analysis was performed on both total reads and unique sequences across all 12 sRNA-seq profiles. A prominent bimodal peak at 21 nt and 24 nt was consistently observed in all libraries for both read categories (Supplementary Figure S3), further confirming that the libraries were of high quality.
2.6. Exploring the Expression of Conserved miRNAs Across Diverse Samples
Using previously described methods [36,37,38,39], totally, 251 miRNA genes were identified in cucumber. After carefully comparing previously reported miRNAs in cucumber [40,41], we identified 85 newly discovered miRNAs, accounting for 34.4% out of the 251 miRNAs (Figure S4a and Supplementary Table S10). By making comparisons with the numbers of conserved miRNAs in Arabidopsis and rice, it was found that 124 miRNAs from 22 highly conserved miRNA families were found in cucumber (Figure S4b and Supplementary Table S11).
When comparing CFC-FOC to CFC, 7 and 8 miRNAs were up- and down-regulated in CFC-FOC, respectively (Figure S4c and Supplementary Table S13). When comparing SGC-FOC to SGC, 9 up-regulated and 7 down-regulated miRNAs were found in SGC-FOC (Figure S4d and Supplementary Table S14). In the comparison between CFC and SGC, 7 and 25 miRNAs were up- and down-regulated in SGC, respectively (Figure S4e and Supplementary Table S15). In the comparison between SGC-FOC and CFC-FOC, 9 and 14 are up- and down-regulated in SGC-FOC (Figure S4f and Supplementary Table S16).
2.7. Identification of Target Genes of Conserved miRNAs
For the purpose of miRNA target discovery in cucumber, four degradome sequencing libraries were prepared from the four distinct experimental sample groups, i.e., CFC, CFC-FOC, SGC, and SGC-FOC, respectively. Over 18 million raw reads were generated per library across all four degradome sequencing datasets (Supplementary Table S16). Over 78% of sequencing reads in the CFC, CFC-FOC and SGC degradome profiles could be aligned to cucumber genome, however only 60.5% sequencing reads in the SGC-FOC degradome profile could be mapped to cucumber genome (Supplementary Table S17). This may indirectly suggested that there were more transcripts from FOC in the samples of the SGC-FOC group, which was consistent with the more severe infection phenotype of SGC-FOC compared to CFC-FOC (see Figure 1a,b).
We identified cucumber target genes using the SeqTar [42] algorithm for 502 mature miRNAs (Derived from 251 miRNA genes, each gene can generate two mature sequences: 5p and 3p). Totally, we identified more than 4000 miRNA:target pairs with mismatches (≤4) and valid read counts (≥1) in at least one of the four degradome profiles (Supplementary Tables S18–S21, respectively). Comparative analysis with Arabidopsis and rice revealed 125 conserved miRNA-target relationships (Supplementary Tables S22 and S23).
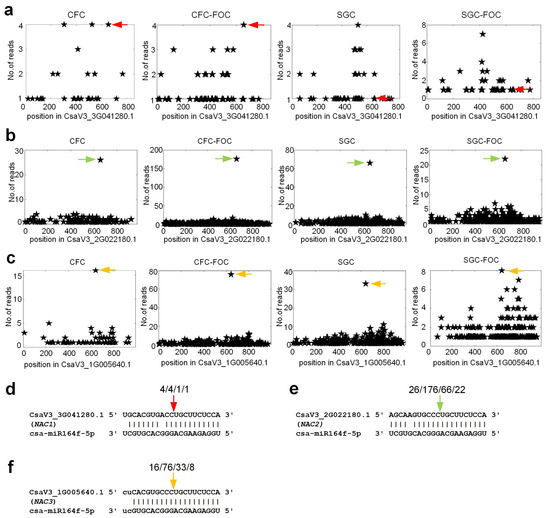
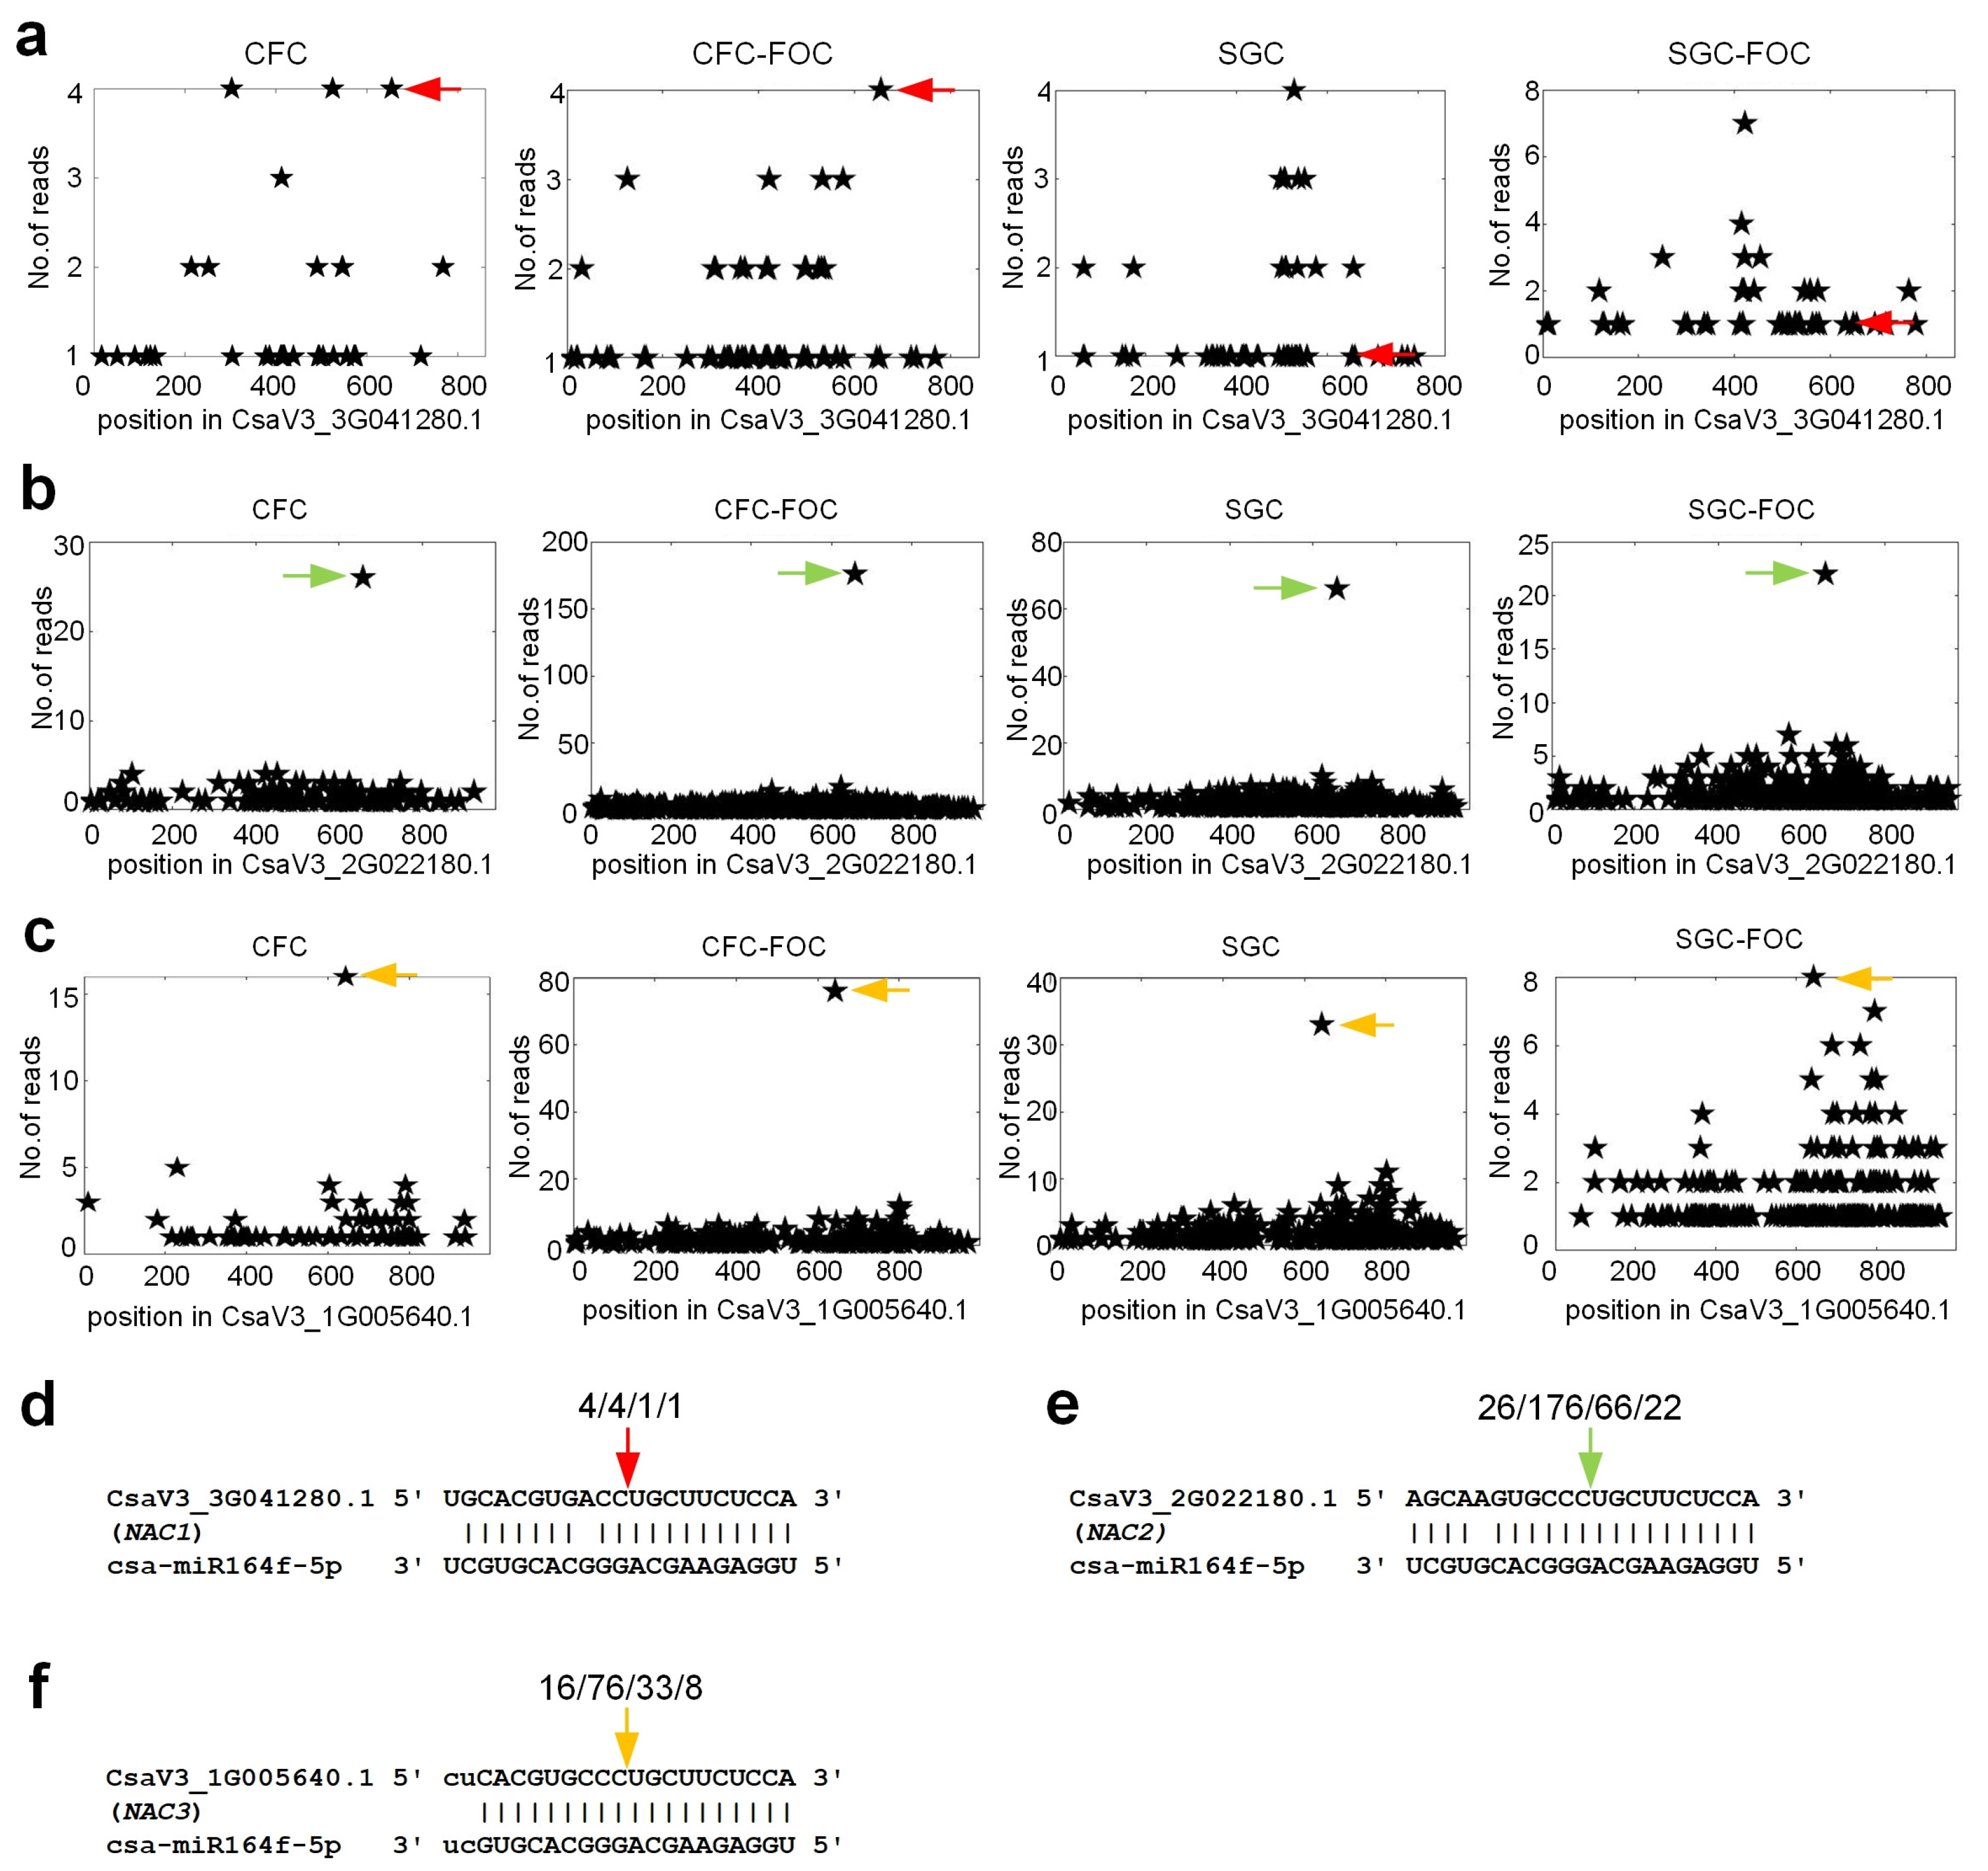
In the degradome results, we focused on the miR164 family and its target genes, the NAC transcription factors that played important roles in the plant defense. There were at least 5 csa-miR164f-5p:NAC pairs with mismatches (≤4) and valid read counts (≥1). As shown in Figure 4 and Figure S7, csa-miR164f-5p targted NAC1 (CsaV3_3G041280.1), NAC2 (CsaV3_2G022180.1), NAC3 (CsaV3_1G005640.1), NAC4 (CsaV3_1G002470.1) and NAC5 (CsaV3_5G038170.1). Compared to CFC, much more degradome reads were detected at the complementary site of csa-miR164f-5p on NAC2, NAC3 and NAC5 in the CFC-FOC (Figure 4b, Figure 4c and Figure S7f, respectively), suggesting that cleavage events on NAC2, NAC3 and NAC5 were more pronounced in CFC-FOC.
Figure 4.
The T-plots and complementary sites of selected csa-miR164f-5p:NAC pairs. (a) The T-plots of NAC1 (CsaV3_3G041280.1) in the CFC, CFC-FOC, SGC and SGC-FOC degradome profiles, respectively. (b) The T-plots of NAC2 (CsaV3_2G022180.1) in the CFC, CFC-FOC, SGC and SGC-FOC degradome profiles, respectively. (c) The T-plots of NAC3 (CsaV3_1G005640.1) in the CFC, CFC-FOC, SGC and SGC-FOC degradome profiles, respectively. (d) The complementary site of csa-miR164a-5p on CsaV3_3G041280.1. (e) The complementary site of csa-miR164f-5p on CsaV3_2G022180.1. (f) The complementary site of csa-miR164f-5p on CsaV3_1G005640.1. In Part (a–c), the x-axis is the position on the transcript, and y-axis is the number of degradome reads detected from a position. The arrows in Part (a), (b), and (c) correspond to the positions pointed by arrows of the same colors in Part (d), (e), and (f), respectively. In Part (d), (e), and (f), the numbers above the arrows represent the numbers of valid degradome reads detected from the CFC, CFC-FOC, SGC and SGC-FOC degradome profiles, respectively.
In comparison, the numbers of degradome reads at the complementary site of csa-miR164f-5p on NAC2 and NAC3 in SGC-FOC were smaller than those of SGC and CFC-FOC (Figure 4b and Figure 4c, respectively), suggesting less pronounced cleavage events of csa-miR164f-5p on NAC2 and NAC3 in SGC-FOC than in CFC-FOC and even in SGC. Therefore, these results indicated that the csa-miR164f-5p:NAC2/NAC3 pairs were activated in CFC-FOC to prevent the over-expression of NAC2/NAC3. However in SGC-FOC, the csa-miR164f-5p:NAC2/NAC3 pairs were not elevated to resist the infection of FOC.
For other examples of conserved miRNA targets, the miR160 family targets the auxin response factors (ARF) [43]. The miR171 family targets the Scarecrow-like transcription factor (SCL) [44]. As shown in Supplementary Figure S5, csa-miR160c-5p targeting an ARF gene (CsaV3_1G023020.1) and csa-miR171b-3p targeting an SCL gene (CsaV3_6G009170.1) were confirmed in all of the four degradome sequencing profiles.
By using a very stringent criteria (see Section 4), we also predicted hundreds of some new targets of conserved miRNAs in cucumber from each of the 4 degradome profiles (as listed in Supplementary Tables S24–S27, respectively). For examples, some new targets of csa-miR157b-3p, csa-miR172b-3p, csa-miR393d-5p, csa-miR396g-5p, csa-miR395a-3p not being reported previously were shown in Supplementary Figure S6. For all of these targets, we detected degradome reads in at least three of the four degradome profiles generated. Further experiments are needed to verify the authenticity and the functional relevances of these new targets.
2.8. Correlation Analysis of csa-miR164f-5p and Its NAC Target Genes
We performed correlational analysis between miRNAs and their putative targets using normalized expression data as a further validation step. Because both sRNA-Seq and RNA-Seq profiles were obtained using the same tissue samples, the resulting correlation coefficients provide a direct indication of the functionality of miRNA-mediated regulation. The correlation coefficient between csa-miR164f-5p and NAC1 was positive (Supplementary Figure S8a), suggesting that NAC1 might be regulated by other factors. As shown in the Supplementary Figure S8b–e, the expression levels of csa-miR164f-5p and those of four NAC genes, i.e., NAC2 (CsaV3_2G022180.1), NAC3 (CsaV3_1G005640.1), NAC4 (CsaV3_1G002470.1) and NAC5 (CsaV3_5G038170.1), were negatively correlated, with correlation coefficient values of −0.20, −0.51, −0.55, and −0.43, respectively. Their p-values were 0.53, 0.09, 0.06, and 0.16, respectively, failing to reach statistical significance. However, due to the complexity of regulatory mechanisms within plants—including temporal and spatial mismatches between miRNA and target mRNA expression, translational suppression, and buffering effects from multi-layered regulatory networks—we interpret these findings to indicate that csa-miR164f-5p repressed these four NAC genes in the analyzed samples.
2.9. Validating That csa-miR164f-5p Directly Inhibits NAC2
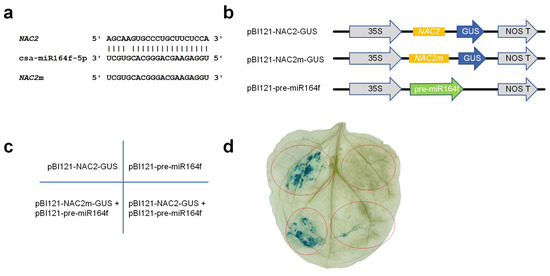
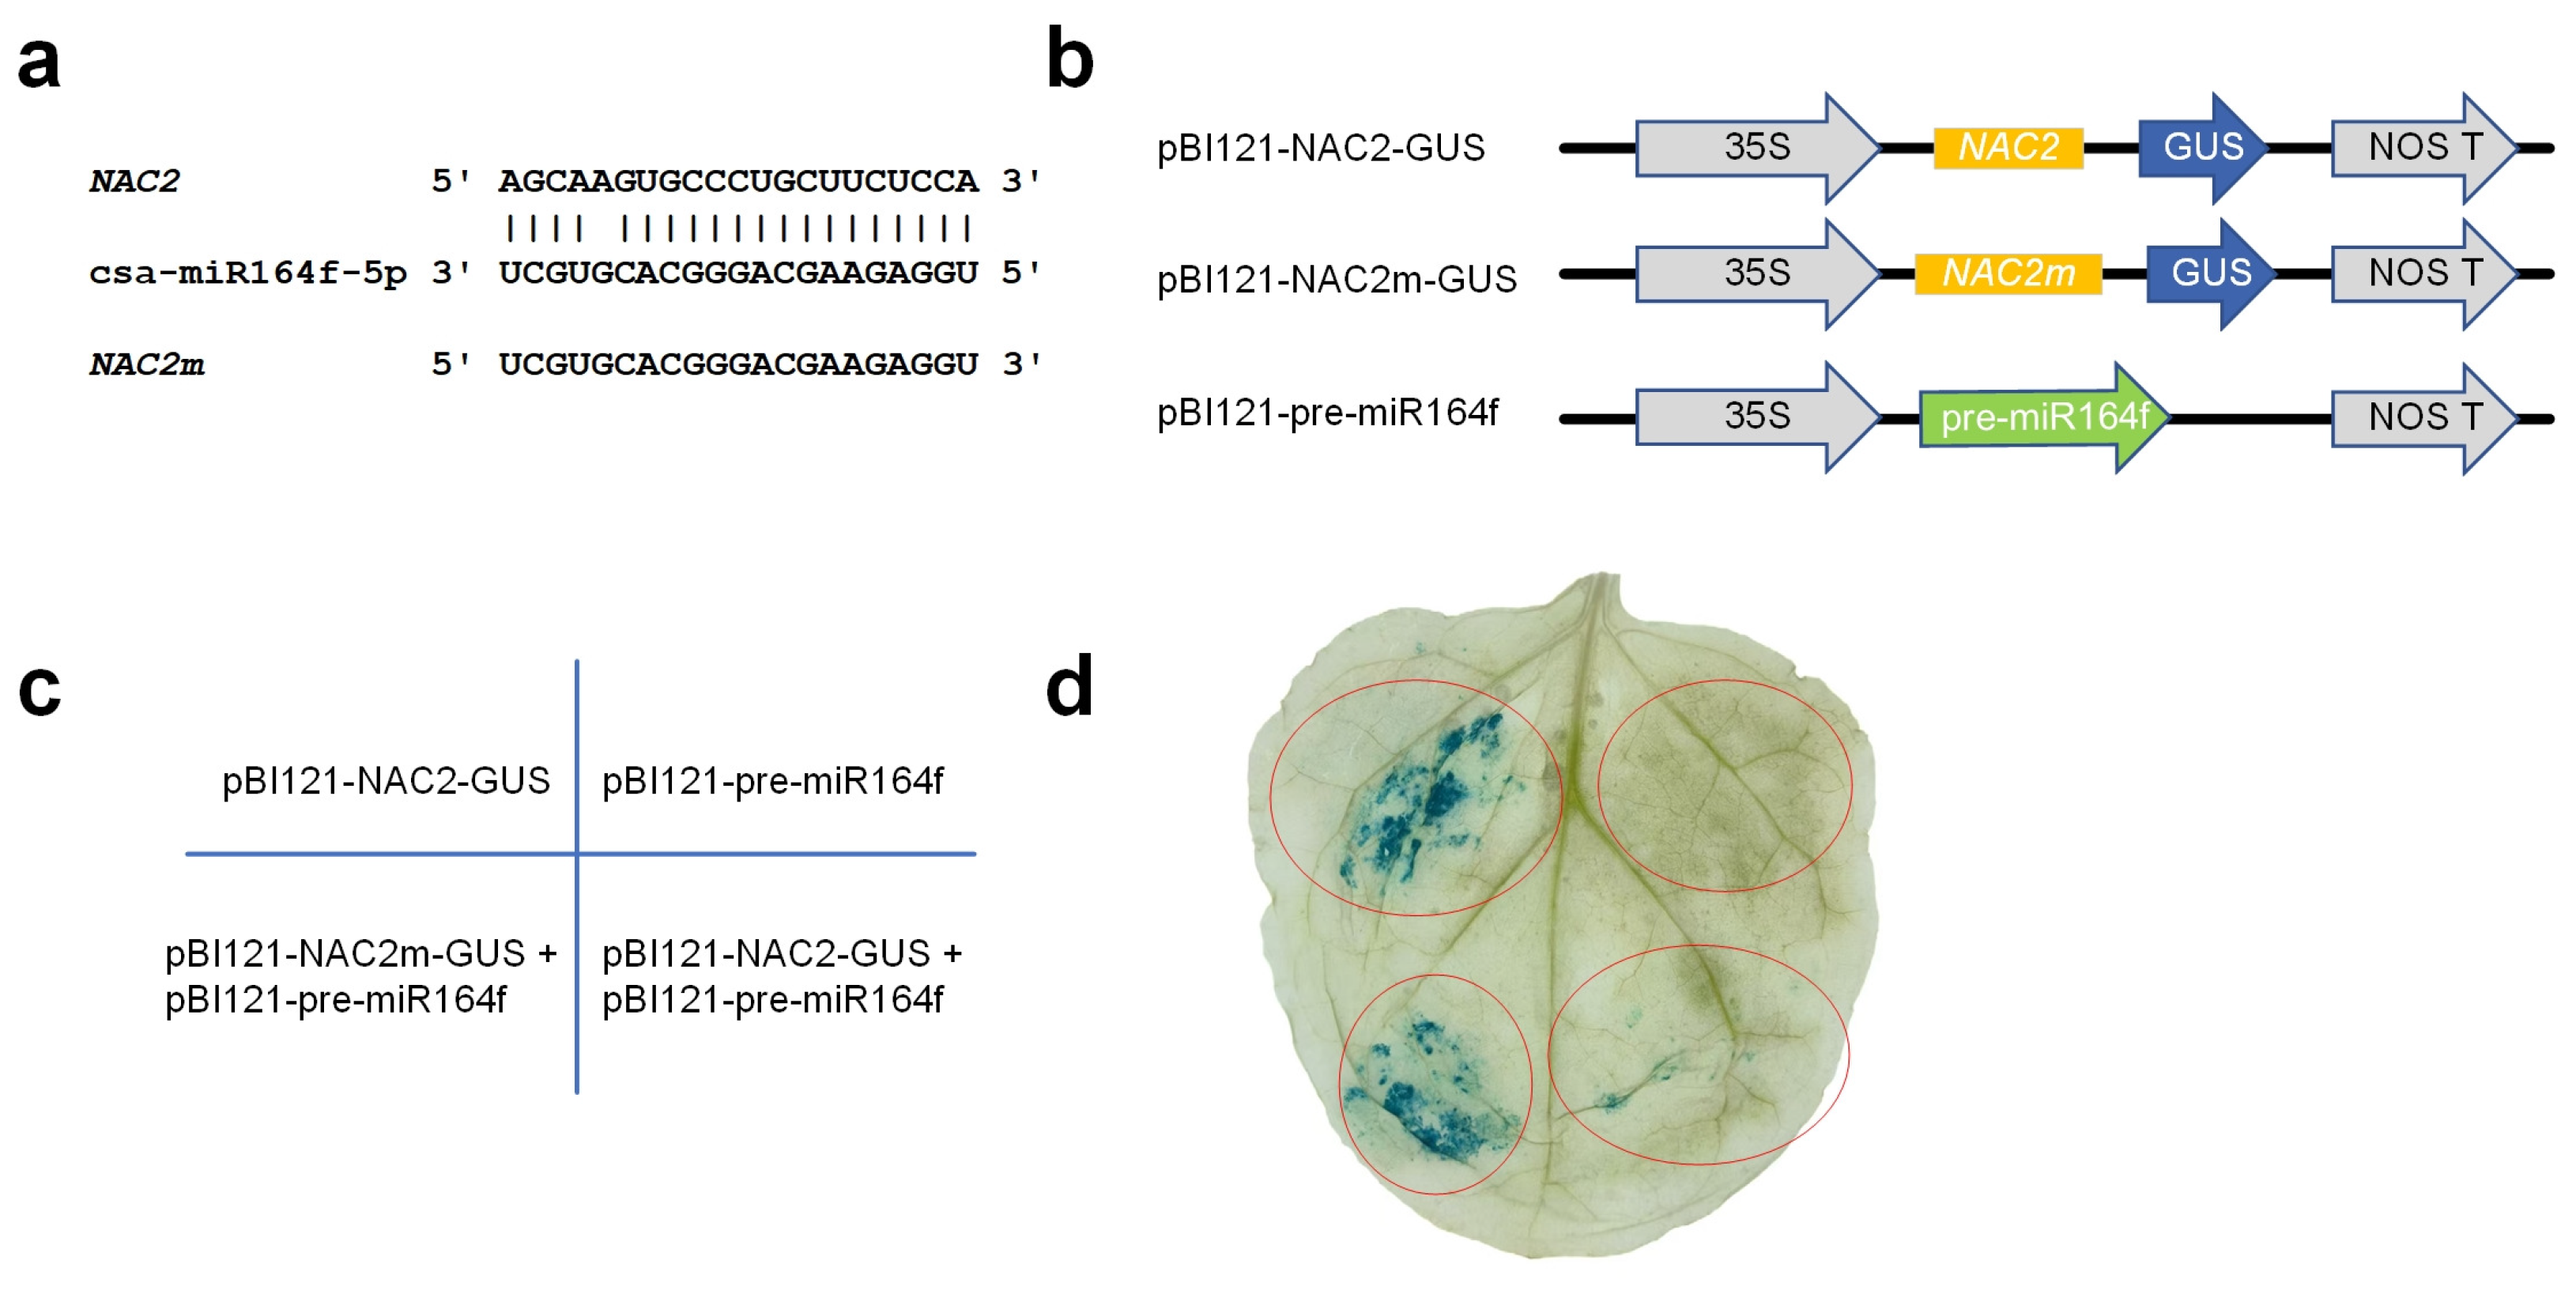
The relationship between csa-miR164f-5p and NAC2 was further verified through GUS histochemical staining in N. benthamiana co-transfection experiments. As shown in Figure 5a, we mutated the complementary site of csa-miR164f-5p on NAC2 which destructed the complementarity between csa-miR164f-5p and NAC2. GUS expression was significantly reduced in leaves simultaneously transformed with pBI121-NAC2 and pBI121-pre-csa-miR164f (Figure 5d). However, when we simultaneously transfected pBI121-NAC2m and pBI121-pre-csa-miR164f, the activity of GUS did not change (Figure 5d). These results indicated that csa-miR164f-5p inhibited the expression of NAC2 through the identified complementary site in Figure 5a.
Figure 5.
Validating that csa-miR164f-5p directly inhibits the expression of NAC2. (a) Sequences of csa-miR164f-5p, NAC2, and NAC2m, i.e., NAC2 with mutated complementary site of csa-miR164f-5p. (b) Schematic diagrams of constructs for NAC2, NAC2m, and precursor of csa-miR164f. (c) A schematic view of the experimental design for Agrobacterium injection into N. benthamiana. (d) -Glucuronidase (GUS) phenotypes by histochemical staining for the arrangement in Part (c). The regions marked in red circles are the regions with expected positive staining.
2.10. Transient Overexpression Assay of NAC2 and csa-miR164f in Cucumber
Transient overexpression experiments were conducted in cucumber cotyledons using the pBI121 vector. qRT-PCR results showed that NAC2 expression was significantly upregulated in the NAC2-OE treatment group compared to the empty vector control group (Supplementary Figure S9a). In the NAC2 co-overexpressed with miR164f group (NAC2+miR164f-OE), NAC2 expression decreased compared to the NAC2-OE group (Supplementary Figure S9a), confirming the negative target regulation of miR164f on NAC2, consistent with the sequencing results from the degradation group.
Four days after FOC inoculation, NAC2-OE leaves exhibited smaller lesion areas than the control group, while miR164f-OE leaves showed the largest lesion areas. Leaves co-expressing NAC2 and miR164f-OE displayed intermediate lesion sizes (Supplementary Figure S9b,c). These results indicate that NAC2 positively regulates cucumber resistance to FOC, while miR164f negatively regulates disease resistance by suppressing NAC2 expression.
3. Discussion
3.1. Grafting-Induced Resistance: Comparative Analysis and Mechanistic Insights
In this study, we observed that grafted cucumbers exhibited enhanced resistance to FOC infection, to contextualize these findings within the broader framework of rootstock-mediated resistance, we compared our results with previous studies on grafted cucurbits. In wax gourd grafted with pumpkin [34], DEGs were primarily enriched in the MAPK signaling pathway and the cutin, suberin, and wax biosynthesis pathway, consistent with the pathway enrichment observed in our study. Wang et al. [45] reported that upregulation of wax and phenylpropanoid biosynthesis pathways contributes to enhanced disease resistance in figleaf gourd-grafted cucumber. Similarly, in lily, phenylpropanoid metabolites such as hydroxycinnamic acid, flavonoids, and lignin play crucial roles in defense against wilt, with ethylene response factors (ERFs) regulating their biosynthesis [46]. In our study, at 6 days post-infection, the induction levels of MAPK and plant-pathogen interaction pathway genes were lower in CFC-FOC than in SGC-FOC, which may reflect distinct defense mechanisms in grafted plants or reduced pathogen load at the sampling time point. And the MAPK pathway genes, particularly those involved in ethylene biosynthesis (Supplementary Figure S2), were significantly activated in SGC-FOC but showed reduced induction in CFC-FOC. This differential activation raises the question of how defense signaling shifts from MAPK-mediated pathways toward NAC-ROS activation in resistant plants. Although our current data do not directly address the involvement of salicylic acid (SA) or jasmonic acid (JA) signaling, the observed activation of ethylene biosynthesis genes in the MAPK pathway (Supplementary Figure S2) suggests a potential link between ethylene and the regulatory shift. Ethylene is known to interact with ROS signaling [47,48,49] and may coordinate with NAC transcription factors to modulate defense outcomes. Future studies will focus on dissecting the cross-talk between ethylene, SA, and JA pathways in grafted cucumbers, as well as their potential interplay with the miR164-NAC2-ROS module in mediating resistance against FOC.
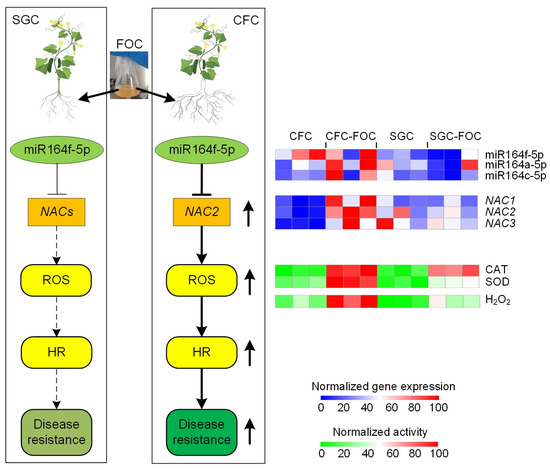
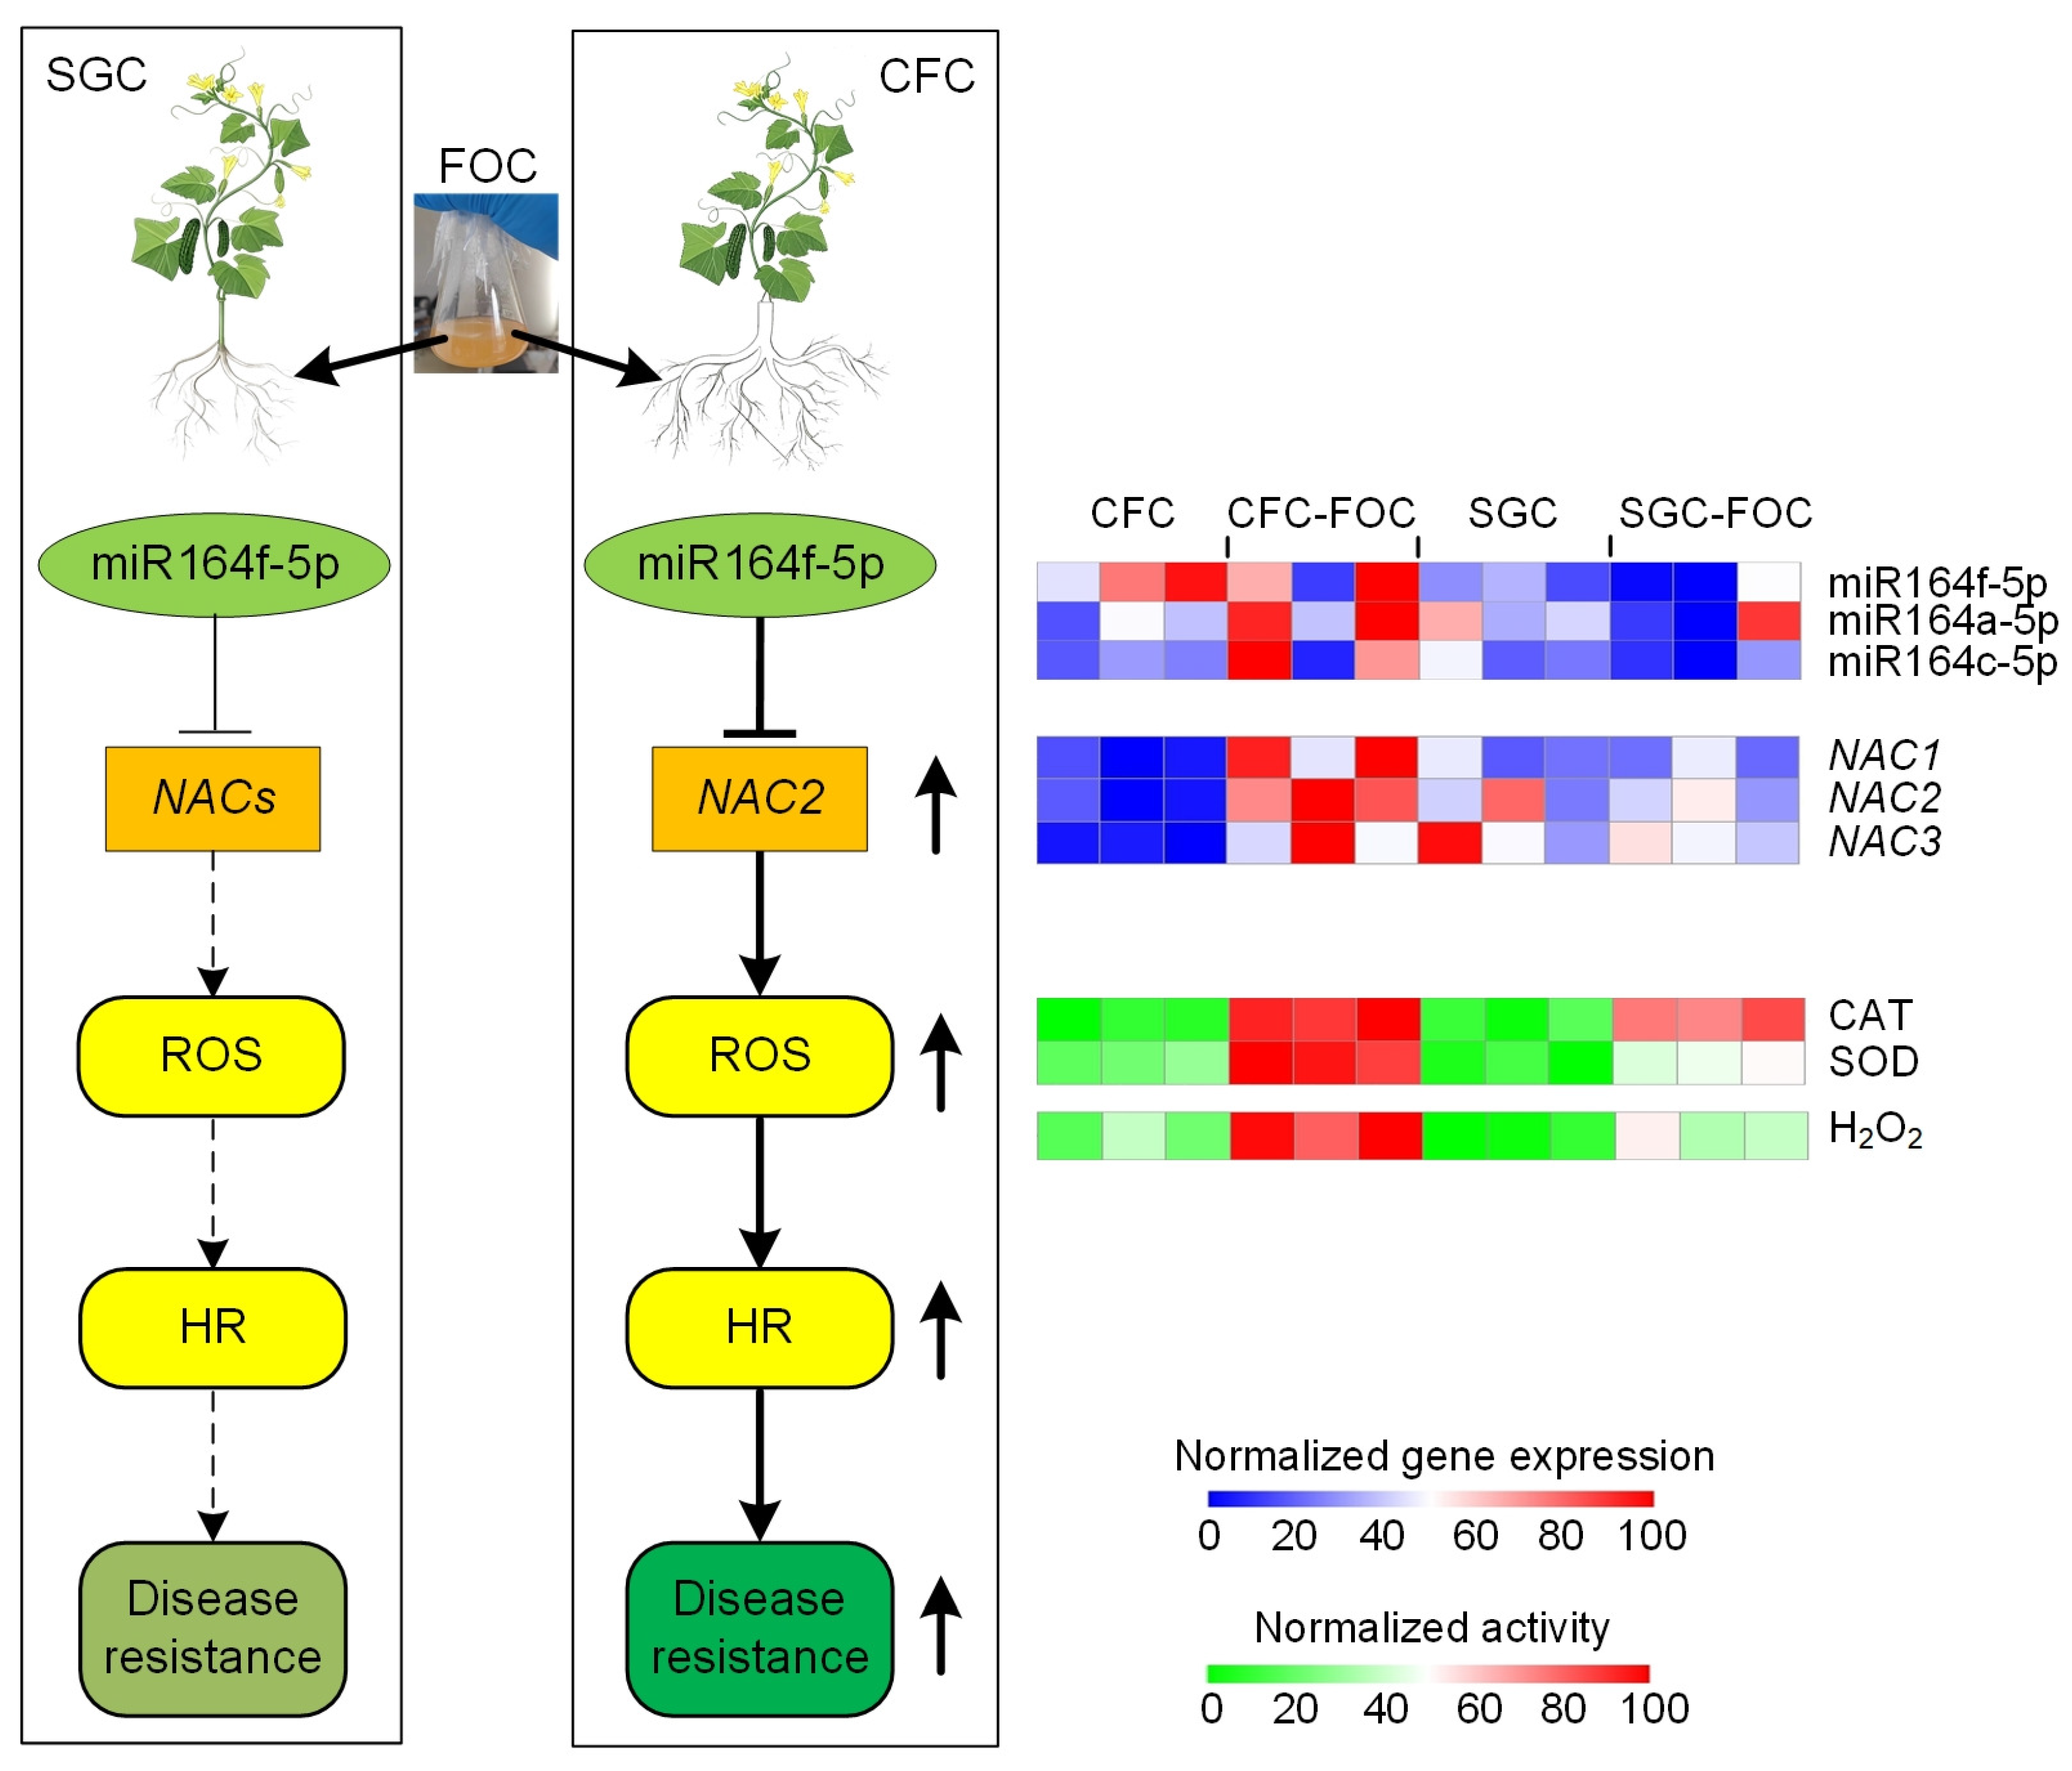
We found that three NACs (NAC1/2/3) targeted by csa-miR164f-5p were up-regulated in CFC-FOC (see Figure 6). Their up-regulation coincided with increased ROS accumulation (see Figure 6), suggesting a possible involvement in ROS-mediated defense responses. The expression levels of NAC2 and NAC3 negatively correlated with the expression level of csa-miR164f-5p. We also confirmed that csa-miR164f-5p repressed NAC2 (see Figure 5) and NAC2 positively regulates cucumber resistance to FOC (Supplementary Figure S11). In the transcriptome data, we discovered, ROS-related genes showed coordinated upregulation in CFC-FOC: Rboh (CsaV3_1G002910.1), CAT (CsaV3_6G031490.1), and POD (CsaV3_4G023610.1, CsaV3_6G043930.1) were all induced, suggesting grafted plants enhance both ROS generation and homeostasis maintenance. Notably, Rboh activation aligns with reports that NACs regulate Rboh expression under salt stress [50], raising the question of whether NAC2 directly activates Rboh in cucumber. Genome-wide NAC family analysis revealed additional FOC-responsive members warranting further study (Supplementary Figure S10). In contrast, SGC-FOC exhibited weak miR164 expression, limited NAC upregulation, correlating with susceptibility (see Figure 1a,b). Although NAC4/5 were upregulated in SGC-FOC (Supplementary Table S37), their potential role in ROS activation remains unclear. Further investigation is needed to determine whether and how NAC4/5 contribute to defense responses in grafted cucumbers. These results support a model (see Figure 6) in which csa-miR164 family members fine-tune NAC2/3 expression during defense responses in grafted cucumbers, potentially balancing ROS levels to avoid oxidative damage while promoting resistance [51,52].
Figure 6.
A schematic view of the role of NACs in response to FOC infection in CFC. The expression levels of NAC1/2/3 were upregulated in CFC, but did not change significantly in SGC after FOC infection. Consequently, ROS, as well as related enzymes such as CAT and SOD, was activated in CFC, but did not change severely in SGC. Next, hypersensitive response (HR) were enhanced in CFC, which resulted in elevated resistance to FOC in CFC. In this process, csa-miR164a/c/f-5p negatively regulated NAC2/3 to fine-tune their expression levels and avoid excessive ROS in CFC. In CFC, the upward arrow beside NAC2 indicates increased expression in CFC-FOC. The upward arrow beside ROS, HR and Disease resistance indicate increased effect in CFC-FOC. Whereas in SGC, a dotted arrow indicates a decrease in effect or loss of effect. The thin dull arrow from “miR164f-5p” to “NAC2” indicates decreased repression of miR164f-5p on NAC2 in SGC-FOC, compared to CFC-FOC. The source data are available in Supplementary Table S31.
Regarding plant defense, numerous studies focus on miRNA-target gene modules regulating plant resistance [53]. MicroRNA-guided regulation further fine-tunes NAC functions across species. Notably, the miR164 family extensively targets NAC transcription factors, participating in plant defense responses against biotic and abiotic stresses by negatively regulating their expression, representing a highly conserved regulatory mechanism [54,55,56]. For examples, pathogen-induced MhNAC21/22 in apple is suppressed by miR164, which modulates jasmonic acid (JA) signaling; transgenic over-expression of MhNAC21/22 elevates JA-responsive gene expression and resistance [57]. Evolutionary conservation of the osa-miR164a/OsNAC60 module has been observed across several plant disease resistance networks [18]. In Arabidopsis thaliana, ath-miR164 negatively regulates NAC4, which promotes HR by repressing cell death inhibitors (e.g., LURP1, WRKY40, WRKY54) [29]. In this study, multiple miR164 members (a/c/f) were found to target NAC genes due to their highly conserved sequences. Among them, miR164f showed the strongest regulatory effect on NAC2. The roles of other miR164 members in NAC regulation warrant further investigation.
3.2. Limitations of the Study
Graft-induced resistance involves systemic signaling, where rootstocks under pathogen attack may transport molecules (such as small RNAs, hormones, or peptides) via vasculature to prime scion leaf defenses [58]. As FOC is a vascular pathogen that spreads from roots to shoots, leaves represent both the final infection site and a systemic signal recipient. Therefore, leaf transcriptome and small RNA sequencing were used to investigate rootstock-induced resistance mechanisms. Nevertheless, several limitations should be acknowledged. Transcriptomic analysis was performed only on leaf samples, while root and vascular tissues—the primary infection sites—were not examined. Disease resistance was evaluated based on phenotypic observation and physiological indicators, without quantitative measurements such as disease index or fungal biomass. Due to experimental constraints, pathogen biomass quantification—which would help distinguish between reduced infection and altered defense signaling—was not performed. ROS-related physiological parameters were measured, but in situ visualization (e.g., DAB staining) was not conducted. Additionally, although GUS and transient overexpression assays confirmed miR164f-NAC2 regulation, 5’ RACE validation of the cleavage site was lacking. Addressing these limitations in future studies will further elucidate the mechanisms underlying graft-induced resistance. Future studies should employ multi-time-point sampling to further elucidate the temporal dynamics of the MAPK and NAC-ROS pathways.
4. Materials and Methods
4.1. Plant Materials and Fungal Culture
The plant materials were cucumber (a local cultivar from Yunnan Province, China, referred to as “Yunnan local cultivar”.), and figleaf gourd (Cucurbita ficifolia Bouché) (2n = 2x = 40) rootstocks sampled in May 2023 and stocked by Key Laboratory of Vegetable Biology of Yunnan Province, College of Landscape and Horticulture, Yunnan Agricultural University, Kunming, Yunnan, China. The FOC susceptibility of this local cucumber cultivar has not been previously reported. In our preliminary experiments, non-grafted plants developed typical Fusarium wilt symptoms within 6–8 days post-inoculation, indicating that this cultivar is susceptible to FOC infection. Uniform seedlings were selected for grafting based on growth stage and morphology to minimize experimental variation. Cucumber seedlings at the two-cotyledon stage were used as scions, and figleaf gourd seedlings at the first true leaf expansion stage were used as rootstocks. Grafting was performed using the top hole insertion method [59]. Grafted plants were immediately placed in a controlled environment with high humidity to ensure successful union. The air relative humidity was maintained above 90% by plastic covering, with day/night temperatures of 25 °C and 16 °C, respectively. After a 7-day acclimation period, grafting success was evaluated based on scion vigor and new true leaf expansion; the success rate exceeded 90%. Only uniformly developed seedlings with two fully expanded true leaves were selected for subsequent experiments to ensure consistency among biological replicates.
The Fusarium wilt strain used in this study was FOC, which was provided by Key Laboratory of Vegetable Biology of Yunnan Province, College of Landscape and Horticulture, Yunnan Agricultural University. The strains kept in slant test tube medium were removed from the refrigerator at 4 °C, and the FOC were proliferated on plates containing Potato Dextrose Agar (PDA) medium at 28 °C for 4 d, then incubated in conical flasks containing Potato Dextrose Broth (PDB) medium at 200 r/min at 28 °C for 3 d. The spore suspension was filtered through sterile gauze to remove mycelial debris, following standard protocols, the concentration was adjusted to spores/mL using sterile distilled water, as determined by hemocytometer counting. This density has been widely reported to ensure consistent and typical Fusarium wilt symptom development within an appropriate time frame. At the two true leaf stage, seedlings were carefully uprooted and subjected to root wounding by cutting approximately half of the fibrous roots (approximately 1–2 cm from the root tips) with sterilized scissors, taking care not to damage the main root. The wounded roots were then immersed in the FOC spore suspension ( spores/mL) for 1 h. After inoculation, seedlings were transplanted into black plastic nursery pots and maintained in a greenhouse under controlled conditions (25 °C day/16 °C night). Control seedlings were mock inoculated by immersing wounded roots in sterile distilled water for 1 h before transplanting.
4.2. Measurement of Physiological Indicators
Figleaf gourd-grafted and self-grafted cucumber seedlings were inoculated with FOC and sampled at 6 days post-inoculation (dpi), with three biological replicates per treatment group (named as CFC-FOC and SGC-FOC respectively), which were rapidly snap-frozen in liquid nitrogen and stored in a refrigerator at −80 °C. Meanwhile, figleaf gourd grafted and self-grafted seedlings without wilt pathogen treatments (named as CFC and SGC, respectively) were also collected for 3 biological replicates, respectively. The leaf samples of CFC and SGC were obtained and subjected to immediate snap-freezing in liquid nitrogen. Each biological replicate consisted of three seedlings, with each replicate corresponding to a single plant. All treatment groups were arranged in a completely randomized block design within the greenhouse, and their positions were periodically rotated to minimize microenvironmental variation. Sampling was conducted in random order to avoid batch effects. To evaluate physiological responses associated with disease resistance, we measured the following parameters in leaf samples: malondialdehyde (MDA) content, hydrogen peroxide (H2O2) content, total antioxidant capacity, and the activities of antioxidant enzymes including catalase (CAT), peroxidase (POD), and superoxide dismutase (SOD). In addition, soluble protein and soluble sugar contents were determined. Briefly, MDA content was determined by the thiobarbituric acid (TBA) method; H2O2 content was measured using a spectrophotometric method based on titanium sulfate; CAT, POD, and SOD activities were assayed by monitoring the decomposition of H2O2, guaiacol oxidation, and nitroblue tetrazolium (NBT) reduction, respectively. Total antioxidant capacity was evaluated using the FRAP (ferric reducing antioxidant power) method. Soluble protein content was determined by the Bradford method, and soluble sugar content was measured by the anthrone-sulfuric acid method. The units for CAT, POD, and SOD are expressed as U/g and the unit for total antioxidant capacity is expressed in µmol/g. All indicators are measured using corresponding reagent kits (Beijing Boxbio Science & Technology Co., Ltd. Beijing, China).
4.3. Transcriptome, Small RNA, and Degradome Sequencing
Total RNAs were collected from specimens using Trizol reagent (TransGen Biotech, Beijing, China) following the provided protocol. RNA integrity was examined by UV spectrophotometry and an Agilent 2100 Bioanalyzer (Agilent, Santa Clara, CA, USA). We performed RNA sequencing for all 12 samples using an Illumina HiSeq 4000 sequencer (Illumina, San Diego, CA, USA) with a 2 × 150 nt pair-end RNA-Seq strategy. Small RNA sequencing libraries were prepared from isolated small RNAs (derived from total RNA) and subsequently sequenced on an Illumina HiSeq 2000 sequencer (Illumina, San Diego, CA, USA). In preparing the degradome sequencing profiles, the same amount of total RNAs (around 20 g) from three biological replicates for the four treatment groups, respectively, were mixed and then subjected to library construction. Degradome sequencing libraries were prepared using the protocol reported previously [36,37,38,60]. Four degradome sequencing profiles were generated for CFC and SGC leaves with and without FOC infections, respectively. Then, the obtained degradome sequencing libraries were sequenced using a IIIumina Hiseq 2500 sequencer (Illumina, San Diego, CA, USA) with the 1 × 50 nt single-end sequencing mode. All sequencing profiles were then evaluated using the FASTQC program [35].
The sequencing data generated in this study have been deposited in the NCBI GEO database. The RNA-Seq, sRNA-Seq, and degradome sequencing profiles are available under the series accession numbers GSE309099, GSE308868, and GSE308832, respectively.
4.4. Transcriptome Assembly and Calculation of Expression Levels
The reference genome of cucumber (Chinese Long inbred line, 9930 V3) were downloaded from the Cucurbit Genomics Database [61]. The 12 obtained RNA-Seq profiles were mapped to cucumber genome with the HISAT2 (v2.1.0) [62]. Totally, 95.5% of the reads could be aligned to the genome (Supplementary Table S1), suggesting high qualities of the obtained RNA-Seq profiles. After converting the format using SAMTools (v1.12) [62], we performed transcript assembly with Cufflinks (v2.2.1) [63]. Totally, 24,078 transcripts (Supplementary Table S2) were identified from the obtained RNA-Seq profiles. Finally, the normalized expression levels of cucumber genes were obtained using cuffquant and cuffnorm in the Cufflinks package [63].
4.5. Identification of DEGs and Analysis of Their Enriched Pathways
The average FPKM values for each of the four sample groups were calculated using MS Excel (Microsoft, Redmond, WA, USA) based on the normalized expression data generated from the RNA-seq analysis pipeline. The genes with average expression levels of at least 5 Fragment Per Kilobase Million (FPKM) in at least one group of samples were kept for subsequent analysis. Differential expression analysis was performed based on raw count matrix using the edgeR package (v3.42.4) [64], with TMM normalization, sequential dispersion estimation (common, trended, and tagwise), and a generalized linear model (design = ∼group) applied to identify DEGs across four pairwise comparisons (CFC vs. CFC-FOC, CFC vs. SGC, SGC vs. SGC-FOC, CFC-FOC vs. SGC-FOC). Differentially expressed genes (DEGs) were defined by applying the criteria of logFC ≥ 1 and multiple-test corrected (adjusted using the Benjamini–Hochberg method). Subsequently, enrichment analysis of KEGG pathways for the DEGs was conducted with KEGG Orthology Based Annotation System (KOBAS) software (v3.0) [33].
The plant pathogen interaction pathway and the MAPK pathway from KEGG were manually revised and integrated. The expression levels of the genes in the combined pathways were examined.
4.6. Clustering and Principle Component Analysis Using Gene Expression Profiles
We performed principal component analysis (PCA) with the pca function in MatLab (v2019) software (Mathworks, Natick, MA, USA). Cluster analysis was conducted using the hclust function from the R pheatmap package, and the pheatmap function was employed to visualize the clustering results.
4.7. Analysis of sRNA-Seq Profiles and Identification of Conserved miRNAs
The twelve sRNA-Seq libraries were processed using published methods [36,37,38,39]. After 3’-adapters removal and filtering of reads below 18 nt, duplicates were collapsed to obtain unique sequences. These were mapped to database including Rfam (r11) [65], NONCODE (v3.0) [66], Silva [67], the TIGR Plant Repeat Databases [68], miRBase (v22) [69] and Repbase [70] by applying the BOWTIE algorithm (v1.0.0) [71] the following parameters “-a –best -S -v 0 -f", Matched reads and unique sequences were then counted for each molecule type.
To identify conserved miRNA homologs in cucumber, mature miRNA sequences from multiple plants were obtained from miRBase (v22) [69] and deduplicated. These unique reads were mapped to the cucumber genome using NCBI BLASTN (v2.2.26) [72]. Flanking regions of matched loci were extracted, and their secondary structures were predicted with RNAfold [73]. The identified sequences were required to meet the following criteria: no more than two bulged nucleotides, a maximum of five mismatches or asymmetrically unpaired nucleotides, and no more than three consecutive mismatches within the mature miRNA region. Candidate precursors with predicted hairpin structures were further evaluated based on the positioning of mature miRNAs on the same arm of the hairpin. The candidates were further validated by examining the distribution of smallRNA-seq reads, following the method in [74]. For sequences that perfectly match previously reported miRNAs in the database, the official names from miRBase are directly adopted. For sequences identified in this study that do not perfectly match existing cucumber miRNAs, names are assigned sequentially based on their family affiliation and genomic location to ensure systematic and unique naming.
The final set of conserved miRNAs was compared with those in earlier findings [40,41]. Due to the lack of pre-miRNA annotations in several relevant studies [28,75,76] a direct comparison of our results with those reports was not feasible. And miRNAs were named by following the names of reported ones.
4.8. Identifying of Differentially Expressed miRNAs in Different Groups
To quantify mature miRNA expression levels, small RNA sequencing reads were first aligned to mature miRNA references using NCBI BLASTN (v2.2.26) [72] with the options of “-m 8 -e 0.01", The alignment counts (raw read counts) were obtained for each miRNA, and differential expression analysis was performed based on these raw counts using the edgeR program (v3.42.4) [64]. Only miRNAs with an average expression of at least 10 RPTM in at least one of the compared groups were included in the analysis. For visualization purposes, raw counts were normalized to Reads Per Ten Million (RPTM), with the normalized values provided in Supplementary Table S12. Significance was assigned in each pairwise comparison when the p-value was below 0.05.
4.9. Identification of miRNA Targets in Cucumber by Analyzing Degradome Sequencing Profiles
The 4 obtained degradome sequencing profiles were processed with the computational methods reported previously [36,37,38,39,77]. We performed quality control and filtering on the sequencing data obtained from the sequencer, screening the raw data to remove low-quality reads. For each of the 4 degradome profiles, the first 20 nucleotides from the 5′ end were cut out, and the unique sequences were generated. The frequencies of these unique sequences were counted, which was the processed file of the degradome profile. The 4 processed degradome files were then mapped to the genome with Bowtie (v1.0.0) [71] to calculate the mapping ratios (Supplementary Table S17).
To identify targets of conserved miRNAs, we utilized the SeqTar [42] to independently process the four degradome profiles. Only miRNA–target pairs showing no more than four mismatches and supported by at least one valid degradome read in any of four profiles were retained for subsequent analysis, as documented as listed in Supplementary Tables S18–S21.
By screening results with mismatches less than or equal to 3 and valid reads greater than or equal to 1, we found at least 226 new target genes for conserved miRNAs in each of the four degradome profiles (Supplementary Tables S23–S26, respectively).
4.10. Analyzing the Relationship Between miRNA and Target Gene Expression Levels
The correlation between miRNAs and their corresponding target mRNAs was assessed using the Pearson correlation coefficient, based on their respective normalized expression levels (RPTM for miRNAs and FPKM for mRNAs). The coefficient values were computed with the corrcoef function in MatLab (v2019) (Mathworks, Natick, MA, USA).
4.11. Validating the Differentially Expressed Genes with qRT-PCR
Based on RNA-Seq data (Supplementary Table S3), five NAC genes exhibiting significant differential expression between CFC and CFC-FOC were chosen for further validation. Primers used are listed in Supplementary Table S3. Cucumber seedlings cultivated at Yunan Agriculture University, Yunnan, China. were sampled and rapidly frozen in liquid nitrogen, storage at −80 °C. Total RNA was isolated using Trizol reagent (TransGen Biotech, Beijing, China) and reverse-transcribed into cDNA using One Step RT-qPCR Kit (Sangon Biotech, Shanghai, China). The quantitative real-time PCR (qRT-PCR) was performed with Taq SYBR Green qPCR premix (LABLEAD, Beijing, China) using the following cycling conditions: 30 s at 95 °C followed by 40 cycles of 10 s at 95 °C, 10 s at 58 °C and 30 s at 72 °C. The expression level of Actin was used as internal control. Relative expression was calculated using the method [78] with three biological replicates per group. Statistical comparisons between CFC and CFC-FOC were performed using t-tests.
4.12. Co-Transformation of miRNA and Its Targets in N. benthamiana
The interaction between csa-miR164f-5p and a specific NAC2 was validated by employing the N. benthamiana co-transformation system, following the protocol of Wang et al. [79]. The precursor of csa-miR164f was amplified from the genome of cucumber to construct pBI121-pre-csa-miR164f plamid (Sangon Biotech, Shanghai, China). The CDS of NAC2, containing the complementary site of csa-miR164f-5p on NAC2, was amplified using the cDNA of cucumber as a template, for the construction of pBI121-NAC2 plamid. The mutated NAC2 plasmid pBI121-NAC2m was also constructed by using disturbed sequence of the csa-miR164f-5p complementary site along with 100 nt upstream and downstream, respectively, of the csa-miR164f-5p complementary site on NAC2 (BioRun Bio, Wuhan, China). Agrobacterium tumefaciens strain GV3101 (Weidi Bio, Shanghai, China) containing recombinant plasmids (pBI121-NAC, pBI121-NAC2m and pBI121-pre-csa-miR164, respectively) were injected into N. benthamiana leaves as reported previously [79]. Each treated GV3101 strain (5 mL) was infiltrated into N. benthamiana leaves. The above leaves were stained as reported previously [80]. Three Nicotiana benjamina plants were selected as biological replicates. Three to four fully expanded true leaves were injected per plant. Each leaf was divided into four distinct regions, each injected with a different treatment group. During injection, the inoculation area was strictly controlled, and overflowing solution was promptly wiped to prevent cross-contamination between treatment groups. GUS activity was qualitatively assessed via histochemical staining (X-Gluc, Coolaber, Beijing, China). After staining, leaves were decolorized with 70% ethanol. Blue coloration within each region was observed and photographed.
4.13. Transient Overexpression and Functional Validation in Cucumber
Using the same pBI121 vector as in the N. benthamiana co-transformation experiment, transient overexpression was performed in cucumber cotyledons via Agrobacterium-mediated transformation. Following the cucumber genetic transformation system optimized by Liu [81]. After dark incubation at room temperature for 3–5 h, the suspension was injected onto the abaxial surface of cucumber cotyledons at the one-leaf-one-heart stage using a needle-free syringe. Each treatment group included 6 seedlings, with two cotyledons injected per seedling, each receiving approximately 100–150 L of bacterial suspension. Post-injection, seedlings were co-cultured at 25 °C in the dark for 24 h before resuming normal light conditions. At 48–72 h post-inoculation, cotyledon samples were collected from 3 seedlings per treatment for qRT-PCR analysis of target gene expression to validate overexpression efficiency; 3 additional seedlings per treatment were reserved for subsequent disease resistance evaluation.
Following the wound inoculation method described by Mandeel & Baker [82], FOC mycelium patches were applied to the leaf abaxial surface: A sterile blade was used to make a shallow, approximately 0.5 cm long wound on the apical side of the cotyledon (the same region previously used for Agrobacterium infection). A mycelium patch with a side length of approximately 0.3 cm was then applied to the wound with the mycelium side facing down. Two cotyledons per plant were inoculated. After inoculation, plants were misted to maintain humidity and covered with transparent film to sustain a high-humidity environment (relative humidity ≥ 90%). Observe and record lesion area daily. Use ImageJ software (v1.4.3) [83] to measure lesion area and percentage of leaf area affected per leaf. Collect data from at least three seedlings per treatment, calculate averages, and assess significant differences between treatments to evaluate the effect of target gene overexpression on cucumber resistance to Fusarium wilt.
5. Conclusions
This study employed multi-omics analysis and found that at 6 days post-infection, the induction levels of canonical defense pathways (such as the plant–pathogen interaction pathway and the MAPK pathway) were lower in CFC-FOC compared to SGC-FOC. In contrast, the expression of NAC1/2/3 targeted by miR164f were significantly upregulated in CFC-FOC, with expression patterns consistent with changes in hydrogen peroxide content and antioxidant enzyme activities. Degradome sequencing and functional assays confirmed that miR164f directly represses NAC2, and transient overexpression of NAC2 in cucumber enhanced resistance to FOC. Together, these findings support a model in which the miR164f-NAC2-ROS module (Figure 6) contributes to cucumber (Yunnan local cultivar) graft onto figleaf gourd against Fusarium wilt, providing new insights into rootstock-mediated defense mechanisms and potential targets for cucumber breeding.
Supplementary Materials
The following supporting information can be downloaded at: https://www.mdpi.com/article/10.3390/agriculture16060682/s1.
Author Contributions
Conceptualization, J.-X.L., S.H. and Y.Z.; methodology, J.-X.L., S.H. and Y.Z.; software, Y.Z.; validation, H.Z., Y.P., Y.X., K.L., G.L., C.S., M.R. and H.H.; formal analysis, H.Z., Y.P., Y.X., K.L., G.L., C.S., H.H. and M.R.; investigation, H.Z., Y.P., Y.X., K.L., G.L., C.S., M.R. and Z.-A.Y.; resources, S.H., J.-X.L. and Y.Z.; data curation, H.Z., Y.P. and Y.X.; writing—original draft preparation, H.Z. and Y.P.; writing—review and editing, Y.Z. and J.-X.L.; visualization, H.Z., Y.P. and Y.X.; supervision, Y.Z.; project administration, Y.Z.; funding acquisition, S.H. and Y.Z. All authors have read and agreed to the published version of the manuscript.
Funding
This research was funded by three grants (No. 202501BD070001-005, No. 202402AE090012 and No. 202503AP140022) of the Yunnan Province Science and Technology Department, Kunming, Yunnan, China, a grant (No. 2023001) of Yunnan Agricultural University, Yunnan, China to YZ; and two grants (No. 202301BD070001-027 and No. XDYC-QNRC2022-0233) of the Yunnan Province Science and Technology Department, Kunming, Yunnan, China to SH. The APC was funded by a grant (No. 2023001) of Yunnan Agricultural University, Kunming, Yunnan, China to YZ.
Institutional Review Board Statement
Not applicable.
Data Availability Statement
Publicly available datasets were analyzed in this study. These data can be found here: https://www.ncbi.nlm.nih.gov/geo/query/acc.cgi?acc=GSE309099, https://www.ncbi.nlm.nih.gov/geo/query/acc.cgi?acc=GSE308868, and https://www.ncbi.nlm.nih.gov/geo/query/acc.cgi?acc=GSE308832 (accessed on 10 November 2025).
Conflicts of Interest
The authors declare no conflicts of interest. The funders had no role in the design of the study; in the collection, analyses, or interpretation of data; in the writing of the manuscript; or in the decision to publish the results.
Abbreviations
The following abbreviations are used in this manuscript:
| FOC | Fusarium oxysporum f. sp. cucumerinum |
| CFC | Cucumber Seedling Grafted onto Figleaf Gourd |
| SGC | Self-Grafted Cucumbers |
| FAO | Food and Agriculture Organization of the United Nations |
| FORC | Fusarium oxysporum f. sp. radicis-cucumerinum |
| ROS | Reactive Oxygen Species |
| HR | Hypersensitive Response |
| PDA | Potato Dextrose Agar |
| PDB | Potato Dextrose Broth |
| CFC-FOC | Cucumber Seedling Grafted onto Figleaf Gourd were infested with FOC |
| SGC-FOC | Self-grafted Cucumbers were infested with FOC |
| MDA | Malondialdehyde |
| CAT | Catalase activity |
| POD | Peroxidase activity |
| SOD | Superoxide dismutase activity |
| H2O2 | Hydrogen peroxide |
| NBT | nitroblue tetrazolium |
| FRAP | ferric reducing antioxidant power |
| DEG | Differentially expressed gene |
| KEGG | Kyoto Encyclopedia of Genes and Genomes |
| KOBAS | KEGG Orthology Based Annotation System |
| PCA | Principal component analysis |
| RPTM | Reads Per Ten Million |
| qRT-PCR | quantitative Real-Time PCR |
| ARF | Auxin Response Factors |
| SCL | Scarecrow-like transcription factor |
| PCD | Programmed Cell Death |
| SA | Salicylic Acid |
| JA | Jasmonic Acid |
References
- Zhou, X.; Wu, F.; Wang, X.; Yuan, Y. Progresses in the mechanism of resistance to Fusarium wilt in cucumber (Cucumis sativus L.). J. Northeast Agric. Univ. 2008, 15, 1–6. [Google Scholar]
- Portal González, N.; Soler, A.; Ribadeneira, C.; Solano, J.; Portieles, R.; Herrera Isla, L.; Companioni, B.; Borras-Hidalgo, O.; Santos Bermudez, R. Phytotoxic Metabolites Produce by Fusarium oxysporum f. sp. cubense Race 2. Front. Microbiol. 2021, 12, 629395. [Google Scholar] [CrossRef] [Scilit]
- Schwarz, D.; Rouphael, Y.; Colla, G.; Venema, J.H. Grafting as a tool to improve tolerance of vegetables to abiotic stresses: Thermal stress, water stress and organic pollutants. Sci. Hortic. 2010, 127, 162–171. [Google Scholar] [CrossRef] [Scilit]
- Sharma, D.; Shukla, A. Fusarium wilt of cucumber-a review. Int. J. Econ. Plants 2021, 8, 193–200. [Google Scholar] [CrossRef] [Scilit]
- Williams, H. Root and stem rot of cucumber caused by Fusarium oxysporum f. sp. radicis-cucumerinum f. sp. nov. Plant Dis. 1996, 80, 313. [Google Scholar]
- Xie, J.; Ding, Y.; Gao, T.; He, S.; Zhao, K.; Yang, X.; Zhang, J.; Yang, Z. Transcriptomic and proteomic analyses of Cucurbita ficifolia Bouché (Cucurbitaceae) response to Fusarium oxysporum f. sp. cucumerium. BMC Genom. 2022, 23, 436. [Google Scholar] [CrossRef] [Scilit]
- Louws, F.J.; Rivard, C.L.; Kubota, C. Grafting fruiting vegetables to manage soilborne pathogens, foliar pathogens, arthropods and weeds. Sci. Hortic. 2010, 127, 127–146. [Google Scholar] [CrossRef] [Scilit]
- Reddy, P.P. Chapter: Grafted Vegetables for Management of Soilborne Pathogens. In Sustainable Crop Protection Under Protected Cultivation; Springer: Singapore, 2016; pp. 83–97. [Google Scholar]
- Li, G.; Zou, J.; Gong, T.; Li, X.; Meng, J.; Zhang, J.; Xu, B.; He, S. Evaluation of Figleaf Gourd and White-Seeded Pumpkin Genotypes as Promising Rootstocks for Cucumber Grafting. Horticulturae 2025, 11, 778. [Google Scholar] [CrossRef] [Scilit]
- Zhou, Y.; Zhou, J.; Huang, L.; Ding, X.; Shi, K.; Yu, J. Grafting of Cucumis sativus onto Cucurbita ficifolia leads to improved plant growth, increased light utilization and reduced accumulation of reactive oxygen species in chilled plants. J. Plant Res. 2009, 122, 529–540. [Google Scholar] [CrossRef] [Scilit] [PubMed]
- Huang, Y.; Bie, Z.; He, S.; Hua, B.; Zhen, A.; Liu, Z. Improving cucumber tolerance to major nutrients induced salinity by grafting onto Cucurbita ficifolia. Environ. Exp. Bot. 2010, 69, 32–38. [Google Scholar] [CrossRef] [Scilit]
- Huang, Y.; Tang, R.; Cao, Q.; Bie, Z. Improving the fruit yield and quality of cucumber by grafting onto the salt tolerant rootstock under NaCl stress. Sci. Hortic. 2009, 122, 26–31. [Google Scholar] [CrossRef] [Scilit]
- Bayoumi, Y.; Abd-Alkarim, E.; El-Ramady, H.; El-Aidy, F.; Hamed, E.S.; Taha, N.; Prohens, J.; Rakha, M. Grafting improves fruit yield of cucumber plants grown under combined heat and soil salinity stresses. Horticulturae 2021, 7, 61. [Google Scholar] [CrossRef] [Scilit]
- Yuan, X.; Wang, H.; Cai, J.; Li, D.; Song, F. NAC transcription factors in plant immunity. Phytopathol. Res. 2019, 1, 3. [Google Scholar] [CrossRef] [Scilit]
- Masri, R.; Kiss, E. The role of NAC genes in response to biotic stresses in plants. Physiol. Mol. Plant Pathol. 2023, 126, 102034. [Google Scholar] [CrossRef] [Scilit]
- Xiong, H.; He, H.; Chang, Y.; Miao, B.; Liu, Z.; Wang, Q.; Dong, F.; Xiong, L. Multiple roles of NAC transcription factors in plant development and stress responses. J. Integr. Plant Biol. 2025, 67, 510–538. [Google Scholar] [CrossRef] [Scilit] [PubMed]
- Dong, B.; Liu, Y.; Huang, G.; Song, A.; Chen, S.; Jiang, J.; Chen, F.; Fang, W. Plant NAC transcription factors in the battle against pathogens. BMC Plant Biol. 2024, 24, 958. [Google Scholar] [CrossRef] [Scilit] [PubMed]
- Wang, Z.; Xia, Y.; Lin, S.; Wang, Y.; Guo, B.; Song, X.; Ding, S.; Zheng, L.; Feng, R.; Chen, S.; et al. Osa-miR164a targets OsNAC60 and negatively regulates rice immunity against the blast fungus Magnaporthe oryzae. Plant J. 2018, 95, 584–597. [Google Scholar] [CrossRef] [Scilit] [PubMed]
- Chen, Q.; Niu, F.; Yan, J.; Chen, B.; Wu, F.; Guo, X.; Yang, B.; Jiang, Y.Q. Oilseed rape NAC56 transcription factor modulates reactive oxygen species accumulation and hypersensitive response-like cell death. Physiol. Plant. 2017, 160, 209–221. [Google Scholar]
- Wang, G.; Zhang, S.; Ma, X.; Wang, Y.; Kong, F.; Meng, Q. A stress-associated NAC transcription factor (SlNAC35) from tomato plays a positive role in biotic and abiotic stresses. Physiol. Plant. 2016, 158, 45–64. [Google Scholar]
- Vranic, M.; Perochon, A.; Benbow, H.; Doohan, F.M. Comprehensive analysis of pathogen-responsive wheat NAC transcription factors: New candidates for crop improvement. G3 2022, 12, jkac247. [Google Scholar]
- Bartel, D.P. MicroRNAs: Genomics, biogenesis, mechanism, and function. Cell 2004, 116, 281–297. [Google Scholar] [CrossRef] [Scilit] [PubMed]
- Voinnet, O. Origin, biogenesis, and activity of plant microRNAs. Cell 2009, 136, 669–687. [Google Scholar] [CrossRef] [Scilit] [PubMed]
- Chen, X. Small RNAs in development–insights from plants. Curr. Opin. Genet. Dev. 2012, 22, 361–367. [Google Scholar] [CrossRef] [Scilit] [PubMed]
- Axtell, M.J. Classification and comparison of small RNAs from plants. Annu. Rev. Plant Biol. 2013, 64, 137–159. [Google Scholar] [CrossRef] [Scilit]
- Jones-Rhoades, M.W.; Bartel, D.P.; Bartel, B. MicroRNAs and their regulatory roles in plants. Annu. Rev. Plant Biol. 2006, 57, 19–53. [Google Scholar] [CrossRef] [Scilit]
- Sunkar, R.; Zhu, J.K. MicroRNAs and short-interfering RNAs in plants. J. Integr. Plant Biol. 2007, 49, 817–826. [Google Scholar] [CrossRef] [Scilit]
- Xu, J.; Xian, Q.; Zhang, N.; Wang, K.; Zhou, X.; Li, Y.; Dong, J.; Chen, X. Identification of miRNA-target gene pairs responsive to fusarium wilt of cucumber via an integrated analysis of miRNA and transcriptome profiles. Biomolecules 2021, 11, 1620. [Google Scholar] [CrossRef] [Scilit]
- Lee, M.H.; Jeon, H.S.; Kim, H.G.; Park, O.K. An Arabidopsis NAC transcription factor NAC4 promotes pathogen-induced cell death under negative regulation by microRNA164. New Phytol. 2017, 214, 343–360. [Google Scholar] [CrossRef] [Scilit]
- Chand, S.K.; Nanda, S.; Mishra, R.; Joshi, R.K. Multiple garlic (Allium sativum L.) microRNAs regulate the immunity against the basal rot fungus Fusarium oxysporum f. sp. Cepae. Plant Sci. 2017, 257, 9–21. [Google Scholar] [CrossRef] [Scilit]
- Thies, J.A. Grafting for managing vegetable crop pests. Pest Manag. Sci. 2021, 77, 4825–4835. [Google Scholar] [CrossRef] [Scilit]
- Bartholomew, E.S.; Xu, S.; Zhang, Y.; Yin, S.; Feng, Z.; Chen, S.; Sun, L.; Yang, S.; Wang, Y.; Liu, P.; et al. A chitinase CsChi23 promoter polymorphism underlies cucumber resistance against Fusarium oxysporum f. sp. cucumerinum. New Phytol. 2022, 236, 1471–1486. [Google Scholar] [CrossRef] [Scilit]
- Xie, C.; Mao, X.; Huang, J.; Ding, Y.; Wu, J.; Dong, S.; Kong, L.; Gao, G.; Li, C.Y.; Wei, L. KOBAS 2.0: A web server for annotation and identification of enriched pathways and diseases. Nucleic Acids Res. 2011, 39, W316–W322. [Google Scholar] [CrossRef] [Scilit] [PubMed]
- Zhu, B.; Li, C.; Wang, M.; Chen, J.; Hu, Y.; Huang, W.; Wang, H. Comparative transcriptome provides insights into gene regulation network associated with the resistance to Fusarium wilt in grafted wax gourd Benincasa hispida. Front. Plant Sci. 2023, 14, 1277500. [Google Scholar] [CrossRef] [Scilit]
- Wingett, S.W.; Andrews, S. FastQ Screen: A tool for multi-genome mapping and quality control. F1000Research 2018, 7, 1338. [Google Scholar] [CrossRef] [Scilit]
- Liu, L.; Ren, S.; Guo, J.; Wang, Q.; Zhang, X.; Liao, P.; Li, S.; Sunkar, R.; Zheng, Y. Genome-wide identification and comprehensive analysis of microRNAs and phased small interfering RNAs in watermelon. BMC Genom. 2018, 19, 61–72. [Google Scholar] [CrossRef] [Scilit] [PubMed]
- Guo, J.; Wang, Q.; Liu, L.; Ren, S.; Li, S.; Liao, P.; Zhao, Z.; Lu, C.; Jiang, B.; Sunkar, R.; et al. Analysis of microRNAs, phased small interfering RNAs and their potential targets in Rosarugosa Thunb. BMC Genom. 2019, 19, 983. [Google Scholar] [CrossRef] [Scilit]
- Suo, A.; Lan, Z.; Lu, C.; Zhao, Z.; Pu, D.; Wu, X.; Jiang, B.; Zhou, N.; Ding, H.; Zhou, D.; et al. Characterizing microRNAs and their targets in different organs of Camellia sinensis var. assamica. Genomics 2021, 113, 159–170. [Google Scholar] [CrossRef] [Scilit] [PubMed]
- Zheng, Y. Computational Non-Coding RNA Biology; Academic Press: Cambridge, MA, USA, 2018. [Google Scholar]
- Zhang, X.; Lai, Y.; Zhang, W.; Ahmad, J.; Qiu, Y.; Zhang, X.; Duan, M.; Liu, T.; Song, J.; Wang, H.; et al. MicroRNAs and their targets in cucumber shoot apices in response to temperature and photoperiod. BMC Genom. 2018, 19, 819. [Google Scholar] [CrossRef] [Scilit]
- Ma, Q.; Niu, C.; Wang, C.; Chen, C.; Li, Y.; Wei, M. Effects of differentially expressed microRNAs induced by rootstocks and silicon on improving chilling tolerance of cucumber seedlings (Cucumis sativus L). BMC Genom. 2023, 24, 250. [Google Scholar] [CrossRef] [Scilit]
- Zheng, Y.; Li, Y.F.; Sunkar, R.; Zhang, W. SeqTar: An effective method for identifying microRNA guided cleavage sites from degradome of polyadenylated transcripts in plants. Nucleic Acids Res. 2012, 40, e28. [Google Scholar] [CrossRef] [Scilit]
- Li, Y.; Luo, W.; Sun, Y.; Chang, H.; Ma, K.; Zhao, Z.; Lu, L. Identification and expression analysis of miR160 and their target genes in cucumber. Biochem. Genet. 2022, 60, 127–152. [Google Scholar] [CrossRef] [Scilit] [PubMed]
- Pei, L.; Zhang, L.; Liu, X.; Jiang, J. Role of microRNA miR171 in plant development. PeerJ 2023, 11, e15632. [Google Scholar] [CrossRef] [Scilit]
- Wang, Y.; Cao, R.; Yang, L.; Duan, X.; Zhang, C.; Yu, X.; Ye, X. Transcriptome analyses revealed the wax and phenylpropanoid biosynthesis pathways related to disease resistance in rootstock-grafted cucumber. Plants 2023, 12, 2963. [Google Scholar] [CrossRef] [Scilit]
- Deng, J.; Che, X.; Gu, Y.; Qu, Y.; Liu, D. Integrated multi-omics investigation revealed the importance of phenylpropanoid metabolism in the defense response of Lilium regale Wilson to Fusarium wilt. Hortic. Res. 2024, 11, uhae140. [Google Scholar] [CrossRef] [Scilit]
- Haghpanah, M.; Namdari, A.; Kaleji, M.K.; Nikbakht-Dehkordi, A.; Arzani, A.; Araniti, F. Interplay between ROS and hormones in plant defense against pathogens. Plants 2025, 14, 1297. [Google Scholar] [CrossRef] [Scilit]
- Chen, Y.; Xia, P. NAC transcription factors as biological macromolecules responded to abiotic stress: A comprehensive review. Int. J. Biol. Macromol. 2025, 308, 142400. [Google Scholar] [CrossRef] [Scilit]
- Bian, Z.; Gao, H.; Wang, C. NAC transcription factors as positive or negative regulators during ongoing battle between pathogens and our food crops. Int. J. Mol. Sci. 2020, 22, 81. [Google Scholar] [CrossRef] [Scilit]
- Zhang, W.; Zhi, W.; Qiao, H.; Huang, J.; Li, S.; Lu, Q.; Wang, N.; Li, Q.; Zhou, Q.; Sun, J.; et al. H2O2-dependent oxidation of the transcription factor GmNTL1 promotes salt tolerance in soybean. Plant Cell 2024, 36, 112–135. [Google Scholar] [CrossRef] [Scilit]
- Hasanuzzaman, M.; Bhuyan, M.B.; Zulfiqar, F.; Raza, A.; Mohsin, S.M.; Mahmud, J.A.; Fujita, M.; Fotopoulos, V. Reactive oxygen species and antioxidant defense in plants under abiotic stress: Revisiting the crucial role of a universal defense regulator. Antioxidants 2020, 9, 681. [Google Scholar] [CrossRef] [Scilit] [PubMed]
- Ahammed, G.J.; Li, Z.; Chen, J.; Dong, Y.; Qu, K.; Guo, T.; Wang, F.; Liu, A.; Chen, S.; Li, X. Reactive oxygen species signaling in melatonin-mediated plant stress response. Plant Physiol. Biochem. 2024, 207, 108398. [Google Scholar] [CrossRef] [Scilit] [PubMed]
- Jiang, T.; Rodriguez, K.; Tanwir, S.E.; Liu, F.; Hussain, F.; Cherukula, J.C.; Huo, H. Regulatory role of MicroRNA164 in heat and salinity stress responses via candidate target genes during seed germination in petunia. Hortic. Adv. 2025, 3, 15. [Google Scholar] [CrossRef] [Scilit]
- Dong, Y.; Tang, M.; Huang, Z.; Song, J.; Xu, J.; Ahammed, G.J.; Yu, J.; Zhou, Y. The miR164a-NAM3 module confers cold tolerance by inducing ethylene production in tomato. Plant J. 2022, 111, 440–456. [Google Scholar] [CrossRef] [Scilit]
- Chi, Q.; Ma, W.; Niu, R.; Wu, B.; Guo, L.; Ma, M.; Liu, X.; Zhao, H. The miR164-TaNAC14 module regulates root development and abiotic-stress tolerance in wheat seedlings. J. Integr. Agric. 2023, 22, 981–998. [Google Scholar] [CrossRef] [Scilit]
- Yuan, M.; Jin, T.; Wu, J.; Li, L.; Chen, G.; Chen, J.; Wang, Y.; Sun, J. IAA-miR164a-NAC100L1 module mediates symbiotic incompatibility of cucumber/pumpkin grafted seedlings through regulating callose deposition. Hortic. Res. 2024, 11, uhad287. [Google Scholar] [CrossRef] [Scilit]
- Zhou, T.; Cao, L.; Hu, K.; Yu, X.; Qu, S. miR164–NAC21/22 module regulates the resistance of Malus hupehensis against Alternaria alternata by controlling jasmonic acid signaling. Plant Sci. 2023, 330, 111635. [Google Scholar] [PubMed]
- Lu, X.; Liu, W.; Wang, T.; Zhang, J.; Li, X.; Zhang, W. Systemic long-distance signaling and communication between rootstock and scion in grafted vegetables. Front. Plant Sci. 2020, 11, 460. [Google Scholar] [CrossRef] [Scilit]
- Sakthivel, M.; Kavitha, M.; Rani, C.; Devrajan, K.; Vanitha, K. Synergistic role of rootstock and grafting in boosting growth, yield, and quality of cucumber cultivation. Plant Sci. 2024, 11. [Google Scholar] [CrossRef] [Scilit]
- Li, Y.F.; Zheng, Y.; Addo-Quaye, C.; Zhang, L.; Saini, A.; Jagadeeswaran, G.; Axtell, M.J.; Zhang, W.; Sunkar, R. Transcriptome-wide identification of microRNA targets in rice. Plant J. 2010, 62, 742–759. [Google Scholar] [CrossRef] [Scilit]
- Li, Q.; Li, H.; Huang, W.; Xu, Y.; Zhou, Q.; Wang, S.; Ruan, J.; Huang, S.; Zhang, Z. A chromosome-scale genome assembly of cucumber Cucumis sativus L. GigaScience 2019, 8, giz072. [Google Scholar] [CrossRef] [Scilit]
- Li, H.; Handsaker, B.; Wysoker, A.; Fennell, T.; Ruan, J.; Homer, N.; Marth, G.; Abecasis, G.; Durbin, R.; Subgroup, G.P.D.P. The sequence alignment/map format and SAMtools. Bioinformatics 2009, 25, 2078–2079. [Google Scholar] [CrossRef] [Scilit]
- Trapnell, C.; Williams, B.A.; Pertea, G.; Mortazavi, A.; Kwan, G.; Van Baren, M.J.; Salzberg, S.L.; Wold, B.J.; Pachter, L. Transcript assembly and quantification by RNA-Seq reveals unannotated transcripts and isoform switching during cell differentiation. Nat. Biotechnol. 2010, 28, 511–515. [Google Scholar] [CrossRef] [Scilit]
- Robinson, M.D.; McCarthy, D.J.; Smyth, G.K. edgeR: A Bioconductor package for differential expression analysis of digital gene expression data. Bioinformatics 2010, 26, 139–140. [Google Scholar] [CrossRef] [Scilit]
- Burge, S.W.; Daub, J.; Eberhardt, R.; Tate, J.; Barquist, L.; Nawrocki, E.P.; Eddy, S.R.; Gardner, P.P.; Bateman, A. Rfam 11.0: 10 years of RNA families. Nucleic Acids Res. 2013, 41, D226–D232. [Google Scholar] [CrossRef] [Scilit] [PubMed]
- Bu, D.; Yu, K.; Sun, S.; Xie, C.; Skogerbø, G.; Miao, R.; Xiao, H.; Liao, Q.; Luo, H.; Zhao, G.; et al. NONCODE v3. 0: Integrative annotation of long noncoding RNAs. Nucleic Acids Res. 2012, 40, D210–D215. [Google Scholar] [CrossRef] [Scilit]
- Quast, C.; Pruesse, E.; Yilmaz, P.; Gerken, J.; Schweer, T.; Yarza, P.; Peplies, J.; Glöckner, F.O. The SILVA ribosomal RNA gene database project: Improved data processing and web-based tools. Nucleic Acids Res. 2012, 41, D590–D596. [Google Scholar] [CrossRef] [Scilit]
- Ouyang, S.; Buell, C.R. The TIGR Plant Repeat Databases: A collective resource for the identification of repetitive sequences in plants. Nucleic Acids Res. 2004, 32, D360–D363. [Google Scholar] [CrossRef] [Scilit]
- Kozomara, A.; Griffiths-Jones, S. miRBase: Annotating high confidence microRNAs using deep sequencing data. Nucleic Acids Res. 2014, 42, D68–D73. [Google Scholar] [CrossRef] [Scilit] [PubMed]
- Bao, W.; Kojima, K.K.; Kohany, O. Repbase Update, a database of repetitive elements in eukaryotic genomes. Mob. DNA 2015, 6, 11. [Google Scholar] [CrossRef] [Scilit]
- Langmead, B.; Trapnell, C.; Pop, M.; Salzberg, S.L. Ultrafast and memory-efficient alignment of short DNA sequences to the human genome. Genome Biol. 2009, 10, R25. [Google Scholar] [CrossRef] [Scilit] [PubMed]
- Altschul, S.F.; Gish, W.; Miller, W.; Myers, E.W.; Lipman, D.J. Basic local alignment search tool. J. Mol. Biol. 1990, 215, 403–410. [Google Scholar] [CrossRef]
- Hofacker, I.L. Vienna RNA secondary structure server. Nucleic Acids Res. 2003, 31, 3429–3431. [Google Scholar] [CrossRef] [Scilit]
- Axtell, M.J.; Meyers, B.C. Revisiting criteria for plant microRNA annotation in the era of big data. Plant Cell 2018, 30, 272–284. [Google Scholar] [CrossRef] [Scilit]
- Sun, Y.; Luo, W.; Chang, H.; Li, Z.; Zhou, J.; Li, X.; Zheng, J.; Hao, M. Identification of miRNAs and their target genes involved in cucumber fruit expansion using small RNA and degradome sequencing. Biomolecules 2019, 9, 483. [Google Scholar] [CrossRef] [Scilit] [PubMed]
- Pawelkowicz, M.E.; Skarzynska, A.; Koter, M.D.; Turek, S.; Plder, W. miRNA profiling and its role in multi-omics regulatory networks connected with somaclonal variation in cucumber (Cucumis sativus L). Int. J. Mol. Sci. 2022, 23, 4317. [Google Scholar] [CrossRef] [Scilit] [PubMed]
- Zheng, Y.; Chen, K.; Xu, Z.; Liao, P.; Zhang, X.; Liu, L.; Wei, K.; Liu, D.; Li, Y.F.; Sunkar, R.; et al. Small RNA profiles from Panax notoginseng roots differing in sizes reveal correlation between miR156 abundances and root biomass levels. Sci. Rep. 2017, 7, 9418. [Google Scholar] [CrossRef] [Scilit]
- Livak, K.J.; Schmittgen, T.D. Analysis of relative gene expression data using real-time quantitative PCR and the 2−ΔΔCT method. Methods 2001, 25, 402–408. [Google Scholar] [CrossRef] [Scilit]
- Wang, B.; Sun, Y.; Song, N.; Zhao, M.; Liu, R.; Feng, H.; Wang, X.; Kang, Z. Puccinia striiformis f. sp. tritici microRNA-like RNA 1 (Pst-milR1), an important pathogenicity factor of Pst, impairs wheat resistance to Pst by suppressing the wheat pathogenesis-related 2 gene. New Phytol. 2017, 215, 338–350. [Google Scholar] [CrossRef] [Scilit]
- Jefferson, R.A.; Kavanagh, T.A.; Bevan, M.W. GUS fusions: Beta-glucuronidase as a sensitive and versatile gene fusion marker in higher plants. EMBO J. 1987, 6, 3901–3907. [Google Scholar] [CrossRef] [Scilit] [PubMed]
- Liu, H.; Zhao, J.; Chen, F.; Wu, Z.; Tan, J.; Nguyen, N.H.; Cheng, Z.; Weng, Y. Improving Agrobacterium tumefaciens-mediated genetic transformation for gene function studies and mutagenesis in cucumber (Cucumis sativus L.). Genes 2023, 14, 601. [Google Scholar] [CrossRef] [Scilit] [PubMed]
- Mandeel, Q.; Baker, R. Mechanisms involved in biological control of Fusarium wilt of cucumber with strains of nonpathogenic Fusarium oxysporum. Phytopathology 1991, 81, 462–469. [Google Scholar] [CrossRef] [Scilit]
- Abràmoff, M.D.; Magalhães, P.J.; Ram, S.J. Image processing with ImageJ. Biophotonics Int. 2004, 11, 36–42. [Google Scholar]
Disclaimer/Publisher’s Note: The statements, opinions and data contained in all publications are solely those of the individual author(s) and contributor(s) and not of MDPI and/or the editor(s). MDPI and/or the editor(s) disclaim responsibility for any injury to people or property resulting from any ideas, methods, instructions or products referred to in the content. |
© 2026 by the authors. Licensee MDPI, Basel, Switzerland. This article is an open access article distributed under the terms and conditions of the Creative Commons Attribution (CC BY) license.