Article

Effects of Nitrogen Fertilizer Management Strategies on Post-Anthesis Photosynthetic Characteristics, Nitrogen Transport and Soil Nitrogen Properties in Winter Wheat


1
Dezhou Academy of Agricultural Sciences, Dezhou 253015, China
2
Shandong Rural Revitalization Practice Research Institute, Dezhou 253028, China
3
Institute of Agricultural Resources and Environment, Shandong Academy of Agricultural Sciences, Jinan 250100, China
*
Authors to whom correspondence should be addressed.
†
These authors have contributed equally to this work and share first authorship.
Agriculture 2026, 16(20), 2195; https://doi.org/10.3390/agriculture16202195
Submission received: 1 September 2026 / Revised: 3 October 2026 / Accepted: 5 October 2026 / Published: 9 October 2026
(This article belongs to the Section Crop Production)

Abstract

To investigate the effects of different nitrogen fertilizer management strategies on post-anthesis photosynthetic characteristics, nitrogen translocation, and yield formation of winter wheat, this study was based on a long-term fixed-site experiment established in 2013. Four treatments were set up: no nitrogen application (CK), conventional nitrogen application (FP), optimized nitrogen application (OPT), and controlled-release nitrogen fertilizer (CRF), to study their effects on the post-anthesis photosynthesis, nitrogen translocation, yield, and soil characteristics of winter wheat. Nitrogen application significantly increased flag leaf SPAD value, green leaf area index, net photosynthetic rate, and yield components ( p< 0.05). The OPT treatment achieved the highest yield of 8871.69 kg·hm−2, which was 2.32% and 4.00% higher than that of FP and CRF, respectively, and its nitrogen use efficiency indicators were also relatively high. Nitrogen application increased urease activity and altered microbial community composition. OPT could maintain a relatively high post-anthesis photosynthetic capacity and promote efficient nitrogen utilization, suggesting that it a suitable fertilization mode for high-yield and high-efficiency winter wheat production.

1. Introduction

The North China Plain is a core main production area for winter wheat (Triticum aestivum L.) in China. However, long-term excessive nitrogen application and inappropriate topdressing timing have not only failed to significantly and sustainably increase yield, but have also caused serious ecological and environmental problems such as crop lodging, soil acidification, and nitrate pollution of groundwater [1,2,3]. How to improve nitrogen use efficiency while ensuring high and stable crop yields has become a core challenge for the sustainable development of agriculture in this region [4]. Optimized nitrogen management (OPT) reduces the proportion of basal fertilizer and appropriately postpones nitrogen application, thereby matching the nutrient demand pattern of winter wheat and achieving efficient synchronization between plant demand and supply [5]. Although controlled-release nitrogen fertilizer (CRF) can significantly save labor, whether its nutrient release rate can perfectly match the several-month growth period of winter wheat under different environmental conditions remains controversial [6,7]. Therefore, systematically exploring the comprehensive regulatory effects of different nitrogen management regimes on winter wheat is of great scientific significance.
Grain yield formation in winter wheat largely depends on the accumulation of post-anthesis photosynthates. Flag eaf chlorophyll content, green leaf area, and photosynthetic rate are key physiological indicators affecting assimilate supply during grain filling [8]. Rational split nitrogen application can maintain post-anthesis leaf photosynthetic function, delay leaf senescence, and promote dry matter accumulation and grain formation [9]. Grain nitrogen is derived primarily from the remobilization of nitrogen stored in vegetative organs before anthesis and continued nitrogen uptake after anthesis, with their relative contributions regulated by the rate and timing of nitrogen application [10,11]. Therefore, optimized nitrogen management may promote yield formation in winter wheat by coordinating post-anthesis photosynthesis, nitrogen uptake, and nitrogen remobilization from vegetative organs.
Nitrogen management also affects soil nitrogen supply and biological properties. The profile distribution of soil nitrate nitrogen reflects the availability of nitrogen to crops and is closely associated with the risk of nitrate leaching [12]. Long-term mineral nitrogen fertilization can alter soil enzyme activities, microbial biomass, and community composition, thereby affecting soil organic matter decomposition and nutrient transformation [13,14]. However, research remains relatively limited on the effects of long-term fixed-site nitrogen fertilizer management regimes on nitrogen use efficiency and post-anthesis nitrogen accumulation and translocation in wheat, particularly regarding how nitrogen management regulates winter wheat yield through coordinated aboveground–belowground physiological and ecological mechanisms.
Accordingly, this study was conducted using a long-term nitrogen management experiment in Dezhou, Shandong Province, with the winter wheat cultivar ‘Jimai 22’. Four treatments—no nitrogen application (CK), conventional nitrogen application (FP), optimized nitrogen application (OPT), and controlled-release fertilizer application (CRF)—were compared in terms of post-anthesis leaf photosynthetic characteristics, dry matter accumulation and remobilization, nitrogen, phosphorus, and potassium accumulation and remobilization, grain yield, and yield components. Soil nitrogen profile distribution, enzyme activities, and microbial community characteristics were also analyzed. This study aimed to clarify the responses of plant physiological traits and soil nitrogen supply to different nitrogen management practices and to provide a theoretical basis for high-yield and resource-efficient winter wheat production in the North China Plain.

2. Materials and Methods

2.1. Overview of the Pilot Sites

The long-term fixed-site field experiment was established in 2013 at the Modern Agricultural Science and Technology Park in Dezhou, Shandong Province (37°26′24″ N, 116°20′24″ E). The 2023–2024 growing season was used for intensive post-anthesis sampling, while yield data from the 2020–2021, 2021–2022, and 2022–2023 growing seasons were used to assess interannual yield stability. The region has a temperate continental monsoon climate and is a typical winter wheat–maize double cropping area with flat terrain. The experimental soil was sandy loam, and the physical and chemical properties of the 0–20 cm plough layer were as follows: total nitrogen 0.3 g·kg−1, available phosphorus 16.24 mg·kg−1, available potassium 77.24 mg·kg−1, organic matter 10.10 g·kg−1, and pH 8.7. The preceding crop was maize, and all straw was returned to the field after harvest.

2.2. Experimental Design

The wheat cultivar used in the experiment was ‘Jimai 22’, sown in October 2023 and harvested in June 2024, with a sowing rate of 225 kg·hm−2, a row spacing of 16.7 cm, and drilled sowing.
The long-term fixed-site experiment was established in 2013. The four treatments (CK, FP, OPT, and CRF) have been maintained since then. Two datasets were used in this study. The first dataset is the long-term grain yield data from the 2020–2021, 2021–2022, and 2022–2023 winter wheat growing seasons, which were used to evaluate the interannual stability of yield under different nitrogen management strategies. The second dataset is from the 2023–2024 growing season, in which the same long-term plots were sampled intensively for post-anthesis photosynthetic traits, dry matter and nitrogen accumulation/translocation, grain yield and yield components, soil nitrogen profiles, soil enzyme activities, and microbial community composition. The two datasets were not pooled for statistical correlation. The long-term yield data provide agronomic background on treatment stability, whereas the 2023–2024 data provide mechanistic information on post-anthesis physiology, nitrogen transport, and soil nitrogen availability. Overall, the two datasets are complementary and jointly support the same general conclusion.
Based on the long-term field experiment established in 2013, four fertilization treatments were set up: (1) no nitrogen control (CK); (2) farmers’ conventional nitrogen application (FP, basal-to-topdressing ratio of 1:2); (3) optimized nitrogen application (OPT, basal-to-topdressing ratio of 1:1); and (4) one-time basal application of controlled-release nitrogen fertilizer (CRF). The fertilizer input amounts for each treatment are shown in Table 1. The nitrogen fertilizer used in the FP and OPT treatments was large granular urea (N 46%, Shandong Hualu Hengsheng Chemical Co., Ltd.,Dezhou, China), while the nitrogen fertilizer used in the CRF treatment was coated urea (N 43%, developed by Shandong Academy of Agricultural Sciences, Jinan, China, with a release period of 60 days). Phosphorus and potassium fertilizers were applied once as basal fertilizer in all treatments.
The plots were arranged in a randomized complete block design with three replications, totaling 12 plots. Each plot was 9.5 m long and 4.2 m wide, with an area of 40 m2, a 1 m spacing between plots, and 5 m border rows. Except for fertilization, field management practices such as irrigation and pest control during the experimental period followed local farmers’ management practices.

2.3. Yield and Its Constituent Factors

At maturity, a 2 m2 area in each plot was harvested manually using the quadrat method (1 m × 1 m) for yield determination. After air-drying, the samples were threshed and weighed, and grain yield and thousand-kernel weight were calculated after adjusting to 13% standard moisture content. In each plot, a 1-m section of plants in two adjacent rows was selected to investigate the number of effective spikes per unit area, and 40 individual spikes were randomly selected for yield component analysis to determine grain number per spike and thousand-grain weight [15].

2.4. Determination of Chlorophyll Content

A portable chlorophyll meter (LYS-4N, Hangzhou Lvbo Instrument Co., Ltd., Hangzhou, China) was used to measure on the day of anthesis (0 d) and at 10 d, 20 d, and 30 d after anthesis on clear mornings from 9:00 to 11:00. In each plot, five flag leaves with uniform growth were selected, and three points were measured on each leaf, with the average value taken as the final SPAD value.

2.5. Green Leaf Area Index (GLAI)

At anthesis (0 d) and 10, 20 and 30 d after anthesis, 10 plants were randomly selected from each plot, and the green leaf area of each plant was measured using the length-to-width ratio method. The formula for calculating GLAI per unit area is as follows [16]:
GLAI = 0.83 × ρ × ∑ i = 1 n ( a i × b i ) × 10 − 4
In the formula, 0.83 is the correction factor; ρ is the number of plants per unit area (plants·hm−2); ai and bi are the leaf length (cm) and leaf width (cm) respectively; and n is the number of green leaves.

2.6. Measurement of Photosynthetic Parameters

On clear, cloudless mornings between 9:30 and 11:30 a.m. at 0, 10, and 20 d after anthesis, the net photosynthetic rate (Pn), stomatal conductance (Gs), intercellular CO2 concentration (Ci), and transpiration rate (Tr) of flag leaves were measured using a portable photosynthesis system (CIRAS-4, PP Systems, Amesbury, MA, USA). The chamber conditions were set as follows: light intensity of 1200 μmol m−2 s−1, reference CO2 concentration of 450 μmol mol−1, leaf temperature of 30 °C, and relative humidity in the leaf chamber of 40%. All measurements were conducted under outdoor conditions. The instrument’s closed-loop regulation of light intensity, CO2 concentration, and leaf temperature effectively reduced interference from fluctuations in the external environment, ensuring the reliability and reproducibility of the measured data.

2.7. Determination of Nitrate and Ammonium Nitrogen Content in Soil

At maturity, soil samples were collected from the 0–20 cm, 20–40 cm, 40–60 cm, and 60–90 cm soil layers in each plot using a five-point sampling method. After passing fresh soil samples through a 2 mm sieve, 10.00 g was weighed, mixed with 50 mL of 1 mol·L−1 KCl solution, shaken for 30 min for extraction, and filtered. The nitrate nitrogen and ammonium nitrogen contents in the extract were simultaneously determined using a continuous flow analyzer (SmartChem 200C, Alliance, Frepillon, France).

2.8. Determination of Soil Enzyme Activity

At 0 d after anthesis, soil samples were collected from the 0–20 cm plow layer of each plot using a five-point sampling method. After air-drying, the samples were passed through a 1 mm sieve. Soil enzyme activities were determined using assay kits produced by Suzhou Comin Biotechnology Co., Ltd (Suzhou, China). Soil urease activity was measured using the indophenol blue colorimetric method [17], and catalase activity was measured using the ultraviolet absorption method [18,19]. Each sample was measured in three replicates.

2.9. Soil Microbial Analysis

At 0 d after anthesis, soil samples were collected from the 0–20 cm plow layer of each plot using a five-point sampling method. After passing through a 2 mm sieve, fresh soil samples were immediately placed in cryogenic vials, snap-frozen in liquid nitrogen, and stored at −80 °C until further use. Total genomic DNA was extracted from 0.5 g of each soil sample using the E.Z.N.A.® soil DNA kit (Omega Bio-tek, Norcross, GA, USA). The quality of the extracted DNA was examined by 1% agarose gel electrophoresis, and qualified samples were stored at −80 °C for further analysis. The V3–V4 region of bacterial 16S rRNA was amplified by PCR using primers 338F (5′-ACTCCTACGGAGGGAGCAG-3′) and 806R (5′-GGACTACHVGGGTWTCTAAT-3′). The fungal ITS1 region was amplified using primers ITS1F (5′-ACTTGGTCATTTAGAGAGAAGTAA-3′) and ITS2 (5′-BGCTGCGTTCTTCATCGATGC-3′). PCR products were recovered from 2% agarose gels and purified with a DNA gel extraction and purification kit (PCR Clean-Up Kit, Yuhua, Shanghai, China), and then quantified using a Qubit 4.0 fluorometer (Thermo Fisher Scientific, Waltham, MA, USA).
Libraries were constructed from the purified PCR products using the NEXTFLEX Rapid DNA-Seq Kit (PerkinElmer, Waltham, MA, USA): (1) adapter ligation; (2) removal of adapter self-ligation fragments using magnetic beads; (3) enrichment of library templates by PCR amplification; and (4) recovery of PCR products with magnetic beads to obtain the final library. Sequencing was performed on the Illumina NextSeq 2000 platform (Shanghai Majorbio Bio-pharm Technology Co., Ltd., Shanghai, China). After obtaining the high-throughput data, paired-end reads were merged using FLASH version 1.2.11. Quality-controlled and merged sequences were clustered into operational taxonomic units (OTUs) at 97% similarity and chimeras were removed using UPARSE v11.0.667. Taxonomic annotation of OTUs was performed using the RDP classifier version 2.11 against the Silva 16S rRNA gene database (v138.2) with a confidence threshold of 70%. Community composition was summarized for each sample at different taxonomic levels. OTUs were classified at the genus level, and the species composition of the top 10 genera with relative abundance >1% was analyzed.
All data analyses were carried out on the Majorbio Cloud Platform (https://cloud.majorbio.com, accessed on 11 September 2024). Alpha diversity indices, such as Chao1 and Shannon, were calculated using mothur (http://www.mothur.org/wiki/calculators, accessed on 11 September 2024), and between-group differences in alpha diversity were assessed using the Wilcoxon rank-sum test.

2.10. Determination of Total Nitrogen Content in Soil

Soil samples were collected from the 0–20 cm, 20–40 cm, and 40–60 cm soil layers of each plot at 0, 10, 20, and 30 d after anthesis, and at maturity. After air-drying, the samples were passed through a 200-mesh sieve, digested with concentrated H2SO4, and analyzed for total nitrogen content using the Kjeldahl method [20].

2.11. Determination of Dry Matter Accumulation and Nutrient Content

Destructive sampling was conducted at 0, 10, 20 and 30 d after anthesis, as well as at maturity. Two sampling points were selected in each plot to collect aboveground plants from 1 m of double-row plots. Forty plants were randomly selected and separated into organs: at the anthesis stage the samples were divided into three parts (stem + leaf sheath, leaf blade, and spike), and at maturity into four parts (stem + leaf sheath, leaf blade, rachis + glume, and grain). All samples were initially dried at 105 °C for 30 min to deactivate enzymes, then oven-dried at 75 °C to constant weight for dry matter measurement. The dried samples were ground, digested using the concentrated H2SO4–H2O2 method, and analyzed for total nitrogen content by the Kjeldahl method, phosphorus content by the vanadium-molybdate yellow colorimetric method, and potassium content by flame photometry [16].

2.12. Calculation of Nitrogen Accumulation, Transport and Utilisation Efficiency

Indices related to nitrogen fertilizer use efficiency:
Nitrogen agronomic efficiency (kg·kg−1) = (grain yield of N-fertilized treatment − grain yield of control treatment)/N application rate
Nitrogen partial factor productivity (kg·kg−1) = grain yield of N-fertilized treatment/N application rate
Nitrogen recovery efficiency (%) = (aboveground N uptake of N-fertilized treatment − aboveground N uptake of control treatment)/N application rate × 100

2.13. Data Processing

Data were organized and summarized using Microsoft Excel 2010, and statistical analyses were performed using SPSS 22.0. To examine the treatment × time/soil depth interaction, repeated-measures ANOVA was conducted, with time/soil depth as the within-subject factor and treatment as the between-subject factor. Mauchly’s test was used to assess the sphericity assumption, and when the sphericity assumption was violated, the Greenhouse-Geisser correction was applied. When the interaction was significant, simple effects analysis was further performed, i.e., one-way ANOVA combined with Duncan’s multiple range test (p < 0.05), to evaluate differences among treatments at specific time points. For variables measured at only a single time point, one-way ANOVA combined with Duncan’s multiple range test (p < 0.05) was directly used. Figures and tables were plotted using Origin 2021.

3. Results

3.1. The Effect of Long-Term Nitrogen Fertilizer Management Strategies on Winter Wheat Yields

As shown in Table 2, the grain yield of winter wheat under different treatments was evaluated across three consecutive growing seasons (2020–2021, 2021–2022, and 2022–2023) in the long-term fixed-site experiment. The results showed that the grain yields of all nitrogen-fertilized treatments (FP, OPT, and CRF) were significantly higher than those of the non-fertilized control (CK) in all three growing seasons (p < 0.05). Among the nitrogen-fertilized treatments, no significant differences in yield were observed among the three growing seasons (p > 0.05), with yields consistently ranking OPT > FP > CRF. Therefore, in terms of yield, the nitrogen management strategy used in the OPT treatment was the most favorable among the tested treatments across these three growing seasons.
Table 2. Interannual effects of different fertilization management patterns on wheat yield (2020–2023).
TreatmentUnit2020–20212021–20222022–2023
CKkg·hm−21333.44 ± 59.91 b4217.54 ± 409.58 b1247.29 ± 1060.36 b
FPkg·hm−28236.07 ± 96.70 a9380.32 ± 754.85 a8099.05 ± 136.17 a
OPTkg·hm−28779.82 ± 562.84 a10,018.67 ± 369.97 a8464.23 ± 1569.27 a
CRFkg·hm−28152.69 ± 482.57 a9349.47 ± 532.59 a8050.69 ± 144.50 a
Note: Different lowercase letters within the same column indicate significant differences in Duncan’s (p < 0.05).

3.2. The Effects of Different Nitrogen Fertilizer Management Strategies on Wheat Yield, Its Composition and Nitrogen Use Efficiency

As shown in Table 3, compared with the non-fertilized control (CK), all nitrogen-fertilized treatments (FP, OPT, and CRF) significantly increased grain yield, spike number, and grains per spike of wheat (p < 0.05). The highest grain yield was achieved under the OPT treatment, reaching 8871.69 kg·hm−2, which was 181.46%, 2.32%, and 4.00% higher than that of CK, FP, and CRF, respectively. Regarding yield components, the OPT treatment exhibited both the highest spike number and grains per spike, while the FP treatment had the highest thousand-grain weight. Specifically, the spike number of OPT was 1.82% and 1.39% higher than that of FP and CRF, respectively, and its grains per spike were 3.99% and 0.32% higher, respectively; the thousand-grain weight of FP was 2.35% and 2.08% higher than that of OPT and CRF, respectively. In terms of nitrogen use efficiency, the nitrogen agronomic efficiency, nitrogen partial factor productivity, and nitrogen recovery efficiency of OPT were all higher than those of FP and CRF. In particular, the nitrogen recovery efficiency of OPT reached 74.82%, which was 5.29% and 5.69% higher than that of FP and CRF, respectively.
Table 3. Effects of different fertilization management patterns on wheat yield, yield components, and nitrogen use efficiency. Data are from the 2023–2024 growing season.
ParametersUnitCKFPOPTCRF
Yield
targets
Grain yieldkg·hm−23151.99 ± 586.97 b8670.29 ± 387.32 a8871.69 ± 686.41 a8530.29 ± 550.01 a
Spike number×104·hm−2470.89 ± 35.68 b716.87 ± 12.05 a729.92 ± 44.10 a719.88 ± 0.00 a
Grain number per spikeper spike18.34 ± 2.72 b30.34 ± 1.08 a31.55 ± 2.12 a31.45 ± 2.27 a
Thousand-grain weightg43.89 ± 0.56 c46.19 ± 2.88 a45.13 ± 2.55 b45.25 ± 0.56 ab
Nitrogen efficiency targetsNitrogen agronomic efficiencykg·kg−1-24.53 ± 1.72 a25.42 ± 3.05 a23.90 ± 2.45 a
Productivity of nitrogenkg·kg−1-38.53 ± 1.72 a39.43 ± 3.05 a37.91 ± 2.44 a
Nitrogen recovery efficiency%-71.06 ± 5.33 a74.82 ± 2.31 a70.79 ± 2.96 a
Note: Different lowercase letters within the same column indicate significant differences in Duncan’s (p < 0.05).

3.3. Impact of Different Nitrogen Fertilizer Management Strategies on Post-Anthesis Photosynthetic Characteristics in Wheat

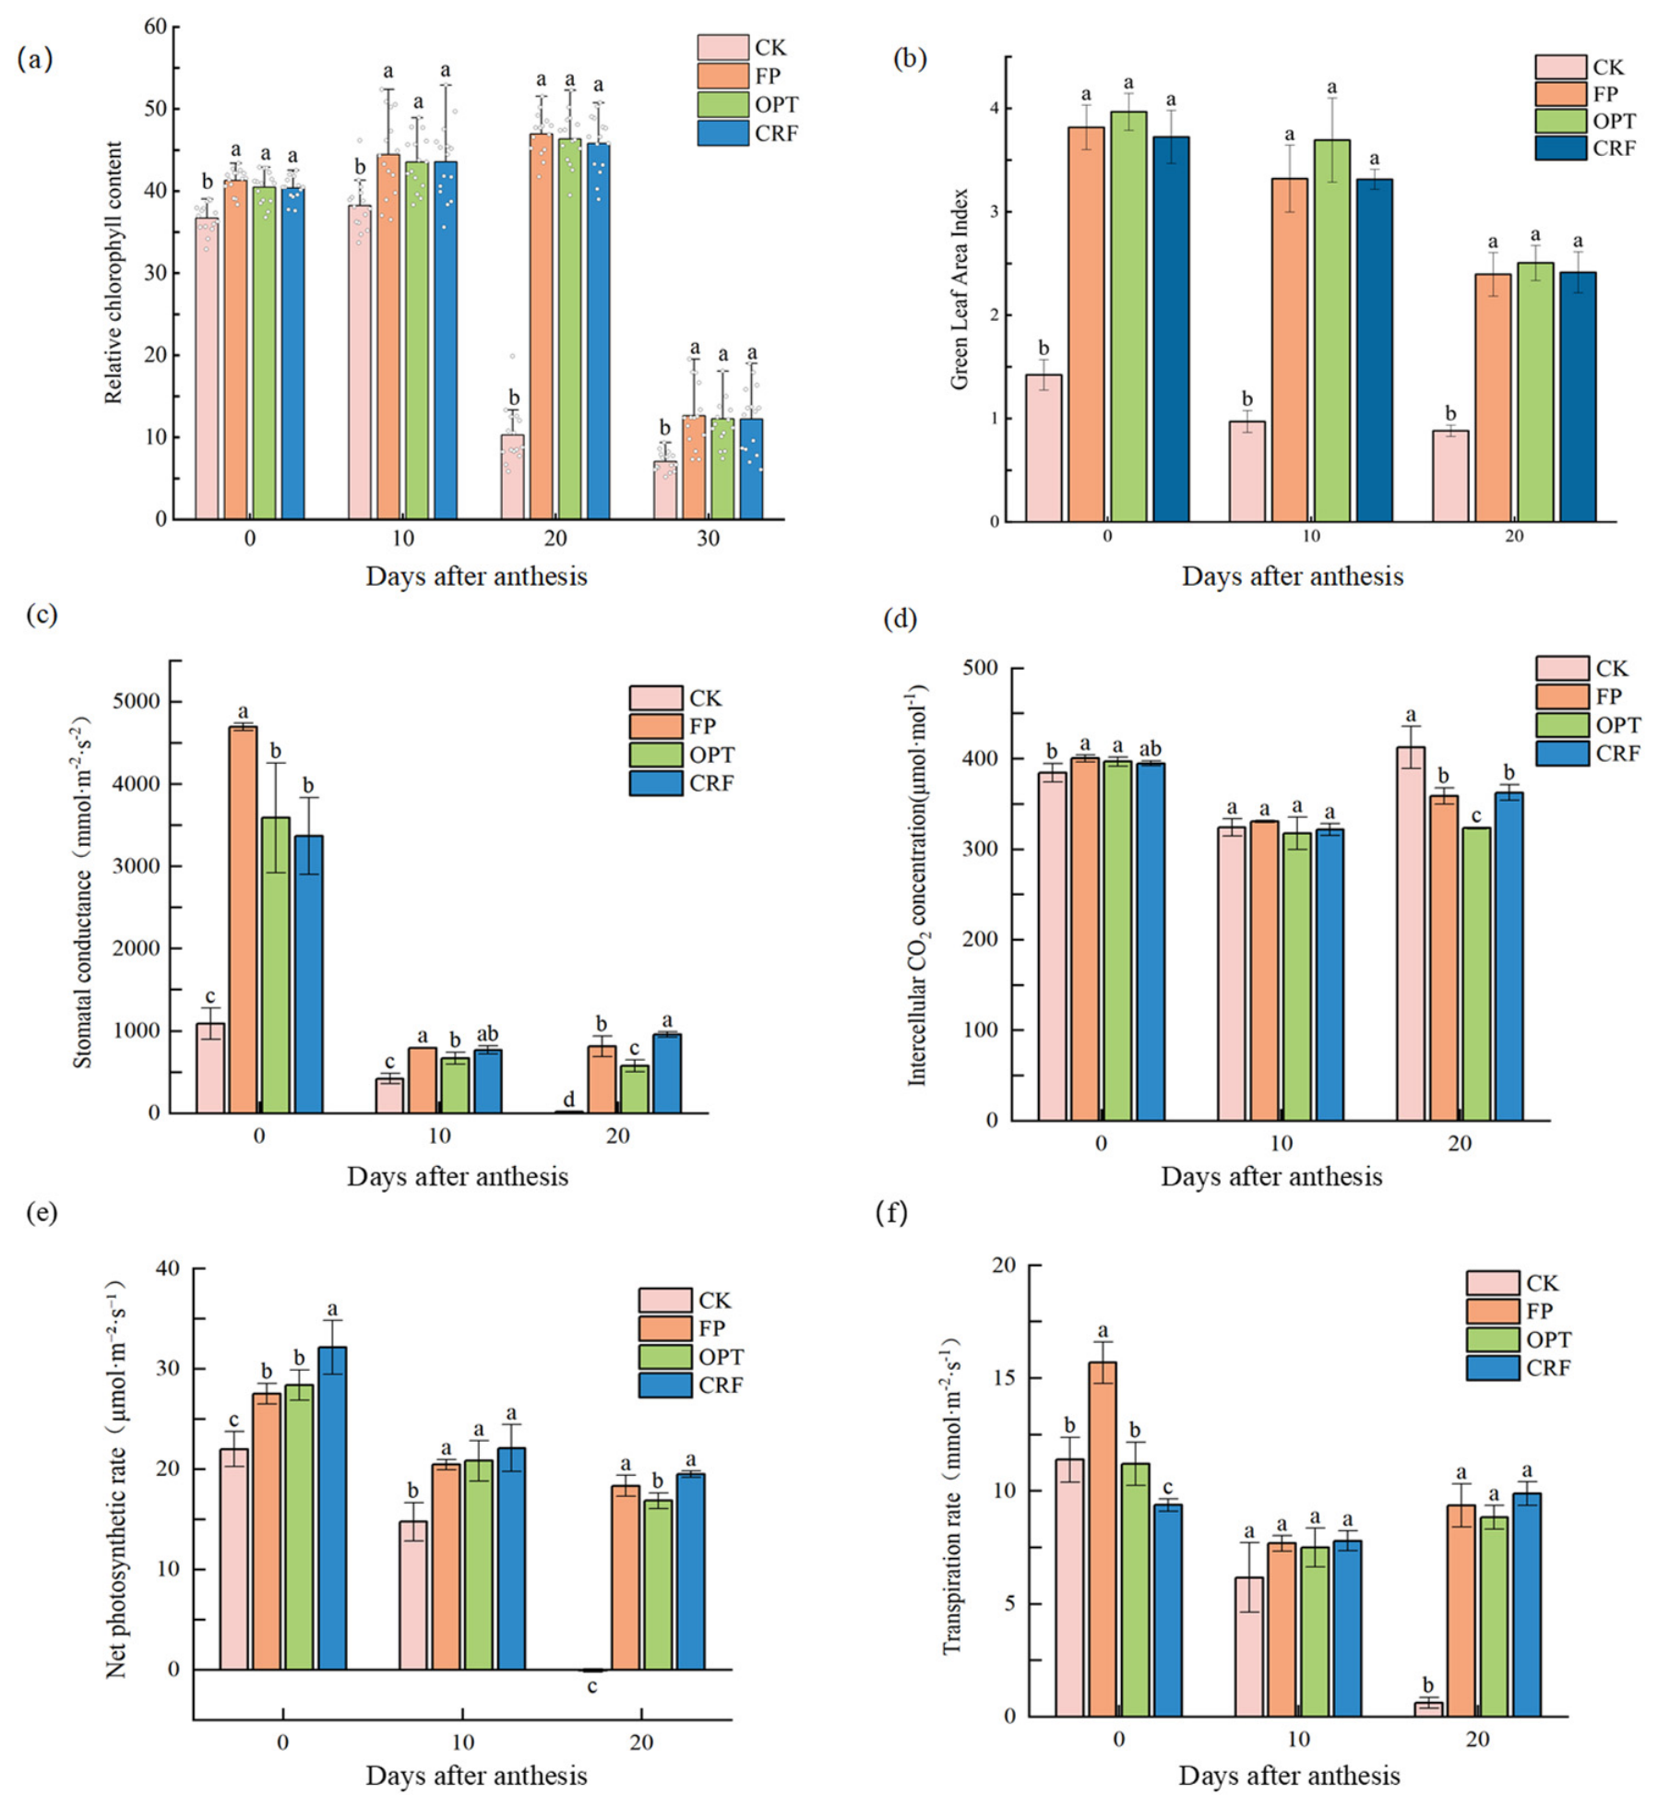
All parameters exhibited significant time × treatment interactions. As shown in Figure 1a, the flag leaf SPAD values of all treatments showed a trend of first increasing and then decreasing after anthesis. The SPAD value of CK was much lower than those of the nitrogen−fertilized treatments; it peaked at 10 d after anthesis and then declined sharply, dropping to 7.04 by 30 d after anthesis. The SPAD values of all nitrogen-fertilized treatments peaked at 20 d after anthesis and decreased rapidly from 20 to 30 d. At all post-anthesis stages, the SPAD values of the nitrogen-fertilized treatments were significantly higher than that of CK (p < 0.05), with FP showing the highest value, followed by OPT and CRF; however, no significant differences were observed among the nitrogen-fertilized treatments. At 20 d after anthesis, the SPAD value of FP was 357.06%, 0.32%, and 2.49% higher than those of CK, OPT, and CRF, respectively.
Figure 1. Post-anthesis SPAD value of flag leaf, green leaf area index, and photosynthetic traits. (a) Post-anthesis SPAD value, white dots represent individual SPAD data points, (b) Green leaf area index, (c) Stomatal conductance, (d) Intercellular CO2 concentration, (e) Net photosynthetic rate, (f) Transpiration rate. Data are from the 2023−2024 growing season. Data are presented as mean ± standard deviation. The F and p values for the time × treatment interactions were as follows: SPAD, F = 85.721, p < 0.001; GLAI, F = 4.154, p = 0.014; Tr, F = 37.981, p < 0.001; Ci, F = 13.546, p < 0.001; Gs, F = 28.794, p < 0.001; and Pn, F = 18.943, p < 0.001. Different lowercase letters in the same column indicate significant differences among treatments based on ANOVA followed by Duncan’s multiple comparison test (p < 0.05).
Agriculture 16 02195 g001
As shown in Figure 1b, the GLAI of all treatments decreased gradually with increasing time after anthesis. The differences between the nitrogen-fertilized treatments and CK were significant (p < 0.05), while no significant differences were found among the nitrogen-fertilized treatments. OPT exhibited the highest GLAI, and CK the lowest. Post-anthesis, the GLAI of CK declined steadily, whereas that of the nitrogen-fertilized treatments decreased slowly from 0 to 10 d and then declined rapidly after 10 d. At 0 d after anthesis, the GLAI of OPT was the highest at 3.97, followed by FP and CRF with close values of 3.82 and 3.81, respectively, while that of CK was significantly lower than the nitrogen-fertilized treatments (p < 0.05), at only 1.42. At 20 d after anthesis, the GLAI of OPT decreased to 2.51, and those of FP and CRF were 2.39 and 2.46, respectively.
As shown in Figure 1c–f, the net photosynthetic rate (Pn) of all treatments decreased gradually with the progression of growth stages, and the Pn of nitrogen-fertilized treatments was significantly higher than that of CK (p < 0.05). Among the nitrogen-fertilized treatments, CRF remained at the highest level throughout the post-anthesis period, whereas the Pn of CK had dropped to negative values by 20 d after anthesis. From 0 to 10 d after anthesis, the Pn of OPT was higher than that of FP, but at 20 d after anthesis the Pn of FP exceeded that of OPT. The transpiration rate (Tr) and stomatal conductance (Gs) showed essentially consistent trends. The Tr and Gs of CK decreased continuously after anthesis and were significantly lower than those of the nitrogen-fertilized treatments. The Tr of the nitrogen-fertilized treatments showed a trend of first decreasing and then increasing, as did the Gs of FP and CRF, whereas the Gs of OPT decreased gradually. The intercellular CO2 concentration (Ci) of all treatments showed a trend of first decreasing and then increasing after anthesis.

3.4. The Effects of Different Nitrogen Fertilizer Management Strategies on the Soil Environment During the Anthesis Stage of Wheat

  • The Effects of Soil Ammonium N Profiles and Soil Enzyme Activity at the Maturity Stage of Wheat
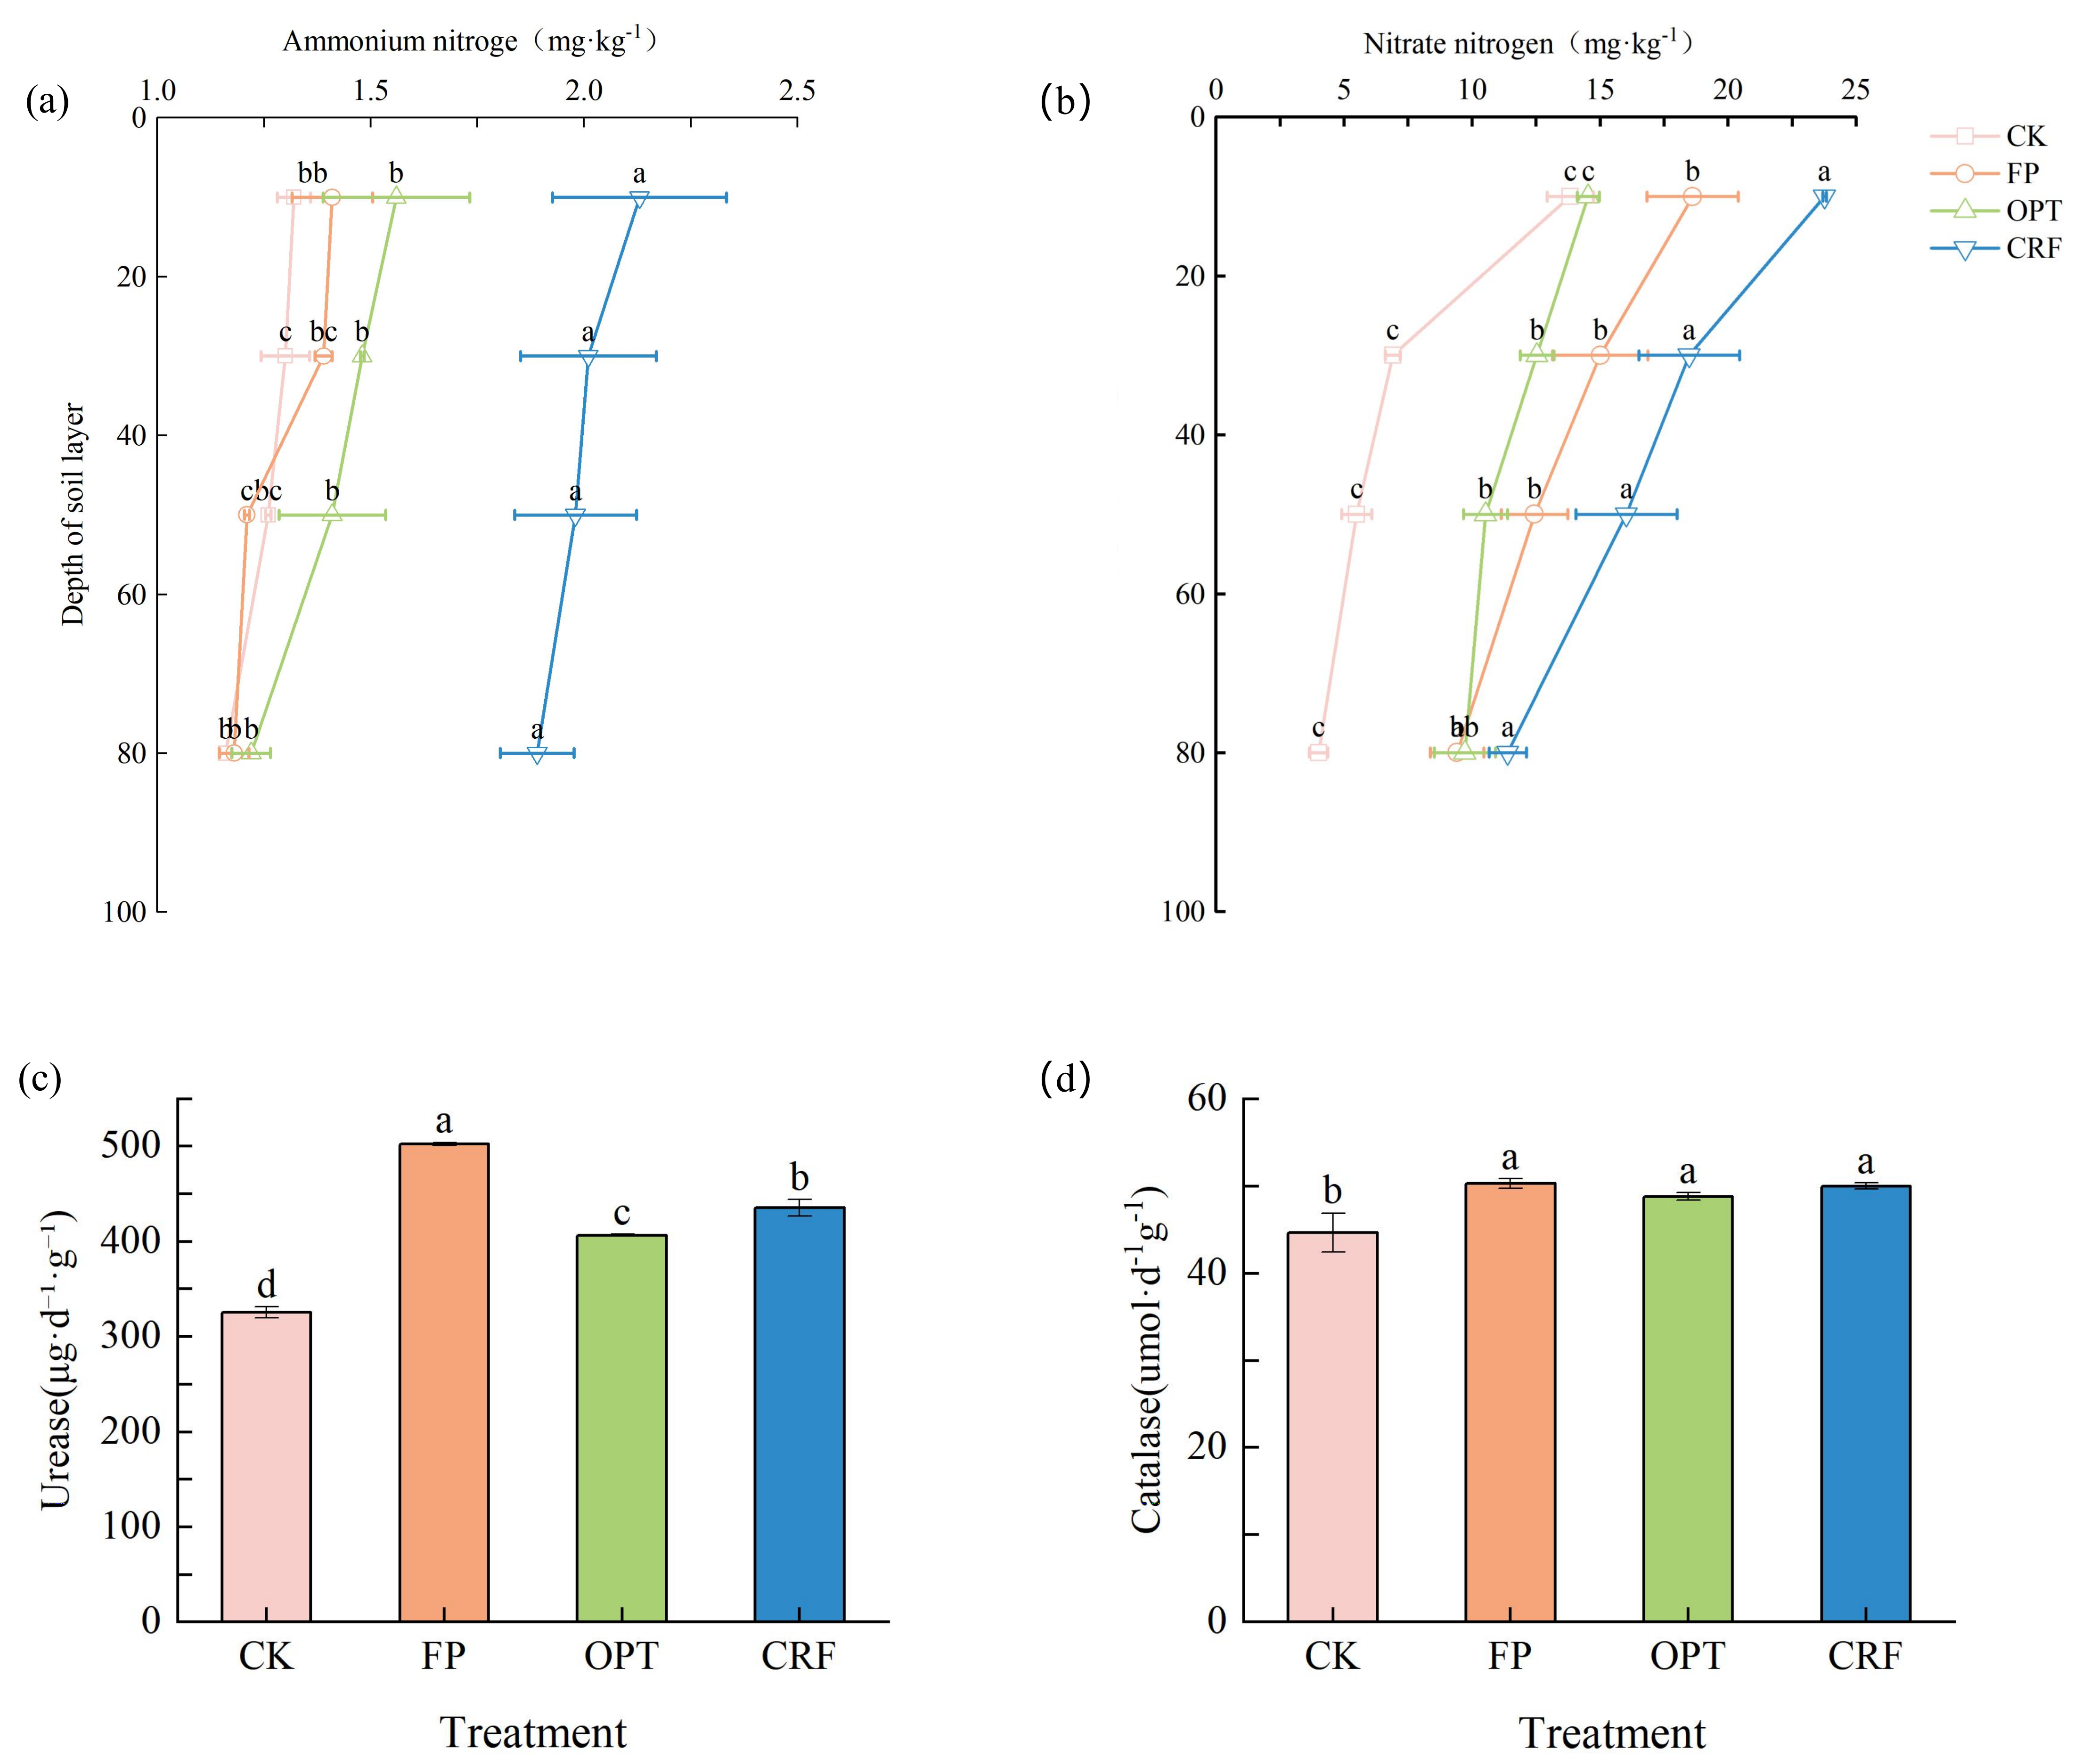
As shown in Figure 2a,b, the ammonium nitrogen (NH4+) content across all treatments remained generally low, ranging from 1.2 to 2.3 mg⋅kg−1. The CRF treatment was significantly higher than the other treatments across all soil layers. In the 0–20 cm topsoil layer, the NH4+ content reached its maximum under the CRF treatment at 2.13 mg⋅kg−1, followed by OPT, while FP and CK were the lowest; the content gradually decreased with increasing soil depth across all treatments. Nitrate nitrogen (NO3−) content progressively declined with soil depth. In the 0–20 cm surface layer, the NO3− content in the CRF treatment was significantly higher than that in the OPT and FP treatments (p < 0.05), reaching 23.77 mg⋅kg−1, with no significant difference observed between OPT and CK. In the 20–40 cm subsurface layer, the CRF treatment remained significantly higher than the other treatments, following the order of CRF > FP > OPT and CK, with a sharp decline observed in the CK treatment. In the deeper layers (40–60 cm and 60–90 cm), residual NO3− under all nitrogen application treatments remained higher than that in CK, though the differences among treatments narrowed; specifically, the residual NO3− in the FP treatment at 60–90 cm was 9.75 mg⋅kg−1, which was lower than that in OPT and CRF.
As shown in Figure 2c,d, at 0 d after anthesis, urease activity was the highest in the FP treatment, followed by CRF and OPT, and lowest in CK. All nitrogen treatments exhibited significantly higher urease activity than CK (p < 0.05); specifically, urease activity in FP increased by 64.35%, 23.63%, and 15.43% compared to CK, OPT, and CRF, respectively. Catalase activity followed the trend of FP > OPT and CRF > CK. Compared to CK, catalase activity in FP, OPT, and CRF increased by 12.61%, 3.01%, and 0.58%, respectively, although no significant differences were observed among the nitrogen-applied treatments.
2.
The Effects of Soil Microbial α-Diversity and Community Composition
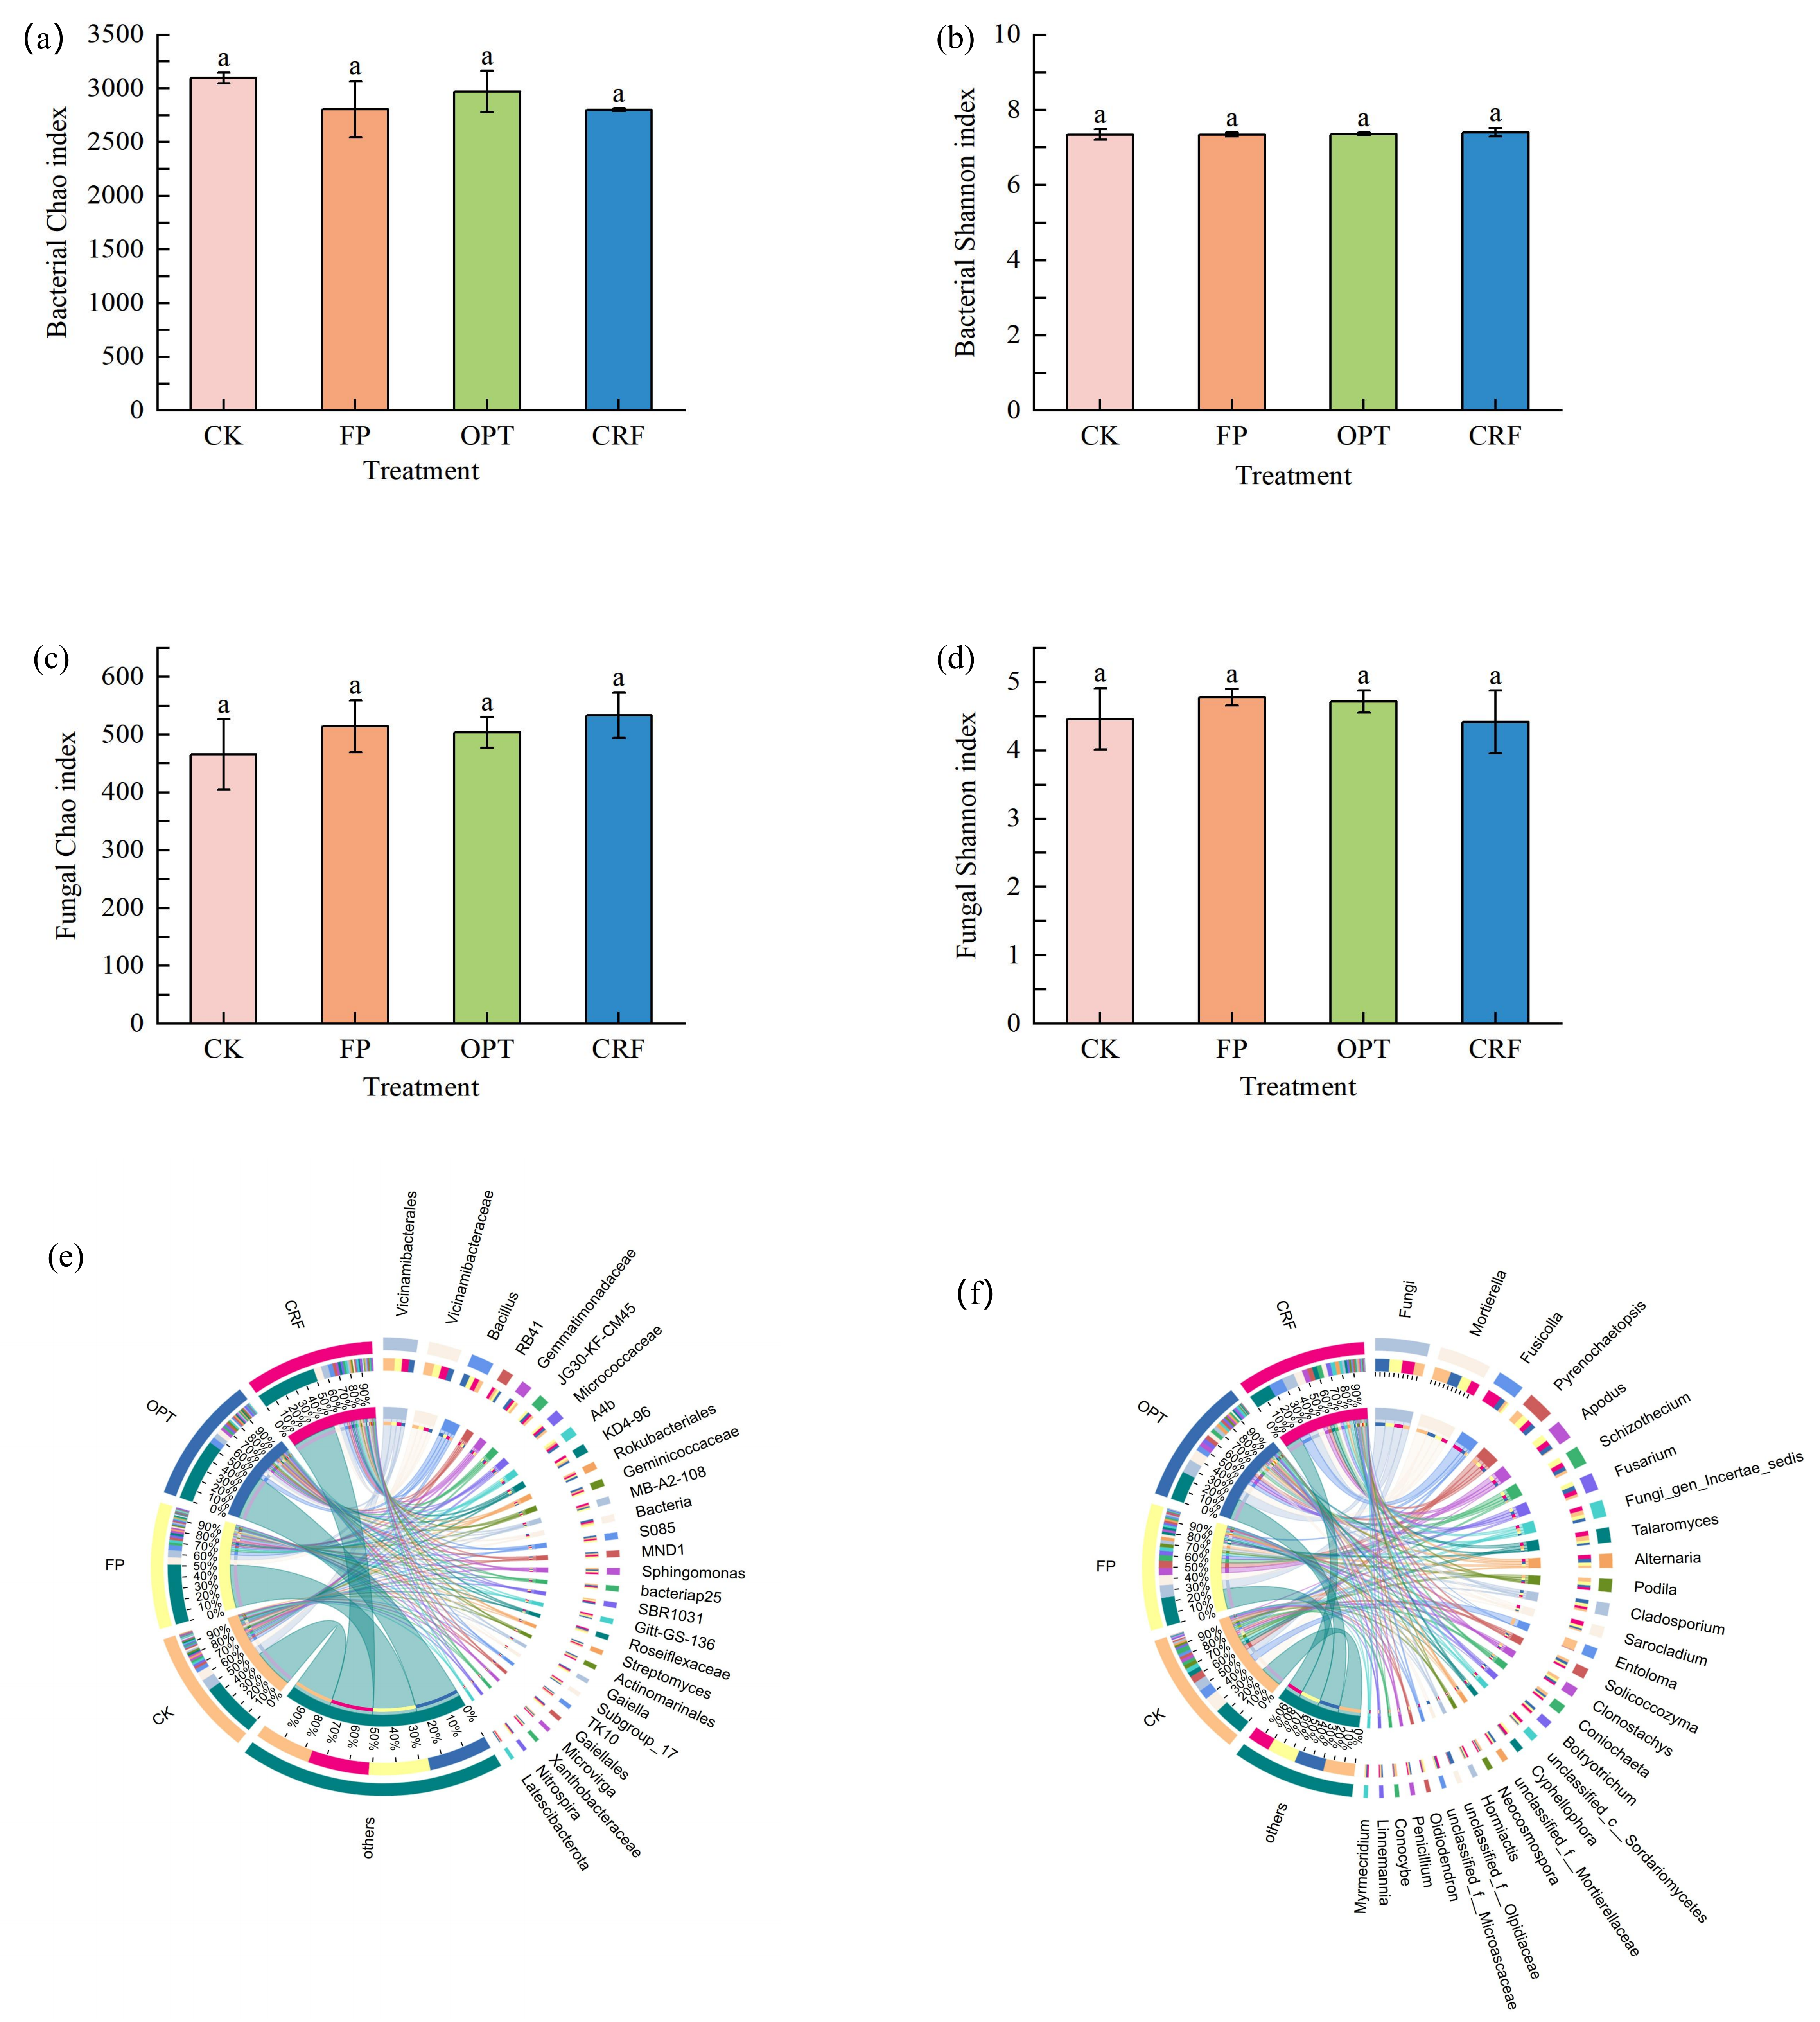
As shown in Figure 3a−d, there were no significant differences in the Chao or Shannon indices of bacteria and fungi among treatments (p > 0.05). The bacterial Chao index was highest in the CK treatment, followed by OPT, and lower in the FP and CRF treatments; the bacterial Chao index in CK was 10.3%, 4.2%, and 10.6% higher than that in FP, OPT, and CRF treatments, respectively. The bacterial Shannon index was highest in CK, followed by CRF, and lower in OPT and FP. The fungal Chao index was highest in CRF, followed by FP, and lower in OPT and CK; the fungal Chao index in CRF was 3.7%, 5.9%, and 14.5% higher than that in FP, OPT, and CK treatments, respectively. The fungal Shannon index was highest in FP, followed by OPT, and lower in CK and CRF.
As shown in Figure 3e,f, different fertilization management modes significantly affected the soil microbial community composition after wheat anthesis. Among the bacterial and fungal communities under different fertilization management modes, the five dominant bacterial groups Vicinamibacterales, Vicinamibacteraceae, Bacillus, RB41, and Gemmatimonadaceae were the most abundant in post-anthesis wheat soil. Compared with CK, the abundances of Vicinamibacterales and Vicinamibacteraceae in the FP and OPT treatments were significantly decreased; however, OPT significantly increased the abundance of the plant growth-promoting bacterial group Bacillus (31%) relative to FP (25%). Meanwhile, Mortierella, Fusicolla, Pyrenochaetopsis, and Apodus were the main fungal communities. Compared with CK (35%), the different fertilization modes FP (22%), OPT (25%), and CRF (18%) significantly reduced the abundance of Mortierella. In addition, OPT significantly reduced the abundance of Pyrenochaetopsis relative to the other fertilization modes.
Figure 2. Effects of treatments on soil nitrate and ammonium nitrogen contents and enzyme activities at maturity. (a) The soil ammonium nitrogen (NH4+−N), (b) nitrate nitrogen (NO3−−N), (c) urease activity (UA), (d) catalase activity (CAT). Data are from the 2023−2024 growing season. Data are presented as mean ± standard deviation. Different lowercase letters in the same column indicate significant differences among treatments based on ANOVA followed by Duncan’s multiple comparison. test (p < 0.05).
Agriculture 16 02195 g002
3.
Changes in Total Soil Nitrogen Content Following Anthesis in Wheat
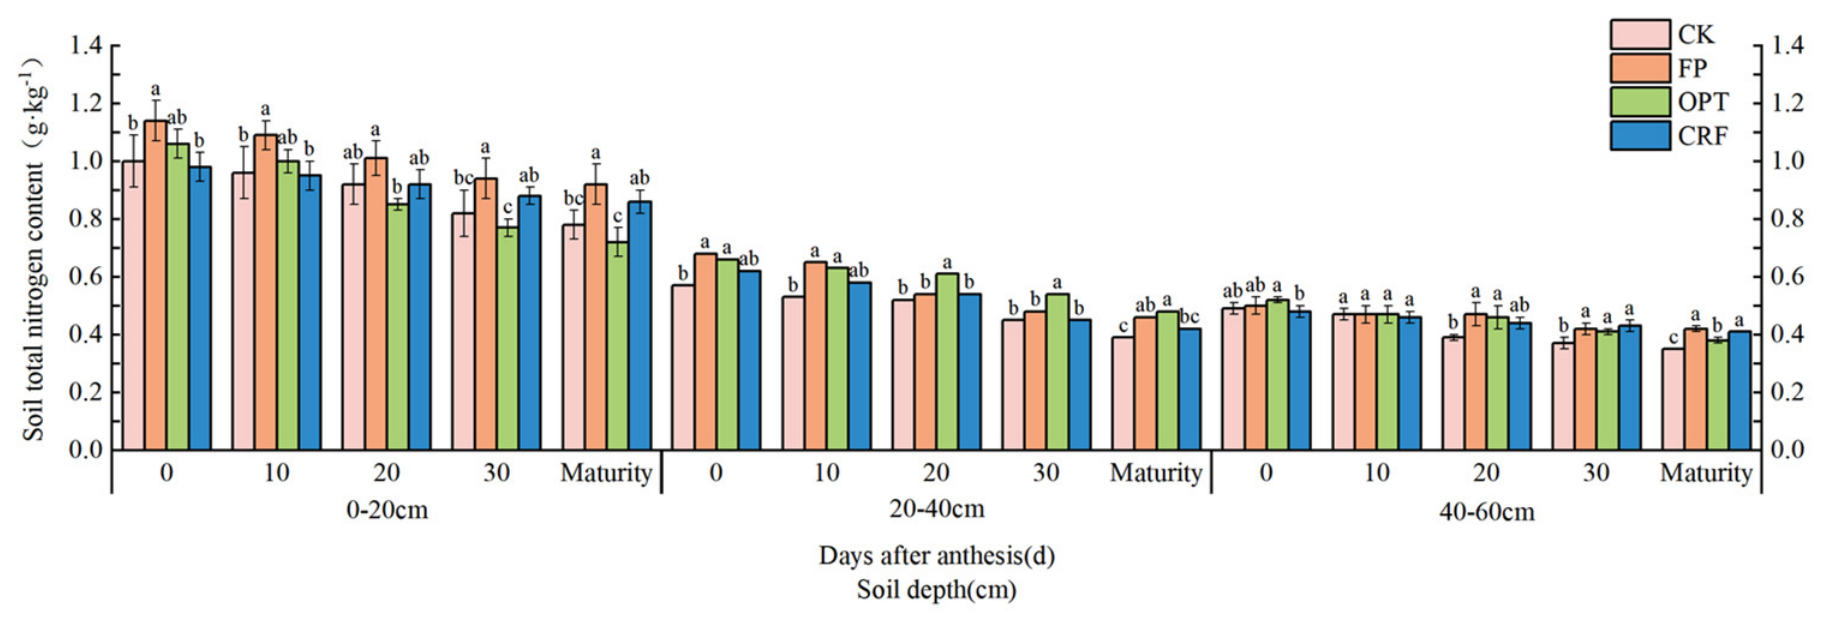
As shown in Figure 4, soil total nitrogen under different treatments showed a gradual decreasing trend after anthesis, and the magnitude of the decrease varied among different fertilization modes. Changes in soil total nitrogen were more obvious in the 0–40 cm soil layer, while changes in the 40–60 cm soil layer were relatively gentle.
Figure 3. Effects of different treatments on soil microbial alpha diversity and community composition at anthesis (0 d post-anthesis). (a) Bacterial Chao index, (b) Bacterial Shannon index, (c) Fungal Chao index, (d) Fungal Shannon index, (e) bacterial community circos plot, (f) fungal community circos plot. Data are from the 2023–2024 growing season. Data are presented as mean ± standard deviation. Different lowercase letters in the same column indicate significant differences among treatments based on ANOVA followed by Duncan’s multiple comparison test (p < 0.05).
Agriculture 16 02195 g003
Figure 4. Dynamic changes in soil total nitrogen in the 0−60 cm layer post-anthesis. Four treatments were set in the experiment: CK (control check), FP (conventional fertilization), OPT (optimized fertilization), and CRF (controlled release fertilizer). Soil total nitrogen content was determined in three soil layers (0−20 cm, 20−40 cm, 40−60 cm) at 0, 10, 20, 30 d after anthesis and at the maturity stage. Data are from the 2023−2024 growing season. The F and p values for the time × treatment interaction from repeated-measures ANOVA were: 0−20 cm layer, F = 4.044, p = 0.027; 20−40 cm layer, F = 1.567, p = 0.211; and 40−60 cm layer, F = 7.622, p < 0.001. Within the same soil layer and the same growth stage, different lowercase letters above the bars indicate significant differences among treatments (p < 0.05, Duncan’s multiple range test).
Agriculture 16 02195 g004
In the 0–20 cm topsoil layer, the time × treatment interaction for soil total nitrogen was significant. Soil total nitrogen in the CK treatment decreased continuously from 1.00 g·kg−1 at the anthesis stage to 0.78 g·kg−1 at maturity, a decrease of 22.0%, with 20–30 d after anthesis being the peak period of nitrogen uptake by plants. The FP treatment maintained the highest soil total nitrogen level at all post-anthesis stages, decreasing from 1.14 g·kg−1 at anthesis to 0.92 g·kg−1, a decrease of 19.3%, and the decreases in both the 10–20 d and 20–30 d periods after anthesis were 0.07 g·kg−1. The OPT treatment decreased from 1.06 g·kg−1 to 0.72 g·kg−1, a decrease of 32.1%, which was the largest decrease among all treatments, and the peak period of plant nitrogen uptake occurred at 10–20 d after anthesis. The CRF treatment showed the smallest decrease, only 12.2%.
In the 20–40 cm sub-plow layer soil, the time × treatment interaction for soil total nitrogen was not significant, but the main effect of treatment was significant in this soil layer (p < 0.05). The trends of soil total nitrogen in all treatments were basically consistent with those in the surface layer, but the decreases were somewhat larger. The decreases in the CK, FP, OPT, and CRF treatments were 31.0%, 32.4%, 27.3%, and 32.3%, respectively. The largest decrease in total nitrogen occurred during the 20–30 d period after anthesis. The FP treatment maintained relatively high levels at both the anthesis and maturity stages, followed by OPT and CRF, and CK was the lowest. In the 40–60 cm deep soil layer, the time × treatment interaction for soil total nitrogen was also significant, the changes in soil total nitrogen in all treatments were generally small, with decreases ranging from 6.7% to 26.9%. The OPT treatment had the largest decrease of 26.9%, with the greatest decline occurring during the 0–10 d period after anthesis.

3.5. The Effects of Different Nitrogen Fertilizer Management Strategies on Post-Anthesis Nitrogen Accumulation and Transport in Wheat

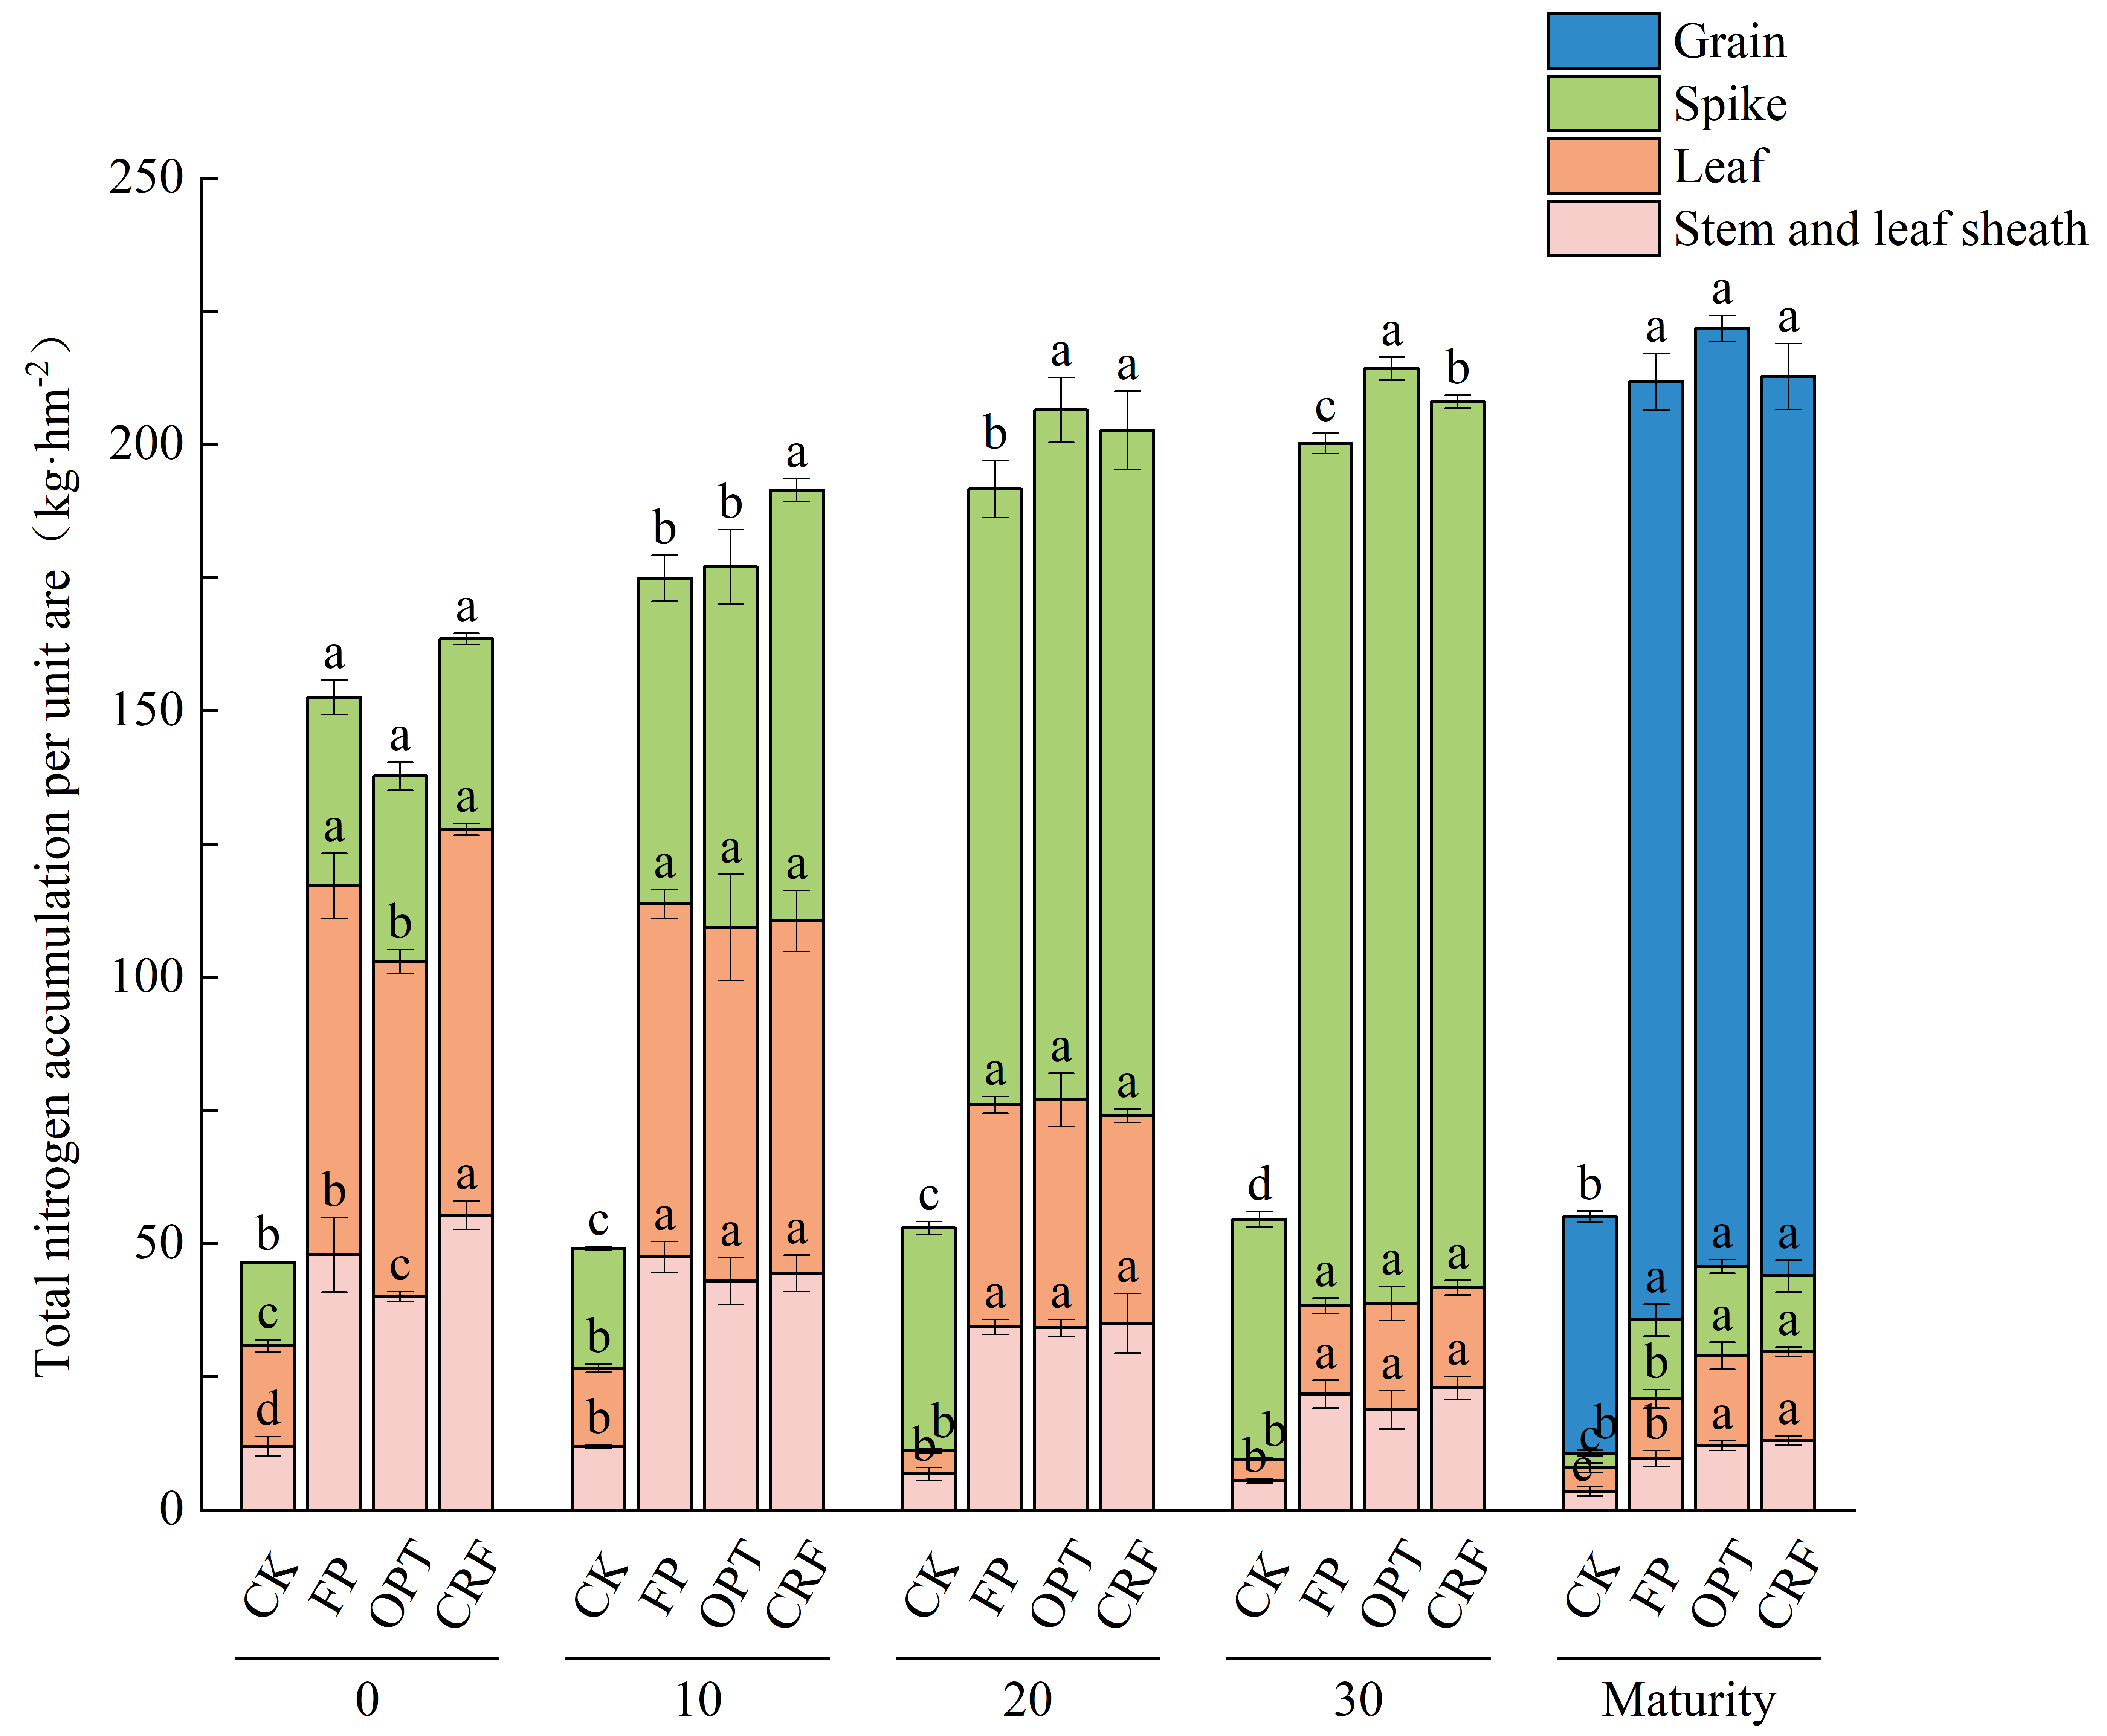
All parameters exhibited significant time × treatment interactions. As shown in Figure 5, plant nitrogen accumulation per unit area in all nitrogen application treatments was significantly higher than that in the CK treatment (p < 0.05). At 0 d after anthesis, the CRF treatment had the highest plant nitrogen accumulation, reaching 163.53 kg·hm−2, followed by FP and OPT, while CK was the lowest at only 46.49 kg·hm−2. At maturity, the grain nitrogen accumulation in the OPT and FP treatments was approximately equal, at 176.05 kg·hm−2 and 176.13 kg·hm−2, respectively, followed by the CRF treatment, and the CK treatment had the lowest nitrogen accumulation of 42.73 kg·hm−2. The CK treatment increased fastest from 20 to 30 d after anthesis; the FP treatment increased fastest from 10 to 20 d after anthesis; and the OPT and CRF treatments increased fastest from 0 to 10 d after anthesis.

3.6. Correlation Analysis of Physiological Indicators, Yield Indicators, Dry Matter Yield and Nitrogen Transport in Wheat Following Anthesis

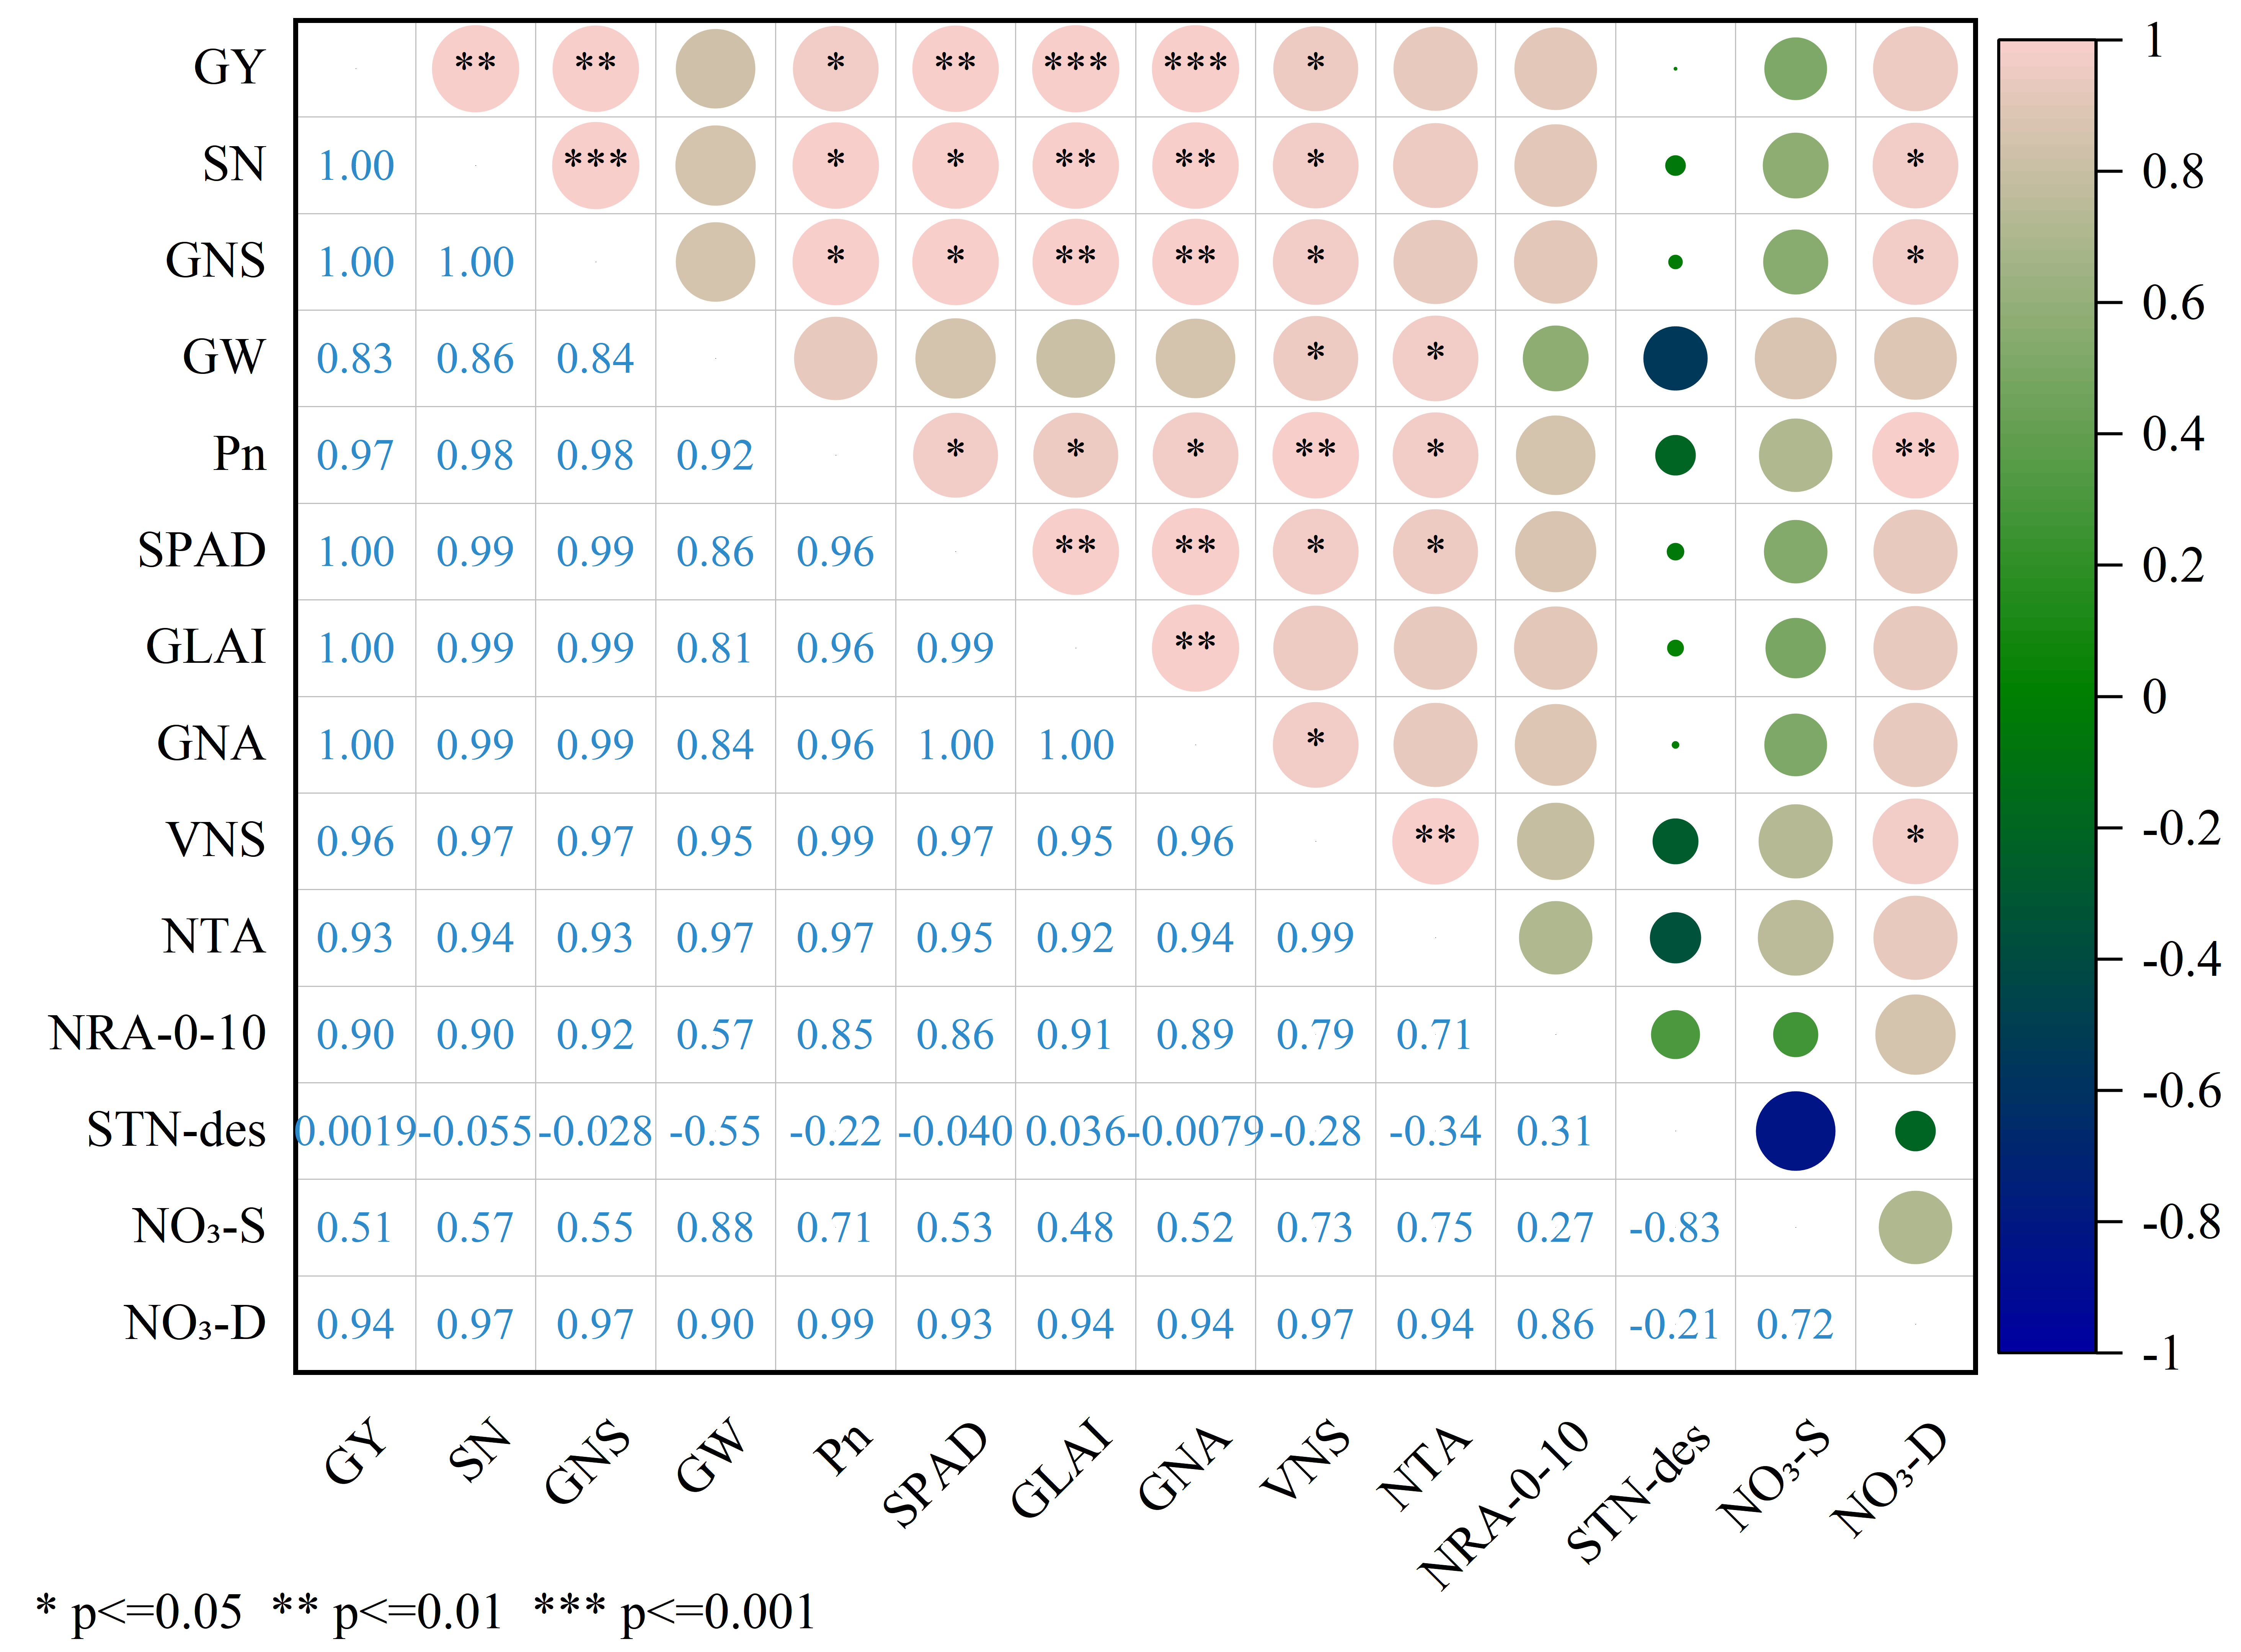
As shown in Figure 6, grain yield (GY) was highly significantly correlated with SN and GNS (p < 0.01). Among photosynthetic characteristics, GY showed highly significant positive correlations with SPAD and GLAI (p < 0.01) and a significant correlation with Pn (p < 0.05), with GLAI showing the strongest correlation with GY. Among nitrogen utilization characteristics, GY was highly significantly positively correlated with GNA (p < 0.01) and significantly correlated with VNS, but had no significant correlation with NTA or NRA-0-10. Among soil nitrogen pool indicators, GY had no significant correlation with STN−des, NO3−S at harvest, or NO3−D. Further analysis showed that Pn was highly significantly positively correlated with VNS and NO3−D (p < 0.01), and significantly positively correlated with SPAD, GLAI, SN, GNS, GNA, and NTA (p < 0.05).
Figure 5. Dynamics of post-anthesis nitrogen accumulation in wheat plants. Four fertilization treatments were set in the experiment: control (CK), conventional fertilization (FP), optimized fertilization (OPT), and controlled release fertilizer (CRF). Nitrogen accumulation per unit area in stem and leaf sheath, leaf, spike (plus grain at the maturity stage) was determined at 0, 10, 20, 30 d after anthesis and maturity. Data are from the 2023−2024 growing season. The F and p values for the Time × Treatment interaction from repeated-measures ANOVA were: stem total nitrogen, F = 16.087, p < 0.001; leaf total nitrogen, F = 25.066, p < 0.001; and panicle total nitrogen, F = 141.031, p < 0.001. Different lowercase letters on bars for the same organ at the same growth stage indicate significant differences among treatments (p < 0.05, Duncan’s multiple range test).
Agriculture 16 02195 g005
Figure 6. Correlation analysis of yield-related traits and physiological indices after anthesis of different treatments. Data are from the 2023−2024 growing season.The shade of the circles represents the magnitude and direction of the correlation coefficient (pink for positive, blue for negative, according to the color bar on the right). The size of the circles represents the level of statistical significance ( p<=0.05, ** p<=0.01, *** p<=0.001); larger circles indicate greater significance. Notes: Definitions of abbreviations used in the figure. GY, grain yield; SN, spike number; GNS, grain number per spike; GW, thousand-grain weight; Pn, average net photosynthetic rate at 0, 10, and 20 d post-anthesis; SPAD, maximum relative chlorophyll content (20 d post-anthesis); GLAI, maximum green leaf area index (0 d post-anthesis); GNA, grain nitrogen accumulation at maturity; VNS, nitrogen storage in vegetative organs at anthesis; NTA, nitrogen translocation from vegetative organs to grains; NRA, nitrogen accumulation at 0−10 d post-anthesis; STN-des, decrease in soil total nitrogen in the 0−20 cm layer; NO3−S, nitrate nitrogen content in the 0−20 cm layer at harvest; NO3−D, nitrate nitrogen content in the 60−90 cm layer at maturity.
Agriculture 16 02195 g006

4. Discussion

4.1. Effects of Nitrogen Fertilizer Management Strategies on Post-Anthesis Photosynthesis, Nitrogen Transport, and Yield Formation in Winter Wheat

The assimilates required for winter wheat grain filling are mainly derived from post-anthesis photosynthesis and the retranslocation of storage substances from vegetative organs accumulated before anthesis. Therefore, maintaining a large green leaf area and strong leaf photosynthetic activity is an important physiological basis for achieving high yield [8,21]. Nitrogen is a key constituent of chlorophyll and photosynthetic enzymes, and an adequate nitrogen supply can delay flag leaf senescence and sustain photosynthetic production capacity during grain filling [22]. In the present study, the post-anthesis flag leaf SPAD value, green leaf area index (GLAI), and net photosynthetic rate (Pn) of nitrogen-fertilized treatments were generally higher than those of CK. Yield was extremely significantly and positively correlated with both the maximum SPAD value and maximum GLAI (p < 0.001), and significantly and positively correlated with the average Pn. Among these, GLAI showed the strongest correlation with yield, indicating that post-anthesis canopy photosynthetic area and its duration may play a greater role in yield formation than the instantaneous photosynthetic rate of individual leaves. The leaves of CK senesced rapidly after anthesis, with flag leaf Pn dropping to negative values by 20 d after anthesis, and its yield was only 35.53–36.59% of that of the nitrogen-fertilized treatments. This further indicates that an insufficient nitrogen supply restricts grain formation by accelerating the decline of canopy photosynthetic function.
Different nitrogen fertilizer management strategies affect post-anthesis photosynthetic function and dry matter production by altering the timing of nitrogen supply and its matching with plant demand. OPT adopted a split application with 50% basal fertilizer and 50% topdressing, which met the nitrogen demand for early canopy establishment while ensuring nitrogen supply during the middle and late growth stages, thus better maintaining post-anthesis SPAD values, GLAI, and canopy photosynthetic capacity. The flag leaf Pn of the CRF treatment was relatively high, but its SPAD value and GLAI were lower than those of the split-application treatments, suggesting that a higher single-leaf photosynthetic rate cannot fully compensate for the loss of assimilation capacity caused by insufficient canopy green area. Previous studies have also shown that optimizing the timing of nitrogen application can improve canopy radiation interception and use efficiency, and promote grain filling by increasing post-anthesis dry matter production and transport [21,23]. Therefore, when evaluating the photosynthetic effects of different nitrogen application strategies, leaf photosynthetic activity, canopy green area, and its maintenance duration should be considered comprehensively, rather than judging solely on the basis of single-leaf Pn.
Post-anthesis dry matter production and the retranslocation of nitrogen in vegetative organs jointly determine grain matter accumulation. Reasonable adjustment of the basal-to-topdressing nitrogen ratio can increase post-anthesis dry matter translocation and harvest index, and promote the redistributed allocation of nitrogen from stems and leaves to grains [23,24,25]. In the present study, the OPT treatment showed rapid plant nitrogen accumulation from 0 to 10 d after anthesis, with grain nitrogen accumulation reaching 176.13 kg·hm−2 at maturity; the grain nitrogen accumulation of the FP treatment was 176.05 kg·hm−2 at maturity, and it maintained a relatively strong nitrogen translocation capacity during the middle and late grain-filling stages. This indicates that balanced basal and top-dressed nitrogen favors early post-anthesis nitrogen uptake, whereas increasing the proportion of top-dressed nitrogen may prolong the translocation of nitrogen to grains during the middle and late stages. Grain nitrogen in winter wheat originates from both the retranslocation of nitrogen stored in pre-anthesis vegetative organs and continued nitrogen uptake by roots after anthesis; the coordination of the two is key to reconciling grain filling and nitrogen accumulation [24,25,26].
The OPT treatment achieved the highest grain yield of 8871.69 kg·hm−2, which was 2.32% and 4.00% higher than that of FP and CRF, respectively, and exhibited relatively high spike number and grains per spike. FP had the highest thousand-grain weight, but its lower spike number and grains per spike limited further yield improvement. It should be noted that the differences in yield and nitrogen use efficiency among the nitrogen-fertilized treatments did not reach a significant level; therefore, OPT can only be regarded as showing superior yield formation and nitrogen utilization potential in numerical terms, and cannot yet be considered significantly better than FP or CRF. Overall, reasonable allocation of the basal-to-topdressing nitrogen ratio can improve the synchronization between nitrogen supply and winter wheat growth demand, maintain post-anthesis canopy photosynthetic function, promote dry matter production and nitrogen translocation to grains, and coordinate the relationships among spike number, grains per spike, and grain weight, ultimately favoring high-yield formation.

4.2. The Effects of Nitrogen Fertilizer Management Strategies on the Distribution of Soil Nitrogen Profiles and Soil Enzyme Activity

The profile distribution of soil inorganic nitrogen reflects the combined effects of nitrogen fertilizer release, crop uptake, and downward migration. Owing to the high mobility of nitrate nitrogen, a mismatch between nitrogen application rate or timing and crop demand can readily result in soil nitrogen accumulation and leaching losses [2,4]. In the present study, soil ammonium nitrogen concentrations at maturity were generally low, ranging from 1.2 to 2.3 mg·kg−1, and decreased with soil depth. Ammonium nitrogen concentrations under CRF were significantly higher than those under the other treatments in all soil layers, reaching 2.13 mg·kg−1 in the surface layer, we speculate that controlled-release nitrogen fertilizer may have continued to release nitrogen during the late growth stage of wheat. Nitrate nitrogen concentrations also generally decreased with soil depth. Under CRF, the nitrate nitrogen concentration in the 0–20 cm layer was 23.77 mg·kg−1, significantly higher than those under OPT and FP; CRF also maintained significantly higher concentrations than the other treatments in the 20–40 cm layer. These results indicate that although controlled-release nitrogen fertilizer can prolong nitrogen supply, its release pattern may not be fully synchronized with the late-season nitrogen demand of wheat, resulting in the retention of some inorganic nitrogen in the soil [27].
In the 40–60 and 60–90 cm soil layers, nitrate nitrogen concentrations under all nitrogen-fertilized treatments remained higher than that under CK, although the differences among treatments became smaller, indicating a potential risk of nitrate migration into deeper soil layers under long-term nitrogen application. Under FP, the nitrate nitrogen concentration in the 60–90 cm layer was 9.75 mg·kg−1, lower than those under OPT and CRF. It should be noted that deep-soil nitrate accumulation is jointly determined by fertilizer application timing, soil water movement, root uptake, and previous nitrogen accumulation. Therefore, annual nitrogen leaching losses cannot be assessed solely from soil profile concentrations measured at a single time point [2,4]. Although OPT improved the synchronization between nitrogen supply and crop demand, a small amount of nitrate remained in the deeper soil layers, suggesting that its environmental effects require further evaluation through long-term field observations and nitrogen balance assessments.
Soil total nitrogen concentrations generally decreased after anthesis, with more pronounced changes in the 0–40 cm layers and relatively minor changes in the 40–60 cm layer. This suggests that nitrogen uptake by winter wheat after anthesis was mainly derived from the upper soil layers, where roots were more densely distributed. Under OPT, total nitrogen in the 0–20 cm soil layer decreased from 1.06 g·kg−1 at anthesis to 0.72 g·kg−1 at maturity, representing the largest reduction. This corresponded with the rapid plant nitrogen accumulation observed from 0 to 10 d after anthesis, indicating that a 1:1 ratio of basal to top-dressed nitrogen may enhance plant uptake of surface-soil nitrogen during early post-anthesis growth. Under FP, the surface-soil total nitrogen concentration remained at 0.92 g·kg−1 at maturity, representing a reduction of only 19.3%. This suggests that the higher proportion of top-dressed nitrogen provided a greater soil nitrogen supply, although some of the nitrogen was not fully utilized by the plants. Thus, soil total nitrogen depletion was synchronized to some extent with plant nitrogen accumulation. However, because total nitrogen includes a large proportion of organic nitrogen that is not readily available to crops in the short term, its variation can only serve as a supplementary indicator of soil nitrogen supply.
Soil enzyme activity is an important biological indicator of nutrient transformation and microbial metabolism. Urease directly participates in urea hydrolysis, whereas catalase reflects soil redox processes and microbial activity [28,29]. In this study, urease activity under all nitrogen-fertilized treatments was significantly higher than that under CK (p < 0.05). FP exhibited the highest urease activity, exceeding CK, OPT, and CRF by 64.35%, 23.63%, and 15.43%, respectively. This may be because the higher proportion of top-dressed nitrogen under FP increased urea substrate availability and induced urease activity. Catalase activity under FP, OPT, and CRF was 12.61%, 3.01%, and 0.58% higher than that under CK, respectively; however, no significant differences were observed among the nitrogen-fertilized treatments, indicating that catalase responded less strongly than urease to nitrogen fertilizer management. Overall, different nitrogen fertilizer management strategies affected the vertical distribution of soil nitrogen and soil enzyme activity by altering nitrogen release and transformation. OPT promoted nitrogen uptake from the surface soil, although deep-soil nitrate accumulation remains a concern. For CRF, the release rate should be further optimized to improve its synchronization with the nitrogen requirements of winter wheat.

4.3. Effects of Nitrogen Fertilizer Management Strategies on Soil Microbial Community Structure and Dominant Groups

Soil microorganisms respond to changes in the nutrient environment induced by nitrogen application [30], although the magnitude of their responses depends on the application rate, fertilization method, and experimental duration [31,32]. In this study, neither the Chao nor Shannon index of bacterial and fungal communities differed significantly among treatments (p > 0.05), indicating that, under an equal nitrogen application rate, changes in nitrogen fertilizer management did not significantly affect soil microbial richness or diversity. Thus, the microbial effects of different nitrogen management strategies were mainly reflected in community composition and the relative abundance of certain dominant taxa rather than overall diversity.
The dominant bacterial taxa included Vicinamibacterales, Vicinamibacteraceae, Bacillus, RB41, and Gemmatimonadaceae. Compared with CK, FP and OPT significantly reduced the relative abundances of Vicinamibacterales and Vicinamibacteraceae. The relative abundance of Bacillus was 31% higher under OPT than under FP. Some Bacillus strains can promote nutrient mobilisation and plant growth [33]. However, their specific functions were not examined in this study; therefore, the relationship between changes in Bacillus abundance and nutrient uptake by winter wheat requires further investigation.
The fungal community was dominated by Mortierella, Fusicolla, Pyrenochaetopsis, and Apodus. The relative abundance of Mortierella under CK, FP, OPT, and CRF was 35%, 22%, 25%, and 18%, respectively, indicating an overall decline following nitrogen application, with the lowest value under CRF. OPT also significantly reduced the relative abundance of Pyrenochaetopsis. Overall, nitrogen fertilizer management did not significantly alter the α-diversity of soil bacterial or fungal communities but affected the composition of certain dominant taxa. As microbial communities were assessed only at anthesis and their functions were not verified, these findings primarily describe microbial community responses to different nitrogen management strategies and do not support further causal inference.

4.4. Synergistic Responses of Winter Wheat Aboveground Physiological Characteristics and Soil Nitrogen Availability Under Different Nitrogen Fertilizer Management Schemes

Different fertilization strategies altered soil carbon and nitrogen availability, driving the differentiation of functional groups within bacterial and fungal communities and thereby affecting nitrate transformation and migration. In the CRF treatment, we speculate that the controlled-release nitrogen fertilizer may have continued to release nitrogen after anthesis, nitrate accumulation in the surface layer was the highest, which may inhibit nitrogen-transforming functional fungi such as Mortierella. Although the FP treatment received the largest topdressing nitrogen rate, its abundance of plant growth-promoting bacteria such as Bacillus was lower than that in OPT, which may directly or indirectly weaken microbially mediated nitrogen retention and phosphorus mobilization, resulting in the leaching of some nitrogen to deeper layers. In the OPT treatment, a balanced basal-to-topdressing ratio promoted the enrichment of beneficial bacteria such as Bacillus early after anthesis. We speculate that the potential mechanism is that these plant growth-promoting bacteria may enhance the nitrogen retention and phosphorus mobilization capacity of rhizosphere microorganisms, representing the microbiological mechanism by which OPT achieved relatively high nitrogen recovery efficiency while keeping deep nitrate residues at a moderate level.
Synchronisation between soil nitrogen supply and plant nitrogen uptake is essential for maintaining post-anthesis photosynthetic function and promoting grain formation in winter wheat. Appropriate nitrogen fertilizer management can coordinate soil nitrogen supply, plant nitrogen uptake, and nitrogen remobilisation from vegetative organs, thereby improving post-anthesis photosynthetic production and yield formation [34,35]. In this study, all nitrogen treatments significantly increased post-anthesis SPAD values, GLAI, net photosynthetic rate, and grain yield, indicating that improved soil nitrogen availability delayed leaf senescence and enhanced canopy photosynthetic capacity after anthesis. The nitrogen management strategies resulted in distinct soil–plant nitrogen responses. Under OPT, plant nitrogen accumulation increased rapidly from anthesis to 10 d after anthesis, while total nitrogen in the 0–20 cm soil layer declined from 1.06 g·kg−1 at anthesis to 0.72 g·kg−1 at maturity, indicating close synchronisation between surface-soil nitrogen depletion and plant uptake. The relatively balanced basal-to-topdressing ratio under OPT maintained a high post-anthesis GLAI and promoted nitrogen translocation to the grain, resulting in the highest grain yield (8871.69 kg·hm−2) and nitrogen recovery efficiency (74.82%). Under FP, total nitrogen in the surface soil remained at 0.92 g·kg−1 at maturity, accompanied by high urease activity, suggesting that the high proportion of top-dressed nitrogen enhanced soil nitrogen supply but that some nitrogen was not fully utilised by the plants. CRF produced the highest surface-soil nitrate content at maturity, suggesting a possible continued release of nitrogen during the late growth stage and a possible mismatch between nitrogen supply and crop demand.
Overall, under the conditions of this experiment, OPT effectively coordinated soil nitrogen supply, post-anthesis plant nitrogen uptake, leaf photosynthetic function, and grain nitrogen accumulation, demonstrating favourable potential for improving yield and nitrogen use. However, differences in yield and nitrogen use efficiency among OPT, FP, and CRF were not significant. Therefore, the apparent synergistic advantages of OPT require further validation through multi-year and multi-site experiments. In addition, the FP treatment received higher P and K inputs than the OPT and CRF treatments, simulating the actual fertilization practices of local farmers, whereas the OPT and CRF treatments had their P and K rates optimized based on the nutrient balance method, in order to investigate the effects of different fertilization management strategies under reduced P and K inputs. However, further work is still needed to thoroughly examine how variation in P and K inputs affects the differences between FP and the other treatments.

5. Conclusions

Different nitrogen fertilizer management strategies significantly affected post-anthesis physiological characteristics, nitrogen translocation, and soil nitrogen supply in winter wheat. Nitrogen application maintained post-anthesis leaf photosynthetic capacity, promoted dry matter accumulation and nitrogen translocation to grains, and thereby increased grain yield. Although differences in grain yield and nitrogen use efficiency among the nitrogen treatments were not statistically significant, the OPT treatment showed relatively better overall performance and exhibited a trend toward superiority in growth and physiological performance, as indicated by its grain yield of 8871.69 kg hm−2 and nitrogen recovery efficiency of 74.82%, which better coordinated post-anthesis photosynthetic production, nitrogen uptake and translocation, and soil nitrogen supply. Nitrogen management had little effect on soil microbial α-diversity, mainly altering the relative abundance of some dominant taxa. Overall, a nitrogen application rate of 225 kg hm−2 with a basal-to-topdressing ratio of 1:1 was a suitable nitrogen management strategy for achieving both high yield and efficient nitrogen use in winter wheat under the conditions of this experiment.

Author Contributions

M.D. and Y.W. contributed equally to this work and share first authorship. Conceptualization, M.D., Y.W. and Z.L.; methodology, M.D., Y.W., D.T., F.W. and Z.L.; software, X.Z.; validation, M.D., Y.W., H.L., T.Z. and W.W.; formal analysis, M.D., Y.W. and D.T.; investigation, M.D., Y.W., D.T., X.Z., H.L., T.Z. and W.W.; resources, H.G. and Z.L.; data curation, M.D., Y.W. and D.T.; writing—original draft preparation, M.D. and Y.W.; writing—review and editing, M.D., Y.W., D.T., H.G. and Z.L.; visualization, M.D., X.Z. and T.Z.; supervision, H.G. and Z.L.; project administration, H.G. and Z.L.; funding acquisition, H.G. and Z.L. All authors have read and agreed to the published version of the manuscript.

Funding

This research was supported by the National Natural Science Foundation of China (Grant No. 32472846), the Earmarked Fund for China Agriculture Research System (CARS-03), and the Smart Fertilization Project of the National Agricultural Science and Technology Project (20221805). Additional funding was provided by the projects “Mechanistic Study on the Influence of Residual Film from Controlled-Release Nitrogen Fertilizer on the Occurrence Characteristics of Soil Microplastics in Wheat–Maize Rotation Areas” and “Research and Evaluation of Soil Health and Soil Biodiversity of Cultivated Land in Dezhou City” (Grant No. YNXM202405).

Data Availability Statement

The original contributions presented in this study are included in the article. Further inquiries can be directed to the corresponding authors.

Acknowledgments

During the preparation of this manuscript, the authors used artificial intelligence tools Chatgpt (version 5.6) solely for language proofreading and polishing. All original data collection, analysis, and interpretation were conducted manually by the authors. The authors have reviewed and edited the final text and take full responsibility for the content of the publication.

Conflicts of Interest

The authors declare no conflicts of interest.

References

  1. Tilman, D.; Balzer, C.; Hill, J.; Befort, B.L. Global food demand and the sustainable intensification of agriculture. Proc. Natl. Acad. Sci. USA 2011, 108, 20260–20264. [Google Scholar] [CrossRef] [Scilit]
  2. Ju, X.T.; Xing, G.X.; Chen, X.P.; Zhang, S.L.; Zhang, L.J.; Liu, X.J.; Cui, Z.L.; Yin, B.; Christie, P.; Zhu, Z.L.; et al. Reducing environmental risk by improving N management in intensive Chinese agricultural systems. Proc. Natl. Acad. Sci. USA 2009, 106, 3041–3046. [Google Scholar] [CrossRef] [Scilit]
  3. Guo, J.H.; Liu, X.J.; Zhang, Y.; Shen, J.L.; Han, W.X.; Zhang, W.F.; Christie, P.; Goulding, K.W.; Vitousek, P.M.; Zhang, F.S. Significant acidification in major Chinese croplands. Science 2010, 327, 1008–1010. [Google Scholar] [CrossRef] [Scilit]
  4. Cui, Z.; Zhang, H.; Chen, X.; Zhang, C.; Ma, W.; Huang, C.; Zhang, W.; Mi, G.; Miao, Y.; Li, X.; et al. Pursuing sustainable productivity with millions of smallholder farmers. Nature 2018, 555, 363–366. [Google Scholar] [CrossRef] [Scilit]
  5. Chen, X.P.; Cui, Z.L.; Vitousek, P.M.; Cassman, K.G.; Matson, P.A.; Bai, J.S.; Meng, Q.F.; Hou, P.; Yue, S.C.; Römheld, V.; et al. Integrated soil-crop system management for food security. Proc. Natl. Acad. Sci. USA 2011, 108, 6399–6404. [Google Scholar] [CrossRef] [Scilit]
  6. Govil, S.; Van Duc Long, N.; Escribà-Gelonch, M.; Hessel, V. Controlled-release fertiliser: Recent developments and perspectives. Ind. Crops Prod. 2024, 219, 119160. [Google Scholar] [CrossRef] [Scilit]
  7. Vejan, P.; Khadiran, T.; Abdullah, R.; Ahmad, N. Controlled release fertilizer: A review on developments, applications and potential in agriculture. J. Control. Release 2021, 339, 321–334. [Google Scholar] [CrossRef] [Scilit]
  8. Carmo-Silva, E.; Andralojc, P.J.; Scales, J.C.; Driever, S.M.; Mead, A.; Lawson, T.; Raines, C.A.; Parry, M.A.J. Phenotyping of field-grown wheat in the UK highlights contribution of light response of photosynthesis and flag leaf longevity to grain yield. J. Exp. Bot. 2017, 68, 3473–3486. [Google Scholar] [CrossRef] [Scilit]
  9. Zhang, Z.; Zhang, Y.; Shi, Y.; Yu, Z. Optimized split nitrogen fertilizer increase photosynthesis, grain yield, nitrogen use efficiency and water use efficiency under water-saving irrigation. Sci. Rep. 2020, 10, 20310. [Google Scholar] [CrossRef] [Scilit]
  10. Kichey, T.; Hirel, B.; Heumez, E.; Dubois, F.; Le Gouis, J. In winter wheat (Triticum aestivum L.), post-anthesis nitrogen uptake and remobilisation to the grain correlates with agronomic traits and nitrogen physiological markers. Field Crops Res. 2007, 102, 22–32. [Google Scholar] [CrossRef] [Scilit]
  11. Mălinaş, A.; Vidican, R.; Rotar, I.; Mălinaş, C.; Moldovan, C.M.; Proorocu, M. Current Status and Future Prospective for Nitrogen Use Efficiency in Wheat (Triticum aestivum L.). Plants 2022, 11, 217. [Google Scholar] [CrossRef] [Scilit]
  12. Huang, T.; Ju, X.; Yang, H. Nitrate leaching in a winter wheat-summer maize rotation on a calcareous soil as affected by nitrogen and straw management. Sci. Rep. 2017, 7, 42247. [Google Scholar] [CrossRef] [Scilit]
  13. Geisseler, D.; Scow, K.M. Long-term effects of mineral fertilizers on soil microorganisms—A review. Soil Biol. Biochem. 2014, 75, 54–63. [Google Scholar] [CrossRef] [Scilit]
  14. Fierer, N.; Lauber, C.L.; Ramirez, K.S.; Zaneveld, J.; Bradford, M.A.; Knight, R. Comparative metagenomic, phylogenetic and physiological analyses of soil microbial communities across nitrogen gradients. ISME J. 2012, 6, 1007–1017. [Google Scholar] [CrossRef] [Scilit]
  15. Zhou, X.; Li, H.; Gao, H.; Du, M.; Wang, Y.; Zhao, T.; Wang, W.; Li, Z. Effects of One-Time Long-Term Application of Organic–Inorganic Compound Fertilizer on Wheat Photosynthetic Characteristics, Soil Properties and Grain Yield. Agronomy 2026, 16, 1250. [Google Scholar] [CrossRef] [Scilit]
  16. Bryson, R.J.; Paveley, N.D.; Clark, W.S.; Sylvester-Bradley, R.; Scott, R.K. Use of in-field measurements of green leaf area and incident radiation to estimate the effects of yellow rust epidemics on the yield of winter wheat. Eur. J. Agron. 1997, 7, 53–62. [Google Scholar] [CrossRef] [Scilit]
  17. Perez-Mateos, M.; Gonzalez-Carcedo, S. Assay of urease activity in soil columns. Soil Biol. Biochem. 1988, 20, 567–572. [Google Scholar] [CrossRef] [Scilit]
  18. Beers, R.F.; Sizer, I.W. A spectrophotometric method for measuring the breakdown of hydrogen peroxide by catalase. J. Biol. Chem. 1952, 195, 133–140. [Google Scholar] [CrossRef] [Scilit]
  19. Trasar-Cepeda, C.; Camina, F.; Leiros, M.C.; Gil-Sotres, F. An improved method to measure catalase activity in soils. Soil Biol. Biochem. 1999, 31, 483–485. [Google Scholar] [CrossRef] [Scilit]
  20. Bao, S.D. Soil Agrochemical Analysis, 3rd ed.; China Agriculture Press: Beijing, China, 2005. [Google Scholar]
  21. Acreche, M.M.; Briceño-Félix, G.; Martín Sánchez, J.A.; Slafer, G.A. Radiation interception and use efficiency as affected by breeding in Mediterranean wheat. Field Crops Res. 2009, 110, 91–97. [Google Scholar] [CrossRef] [Scilit]
  22. Cai, R.-g.; Zhang, M.; Yin, Y.-p.; Wang, P.; Zhang, T.-b.; Gu, F.; Dai, Z.-m.; Liang, T.-b.; Wu, Y.-h.; Wang, Z.-l. Photosynthetic Characteristics and Antioxidative Metabolism of Flag Leaves in Responses to Nitrogen Application During Grain Filling of Field-Grown Wheat. Agric. Sci. China 2008, 7, 157–167. [Google Scholar] [CrossRef] [Scilit]
  23. Li, C.; Shi, Y.; Yu, Z.; Zhang, Y.; Zhang, Z. Optimizing nitrogen application strategies can improve grain yield by increasing dry matter translocation, promoting grain filling, and improving harvest indices. Front. Plant Sci. 2025, 16, 1565446. [Google Scholar] [CrossRef] [Scilit]
  24. Li, G.; Ren, X.; Pang, S.; Feng, C.; Niu, Y.; Qu, Y.; Liu, C.; Lin, X.; Wang, D. Nitrogen redistribution during the grain-filling stage and its correlation with senescence and TaATG8 expression in leaves of winter wheat. J. Integr. Agric. 2026, 25, 1433–1442. [Google Scholar] [CrossRef] [Scilit]
  25. Arduini, I.; Masoni, A.; Ercoli, L.; Mariotti, M. Grain yield, and dry matter and nitrogen accumulation and remobilization in durum wheat as affected by variety and seeding rate. Eur. J. Agron. 2006, 25, 309–318. [Google Scholar] [CrossRef] [Scilit]
  26. Guo, A.; Ren, H.; Yang, H.; Liang, Z.; Li, Y.; Dou, T.; Ma, Y.; Shen, H. Physiological and Molecular Mechanisms of Nitrogen Regulation on Grain Quality in Cereal Crops at Later Stages. Int. J. Mol. Sci. 2026, 27, 2125. [Google Scholar] [CrossRef] [Scilit]
  27. Shen, Y.; Wang, B.; Zhu, S.; Xie, W.; Wang, S.; Zhao, X. Single application of a new polymer-coated urea improves yield while mitigates environmental issues associated with winter wheat grown in rice paddy soil. Field Crops Res. 2022, 285, 108592. [Google Scholar] [CrossRef] [Scilit]
  28. Burns, R.G.; DeForest, J.L.; Marxsen, J.; Sinsabaugh, R.L.; Stromberger, M.E.; Wallenstein, M.D.; Weintraub, M.N.; Zoppini, A. Soil enzymes in a changing environment: Current knowledge and future directions. Soil Biol. Biochem. 2013, 58, 216–234. [Google Scholar] [CrossRef] [Scilit]
  29. Nannipieri, P.; Giagnoni, L.; Renella, G.; Puglisi, E.; Ceccanti, B.; Masciandaro, G.; Fornasier, F.; Moscatelli, M.C.; Marinari, S. Soil enzymology: Classical and molecular approaches. Biol. Fertil. Soils 2012, 48, 743–762. [Google Scholar] [CrossRef] [Scilit]
  30. Shi, J.; Lu, Z.; Lu, T.; Luan, S.; Yang, Y.; Wu, Z.; Wang, Y.; Yang, J.; Han, X. Long-Term Differential Fertilization Strategies Enhance Soil Quality and Microbial Metabolic Functions: Evidence from a 45-Year Field Experiment. Agriculture 2026, 16, 691. [Google Scholar] [CrossRef] [Scilit]
  31. Wang, C.; Liu, D.; Bai, E. Decreasing soil microbial diversity is associated with decreasing microbial biomass under nitrogen addition. Soil Biol. Biochem. 2018, 120, 126–133. [Google Scholar] [CrossRef] [Scilit]
  32. Zhou, Z.; Wang, C.; Zheng, M.; Jiang, L.; Luo, Y. Patterns and mechanisms of responses by soil microbial communities to nitrogen addition. Soil Biol. Biochem. 2017, 115, 433–441. [Google Scholar] [CrossRef] [Scilit]
  33. Radhakrishnan, R.; Hashem, A.; Abd Allah, E.F. Bacillus: A Biological Tool for Crop Improvement through Bio-Molecular Changes in Adverse Environments. Front. Physiol. 2017, 8, 667. [Google Scholar] [CrossRef] [Scilit]
  34. Barraclough, P.B.; Howarth, J.R.; Jones, J.; Lopez-Bellido, R.; Parmar, S.; Shepherd, C.E.; Hawkesford, M.J. Nitrogen efficiency of wheat: Genotypic and environmental variation and prospects for improvement. Eur. J. Agron. 2010, 33, 1–11. [Google Scholar] [CrossRef] [Scilit]
  35. Hawkesford, M.J. Reducing the reliance on nitrogen fertilizer for wheat production. J. Cereal Sci. 2014, 59, 276–283. [Google Scholar] [CrossRef] [Scilit]
Table 1. Fertilizer input for different treatments.
TreatmentTotal N
(Base/Topdressing)
(kg·hm−2)
P2O5
(kg·hm−2)
K2O
(kg·hm−2)
CK010575
FP75/150112.5112.5
OPT112.5/112.510575
CRF225/010575
Note: In the FP treatment, the application rates of phosphorus and potassium were higher than in the other treatments, with the aim of simulating the actual fertilization practices of local farmers. In the OPT and CRF treatments, phosphorus and potassium application rates were optimised using the nutrient balance method, in order to investigate the effects of different fertilization management regimes in a context of reduced phosphorus and potassium application.
Disclaimer/Publisher’s Note: The statements, opinions and data contained in all publications are solely those of the individual author(s) and contributor(s) and not of MDPI and/or the editor(s). MDPI and/or the editor(s) disclaim responsibility for any injury to people or property resulting from any ideas, methods, instructions or products referred to in the content.