Article

Drip-Fed CO2 Acidifies the Rhizosphere to Liberate Nutrients and Boost Cotton Yield

1
Agriculture Department, Shihezi University, Shihezi 832003, China
2
The Key Laboratory of Oasis Eco-Agriculture, Xinjiang Production and Construction Group, Shihezi University, Shihezi 832003, China
*
Author to whom correspondence should be addressed.
Agriculture 2026, 16(2), 238; https://doi.org/10.3390/agriculture16020238
Submission received: 9 December 2025 / Revised: 14 January 2026 / Accepted: 15 January 2026 / Published: 17 January 2026
(This article belongs to the Section Agricultural Soils)

Abstract

Recycling industrial CO2 into agricultural systems offers a dual-purpose strategy for achieving carbon neutrality and enhancing sustainable crop production. Although elevated CO2 is known to influence plant growth, the directed delivery of industrially sourced CO2 via drip irrigation to modulate rhizosphere processes in arid soils remains underexplored. We conducted a two-year field experiment in a Xinjiang cotton field to evaluate the effects of five concentrations of industrial CO2 solution (0.00–0.16 kg·m−3) on soil properties, nutrient dynamics, and crop performance. The optimal CO2 treatment (0.08 kg·m−3) significantly reduced soil pH by up to 0.3 units and electrical conductivity by up to 27.9%, while enhancing the availability of ammonium-N (51.1%), available P (8.1%), and available K (32.65%). These improved soil conditions subsequently enhanced plant N, P, and K accumulation (56.2%, 41.9%, and 53.2%, respectively), total biomass (31.8%), and seed cotton yield (5.76–6.06%). Our findings demonstrate that CO2-enriched irrigation enhances the rhizosphere microenvironment and nutrient availability, providing a novel pathway for carbon recycling and high-efficiency cotton production in arid regions.

1. Introduction

Industrial carbon dioxide (CO2) emissions represent a major contributor of global greenhouse gases, with direct energy combustion accounting for approximately 74% of the sector’s total output. Confronted with stringent climate mitigation targets, the strategic recycling of industrial CO2 into valuable resources has emerged as a critical pathway towards achieving carbon neutrality [1,2]. Beyond geological sequestration, the channeling of industrially captured CO2 into agricultural systems presents a promising alternative for carbon utilization. This approach not only repurposes an industrial waste stream but also enhances soil fertility by modulating rhizosphere chemistry, particularly in arid and alkaline soils where nutrient availability is a major constraint. When delivered via drip irrigation, dissolved CO2 induces the formation of carbonic acid in the rhizosphere, facilitating targeted soil acidification. This process leverages the fundamental reaction of CO2 with water to generate H+ ions, which can enhance the availability of essential nutrients. Consequently, this approach not only transforms an industrial waste product into an agricultural resource but also establishes a tangible and synergistic pathway for industry-to-agriculture carbon recycling, simultaneously addressing emission reduction and soil fertility improvement in arid regions.
In arid and salt-affected croplands, soil pH often exceeds 8.5. The abundance of carbonates and soluble Ca2+ and Mg2+ leads to the precipitation of phosphate and K+ into sparingly soluble Ca phosphate minerals (e.g., apatite), while potassium is primarily fixed within the crystal lattice of K-bearing silicate minerals such as K-feldspar (KAlSi3O8). This process strongly immobilizes phosphorus, potassium, and essential micronutrients, posing a major constraint to crop productivity. To address this, CO2-induced acidification via drip irrigation offers a precise and controllable remedial strategy.
The underlying mechanism begins when CO2 dissolves in soil moisture to form carbonic acid (H2CO3), which dissociates to release H+ ions. These protons first react with carbonate buffers: CaCO3 + H+ → Ca2+ + HCO3. The extent and kinetics of rhizosphere acidification are fundamentally constrained by the soil’s carbonate-governed buffering capacity. Where carbonate levels are moderate, sustained H+ release from carbonic acid can overcome local buffering, inducing a pronounced pH depression that frequently extends below neutrality (pH < 7.0). This acidity disrupts the chemical fixation of phosphorus and potassium. Subsequent proton-induced exchange promotes the desorption of Ca2+ and Mg2+ from mineral surfaces, such as K-feldspar (KAlSi3O8) and apatite (Ca5(PO4)3OH), thereby releasing K+ and H2PO4- into the soil solution. Consequently, exchangeable potassium and available phosphorus can increase by 26.8–72.3% and 8.1–34.4%, respectively [3,4].
Concurrently, elevated CO2 levels stimulate urease activity and accelerate urea hydrolysis, raising ammonium nitrogen (NH4+-N) by approximately 51% [5]. In contrast, nitrification is partially suppressed, leading to a 12.3–20.1% decline in nitrate nitrogen (NO3--N) and consequently reducing nitrogen leaching losses. However, a critical application threshold exists. When CO2 exceeds approximately 0.12 kg·m−3, the accumulated HCO3- can promote the secondary precipitation of CaCO3, potentially re-immobilizing phosphorus and potassium [6,7,8]. This non-linear response underscores the importance of precise dosage control.
Beyond its direct soil chemical effects, elevated CO2 can significantly influence plant nutrient acquisition and accumulation. Meta-analyses of free-air CO2 enrichment (FACE) studies suggest that elevated atmospheric CO2 levels can enhance whole-plant nutrient uptake, a phenomenon often attributed to a “carbon–nutrient” coupling mechanism [9]. This response is frequently facilitated by increased carbon allocation belowground, which can stimulate microbial activity and enhance nutrient mineralization in the rhizosphere—a process known as the rhizosphere priming effect [10]. For instance, compensatory growth under elevated CO2 has been observed even in the absence of significant changes in leaf-level photosynthetic rates, indicating that sink strength and nutrient accumulation can become the primary drivers of plant response [11,12]. However, it is critical to distinguish these observations from the context of the present study. The effects documented in FACE systems are primarily driven by enhanced photosynthesis and carbon assimilation from the atmosphere, which can differ fundamentally from the effects induced by the direct root zone application of CO2 via irrigation, where soil chemical changes and localized microbial interactions are likely the dominant mechanisms.
Despite the recognized potential of CO2 to modify soil and plant processes, current research remains largely confined to controlled environments or atmospheric enrichment studies. A critical knowledge gap exists regarding the systematic effects of field-scale, drip-applied industrial CO2 solutions on soil restructuring, nutrient accumulation dynamics, and ultimate yield formation in saline-alkaline cotton systems. To address this gap, we conducted a comprehensive field plot experiment in a Xinjiang loam cotton field. This study was designed to quantify the impacts of different concentrations of industrially sourced CO2, delivered via drip irrigation, on key soil physicochemical properties, including pH, electrical conductivity, and the availability of nitrogen, phosphorus, and potassium across soil profiles; to assess the subsequent effects on cotton nutrient uptake and partitioning (N, P, and K accumulation in different organs); and to determine the optimal CO2 concentration for maximizing seed cotton yield. Our study provides a comprehensive field-scale evaluation of industrial CO2 fertigation, establishing a mechanistic understanding and identifying the optimal application parameters to maximize cotton productivity in arid, saline-alkaline soils. We aimed to quantify the influence of graded concentrations of drip-delivered industrial CO2 on key soil properties (pH, electrical conductivity, and profile-wise availability of N, P, and K); to assess the downstream effects on cotton nutrient uptake and partitioning among organs; and to identify the CO2 concentration that optimizes seed cotton yield. Through a structured field plot experiment, this study delivers a comprehensive field-scale evaluation of industrial CO2 fertigation, establishes a process-based understanding of its benefits in saline-alkaline environments, and defines the application parameters that maximize cotton productivity under arid, saline-alkaline conditions. These insights offer a scientifically grounded pathway for deploying CO2 as an agronomic resource in challenging agroecosystems.

2. Materials and Methods

2.1. Site Description

The field experiment was conducted at the Xinjiang Tianye Agricultural Research Institute in Shi he zi, Xinjiang, China (44°21′ N, 86°01′ E). The region is characterized by an arid to semi-arid climate, the mean annual precipitation ranging from 125.0 to 207.7 mm, a frost-free period of 168–171 days, sunshine duration of 2300–2700 h, and an accumulated temperature (≥10 °C) between 3570 and 3729 °C. The soil texture is classified as loam, with soil ammonium nitrogen of 9.98–10.21 mg·kg−1, available phosphorus of 10.52–10.82 mg·kg−1, available potassium of 280.61–300.46 mg·kg−1, and soil organic carbon of 12.55–14.41 g·kg−1.

2.2. Experimental Design and CO2 Application

The cotton variety H219 (Xinjiang Bamian Seed Industry Co., Ltd., Urumqi, China), was selected for this study. It exhibits a compact plant architecture, thick stems, low trichome density, medium-sized leaves, and green coloration. This cultivar was chosen based on its dominant adoption in Xinjiang, proven high-yield potential under local field conditions, and documented tolerance to moderate saline-alkaline stress, making it a representative model for regional production systems. During the growing season, irrigation was supplied at 6600–6900 m3·ha−1, with fertilization comprising urea (≥46% N) at 427.5 kg·ha−1 and compound fertilizer (N–P2O5–K2O = 6-12-42, total nutrients ≥60%) at 1140 kg·ha−1. Fertilization was carried out after the termination of CO2 drip application. Five CO2-enriched irrigation water concentrations were applied: C0 (0.00 kg·m−3), C1 (0.04 kg·m−3), C2 (0.08 kg·m−3), C3 (0.12 kg·m−3), and C4 (0.16 kg·m−3). The range included a zero-addition control (C0), suboptimal doses, a targeted optimum based on preliminary data, and a higher concentration where inhibitory effects on growth or nutrient uptake were anticipated. This graded design allowed us to identify not only the optimal application rate but also the threshold beyond which benefits may diminish. The experiment was arranged in a randomized complete block design with three replications per treatment, resulting in 15 experimental plots. The data points displayed in the figures are not individual replicate measurements but rather mean values obtained from treatment × condition combinations.
The nominal concentration of the aqueous CO2 solution applied via drip irrigation was determined through a mass balance calculation:
C = M_(CO2)/V_(water)
where C denotes the target concentration of dissolved CO2 (kg·m−3), M_(CO2) is the mass of CO2 gas delivered per irrigation cycle, measured gravimetrically by weighing the supply cylinder before and after each application (±0.1 kg precision), and V_(water) is the total volume of irrigation water, monitored with an in-line flow meter. The concentration error was controlled within 8%. The operational parameters were as follows: water flow rate 5.00 m3·h−1, water pressure 0.100 MPa, and gas pressure 0.085 MPa, under which CO2 dissolution in the irrigation water remained stable. The actual field concentration was monitored using a gravimetric method.
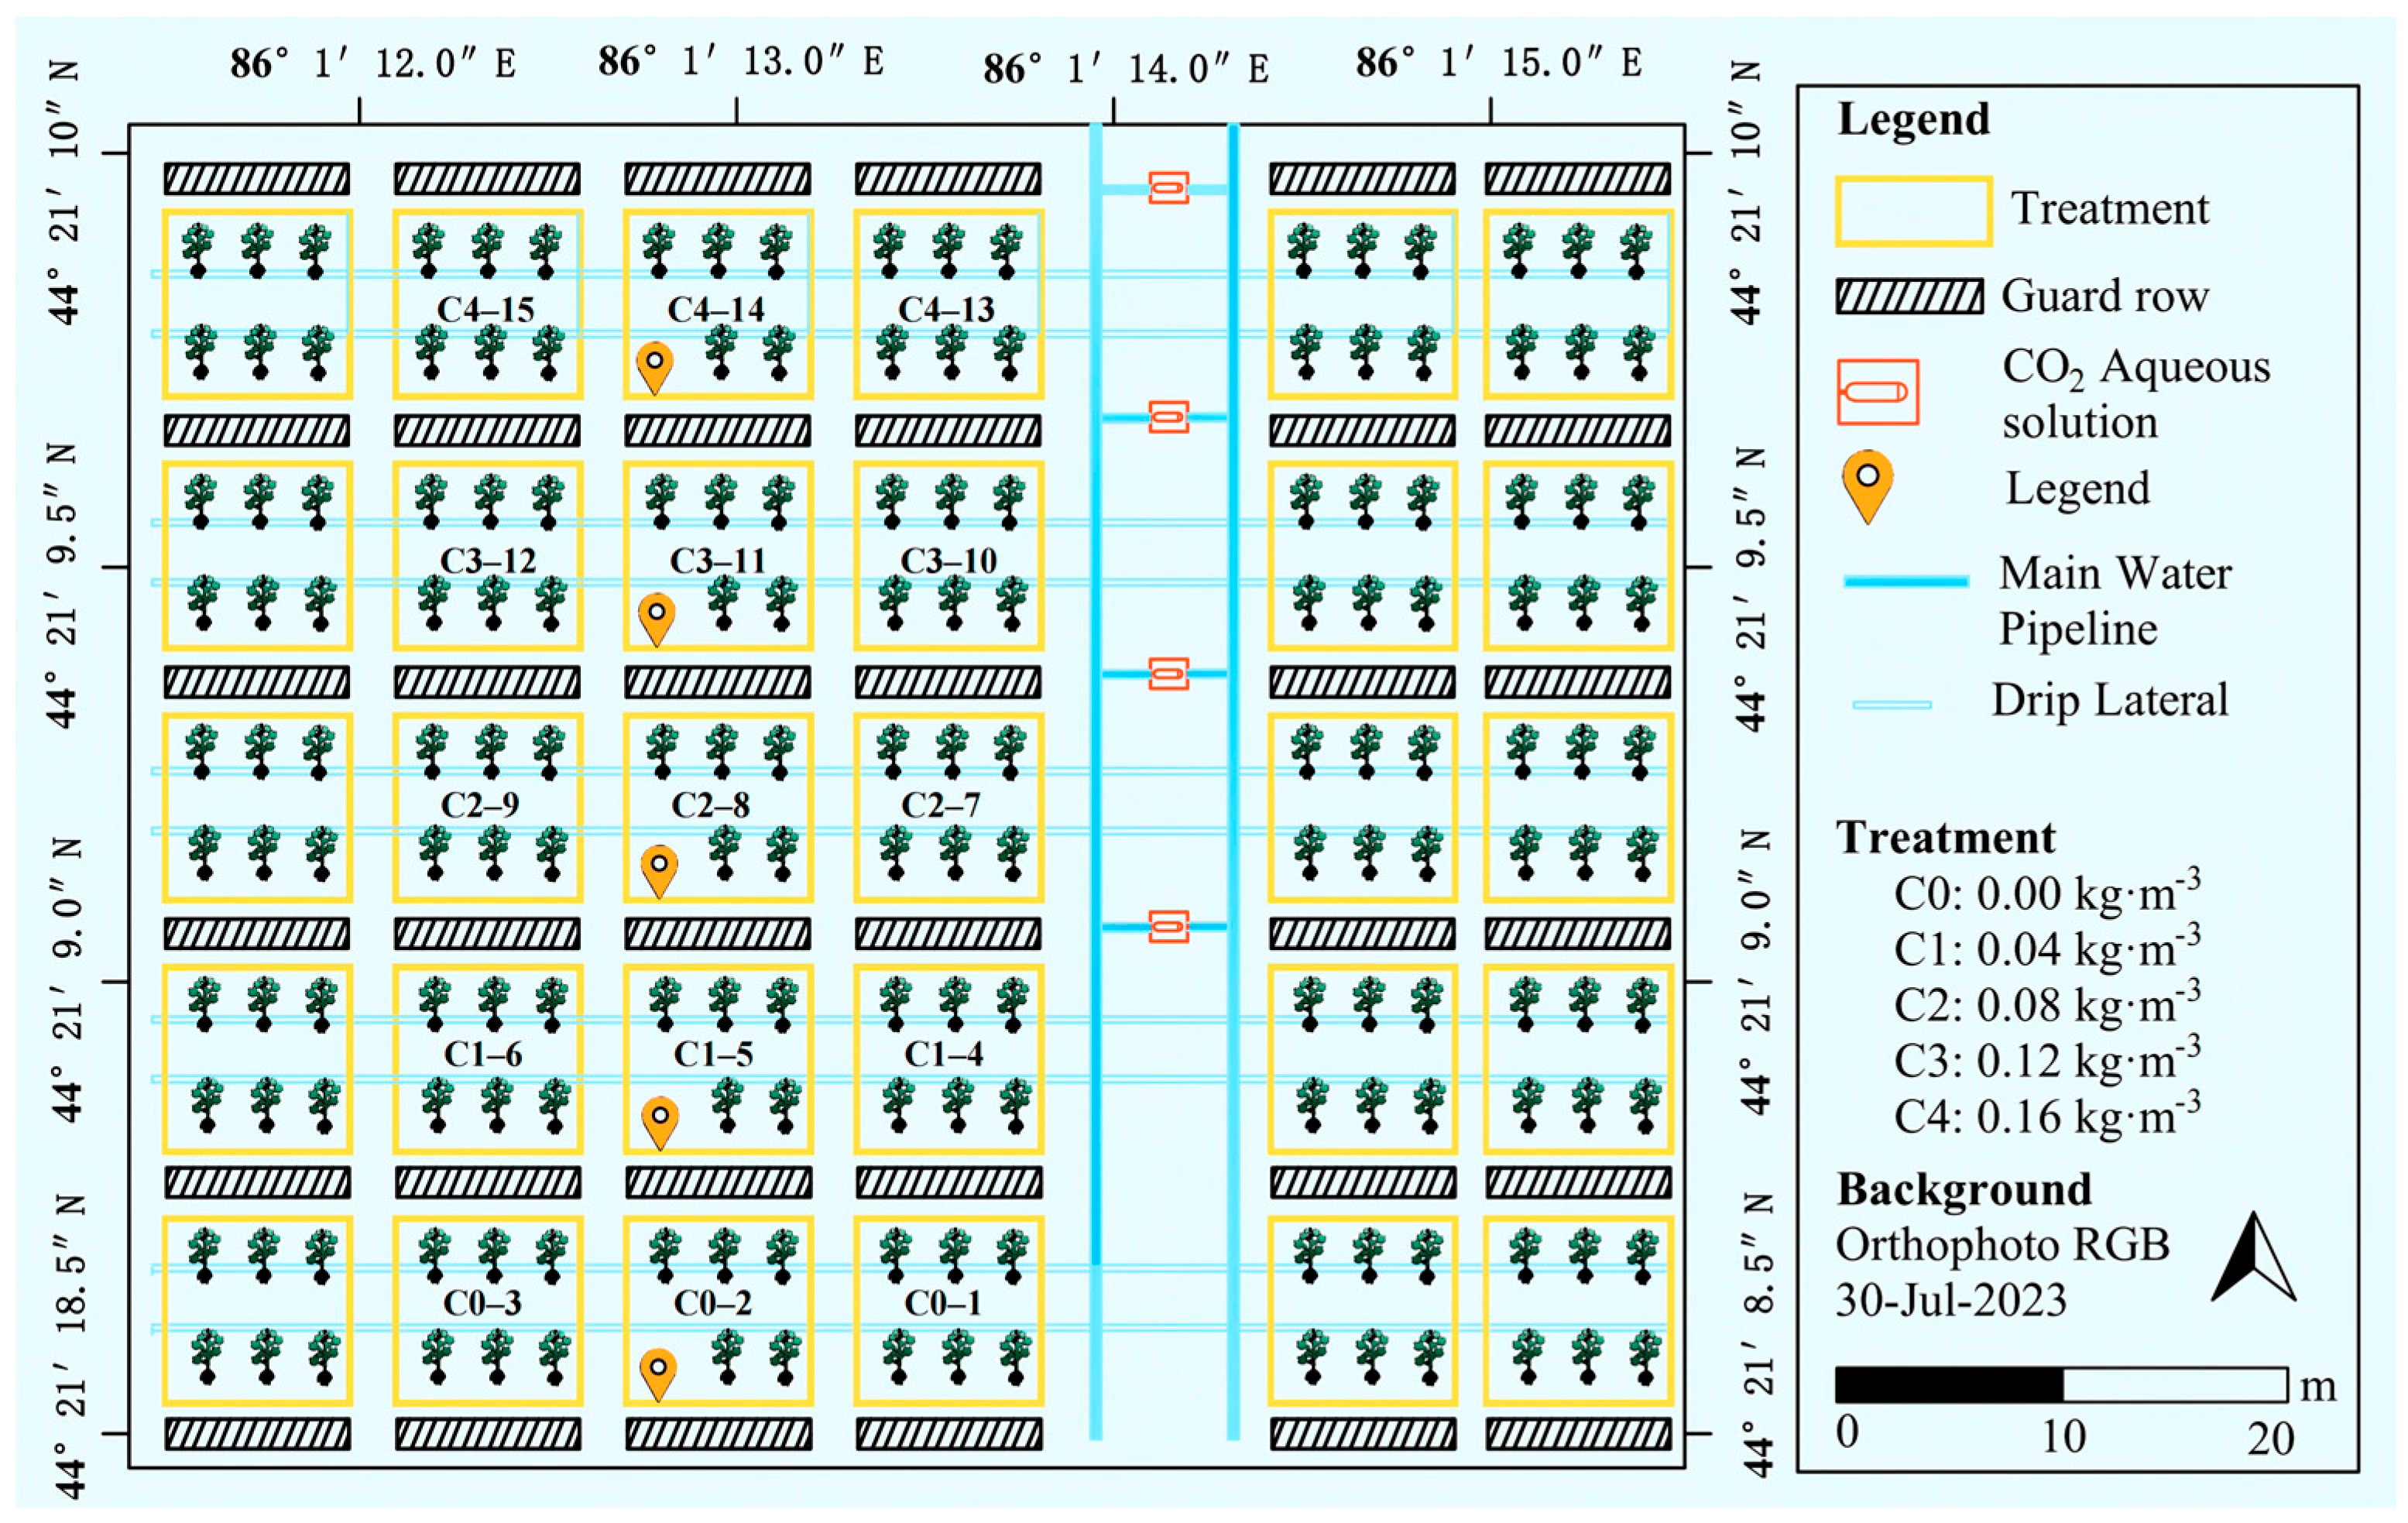
Cotton was planted following a “one-mulch, three-drip-lines, six-rows” pattern, with a row spacing configuration (cm) of 10 cm + 66 cm + 10 cm, plant spacing of 10.0 cm, mulch width of 2.05 m, and mulch spacing of 0.40 m. Each plot measured 9.50 m in length and 9.20 m in width, with a 3.00 m interval between plots and a 3.00 m protective row. CO2 drip application commenced one week before the peak squaring stage and was repeated every 7 days, for a total of 10 applications (Figure 1).
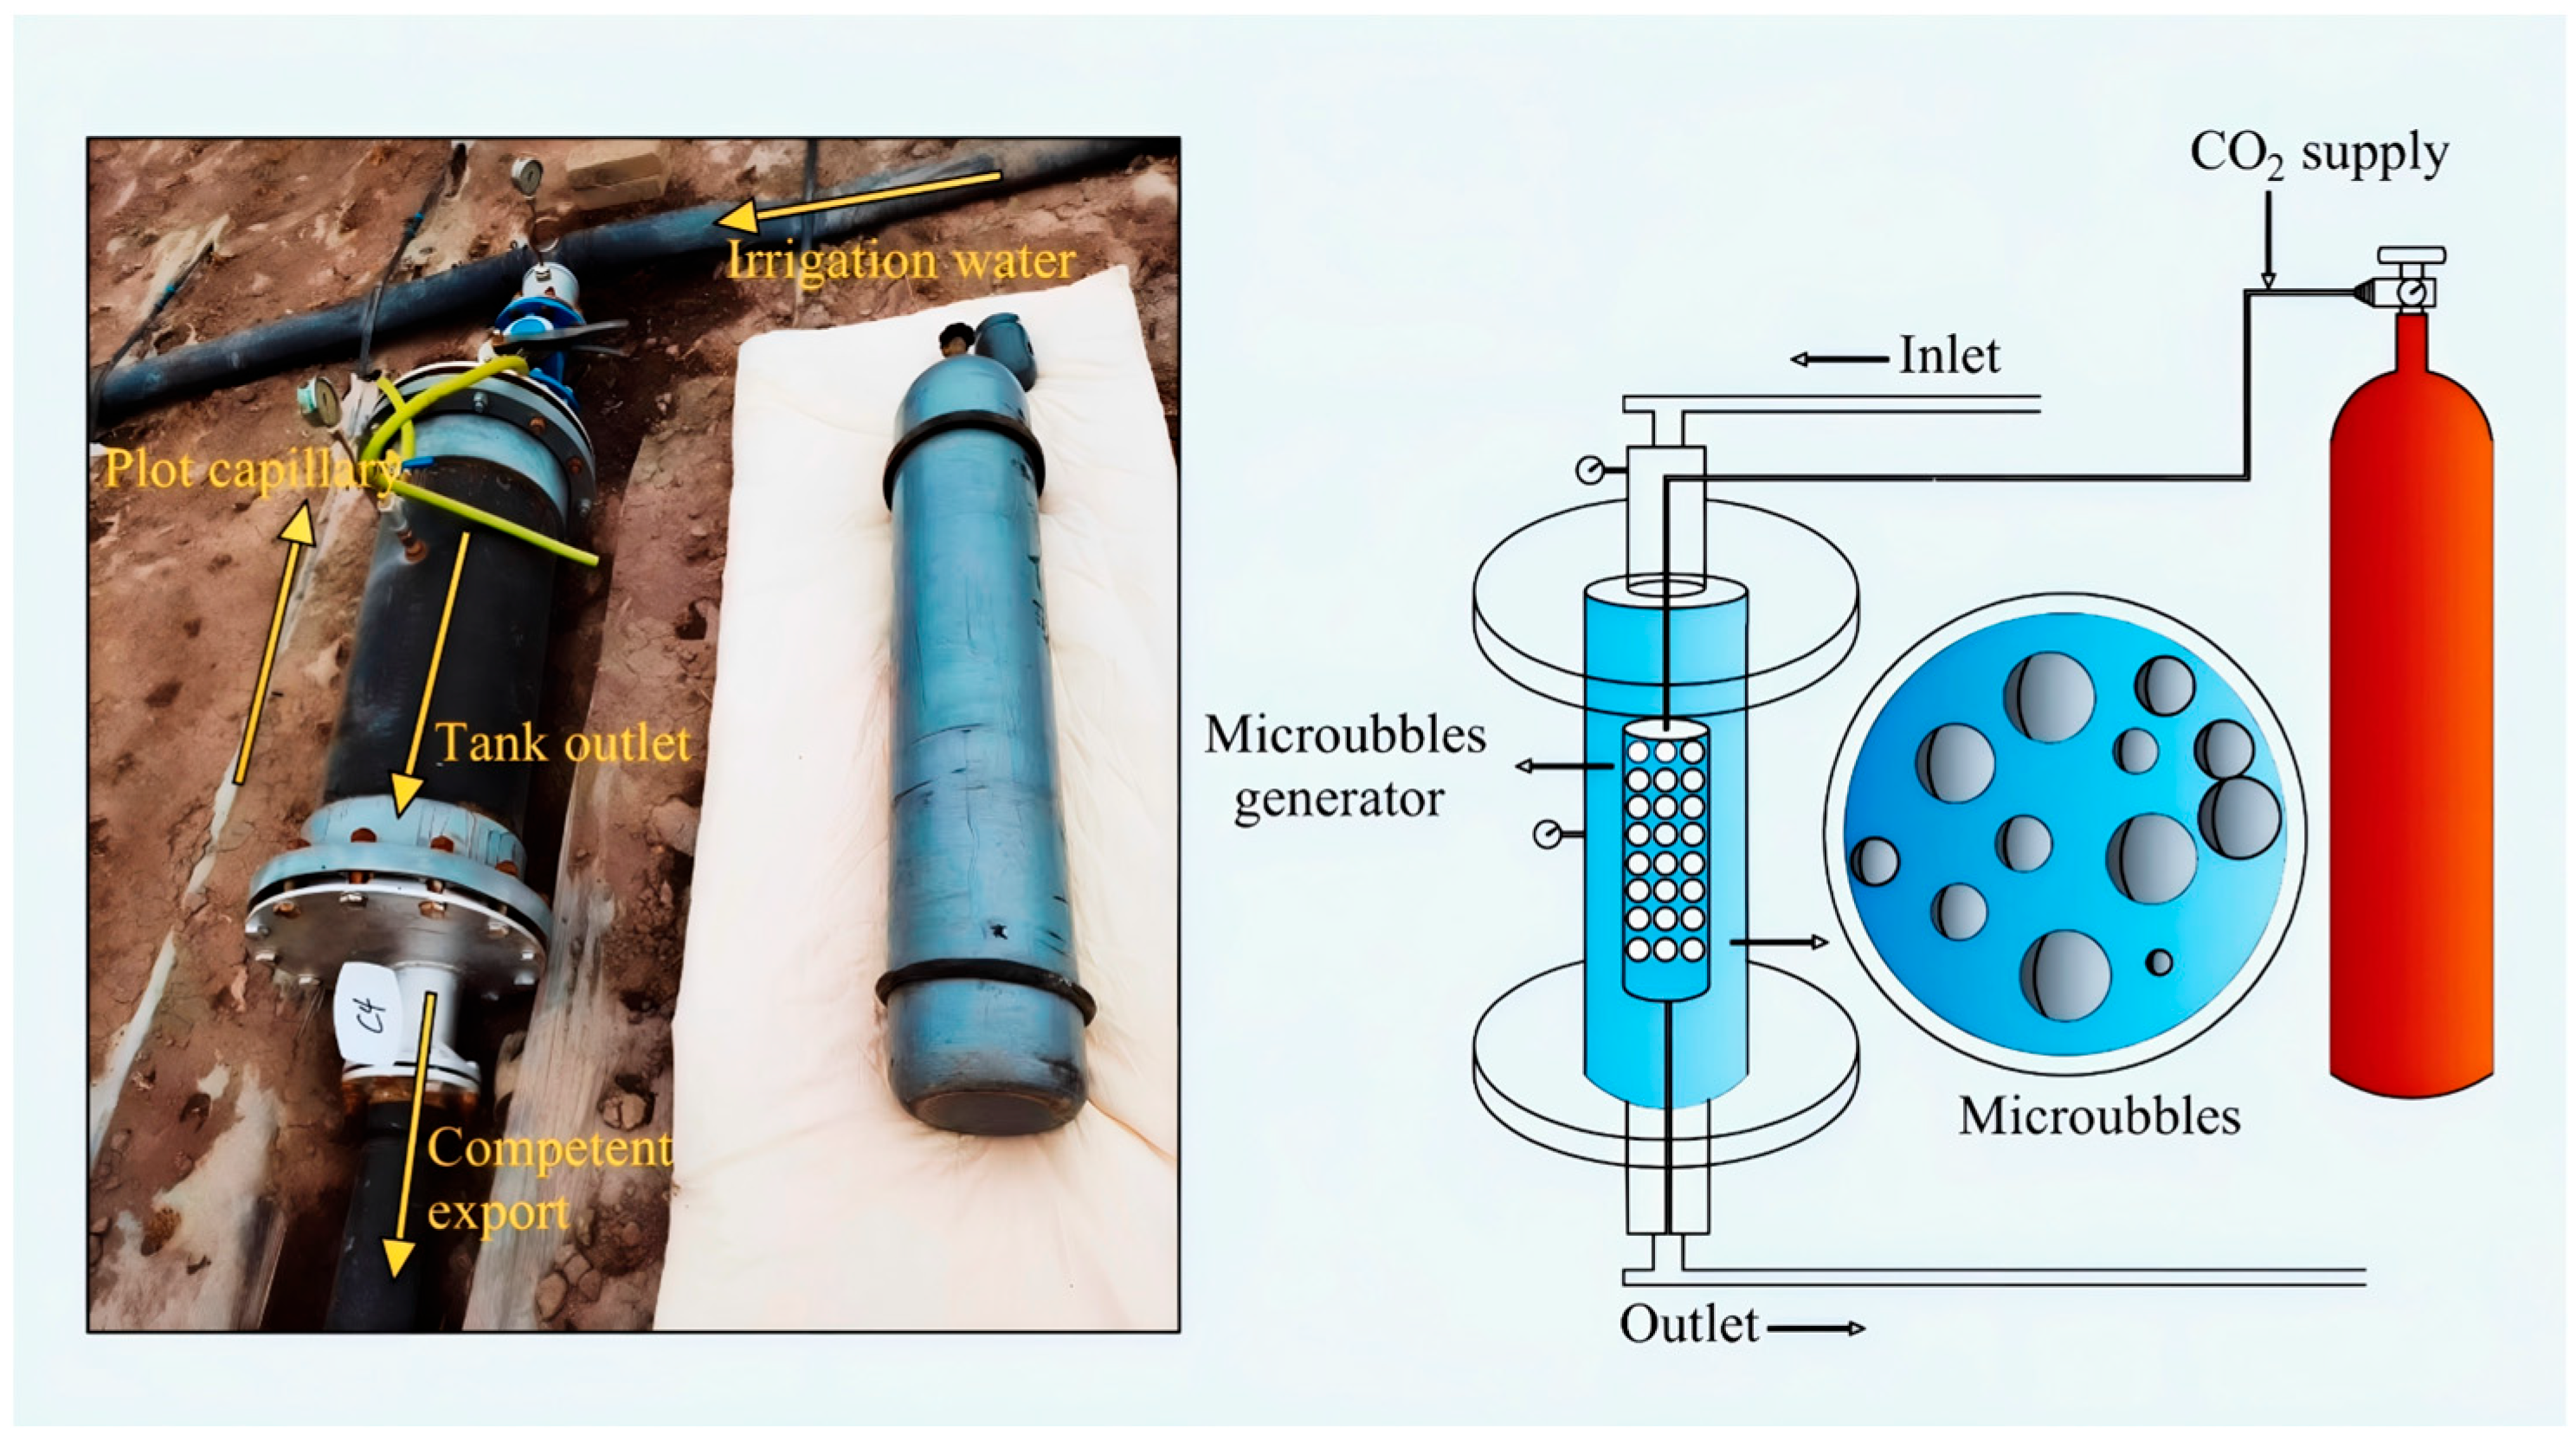
The CO2 delivery system featured a specially designed head-unit CO2 dissolution reactor that generated carbonic acid-enriched irrigation water (Figure 2). The system utilized a precisely maintained pressure gradient between the CO2 gas supply and the irrigation water flow. As irrigation water passed through the main reaction chamber at a controlled velocity (5.00 m3·h−1), the resulting pressure differential enabled CO2 to be uniformly infused into the water stream through a sintered stainless steel aerator, achieving precise control of the dissolved CO2 concentration.
Dissolution efficiency was evaluated by monitoring pH dynamics at key points within the drip irrigation system: source water, reactor outlet, main distribution lines, and individual plot laterals. Successful CO2 enrichment was confirmed by a consistent decrease in pH across all monitored locations. The pH decreases stepwise along the drip irrigation flow path: irrigation water enters the system at 7.66, drops to 6.33 at the tank outlet, declines further to 5.96 at the competent export point, and reaches its lowest value of 5.69 in the plot capillary line. This progressive acidification indicates a continuous release of dissolved acids within the irrigation network.

2.3. Measurements and Analysis

2.3.1. Soil and Plant Sampling and Analysis

Soil samples were collected at four critical growth stages (representing the full squaring stage, full blooming stage, full boll-opening stage, full maturity stage) using a stratified random sampling approach. A tube auger was employed to collect samples from three depth intervals (0–20 cm, 20–40 cm, and 40–60 cm) following an “S” pattern across each plot. Samples from different depths were individually packaged in sealed bags with complete metadata.
Soil pH and electrical conductivity (EC) were measured potentiometrically in 1:5 soil-to-water extracts [13]. Available phosphorus (AP) was determined by 0.5 mol·L−1 sodium bicarbonate extraction followed by molybdenum blue spectrophotometric detection [14]. Soil ammonium (NH4+-N) and nitrate (NO3-N) were extracted with 2 mol·L−1 and 1 mol· L−1 potassium chloride solutions, respectively, and quantified using the indophenol blue colorimetric method and ultraviolet spectrophotometry [15]. Plant tissue nitrogen content was determined by the Kjeldahl digestion method, phosphorus via vanadium molybdenum yellow spectrophotometry, and potassium through flame photometric detection [16,17,18]. Nutrient accumulation per plant (mg·plant−1) was calculated as the product of dry biomass (g·plant−1) and nutrient concentration (mg·g−1) [19]. Seed cotton yield (kg·ha−1) was determined in representative sample plots by first counting the number of mature bolls per hectare. A subsample of 100 bolls was then sun-dried and weighed to determine the mean boll weight (g). The seed cotton yield was calculated by multiplying the total number of bolls per hectare by the mean boll weight and a factor of 0.9 [20].

2.3.2. Statistical Analysis

Data were processed and analyzed using R (v4.3.1; R Foundation for Statistical Computing, Vienna, Austria). Microsoft Excel 2021 (Microsoft Corporation, Redmond, WA, USA). The assumptions of normality and homogeneity of variance were verified using the Shapiro–Wilk test and Levene’s test, respectively, before applying one-way ANOVA. Significant treatment effects were further examined with Duncan’s multiple range test (α = 0.05). To explore the multivariate structure of the dataset and identify key yield-related drivers, principal component analysis (PCA) was performed on standardized soil and plant variables. Relationships among measured parameters were further examined using Pearson correlation analysis. Figures were generated in OriginPro 2022 (OriginLab Corporation, Northampton, MA, USA) [21].

3. Results

3.1. Effects of Drip-Applied CO2-Enriched Irrigation Water on Soil pH and Electrical Conductivity (EC)

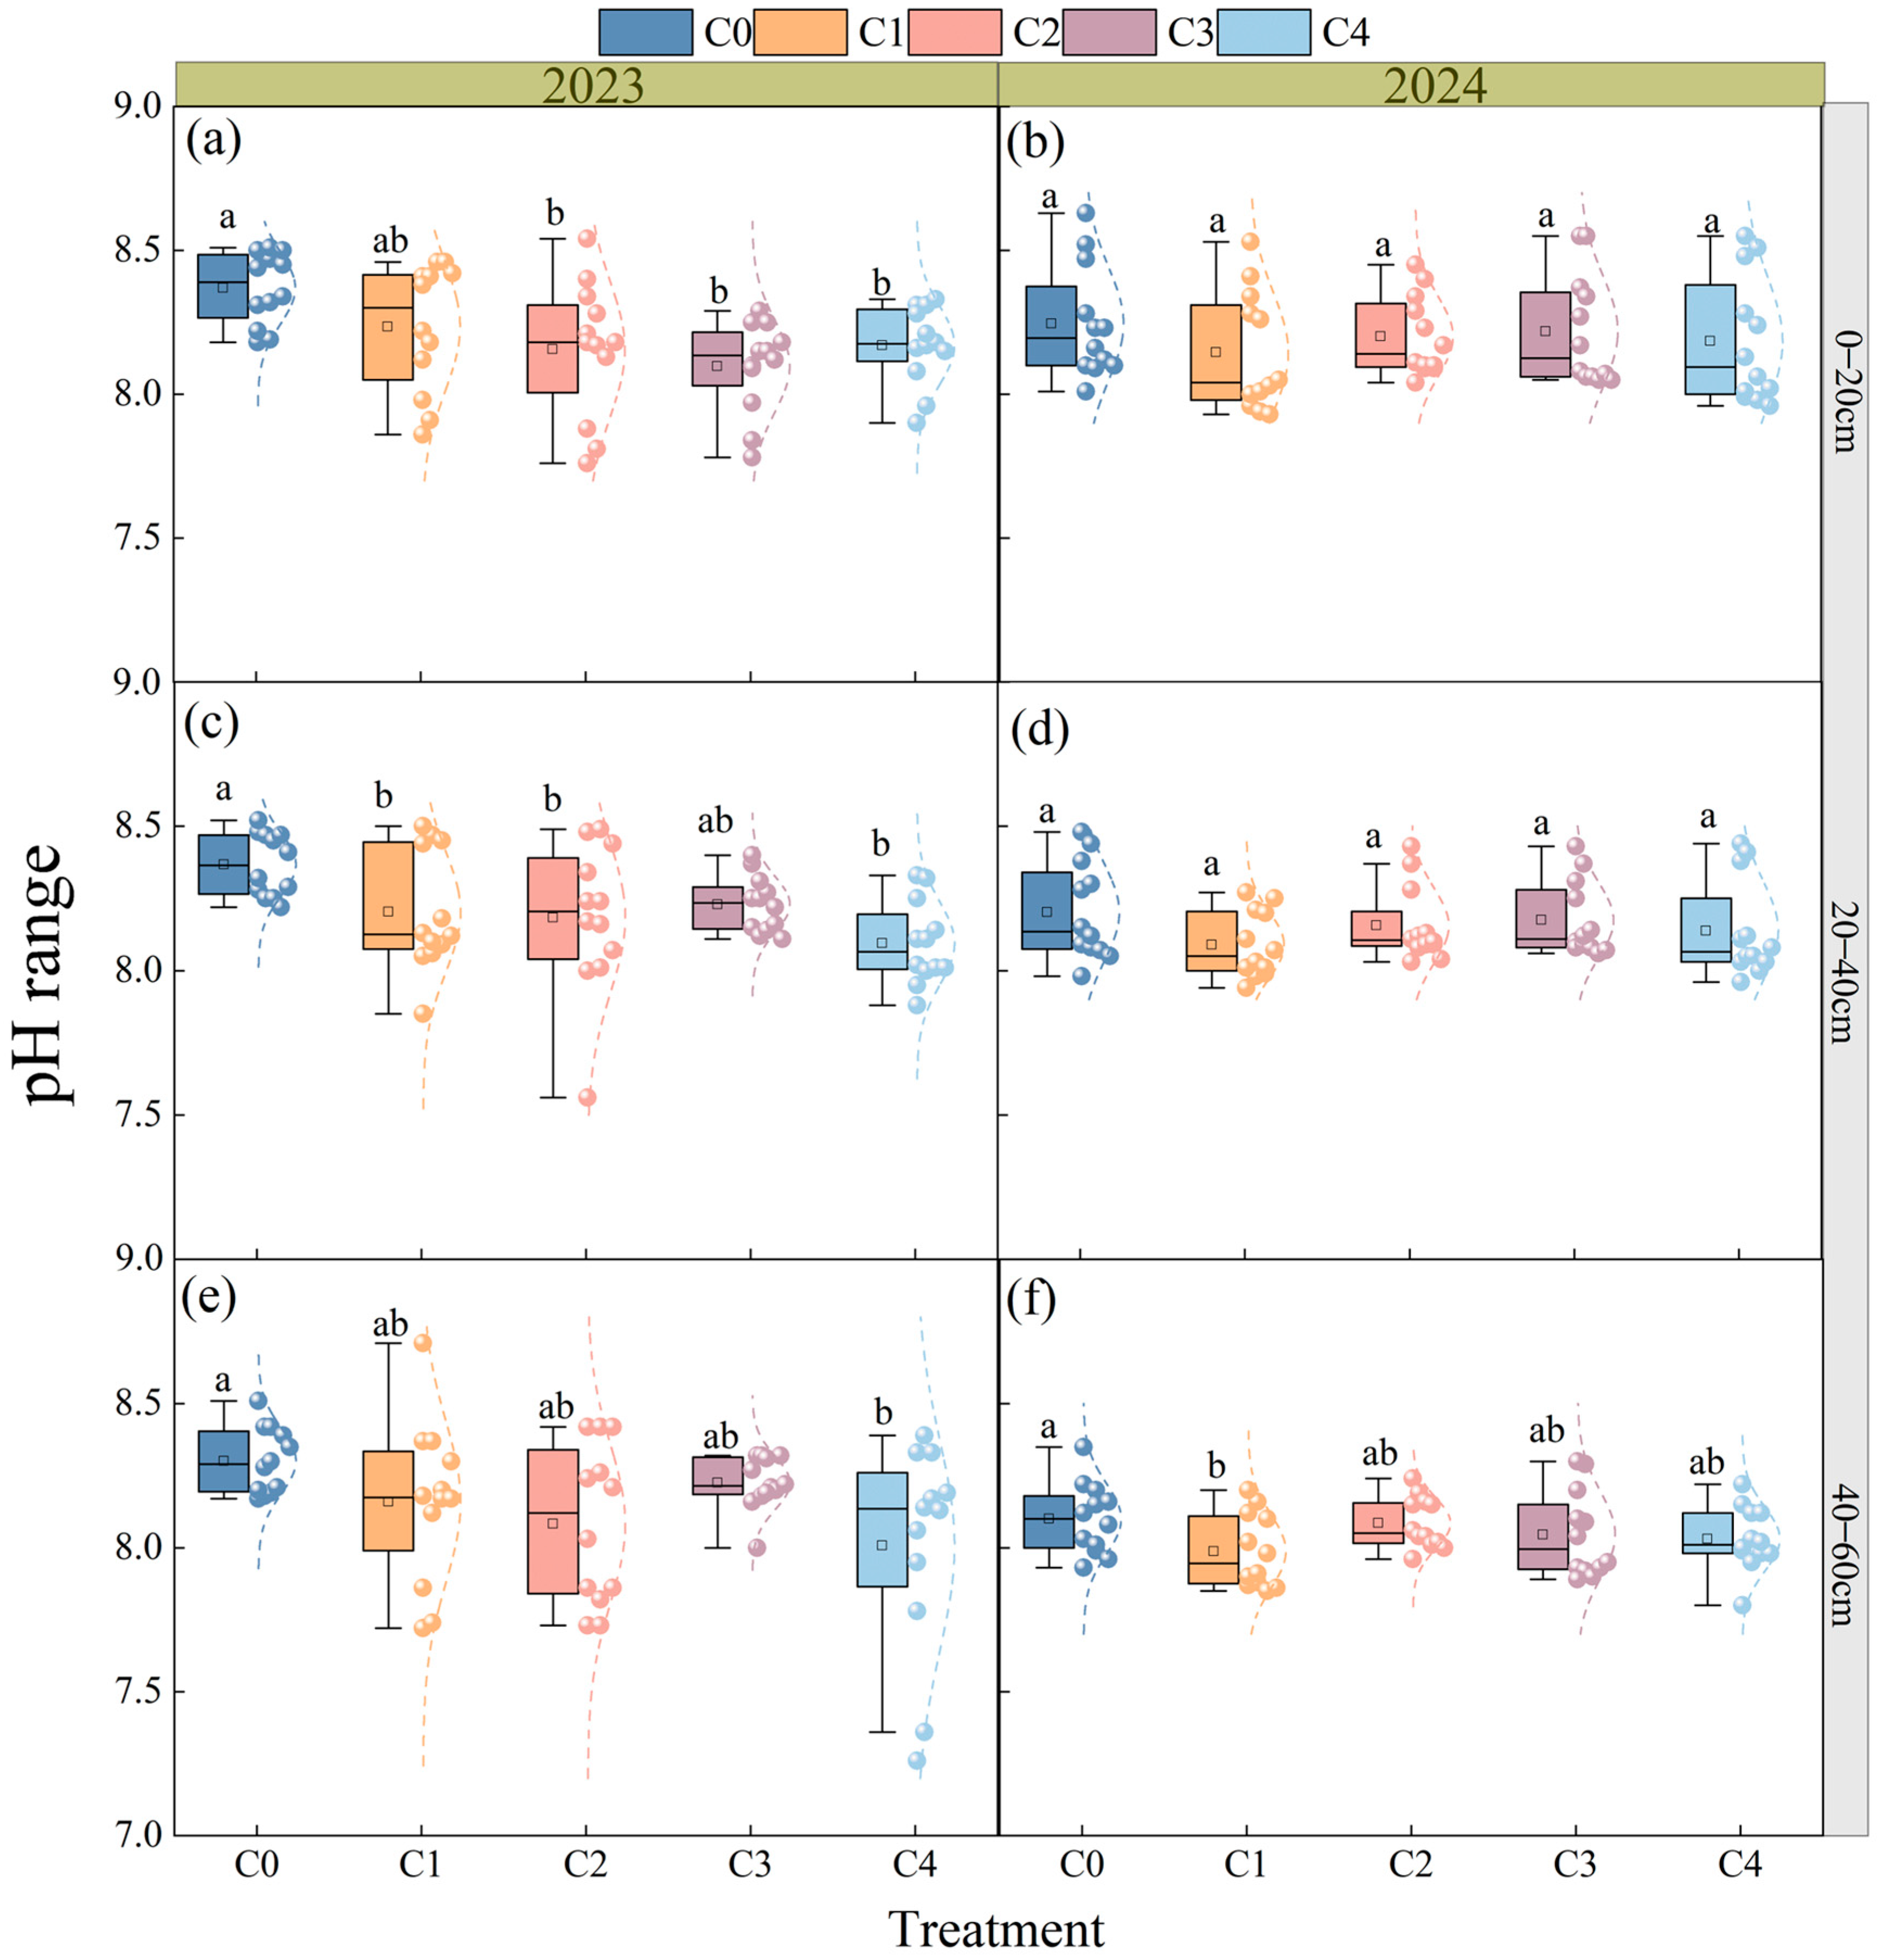
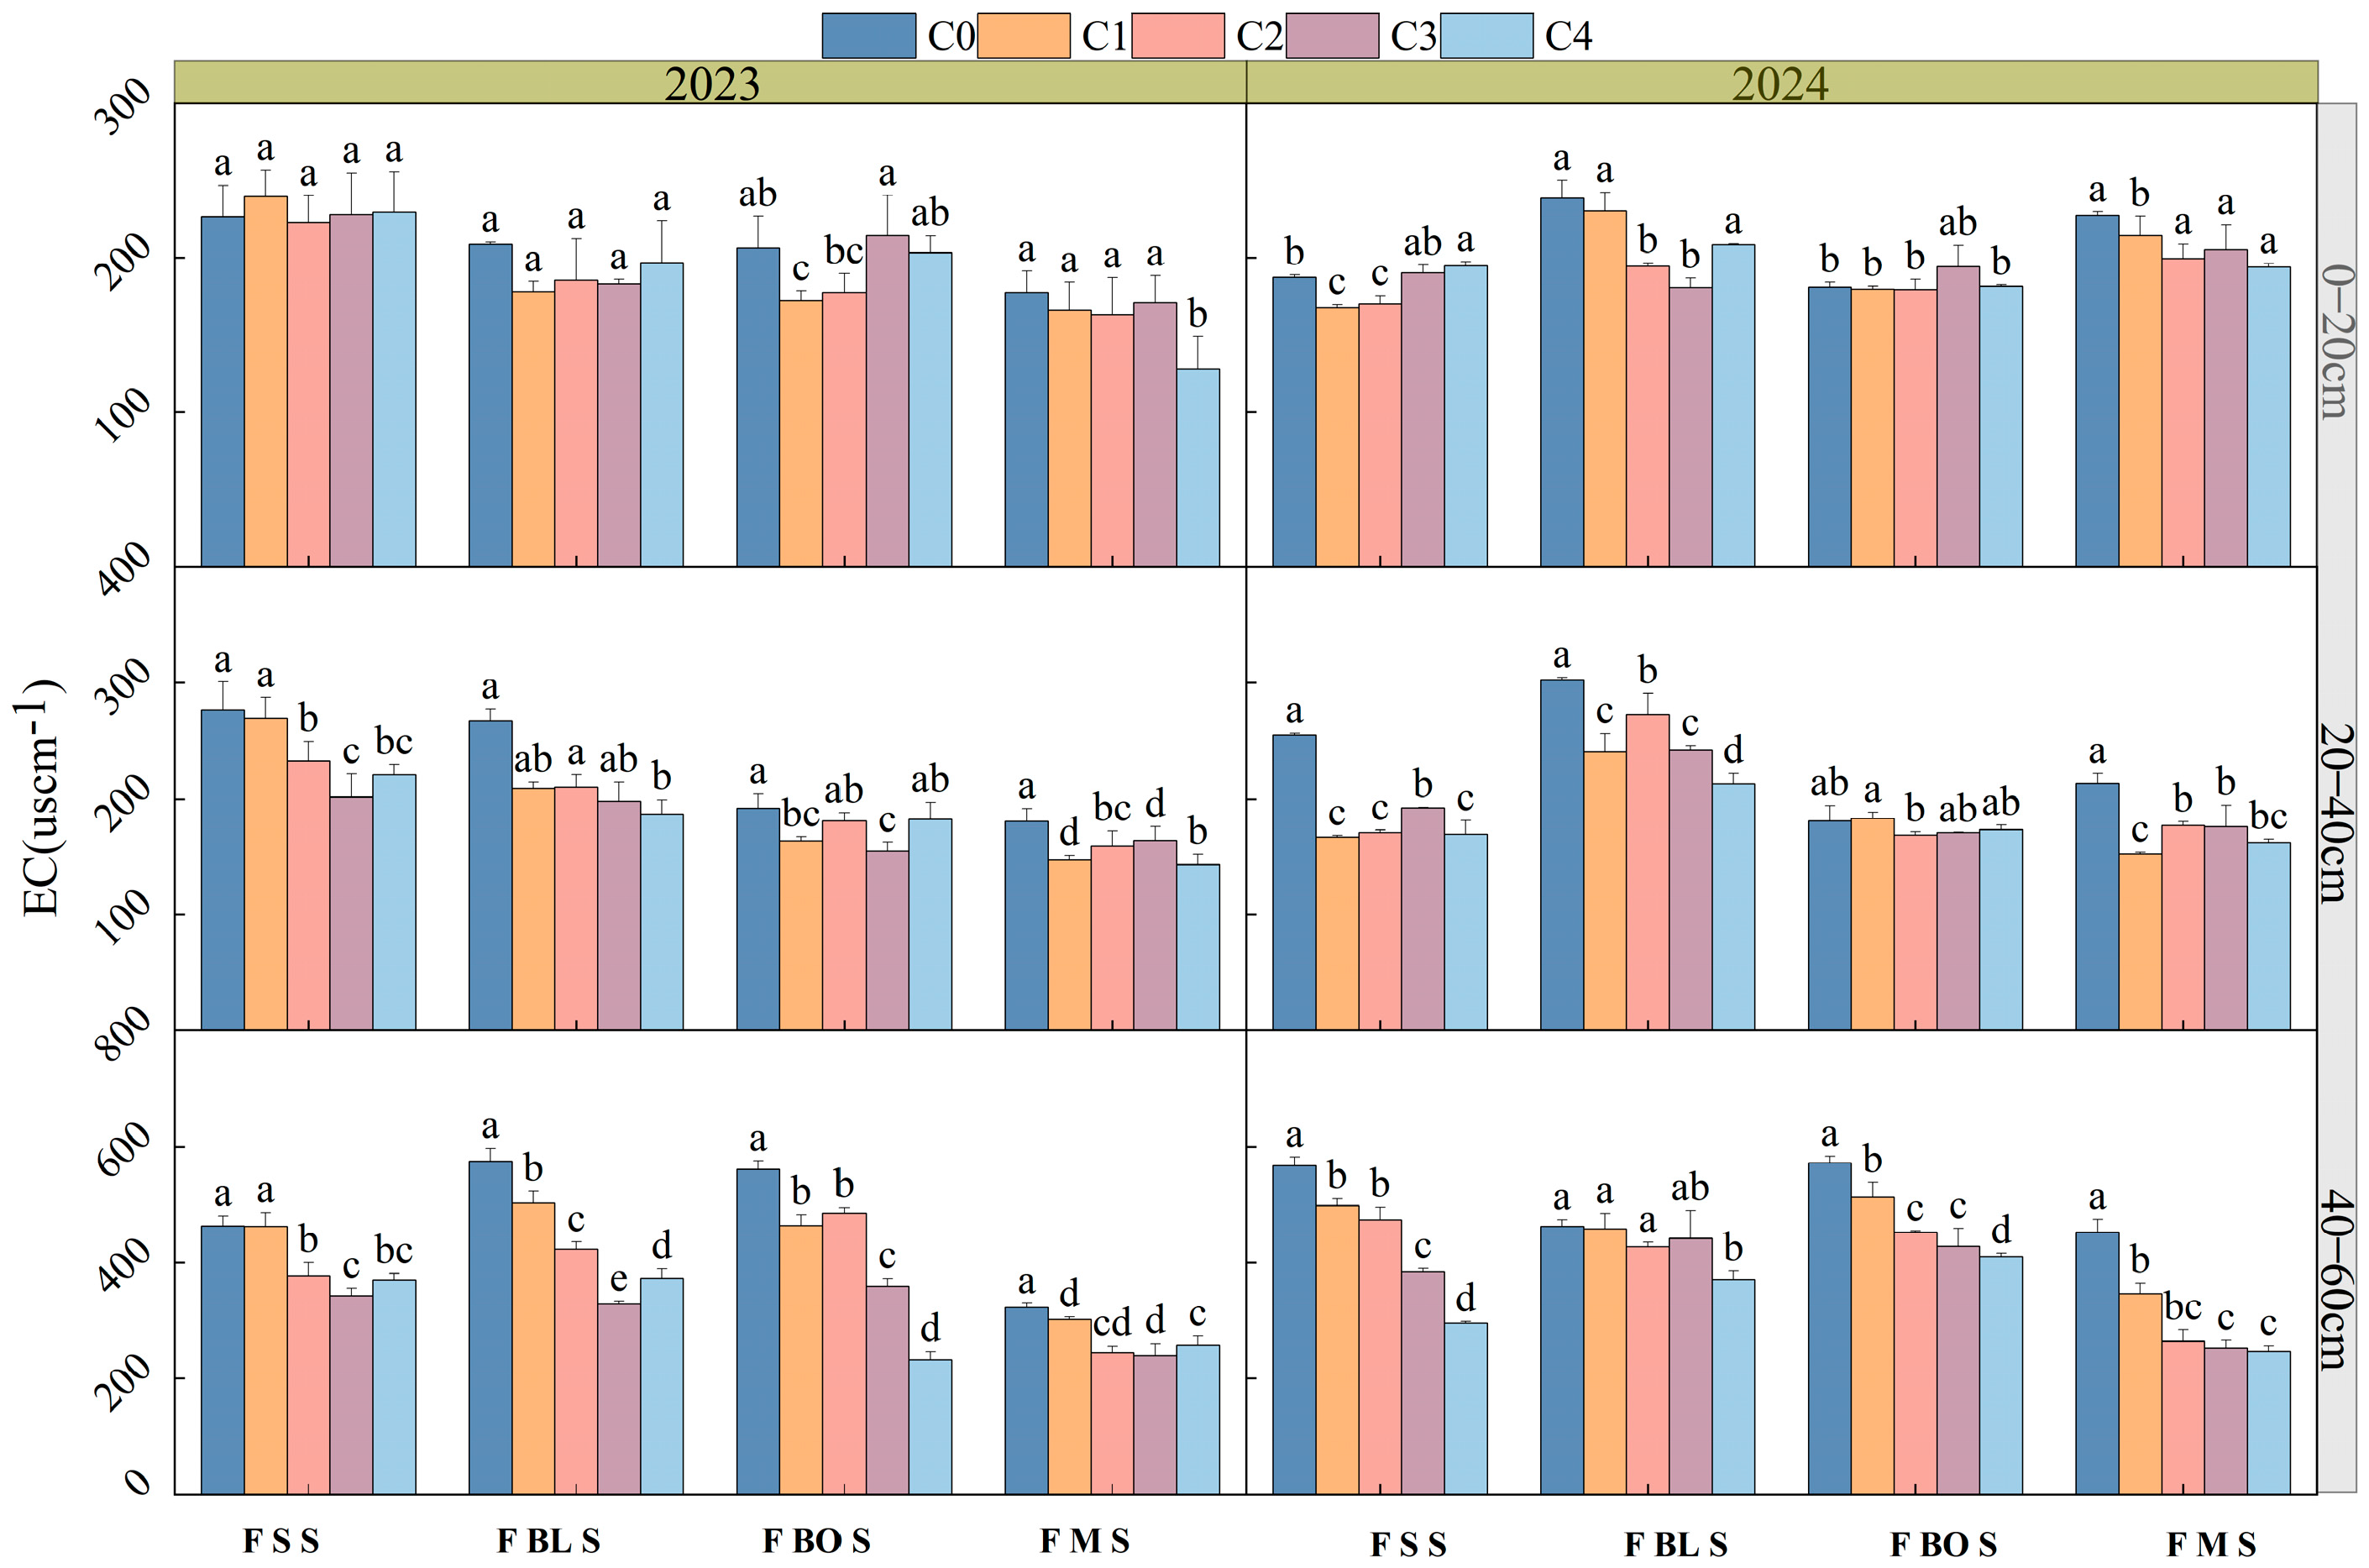
Drip application CO2-enriched irrigation water lowered soil pH and electrical conductivity (EC) in a concentration-dependent manner across the two growing seasons (Figure 3 and Figure 4). Soil acidification was most pronounced in the subsoil (40–60 cm depth), where pH declined by up to 0.3 units under the highest concentration (C4) in 2023 (Figure 3e) (p < 0.05). In the topsoil (0–20 cm), the maximum reduction reached 0.27 units (C3, 2023; Figure 3a) (p < 0.05). Notably, the optimal C2 treatment (0.08 kg·m−3) maintained a stable acidifying effect interannually, reducing pH by 0.21 units in 2023 and 0.04 units in 2024. Responses in the intermediate layer (20–40 cm) were more variable, ranging from a 0.12-unit decrease (C1, 2024) to a 0.27-unit decrease (C4, 2023) (p < 0.05).
A concurrent, progressive reduction in soil salinity was reflected by the decline in EC. Throughout the trial, the C2 treatment consistently lowered EC by 8.6% to 21.1% across the soil profile, with the most marked decrease occurring in the 40–60 cm layer. Higher CO2 concentrations amplified this effect; for instance, the C4 treatment reduced EC by 27.9% at the boll-opening stage and by 63.3% in the deep subsoil during the 2024 full-boll stage (all differences significant at (p < 0.05) compared to the control). This amelioration of salinity—particularly within the root zone—underscores the potential of CO2 fertigation to mitigate saline-alkaline stress and improve the soil physicochemical environment in arid agricultural systems.

3.2. Effects of CO2-Enriched Irrigation on Soil Ammonium and Nitrate Nitrogen

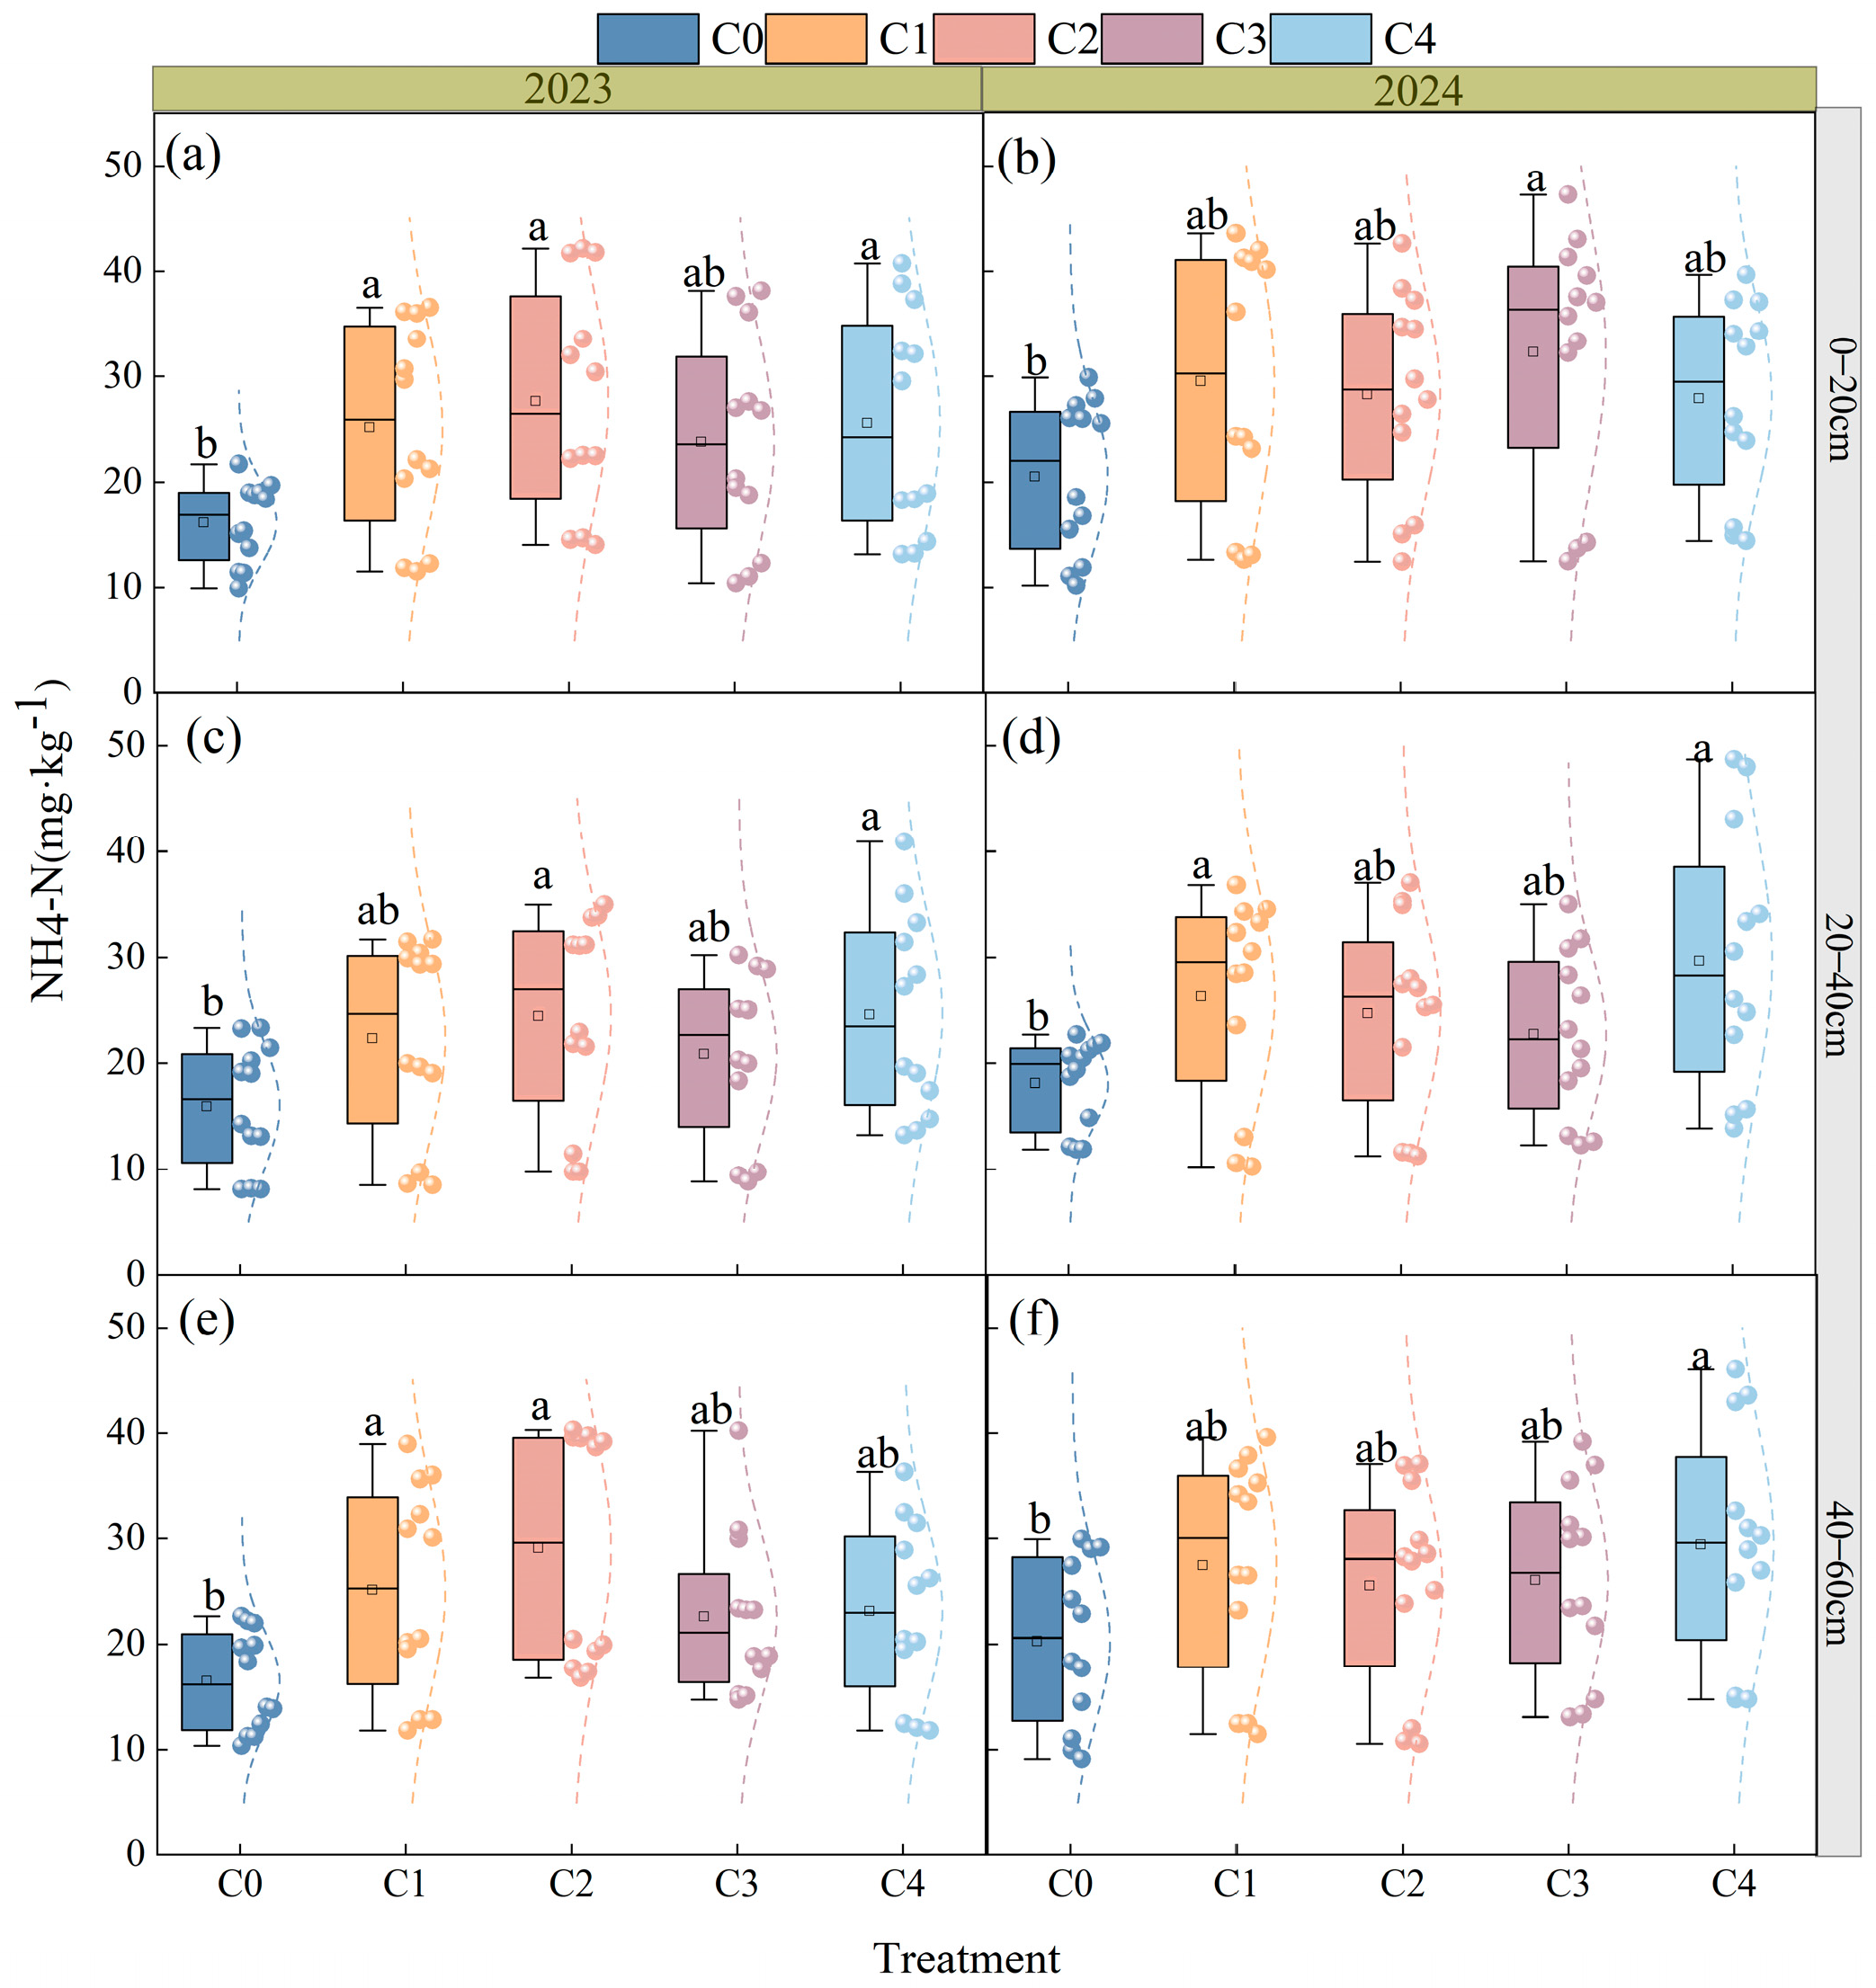
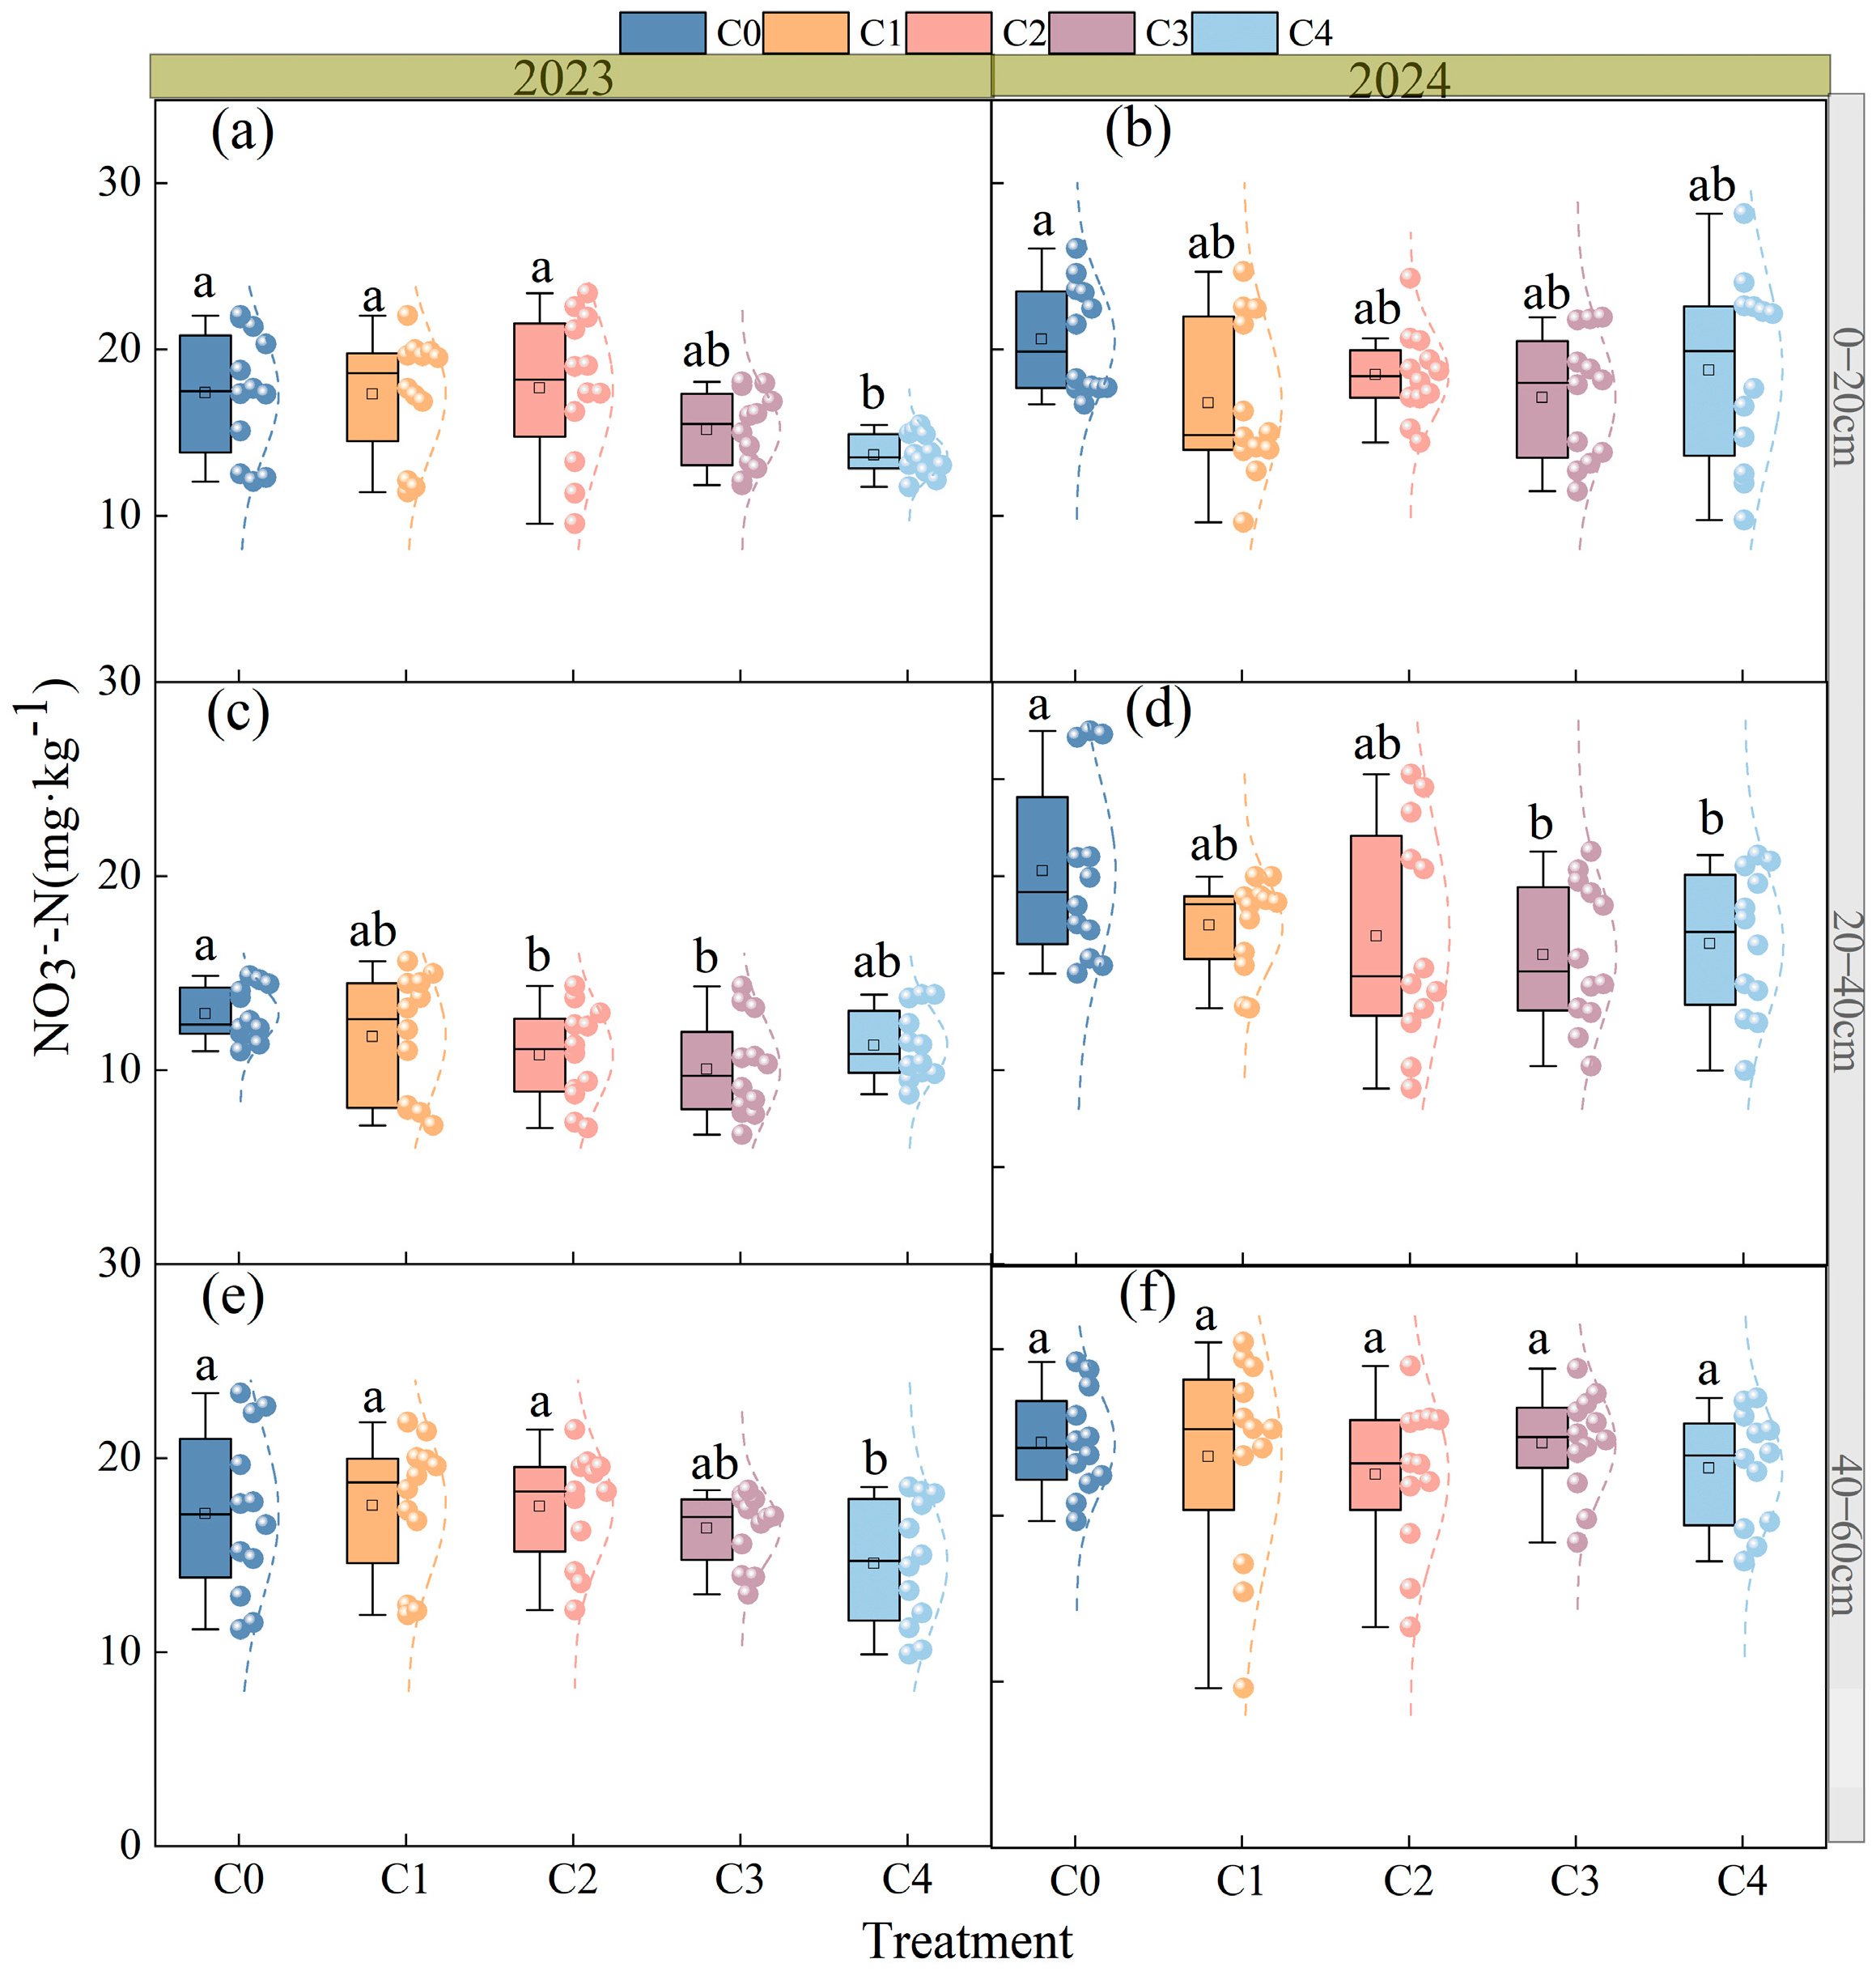
Drip application of industrial CO2 solution significantly influenced soil nitrogen dynamics, with contrasting responses observed between ammonium (NH4+-N) and nitrate (NO3-N) fractions (Figure 5 and Figure 6). The C2 treatment demonstrated the most consistent enhancement of NH4+-N across soil profiles. In the 0–20 cm depth, NH4+-N increased by 27.2% (2023) and 36.1% (2024) under C2 treatment (p < 0.05). The 20–40 cm depth showed a 21.0% increase in 2023 (p < 0.05), moderating to 4.5% in 2024. Most notably, the 40–60 cm depth exhibited the most pronounced response, with NH4+-N increasing by 70.8% in 2023 (p < 0.05) and maintaining a 9.1% increase in 2024. Conversely, CO2 application significantly reduced NO3-N content, showing distinct depth-dependent and interannual variations. The C3 and C4 treatments induced the strongest suppression in surface and subsurface depths, reducing NO3-N by 12.3–20.1% in 2023 and 11.6–18.1% in 2024. The C1 and C2 treatments showed relatively milder effects initially, though suppression intensified in 2024 (e.g., C1 reduced NO3-N by 17.5% in the 0–20 cm depth). Treatment effects diminished with depth, with reductions generally below 10% in the 40–60 cm depth. The contrasting responses of ammonium and nitrate nitrogen to CO2 enrichment suggest a fundamental shift in soil nitrogen cycling processes, potentially involving enhanced mineralization and suppressed nitrification.

3.3. Effects of CO2-Enriched Irrigation on Soil Available Phosphorus

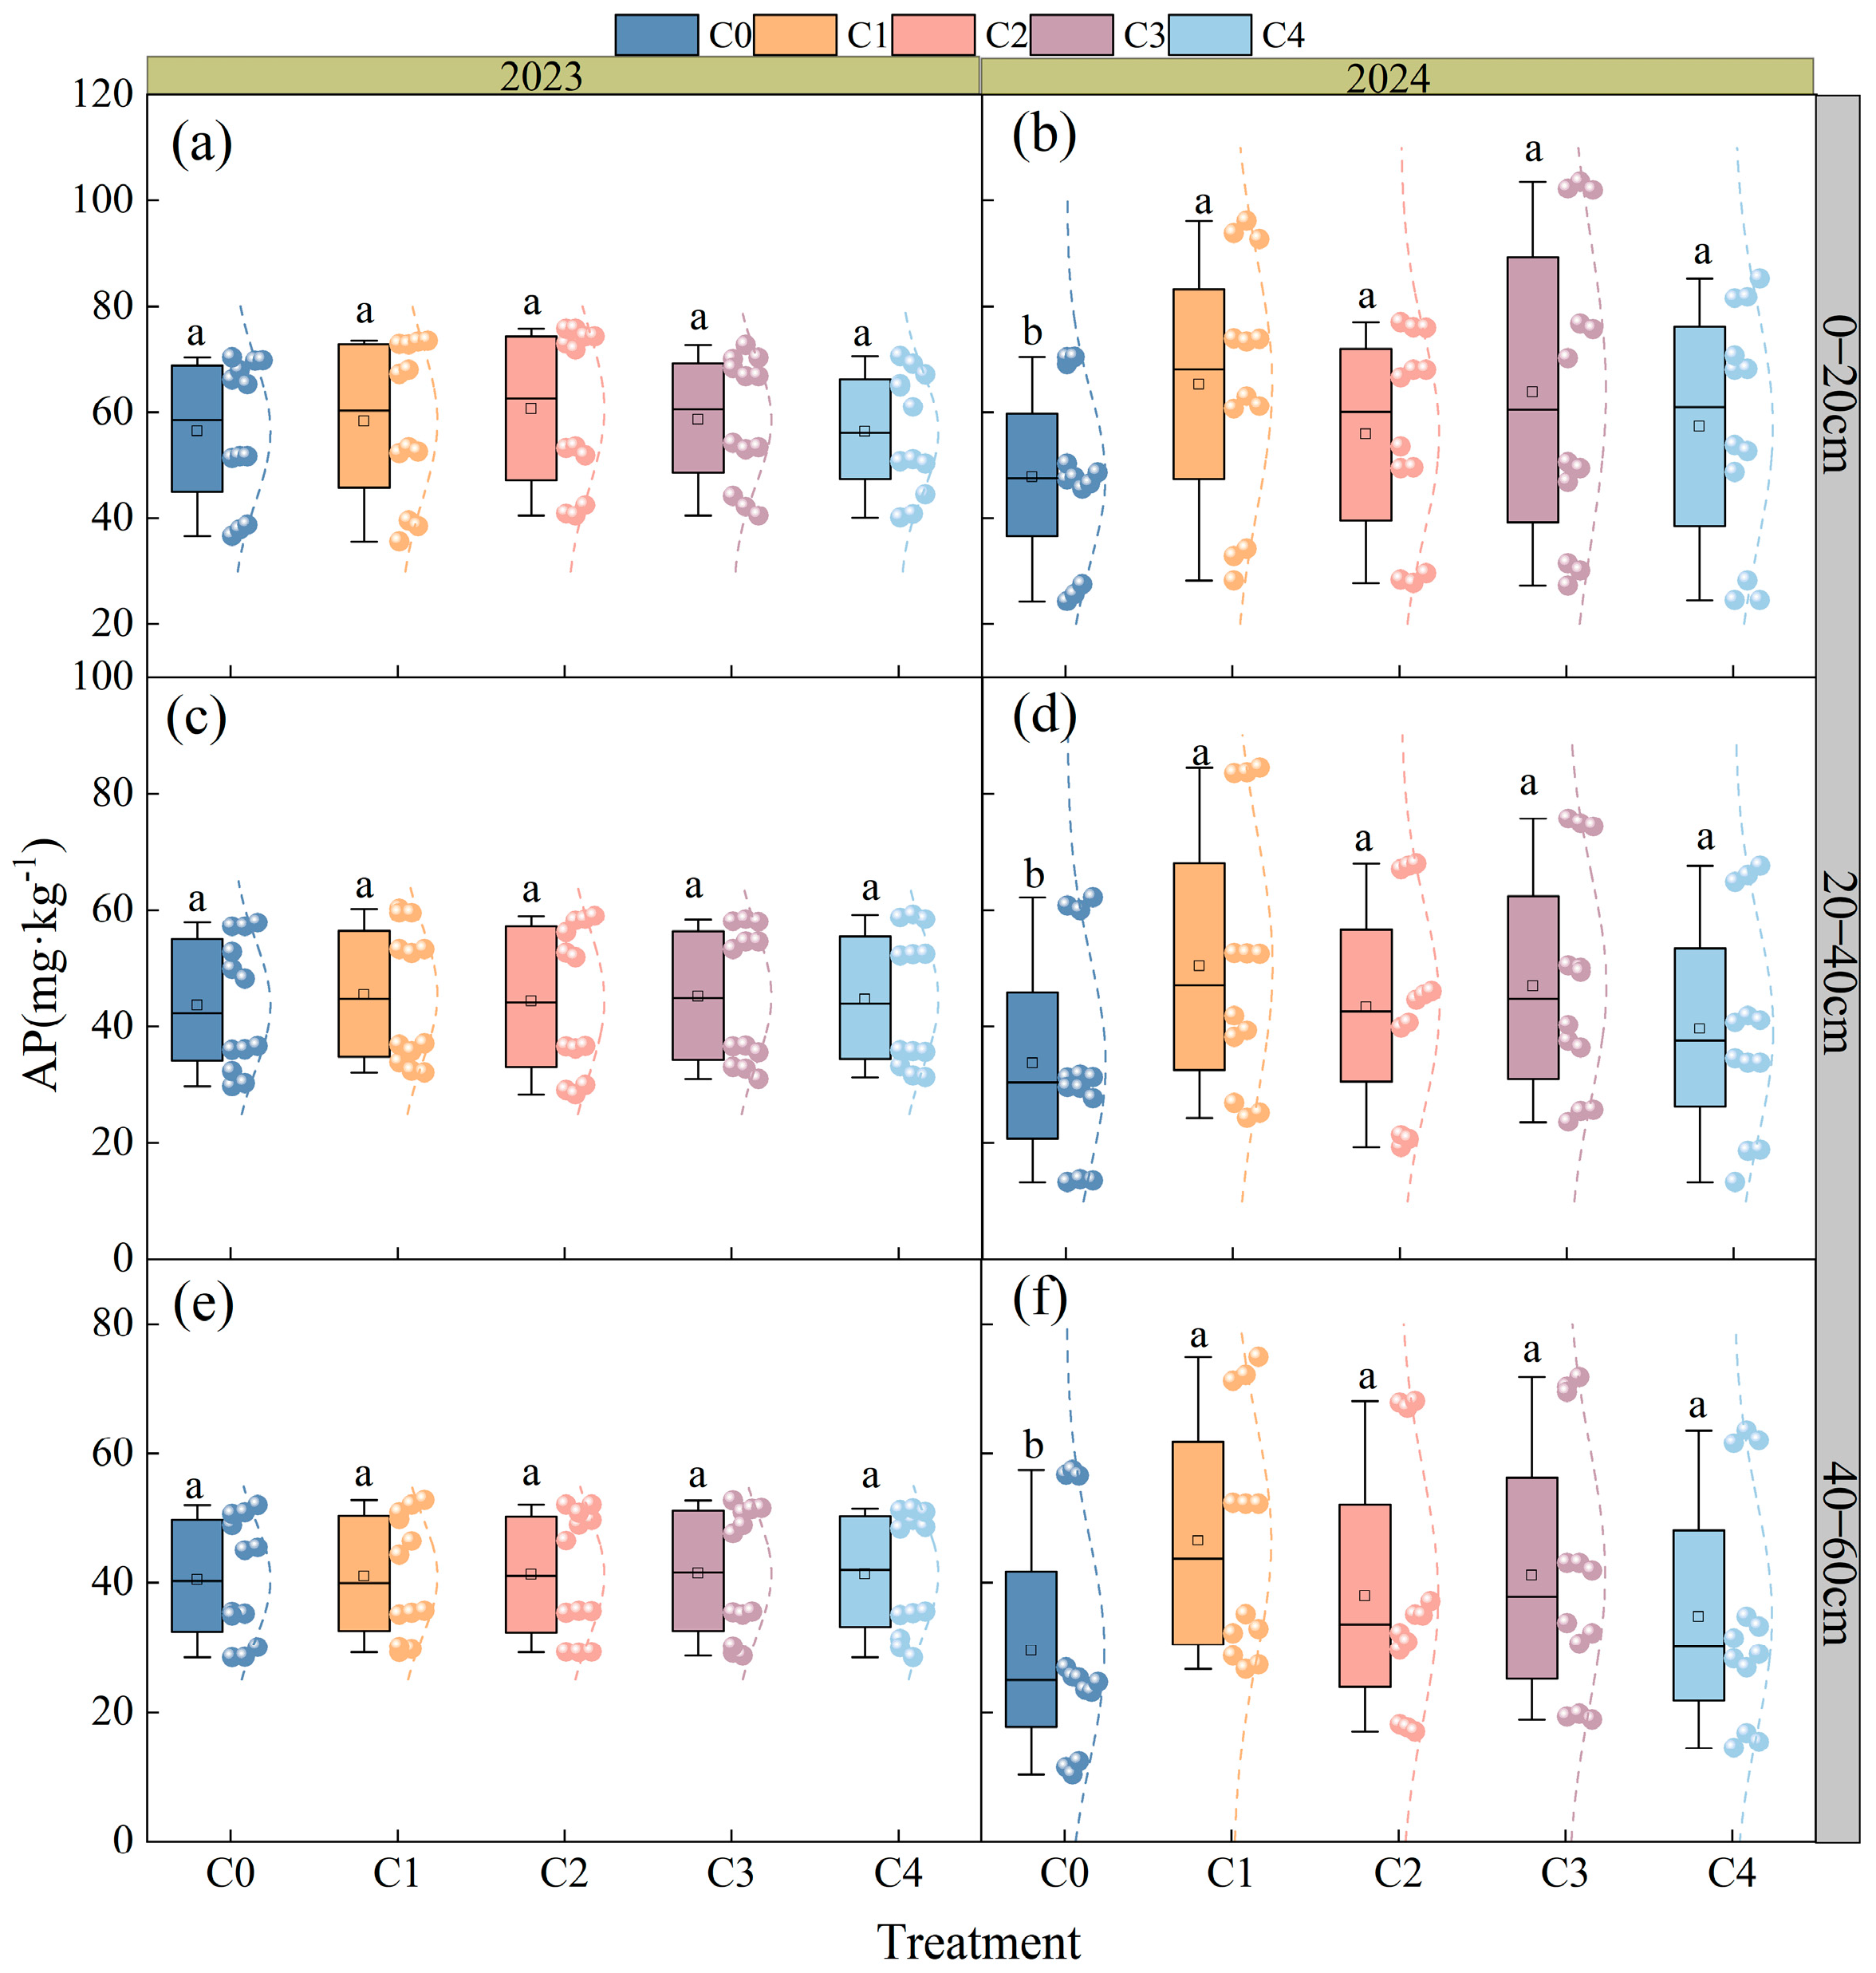
Drip application of the industrial CO2 solution significantly increased the soil available phosphorus (AP) content across all soil depths, with the most pronounced effects observed in the second year and a progressive enhancement during the growth season (p < 0.05) (Figure 7). In the 0–20 cm depth, the AP content rose by 1.4–8.1% in 2023 and further increased to 8.2–24.5% in 2024, with the C2 treatment consistently exhibiting the greatest improvement. Similar trends were observed in the 20–40 cm depth, where notable increases of 20.1–34.4% occurred in 2024 (p < 0.05), again with C2 showing superior performance. Although treatment effects attenuated in the 40–60 cm depth, enhancements in 2024 remained significantly stronger than those in 2023, and the C2 treatment continued to demonstrate optimal effectiveness even at this depth. These results highlight the consistent and depth-dependent enhancement of soil phosphorus availability under CO2 enrichment, with the C2 concentration emerging as the most effective treatment.

3.4. Effects of CO2-Enriched Irrigation on Soil Available Potassium

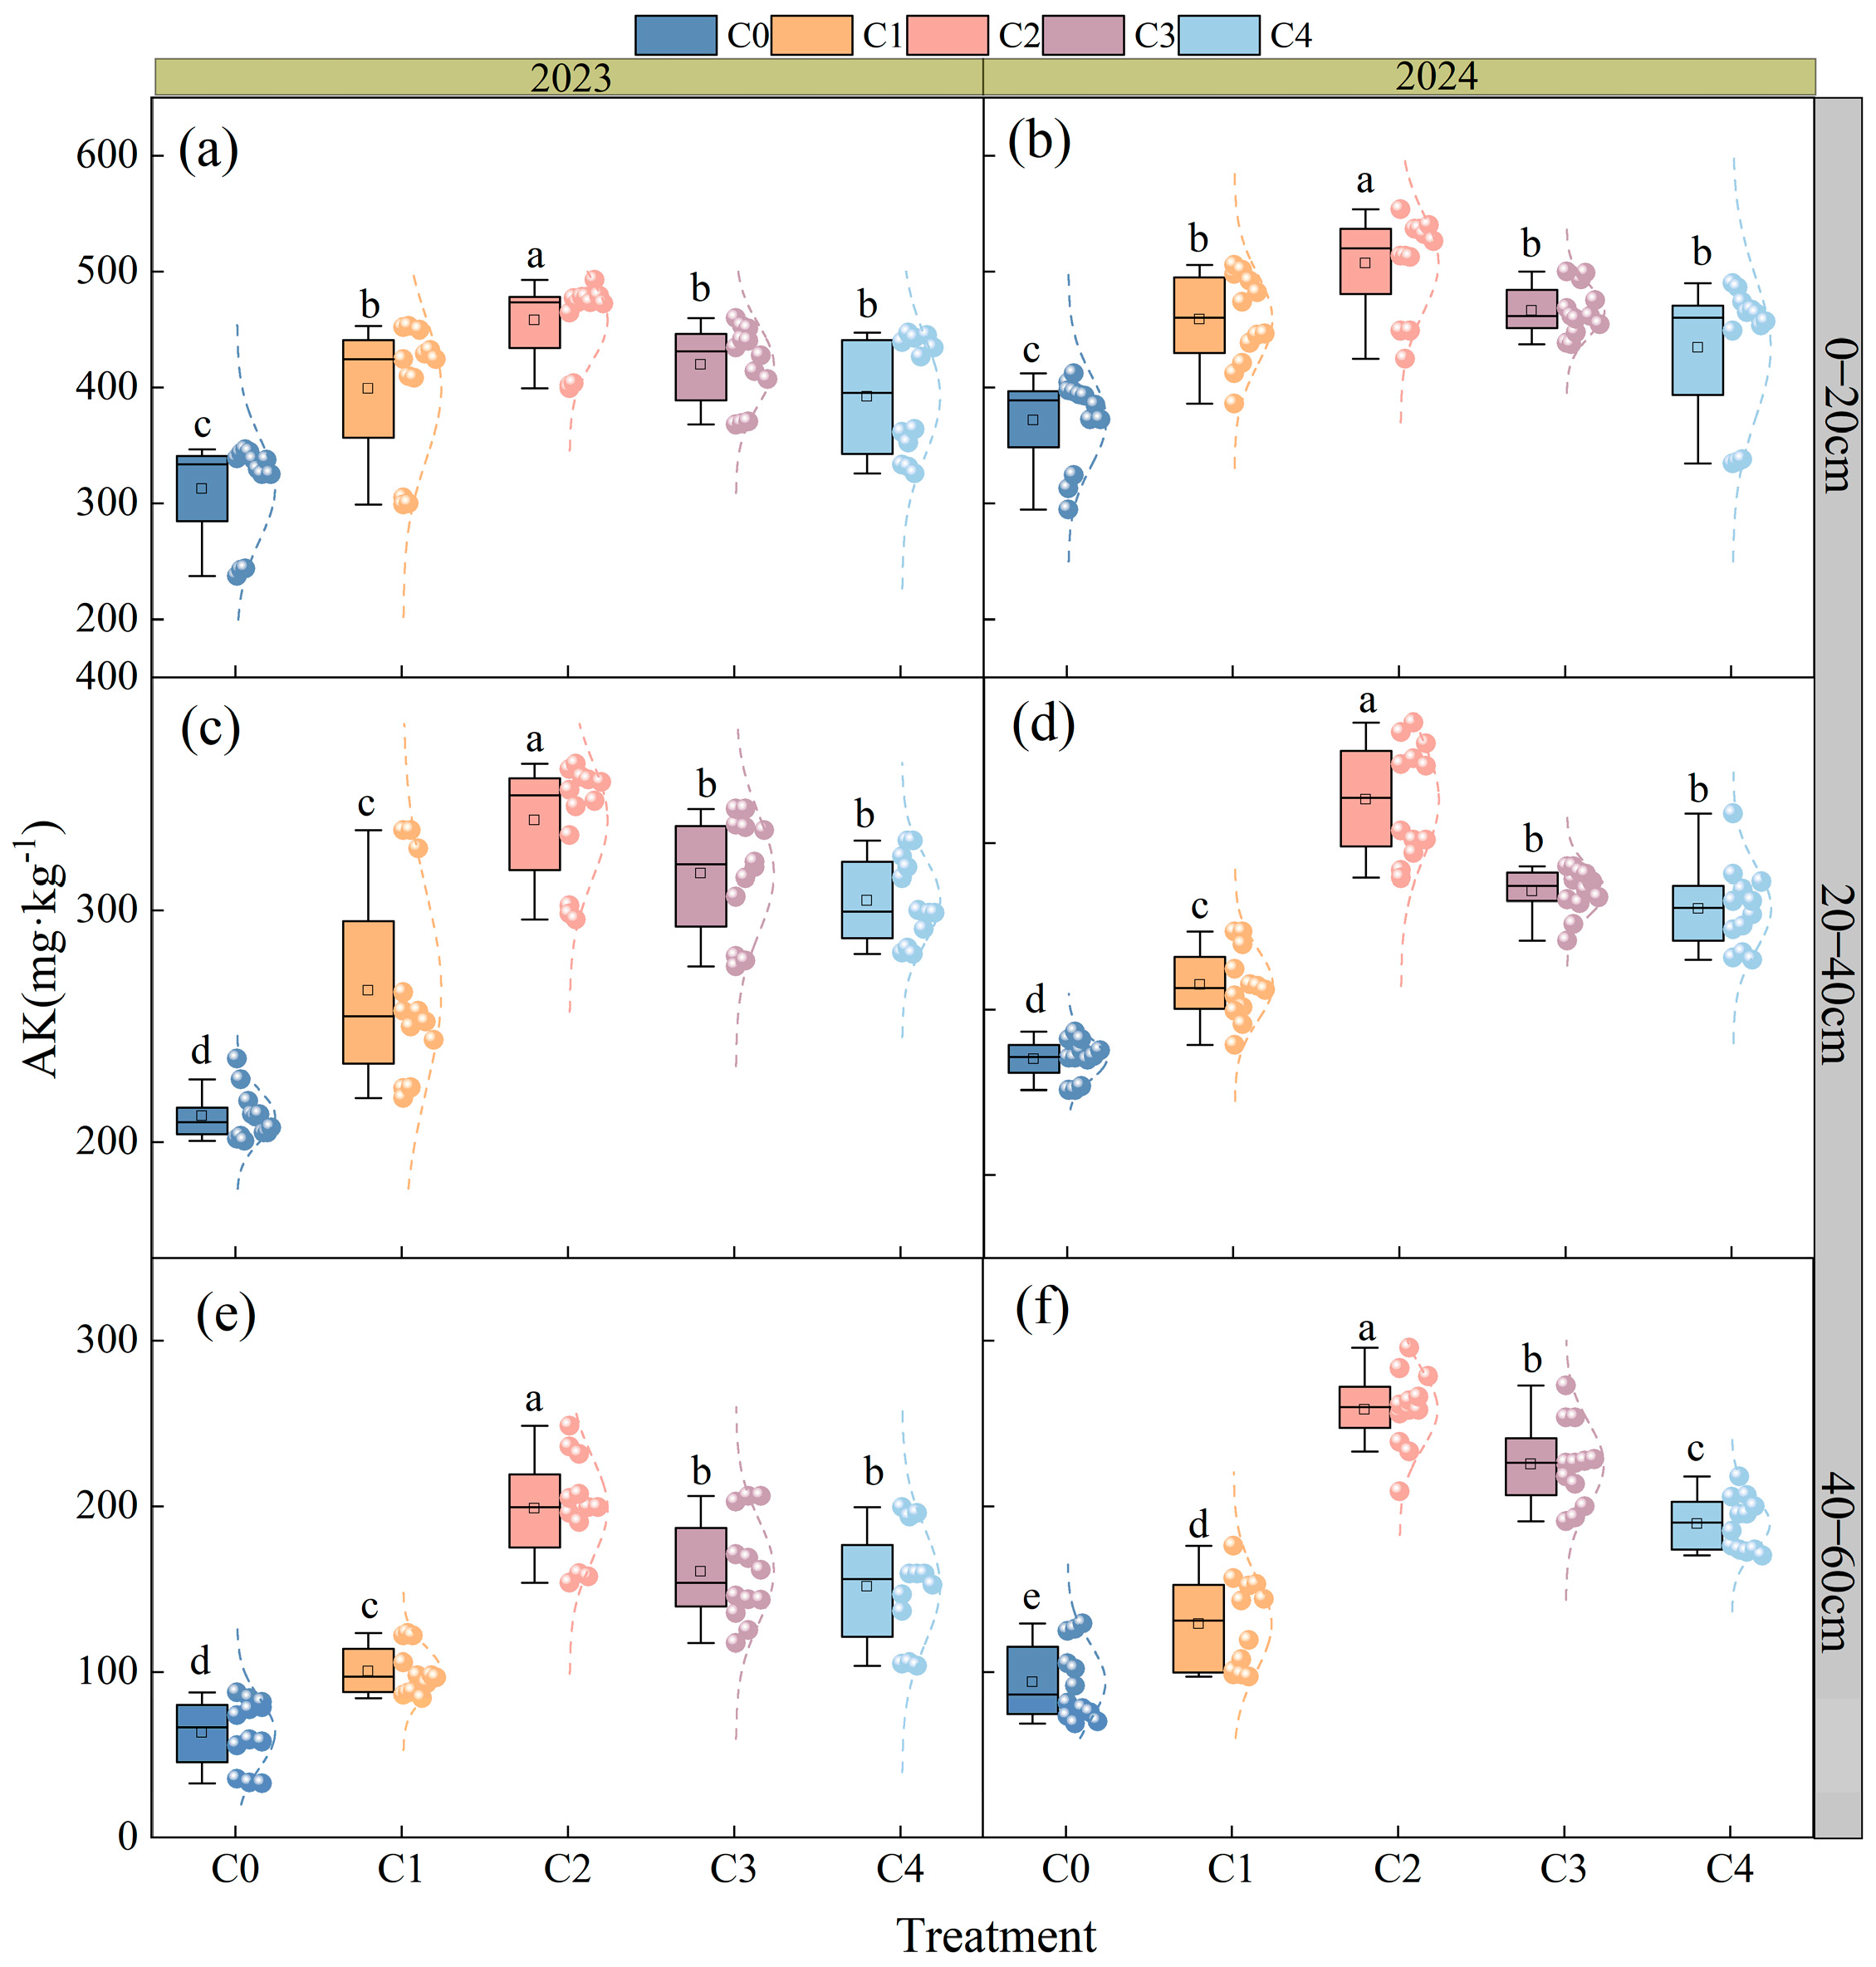
Drip application of the industrial CO2 solution significantly enhanced the soil available potassium (AK) content across all soil profiles, with particularly pronounced effects in the 0–20 cm depth and consistent interannual trends (Figure 8). In the surface layer (0–20 cm), all CO2 treatments significantly increased the AK content (p < 0.05), with the C2 treatment showing the most substantial enhancements of 38.5% in 2023 and 26.8% in 2024, following the efficacy order of C2 > C1 > C3 > C4. Within the 20–40 cm depth, the C2 treatment maintained superior performance with increases of 52.1% and 43.8% during 2023 and 2024, respectively, though the overall treatment effects attenuated with depth and showed generally higher enhancement in 2023 compared to 2024. Notably, in the deepest soil depth (40–60 cm), the C2 treatment continued to demonstrate the strongest promotion effect, particularly with a remarkable 72.3% increase in 2024 (p < 0.05), following the efficacy pattern of C2 > C3 > C1 > C4. The consistent superiority of the C2 treatment across different soil depths and years underscores its optimal effectiveness in enhancing potassium availability throughout the soil profile.

3.5. Effects of CO2-Enriched Irrigation on Plant Nutrient Accumulation and Yield

3.5.1. Effects of CO2-Enriched Irrigation on Plant Nutrient Accumulation

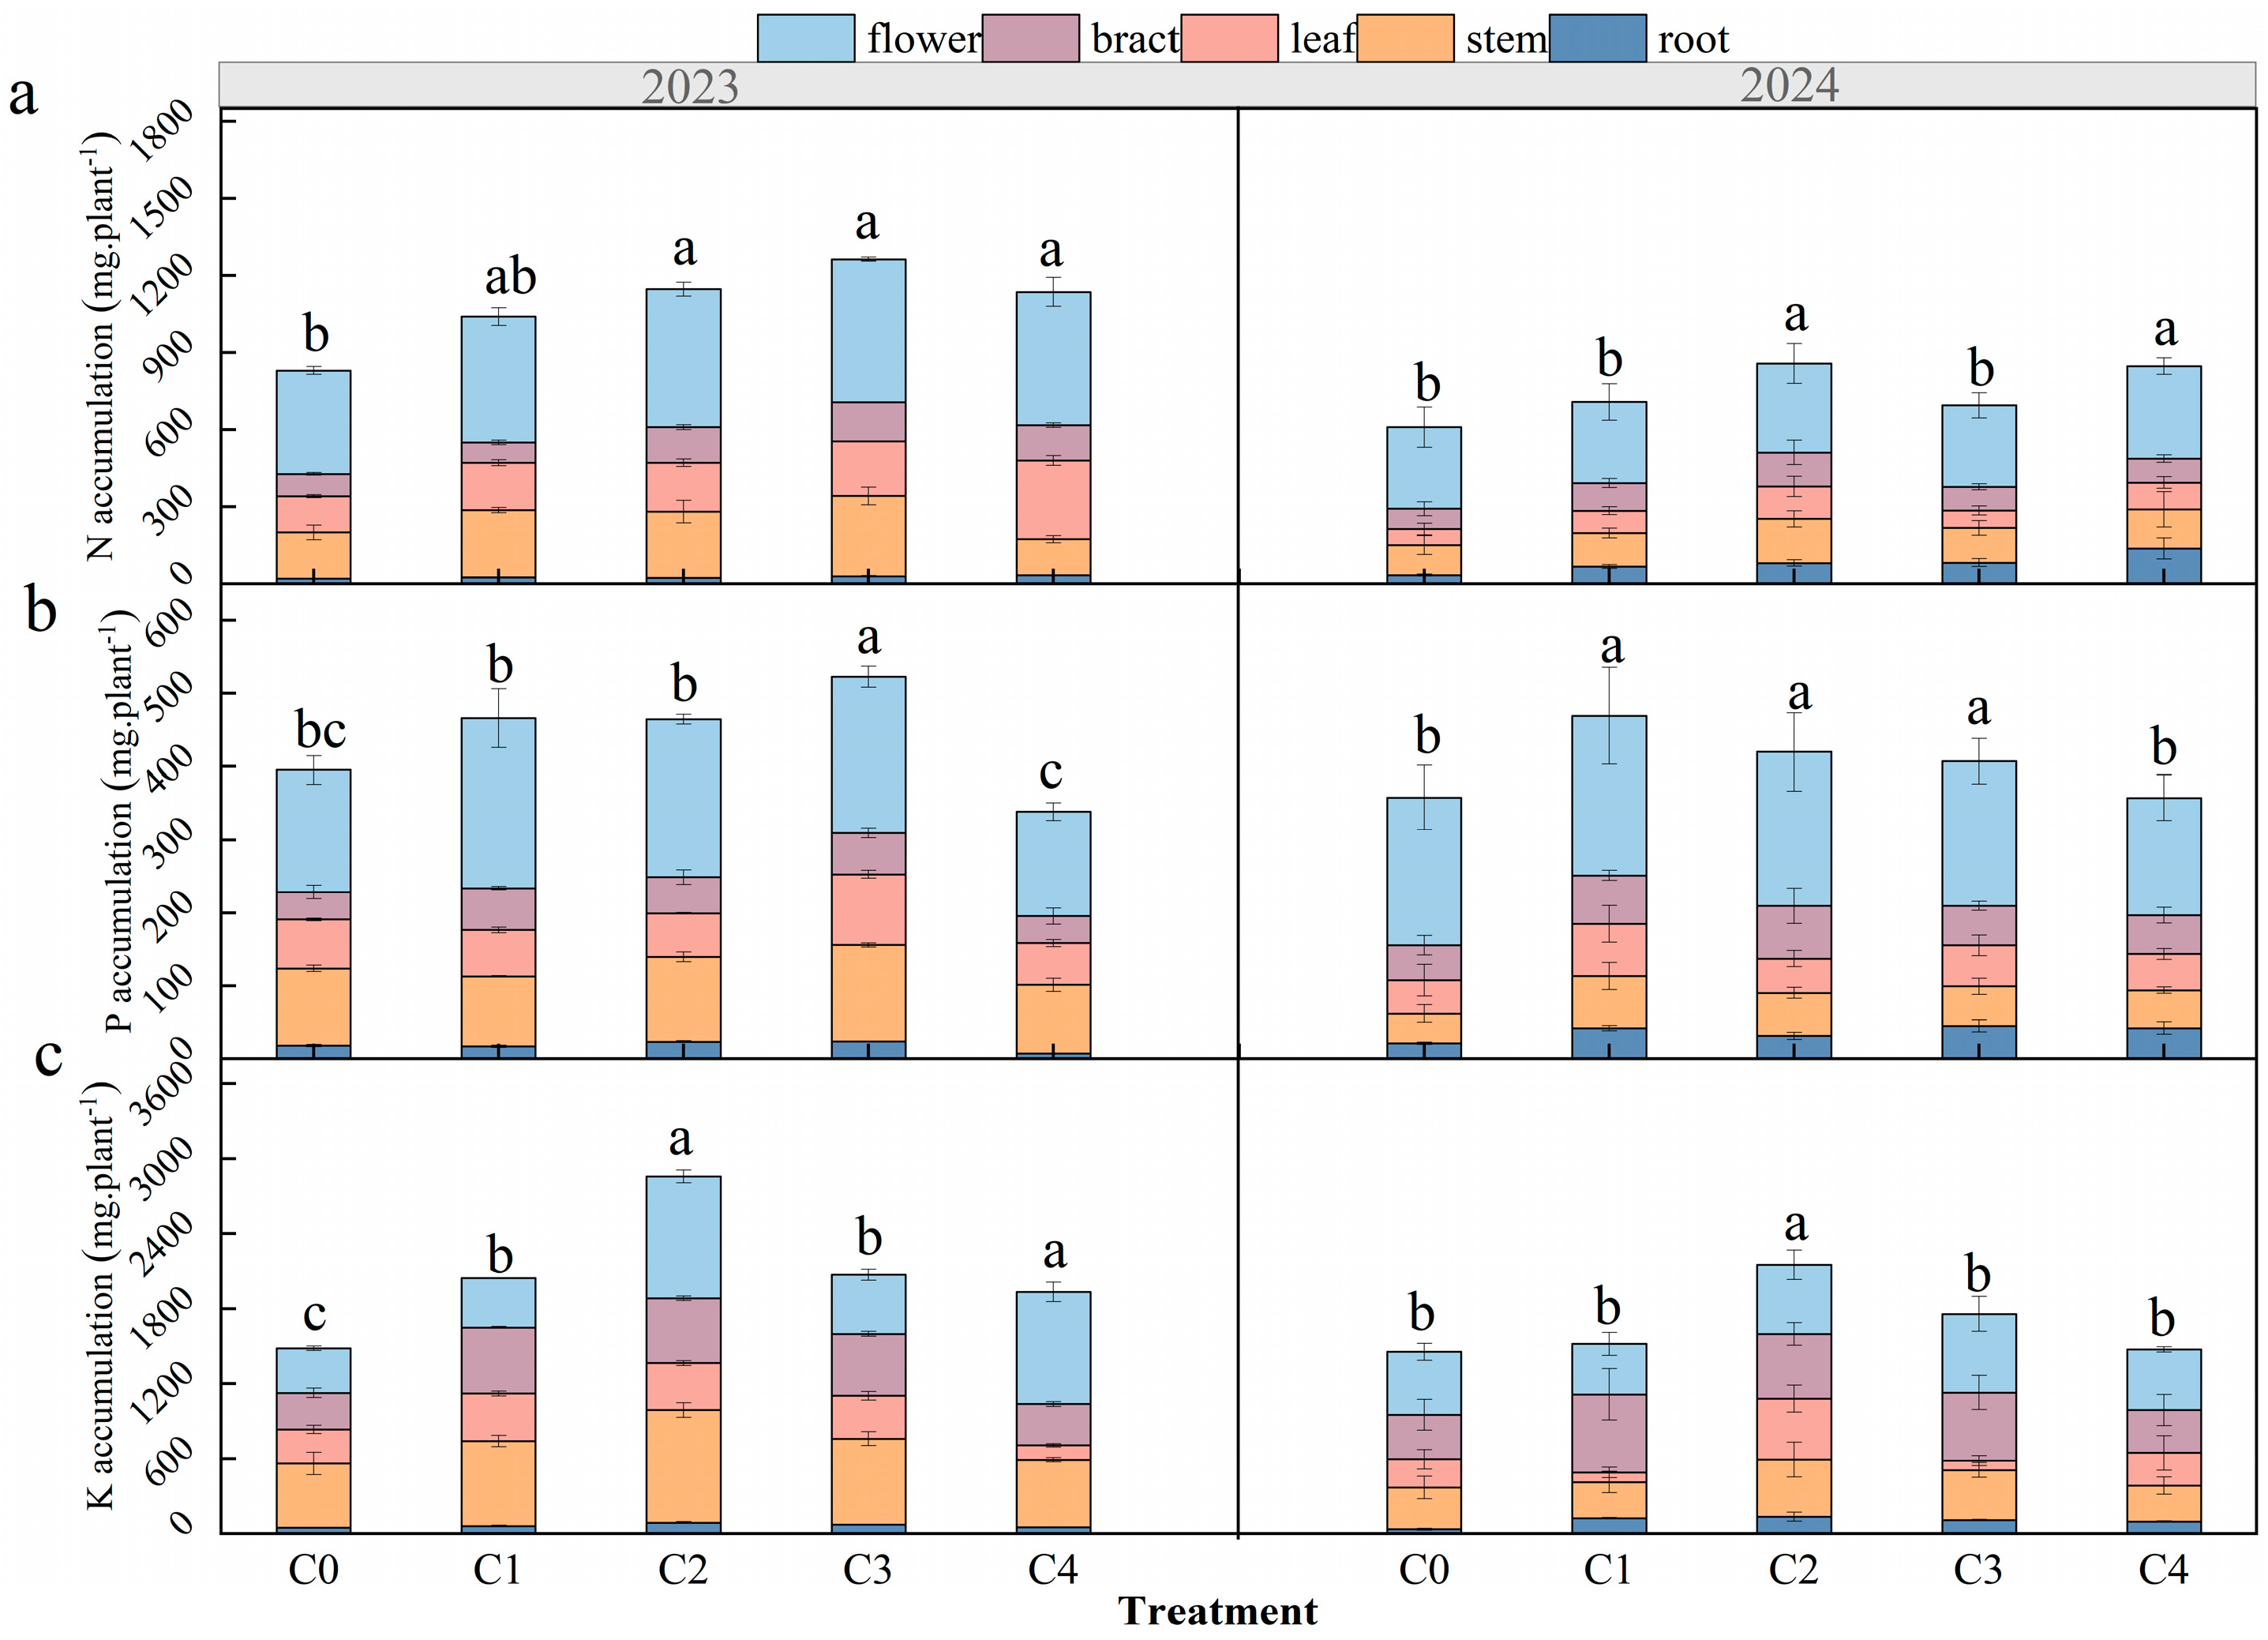
The results demonstrated that the C2 treatment significantly enhanced mineral nutrient accumulation in cotton plants (p < 0.05), with consistent interannual effects (Figure 9). In 2023, the C2 treatment increased nitrogen, phosphorus, and potassium accumulation by 52.2%, 32.3%, and 92.6%, respectively (p < 0.05). During 2024, these enhancements were maintained at 56.2%, 41.9%, and 53.2% for N, P, and K, respectively (p < 0.05), with particularly pronounced nitrogen accumulation in the roots (138.9% increase) and leaves (103.8% increase). Phosphorus accumulation in the roots increased by 31.3% and 49.1% in 2023 and 2024, respectively (p < 0.05), while potassium exhibited the most dramatic response with a 287.4% increase in root accumulation during 2024 (p < 0.05). The reproductive organs showed substantial nutrient enhancement under C2 treatment, with N, P, and K increases of 38.2%, 27.8%, and 172.1% in 2023, and 38.3%, 24.9%, and 34.2% in 2024 (p < 0.05). Compared to the other treatments, the C2 treatment demonstrated clear advantages in promoting more balanced and uniform accumulation of all three essential nutrients.

3.5.2. Effects of CO2-Enriched Irrigation on Cotton Yield and Yield Components

Drip application of CO2-enriched irrigation significantly enhanced cotton yield and biomass production, with the C2 treatment demonstrating optimal performance compared to the control (C0) (Table 1). In 2023, the C2 treatment significantly increased the boll number per plant by 15.30% while boosting biomass accumulation by 30.22% (p < 0.01), resulting in a 6.06% improvement in seed cotton yield (p < 0.05). During 2024, this treatment maintained its effectiveness with a 5.76% yield increase (p < 0.01). Regarding biomass accumulation, the C2 treatment consistently enhanced biomass by 31.80%, whereas the C3 treatment showed greater variability, achieving a 33.52% increase in 2023 but demonstrating reduced effectiveness in 2024, indicating less stable performance across growing seasons.

3.6. Principal Component and Correlation Analysis of Yield and Nutrient Dynamics Under CO2-Enriched Drip Irrigation

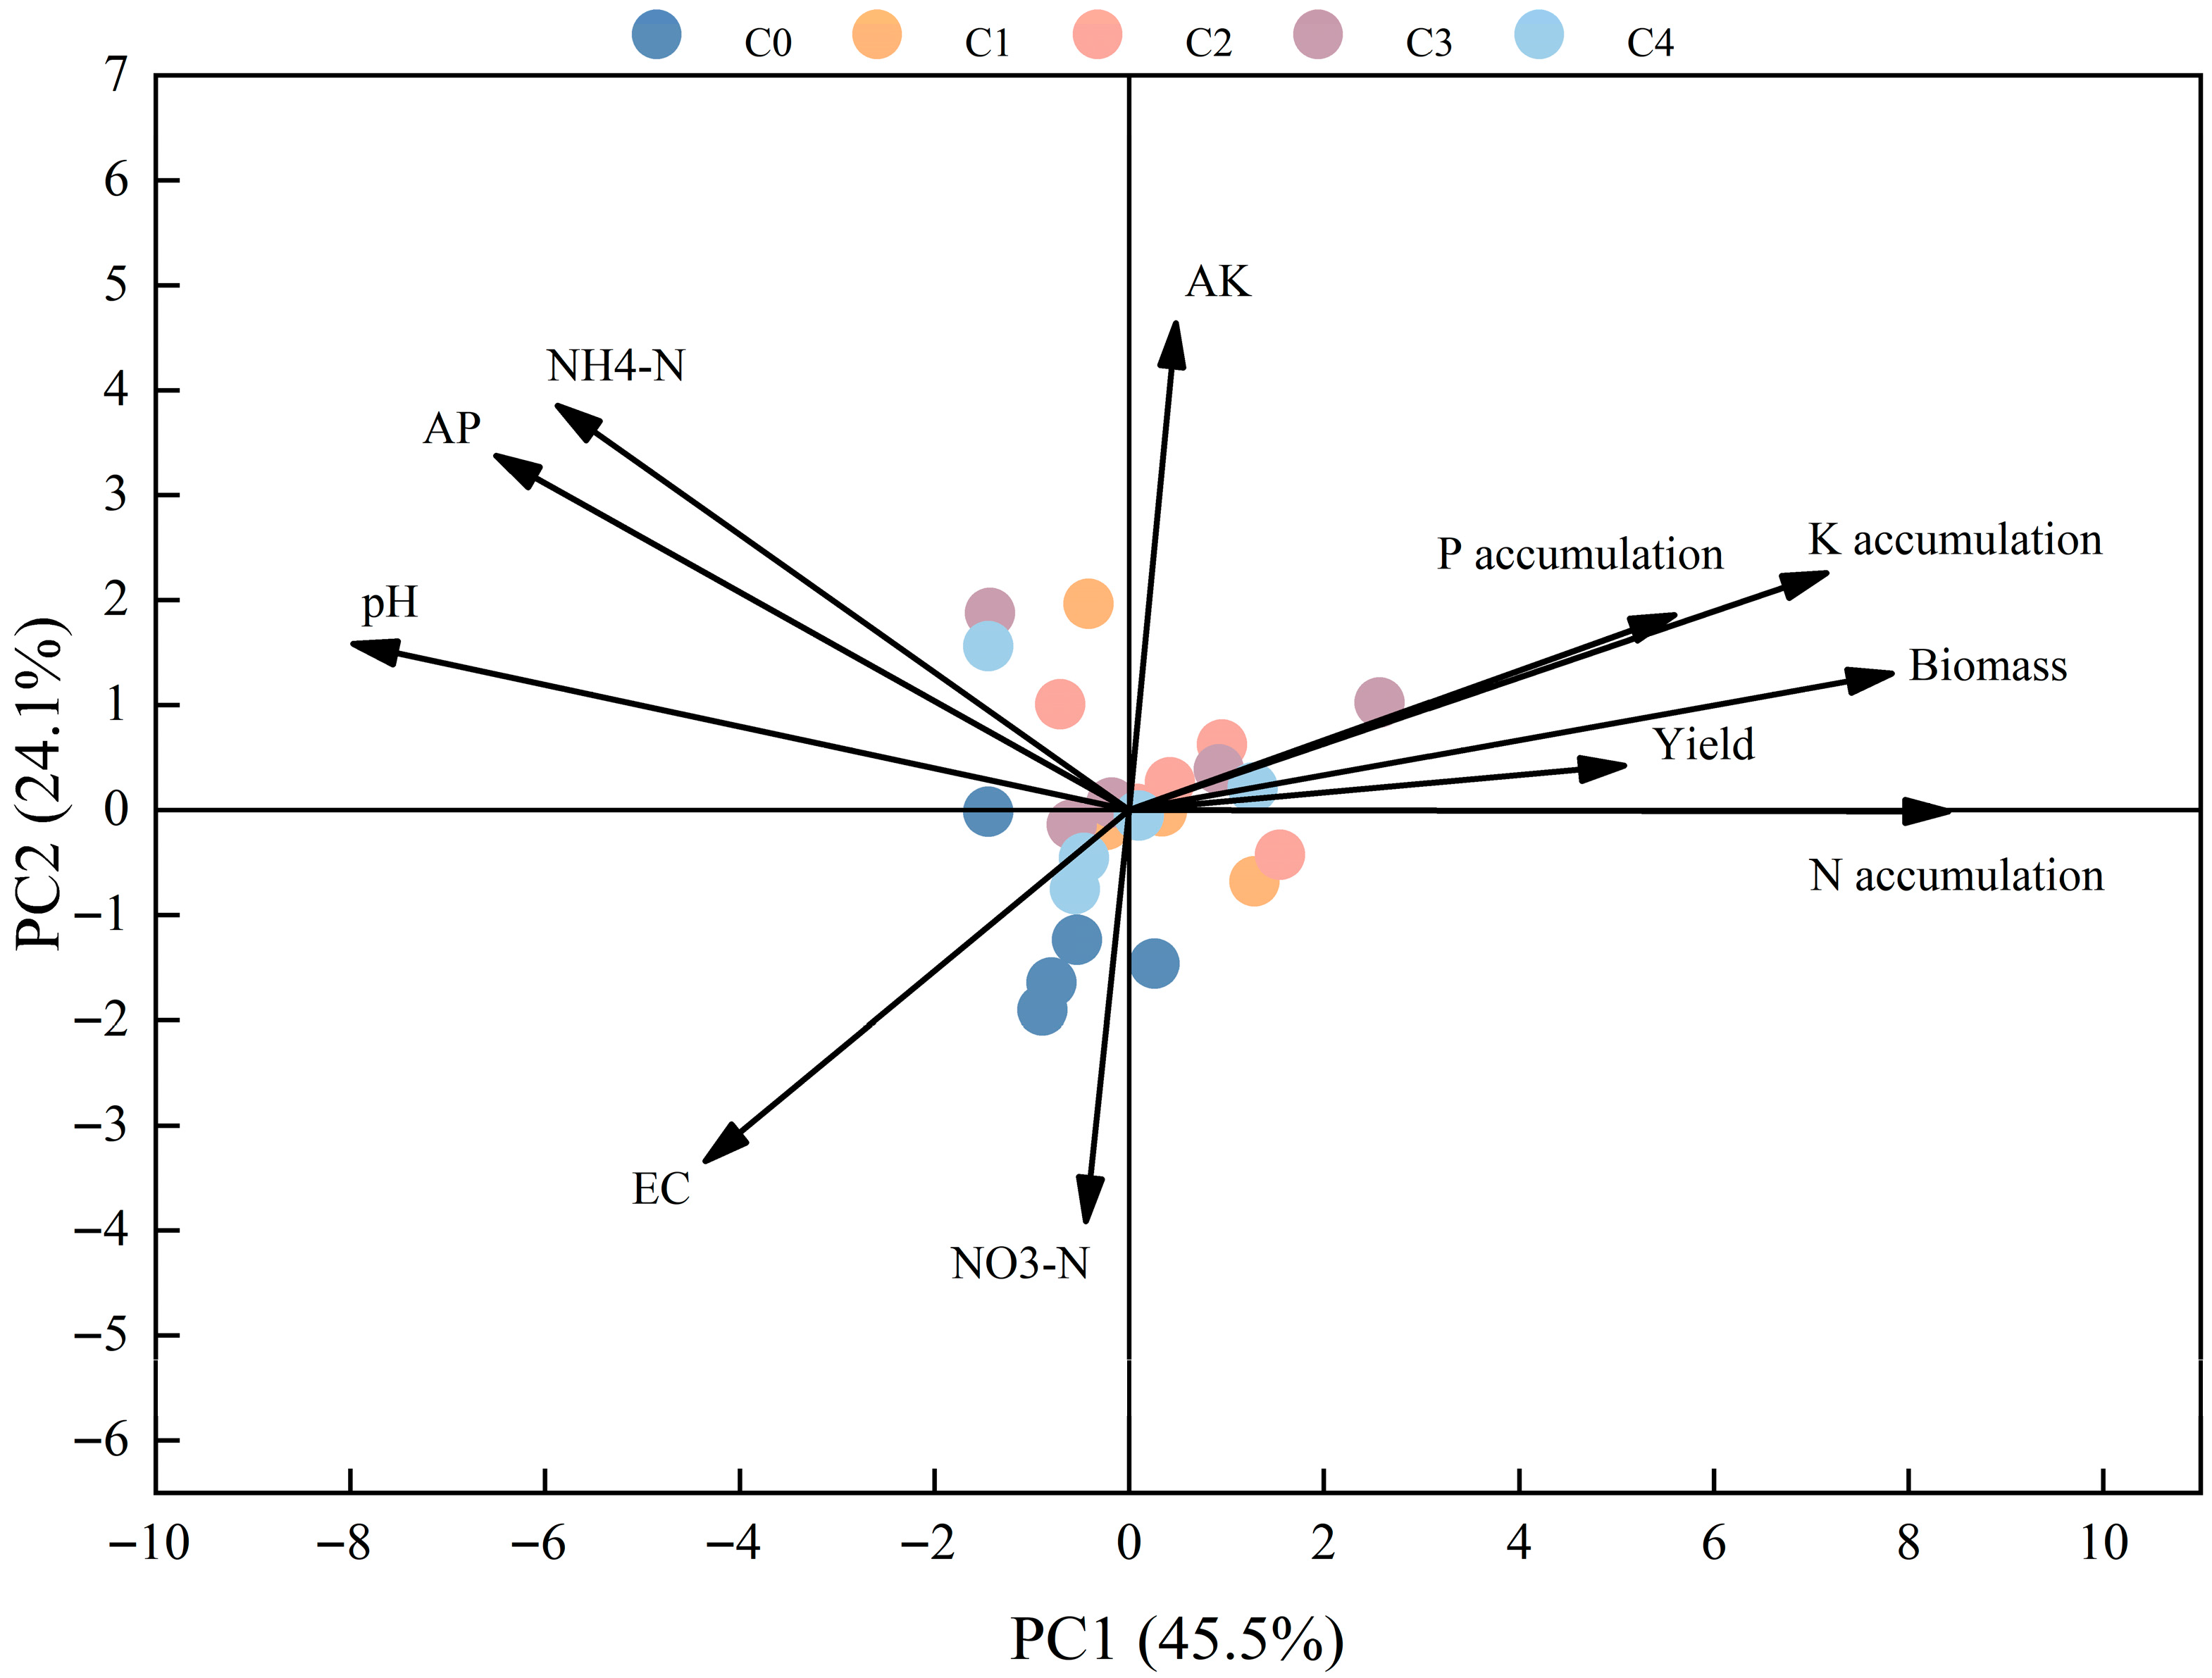
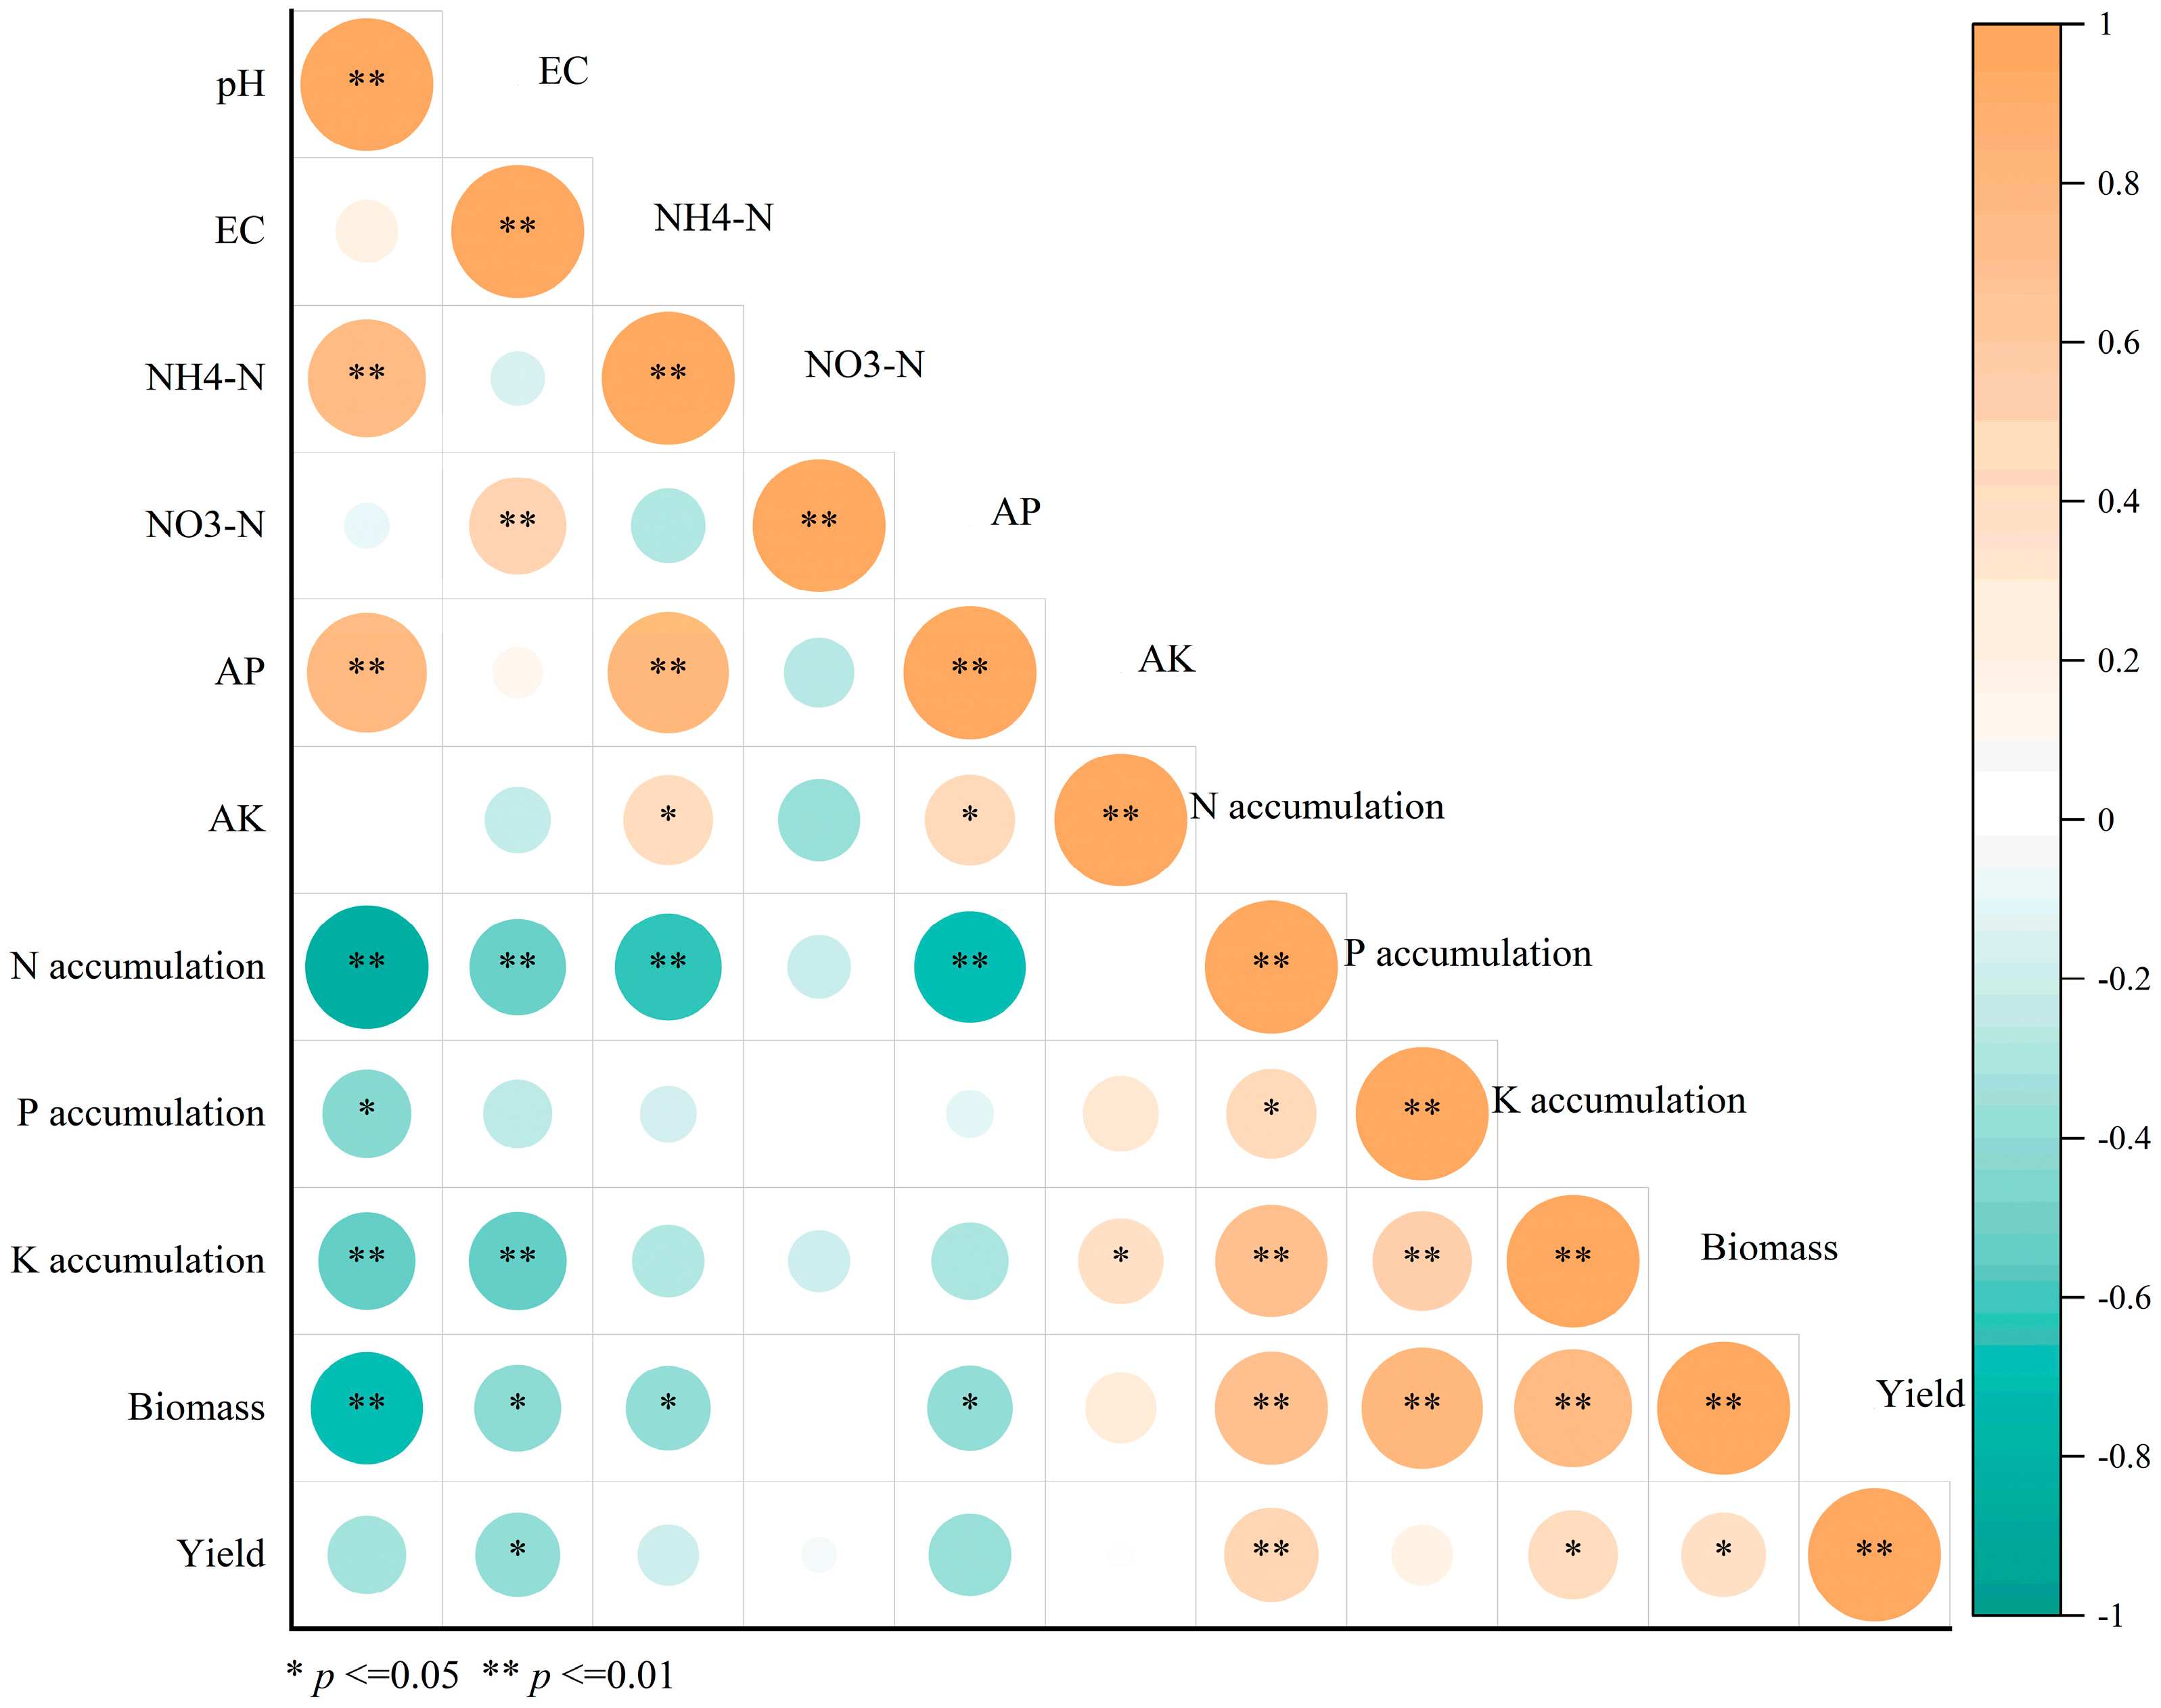
Principal component analysis revealed that the first two principal components collectively accounted for 69.6% of the total variance in the measured parameters (Figure 10). PC1 (45.5% of variance) exhibited strong positive loadings with soil available potassium, plant nutrient accumulation (N, P, K), biomass, and yield (p < 0.05), while showing negative correlations with soil pH, electrical conductivity, and nitrate nitrogen. This component primarily represented yield enhancement and quality improvement. PC2 (24.1% of variance) demonstrated negative associations with yield, electrical conductivity, and nitrate nitrogen, but positive correlations with other measured parameters. The non-CO2-treated control (C0) was distributed in the negative regions of both PC1 and PC2, while the CO2-treated plots occupied the positive regions. The distinct separation of the C2 treatment from the control in the PCA plot corresponds to its coordinated enhancement of yield-forming factors—specifically, nutrient accumulation, biomass, and available potassium. Subsequent correlation analysis quantified these relationships: yield correlated positively with plant nitrogen accumulation (p < 0.01), potassium uptake (p < 0.05), and biomass (p < 0.05), but negatively with soil electrical conductivity (p < 0.01) (Figure 11). These results demonstrate that CO2 enrichment through drip irrigation primarily boosts cotton yield by improving nutrient acquisition and soil conditions.

4. Discussion

4.1. Synergistic Mechanism of Root Zone Acidification-Driven Nutrient Activation

Our results demonstrate that CO2-enriched irrigation water triggers a sequential “acidification–dissolution–replacement–activation” cascade in the root zone, which synergistically enhances the availability of multiple nutrients. The primary reaction, CO2 hydration forming carbonic acid (CO2 + H2O ⇄ H2CO3 ⇄ H+ + HCO3), is the principal driver of soil pH reduction [22]. The liberated H+ ions promote the dissolution of native carbonates (CaCO3 + 2H+ → Ca2+ + H2O + CO2), a process that not only contributes to acidification but also releases Ca2+ ions. These released Ca2+ ions subsequently participate in cation exchange, effectively replacing Na+ from soil colloids. This exchange is a key mechanism for ameliorating sodic conditions, with studies reporting Na+ replacement efficiencies exceeding 65% and a reduction in exchangeable sodium percentage over repeated irrigation cycles [23,24]. The consequent removal of soluble salts through leaching explains the significant decrease we observed in soil electrical conductivity (EC), which is consistent with established models of salt displacement in arid soils.
The acidified and Ca2+-remodeled microenvironment likely contributes to the enhanced nutrient availability through several potential pathways: first, regarding nitrogen dynamics, the observed increase in NH4+-N concurrent with a decrease in NO3-N could indicate an alteration in microbial nitrogen cycling. This pattern is consistent with previous reports where elevated CO2 stimulated urease activity and urea hydrolysis while partially suppressing nitrification [25,26], although these specific microbial processes were not directly quantified in our study. Second, the increase in available phosphorus (AP) likely results from a combination of H+-mediated dissolution of calcium phosphate minerals and the synergistic action of root-exuded organic acids under acidic conditions [27,28]. Third, the significant boost in available potassium (AK) is likely attributable to a well-established geochemical process: the proton-accelerated weathering of K-bearing silicate minerals such as K-feldspar, which releases exchangeable K+ [29,30].
The concentration-dependent response underscores the existence of an optimal threshold. Our C2 treatment (0.08 kg·m−3) yielded the most balanced nutrient enhancements of NH4+-N by 36.1%, available P by 24.5%, and available K by 38.5%. In contrast, the inhibitory effects observed under the higher C4 concentration (0.16 kg·m−3) align with previous reports that excessive soil CO2 can negatively impact root respiration and microbial activity, thereby suppressing nutrient mineralization [31,32]. This non-linear dose–response relationship underscores the necessity of precise CO2 management to optimize fertigation outcomes. The environmental fate of the applied CO2 requires consideration: while the dissolved fraction drives rhizosphere acidification, the residual CO2 may either diffuse to the atmosphere or, under alkaline conditions, contribute to secondary carbonate precipitation. Quantifying these partitioning pathways—key for assessing net carbon sequestration—was beyond the scope of this study but represents a critical avenue for future research employing isotopic tracers (e.g., 13C). Regarding environmental safety, the yield suppression observed at the highest dose (C4) signals potential risks such as root zone hypoxia under excessive application. Crucially, the optimal treatment (C2) induced no detectable adverse effects, demonstrating that precision application can sustainably enhance crop productivity without compromising root zone environmental integrity in arid agroecosystems.

4.2. Organ-Specific Responses and Yield Compensation in Cotton Under CO2 Enrichment

Plant nutrient uptake is co-determined by soil nutrient availability and root activity [33]. In our study, the CO2-induced enhancement of nutrient release translated into distinct accumulation patterns of N, P, and K within cotton plants, exhibiting significant organ specificity and interannual variation. This differential partitioning reflects the tightly coupled carbon–nitrogen–water cycles within the soil–plant–atmosphere continuum (SPAC) and the plant’s inherent source–sink regulatory mechanisms [34]. The robust accumulation of nitrogen in the leaves and roots under C2 treatment indicates a strengthened “source” capacity and a reinforced root “sink” for N. The pronounced increase in potassium accumulation, particularly in the reproductive organs (squares and bolls), is critically important. Cotton has a high potassium demand, and potassium deficiency often leads to premature senescence, a major yield constraint [35,36]. The observed organ sensitivity order (squares/bolls > roots > stems > leaves) aligns with this physiological priority, confirming that CO2 enrichment optimizes nutrient partitioning to strengthen key sink organs [36,37].
Ultimately, cotton yield is primarily determined by boll number per plant and single boll weight [38]. CO2-mediated nutrient release supplied the essential resources for plant growth, and the elevated rhizosphere CO2 concurrently stimulated metabolic activity and sink strength in the developing bolls [39,40]. Yield compensation was thus achieved through a rebalancing of these yield components; the C2 treatment significantly increased the boll number per plant by 15.30%, demonstrating an effective enhancement of sink capacity. It is important to note that the absence of detailed water status data including soil moisture dynamics and evapotranspiration constitutes a limitation of this study, as water availability interacts deeply with both nutrient mobility and the plant response to CO2. Future investigations incorporating precise water management data are warranted to fully disentangle these interactions. Our results indicate that the yield response to CO2 fertigation is governed by multiple interacting factors. While this study elucidates key mechanisms of CO2-enhanced nutrient acquisition, several contextual factors merit further consideration to fully define the system boundaries. A primary unquantified variable is the interactive effect between irrigation management and CO2 efficacy, as concurrent monitoring of soil moisture and evapotranspiration was not conducted. Given that hydraulic regulation critically governs rhizospheric nutrient mobility and CO2 dissolution dynamics, this represents a significant scope for future refinement. Additionally, edaphic variables—including soil texture and organic matter content, which modulate gas diffusion and nutrient retention—along with site-specific climate fluctuations and management legacies, may further modulate treatment outcomes. To advance predictive understanding and operational synergy, subsequent research should implement integrated experimental frameworks that couple real-time hydro-pedological monitoring with controlled CO2 delivery. Such a holistic approach is essential to decode the complex interactions governing water–carbon–nutrient coupling and to translate mechanistic insight into scalable agronomic strategies for arid zone cropping systems.
Here, soil physicochemical parameters, nutrient availability, and plant nutrient accumulation constituted the principal drivers of yield. Among these, NH4+-N, NO3N, and exchangeable K exerted the strongest influence [41], with seed cotton output being linearly related to both soil nutrient supply and plant nutrient status [42,43], consistent with earlier findings. Because enzyme activities and microbial community responses were not monitored, the mechanistic role of soil biota in CO2-fertigated systems remains to be elucidated.

4.3. Industrial–Agricultural Integration Potential and Optimization Pathways for CO2 Drip Irrigation

The drip-fertigation of industrial CO2 establishes a synergistic industry–agriculture nexus, offering a dual pathway for emission valorization and agricultural intensification. To evaluate its scalability, we conducted a preliminary techno-economic analysis contextualized within China’s CCUS cost framework, where capture, transport, and geological storage average 19.7 ± 5.2, 15.4 ± 7.1, and 8.11 USD·t−1 CO2 [44]. Key assumptions include cotton price stability (2623.4 USD·t−1, 2023 level), reproducible field-scale yield responses, infrastructure amortized at 423.1USD·ha−1 over 5–10 years, and local industrial CO2 supplied at 19.8 USD·t−1 (application rate 0.36 t·ha−1).
Under these conditions, the optimum C2 treatment (0.08 kg·m−3) yielded a direct return of USD 937.9 per ton of CO2 applied—excluding soil carbon benefits—demonstrating that yield-driven revenue can largely offset capture and delivery costs at scale (Table 2).
Extrapolating these results to Xinjiang’s 2.45 million hectares of cotton (constituting 86.3% of China’s 2024 acreage) suggests the potential for considerable system-level economic benefits under static market assumptions. This projection highlights the transformative potential of CO2 fertigation while underscoring its conditional nature: real-world outcomes will require spatial adaptation and validation through expanded long-term trials that capture regional agronomic, environmental, and logistical heterogeneity.
Beyond economics, this technology transmutes an industrial waste stream into a functional “carbon fertilizer”, directly linking emission reduction to soil health and crop productivity. In alignment with other studies [45,46], our findings confirm that CO2-enriched irrigation mitigates saline-alkalinity, enhances crop yields, and may augment soil organic carbon stocks, thereby aligning agricultural productivity with climate change mitigation. Future development should prioritize several optimization pathways informed by our results: first, establishing precision CO2 application protocols, with our identified optimum of 0.08 kg·m−3 serving as a critical baseline for cotton in arid loam soils. Second, developing reliable carbon sequestration monitoring and verification methodologies to underpin agricultural carbon credit systems. Finally, creating cross-sectoral policy and financial incentives is essential to accelerate the transition from pilot demonstrations to standardized, large-scale, low-carbon agricultural practices. These advancements will be crucial for providing sustainable production solutions in Xinjiang’s cotton region and contributing to climate-resilient agriculture globally.

5. Conclusions

This study demonstrates that drip irrigation with CO2-enriched irrigation water effectively enhances the soil environment and promotes cotton growth in arid regions through a sequential cascade process characterized by “soil acidification–mineral dissolution–ion exchange–nutrient activation”. Specifically, CO2 application significantly reduced soil pH (by up to 0.3 units) and electrical conductivity (by up to 63.3%), with the C2 treatment (0.08 kg·m−3) exhibiting the most pronounced improvement—increasing soil ammonium nitrogen, available phosphorus, and available potassium by 31.65%, 16.3%, and 32.65%, respectively. These soil enhancements directly facilitated crop nutrient uptake, leading to significant increases in plant nitrogen, phosphorus, and potassium accumulation of 54.0%, 37.1%, and 72.9% (p < 0.05), respectively, a biomass increase of 30.22–31.8%, and a final yield improvement of 6.06%. This technology establishes an integrated industry–agriculture pathway that links industrial emission reduction with agricultural carbon sequestration and crop yield enhancement, thereby offering a practical and low-carbon solution for sustainable agricultural development in arid regions. Future research should focus on elucidating microbial-mediated nutrient transformation mechanisms, evaluating the long-term effects of CO2 application on soil carbon, nitrogen, and phosphorus cycles, and facilitating the large-scale implementation of this technology in Xinjiang’s saline-alkaline farmland, which will provide a scientific basis and practical framework for advancing global sustainable agriculture in arid zones.

Author Contributions

Y.W.: Writing—original draft, Conceptualization, Data curation, Writing—review and editing. H.R.: Software. X.Z.: Data curation. C.D.: Formal analysis and investigation. S.L.; Y.Y.: Validation, Formal analysis. Z.Z. and J.W.: Supervision, Funding acquisition, Writing—review and editing. All authors have read and agreed to the published version of the manuscript.

Funding

This work was supported by the Xinjiang Production and Construction Corps Major Science and Technology Program, grant number (2023AB017) and the Tianshan Talent Program of Xinjiang province (2023TSYCLJ0047).

Institutional Review Board Statement

Ethical review and approval were waived for this study because it did not involve human or animal subjects.

Data Availability Statement

The raw data supporting the conclusions of this article will be made available by the authors on request.

Acknowledgments

The authors extend their gratitude to all individuals and institutions whose contributions supported this research but are not formally listed in the author contributions or funding sections. During the preparation of this manuscript, the reference formatting was managed using NoteExpress. The authors have thoroughly reviewed and refined all content and assume full responsibility for the final publication.

Conflicts of Interest

The authors declare no conflicts of interest.

Abbreviations

The following abbreviations are used in this manuscript:
FSSFull squaring stage
FBLSFull blooming stage
FBOSFull boll-opening stage
FMSFull maturity stage
NH4+-NAmmonium nitrogen
NO3-NNitrate nitrogen
APAvailable phosphorus
AKAvailable potassium

References

  1. Ipcc IPOC. Climate Change 2022; Mitigation of Climate Change; Cambridge University Press: Cambridge, UK, 2022. [Google Scholar]
  2. Cordonnier, J.S.D. Financing Solutions to Foster Industrial Decarbonisation in Emerging and Developing Economies (EN); OECD Environment Working Papers: Paris, France, 2023; ENV/WKP(2023)18. [Google Scholar] [CrossRef] [Scilit]
  3. Dong, Y.; Yang, J.; Zhao, X.; Yang, S.; Mulder, J.; Dörsch, P.; Zhang, G. Seasonal dynamics of soil ph and n transformation as affected by n fertilization in subtropical china: An in situ 15n labeling study. Sci. Total Environ. 2022, 816, 151596. [Google Scholar] [CrossRef] [Scilit]
  4. Alekseeva, T.; Alekseev, A.; Xu, R.; Zhao, A.; Kalinin, P. Effect of soil acidification induced by a tea plantation on chemical and mineralogical properties of alfisols in eastern china. Environ. Geochem. Health 2011, 33, 137–148. [Google Scholar] [CrossRef] [Scilit]
  5. Cambron, T.W.; Fisher, J.B.; Hungate, B.A.; Stocker, B.D.; Keenan, T.; Prentice, I.C.; Terrer, C. Plant nutrient acquisition under elevated CO2 and implications for the land carbon sink. Nat. Clim. Change 2025, 15, 935–946. [Google Scholar] [CrossRef] [Scilit]
  6. Ryan, P.R.; Delhaize, E.; Jones, D.L. Function and mechanism of organic anion exudation from plant roots. Annu. Rev. Plant Physiol. Plant Mol. Biology 2001, 52, 527–560. [Google Scholar] [CrossRef] [Scilit]
  7. Lynch, J.P.; Wojciechowski, T. Opportunities and challenges in the subsoil: Pathways to deeper rooted crops. J. Exp. Bot. 2015, 66, 2199–2210. [Google Scholar] [CrossRef] [Scilit]
  8. Liang, Y.; Liu, J.; Jin, J.; Han, Y.; Wei, Z. Effects of low-molecular-weight organic acids on the transformation and phosphate retention of iron (hydr)oxides. Sci. Total Environ. 2024, 940, 173667. [Google Scholar] [CrossRef] [Scilit]
  9. Wang, Z.; Wang, C.; Liu, S. Elevated CO2 alleviates adverse effects of drought on plant water relations and photosynthesis: A global meta-analysis. J. Ecol. 2022, 110, 2836–2849. [Google Scholar] [CrossRef] [Scilit]
  10. Ochoa-Hueso, R.; Hughes, J.; Delgado-Baquerizo, M.; Drake, J.E.; Tjoelker, M.G.; Piñeiro, J.; Power, S.A. Rhizosphere-driven increase in nitrogen and phosphorus availability under elevated atmospheric CO2 in a mature eucalyptus woodland. Plant Soil 2017, 416, 283–295. [Google Scholar] [CrossRef] [Scilit]
  11. Reddy, K.R.; Robana, R.R.; Hodges, H.F.; Liu, X.J.; Mckinion, J.M. Interactions of CO2 enrichment and temperature on cotton growth and leaf characteristics. Environ. Exp. Bot. 1998, 39, 117–129. [Google Scholar] [CrossRef] [Scilit]
  12. Tischler, C.R.; Polley, H.W.; Johnson, H.B.; Pennington, R.E. Seedling response to elevated CO2 in five epigeal species. Int. J. Plant Sci. 2000, 161, 779–783. [Google Scholar] [CrossRef] [Scilit]
  13. Tagami, K.; Uchida, S. Fundamental study on measurement of soil ph and electrical conductivity in batch tests for the determination of soil—Soil solution distribution coefficient. Nucl. Eng. Technol. 2025, 57, 9. [Google Scholar] [CrossRef] [Scilit]
  14. Chen, C.; Zhu, H.; Lv, Q.; Tang, Q. Impact of biochar on red paddy soil physical and hydraulic properties and rice yield over 3 years. J. Soils Sediments 2022, 22, 607–616. [Google Scholar] [CrossRef] [Scilit]
  15. Chi, Z.; Li, Y.; Zhang, J.; Hu, M.; Wu, Y.; Fan, X.; Li, Z.; Miao, Q.; Li, W. Effects of nitrogen application on ammonium assimilation and microenvironment in the rhizosphere of drip-irrigated sunflower under plastic mulch. Front. Microbiol. 2024, 15, 13. [Google Scholar] [CrossRef] [Scilit]
  16. Chaves, E.S.; Santos, E.J.D.; Araujo, R.G.O.; Oliveira, J.V.; Frescura, V.L.A.; Curtius, A.J. Metals and phosphorus determination in vegetable seeds used in the production of biodiesel by ICP OES and ICP-MS. Microchem. J. 2010, 96, 71–76. [Google Scholar] [CrossRef] [Scilit]
  17. Hafsi, C.; Falleh, H.; Saada, M.; Rabhi, M.; Mkadmini, K.; Ksouri, R.; Abdelly, C.; Smaoui, A. Effects of potassium supply on growth, gas exchange, phenolic composition, and related antioxidant properties in the forage legume sulla carnosa. Flora 2016, 223, 38–45. [Google Scholar] [CrossRef] [Scilit]
  18. Jeong, Y.; Seo, B.; Baek, N.; Kwak, J.; Lee, S.; Park, H.; Choi, W. Methods for the determination of stable isotope ratios of multiple nitrogen species in rainwater using distillation and evaporation. Front. Environ. Sci. 2022, 10, 11. [Google Scholar] [CrossRef] [Scilit]
  19. Pettigrew, W.T. Potassium influences on yield and quality production for maize, wheat, soybean and cotton. Physiol. Plant 2008, 133, 670–681. [Google Scholar] [CrossRef] [Scilit] [PubMed]
  20. Zhi, X.Y.; Han, Y.C.; Li, Y.B.; Wang, G.P.; Du, W.L.; Li, X.X.; Mao, S.C.; Feng, L. Effects of plant density on cotton yield components and quality. J. Integr. Agric. 2016, 15, 1469–1479. [Google Scholar] [CrossRef] [Scilit]
  21. Wang, B.; Li, R.; Wan, Y.; Li, Y.; Cai, W.; Guo, C.; Qin, X.; Song, C.; Wilkes, A. Air warming and CO2 enrichment cause more ammonia volatilization from rice paddies: An OTC field study. Sci. Total Environ. 2021, 752, 7. [Google Scholar] [CrossRef] [Scilit]
  22. Sparks, D.L. Elucidating the fundamental chemistry of soils: Past and recent achievements and future frontiers. Geoderma 2001, 100, 303–319. [Google Scholar] [CrossRef] [Scilit]
  23. Ahmad, W.; Singh, B.; Dalal, R.C.; Dijkstra, F.A. Carbon dynamics from carbonate dissolution in australian agricultural soils. Soil Res. 2015, 53, 144–153. [Google Scholar] [CrossRef] [Scilit]
  24. Jewell, S.; Zhou, X.; Apple, M.E.; Dobeck, L.M.; Spangler, L.H.; Cunningham, A.B. Bulk electric conductivity response to soil and rock CO2 concentration during controlled CO2 release experiments: Observations and analytic modeling. Geophysics 2015, 80, E293–E308. [Google Scholar] [CrossRef] [Scilit]
  25. Gorissen, A.; Cotrufo, M.F. Decomposition of leaf and root tissue of three perennial grass species grown at two levels of atmospheric CO2 and n supply. Plant Soil 2000, 224, 75–84. [Google Scholar] [CrossRef] [Scilit]
  26. Yang, X.Y.; Sun, B.H.; Zhang, S.L. Trends of yield and soil fertility in a long-term wheat-maize system. J. Integr. Agric. 2014, 13, 402–414. [Google Scholar] [CrossRef] [Scilit]
  27. Qi, H.; Liu, Y.; Wang, H.; Kuang, X.; Putra, A.N.; Jiao, J.J.; Gan, J. Carbonate weathering enhances nitrogen assimilatory uptake in rivers globally. Nat. Geosci. 2025, 18, 20. [Google Scholar] [CrossRef] [Scilit]
  28. Zhang, Z.; Xie, D.; Teng, W.; Gu, F.; Zhang, R.; Cheng, K.; Liu, Z.; Zhao, Y.; Yang, F. A state of art review on carbon, nitrogen, and phosphorus cycling and efficient utilization in paddy fields. Plant Soil 2025, 513, 1689–1709. [Google Scholar] [CrossRef] [Scilit]
  29. Kirk, G.J.D.; Boghi, A.; Affholder, M.; Keyes, S.D.; Heppell, J.; Roose, T. Soil carbon dioxide venting through rice roots. Plant Cell Environ. 2019, 42, 3197–3207. [Google Scholar] [CrossRef] [Scilit]
  30. Najafi-Ghiri, M.; Niazi, M.; Khodabakhshi, M.; Boostani, H.R.; Owliaie, H.R. Mechanisms of potassium release from calcareous soils to different salt, organic acid and inorganic acid solutions. Soil Res. 2019, 57, 301–309. [Google Scholar] [CrossRef] [Scilit]
  31. Billings, S.A.; Schaeffer, S.M.; Zitzer, S.; Charlet, T.; Smith, S.D.; Evans, R.D. Alterations of nitrogen dynamics under elevated carbon dioxide in an intact mojave desert ecosystem: Evidence from nitrogen—15 natural abundance. Oecologia 2002, 131, 463–467. [Google Scholar] [CrossRef] [Scilit]
  32. Jiang, D.; Chen, L.; Xia, N.; Norgbey, E.; Koomson, D.A.; Darkwah, W.K. Elevated atmospheric CO2 impact on carbon and nitrogen transformations and microbial community in replicated wetland. Ecol. Process. 2020, 9, 12. [Google Scholar] [CrossRef] [Scilit]
  33. Hinsinger, P.; Betencourt, E.; Bernard, L.; Brauman, A.; Plassard, C.; Shen, J.; Tang, X.; Zhang, F. P for two, sharing a scarce resource: Soil phosphorus acquisition in the rhizosphere of intercropped species. Plant Physiol. 2011, 156, 1078–1086. [Google Scholar] [CrossRef] [Scilit]
  34. Wassen, M.J.; de Boer, H.J.; Fleischer, K.; Rebel, K.T.; Dekker, S.C. Vegetation-mediated feedback in water, carbon, nitrogen and phosphorus cycles. Landsc. Ecol. 2013, 28, 599–614. [Google Scholar] [CrossRef] [Scilit]
  35. Zhang, L.; Jia, L.; He, L.; Lipson, D.A.; Wang, Y.; Wang, S.; Xu, X. Homeostatic evidence of management-induced phosphorus decoupling from soil microbial carbon and nitrogen metabolism. J. Plant Ecol. 2023, 16, 12. [Google Scholar] [CrossRef] [Scilit]
  36. Yan, L.; Gao, G.; Lu, M.; Riaz, M.; Zhang, M.; Tong, K.; Yu, H.; Yang, Y.; Hao, W.; Niu, Y. Insight into the amelioration effect of nitric acid-modified biochar on saline soil physicochemical properties and plant growth. Plants 2024, 13, 15. [Google Scholar] [CrossRef] [Scilit] [PubMed]
  37. Fakhar, A.; Galgo, S.J.C.; Canatoy, R.C.; Rafique, M.; Sarfraz, R.; Farooque, A.A.; Khan, M.I. Advancing modified biochar for sustainable agriculture: A comprehensive review on characterization, analysis, and soil performance. Biochar 2025, 7, 25. [Google Scholar] [CrossRef] [Scilit]
  38. Constable, G.A.; Bange, M.P. The yield potential of cotton (Gossypium hirsutum L.). Field Crops Res. 2015, 182, 98–106. [Google Scholar] [CrossRef] [Scilit]
  39. Zhao, D.L.; Oosterhuis, D.M.; Bednarz, C.W. Influence of potassium deficiency on photosynthesis, chlorophyll content, and chloroplast ultrastructure of cotton plants. Photosynthetica 2001, 39, 103–109. [Google Scholar] [CrossRef] [Scilit]
  40. Singh, J.; Gamble, A.; Brown, S.; Campbell, B.T.; Jenkins, J.; Koebernick, J.; Iii, P.C.B.; Sanz-Saez, A. 65 years of cotton lint yield progress in the USA: Uncovering key influential yield components. Field Crops Res. 2023, 302, 10. [Google Scholar] [CrossRef] [Scilit]
  41. Lyu, N.; Shi, L.; Sun, L.; Liu, F.; Chen, Y.; Yin, F. Interactive effects of elevated CO2 concentration and nitrogen fertilizer application on nitrogen distribution in a cotton-soil system. Appl. Ecol. Envrion. Res. 2020, 18, 4857–4872. [Google Scholar] [CrossRef] [Scilit]
  42. Zhang, G.; Sakai, H.; Tokida, T.; Usui, Y.; Zhu, C.; Nakamura, H.; Yoshimoto, M.; Fukuoka, M.; Kobayashi, K.; Hasegawa, T. The effects of free-air CO2 enrichment (FACE) on carbon and nitrogen accumulation in grains of rice (Oryza sativa L.). J. Exp. Bot. 2013, 64, 3179–3188. [Google Scholar] [CrossRef] [Scilit] [PubMed]
  43. Wang, N.; Zhan, J.; Feng, K.; Qi, J.; Nan, H. Higher yield sustainability and soil quality by reducing chemical fertilizer with organic fertilizer application under a single-cotton cropping system. Front. Plant Sci. 2024, 15, 11. [Google Scholar] [CrossRef] [Scilit]
  44. Zhao, X.; Xiao, J.; Hou, J.; Wu, J.; Lü, X.; Zhang, J.; Liu, Y. Economic and scale prediction of CO2 capture, utilization and storage technologies in China. Pet. Explor. Dev. 2023, 50, 657–668. [Google Scholar] [CrossRef] [Scilit]
  45. Lyu, J.; Liu, H.; Wang, X.; Olave, R.; Tian, C.; Liu, X. Crop yields and soil organic carbon dynamics in a long-term fertilization experiment in an extremely arid region of northern xinjiang, china. J. Arid. Land 2017, 9, 345–354. [Google Scholar] [CrossRef] [Scilit]
  46. Chen, X.; Xi, K.; Yang, Z.; Lu, J.; Zhang, Q.; Wang, B.; Wang, K.; Shi, J. Long-term increases in continuous cotton yield and soil fertility following the application of cotton straw and organic manure. Agronomy 2023, 13, 2133. [Google Scholar] [CrossRef] [Scilit]
Figure 1. Schematic diagram of the cotton planting pattern and drip irrigation system layout.
Agriculture 16 00238 g001
Figure 2. Schematic and field installation of the CO2-enriched irrigation system. CO2 cylinder; pressure-reducing valve; flow meter; micro-bubble generator; plot-level inlet; tank outlet; water return pipe. Arrows indicate the direction of CO2-enriched water flow.
Agriculture 16 00238 g002
Figure 3. Response of soil pH to CO2-enriched irrigation water concentrations across soil depths during the cotton growing seasons of 2023 and 2024. Soil pH was measured at 0–20 cm, 20–40 cm, and 40–60 cm depths under five concentrations of CO2-enriched irrigation water: C0 (0.00), C1 (0.04), C2 (0.08), C3 (0.12), and C4 (0.16 kg·m−3). Data are presented as box plots (n = 3 field replicates × 4 growth stages per treatment). The box represents the interquartile range (IQR, 25th–75th percentile), the internal line indicates the median, whiskers extend to values within 1.5 × IQR, and points denote individual observations. Different lowercase letters above boxes indicate significant differences among treatments within the same soil depth and year (p < 0.05, Tukey’s HSD test). Results for 2023 are shown in the left panels (a,c,e), and corresponding results for 2024 are presented in the right panels (b,d,f).
Agriculture 16 00238 g003
Figure 4. Soil electrical conductivity (EC, mean ± standard deviation, n = 3 replicates) at 0–20 cm, 20–40 cm, and 40–60 cm depths under five CO2-enriched irrigation water concentrations (C0–C4: 0.00, 0.04, 0.08, 0.12, 0.16 kg·m−3) during the 2023 and 2024 cotton growing seasons. FSS = full squaring stage; FBLS = full blooming stage; FBOS = full boll-opening stage; FMS = full maturity stage. Different lowercase letters above bars denote significant differences among treatments within the same depth and growth stage (p < 0.05, Tukey’s HSD).
Agriculture 16 00238 g004
Figure 5. Soil ammonium nitrogen (NH4+-N) at 0–20 cm, 20–40 cm, and 40–60 cm depths under five CO2-enriched irrigation water concentrations. Data from the 2023 and 2024 cotton growing seasons are shown in the left (a,c,e) and right (b,d,f) panels, respectively. For abbreviations and treatment details, see Figure 3 and Figure 4.
Agriculture 16 00238 g005
Figure 6. Soil nitrate nitrogen (NO3-N) at 0–20 cm, 20–40 cm, and 40–60 cm depths under five CO2-enriched irrigation water concentrations. Data from the 2023 and 2024 cotton growing seasons are shown in the left (a,c,e) and right (b,d,f) panels, respectively. For abbreviations and treatment details, see Figure 3 and Figure 4.
Agriculture 16 00238 g006
Figure 7. Soil available phosphorus (AP) at 0–20 cm, 20–40 cm, and 40–60 cm depths under five CO2-enriched irrigation water concentrations. Data from the 2023 and 2024 cotton growing seasons are shown in the left (a,c,e) and right (b,d,f) panels, respectively. For abbreviations and treatment details, see Figure 3 and Figure 4.
Agriculture 16 00238 g007
Figure 8. Soil readily available potassium (AK) at 0–20 cm, 20–40 cm, and 40–60 cm depths under five CO2-enriched irrigation water concentrations. Data from the 2023 and 2024 cotton growing seasons are shown in the left (a,c,e) and right (b,d,f) panels, respectively. For abbreviations and treatment details, see Figure 3 and Figure 4.
Agriculture 16 00238 g008
Figure 9. (a) Accumulation of nitrogen (N), (b) phosphorus (P), and (c) potassium (K) in different cotton organs (root, stem, leaf, bract, flower) under five concentrations of CO2-enriched irrigation water during the 2023 and 2024 growing seasons. Data are presented as mean ± standard error (n = 3). Different lowercase letters above bars within the same plant organ and year indicate significant differences among treatments (p < 0.05, Tukey’s HSD test). Abbreviations and treatment details are consistent with Figure 3 and Figure 4.
Agriculture 16 00238 g009
Figure 10. Principal component analysis (PCA) of soil chemical properties (pH, EC, NH4+-N, NO3-N, available P, and available K), plant nutrient (N, P, K) accumulation, and cotton yield components under five concentrations of CO2-enriched irrigation water (C0–C4) during the 2023 and 2024 growing seasons. The first two principal components cumulatively explained 69.6% of the total variation. Treatment abbreviations follow those defined in Figure 3.
Agriculture 16 00238 g010
Figure 11. Correlation heatmap between soil chemical properties (pH, EC, NH4+-N, NO3-N, available P, readily available K) and cotton growth indicators (N/P/K accumulation, biomass, yield) under five CO2-enriched irrigation water concentrations (C0–C4) in 2023 and 2024. Color intensity reflects the magnitude of Pearson correlation coefficients; asterisks indicate significance levels: * p ≤ 0.05, ** p ≤ 0.01 (two-tailed test).
Agriculture 16 00238 g011
Table 1. Effects of CO2-enriched irrigation water on cotton biomass, yield components, and seed cotton yield.
TimeTreatmentTotal Biomass (g)Single Boll Weight (g)Number of Bolls Per PlantSeed Cotton Yield (kg·ha−1)
2023C072.50 ± 2.77 d4.24 ± 0.42 a5.23 ± 1.11 b5692.50 ± 69.00 b
C189.34 ± 0.47 b4.11 ± 0.63 a5.59 ± 0.22 b5758.5 ± 139.5 ab
C294.41 ± 1.56 a3.93 ± 0.34 b6.03 ± 0.37 a6037.50 ± 69.00 a
C396.8 ± 1.02 a3.98 ± 0.42 b5.06 ± 0.26 b5013.00 ± 118.50 c
C478.54 ± 1.46 c4.30 ± 0.31 a4.99 ± 0.23 b5406.00 ± 60.00 b
2024C069.97 ± 2.74 c3.93 ± 0.04 a7.10 ± 0.24 c6168.00 ± 24.15 c
C186.30 ± 2.64 a3.71 ± 0.06 bc6.83 ± 0.10 d6062.40 ± 13.35 d
C292.22 ± 6.01 a3.82 ± 0.06 ab7.37 ± 0.11 b6520.35 ± 24.00 a
C376.44 ± 1.35 b3.79 ± 0.06 b7.25 ± 0.11 bc6402.90 ± 71.55 b
C473.21 ± 1.07 bc3.67 ± 0.07 c7.82 ± 0.09 a6371.10 ± 86.55 b
Note: Data are presented as mean ± standard deviation (n = 3). Different lowercase letters indicate significant differences among treatments at p < 0.05. See Figure 3 for abbreviations and treatment details.
Table 2. Economic benefit forecast of CCUS and industrial CO2 utilization technologies.
Category/ProcessCarbon CaptureCarbon TransportCarbon Storage (Net Input)Carbon UtilizationOther Expenses
CCUS19.7 ± 5.215.4 ± 7.18.1 ± 6.3−3.4 ± 63.40
CO2 Drip Application19.7 ± 5.211.3 ± 7.10−929.1 ± 47.2176.4 ± 117.5
Cost Difference04.18.1 ± 6.3−925.7 ± 16.2−176.4 ± 117.5
Total Benefit Value937.9 ± −9.9
Note: CCUS: carbon capture, utilization, and storage; (USD·t−1): cost per ton of CO2 for capture/transport/storage/utilization/other expenses in United States dollar; (−) indicates net revenue.
Disclaimer/Publisher’s Note: The statements, opinions and data contained in all publications are solely those of the individual author(s) and contributor(s) and not of MDPI and/or the editor(s). MDPI and/or the editor(s) disclaim responsibility for any injury to people or property resulting from any ideas, methods, instructions or products referred to in the content.