Article

Effects of Different Chemical Thinning Strategies on Yield Performance, Fruit Quality, and Multivariate Responses in Intensive Apple Production
1
Institute of Horticulture, Faculty of Agricultural and Food Sciences and Environmental Management, University of Debrecen, Böszörményi Str. 138, 4032 Debrecen, Hungary
2
Fruittamas Ltd., Debrecen, 4026 Debrecen, Hungary
3
Plant Protection Institute, HUN-REN Centre for Agricultural Sciences, Fehérvári Street 132-144, 1116 Budapest, Hungary
*
Author to whom correspondence should be addressed.
Agriculture 2026, 16(18), 1998; https://doi.org/10.3390/agriculture16181998 (registering DOI)
Submission received: 11 August 2026 / Revised: 12 September 2026 / Accepted: 15 September 2026 / Published: 17 September 2026

Abstract

Optimizing crop load through chemical thinning is essential for yield stability and fruit quality in intensive apple production, yet the relationships between tree growth, yield components, and fruit quality remain insufficiently characterized. This three-year study (2022–2024) evaluated four thinning strategies (control, ammonium thiosulfate [ATS]+ethephon, benzyladenine [BA]+ethephon, and ATS+BA+ethephon) across parameters of the apple cv. ‘Gala Schniga Schnitzer’: trunk cross-sectional area (TCSA), fruit yield (Y), fruit number per tree (FNT), crop load-number (CLnm), crop load-kg (CLkg), fruit size (FS), fruit weight (FW), water-soluble solids content (SSC), and fruit firmness (FF). Chemical thinning and year significantly but differentially affected yield components and fruit quality traits. In the ATS+BA+ethephon treatment, FS in 2023, FW in 2023 and 2024, and Y in 2024 significantly exceeded the control treatment in the respective years. Correlation analysis revealed strong positive relationships between FNT–Y, CLnm–CLkg, and FW–FS, with the strongest association observed between FW and FS (r = 0.98 in 2022 and 2023). Regression analyses confirmed significant linear relationships between FW–FS, FNT–Y, and CLnm–CLkg across thinning treatments. PCA explained 66.93, 54.89, and 50.91% of total variance by PC1 and PC2 in 2022–2024, respectively, with FS and FW showing the longest vectors in all years. The PCA structure varied among years, reflecting differences in the relative contributions of yield, crop load, tree growth, and fruit quality traits. Overall, chemical thinning should be considered not merely for reducing fruit number, but for regulating crop load and balancing productivity and fruit development, with effects varying by trait and year.

1. Introduction

Excessive fruit set can disrupt the balance between source capacity and reproductive sinks, increasing competition among developing fruits for assimilates. Consequently, excessive crop loads often result in reduced fruit size, lower accumulation of flavor-related compounds, poor coloration, delayed maturation, and impaired return bloom in the following season [1,2,3,4,5,6,7,8,9,10]. Therefore, timely thinning of surplus fruitlets is essential for maintaining balanced yield performance and fruit quality. Early thinning has been shown to improve fruit size and quality by increasing flesh firmness and sugar content, while also promoting fruit coloration and advancing ripening [11,12,13,14,15,16,17].
Fruit thinning can be achieved through mechanical or chemical approaches, with chemical thinning being widely used in intensive apple production due to its effectiveness and flexibility. The timing and efficacy of chemical thinning are strongly influenced by cultivar characteristics, phenological stage, environmental conditions, and the applied compound. Properly timed thinning interventions can improve fruit size, enhance firmness and soluble solids content, promote better fruit coloration, and contribute to more balanced yield performance [12,13,14,15,16,17].
For chemical thinning, various substances may be used, such as ammonium thiosulfate (ATS), 6-benzyladenine (BA), ethylene, or metamitrone in apple production. Each of them should be applied under determined fruit size and weather conditions [18,19]. ATS is applied as an aqueous solution at different concentrations and has a burning effect through the reduction of water within the pollen tube until it is well developed enough to fertilize the ovule. In the case of unopened or already fertilized flowers, ATS has no effect. The thinning response and the risk of phytotoxic effects, particularly injury to spur leaves, are strongly influenced by cultivar sensitivity, application timing, concentration, and weather conditions [6,20,21,22]. Depending on flowering conditions, ATS may be applied once or twice during bloom, and its effect can be supplemented by subsequent applications of ethylene or other thinning agents during the growing season. Properly applied ATS reduces the fruit number per cluster, promotes optimal fruit size, improves flesh firmness and other quality attributes, enhances coloration, and contributes to more balanced yield performance in subsequent seasons.
The application of BA is based on its ability to temporarily reduce photosynthetic activity for approximately seven days after treatment, thereby limiting assimilate availability for developing fruitlets during a critical period of fruit development. At the same time, BA promotes the growth of the most advanced fruitlets, which subsequently increase auxin production and further restrict the development of weaker fruitlets within the cluster. This enhanced developmental differentiation stimulates ethylene production in smaller fruitlets, ultimately promoting their abscission during the June fruit drop period [17,23,24,25,26]. Consequently, a greater difference in developmental status among fruitlets within a cluster generally results in more effective thinning responses. The efficacy of BA application is strongly influenced by environmental conditions, with optimal responses typically achieved at temperatures between 18 and 25 °C and under dry leaf surface conditions. At the recommended fruitlet size of 8–12 mm, BA applications may reduce fruit number by up to approximately 20% [27,28,29,30].
Combined applications of ATS and BA may provide more consistent crop load regulation than single-agent treatments by targeting different stages of fruit development. While ATS primarily reduces fruit set during bloom, BA regulates fruitlet competition after bloom, enabling a more precise adjustment of final fruit number. Such complementary effects may improve fruit size, quality attributes, and return bloom, while reducing variability caused by unfavorable application conditions [6,26,31,32,33,34,35,36,37].
Although the physiological consequences of chemical thinning in apple production have been extensively investigated, studies that simultaneously integrate vegetative growth responses, yield formation, and fruit quality attributes using multivariate approaches remain scarce, particularly under intensive orchard management conditions. Such approaches are essential for revealing complex trait interactions that cannot be captured by single-trait analyses. Accordingly, this study addresses two main research questions: (i) how do ATS+ethephon, BA+ethephon, and their combined application affect vegetative growth, crop load, yield, and fruit quality across contrasting growing seasons? (ii) Do these yearly thinning strategies modify the relationships among these traits, resulting in distinct integrated response patterns? We hypothesized that thinning treatments would modify the balance between vegetative growth, crop load, yield, and fruit quality, with responses varying among traits and growing seasons. We further hypothesized that these yearly thinning strategies would modify the relationships among these traits, resulting in distinct integrated response patterns.
Therefore, this three-year study was designed to assess the effects of four thinning strategies (control, ATS+ethephon, BA+ethephon, and ATS+BA+ethephon) on nine key tree and fruit performance indicators, including trunk cross-sectional area, fruit yield, fruit number per tree, crop load expressed as fruit number per unit trunk cross-sectional area, crop load expressed as yield per unit trunk cross-sectional area, fruit size, fruit weight, water-soluble solids content, and fruit firmness. Furthermore, multivariate analyses were applied to elucidate relationships among these traits and to identify integrated patterns associated with thinning treatments and their year-dependent responses on orchard performance. The findings provide insights into the optimization of chemical thinning practices for intensive apple production using the commercially important cultivar (cv.) ‘Gala Schniga Schnitzer’.

2. Materials and Methods

2.1. Location, Planting Material, Orchard Management, and Meteorological Conditions

A three-year study (2022–2024) was performed in a commercial apple orchard of Gardenova Ltd., in eastern Hungary, near the village of Nyírtass (48°06′50.4″ N, 22°01′30.0″ E). The main soil parameters of the experimental site are included in Table 1. The soil was classified as a moderately compacted clay loam, with plasticity indices of 36 and 38 in the 0–30 cm and 30–60 cm soil layers, respectively. Soil pH ranged from slightly acidic to nearly neutral, with values of 6.48 and 6.94 in the upper and lower layers, respectively. The humus content was approximately 2.7% in both layers, which is considered below the optimal level. The nitrate- and nitrite-nitrogen ((NO3 + NO2)-N) content was low, reaching 3.32 and 4.85 mg kg−1 in the 0–30 cm and 30–60 cm layers, respectively. The soil exhibited high phosphorus and magnesium availability, with P2O5 concentrations of 344 and 346 mg kg−1 and Mg concentrations of 327 and 330 mg kg−1 in the respective layers. Potassium availability ranged from moderate to good, with concentrations of 142 mg kg−1 in the upper layer and 199 mg kg−1 in the lower layer.
The experimental orchard was established in spring 2014. Trees were grafted onto M.9 T337 rootstock and trained using a slender spindle training system, with an in-row and between-row spacing of 4.0 × 0.8 m. At the initiation of the experiment in 2022, the trees were eight years old and had an average canopy height of approximately 3.5 m. This study was conducted on a single apple cultivar, ‘Gala Schniga Schnitzer’, an Italian-selected bud mutation of ‘Royal Gala’ [41].
Orchard management followed the guidelines of the European Integrated Fruit Production (IFP) system [42]. Crop protection practices were based on IFP-approved fungicides and insecticides, with the number of annual spray treatments ranging from 14 to 19 during the 2022–2024 growing seasons, depending on the prevailing pest and disease incidence. Winter pruning was carried out annually during the dormant season to regulate tree form and maintain an appropriate canopy structure. Irrigation was provided throughout the experimental period using a drip irrigation system. Orchard nutrient management consisted of separate applications of nitrogen, phosphorus, potassium, and calcium fertilizers. In March each year, 300 kg ha−1 Pétisó (27-0-0 N-P2O5-K2O; Nitrogénművek Zrt., Pétfürdő, Hungary) was applied, providing 81 kg N ha−1. In December, 200 kg ha−1 potassium chloride (0-0-60 N-P2O5-K2O) was applied, providing 120 kg K2O ha−1, together with 200 kg ha−1 superphosphate (0-28-0 N-P2O5-K2O), providing 56 kg P2O5 ha−1. During flowering, 100 kg ha−1 calcium nitrate (15.3-0-0 N-P2O5-K2O; 14.2% nitrate-N and 26.5% CaO) was supplied through drip irrigation. The orchard floor vegetation was managed by mowing the grass-covered alleyways four to six times per year using a flail mower.
Meteorological parameters, including daily mean temperature, minimum temperature, and precipitation, were obtained from a Metos agrometeorological station (Pessl Instruments GmbH, Weiz, Austria) located in close proximity to the experimental orchard. Weather observations were collected continuously from January 2022 to December 2024.

2.2. Fruit-Thinning Treatments

In our experiment, four fruit-thinning treatments were evaluated (control, ATS+ethephon, BA+ethephon, and ATS+BA+ethephon) in an intensive apple orchard between 2022 and 2024 (Table 2). No manual or chemical fruit thinning was performed on the control trees during any of the experimental years. For the ATS+ethephon treatment, ATS Agro Flo (UPL Hungary Ltd., Budapest, Hungary.), containing 53% ammonium thiosulfate, was used in 2022 and 2024, whereas ATS Kristall (UPL Hungary Ltd., Budapest, Hungary), containing 96–98% ammonium thiosulfate, was used in 2023. For the BA+ethephon treatment, Globaryll 100 (UPL Hungary Ltd., Budapest, Hungary), containing 100 g L−1 6-benzyladenine, was used. In each year, the ATS+ethephon, BA+ethephon, and ATS+BA+ethephon treatments were applied with Ethrel (Bayer Hungaria Ltd., Budapest, Hungary), containing 480 g L−1 ethephon. Thus, ethephon was included in all three chemical thinning treatments. No ethephon-only treatment was included in the experimental design. No manual fruit thinning or other corrective crop load adjustment was performed after the chemical thinning treatments in any experimental year. Consequently, the final fruit number and yield reflected the effects of the chemical thinning treatments under the respective year-specific orchard conditions.
In 2022, ATS+ethephon was applied one day after the opening of the king flowers, on 3 May. In the BA+ethephon treatment, benzyladenine was applied at a fruit diameter of 8–10 mm, on 15 May. In the ATS+BA+ethephon treatment, both thinning agents were applied together with ethephon (Table 2).
In 2023, due to abundant and prolonged flowering, ATS+ethephon was applied twice, on 28 April and 2 May, with ethephon included in both applications. The BA+ethephon treatment was applied on 10 May at a fruit diameter of 8–10 mm. In the ATS+BA+ethephon treatment, both thinning agents were applied together with ethephon (Table 2).
In 2024, the growing season started exceptionally early, approximately 3 weeks ahead of the usual phenological schedule. Due to the high risk of spring frost and the lower flower density, ATS+ethephon was applied at the beginning of the petal fall of the king flowers, on 8 April. BA+ethephon was also applied later than usual, on 28 April, at a fruit diameter of 12–14 mm. In the ATS+BA+ethephon treatment, both thinning agents were applied together with ethephon (Table 2).
All treatments were applied using a Kertitox Bora 2000 air-assisted orchard sprayer (Farmgép Ltd., Debrecen, Hungary), operated at a forward speed of 8.5 km h−1 and a spray pressure of 9 bar. The spray volume was determined based on the grower’s practical experience with the orchard. It was 700 L ha−1 in 2022 and was increased to 1000 L ha−1 in 2023 and 2024; the same volume was used for all treatments within each year. The sprayer was equipped with ceramic-insert ATR 80 hollow-cone nozzles. The ATS+ethephon treatments were applied during daytime (12:00–14:00), whereas the BA+ethephon treatments were applied in the early morning (06:00–08:00). Applications were performed without rainfall during spraying.

2.3. Assessment of Nine Parameters

Nine fruit production and quality-related traits were assessed, including trunk cross-sectional area (TCSA), yield per tree (Y), fruit number per tree (FNT), crop load expressed as fruit number per unit trunk cross-sectional area (CLnm), crop load expressed as yield per unit trunk cross-sectional area (CLkg), fruit size (FS), fruit weight (FW), water-soluble solids content (SSC), and fruit firmness (FF). For each treatment, seven trees were designated within each plot, with four independent replicate plots established per treatment in each year. The experiment was arranged as a completely randomized design, with treatments independently and randomly assigned to plots within each year; therefore, treatment assignment was not retained at the same plot positions across the three experimental years. No blocking factor was used. The plot was considered the experimental unit, with four independent plot-level replicates per treatment in each year. The treatment plots were spatially separated by approximately 30 m within orchard rows and by approximately 16 m between the experimental rows. The measured trees were located in the central part of the respective treatment plots, with border trees separating them from adjacent treatment areas to minimize potential spray drift and treatment interference. The five central trees within each plot were used for data collection, whereas the outer trees (first and seventh trees) served as border plants and were excluded from measurements to minimize edge effects. The plot was considered the experimental unit, with four independent plot-level replicates per treatment in each year. From each tree, 20 fruit samples were collected; altogether, 5 × 20 = 100 fruits were collected per plot, and across the four independent replications, 4 × 100 = 400 fruits per treatment/year/measured variable were evaluated for fruit-related measurements.
Trunk diameter was recorded annually following leaf abscission (24 November 2022, 20 November 2023, and 17 November 2024) using a Vernier caliper. These measurements were subsequently converted into trunk cross-sectional area (TCSA, cm2). At commercial harvest maturity (31 August 2022, 4 September 2023, and 23 August 2024), fruits from each experimental tree were harvested separately, and the total fruit number and yield per tree were determined. Crop load was calculated using two approaches: (i) the ratio of fruit number to trunk cross-sectional area (fruit number cm−2 TCSA) and (ii) the ratio of yield to trunk cross-sectional area (kg cm−2 TCSA).
Fruit size was determined on a subsample of 20 fruits per tree using a Vernier caliper. Fruit size was measured at the maximum equatorial diameter of each fruit. The measurements were performed on 20 fruits from each of the five measured trees within each plot, resulting in 100 evaluated fruits per plot and 400 fruits per treatment per year across the four independent replicate plots. For statistical analysis, measurements obtained from the five trees within each plot were averaged to provide one plot-level observation.
Fruit firmness was assessed on a representative subsample of 12 fruits selected from the 100 fruits collected from each experimental plot. The 12 fruits were divided into four groups of three fruits. Firmness was measured using a PCE-PTR 200 N digital penetrometer (Eurochrom Ltd., Szombathely, Hungary) equipped with an 11 mm diameter probe. Before measurement, the skin was removed at the measurement sites. Three measurements were performed on each fruit at three equally spaced points along the fruit’s maximum diameter to account for local variation in firmness and obtain a representative fruit-level value. The probe was inserted to a depth of 0.6 cm. All measurements were performed by the same operator using a consistent penetration procedure and comparable force throughout the measurements. The penetrometer was factory-calibrated, and no additional calibration was performed before the measurements. Firmness values were recorded directly from the instrument in kg cm−2, and this unit was retained in the statistical analyses and text. The measurements were averaged to obtain one plot-level firmness value for each experimental plot. Thus, four independent plot-level observations were obtained per treatment for statistical analysis.
Water-soluble solids content was determined from the same fruits per treatment as for fruit firmness using a digital refractometer (PAL-1, ATAGO Co., Ltd., Tokyo, Japan). The fruits were processed individually using a juice extractor to obtain separate juice samples per treatment. For each juice sample, five refractometer readings were taken and averaged before statistical analysis. Fruit firmness and water-soluble solids content were measured one day after harvest in each experimental year.

2.4. Data Analyses

2.4.1. Analysis of Variance

For each combination of year and thinning treatment, the values of the nine measured variables (TCSA, Y, FNT, CLnm, CLkg, FD, FW, SSC, and FF) were obtained for each of the four independent replicate plots. The resulting dataset was subjected to analysis of variance separately for each year to determine the effects of thinning treatment on the measured variables. Thus, four independent plot-level observations were available for each thinning treatment in each year. Whenever significant differences were detected (p < 0.05), treatment means for each measured variable were compared using the least significant difference (LSD) test at the 5% significance level among thinning treatments within each year. All statistical analyses were performed using Genstat Release 9.1 (Lawes Agricultural Trust, IACR, Rothamsted, UK).

2.4.2. Correlation and Linear Regression Analyses

Relationships among the measured variables were examined using Pearson’s correlation analysis, with statistical significance evaluated at the 5% probability level (p < 0.05). Correlation coefficients (r) were calculated separately for each year (2022, 2023, and 2024) by combining four replicates and four thinning treatments (control, ATS+ethephon, BA+ethephon, and ATS+BA+ethephon), n = 4 × 4 = 16, for each parameter. Parameter pairs exhibiting strong positive or negative associations (|r| > 0.5) were identified within each year. The strongest correlated variable pairs were subsequently visualized using scatterplots, and simple linear regression models were fitted separately for each year. Differences between regression slopes were evaluated using t-tests to determine whether the fitted relationships differed significantly (p < 0.05) among the three years. All statistical analyses were performed using Genstat Release 9.1 (Lawes Agricultural Trust, IACR, Rothamsted, UK). Correlation coefficients were visualized as heatmaps, whereas the linear regression models were generated in R version 4.5.2 [43] using the packages ggplot2 version 3.5.1 [44], reshape2 version 1.4.4 [45], and dplyr version 1.1.4 [46].

2.4.3. Principal Component Analysis

Principal component analysis (PCA) was applied to investigate the multivariate relationships among the nine measured variables, with fruit firmness excluded in 2022 because these data were not available for that year. Prior to analysis, all variables were standardized to a mean of zero and a standard deviation of one to eliminate differences in measurement scales. The percentage of total variance explained by each principal component was calculated separately for each year, and the first two principal components (PC1 and PC2) were used to visualize the multivariate structure of the dataset for the three years (2022, 2023, and 2024). Eigenvectors were obtained from the PCA rotation matrix. For biplot visualization, the PC1 and PC2 eigenvector coordinates were multiplied by a constant factor of 5 solely to improve the visual representation of the variable vectors. Because the signs of principal component axes are arbitrary, their direction may be reversed without affecting the interpretation of the PCA. Principal component analysis and biplot visualization were carried out in R version 4.5.2 [43] using the packages ggplot2 version 3.5.1 [44], dplyr version 1.1.4 [46], and ggrepel version 0.9.6 [47]. Data import and export procedures were performed using the readxl version 1.4.5 [48] and openxlsx version 4.2.8 [49] packages, respectively.

3. Results

3.1. Analysis of Variance

Analysis of variance revealed that trunk cross-sectional area (TCSA), fruit yield (Y), fruit number per tree (FNT), crop load-number (CLnm), crop load-kg (CLkg), fruit size (FS), fruit weight (FW), water-soluble solids content (SSC), and fruit firmness (FF) were significantly affected (p < 0.05) by year and thinning treatment, except for TCSA, for which the effect of thinning treatment was not significant (Table 3).

3.2. Meteorological Parameters

During the experimental period, no major weather-related events causing visible damage to tree productivity were observed in the orchard. Throughout the 2022–2024 study period, monthly mean air temperatures ranged from −0.4 to 24.4 °C (Table S1), indicating pronounced seasonal and interannual variability in thermal conditions. Minimum temperatures ranged from −9.9 to 15.1 °C (Table S1), with no recorded winter injury or late spring frost damage. The long-term average annual precipitation in the region is 580–620 mm; however, all three experimental years were characterized by below-average precipitation, with annual totals ranging from 310 to 512 mm. Monthly precipitation varied considerably (1.0–109.8 mm; Table S1), reflecting differences in water availability during the growing seasons.

3.3. Vegetative Growth Parameter: Trunk-Cross Sectional Area—TCSA

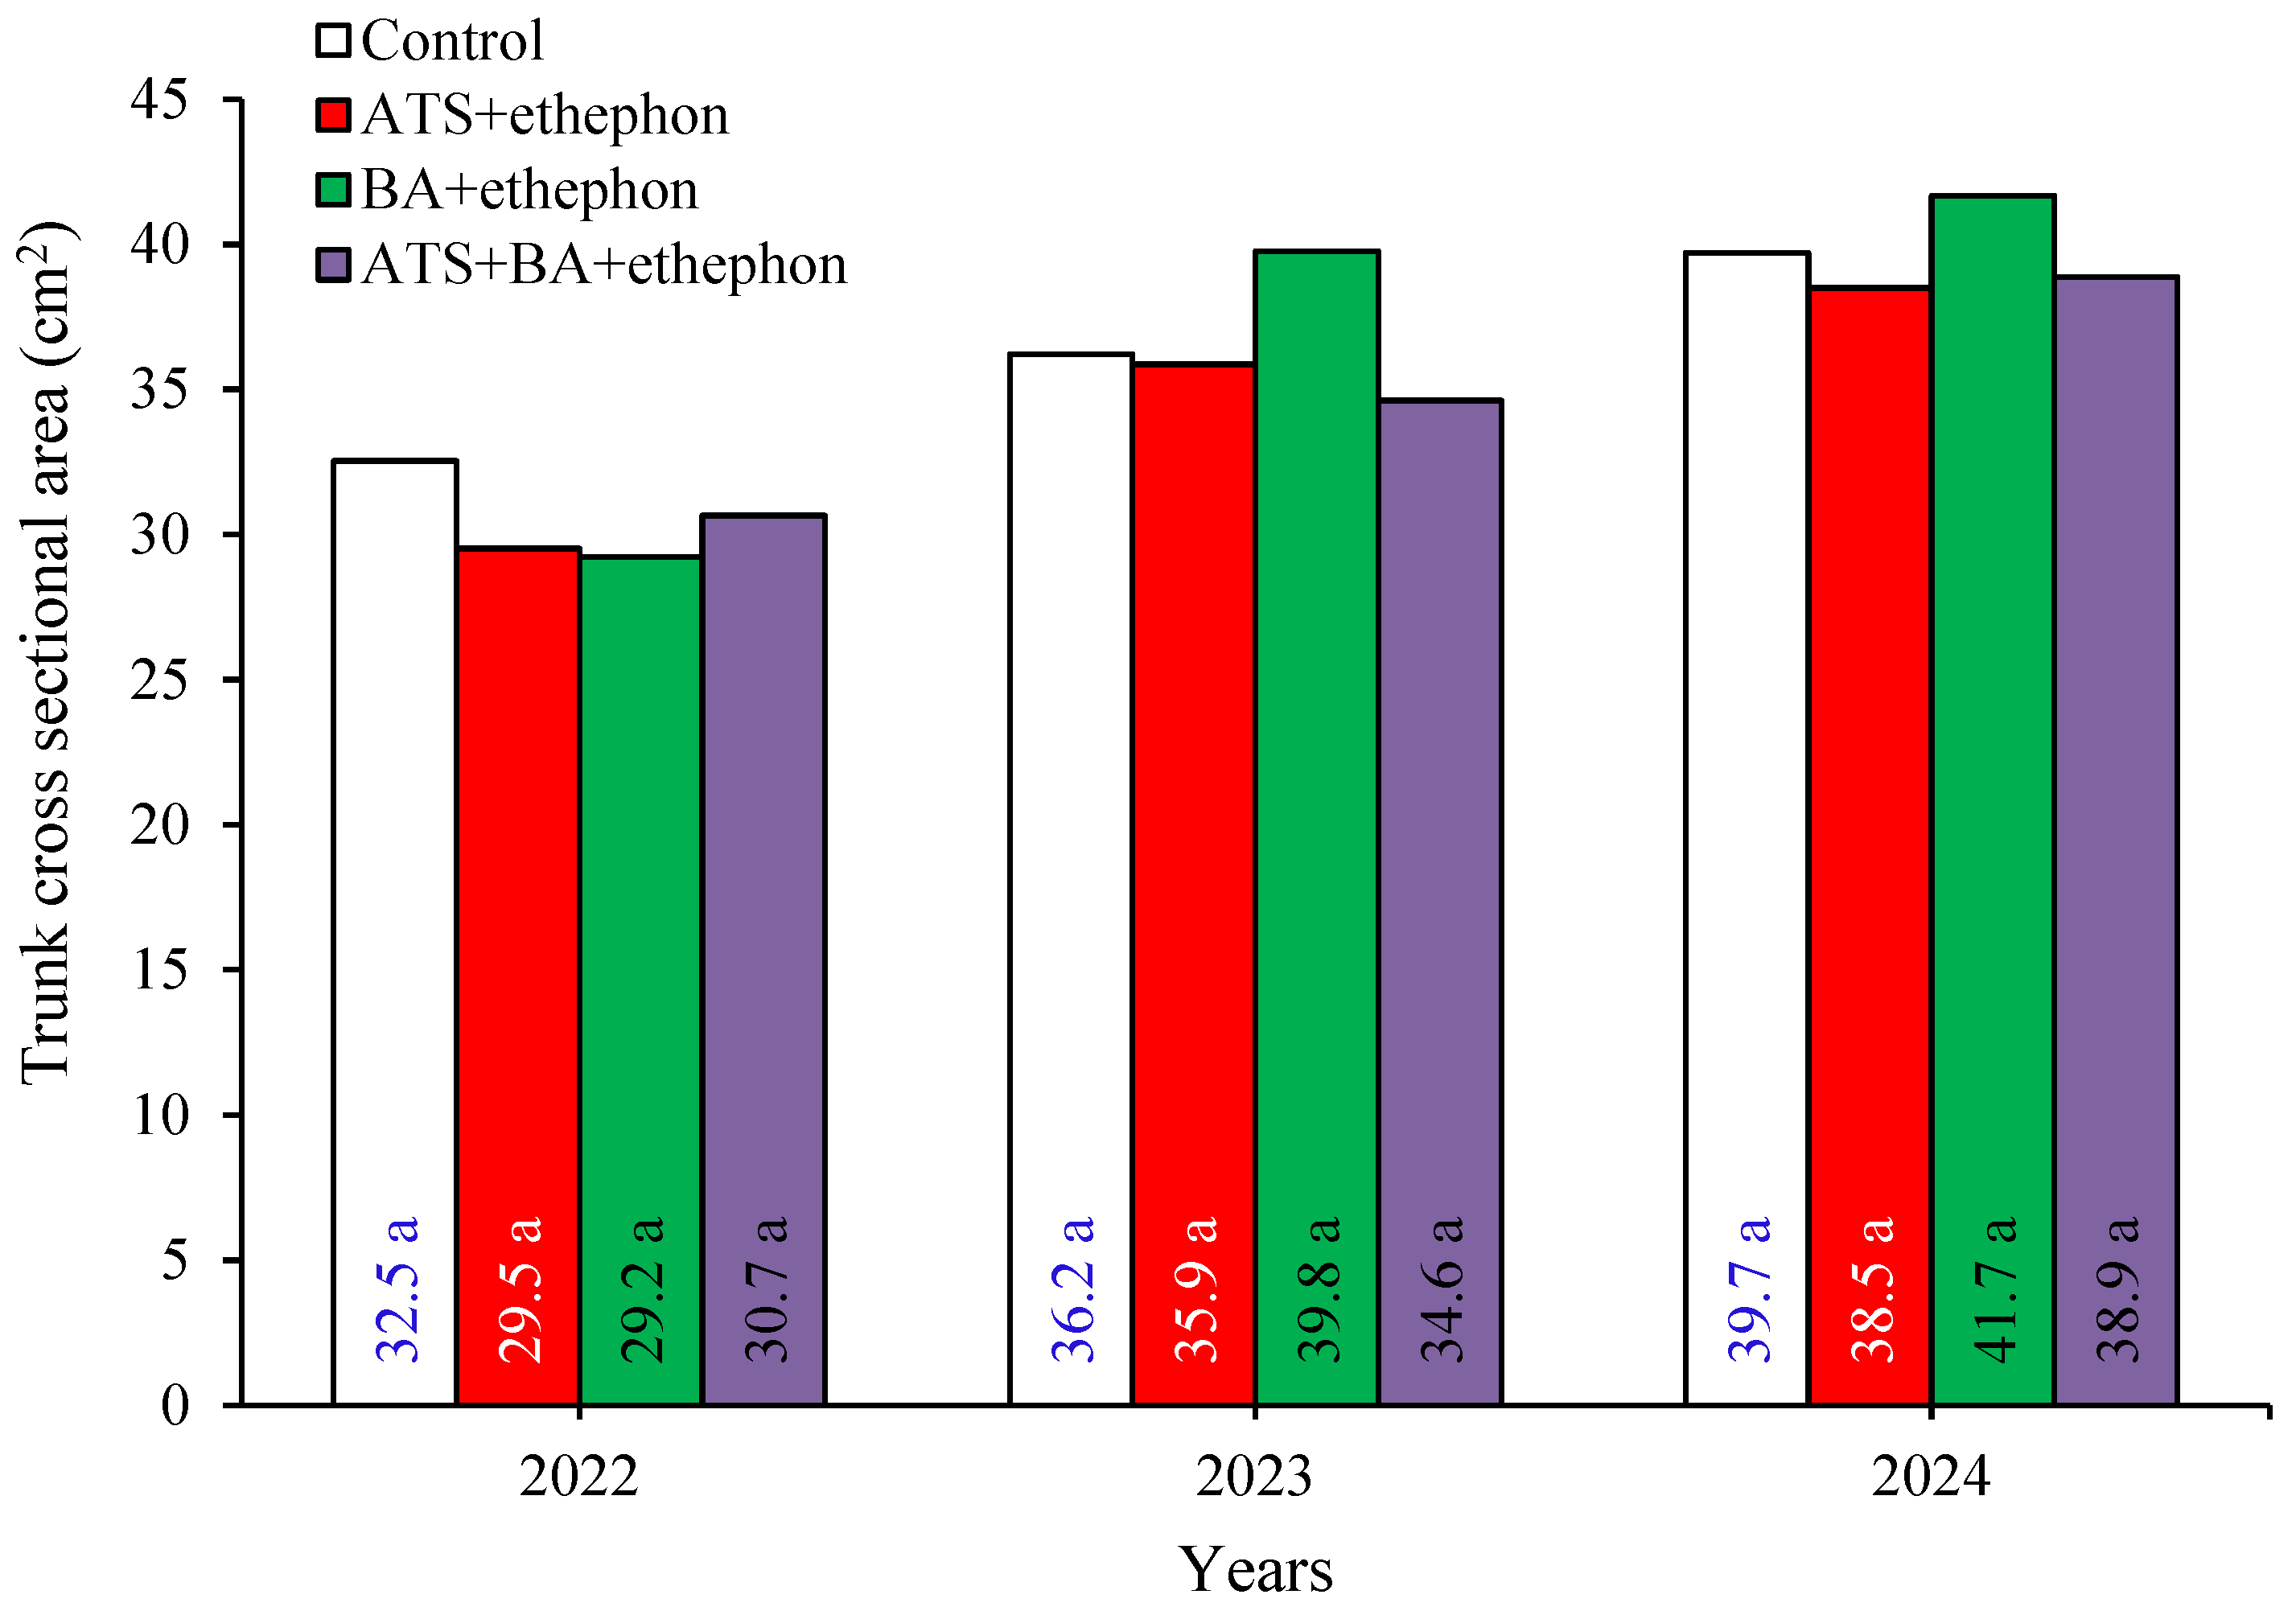
The TCSA values continuously increased during the experimental period (Figure 1). In the first experimental year (2022), the trunk cross-sectional area of the examined trees ranged from 29.2 to 32.5 cm2, whereas in the third experimental year (2024), values increased to 38.5–41.7 cm2. No significant differences were observed among treatments within individual years.

3.4. Yield-Related Parameters

3.4.1. Fruit Number per Tree—FNT

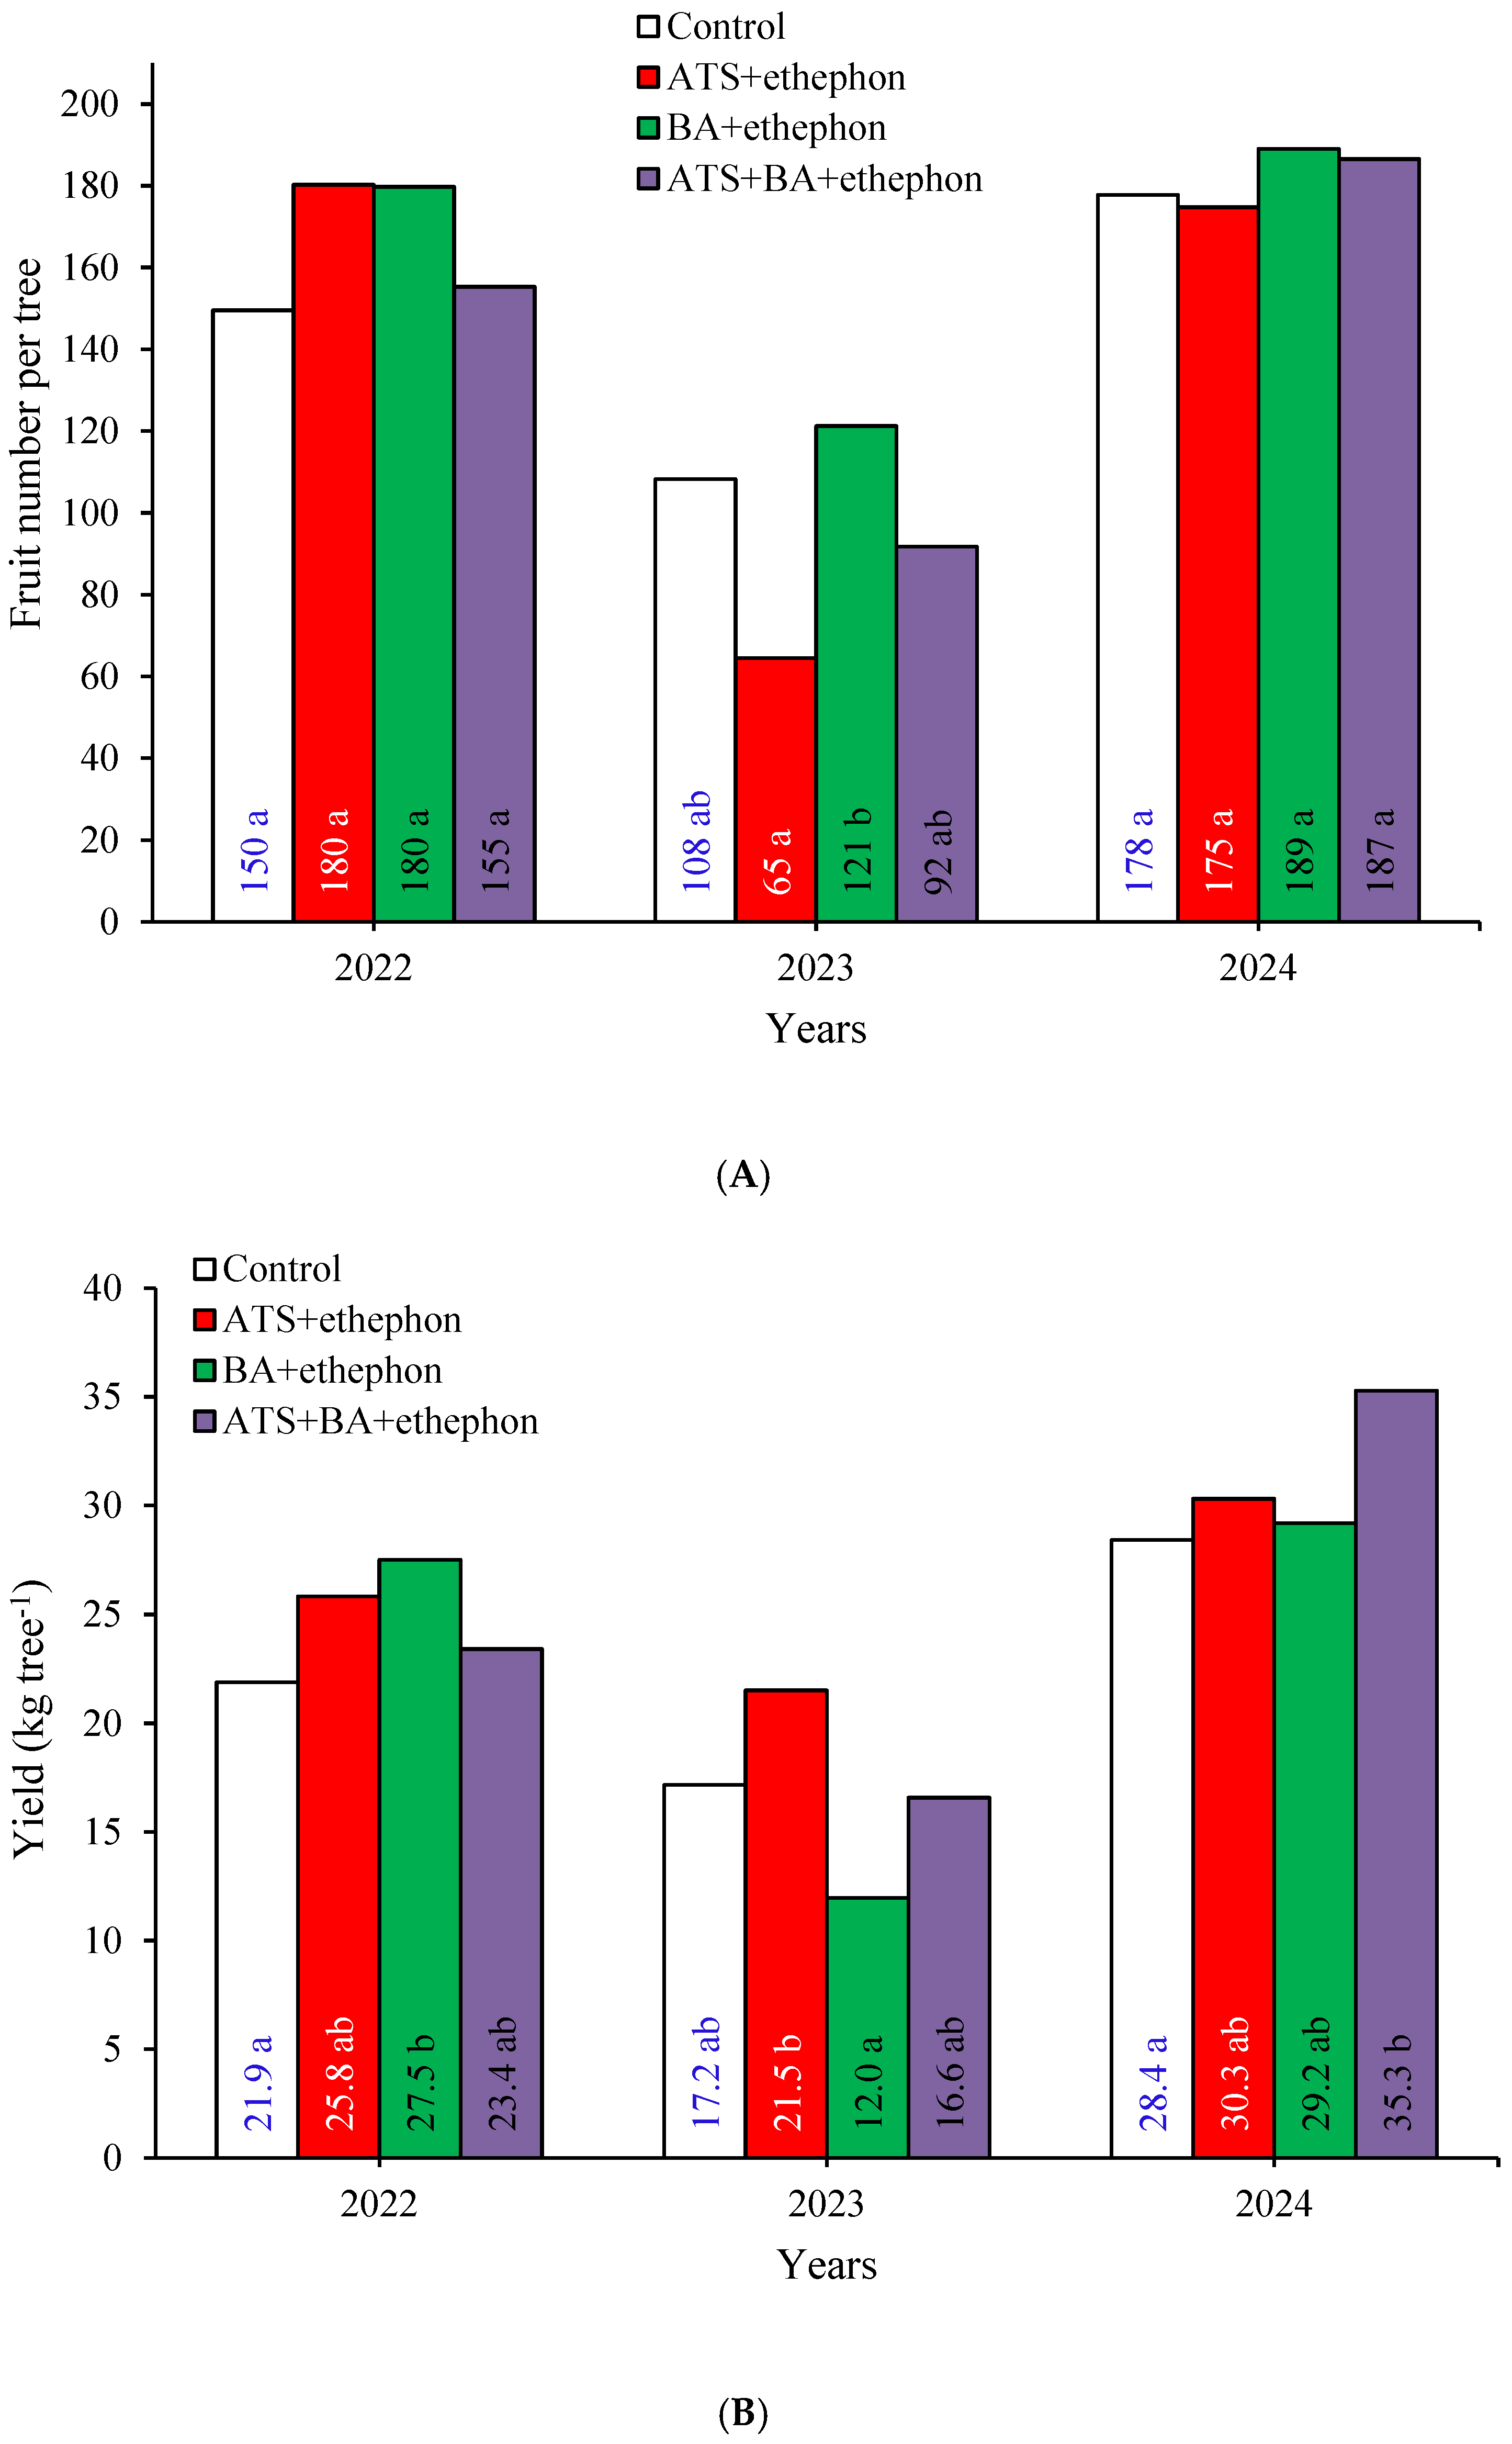
Over the three-year study period, the number of fruits per tree ranged from 65 to 189 fruits tree−1 (Figure 2A). The lowest fruit number (65 fruits tree−1) was recorded in ATS+ethephon-treated trees in 2023, whereas the highest value (189 fruits tree−1) was observed in BA+ethephon-treated trees in 2024. The thinning treatments within years significantly affected FNT only in 2023, when BA-treated trees showed significantly higher FNT values compared with the ATS+ethephon-treated trees.

3.4.2. Fruit Yield (Kg) per Tree—Y

During the assessment period, fruit yield ranged from 12.0 to 35.3 kg tree−1 (Figure 2B). The highest yield was recorded in the ATS+BA+ethephon treatment in 2024 (35.3 kg tree−1), whereas the lowest yield was observed in the BA+ethephon treatment in 2023 (12.0 kg tree−1). Significant differences in fruit yield among the four thinning treatments were detected in all years. In 2022, the BA+ethephon treatment resulted in a significantly higher fruit yield (27.5 kg tree−1) compared with the control trees (21.9 kg tree−1). In 2023, fruit yield in the ATS+ethephon treatment (21.5 kg tree−1) was significantly higher than that in the BA+ethephon treatment (12.0 kg tree−1). In 2024, fruit yield in the ATS+BA+ethephon treatment (35.3 kg tree−1) was significantly higher than that in the control treatment (28.4 kg tree−1).

3.4.3. Crop Load: Fruit Number per cm2—CLnm

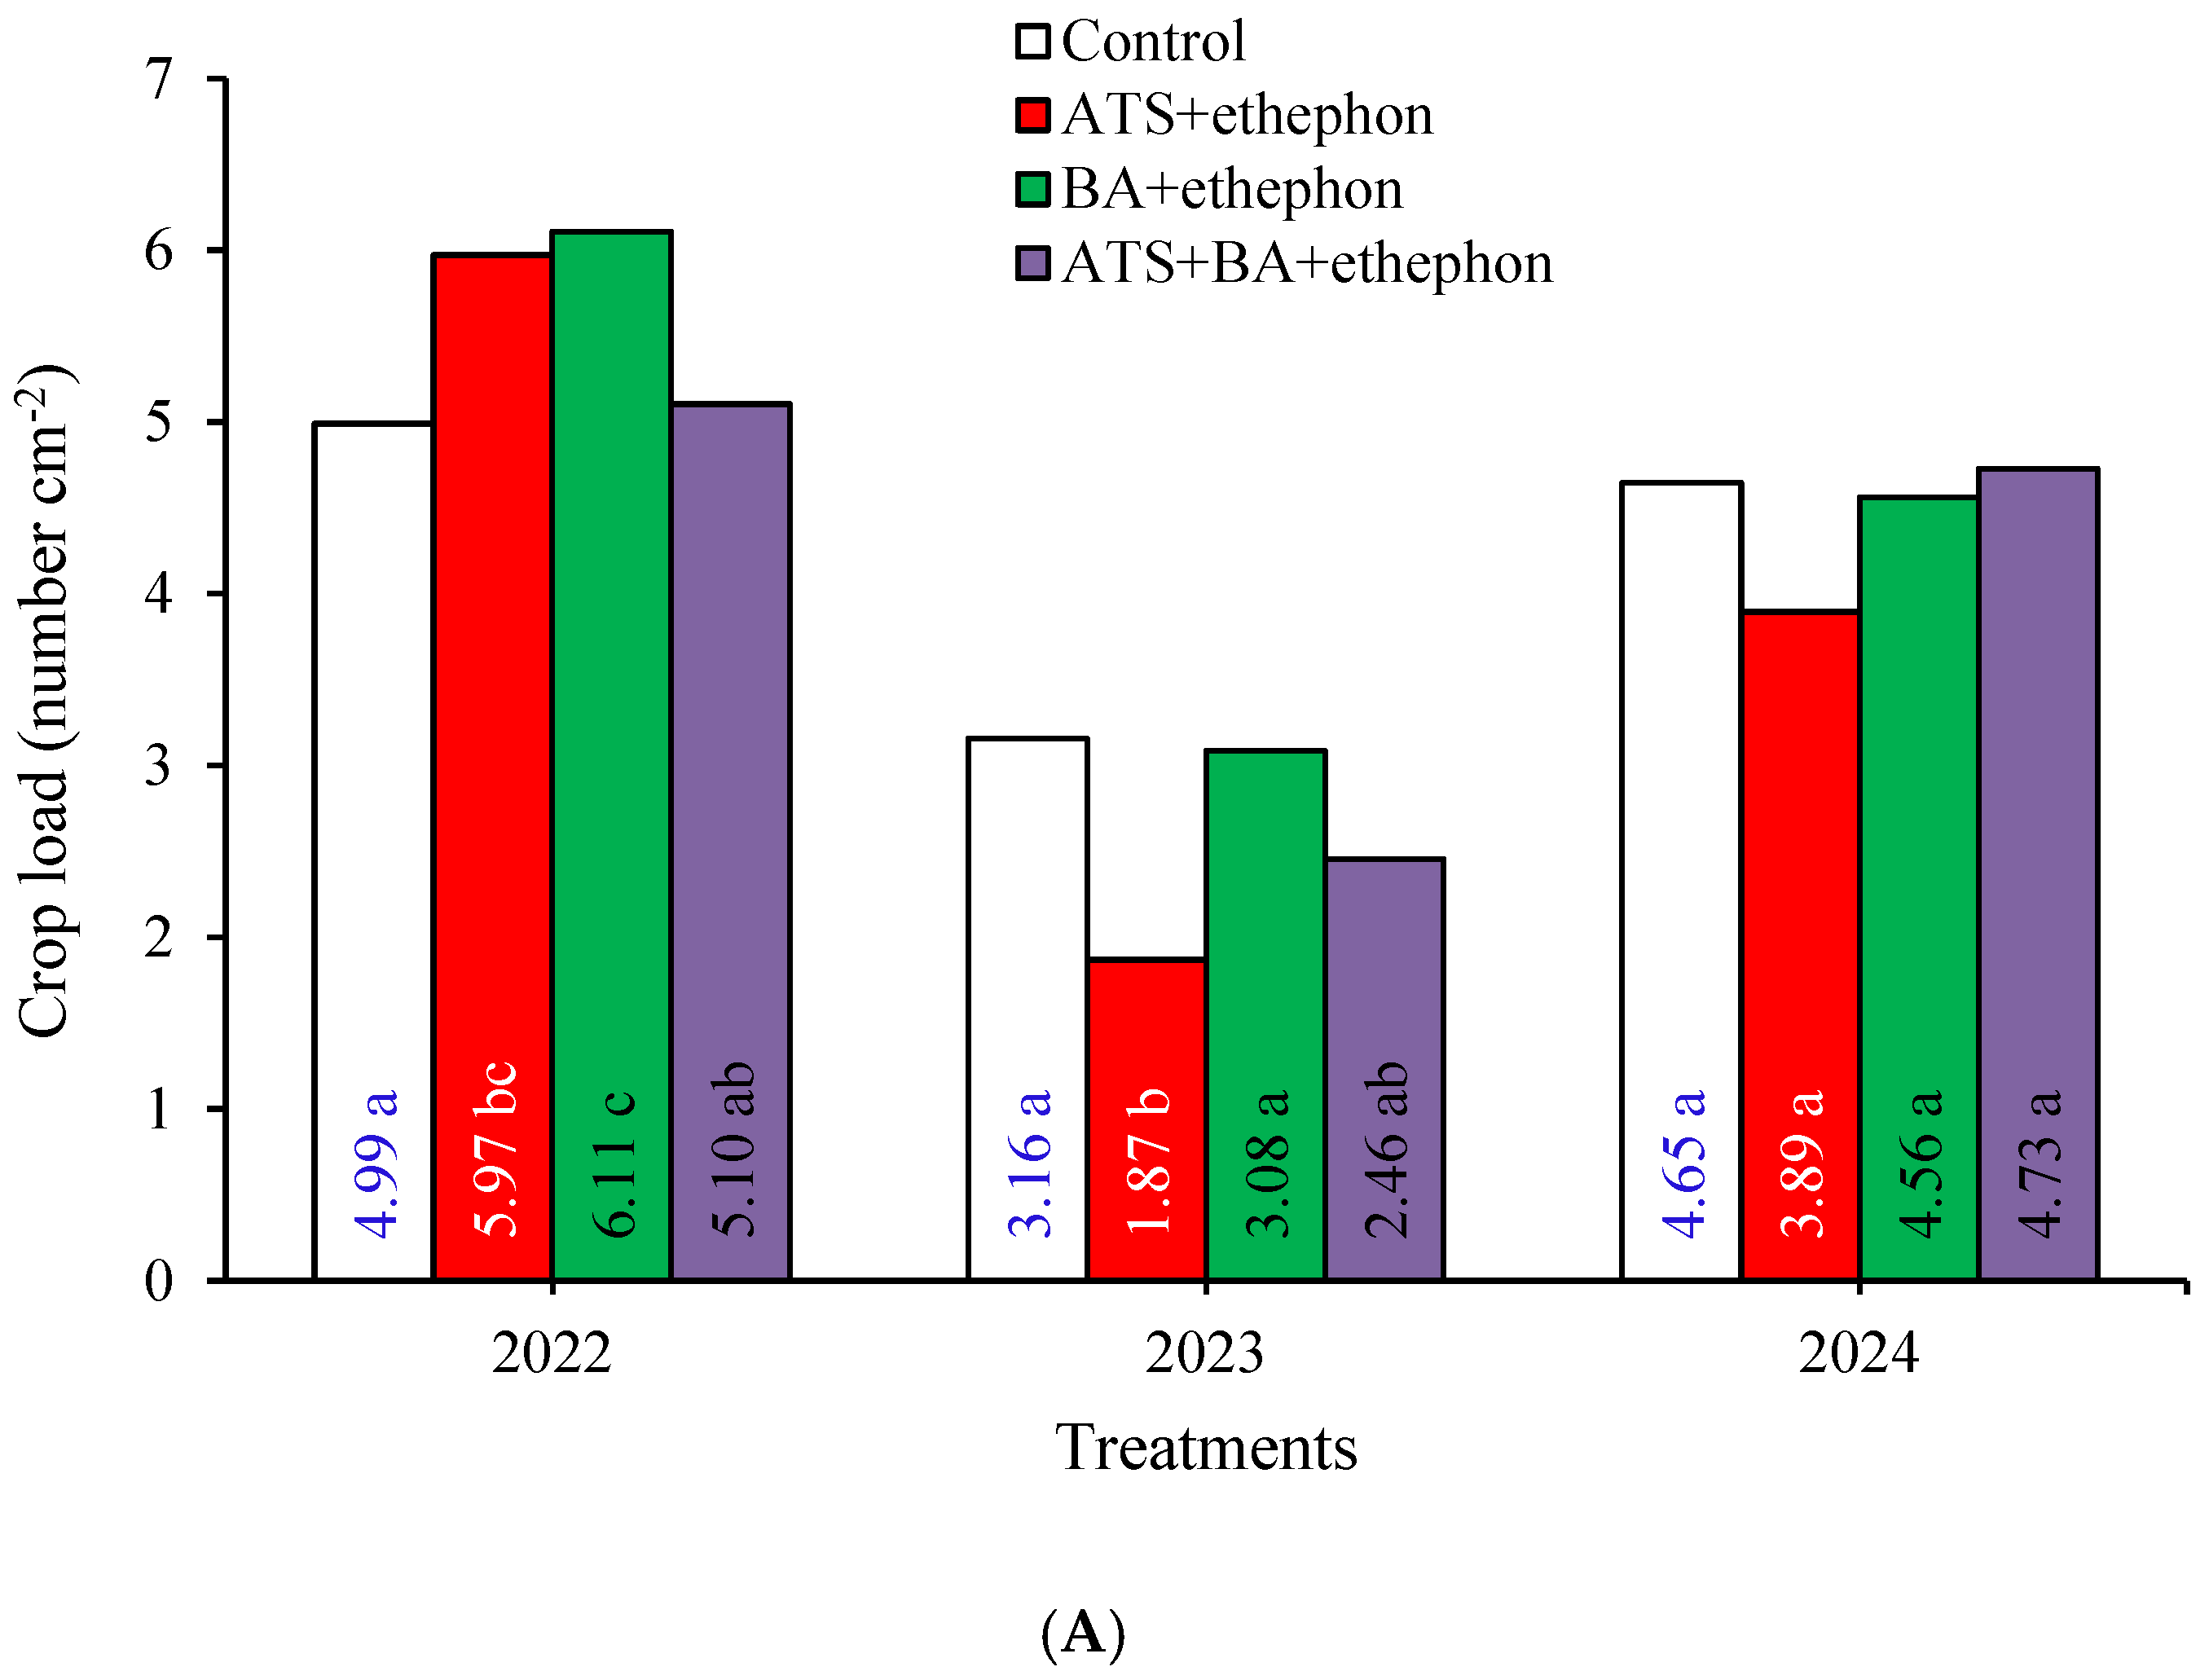
During the trial period, crop load values ranged from 1.87 to 6.11 fruits cm−2 (Figure 3A). The highest crop load was recorded in the BA+ethephon treatment in 2022 (6.11 fruits cm−2), whereas the lowest value was observed in the ATS+ethephon treatment in 2023 (1.87 fruits cm−2). Significant differences in CLnm were detected in 2022 and 2023. In 2022, BA+ethephon treatment resulted in a significantly higher CLnm value (6.11 fruits cm−2) compared with the control and ATS+BA+ethephon treatments (4.99 and 5.10 fruits cm−2, respectively). In 2023, ATS+ethephon treatment resulted in a significantly lower CLnm value (1.87 fruits cm−2) compared with the control and BA+ethephon treatments (3.08 and 3.16 fruits cm−2, respectively).

3.4.4. Crop Load: Fruit (kg) per cm2

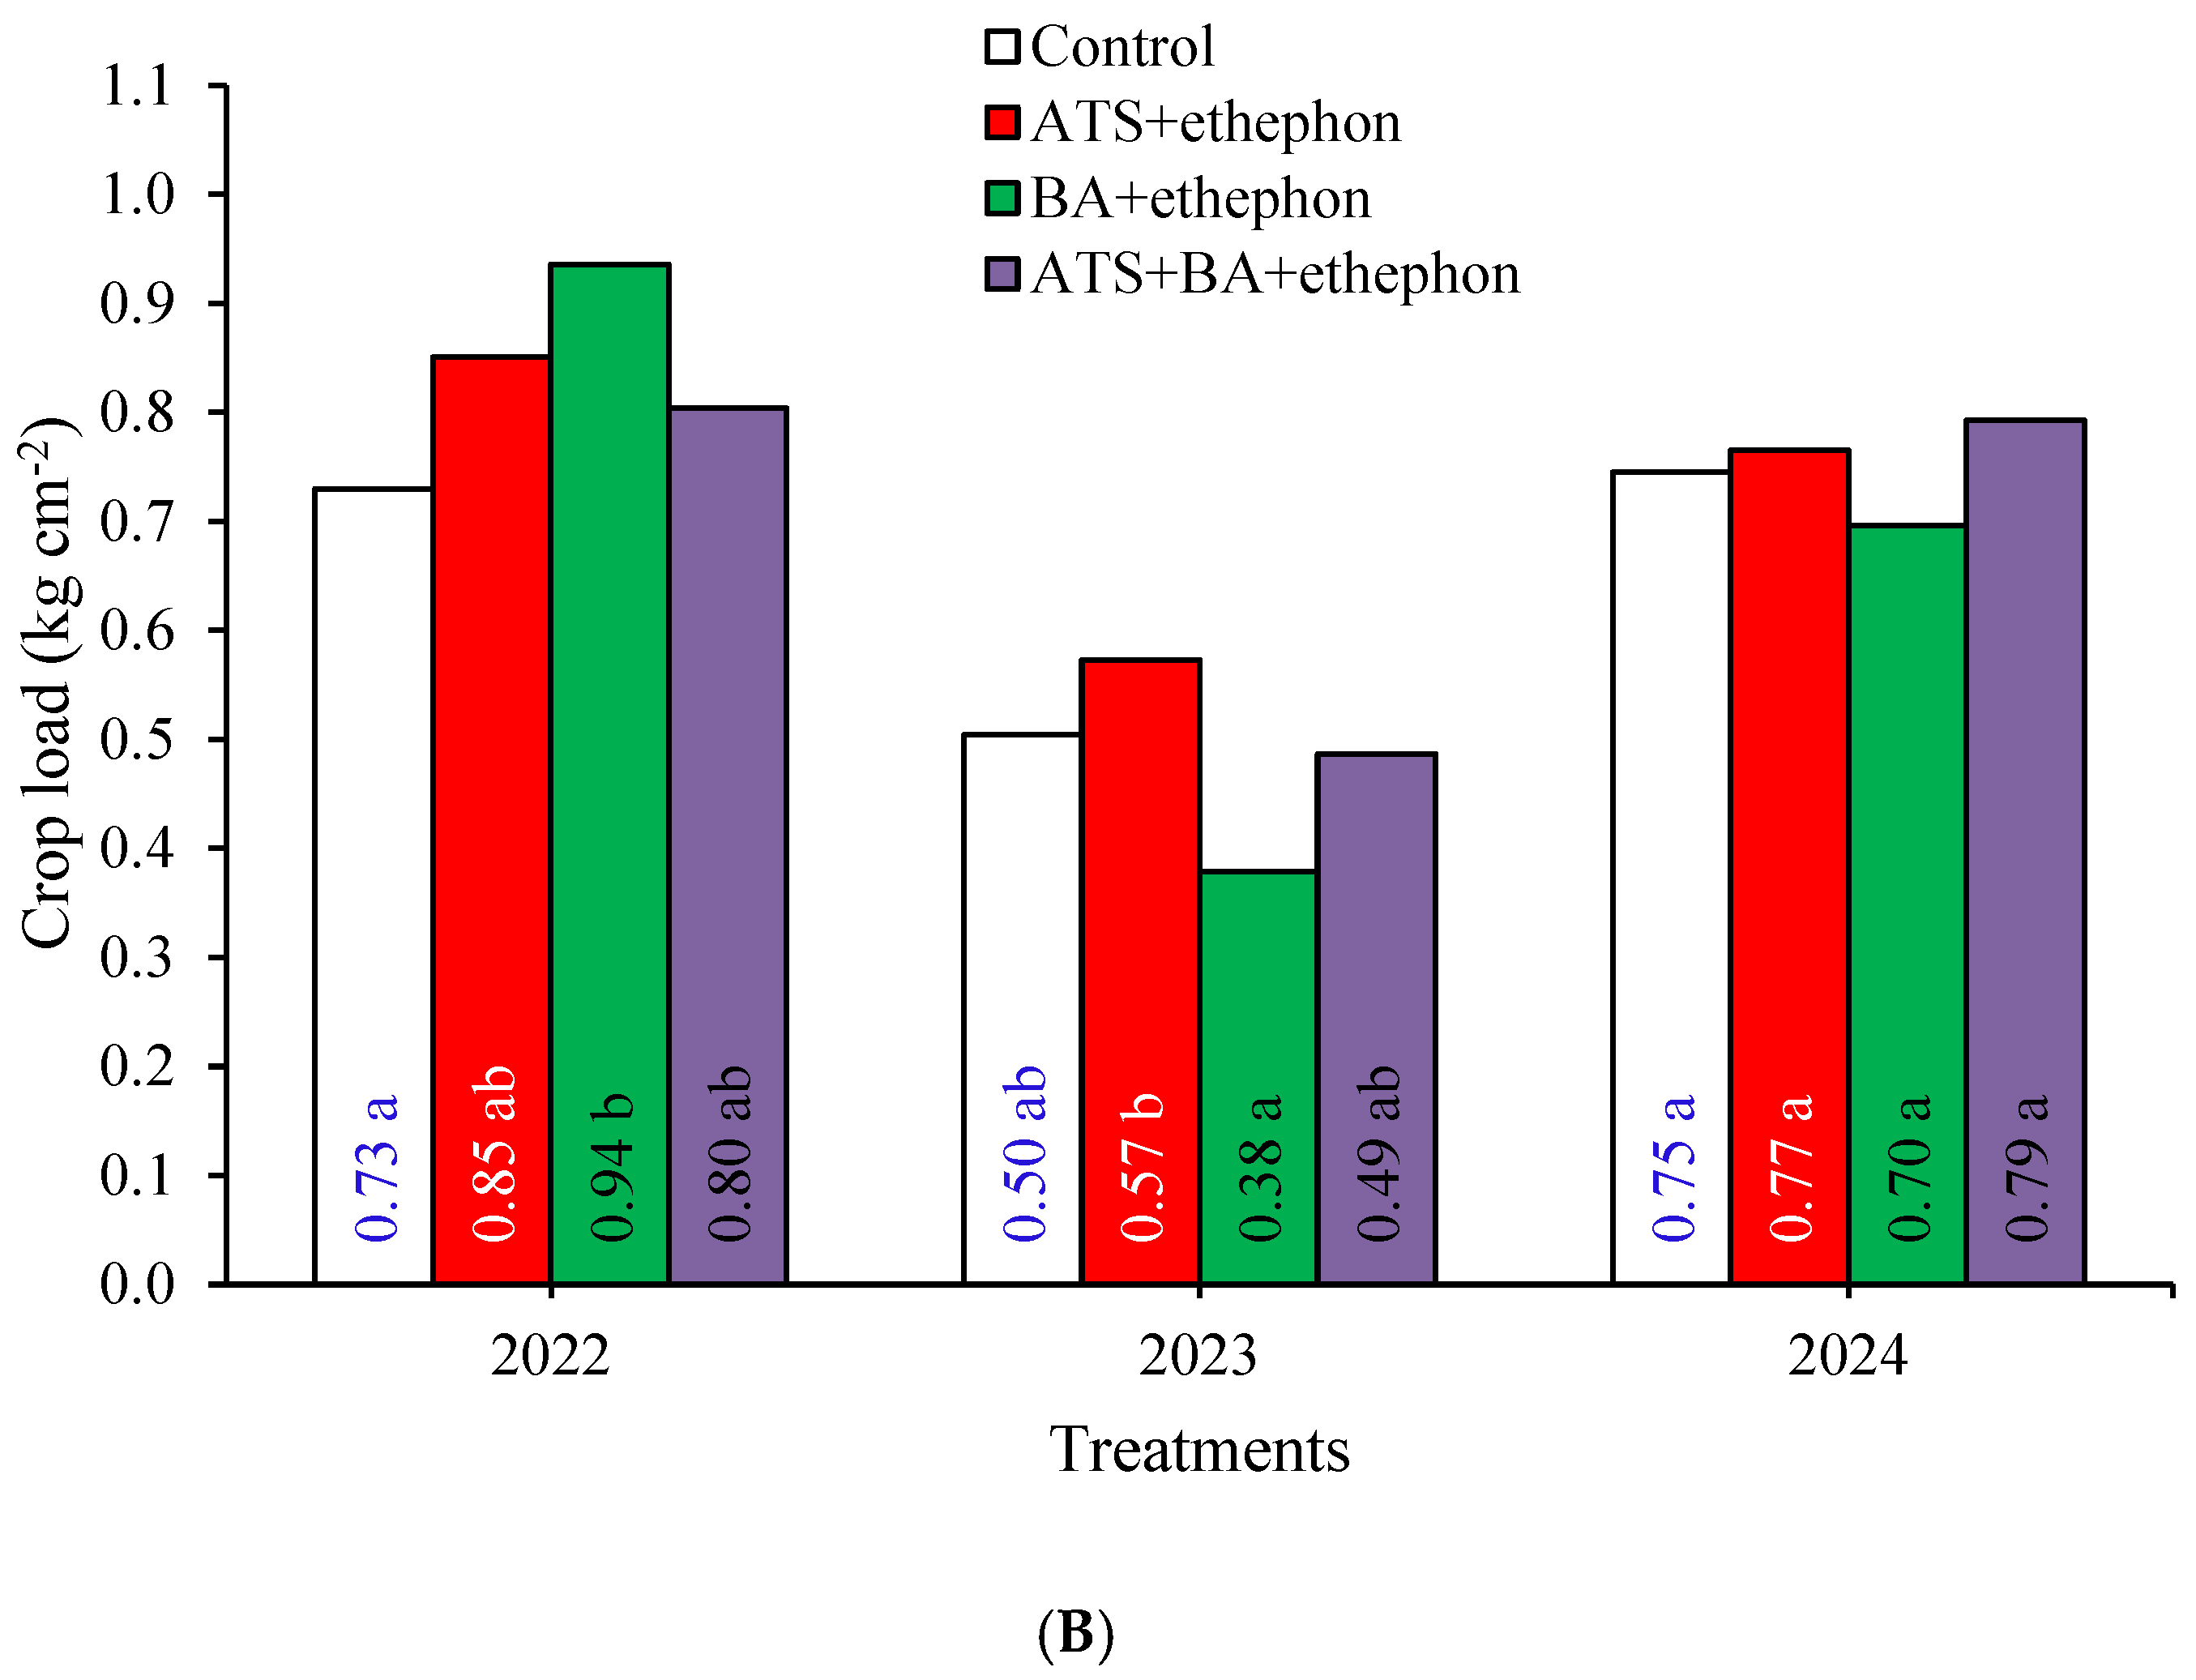
Crop load, expressed as yield per unit trunk cross-sectional area (CLkg), ranged from 0.38 to 0.94 kg cm−2 during the experimental period (Figure 3B). The maximum CLkg value was observed in the BA+ethephon treatment in 2022 (0.94 kg cm−2), whereas the minimum value occurred in the same treatment in 2023 (0.38 kg cm−2). In 2022, the BA+ethephon treatment showed a higher CLkg value (0.94 kg cm−2) compared with the control treatment (0.73 kg cm−2). In 2023, the ATS+ethephon treatment showed a higher CLkg value (0.57 kg cm−2) compared with the BA+ethephon treatment (0.38 kg cm−2).

3.5. Physicochemical Fruit Quality Parameters

3.5.1. Fruit Size—FS

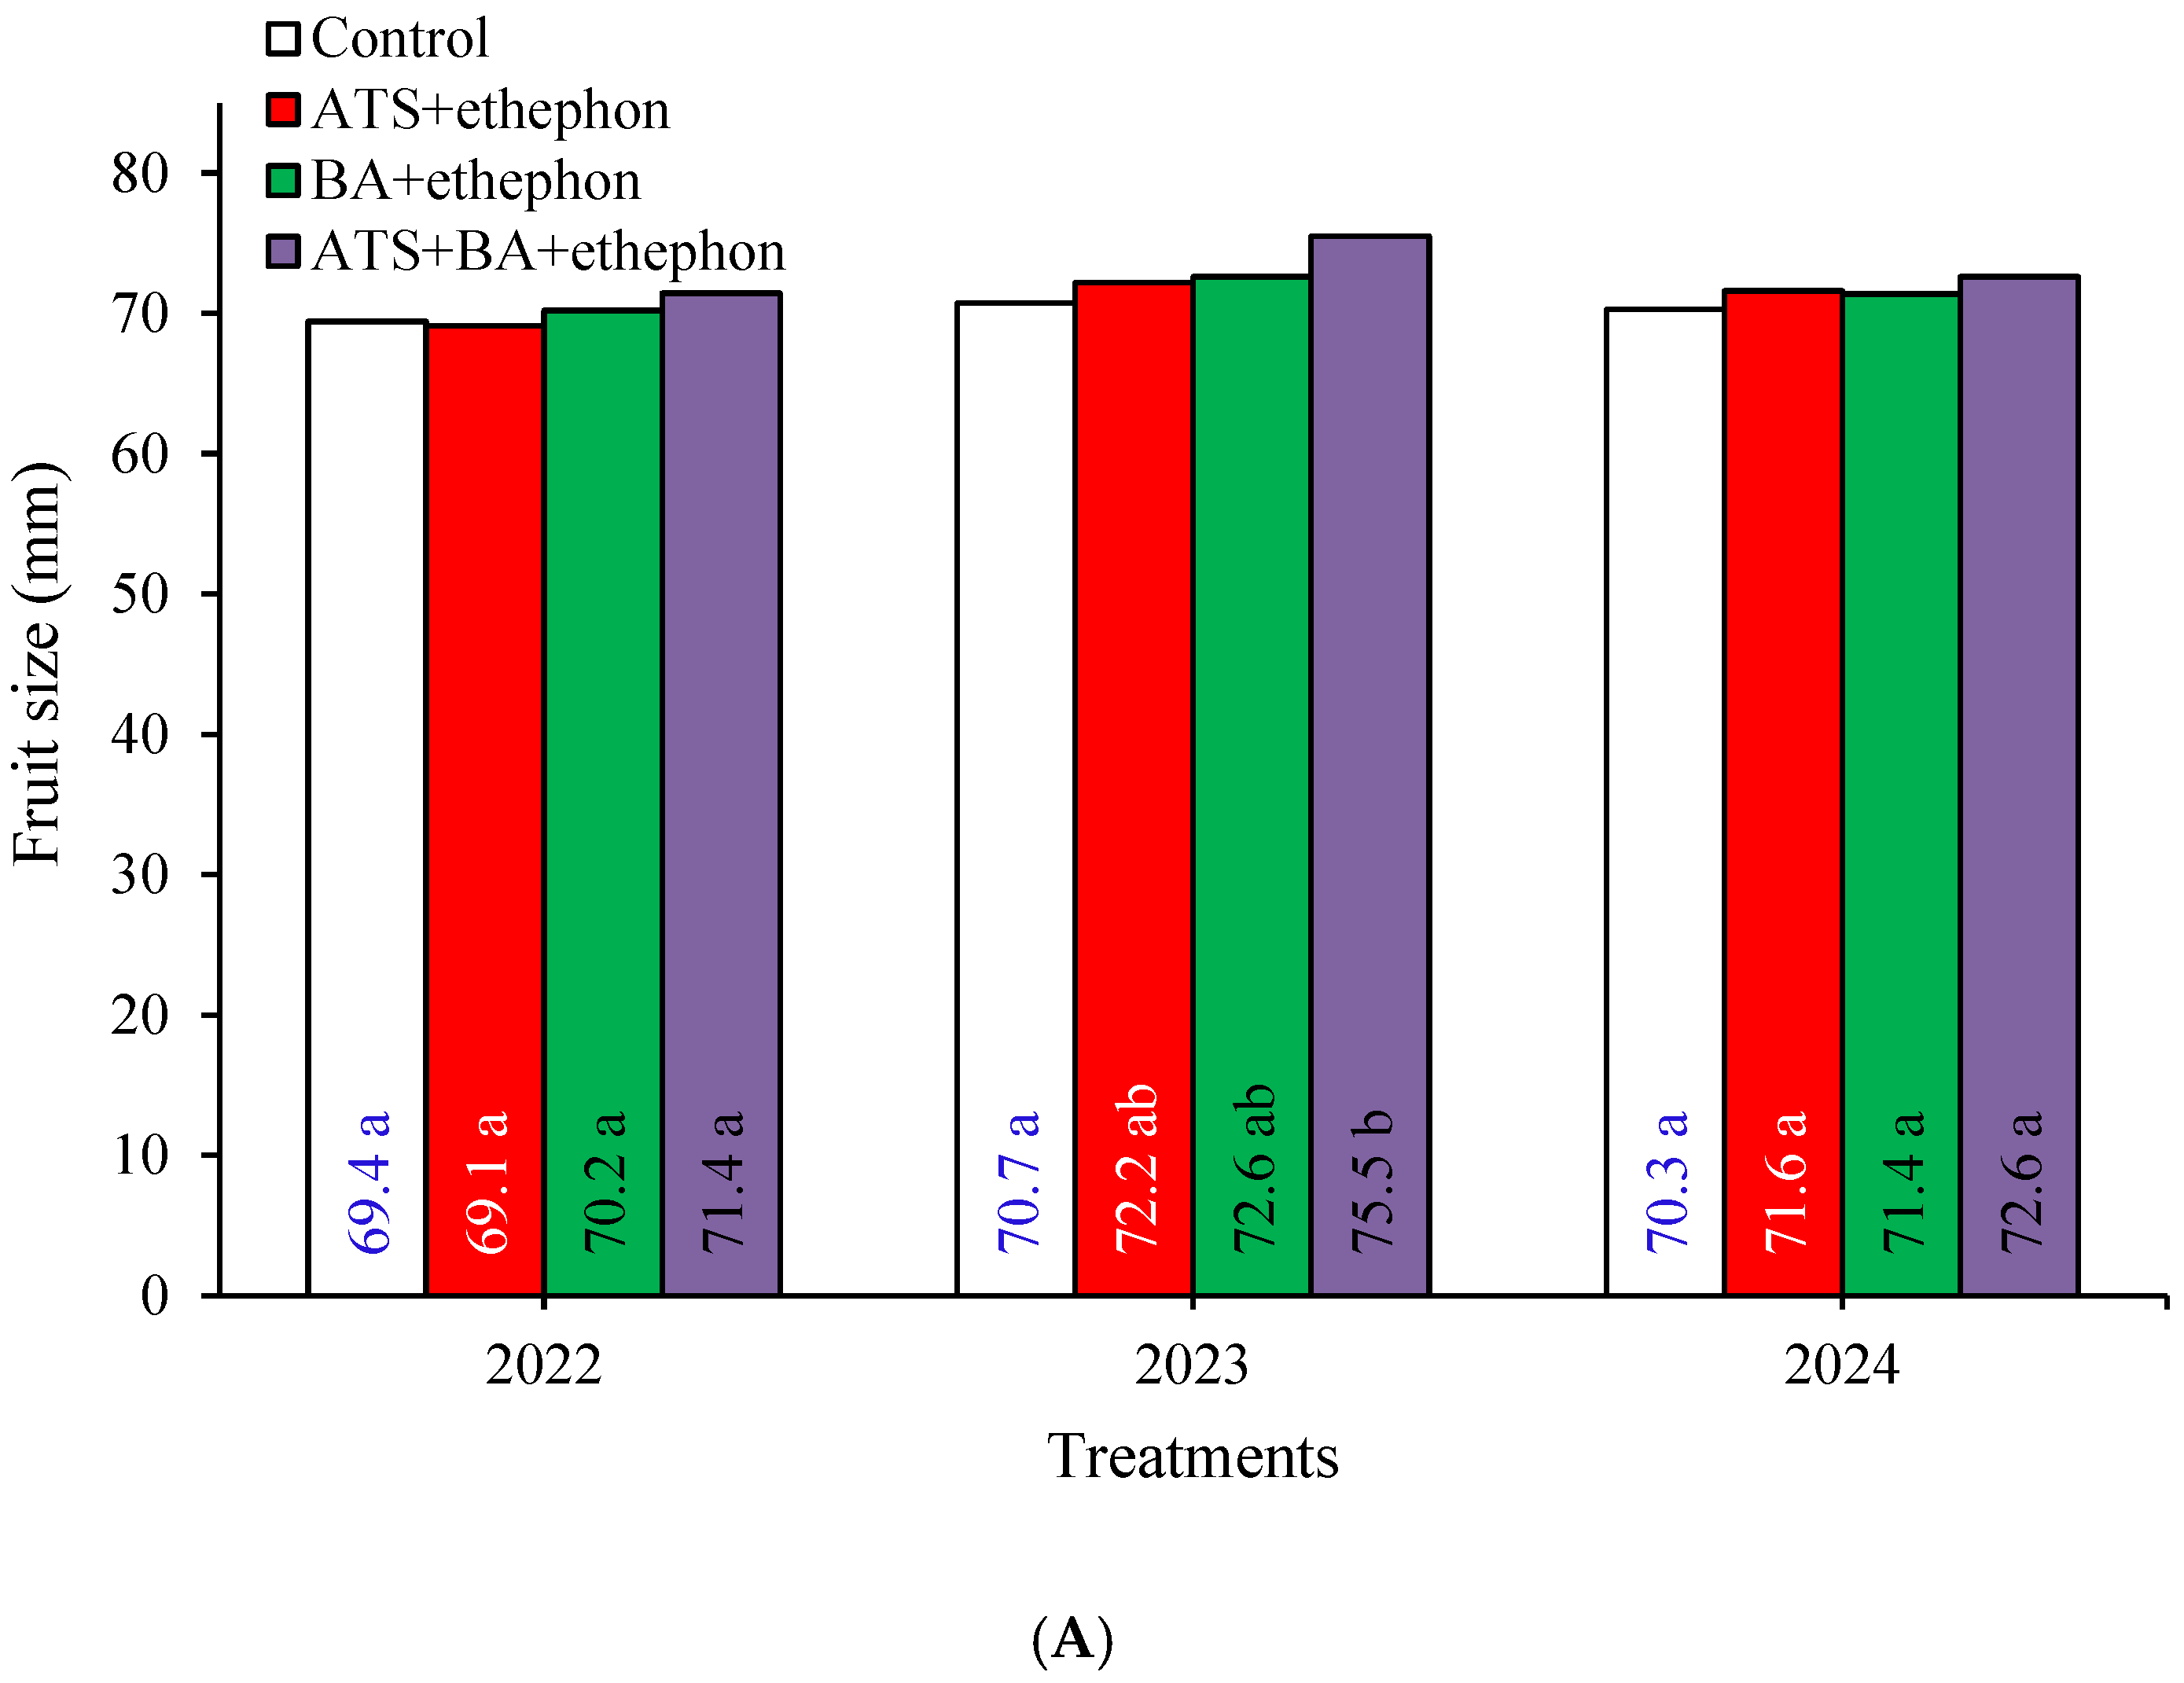
During the experimental period, fruit size reached the required 70 mm each year, except for the control and ATS+ethephon treatments in 2022 (Figure 4A). Over the three-year trial, fruit size ranged from 69.1 to 75.5 mm.
The smallest fruit size (69.1 mm) was measured in 2022 in the ATS+ethephon treatment, while the largest fruits (75.5 mm) were harvested from the ATS+BA+ethephon treatment in 2023. Regarding the thinning treatment effects, the ATS+BA+ethephon treatment significantly increased fruit size compared with the control only in 2023.

3.5.2. Fruit Weight—FW

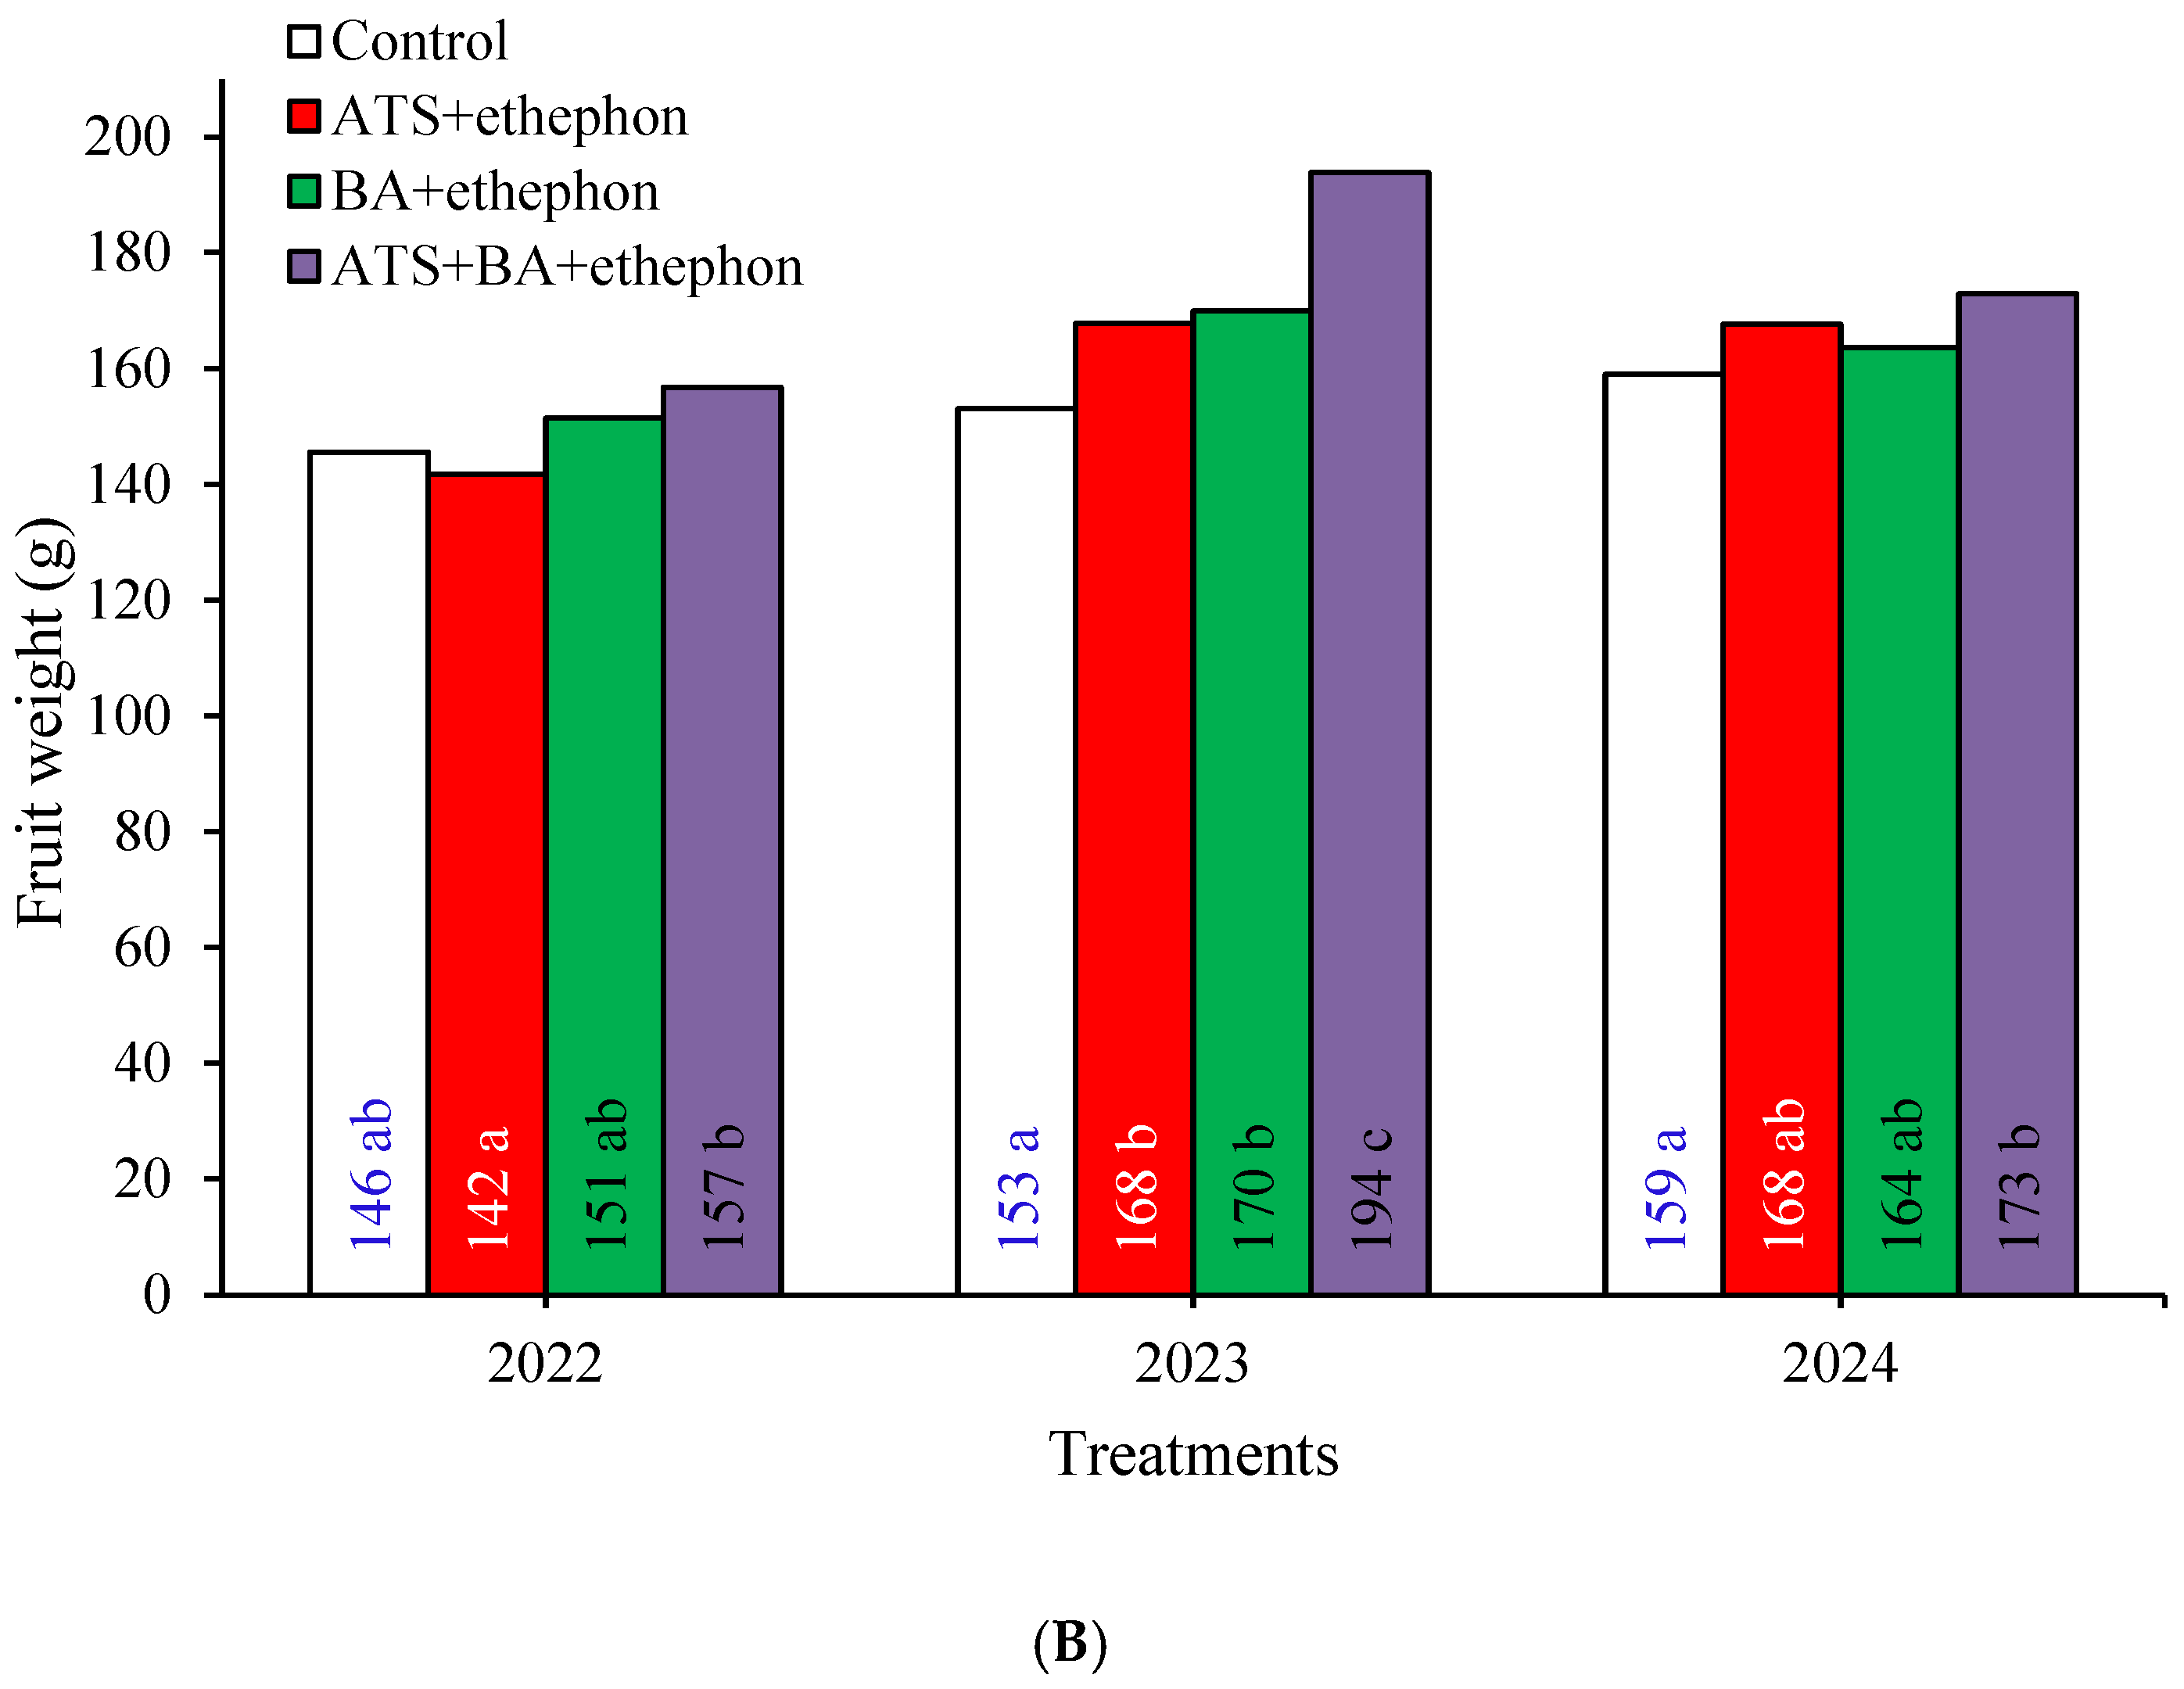
Over the three-year trial, fruit weight ranged from 142 to 194 g (Figure 4B). The highest fruit weight (194 g) was recorded in the ATS+BA+ethephon treatment in 2023, whereas the lowest value (142 g) was observed in the ATS+ethephon treatment in 2022. Treatment effects revealed that fruit weight was significantly higher in all thinning treatments than in the control treatment in 2023. Furthermore, the ATS+BA+ethephon treatment resulted in significantly higher fruit weight than the ATS+ethephon and control treatments in 2022 and 2024.

3.5.3. Water-Soluble Solids Content—SSC

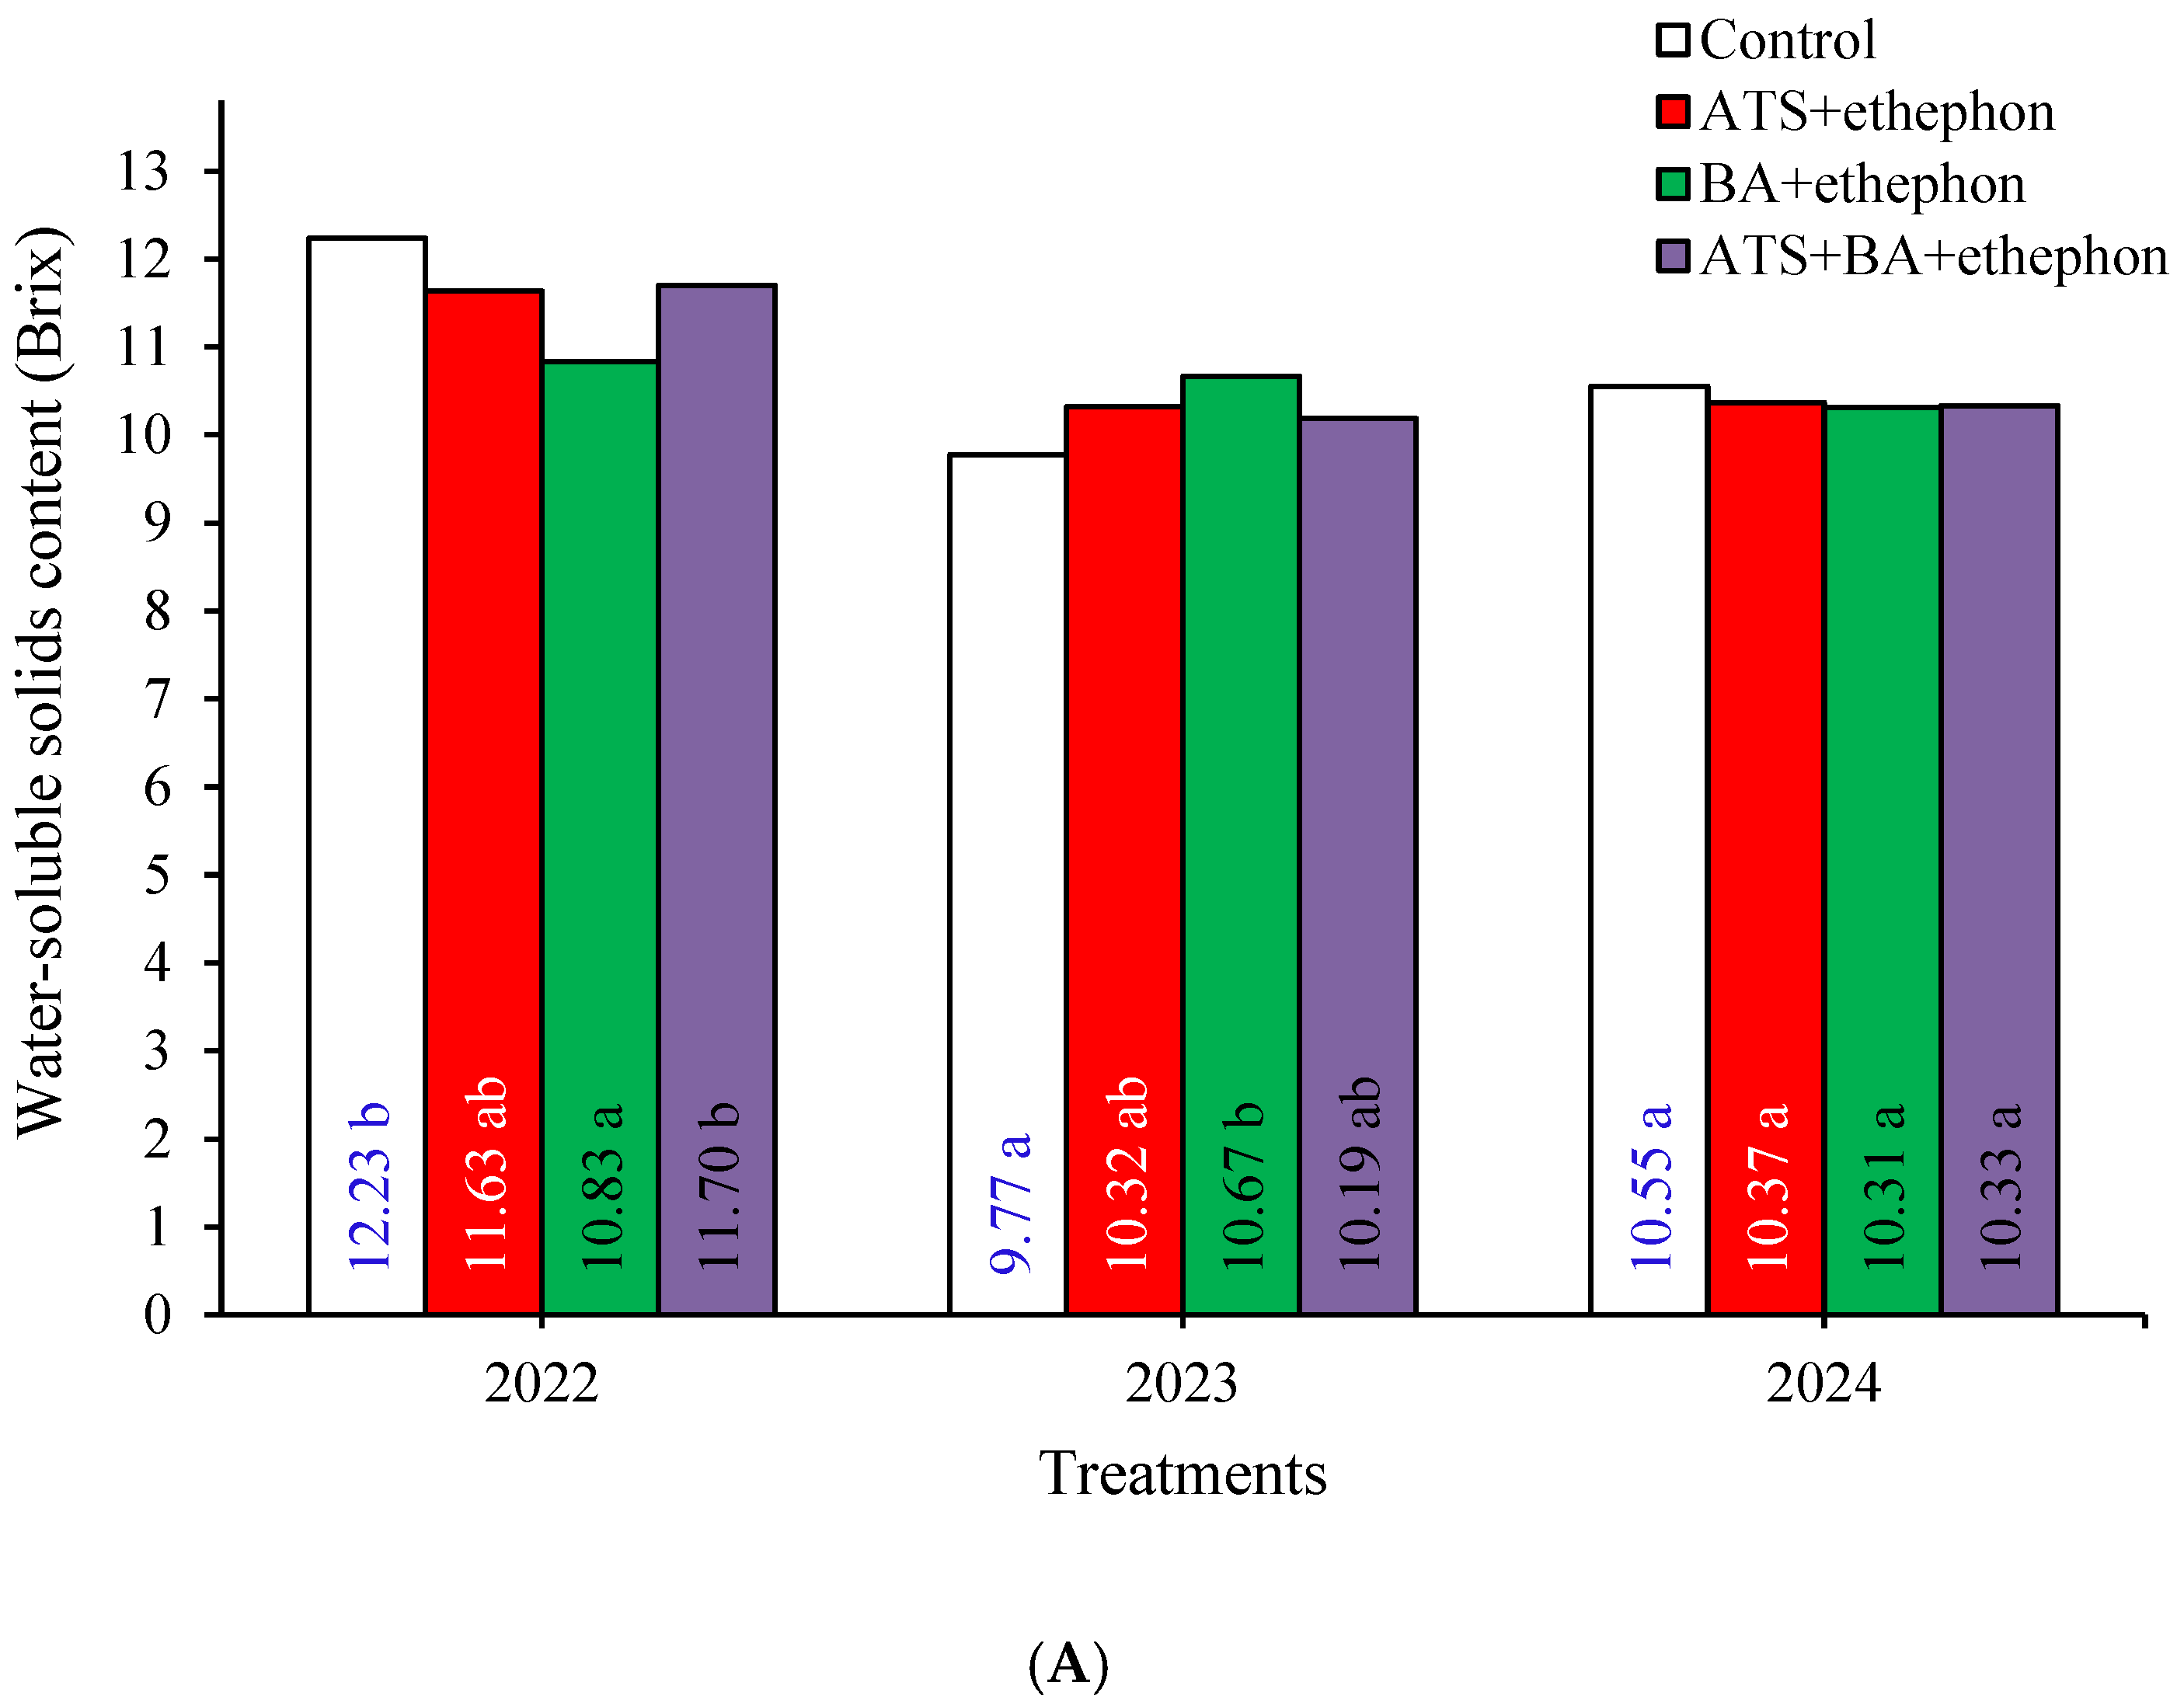
Water-soluble solids content ranged from 9.77 to 12.23 °Brix (Figure 5A). The lowest value (9.77 °Brix) was observed in the control treatment in 2023, whereas the highest value (12.23 °Brix) was recorded in the same treatment in 2022. A significant treatment effect was detected in 2022 and 2023. The BA+ethephon treatment showed significantly lower values (10.83 °Brix) than the control and ATS+BA+ethephon treatments (12.23 and 11.07 °Brix) in 2022. In contrast, in 2023, BA+ethephon treatment resulted in significantly higher values (10.67 °Brix) compared with the control treatment (9.77 °Brix).

3.5.4. Fruit Firmness—FF

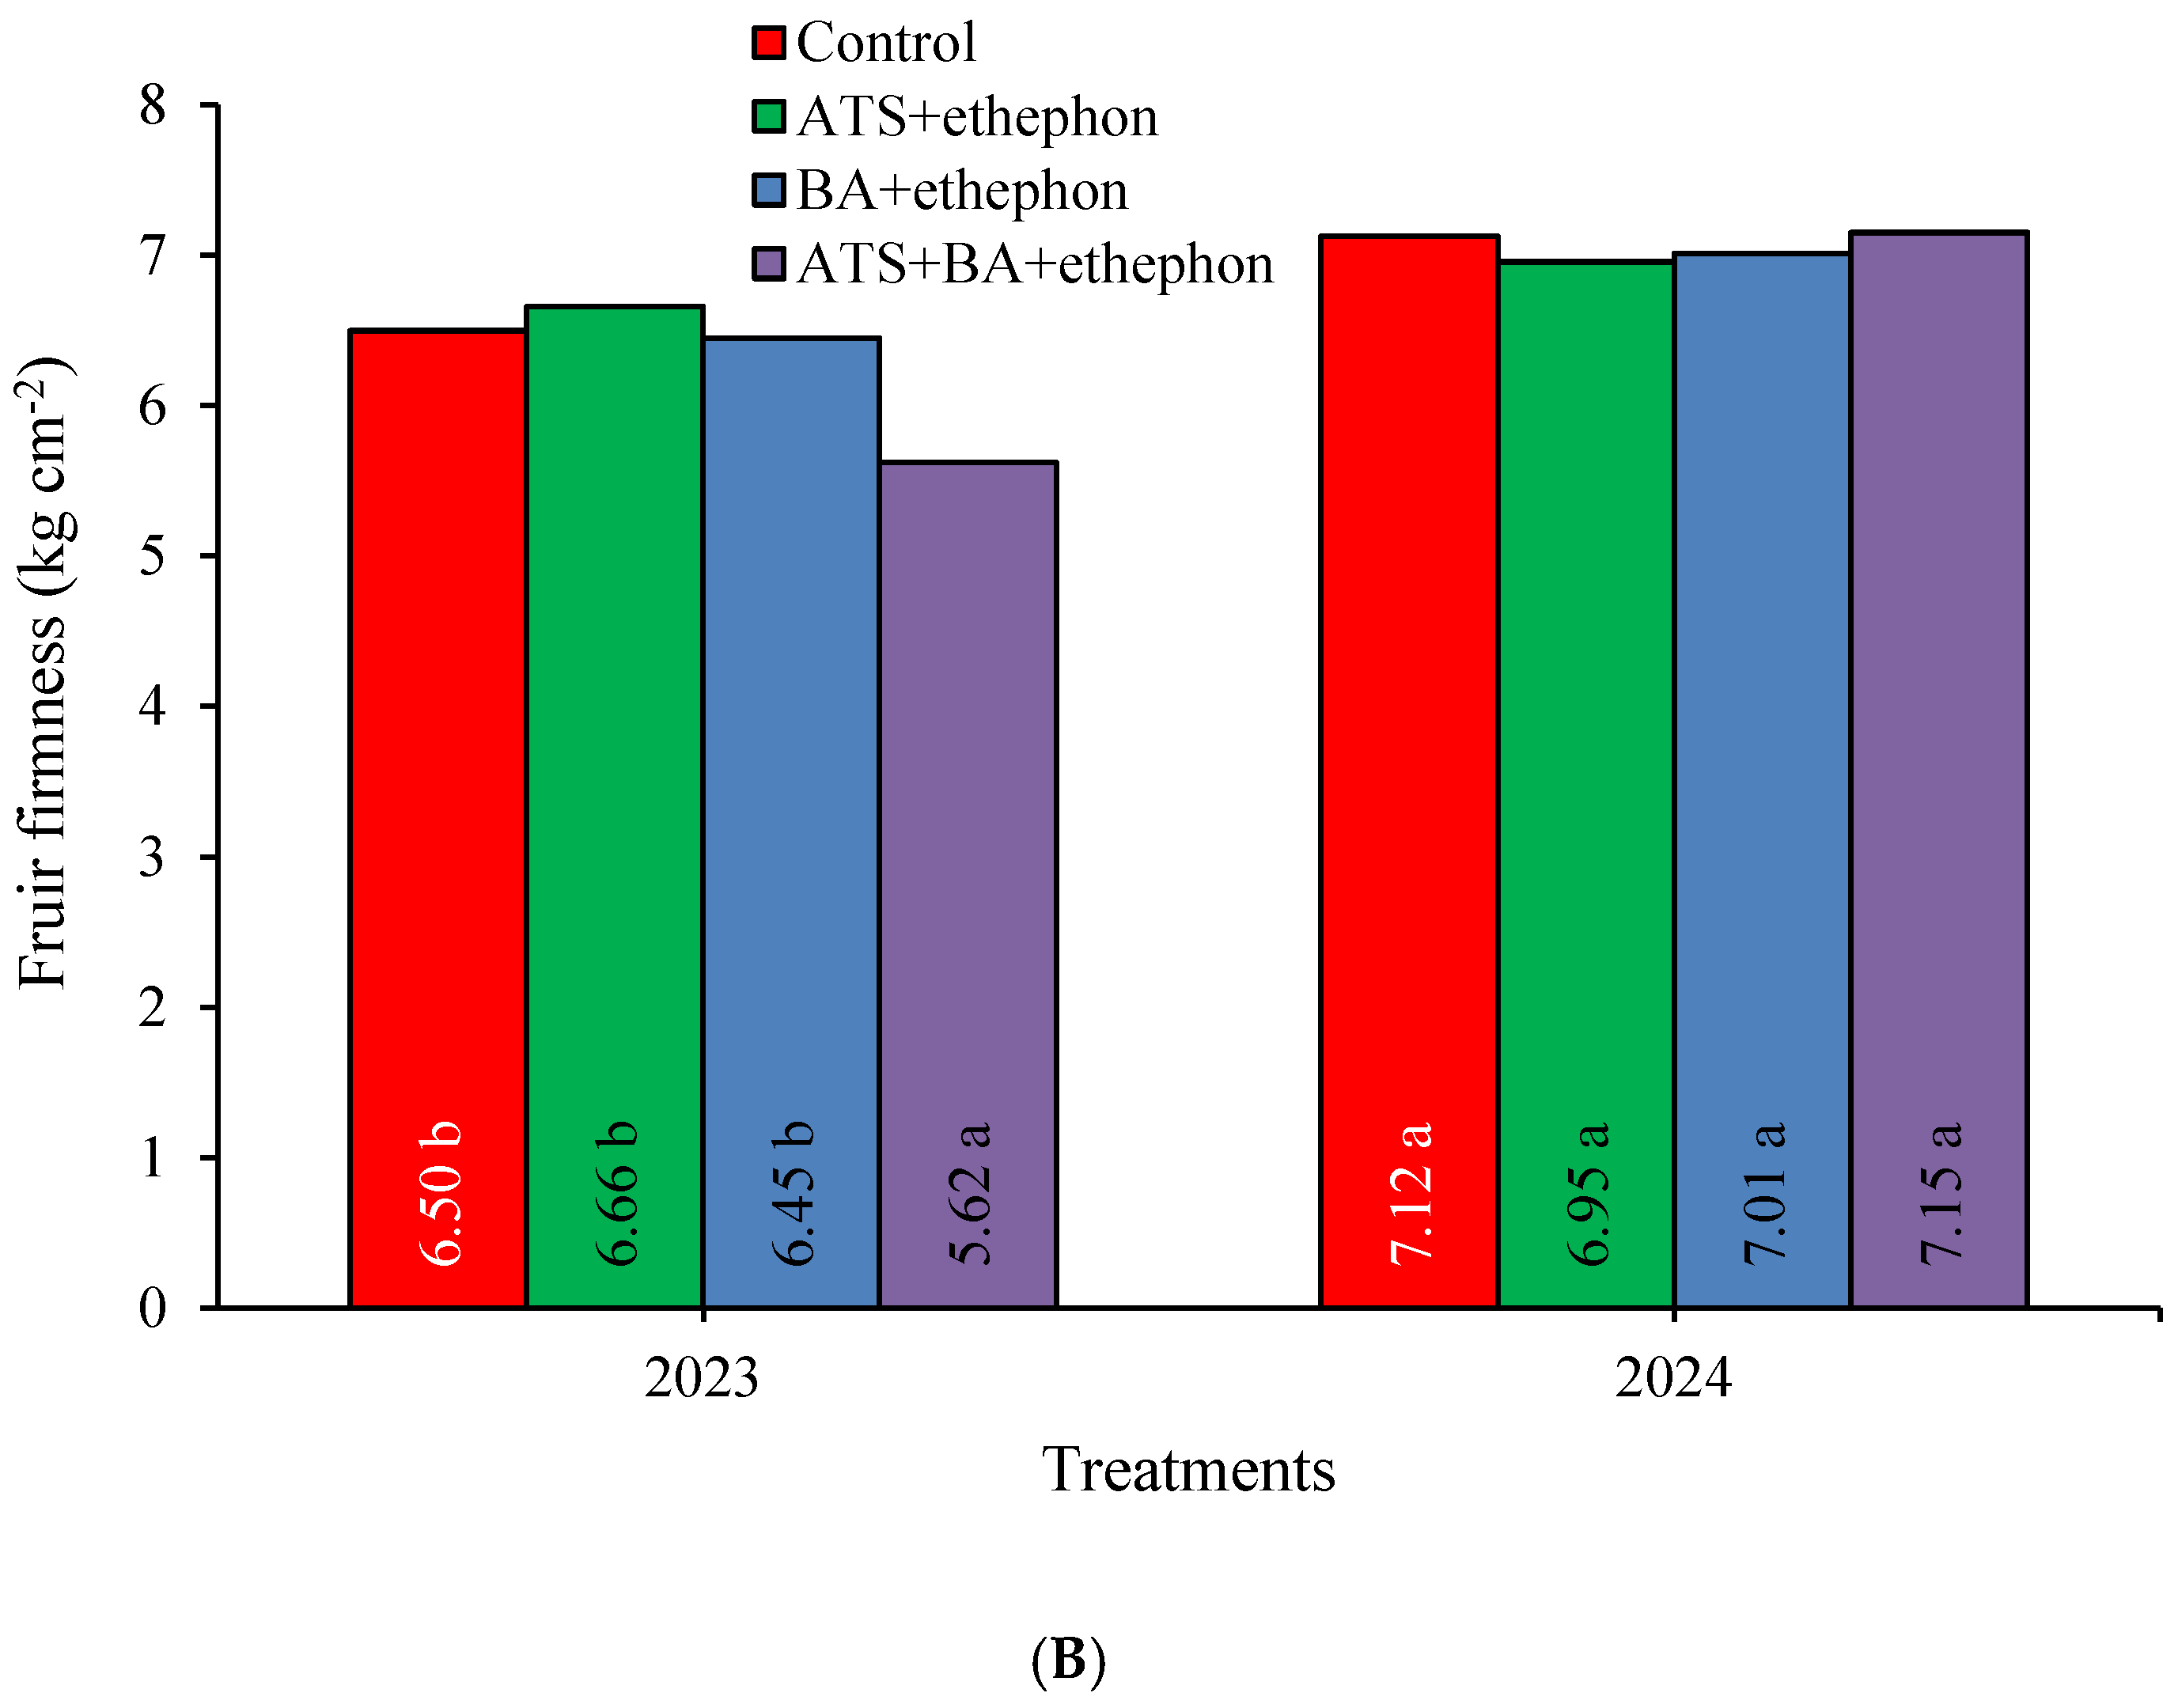
During the assessment period (2023–2024), fruit firmness ranged from 5.62 kg cm−2 in the ATS+BA+ethephon treatment in 2023 to 7.15 kg cm−2 in the same treatment in 2024 (Figure 5B). Regarding treatment effects, significant differences were detected in 2023, when fruit firmness in the ATS+BA+ethephon treatment was significantly lower (5.65 kg cm−2) than in the other three treatments (6.45–6.66 kg cm−2). In 2024, no significant differences between treatments were observed (Table 3).

3.6. Correlation Between Parameters

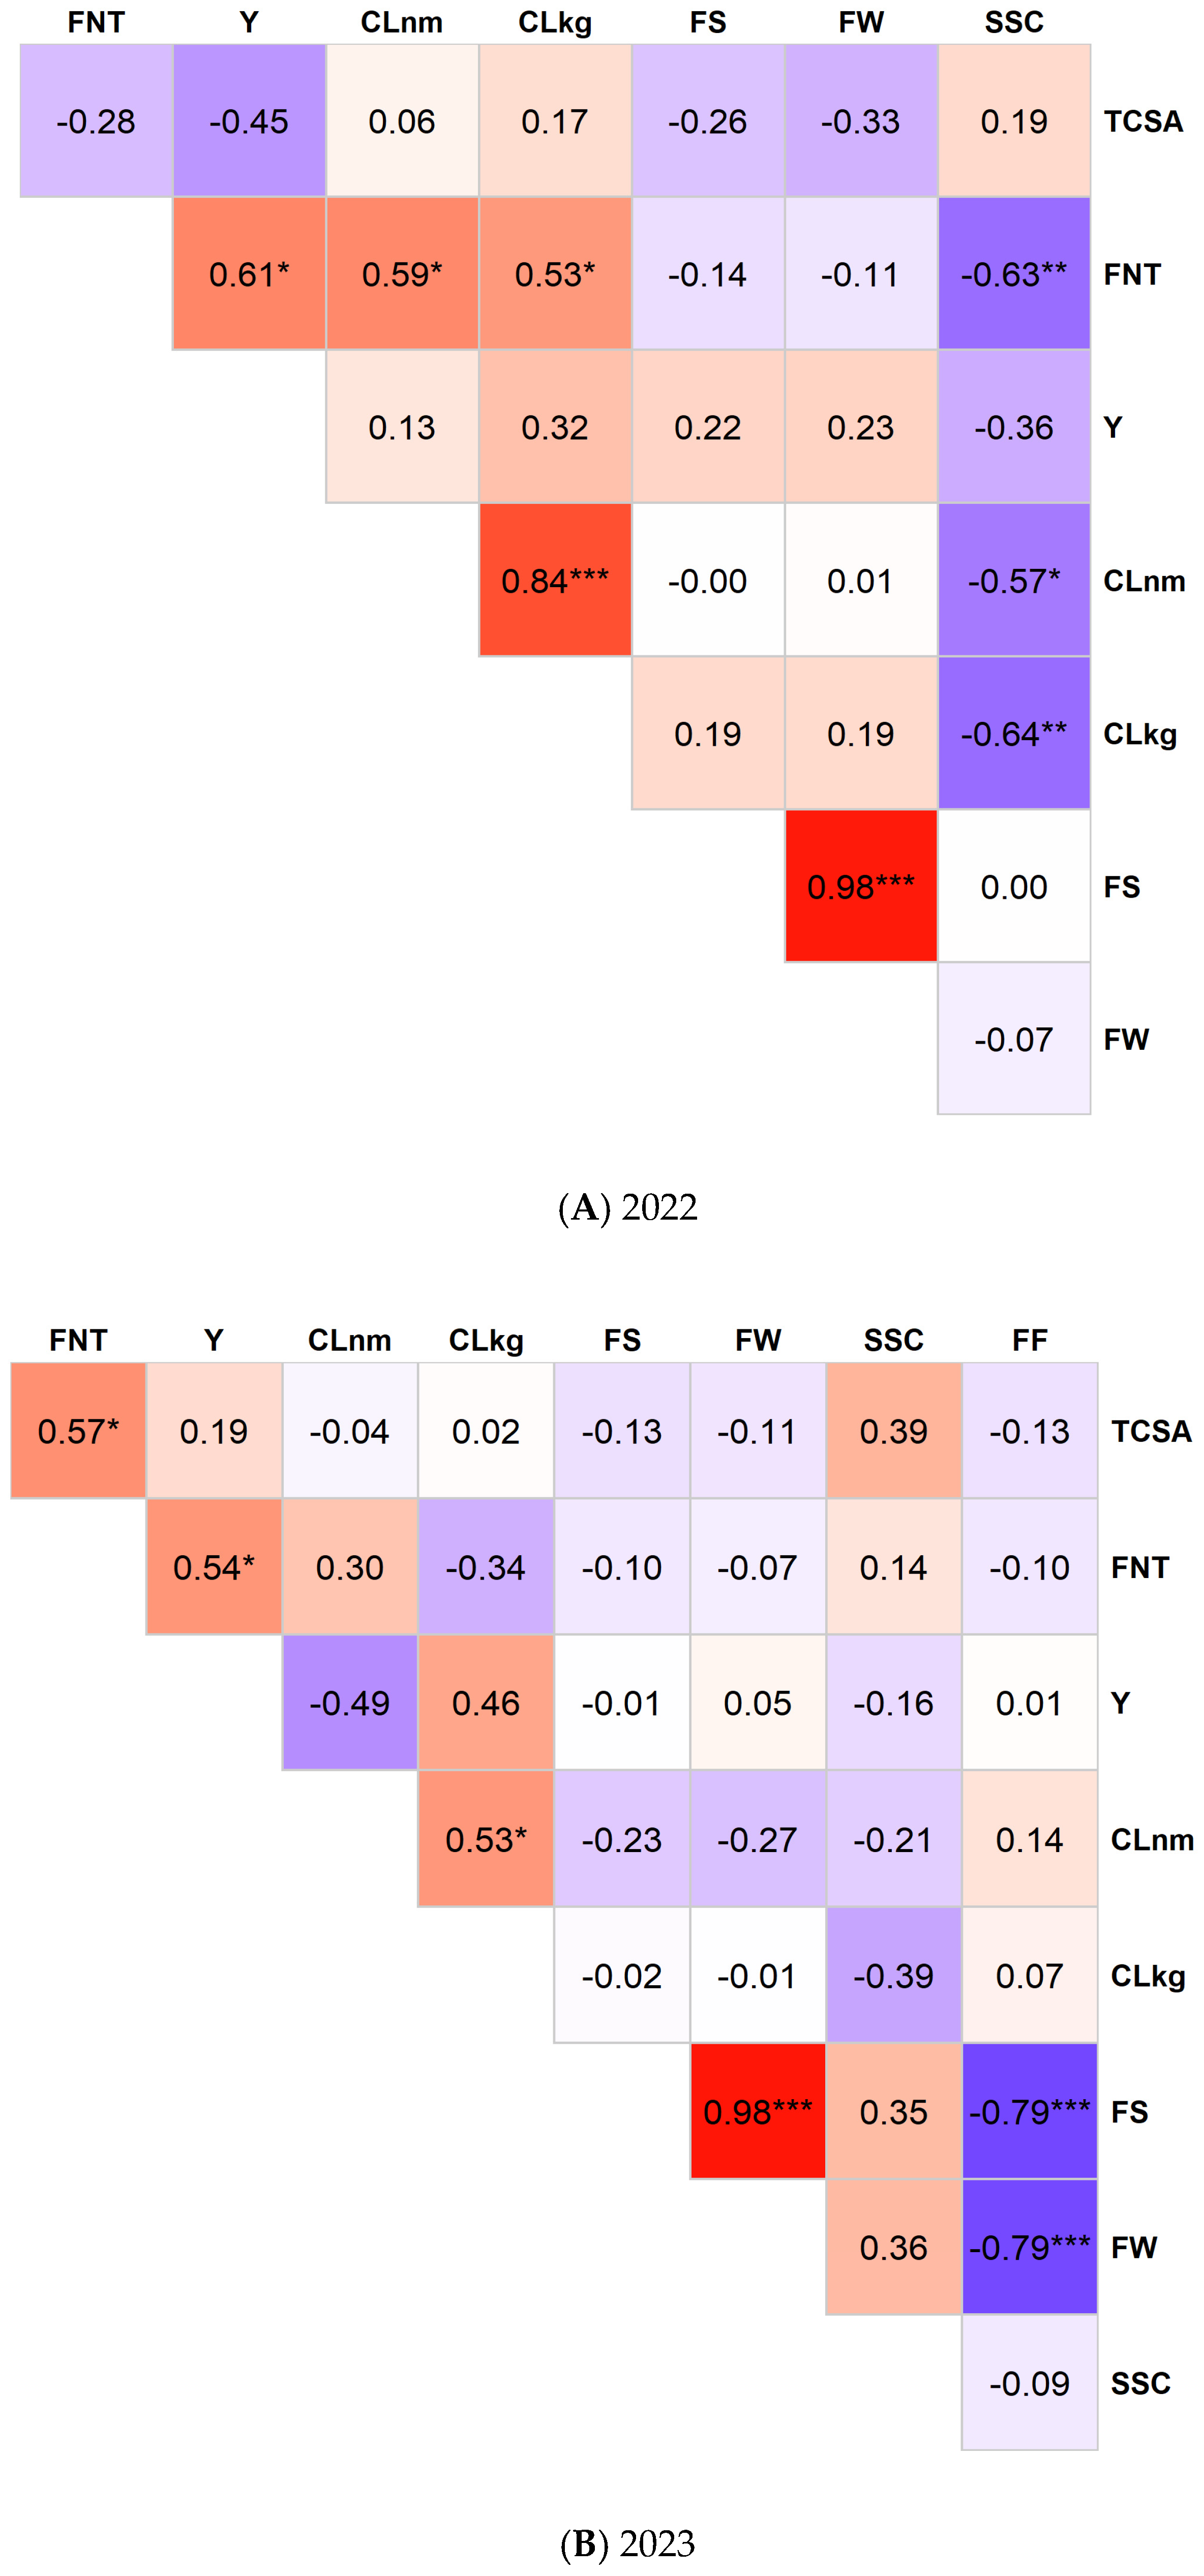
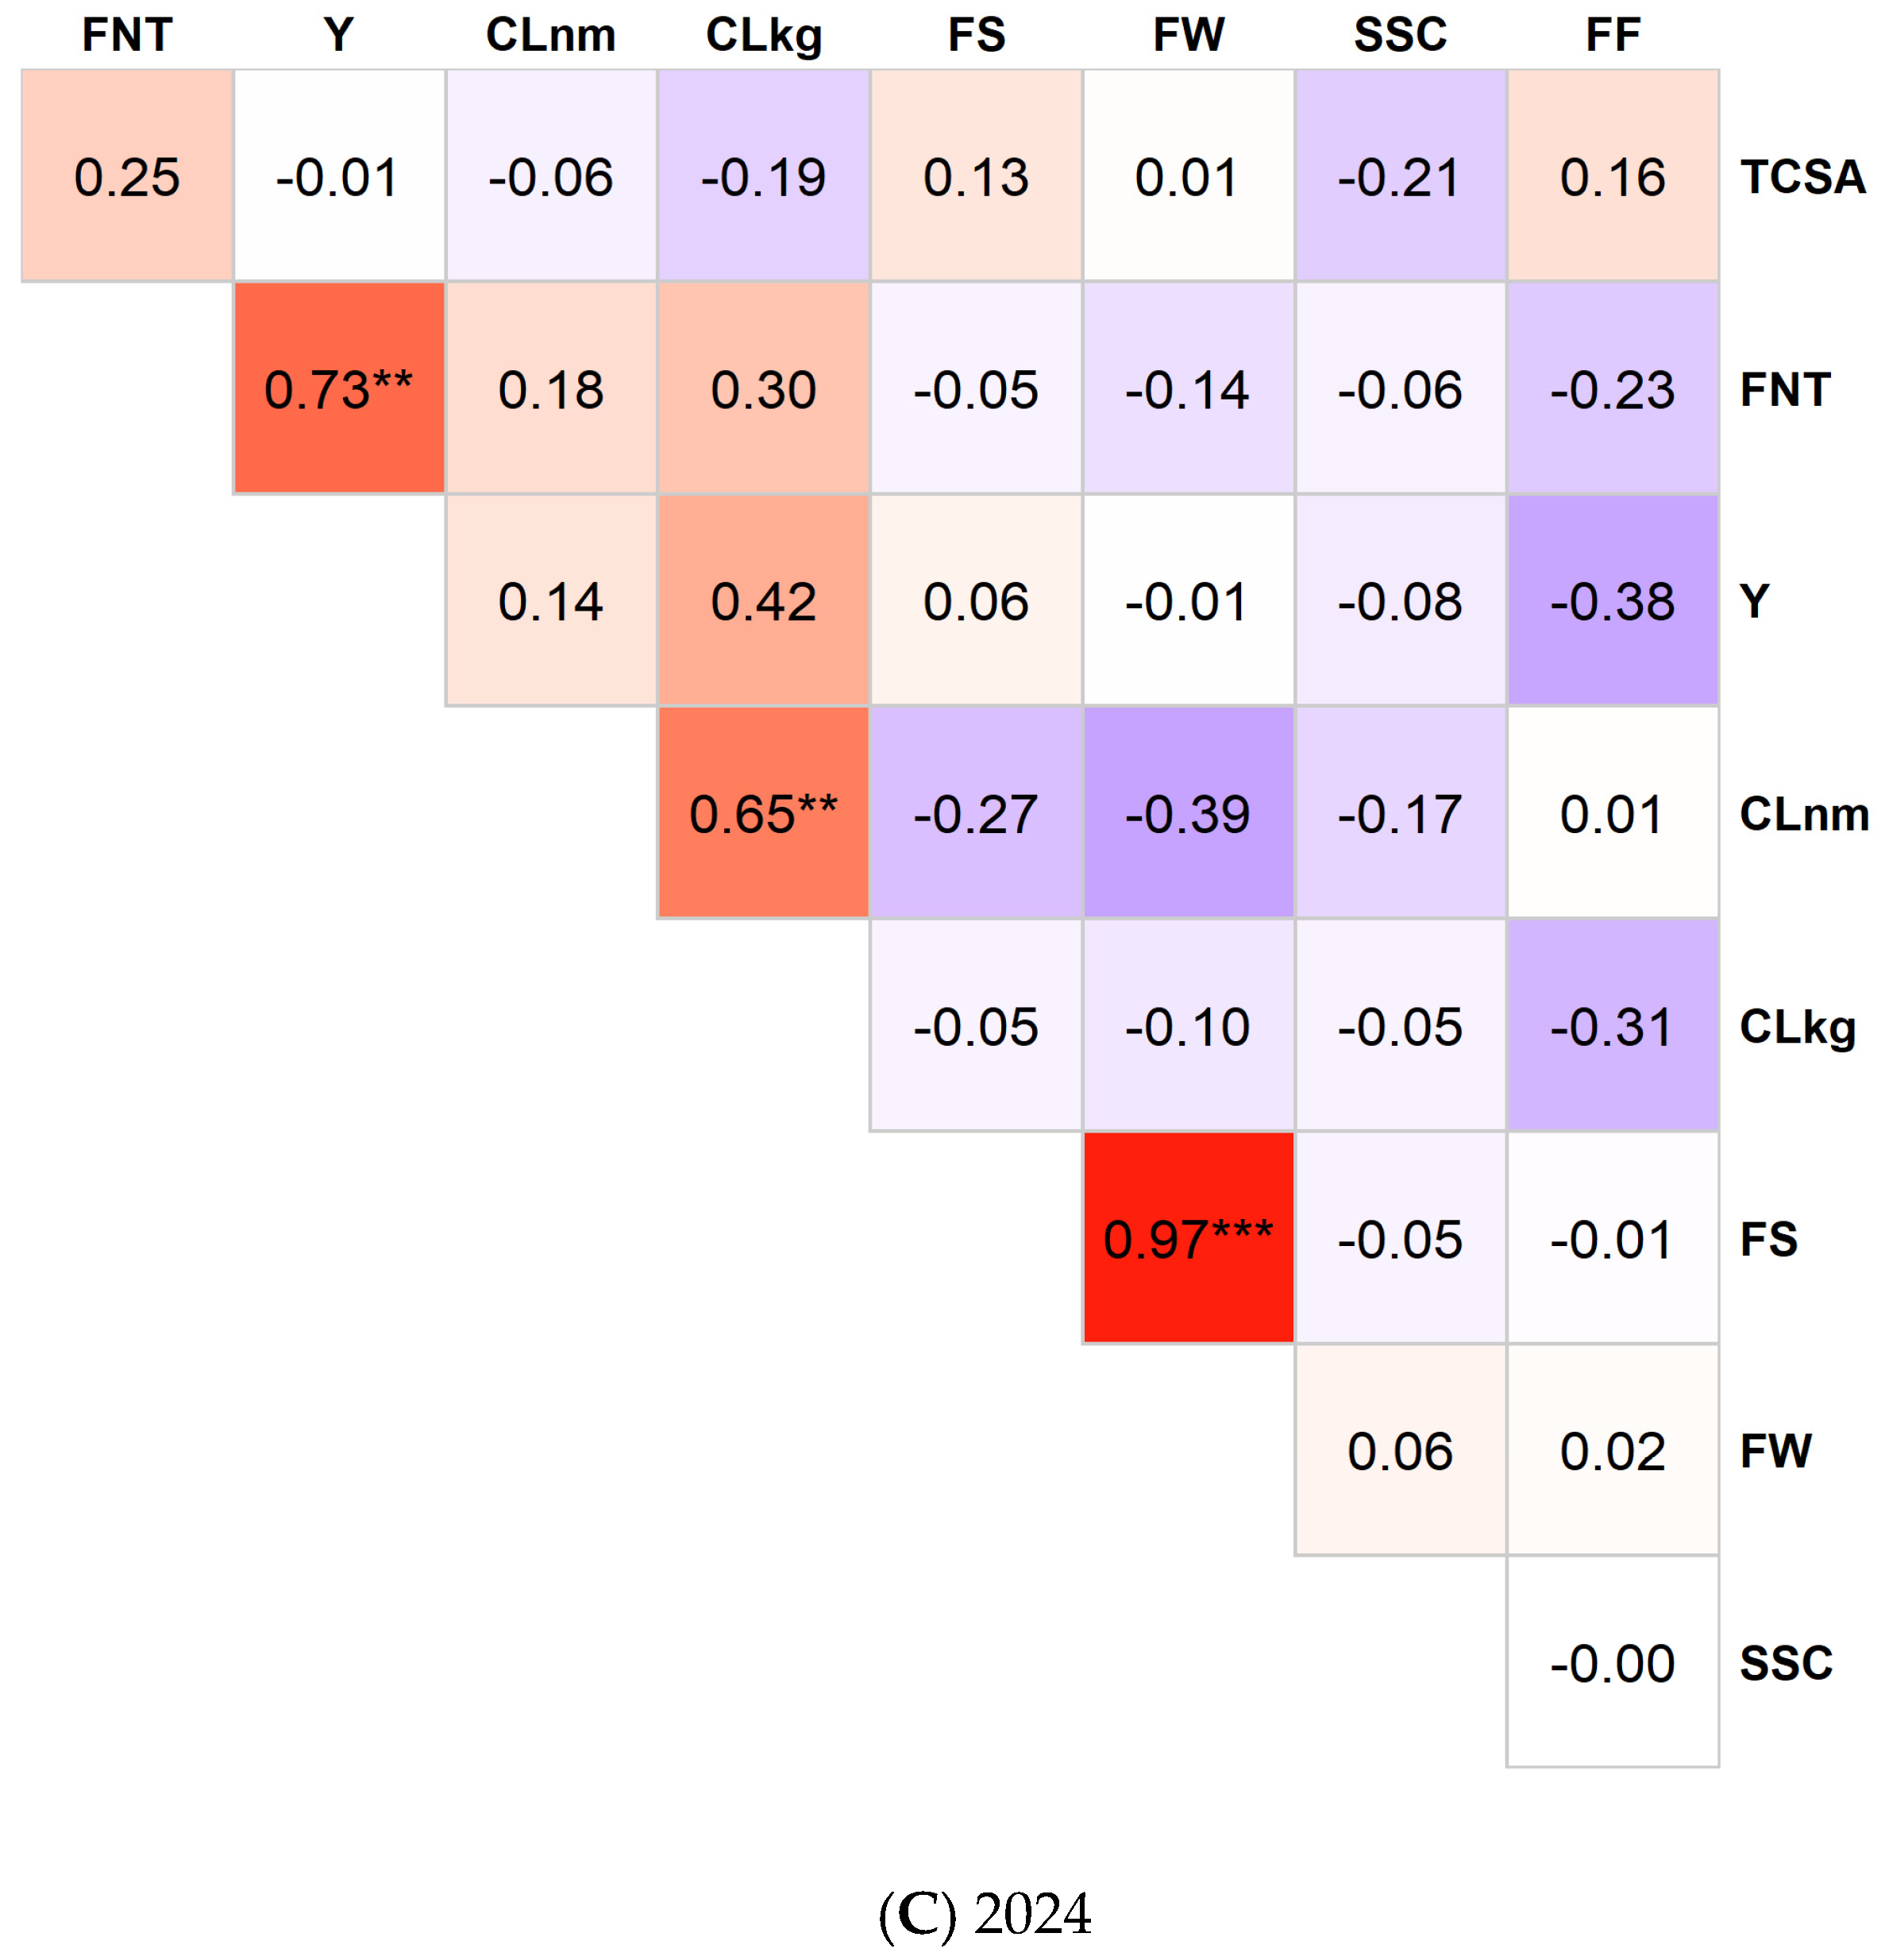
The highest Pearson correlation coefficient (r = 0.98) was observed between FW and FS in 2022 and 2023 (Figure 6A,B). In the 2022 dataset, the correlation coefficients were significant for eight parameter pairs, of which five were positive (Y vs. FNT, CLnm vs. FNT, CLkg vs. FNT, CLkg vs. CLnm, and FW vs. FS) and three were negative (SSC vs. FNT, SSC vs. CLnm, and SSC vs. CLkg) (Figure 6A). In the 2023 dataset, the correlation coefficients were significant for six parameter pairs, of which four were positive (FNT vs. TCSA, Y vs. FNT, CLkg vs. CLnm, and FW vs. FS) and two were negative (FF vs. FS and FF vs. FW) (Figure 6B). The r values for the 2024 dataset were significant for three parameter pairs, and all three were positive (Y vs. FNT, CLkg vs. CLnm, and FW vs. FS) (Figure 6C).

3.7. Linear Regression Among Selected Parameters

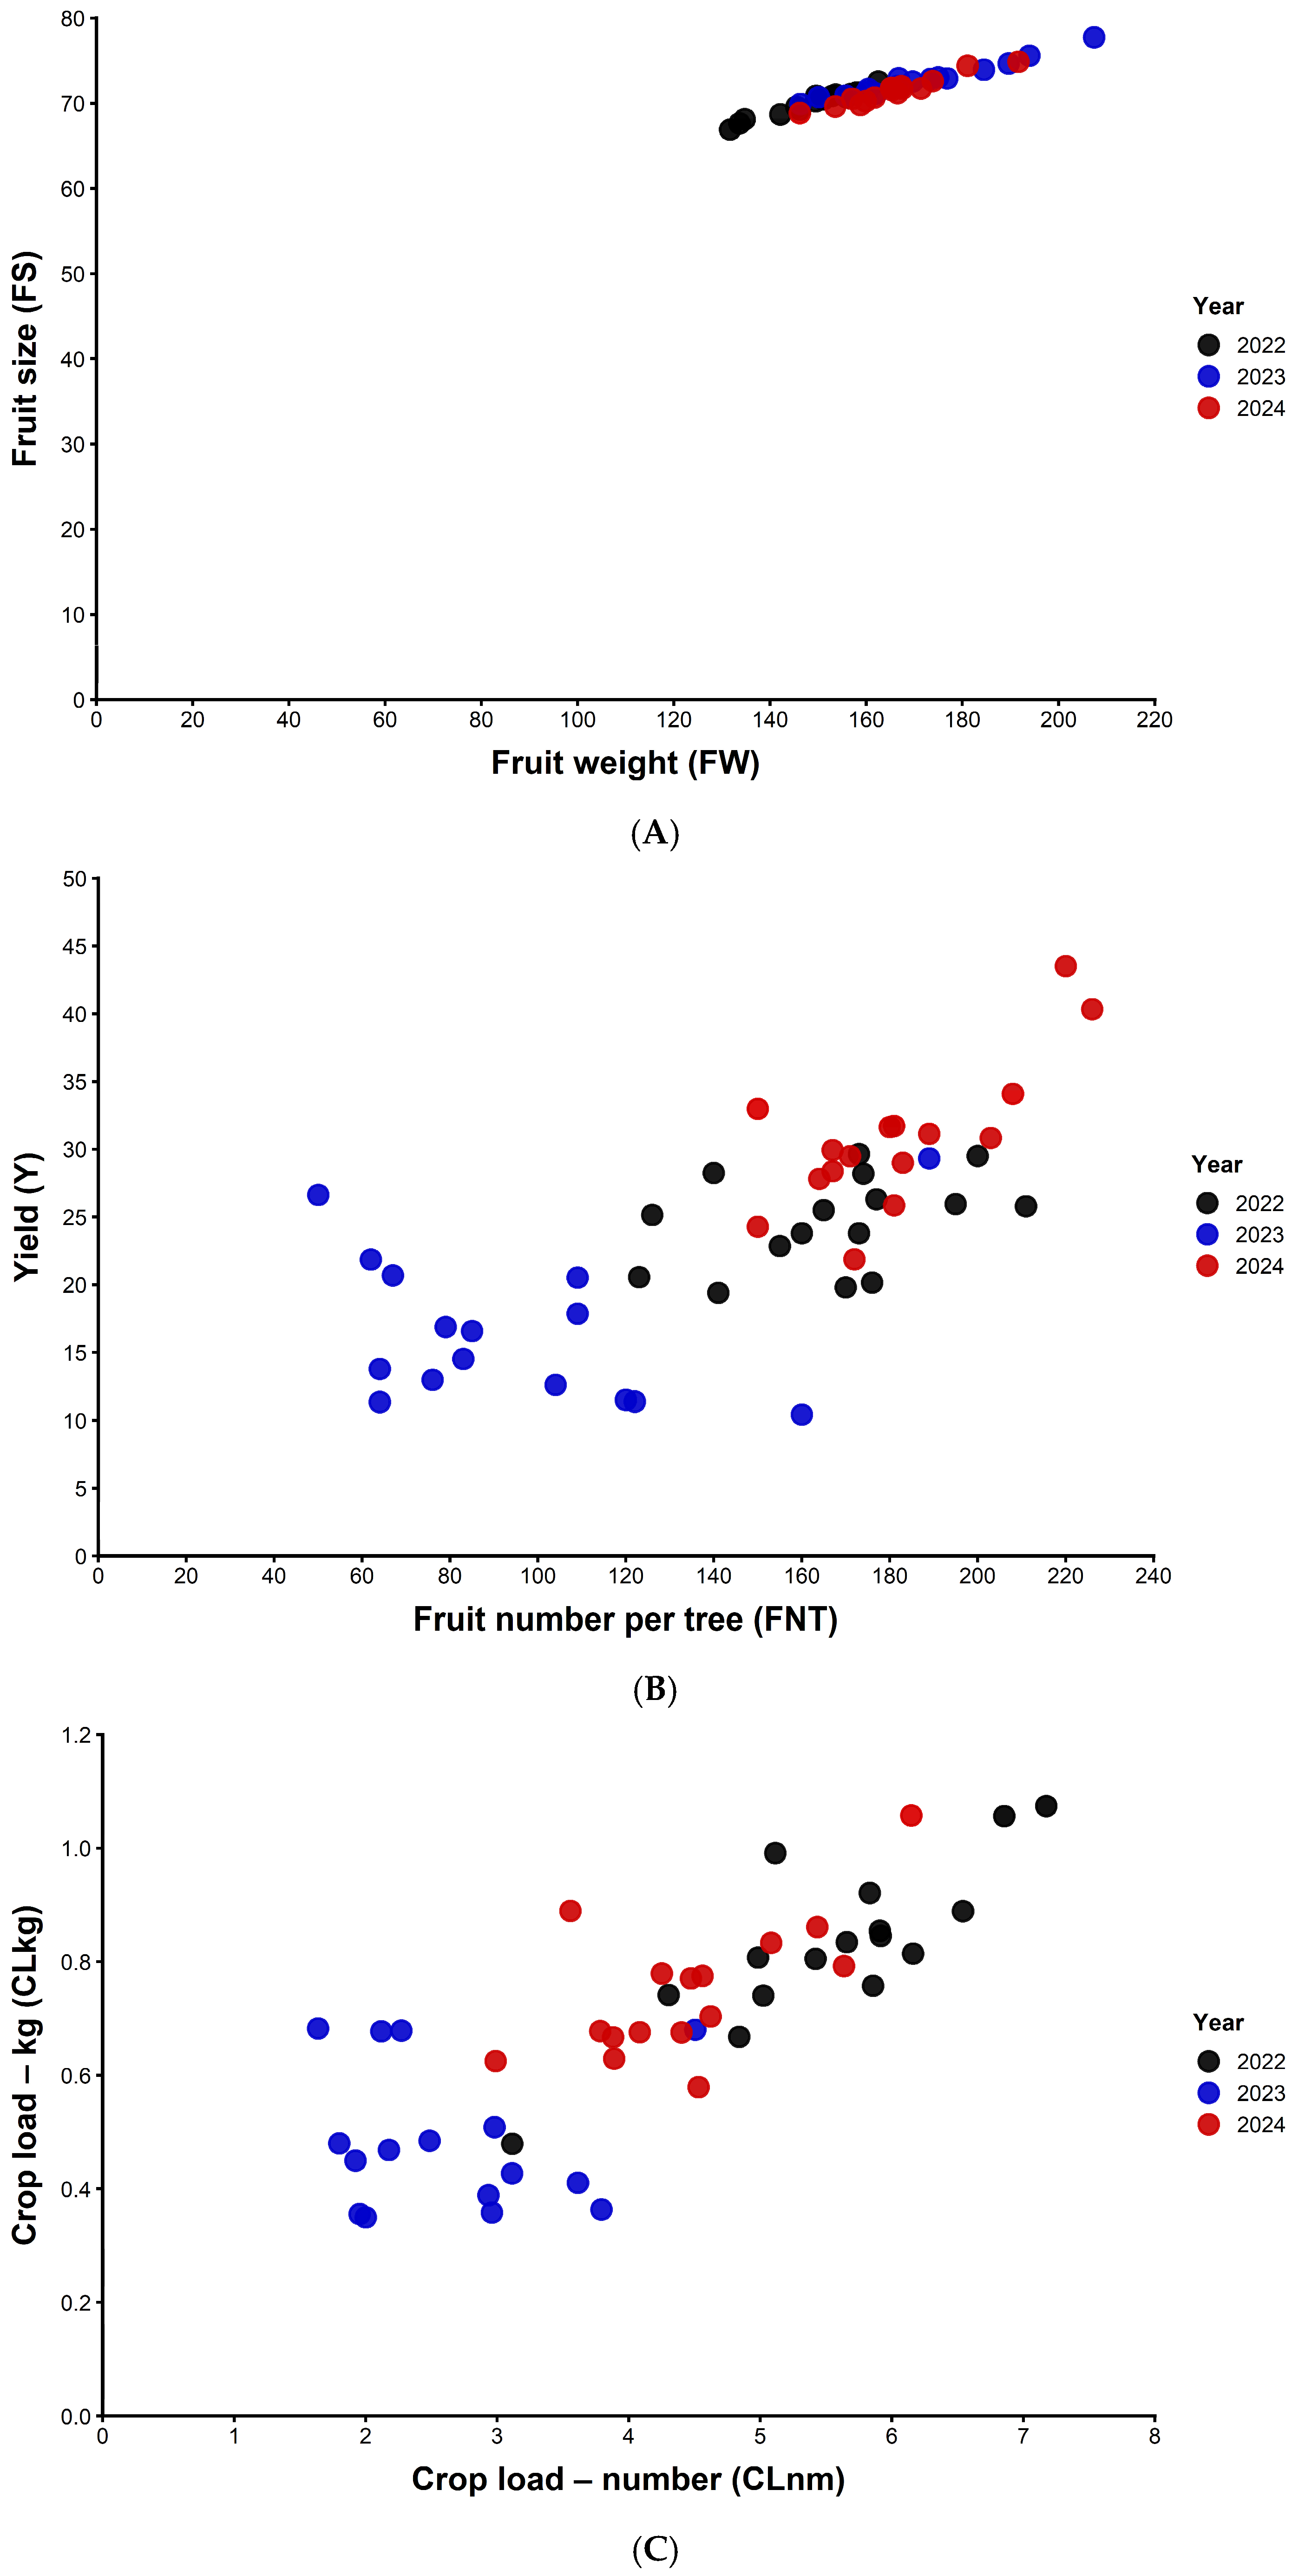
Among the evaluated trait relationships, FW vs. FS, FNT vs. Y, and CLnm vs. CLkg showed the most pronounced and consistent correlations across the overall dataset and individual thinning treatments. Therefore, these associations were selected for further evaluation using regression models (Figure 7). Significant linear relationships were obtained for all three variable combinations, with correlation coefficients ranging from r = 0.784 to 0.942 and corresponding p-values of 0.038–0.001 among the three years.
For the FW vs. FS relationship, increasing fruit weight was generally associated with a slight increase in fruit size across all thinning treatments (Figure 7A). The FNT vs. Y relationship showed that most fruit number per tree values increased proportionally with increasing yield, regardless of thinning treatments (Figure 7B). Finally, the CLnm vs. CLkg relationship indicated that increasing crop load, expressed in number per cm2, was associated with an increasing crop load, expressed in kg per m2, across all thinning treatments (Figure 7C).

3.8. Principal Component Analyses

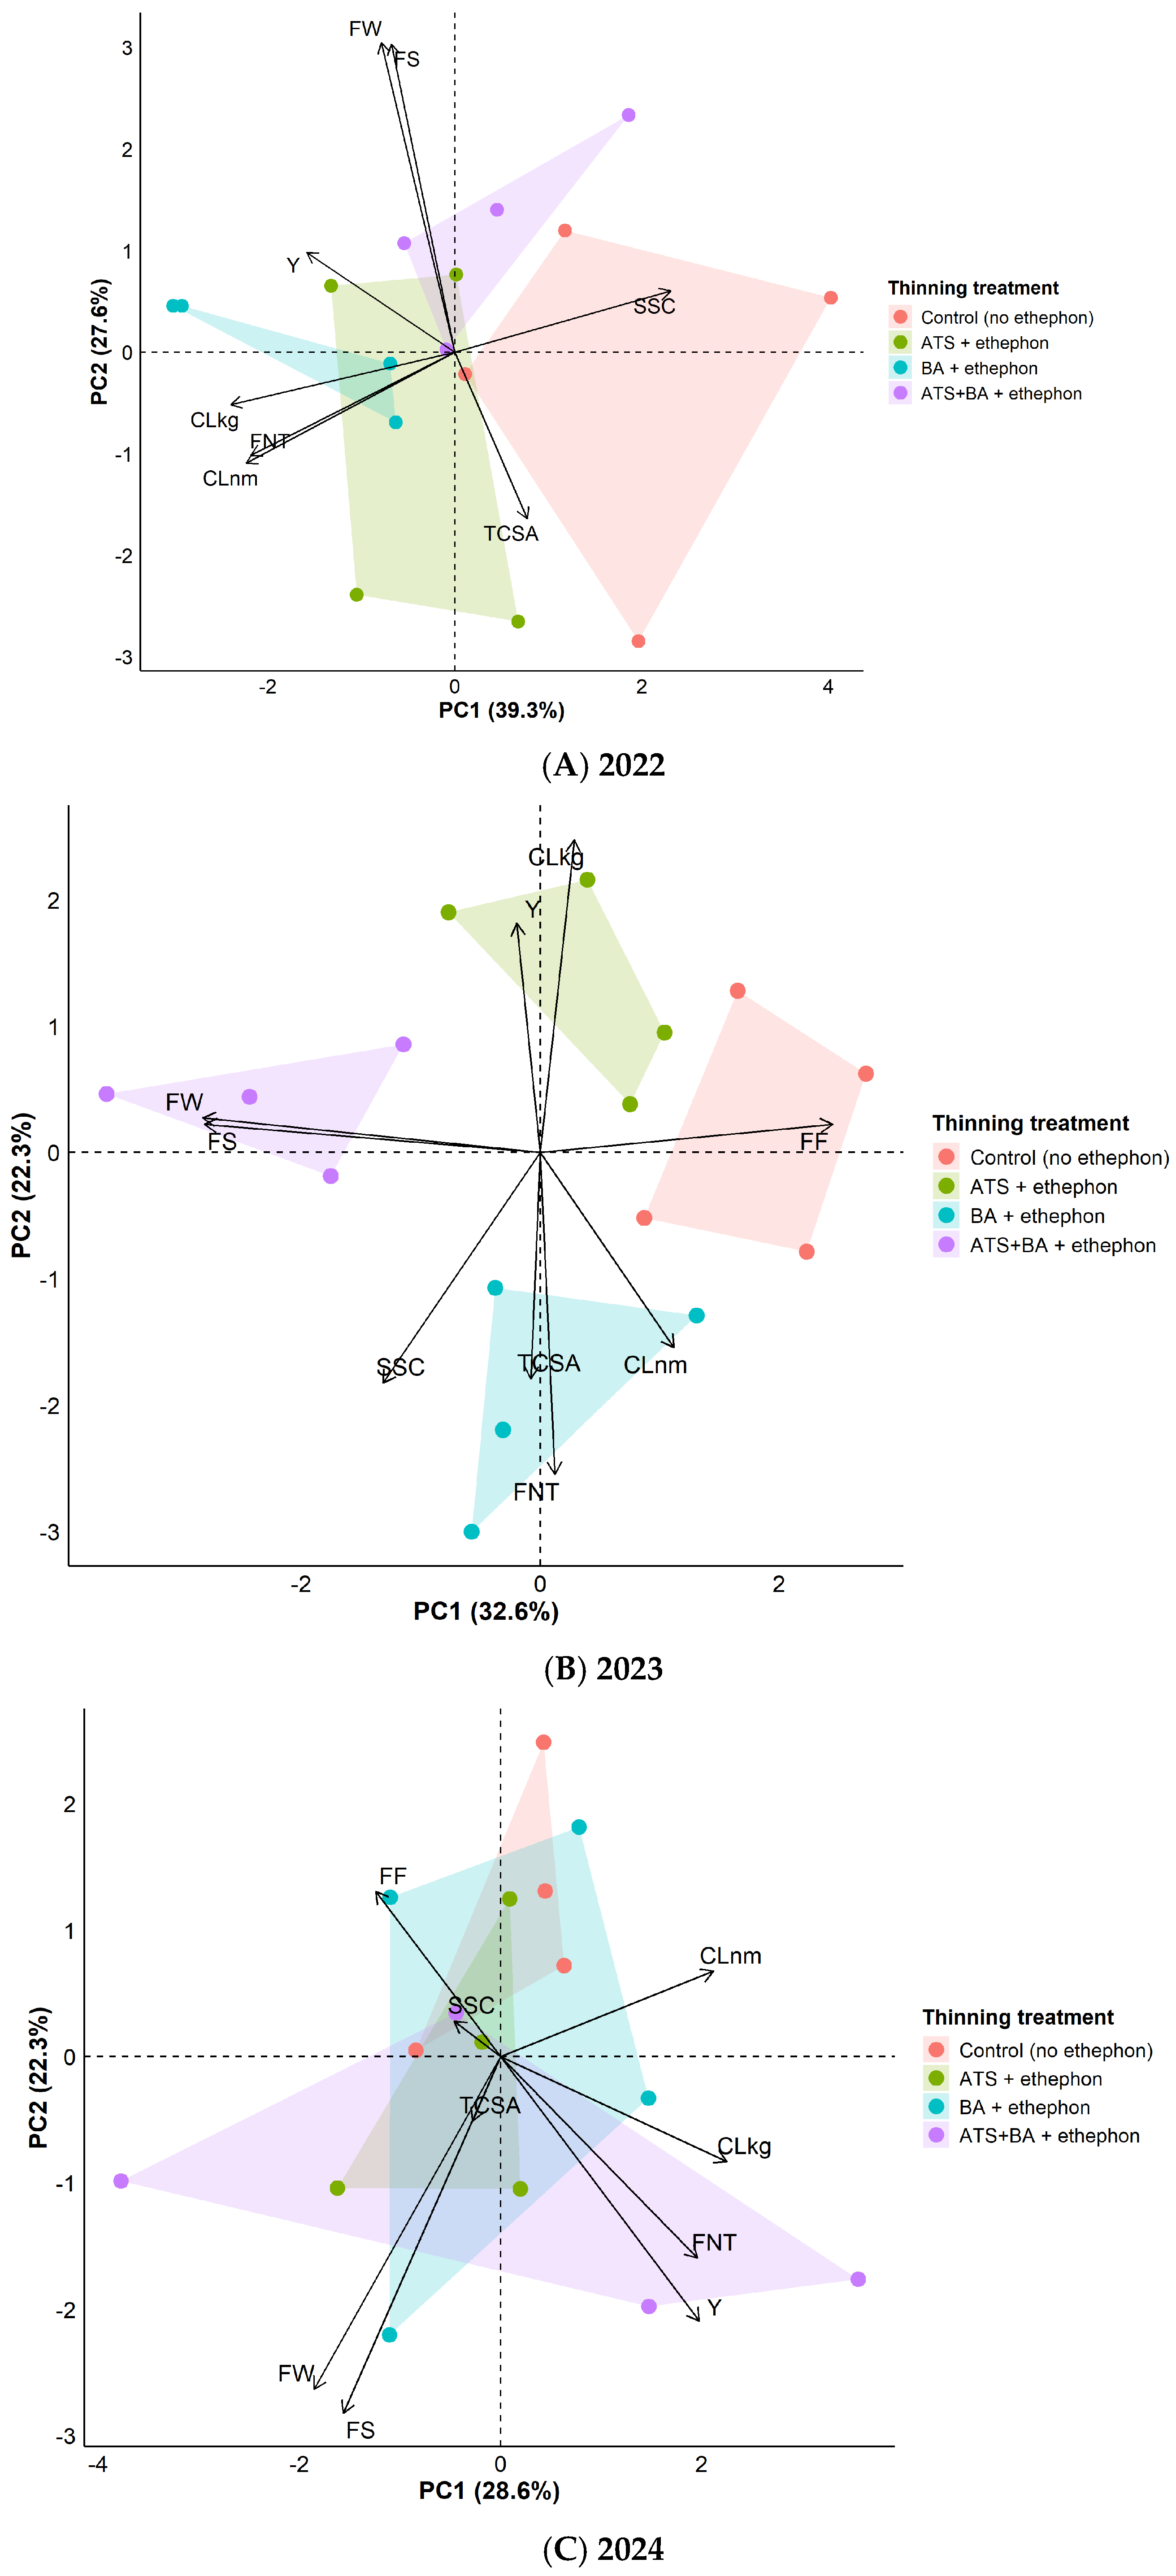
The first five principal components (PCs) together explained 95.62, 93.47, and 88.49% of the total variance in 2022, 2023, and 2024, respectively, and were therefore retained for further interpretation based on the cumulative variance criterion (Table 4). In 2022, PC1 accounted for 39.35% of the total variance and was mainly associated with FNT, CLnm, CLkg, and SSC (Table 4). PC2 explained 27.58% of the variance and was linked to FS and FW. PC3 contributed 16.63% of the variance and was primarily related to TCSA, Y, CLkg, and FS. PC4 explained 7.24% of the variance and was associated with TCSA and Y, while PC5 accounted for 4.82% of the variance and was mainly related to CLnm and SSC (Table 4). In 2023, PC1 accounted for 32.64% of the total variance and was mainly associated with FS, FW, and FF (Table 4). PC2 explained 22.25% of the variance and was linked to TCSA, Y, FNT, CLkg, and SSC. PC3 contributed 18.50% of the variance and was primarily related to TCSA, Y, and CLnm. PC4 explained 12.51% of the variance and was associated with FNT, CLnm, CLkg, SSC, and FF, while PC5 accounted for 7.57% of the variance and was mainly related to CLkg and SSC (Table 4). In 2024, PC1 accounted for 28.62% of the total variance and was mainly associated with Y, FNT, CLnm, CLkg, and FW (Table 4). PC2 explained 22.29% of the variance and was linked to Y, FS, and FW. PC3 contributed 15.18% of the variance and was primarily related to TCSA and SSC. PC4 explained 12.91% of the variance and was associated with CLnm, CLkg, and SSC, while PC5 accounted for 9.49% of the variance and was mainly related to SSC and FF (Table 4).
In the biplots, fruit size (FS) and fruit weight (FW) exhibited the longest variable vectors in all years. Both variables pointed toward the negative side of PC1 and the positive side of PC2 in 2022 (Figure 8A), toward the negative side of PC1 with near-zero coordinates on PC2 in 2023 (Figure 8B), and toward the negative sides of both PC1 and PC2 in 2024 (Figure 8C). In 2022, the CLkg, CLnm, and FNT vectors pointed toward the negative sides of both PC1 and PC2, whereas the SSC vector pointed toward the positive sides of both axes (Figure 8A). In 2023, the CLkg and FF vectors pointed toward the positive sides of both PC1 and PC2, whereas the FNT vector had a near-zero coordinate on PC1 and pointed toward the negative side of PC2 (Figure 8B). In 2024, the Y, FNT, and CLkg vectors pointed toward the positive side of PC1 and the negative side of PC2, whereas the CLnm vector pointed toward the positive sides of both PC1 and PC2 (Figure 8C). The remaining variables exhibited shorter vectors with varying orientations along PC1 and PC2 across the three years.

4. Discussion

The present study demonstrated that chemical thinning strategies affected selected components of reproductive performance and fruit quality in cv. ‘Gala Schniga Schnitzer’ apple trees, although treatment responses varied among traits and seasons. The absence of major frost damage or severe weather-related disturbances allowed the evaluation of thinning effects under representative intensive orchard conditions, while still capturing the influence of annual environmental variation on tree responses. This year-to-year variation was particularly evident in the magnitude and significance of treatment effects on fruit number, crop load indices, fruit size, and fruit quality, whereas trunk cross-sectional area was not significantly affected by thinning in any year.

4.1. Trunk Cross-Sectional Area

Trunk cross-sectional area (TCSA) is an important indicator of tree vegetative capacity in intensive apple orchards and provides the basis for expressing crop load relative to tree size [50]. In the present study, TCSA increased consistently from 2022 to 2024, but no differences were detected among the control, ATS+ethephon, BA+ethephon, and ATS+BA+ethephon treatments (Figure 1). This pattern is consistent with the ANOVA results, which showed no significant thinning treatment effect on TCSA in any of the three years (p = 0.533–0.798) (Table 3). This indicates that the observed differences in reproductive load, yield formation, and fruit quality occurred without detectable differences in trunk size among thinning treatments, suggesting that the short-term effects of thinning were expressed primarily in reproductive and fruit quality traits rather than in measurable trunk growth. Similar findings indicate that crop load manipulation may alter source–sink relationships and assimilate partitioning without causing measurable changes in trunk growth over relatively short experimental periods [51]. The continuous increase in TCSA across all treatments further suggests that ATS+ethephon- and BA+ethephon-based thinning strategies did not adversely affect the continued vegetative growth of the trees under the conditions of the present experiment.

4.2. Fruit Yield Components: Yield, Number, Size, and Weight

Fruit yield in intensive apple production depends on the balance between fruit retention and individual fruit growth, which determines productivity and fruit quality. Chemical thinning regulates this balance and must therefore be optimized to maintain yield while improving fruit size and weight [52,53].
In slender spindle orchard systems, target yields generally range between 20–25 kg tree−1, with approximately 90–110 fruits tree−1 [52,53]. Previous studies have characterized ‘Gala Schniga Schnitzer’ as a productive and regularly bearing cultivar under intensive orchard conditions [54]. In the present study, fruit number ranged from 65 to 189 fruits tree−1, and yield ranged from 12.0 to 35.3 kg tree−1 across the three experimental years (Figure 2A,B). Analysis of variance showed significant effects of thinning treatment on fruit number and yield, although the significance of the treatment effect varied among years. The treatment effect was significant for fruit number only in 2023, whereas yield was significantly affected by thinning treatment in all three years (Table 3). Such annual variation is consistent with previous findings showing that temperature, radiation, precipitation, and tree carbohydrate status influence flowering intensity, fruit retention, and thinning effectiveness [10,33,55].
Treatment effects on fruit number and yield varied among years. In 2023, ATS+ethephon-treated trees had fewer fruits than BA+ethephon-treated trees, whereas BA+ethephon produced the highest fruit number in 2024 (189 fruits tree−1). This response was particularly evident in 2023, when ATS+ethephon-treated trees produced the lowest fruit number (65 fruits tree−1) but maintained a relatively high yield (21.5 kg tree−1) due to increased fruit size. Similarly, in 2024, ATS+BA+ethephon produced the highest yield of the experiment (35.3 kg tree−1) without increasing fruit numbers compared with the other treatments, indicating that enhanced individual fruit growth contributed substantially to yield improvement (Figure 2A,B and Figure 4A,B). Thus, the yield response cannot be characterized simply as a consequence of reduced fruit number, but rather reflects treatment- and season-dependent changes in the balance between fruit retention and individual fruit growth. These responses agree with previous findings showing that ATS+ethephon and BA+ethephon applications can reduce fruit number while maintaining or improving fruit size, although the magnitude of the response depends on cultivar, application timing, and environmental conditions [3,26,27,34,37].
The observed relationship between reproductive load and yield reflects source–sink regulation in apple trees, where reduced fruit number decreases competition among reproductive sinks and increases assimilate availability for the remaining fruits [56]. Previous studies have demonstrated that reduced crop load can maintain yield efficiency through increased individual fruit growth rather than higher fruit number [50,53]. In the present experiment, the strong positive relationships between fruit number and yield, and between fruit weight and fruit size (Figure 6 and Figure 7A,B), were consistent with the close contribution of fruit number to total yield and the close association between fruit weight and fruit size. Therefore, thinning responses should be interpreted through the integrated relationships among reproductive load, yield formation, fruit growth, and quality development rather than through individual parameters alone.
The ATS+ethephon treatment provided a clear example of the fruit treatment-dependent response in 2023, when ATS+ethephon resulted in the lowest fruit number (65 fruits tree−1) but maintained a yield of 21.5 kg tree−1, indicating that the lower fruit number was accompanied by greater individual fruit development. ATS acts primarily as a blossom thinner by reducing initial fruit set and thereby modifying early reproductive demand [57,58]. Similar responses have been reported in ‘Gala’ and other apple cultivars, where ATS reduced fruit number while maintaining commercially acceptable yields through improved fruit growth [21,57,59]. Basak [27] similarly demonstrated that ATS and BA applications reduced fruit number while improving fruit size and reducing biennial bearing tendency in several apple cultivars, including ‘Gala’.
Fruit size and fruit weight are among the most important determinants of apple market value, with fruits exceeding approximately 70 mm in diameter generally preferred for premium markets [53,60]. Previous studies on ‘Gala’ clones have shown that inadequate crop regulation may restrict fruit size development, whereas effective thinning promotes commercially desirable fruit characteristics [61,62]. In the present study, fruit size ranged from 69.1 to 75.5 mm across treatments and years. The 70 mm threshold was reached in all treatment combinations except the control and ATS+ethephon treatments in 2022. A significant thinning treatment effect on fruit size was detected only in 2023, when ATS+BA+ethephon produced larger fruit than the control (Figure 4A). The larger fruit observed with ATS+BA+ethephon in 2023 may be consistent with complementary effects of blossom and fruitlet thinning, although the present data do not allow the relative contribution of the two active ingredients to be separated mechanistically [63,64]. BA alone had variable effects on fruit number, yield, and fruit growth depending on year (Figure 2A and Figure 4A,B). Notably, fruit weight was more responsive to thinning than fruit size in several treatment–year combinations: in 2023, all thinning treatments produced significantly heavier fruit than the control, while ATS+BA+ethephon also produced higher fruit weight than ATS+ethephon and the control in 2022 and 2024. Similar advantages of combined ATS and BA applications have been reported previously, demonstrating improved fruit size and productivity characteristics compared with single-component thinning strategies [21,32,65].

4.3. Fruit Yield Components: Crop Load Measures

In apple production, the generally accepted optimal crop load is 6–8 fruits cm−2 [66]. According to Robinson and Watkins [50], fruit coloration begins to decline at a crop load of 6 fruits cm−2, while at 10 fruits cm−2, marketable fruit coloration can no longer be achieved. Robinson [67] also suggested that, for the cv. ‘Gala’, crop load should be maintained at approximately 6 fruits cm−2. Similar conclusions were reported by Ding [56], who found that a crop load of 6 fruits cm−2 already increases the tendency toward biennial bearing. Bound [53] reported that the cv. ‘Gala’ is capable of sustaining crop loads of up to 8 fruits cm−2 without negatively affecting return bloom; however, fruit quality may be compromised under such conditions. In some ‘Gala’ clones, fruits can achieve the required quality parameters even at crop loads of 9.7–12.7 fruits cm−2 [62]. In the present study, crop load values ranged from 1.87 to 6.11 fruits cm−2 (Figure 3A), and therefore generally did not exceed the threshold of 6 fruits cm−2 that is most commonly recommended in previous studies.
Regarding treatment effects, the ATS+ethephon treatment resulted in a significantly lower crop load in 2023 (1.87 fruits cm−2) compared with the control and BA+ethephon treatments (3.08–3.16 fruits cm−2) (Figure 3A). However, no similar effect was observed in 2022 or 2024. The same pattern was observed for crop load expressed as yield per unit TCSA (CLkg): in 2023, ATS+ethephon resulted in a significantly higher CLkg (0.57 kg cm−2) than BA+ethephon (0.38 kg cm−2), whereas in 2022, BA+ethephon showed a significantly higher CLkg (0.94 kg cm−2) than the control (0.73 kg cm−2). No significant treatment differences were detected in 2024. Due to the high risk of spring frost and the lower flower density, ammonium thiosulfate application in 2024 was postponed until the onset of petal fall in king flowers, which may have contributed to the lower efficiency of the ATS+ethephon treatment. Cline et al. [59] also reported inconsistent results regarding the effectiveness of ATS+ethephon in a four-year study conducted on the ‘Gala’ and ‘Honeycrisp’ apple cultivars. However, other studies have demonstrated that ATS+ethephon is an effective blossom-thinning agent [21,32].
In our study, BA+ethephon treatment did not result in a significant reduction in crop load in the ‘Gala Schniga Schnitzer’ apple cultivar in any of the evaluated years compared with the control treatment (Figure 3). Several previous studies have demonstrated that responses to benzyladenine are not always consistent. Bound et al. [68] emphasized that the effectiveness of BA is strongly influenced by trees’ physiological conditions and year-specific characteristics. According to Lakso et al. [69], BA thinning efficacy is closely related to tree carbohydrate status, which is largely determined by environmental conditions. Consequently, the same treatment may produce different responses in different years. Similarly, Botton et al. [64] reported that the effect of BA is highly dependent on environmental conditions and tree developmental stage.
The strong positive relationship between CLnm and CLkg (Figure 6 and Figure 7C) demonstrates that increasing reproductive density was consistently associated with increased yield per unit tree capacity. This relationship was significant across the evaluated datasets, with the regression analysis showing a positive linear association between CLnm and CLkg (Figure 7C). The absence of differences among the regression slopes of control, ATS+ethephon, BA+ethephon, and ATS+BA+ethephon treatments indicates that thinning strategies modified absolute crop load levels without changing the fundamental relationship between reproductive density and yield accumulation. This suggests that the relationship between the number of fruits relative to tree size and the corresponding fruit mass relative to tree size was not substantially altered by the thinning treatments. Thus, CLnm and CLkg represent complementary indicators of reproductive balance, where CLnm reflects sink number, and CLkg integrates fruit retention and individual fruit growth. Similar relationships between crop load, yield efficiency, and tree capacity have been reported in intensive apple systems, supporting the use of tree-size-related crop load measures for evaluating reproductive pressure [16,50,70]. The combined interpretation of CLnm and CLkg therefore provides a more complete assessment of thinning effects than either parameter alone, consistent with the role of crop load regulation in assimilate allocation and fruit development [51,56].

4.4. Physicochemical Fruit Quality Parameters: Firmness and Water-Soluble Solids Content

Fruit firmness was reduced in the ATS+BA+ethephon treatment in 2023 (5.62 kg cm−2) compared with the other treatments (6.45–6.66 kg cm−2), which was associated with the larger fruit size and weight observed in this treatment (Figure 5B). In contrast, the correlation analysis showed significant negative relationships between fruit firmness and both fruit size and fruit weight in 2023 (Figure 6B), indicating that larger and heavier fruits tended to have lower firmness in that year. This relationship is consistent with the possibility that greater fruit enlargement was associated with reduced firmness, although the observational nature of the correlations does not allow a direct causal relationship to be established [53,69,71,72]. No significant correlations between the crop load measures and fruit firmness were reported in the present dataset; therefore, the relationship between crop load and firmness remains uncertain under the conditions of this experiment.
Water-soluble solids content, reflecting soluble sugar accumulation and consumer-perceived quality, was significantly affected by year, thinning treatment, and their interaction (Table 3; Figure 5A), indicating a strong seasonal dependency of soluble solids accumulation [73,74]. Within individual years, significant thinning treatment effects were detected in 2022 and 2023, but not in 2024. In 2022, BA+ethephon resulted in lower SSC (10.83 °Brix) than the control (12.23 °Brix) and ATS+BA+ethephon (11.07 °Brix), whereas in 2023, BA+ethephon produced higher SSC (10.67 °Brix) than the control (9.77 °Brix). Thus, the effect of thinning on SSC was not uniform across treatments or years. In particular, the higher SSC observed with BA+ethephon in 2023 occurred together with greater fruit weight relative to the control, suggesting that the relationship between fruit enlargement and the soluble solids concentration was not simply determined by a dilution effect. Similar relationships between crop load regulation, assimilate partitioning, and fruit quality improvement have been reported in apple [3,53,56].
However, the overall correlation analysis revealed year-dependent associations between SSC and the other measured traits (Figure 6), demonstrating that the relationship between soluble-solids concentration and fruit growth was not consistent across years. In 2022, SSC was negatively correlated with FNT, CLnm, and CLkg, indicating that a higher reproductive load was associated with a lower soluble solids concentration. Larger fruits may contain a greater proportion of water, reducing the soluble solids concentration despite increased carbohydrate accumulation [55,75]. Differences in temperature, radiation, precipitation, and tree water status may modify carbohydrate accumulation and fruit water balance, explaining the variable responses observed among years [55,76].
Previous studies have also demonstrated the variable effects of ATS+ethephon and BA+ethephon thinning on soluble solids accumulation, with positive responses depending on cultivar, environmental conditions, and crop load status [21,26,33,34,37]. Therefore, the effects of chemical thinning on SSC should be interpreted as the result of complex interactions among crop load regulation, assimilate partitioning, fruit growth dynamics, and seasonal variability.

4.5. Multivariate Insight

The multivariate insight afforded by PCA revealed the main patterns of variation among the measured tree, yield, crop load, and fruit quality traits (Figure 8), with the relative contribution of individual traits to the principal components varying among years (Table 4; Figure 8). In 2022, PC1 was mainly associated with FNT, CLnm, CLkg, and SSC, whereas PC2 was primarily associated with FS and FW. In 2023, PC1 was mainly associated with FS, FW, and FF, while PC2 was primarily associated with TCSA, Y, FNT, CLkg, and SSC. In 2024, PC1 was mainly associated with Y, FNT, CLnm, CLkg, and FW, whereas PC2 was primarily associated with Y, FS, and FW. This separation indicates that yield, crop load, tree growth, and fruit development traits contributed differently to the overall variation among years [51,56].
The close association of yield and crop load variables in the relevant principal component dimensions is consistent with the significant relationships observed in the correlation and regression analyses. The strong and recurrent contribution of FS and FW to the PCA structure, together with their strong positive correlation, further highlights the close relationship between fruit size and fruit weight. These findings support previous evidence that excessive crop load increases competition for assimilates and may reduce fruit growth and quality, whereas appropriate thinning improves source–sink balance and promotes the development of retained fruits [16,56]. Therefore, crop load expressed relative to tree capacity provides a more biologically meaningful assessment of reproductive pressure than fruit number alone because it integrates tree size, yield potential, and resource availability [16,50,70], emphasizing that optimal thinning should target reproductive balance rather than maximum crop reduction.
The distinct multivariate position of the thinning treatments in the PCA biplot provides a multivariate representation of their relationships with the measured traits (Figure 8). However, these relationships varied among years, and the treatment effects should therefore be interpreted together with the year-specific univariate results rather than as a single consistent treatment response across the three seasons. Similar complementary effects of ATS and BA have been reported, with blossom thinning reducing excessive fruit retention and BA supporting fruit growth under suitable physiological conditions [21,30,65].
The PCA-based discrimination of treatments highlights the value of multivariate approaches for evaluating thinning efficiency, as crop load management influences multiple interacting traits rather than individual parameters. Similar approaches have successfully integrated physical and biochemical attributes to characterize apple quality differences beyond single measurements [55,75]. Thus, thinning strategies should be evaluated by their ability to optimize the balance among crop load, yield efficiency, and fruit quality, which is essential for stable production in high-density apple systems. The year-dependent PCA structure further indicates that the relationships among these traits cannot be represented by a single invariant combination of variables, supporting the use of multivariate analysis alongside individual trait-based assessments when evaluating chemical thinning responses.
A limitation of the present study is that baseline flowering density, initial fruit set, post-treatment fruit set, and return-to-flowering measurements were not available for the experimental plots. Therefore, differences in final fruit number and yield cannot be attributed exclusively to differences in chemical thinning response, particularly under years with contrasting flowering conditions. The results should consequently be interpreted as comparisons of harvest outcomes under year-specific chemical thinning programs rather than as a definitive assessment of thinning effectiveness based solely on final fruit number. Importantly, no manual fruit thinning or other corrective crop load adjustment was performed after the chemical treatments, so subsequent crop load interventions did not influence the final treatment comparisons.

5. Conclusions

Our study demonstrated that chemical thinning with ammonium thiosulfate+ethephon, benzyladenine+ethephon, and their combination affected selected reproductive and fruit quality traits in the intensive ‘Gala Schniga Schnitzer’ apple production system. The magnitude of treatment effects varied among years, highlighting the importance of seasonal environmental conditions in determining thinning responses; overall, the results indicate that thinning responses were trait- and year-dependent, suggesting that the effects of chemical thinning should be evaluated in relation to both the specific production objective and the prevailing growing conditions.
ATS and BA with ethephon, applied individually or in combination, influenced fruit development and crop load regulation differently, indicating that the choice of thinning program can modify the balance among fruit retention, crop load, and fruit development. The greater fruit development (e.g., FS and FW) response observed with the combined ATS+BA+ethephon treatment suggests that integrating complementary thinning agents may provide advantages beyond simple fruit number reduction, particularly when the objective is to maintain an appropriate crop load while supporting fruit development. However, the magnitude of these benefits varied among growing seasons, emphasizing that thinning strategies should be adapted to seasonal conditions rather than applied uniformly across years.
The multivariate analysis further confirmed that thinning responses cannot be adequately described by single production traits, as crop load, yield efficiency, fruit size, and quality attributes formed an interconnected response system. The strong association between crop load indicators and yield components emphasized the importance of evaluating reproductive pressure relative to tree capacity rather than fruit number alone. Furthermore, the year-dependent PCA structure showed that the relative contribution of yield, crop load, tree growth, and fruit quality traits to overall variation differed among seasons. The strong association between fruit size and fruit weight further highlighted the close relationship between these two fruit-development traits.
Overall, these findings demonstrate that effective chemical thinning should not be considered solely as a method for reducing fruit number, but rather as a strategy for regulating crop load and the balance between productivity and fruit development. Under intensive orchard conditions, the integrated application of ATS and BA may be a useful approach for combining crop load regulation with enhanced fruit development, although its effectiveness should be evaluated according to the specific production trait and growing season in ‘Gala Schniga Schnitzer’ apple production.

Supplementary Materials

The following supporting information can be downloaded at https://www.mdpi.com/article/10.3390/agriculture16181998/s1, Table S1. Monthly mean and minimum temperatures (°C) and total monthly precipitation (mm) in Nyírtass, Hungary, from 2022 to 2024.

Author Contributions

Conceptualization, I.J.H. and T.S.; methodology, I.J.H., T.S., and Á.C.; software, I.J.H.; validation, I.J.H.; formal analysis, I.J.H.; investigation, Á.C., M.S., and I.J.H.; resources, I.J.H.; data curation, Á.C. and I.J.H.; writing—original draft preparation, Á.C., M.S., and I.J.H.; writing—review and editing, I.J.H.; visualization, I.J.H.; supervision, I.J.H.; project administration, Á.C. and T.S.; funding acquisition, I.J.H. All authors have read and agreed to the published version of the manuscript.

Funding

This research was funded by the Hungarian Scientific Research Funds (ADVANCED_152727) awarded to I.J.H.

Data Availability Statement

Data will be provided for other scientists upon reasonable request.

Conflicts of Interest

Tamás Szentpéteri was employed by Fruittamas Ltd. The remaining authors declare that the research was conducted in the absence of any commercial or financial relationships that could be construed as a potential conflict of interest.

References

  1. Dorigoni, A.; Lezzer, P. Chemical thinning of apple with new compounds. Erwerbs-Obstbau 2007, 49, 93–96. [Google Scholar] [CrossRef] [Scilit]
  2. Schweizer, S.; Neumann, L.; Braun, P.; Kuttnig, S.; Baumgartner, D.; Widmer, A. Behangsprognose bei Äpfeln. Agrar. Schweiz 2014, 5, 422–429. [Google Scholar]
  3. Khan, I.A.; Ganaie, S.A.; Mir, I.A.; Ganai, S.A. Evaluation of thinning practices for crop load management in high-density Gala apple orchards in Kashmir. J. Krishi Vigyan 2024, 12, 438–440. [Google Scholar] [CrossRef] [Scilit]
  4. Bergh, O. Effect of time of hand-thinning on apple fruit size. S. Afr. J. Plant Soil 1990, 7, 1–10. [Google Scholar] [CrossRef] [Scilit]
  5. Friedrich, G.; Fischer, M. Physiologische Grundlagen des Obstbaues; Verlag Eugen Ulmer: Stuttgart, Germany, 2000. [Google Scholar]
  6. Link, H. Significance of flower and fruit thinning on fruit quality. Plant Growth Regul. 2000, 31, 17–26. [Google Scholar] [CrossRef] [Scilit]
  7. Keserović, Z.; Gvozdenović, D.; Lazić, S.; Hnatko, Z. Biological bearing control of some apple cultivars. Voćarstvo 2005, 39, 241–249. (In Serbian) [Google Scholar]
  8. Pellerin, B.P.; Buszard, D.; Iron, D.; Embree, C.G.; Marini, R.P.; Nichols, D.S.; Neilsen, G.H.; Neilsen, D.A. Theory of blossom thinning to consider maximum annual flower bud numbers on biennial apple trees. HortScience 2011, 46, 40–42. [Google Scholar] [CrossRef] [Scilit]
  9. Kaçal, E.; Öztürk, G.; Gür, İ.; Aydinli, M.; Koçal, H.; Altindal, M.; Yildirim, A.N. Crop load management with blossom thinners in ‘Redchief’ apple and their effects on fruit mineral composition. Erwerbs-Obstbau 2019, 61, 231–236. [Google Scholar] [CrossRef] [Scilit]
  10. Netsawang, P.; Damerow, L.; Lammers, P.S.; Kunz, A.; Blanke, M. Alternative approaches to chemical thinning for regulating crop load and alternate bearing in apple. Agronomy 2023, 13, 112. [Google Scholar] [CrossRef] [Scilit]
  11. Schumacher, R.; Stadler, W. Zusatzpräparate verbessern die Ausdünnungswirkung von Naphthylacetamid. Schweiz. Z. Obst-Weinbau 1987, 123, 248–252. [Google Scholar]
  12. Ferree, D.C. Performance of benzyladenine as a chemical thinner on eight apple cultivars. J. Tree Fruit Prod. 1996, 1, 33–50. [Google Scholar] [CrossRef] [Scilit]
  13. Bound, S.A. The Impact of Selected Orchard Management Practices on Apple (Malus domestica L.) Fruit Quality. Ph.D. Thesis, University of Tasmania, Tasmania, Australia, 2005; 190p. [Google Scholar]
  14. Ouma, G. Chemical and non-chemical thinning methods in apple (Malus domestica Borkh.). ARPN J. Agric. Biol. Sci. 2007, 2, 7–11. [Google Scholar]
  15. Seehuber, C.; Damerow, L.; Kunz, A.; Blanke, M.M. Mechanische Fruchtbehangsregulierung bei Apfel verbessert Fruchtgröße, Fruchtfestigkeit, Fruchtausfärbung und die Sourceältnisse mit mehr Einzelfruchtständen (Singlets) bei ‘Gala’. Erwerbs-Obstbau 2014, 56, 49–58. [Google Scholar] [CrossRef] [Scilit]
  16. Kon, T.M.; Schupp, J.R. Apple crop load management with special focus on early thinning strategies. In Horticultural Reviews; Wiley: Hoboken, NJ, USA, 2018; pp. 255–298. [Google Scholar] [CrossRef] [Scilit]
  17. Baab, G.; Hilsendegen, P.; Solomakhin, A. Fruchtbehangsregulierung bei Äpfeln und Birnen; AGROselection–Fruit Tec GmbH: Salem, Germany, 2022; 174p. [Google Scholar]
  18. Byers, R.E. Flower and fruit thinning and vegetative: Fruiting balance. In Apples—Botany, Production and Uses; Ferree, D.C., Warrington, I.J., Eds.; CAB International: Wallingford, UK, 2003; pp. 409–436. [Google Scholar] [CrossRef] [Scilit]
  19. Clever, M. A comparison of different thinning products applied to the apple variety ‘Elstar Elshof’ in the Lower Elbe region. Erwerbs-Obstbau 2007, 49, 107–109. [Google Scholar] [CrossRef] [Scilit]
  20. Schröder, M.; Link, H. Calcium content in apple fruits after thinning treatments in relation to crop load, fruit size and leaf area. Acta Hortic. 2022, 594, 541–545. [Google Scholar] [CrossRef] [Scilit]
  21. Bound, S.A.; Wilson, S.J. Ammonium thiosulfate and 6-benzyladenine improve the crop load and fruit quality of ‘Delicious’ apples. Aust. J. Exp. Agric. 2007, 47, 635–644. [Google Scholar] [CrossRef] [Scilit]
  22. Hampson, C.; Bedford, K. Efficacy of blossom thinning treatments to reduce fruit set and increase fruit size of Ambrosia and Aurora Golden Gala™ apple. Can. J. Plant Sci. 2011, 91, 983–990. [Google Scholar] [CrossRef] [Scilit]
  23. Basak, A. Benzyladenine (BA) as an apple fruitlet thinning agent—Preliminary results. Hort. Sci. 1996, 28, 54–57. [Google Scholar]
  24. Milić, B.; Tarlanović, J.; Keserović, Z.; Zorić, L.; Blagojević, B.; Magazin, N. The growth of apple central fruits as affected by thinning with NAA, BA and naphthenic acids. Erwerbs-Obstbau 2017, 59, 185–193. [Google Scholar] [CrossRef] [Scilit]
  25. Kuster, T. Behangsregulierung im Obstbau. Schweiz. Obst 2020, 2, 30–34. [Google Scholar]
  26. Buler, Z.; Filipczak, J. Influence of several methods of flower and fruitlet thinning on the yield and quality of Gala Must apples. Acta Sci. Pol. Hortorum Cultus 2025, 24, 3–15. [Google Scholar] [CrossRef] [Scilit]
  27. Basak, A. Use of benzyladenine, Endothall and ammonium thiosulfate for fruitlet thinning in some apple cultivars. Acta Hortic. 2000, 517, 217–226. [Google Scholar] [CrossRef] [Scilit]
  28. Bubán, T. The use of benzyladenine in orchard fruit growing: A mini review. Plant Growth Regul. 2000, 32, 381–390. [Google Scholar] [CrossRef] [Scilit]
  29. Robinson, T.L. Interaction of benzyladenine and naphthaleneacetic acid on fruit set, fruit size and crop value of twelve apple cultivars. Acta Hortic. 2006, 727, 283–290. [Google Scholar] [CrossRef] [Scilit]
  30. Costa, G.; Botton, A.; Vizzotto, G. Fruit thinning. In Horticultural Reviews; Wiley: Hoboken, NJ, USA, 2018; pp. 185–226. [Google Scholar] [CrossRef] [Scilit]
  31. McLaughlin, J.M.; Greene, D.W. Effects of BA, GA4+7, and daminozide on fruit set, fruit quality, vegetative growth, flower initiation and flower quality of ‘Golden Delicious’ apples. J. Am. Soc. Hortic. Sci. 1984, 109, 34–39. [Google Scholar] [CrossRef] [Scilit]
  32. Maas, F. Ausdünnungsstrategien für die Apfelsorte ‘Elstar’—Erfahrungen mit Ammoniumthiosulfat, Calciumhydroxid und Benzyladenin. Erwerbs-Obstbau 2007, 49, 101–105. [Google Scholar] [CrossRef] [Scilit][Green Version]
  33. Maas, F.; Fotiric Aksic, M.; Meland, M. Response of ‘Rubinstep’ apple to flower and fruitlet thinning in a northern climate. Acta Hortic. 2020, 1295, 41–48. [Google Scholar] [CrossRef] [Scilit]
  34. Radivojevic, D.; Fotiric, M.; Milivojevic, J.; Oparnica, C. Chemical thinning induced by single and sequential application of BA, NAA and metamitron on ‘Gala’ and ‘Golden Delicious’ apple. Acta Hortic. 2022, 1341, 1–8. [Google Scholar] [CrossRef] [Scilit]
  35. Khan, I.A.; Hassan, S.; Mir, M.A.; Khalil, A.; Nazir, N.; Nisar, S.; Ganie, S.A.; Amin, Z. Effect of crop load on yield and quality parameters in apple cv. ‘Gala Redlum’. Int. J. Environ. Clim. Change 2023, 13, 317–325. [Google Scholar] [CrossRef] [Scilit]
  36. Gyalai, I.; Tóth, B.; Nasirov, M.; Kholmirzaev, B. Examination of the effectiveness of fruit thinning in the case of Idaho and Gala Must early apple varieties. Acta Hortic. Regiotect. 2024, 27, 84–89. [Google Scholar] [CrossRef] [Scilit]
  37. Petri, J.L.; de Fátima Esperança, C.; Sezerino, A.A.; Silva Ogoshi, R.C. Impact of post-flowering chemical thinning on the fruit yield and quality metrics in ‘Fuji Suprema’ apple trees. J. Exp. Agric. Int. 2025, 47, 472–479. [Google Scholar] [CrossRef] [Scilit]
  38. MI 08-1741/1-88; Mezőgazdasági Műszaki Irányelvek (Agricultural Technical Guidelines). Magyar Szabványügyi Testület: Budapest, Hungary, 2009.
  39. Egnér, H.; Riehm, H.; Domingo, W.R. Untersuchungen über die chemische Bodenanalyse als Grundlage für die Beurteilung des Nährstoffzustandes der Böden. II. K. Lantbr. Högsk. Ann. 1960, 26, 199–215. [Google Scholar]
  40. Skalar. Handbook of Manual San Plus Analyzer; Skalar Methods; Skalar: Breda, The Netherlands, 1996. [Google Scholar]
  41. Court of Justice of the European Union. Judgment of the Court (Fifth Chamber) of 8 June 2017, Schniga GmbH v. Community Plant Variety Office (CPVO), Case C-625/15 P. ECLI:EU:C:2017:435; Court of Justice of the European Union: Luxembourg, 2017. [Google Scholar]
  42. Malavolta, C.; Cross, J.; Cravedi, P.; Jörg, E. (Eds.) Guidelines for Integrated Production of Stone Fruits; Technical Guideline III; IOBC/WPRS Bull.: Bragança, Portugal, 2003; Volume 26, p. 71. [Google Scholar]
  43. R Core Team. R: A Language and Environment for Statistical Computing; R Foundation for Statistical Computing: Vienna, Austria, 2024; Available online: https://www.R-project.org/ (accessed on 10 November 2025).
  44. Wickham, H. ggplot2: Elegant Graphics for Data Analysis; Springer: New York, NY, USA, 2016. [Google Scholar] [CrossRef] [Scilit]
  45. Wickham, H. Reshaping data with the reshape package. J. Stat. Softw. 2007, 21, 1–20. [Google Scholar] [CrossRef] [Scilit]
  46. Wickham, H.; François, R.; Henry, L.; Müller, K.; Vaughan, D. dplyr: A Grammar of Data Manipulation; R Foundation for Statistical Computing: Vienna, Austria, 2023; Available online: https://CRAN.R-project.org/package=dplyr (accessed on 14 January 2026).
  47. Slowikowski, K. ggrepel: Automatically Position Non-Overlapping Text Labels with ggplot2; R Foundation for Statistical Computing: Vienna, Austria, 2024; Available online: https://CRAN.R-project.org/package=ggrepel (accessed on 14 January 2026).
  48. Wickham, H.; Bryan, J. readxl: Read Excel Files; R Foundation for Statistical Computing: Vienna, Austria, 2023; Available online: https://CRAN.R-project.org/package=readxl (accessed on 18 January 2026).
  49. Schauberger, P.; Walker, A. openxlsx: Read, Write and Edit xlsx Files; R Foundation for Statistical Computing: Vienna, Austria, 2023; Available online: https://CRAN.R-project.org/package=openxlsx (accessed on 18 January 2026).
  50. Robinson, T.L.; Watkins, C.B. Crop load of Honeycrisp affects not only fruit size but also many quality attributes. N. Y. Fruit Q. 2003, 11, 7–10. [Google Scholar]
  51. Liang, B.; Sun, Y.; Li, Z.; Zhang, X.; Yin, B.; Zhou, S.; Xu, J. Crop load influences growth and hormone changes in the roots of ‘Red Fuji’ apple. Front. Plant Sci. 2020, 11, 665. [Google Scholar] [CrossRef] [Scilit]
  52. Robinson, T.L.; Hoying, S.A.; Reginato, G.H. The tall spindle planting system: Principles and performance. Acta Hortic. 2011, 903, 571–579. [Google Scholar] [CrossRef] [Scilit]
  53. Bound, S.A. Determination of target crop loads for maximising fruit quality and return bloom in several apple cultivars. Appl. Biosci. 2023, 2, 586–606. [Google Scholar] [CrossRef] [Scilit]
  54. Bassi, G.; Gregori, R.; Sansavini, S.; Guerra, W.; Berra, L.; Folini, L. Tutte le varietá di melo per i nuovi impianti. L’Informatore Agrar. 2012, 46, 66–70. [Google Scholar]
  55. Le Bourvellec, C.; Bureau, S.; Renard, C.M.G.C.; Plenet, D.; Gautier, H.; Touloumet, L.; Girard, T.; Simon, S. Cultivar and year rather than agricultural practices affect primary and secondary metabolites in apple fruit. PLoS ONE 2015, 10, e0141916. [Google Scholar] [CrossRef] [Scilit]
  56. Ding, N.; Chen, Q.; Zhu, Z.; Peng, L.; Ge, S.; Jiang, Y. Effects of crop load on distribution and utilization of 13C and 15N and fruit quality for dwarf apple trees. Sci. Rep. 2017, 7, 14172. [Google Scholar] [CrossRef] [Scilit]
  57. Marchioretto, L.D.R.; De Rossi, A.; Michelon, M.F.; Orlandi, J.C.; do Amaral, L.O. Ammonium thiosulfate as blossom thinner in ‘Maxi Gala’ apple trees. Pesqui. Agropecu. Bras. 2018, 53, e2018001000006. [Google Scholar] [CrossRef] [Scilit]
  58. Stern, R.A.; Ben-Arie, R.; Applebaum, S.; Flaishman, M. Efficacy and mode of action of blossom thinners on ‘Fuji More’ apple trees. Sci. Hortic. 2019, 246, 634–642. [Google Scholar] [CrossRef] [Scilit]
  59. Cline, J.A.; Bakker, C.J.; Beneff, A.; DeBrouwer, E. Thinning response of Gala and Honeycrisp apple trees to lime sulfur and ATS blossom thinners in combination with carbaryl as a fruitlet thinner. Can. J. Plant Sci. 2026, 106, 1–22. [Google Scholar] [CrossRef] [Scilit]
  60. Marini, R.P.; Schupp, J.R.; Baugher, T.A.; Crassweller, R. Estimating apple fruit size distribution from early-season fruit diameter measurements. HortScience 2019, 54, 1947–1954. [Google Scholar] [CrossRef] [Scilit]
  61. Bassi, G.; Ferraro, F. I cloni di Gala che colorano meglio in pianura. L’Informatore Agrar. 2005, 37, 63–64. [Google Scholar]
  62. Csihon, Á.; Gonda, I.; Szabó, S.; Holb, I. Tree vegetative and generative properties and their inter-correlations for prospective apple cultivars under two training systems for young trees. Hortic. Environ. Biotechnol. 2022, 63, 325–339. [Google Scholar] [CrossRef] [Scilit]
  63. Basak, A. Fruit thinning by using benzyladenine (BA) with ethephon, ATS, NAA, urea and carbaryl in some apple cultivars. Acta Hortic. 2004, 653, 99–106. [Google Scholar] [CrossRef] [Scilit]
  64. Botton, A.; Eccher, G.; Forcato, C.; Ferrarini, A.; Begheldo, M.; Zermiani, M.; Moscatello, S.; Battistelli, A.; Velasco, R.; Ramina, A. A time-course model for BA action in apple fruitlet thinning. J. Exp. Bot. 2011, 62, 2653–2666. [Google Scholar]
  65. Kim, E.-J.; Guak, S.-H. Chemical thinning of ‘Fuji’ apple with ammonium thiosulfate and benzyladenine. Hortic. Environ. Biotechnol. 2010, 51, 520–524. [Google Scholar]
  66. Gonzalez Nieto, L.; Wallis, A.; Clements, J.; Miranda Sazo, M.; Kahlke, C.; Kon, T.M.; Robinson, T.L. Evaluation of computer vision systems and applications to estimate trunk cross-sectional area, flower cluster number, thinning efficacy and yield of apple. Horticulturae 2023, 9, 880. [Google Scholar] [CrossRef] [Scilit]
  67. Robinson, T.L. Crop load management of new high-density apple orchards. N. Y. Fruit Q. 2008, 16, 3–7. [Google Scholar]
  68. Bound, S.A.; Jones, K.M.; Koen, T.B.; Oakford, M.J. The thinning effect of benzyladenine on red ‘Fuji’ apple trees. J. Hortic. Sci. 1991, 66, 789–794. [Google Scholar] [CrossRef] [Scilit]
  69. Lakso, A.N.; Robinson, T.L.; Goffinet, M.C.; White, M.D. Apple fruit growth responses to varying thinning methods and timing. Acta Hortic. 2001, 557, 205–214. [Google Scholar] [CrossRef] [Scilit]
  70. Scalisi, A.; Plozza, T.; Reddy, P.; Peavey, M.; McClymont, L.; Rochfort, S.; Stefanelli, D.; Goodwin, I. Localised and tree total crop loads influence trunk growth, return fruit set, yield, and fruit quality in apples. Hortic. Adv. 2024, 2, 17. [Google Scholar] [CrossRef] [Scilit]
  71. Zude, M.; Herold, B.; Roger, J.-M.; Bellon-Maurel, V.; Landahl, S. Predicting soluble solid content and firmness in apple fruit by means of laser light backscattering image analysis. J. Food Eng. 2007, 82, 58–67. [Google Scholar] [CrossRef] [Scilit]
  72. Yim, Y.J. Interrelations among crop load, fruit quality, shoot growth, and leaf mineral nutrients in dense-planting ‘Fuji’/M.26/seedling apple trees with high productivity. Hortic. Environ. Biotechnol. 2005, 46, 188–192. [Google Scholar]
  73. Hoehn, E.; Gasser, F.; Guggenbühl, B.; Künsch, U. Efficacy of instrumental measurements for determination of minimum requirements of firmness, soluble solids, and acidity of several apple varieties in comparison to consumer expectations. Postharvest Biol. Technol. 2003, 27, 27–37. [Google Scholar] [CrossRef] [Scilit]
  74. Palmer, J.W.; Harker, F.R.; Tustin, D.S.; Johnston, J. Fruit dry matter concentration: A new quality metric for apples. J. Sci. Food Agric. 2010, 90, 2586–2594. [Google Scholar] [CrossRef] [Scilit]
  75. Mureșan, A.E.; Sestras, A.F.; Militaru, M.; Păucean, A.; Tanislav, A.E.; Pușcaș, A.; Sestras, R.E. Chemometric comparison and classification of 22 apple genotypes based on texture analysis and physico-chemical quality attributes. Horticulturae 2022, 8, 64. [Google Scholar] [CrossRef] [Scilit]
  76. Gormley, T.R.; Harrington, D.; McDonnell, P.F. Quality of Golden Delicious apples grown in seven different orchard locations. Ir. J. Food Sci. Technol. 1981, 5, 165–169. [Google Scholar]
Figure 1. Trunk cross-sectional area (TCSA, cm2) of the apple cv. ‘Gala Schniga Schnitzer’ under four thinning treatments (control, ATS+ethephon, BA+ethephon, and ATS+BA+ethephon) in Nyírtass, Hungary, during 2022–2024. Differences among treatments were evaluated using the LSD0.05 test at the 5% significance level. The same lowercase letter “a” above all columns indicates that there were no significant differences among thinning treatments within each year (p > 0.05).
Agriculture 16 01998 g001
Figure 2. Fruit number per tree (FNT, panel (A)) and yield (Y, kg tree−1, panel (B)) of the apple cv. ‘Gala Schniga Schnitzer’ under four thinning treatments (control, ATS+ethephon, BA+ethephon, and ATS+BA+ethephon) in Nyírtass, Hungary, during 2022–2024. Differences among treatments were evaluated using the LSD0.05 test at the 5% significance level. Means followed by different lowercase letters (a,b) indicate significant differences among treatments within each year (p = 0.05).
Agriculture 16 01998 g002
Figure 3. Crop load (number cm−2, CLnm, panel (A)) and crop load (kg cm−2, CLkg, panel (B)) of the apple cv. ‘Gala Schniga Schnitzer’ under four thinning treatments (control, ATS+ethephon, BA+ethephon, and ATS+BA+ethephon) in Nyírtass, Hungary, during 2022–2024. Differences among treatments were evaluated using the LSD0.05 test at the 5% significance level. Means followed by different lowercase letters (a,b,c) indicate significant differences among treatments within each year (p = 0.05).
Agriculture 16 01998 g003aAgriculture 16 01998 g003b
Figure 4. Fruit size (FS, mm, panel (A)) and fruit weight (FW, g, panel (B)) of the apple cv. ‘Gala Schniga Schnitzer’ under four thinning treatments (control, ATS+ethephon, BA+ethephon, and ATS+BA+ethephon) in Nyírtass, Hungary, during 2022–2024. Differences among treatments were evaluated using the LSD0.05 test at the 5% significance level. Means followed by different lowercase letters (a,b) indicate significant differences among treatments within each year (p = 0.05).
Agriculture 16 01998 g004aAgriculture 16 01998 g004b
Figure 5. Water-soluble solids content (SSC, panel (A), 2022–2024) and fruit firmness (kg cm−2, panel (B), 2023–2024) of the apple cv. ‘Gala Schniga Schnitzer’ under four thinning treatments (control, ATS+ethephon, BA+ethephon, and ATS+BA+ethephon) in Nyírtass, Hungary. Differences among treatments were evaluated using the LSD0.05 test at the 5% significance level. Means followed by different lowercase letters (a,b) indicate significant differences among treatments within each year (p = 0.05).
Agriculture 16 01998 g005aAgriculture 16 01998 g005b
Figure 6. Pearson’s correlation coefficients (r) among nine measured parameters for 2022 (A), 2023 (B), and 2024 (C) at Nyírtass for the apple cv. ‘Gala Schniga Schnitzer’. The nine parameters were: trunk cross-sectional area (TCSA), fruit number per tree (FNT), fruit yield (Y), crop load-number (CLnm), crop load-kg (CLkg), fruit size (FS), fruit weight (FW), water-soluble solids content (SSC), and fruit firmness (FF). *, **, and *** indicate significance at p = 0.05, 0.01, and 0.001, respectively.
Agriculture 16 01998 g006aAgriculture 16 01998 g006b
Figure 7. Relationships between three variable pairs: FW vs. FS (A), FNT vs. Y (B), and CLnm vs. CLkg (C) for the three years (2022, 2023, and 2024) in an experimental apple orchard at Nyírtass, Hungary, on the apple cv. ‘Gala Schniga Schnitzer’ (n = 48; four thinning treatments × three years × four replications).
Agriculture 16 01998 g007
Figure 8. Biplot of principal component analysis (PCA) separately for 2022 (A), 2023 (B), and 2024 (C) based on nine measured variables: trunk cross-sectional area (TCSA), fruit yield (Y), fruit number per tree (FNT), crop load number (CLnm), crop load kg (CLkg), fruit size (FS), fruit weight (FW), water-soluble solids content (SSC), and fruit firmness (FF). An experimental apple orchard at Nyírtass, Hungary, using the apple cv. ‘Gala Schniga Schnitzer’.
Agriculture 16 01998 g008
Table 1. Main soil characteristics of the experimental orchard site at Nyírtass, Hungary, in 2024, with reference optimal ranges for moderately compacted clay loam according to the Agricultural Technical Guidelines [38].
Soil Parameters0–30 cm30–60 cmOptimal Value
pH (KCl)6.486.946.0–6.8
Plasticity index (KA)363843–50
Humus content (%)2.722.673–5
(NO3+NO2)-N (mg kg−1) (KCl)3.324.857–30
P2O5 (mg kg−1) (AL)34434680–120
K2O (mg kg−1) (AL)142199180–250
Mg (mg kg−1) (KCl)327330150–250
The concentrations of AL-extractable phosphorus (P), potassium (K), and magnesium (Mg) in the soil were quantified using the procedure described by Egnér et al. [39]. The soil nitrate- and nitrite-nitrogen NO3 + NO2–N levels were determined according to the Skalar analytical method [40].
Table 2. Description of thinning treatments and application rates applied to apple cv. ‘Gala Schniga Schnitzer’ in the experimental orchard at Nyírtass, Hungary (2022–2024).
Treatment/
Characteristics
Active
Ingredients
Applied
Dose
Product Name
(Manufacturer)
Date of Thinning and Phenological Phase
2022
Control
ATS+ethephon53% ammonium thiosulphate
+ 480 g L−1 etefon
34 L ha−1
+ 3 dL ha−1
ATS Agro Flo (UPL Hungary Ltd.)
+ Ethrel (Bayer Hungaria Ltd.)
3 May: central flower opening
BA+ethephon100 g/L benzyladenine
+ 480 g L−1 etefon
1.5 L ha−1
+ 2 dL ha−1
Globaryll 100 (UPL Hungary Ltd.)
+ Ethrel (see above)
15 May:
8–10 mm fruit diameter
ATS+BA+ethephonsame as single ATS and single BA treatments, including ethephon
2023
Control
ATS+ethephon96–98% ammonium thiosulphate
+ 480 g L−1 etefon
22.5 kg ha−1
+ 3 dL ha−1
ATS Kristall (UPL Hungary Ltd.)
+ Ethrel (Bayer Hungaria Ltd.)
28 April: central flower opening
2 May: 4 days after central flower opening
BA+ethephon100 g L−1 benzyladenine
+ 480 g L−1 etefon
1.5 L ha−1
+ 2 dL ha−1
Globaryll 100 (UPL Hungary Ltd.)
+ Ethrel (see above)
10 May: 8–10 mm fruit diameter
ATS+BA+ethephonsame as single ATS and single BA treatments, including ethephon
2024
Control
ATS+ethephon53% ammonium thiosulphate
+ 480 g L−1 etefon
35 L ha−1
+ 3 dL ha−1
ATS Agro Flo (UPL Hungary Ltd.)
+ Ethrel (Bayer Hungaria Ltd.)
8 April: beginning of petal fall
BA+ethephon100 g L−1 benzyladenine
+ 480 g L−1 etefon
1.5 L ha−1
+ 2 dL ha−1
Globaryll 100 (UPL Hungary Ltd.)
+ Ethrel (see above)
28 April: 12–14 mm fruit diameter
ATS+BA+ethephonsame as single ATS and single BA treatments, including ethephon
Table 3. Analysis of variance for the effects of thinning treatments (control, ATS+ethephon, BA+ethephon, and ATS+BA+ethephon) separately for the years 2022, 2023, and 2024 on trunk cross-sectional area (TCSA), fruit yield (Y), fruit number per tree (FNT), crop load-number (CLnm), crop load-kg (CLkg), fruit size (FS), fruit weight (FW), water-soluble solids content (SSC), and fruit firmness (FF). SoV: source of variation; df: degrees of freedom; MS: mean squares; p: the probability values associated with the F-tests. For FF, data were not available in 2022.
TCSA Y FNT CLnm CLkg
SoVdfMSpdfMSPdfMSpDfMSpdfMSp
2022
Thinning39.020.688325.20.045310390.16631.330.04930.0290.049
Residuals1217.9 128.2 12517.1 120.91 120.019
2023
Thinning319.40.533360.10.049323960.04731.450.04330.0250.042
Residuals1225.2 1224.9 121195 120.47 120.013
2024
Thinning38.150.798337.90.0483186.50.81230.5810.29130.0060.458
Residuals1224.1 1226.9 12586.3 120.68 120.024
FS FW SSC FF
SoVdfMSpdfMSpdfMSpdfMSp
2022
Thinning34.290.1273174.20.03931.33<0.001---
Residuals121.85 1264.9 120.09 --
2023
Thinning316.10.00131138<0.00130.550.00230.880.001
Residuals121.02 1253.3 120.03 120.08
2024
Thinning33.560.2493139.80.04930.050.38630.020.785
Residuals122.27 12107.9 120.37 120.08
Table 4. Eigenvalues, explained variance, and eigenvectors from the principal component analysis (PCA) of nine measured variables under four thinning treatments (control, ATS, BA, and ATS+BA) separately for 2022, 2023, and 2024, in an apple orchard experiment at Nyírtass, Hungary, with the cv. ‘Gala Schniga Schnitzer’.
ItemsPC1PC2PC3PC4PC5
2022
Eigenvalue3.1482.2071.3300.5790.386
Proportion of variance (%)39.3527.5816.637.2434.819
Cumulative variance (%)39.3566.9383.5690.8095.62
Eigenvectors
Trunk cross-sectional area—TCSA0.155−0.3280.6250.428−0.151
Fruit yield—Y−0.3170.196−0.4160.7900.085
Fruit number per tree—FNT−0.436−0.203−0.268−0.2470.282
Crop load number—CLnm−0.446−0.2190.283−0.2000.412
Crop load kg—CLkg−0.479−0.1040.3690.2250.074
Fruit size—FS−0.1360.6070.289−0.0410.040
Fruit weight—FW−0.1580.6100.243−0.128−0.059
Water-soluble solids content—SSC0.4620.1200.0760.1500.843
PC1PC2PC3PC4PC5
2023
Eigenvalue2.9382.0031.6651.1250.681
Proportion of variance (%)32.6422.2518.5012.517.571
Cumulative variance (%)32.6454.8973.3985.8993.47
Eigenvectors
Trunk cross-sectional area—TCSA−0.015−0.3590.5800.111−0.349
Fruit yield—Y−0.0390.3630.5890.0470.285
Fruit number per tree—FNT0.025−0.5090.3190.3640.349
Crop load number—CLnm0.224−0.309−0.3560.528−0.303
Crop load kg—CLkg0.0580.4950.2160.374−0.598
Fruit size—FS−0.5620.045−0.1260.095−0.065
Fruit weight—FW−0.5650.054−0.0820.090−0.034
Water-soluble solids content—SSC−0.263−0.3650.140−0.530−0.445
Fruit firmness—FF0.4900.0440.022−0.368−0.150
PC1PC2PC3PC4PC5
2024
Eigenvalue2.5762.0061.3661.1620.854
Proportion of variance (%)28.6222.2915.1812.919.494
Cumulative variance (%)28.6250.9166.0978.9988.49
Eigenvectors
Trunk cross-sectional area—TCSA−0.056−0.102−0.7230.020−0.164
Fruit yield—Y0.395−0.418−0.0570.244−0.031
Fruit number per tree—FNT0.391−0.319−0.3040.310−0.237
Crop load number—CLnm0.4230.1350.032−0.545−0.243
Crop load kg—CLkg0.450−0.1660.269−0.384−0.157
Fruit size—FS−0.313−0.5650.043−0.272−0.079
Fruit weight—FW−0.371−0.5260.145−0.201−0.094
Water-soluble solids content—SSC−0.0920.0560.4420.456−0.685
Fruit firmness—FF−0.2480.261−0.300−0.277−0.590
Disclaimer/Publisher’s Note: The statements, opinions and data contained in all publications are solely those of the individual author(s) and contributor(s) and not of MDPI and/or the editor(s). MDPI and/or the editor(s) disclaim responsibility for any injury to people or property resulting from any ideas, methods, instructions or products referred to in the content.