Article

Integrated Transcriptomic and Metabolomic Analysis of Cold Stress Network in Interspecific Hybrids Between Chrysanthemum lavandulifolium (Fisch. ex Trautv.) Makino and × morifolium Ramat., cv. ‘Yannong Qiujin’

1
College of Agricultural, Yanbian University, Yanji 133002, China
2
Yanbian Academy of Forestry Sciences, Yanji 133002, China
*
Authors to whom correspondence should be addressed.
The authors contributed equally to this work.
Agriculture 2026, 16(17), 1923; https://doi.org/10.3390/agriculture16171923
Submission received: 31 July 2026 / Revised: 29 August 2026 / Accepted: 2 September 2026 / Published: 5 September 2026
(This article belongs to the Topic Plant Breeding, Genetics and Genomics, 2nd Edition)

Abstract

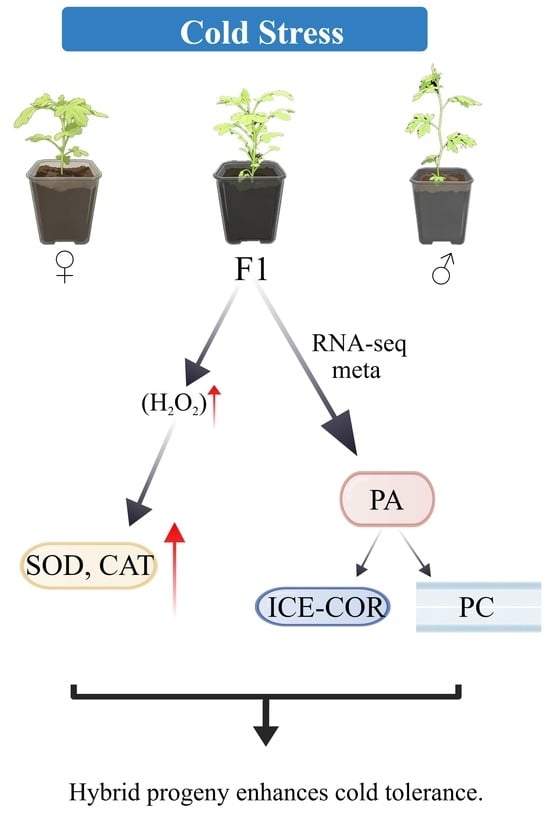
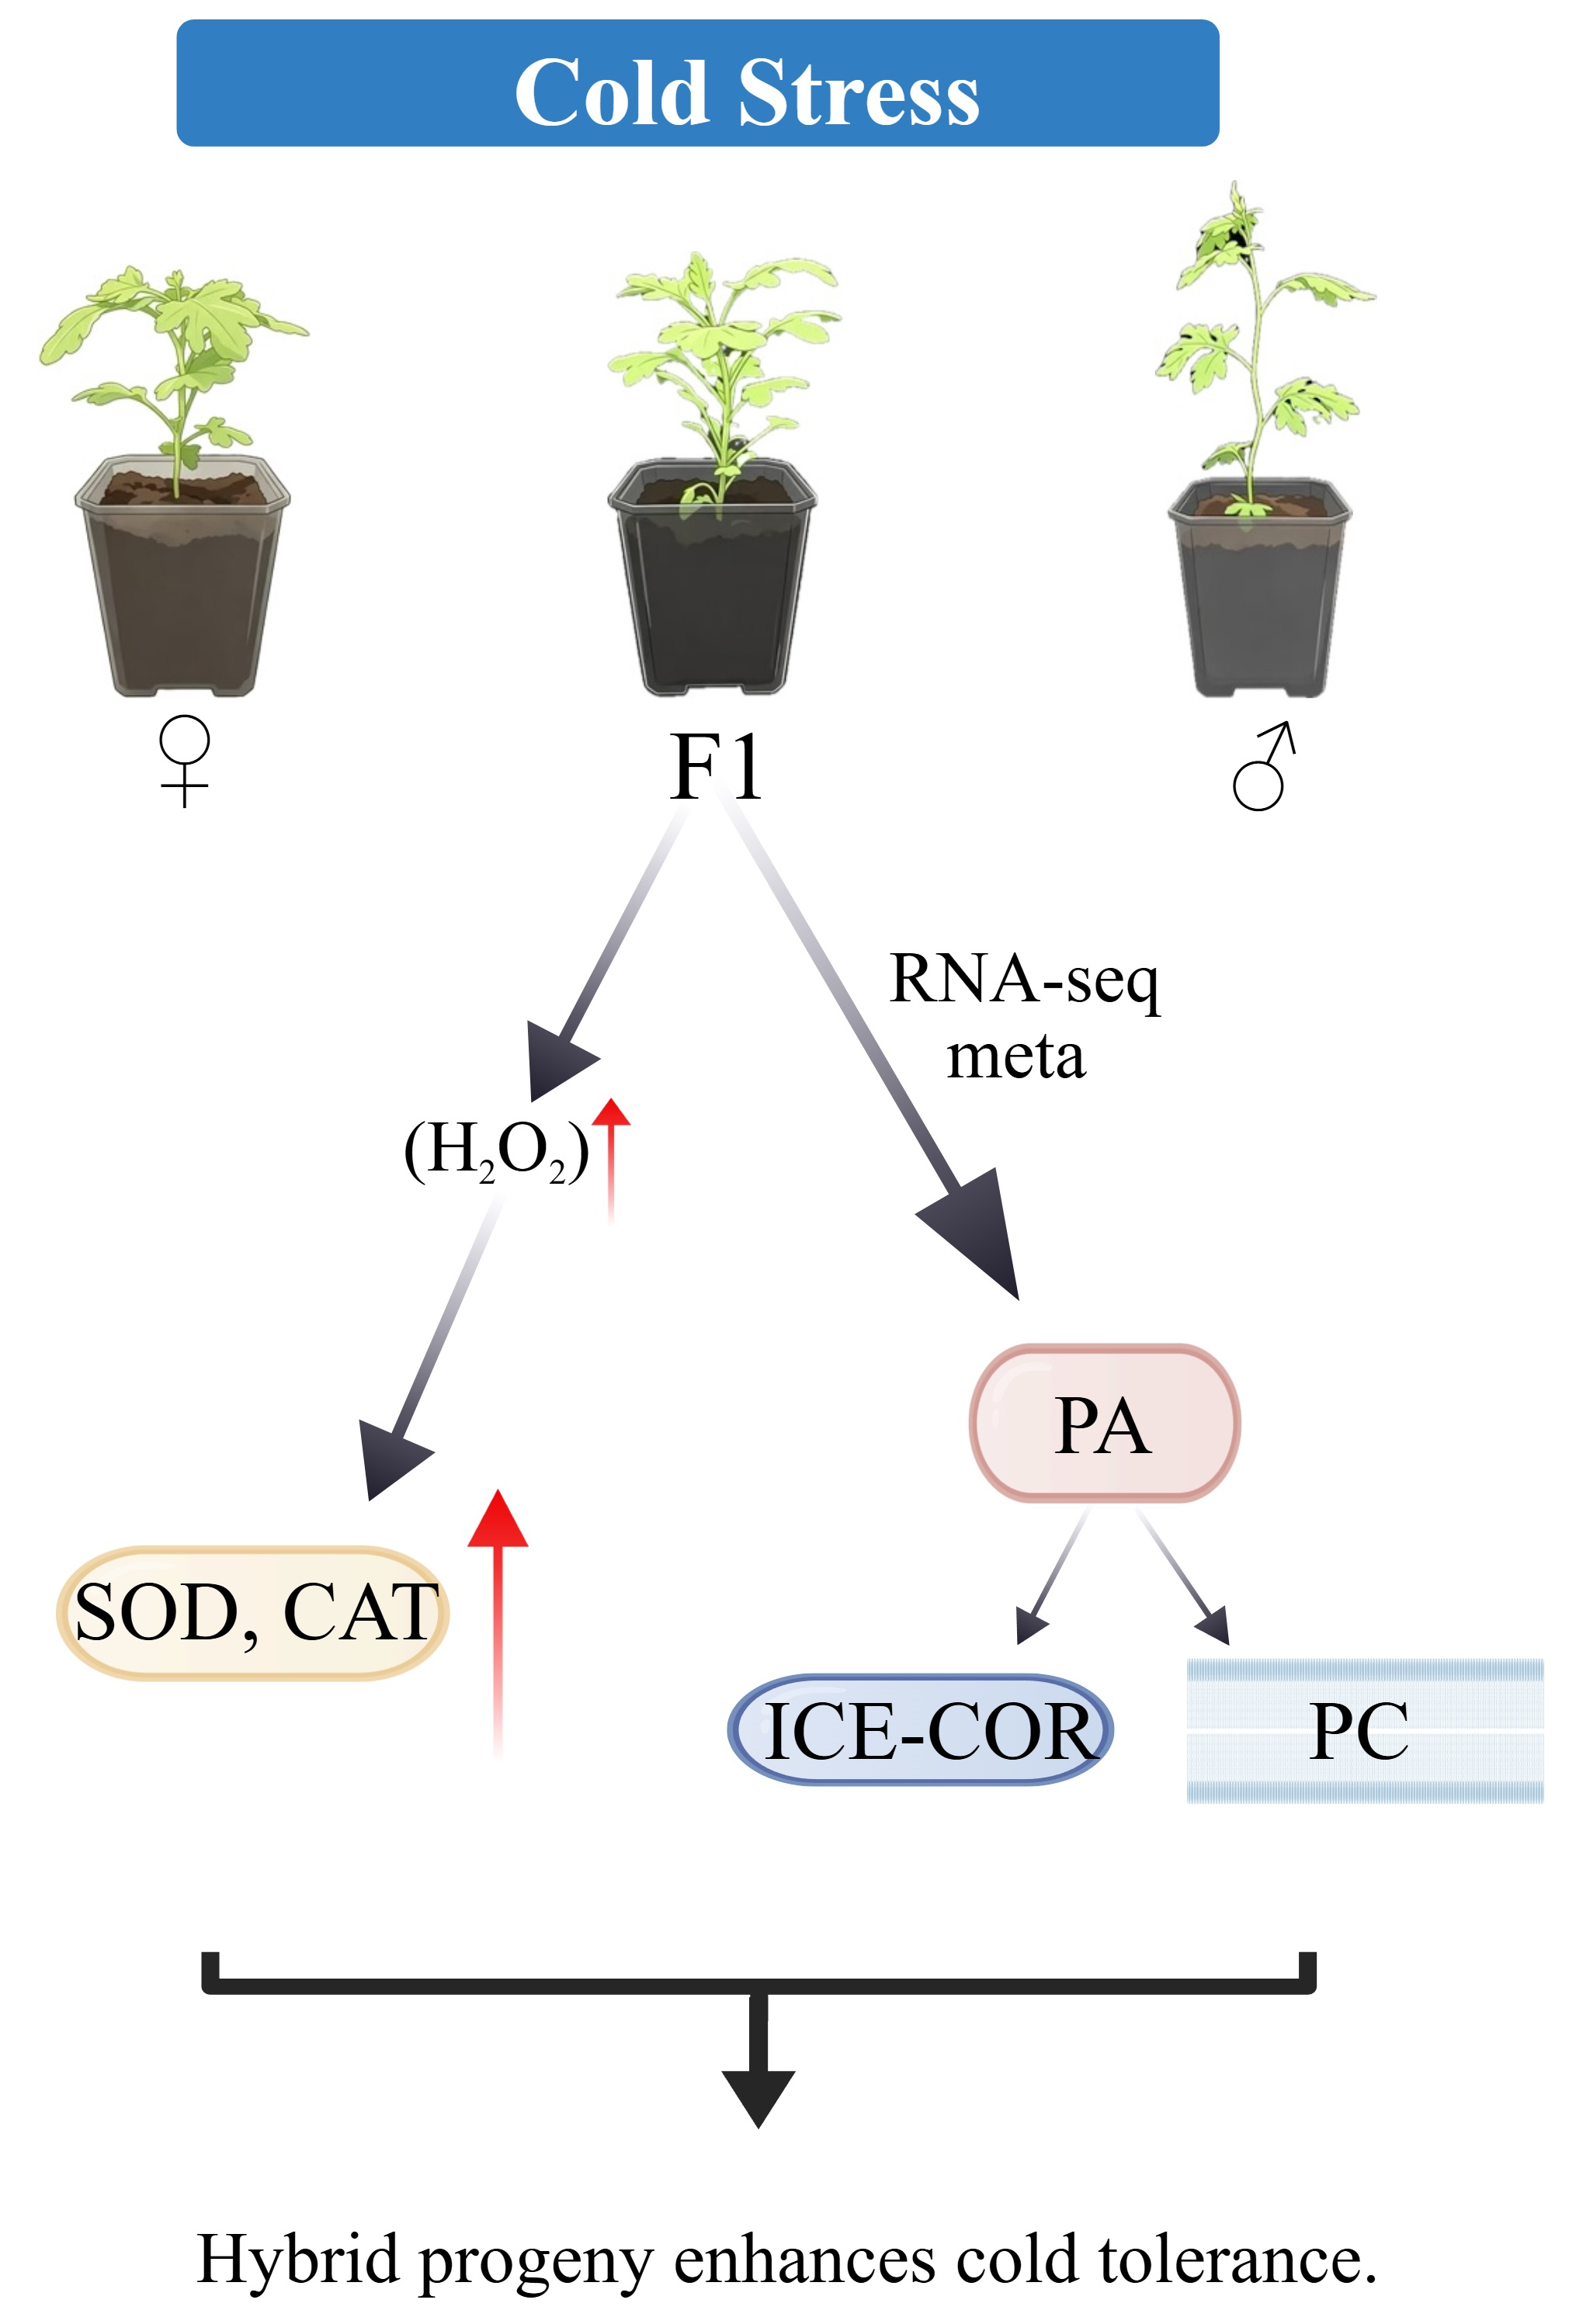
Groundcover chrysanthemums exhibit inherently poor low-temperature adaptability, making them highly vulnerable to cold stress and thereby constraining their large-scale regional cultivation. Interspecific hybridization was conducted between diploid Chrysanthemum lavandulifolium (Fisch. ex Trautv.) Makino (pollen donor) and hexaploid cultivar Chrysanthemum × morifolium Ramat., cv. ‘Yannong Qiujin’ (seed parent) to generate cold-tolerant groundcover chrysanthemum germplasm. Comprehensive physiological profiling and integrated multi-omics analyses were performed on both parental plants and their hybrid progeny to identify candidate molecular pathways associated with cold adaptation in ploidy-divergent Chrysanthemum hybrids. Hybrid progeny exhibited significantly lower semi-lethal temperature (LT50), malondialdehyde (MDA) content, and relative electrical conductivity compared with the female parent, indicating heterosis-mediated enhancement of cellular membrane integrity. Integrated transcriptomic and metabolomic profiling identified significant enrichment of glycerophospholipid metabolism in the hybrid progeny. Upregulated expression of glycerol-3-phosphate acyltransferase (GPAT) and lysophosphatidic acid acyltransferase (LPAAT) genes promoted substantial accumulation of lysophosphatidic acid (LPA) and phosphatidic acid (PA). We found that higher expression levels of GPAT and LPAAT were positively associated with increased accumulation of LPA and PA. PA further contributes to phosphatidylcholine (PC) synthesis, potentially improving plasma-membrane permeability and sustaining plasma membrane integrity under chilling stress. Meanwhile, transcript abundance of the inducer of CBF expression (ICE), cold-regulated (COR) genes were markedly elevated. This study identifies candidate molecular pathways underlying cold adaptation in hybrid progeny derived from ploidy-divergent Chrysanthemum, thereby providing a robust theoretical foundation for breeding novel cold-tolerant chrysanthemum cultivars.

Graphical Abstract

1. Introduction

As a major abiotic stressor, low temperature severely impairs plant growth and development. Cold stress disrupts normal crop growth, leading to growth retardation, dwarfing, and yield reduction, while severe cold exposure leads to permanent cellular damage and plant death [1]. Cold stress compromises plant cellular integrity via driving the phase shift of cell membranes from their native liquid-crystalline conformation to a rigid gel state, consequently boosting membrane permeability, inducing overaccumulation of reactive oxygen species (ROS), and exacerbating membrane lipid peroxidation. Mounting evidence demonstrates that plants employ sophisticated, cold-responsive regulatory networks to enhance freezing tolerance. Among these, the MAPK-ICE-CBF-COR transcriptional cascade is the most extensively characterized cold-signaling module; it promotes the accumulation of compatible osmolytes to maintain membrane lipid homeostasis and alleviate cold-induced lipid peroxidation damage [2].
Cumulative research efforts in cold resistance have yielded remarkable advances in recent decades. Within the MAPK-dependent regulatory network, Liu et al. [3] identified a cold-activated OsMAPK6-OsICE1/OsIPA1 transcriptional cascade. By phosphorylating and thereby stabilizing the OsICE1 and OsIPA1 proteins, OsMAPK6 enhances chilling tolerance in rice seedlings, offering mechanistic insights into early-stage cold adaptation in rice. In a study on sweet potato cold tolerance, Sul-U Park et al. [4] demonstrated that MPK3/MPK6-mediated phosphorylation of IbSPF1 enables this transcription factor to modulate cold-responsive gene expression and improve cold tolerance. Regarding the canonical ICE-CBF-COR cascade, Wang et al. [5] cloned the wheat TaMPK3 gene and generated TaMPK3-overexpressing Arabidopsis lines. Further functional assays confirmed that TaMPK3 interacts with TaICE41 to activate the ICE-CBF-COR regulatory module, thereby enhancing freezing tolerance in the winter wheat cultivar DN1.
The lipid composition and fluidity of cellular membranes represent critical physicochemical determinants for sustaining normal biological membrane function and constitute a fundamental structural basis enabling plants to withstand low-temperature stress. Existing studies have established that jasmonic acid (JA) signaling regulates sphingolipid metabolism. Huang et al. [6] found that cold stress induces the upregulation of SLD1 expression, which increases the unsaturation level of long-chain fatty acids in Arabidopsis thaliana. As a master transcription factor in the JA signaling pathway, MYC2 directly regulates the transcription of SLD1 and associated genes, thereby reprogramming sphingolipid composition, maintaining membrane fluidity, and enhancing plant cold tolerance. Additionally, cold-tolerant Dichondra repens ecotypes displayed substantially less membrane lipid peroxidation than their cold-sensitive counterparts [7]. Collectively, these studies demonstrate that plant cold tolerance is a complex, polygenic trait governed by the synergistic interplay of multiple signaling pathways. These regulatory mechanisms provide a vital theoretical foundation for improving crop cold tolerance via genetic improvement.
Distant hybridization, mainly categorized into interspecific and intergeneric hybridization, is a pivotal breeding strategy for harnessing elite genetic resources from wild germplasms and accelerating the development of novel crop varieties. Nowakowska et al. [8] identified clubroot resistance genes via intergeneric hybridization in Brassica and successfully introgressed these genes into cultivated crops including diploid oilseed rape (Brassica napus) and diploid Chinese cabbage (Brassica rapa subsp. pekinensis), thereby effectively mitigating clubroot disease incidence and reducing yield losses in Brassica crops. Pei et al. [9] performed interspecific crosses using diploid Cucumis sativus (cultivated cucumber) and diploid Cucumis hystrix (wild sour cucumber) as parents. The hybrid progeny exhibited a significantly lower semi-lethal temperature, an enhanced capacity for photosynthetic protection, and a more efficient ROS scavenging system, thereby exhibiting superior stress tolerance. Fechete et al. [10] developed hybrid white clover (Trifolium repens) lines by crossing Trifolium occidentale and Trifolium pallescens progenitor populations. Comparative transcriptomic analysis of the hybrids and their parental lines under frost stress revealed that both the alpine parents and the hybrid lines exhibited significantly higher accumulation of galactitol and raffinose compared with the coastal parents, thereby enhancing cold tolerance in white clover. Transcriptomic profiling of intraspecific progenies obtained by crossing diploid Vitis vinifera cultivars ‘Ecolly’ and ‘Dunkelfelder’ uncovered prominent enrichment of differentially expressed genes (DEGs) in glycerophospholipid metabolism and flavonoid biosynthetic pathways; such pathways strengthen plant cold hardiness via sustaining membrane lipid homeostasis [11]. Controlled crosses were conducted between the hexaploid groundcover chrysanthemum cultivars ‘Yannong Chenghuang’ (male parent) and ‘Yannong Hongxue’ (female parent), and the hybrid progeny exhibited significantly enhanced cold and salt tolerance relative to the female parent [12]. Although distant hybridization has yielded substantial advances in enhancing crop resistance and improving quality traits, most contemporary research predominantly focuses on intergeneric and intrageneric interspecific hybridization. In contrast, investigations into stress resistance in progeny from crosses between congeneric species with divergent ploidy levels remain scarce. In Arabidopsis, inter-ploidy crosses significantly influence a broad spectrum of morphological and adaptive traits including stomatal size, floral organ dimensions, and seed weight [13]. Similarly, rice inter-ploidy hybrids demonstrate enhanced tolerance to abiotic stresses, notably heavy-metal stress [14]. However, the cold tolerance phenotype remains poorly characterized in inter-ploidy hybrids of the genus Chrysanthemum.
The groundcover chrysanthemum cultivar Chrysanthemum × morifolium Ramat., cv. ‘Yannong Qiujin’ was crossed with the Chrysanthemum lavandulifolium (Fisch. ex Trautv.) Makino to generate hybrid progeny. Hybrid progeny were subjected to low-temperature stress, and their phenotypic were systematically assessed. Concurrently, key physiological and biochemical markers of cold tolerance were quantified to enable a comprehensive evaluation of cold resistance in these hybrid progeny. Integrated transcriptomic and metabolomic profiling of parental lines and hybrid progeny enables mechanistic exploration of chilling stress through coordinated analysis of gene expression patterns and metabolite accumulation, thereby providing a theoretical foundation for the targeted breeding of cold-tolerant groundcover chrysanthemum cultivars.

2. Materials and Methods

2.1. Cross Between C. lavandulifolium (Fisch. ex Trautv.) Makino and Chrysanthemum × morifolium Ramat., cv. ‘Yannong Qiujin’

Groundcover chrysanthemum (Chrysanthemum × morifolium Ramat. 2n = 6x = 54) is a hexaploid species within the genus Chrysanthemum (family Asteraceae). It exhibits outstanding ornamental attributes, including a neat elliptical plant architecture, vibrant and diverse flower colors, and a wide array of floral forms. As a valuable germplasm resource for urban landscape development [14]. C. lavandulifolium (2n = 2x = 18), a perennial diploid herb also belonging to the Asteraceae family [15], is one of the principal ancestral species of modern cultivated chrysanthemums and demonstrates notable cold tolerance [16]. The diploid wild CL with strong cold resistance was selected as the male parent, while the ornamental groundcover chrysanthemum cultivar QJ with excellent plant shape but limited cold hardiness served as the female parent. Both parental materials were planted in the spring at the Yanbian University Teaching Base. In late September, all tubular florets of the female parent flowers were carefully excised with fine forceps immediately prior to anthesis. Pollen was collected from CL plants and used for artificial pollination, following the protocol described by Shan et al. [12]. Cross-pollination was performed on 10 female parent plants, involving a total of 120 florets. Fifty days after pollination, seeds were promptly harvested upon withering of the inflorescences and full seed maturation. A total of three seeds were collected and subsequently stored under low-temperature conditions for sowing the following spring. All experiments were conducted from October 2024 to October 2025.

2.2. SRAP Analysis of Hybrid Progenies of C. lavandulifolium (Fisch. ex Trautv.) Makino and Chrysanthemum × morifolium Ramat., cv. ‘Yannong Qiujin’

A total of three hybrid seeds were harvested, and only one seed germinated to obtain a single putative hybrid plant. Young healthy leaves were sampled from the female parent, the male parent and this putative hybrid individual for genomic DNA extraction, followed by Sequence-Related Amplified Polymorphism (SRAP) marker analysis. Genomic DNA was extracted following the manufacturer’s instructions for the commercial DNA extraction kit (Tiangen Biotech Co., Ltd., Beijing, China). The concentration and purity of extracted genomic DNA were determined using 1.5% (w/v) agarose gel electrophoresis and a Merinton SMA1000 microvolume spectrophotometer (Merinton Instrument Inc., Ann Arbor, MI, USA). Genomic DNA isolated from parental plants and their hybrid progenies was normalized to a concentration of 200 ng/μL for subsequent SRAP-PCR amplification using an A300 gene amplifier (LongGene, Hangzhou, China). The total reaction volume for SRAP-PCR was 25 μL, consisting of 2 μL of template DNA, 1 μL of primer mixture, 1.5 μL of dNTP mixture, 2.0 μL of Mg2+ solution, 0.2 μL of rTaq DNA polymerase, and 2.5 μL of 10× PCR buffer; nuclease-free water was added to adjust the final volume to 25 μL. The sequences of primers are listed in Table S1. The PCR amplification protocol was as follows: an initial denaturation step at 94 °C for 4 min, followed by 4 cycles of denaturation at 94 °C for 1 min, annealing at 35 °C for 1 min, and extension at 72 °C for 2 min. Subsequently, 30 additional cycles comprising denaturation at 94 °C for 1 min, annealing at 50 °C for 1 min, and extension at 72 °C for 2 min, and a final extension at 72 °C for 10 min. The PCR products were electrophoresed on a 1.5% (w/v) agarose gel at 220 V for 15 min using a DYY‑10C electrophoresis power supply (Beijing Liuyi Instrument Factory, Beijing, China). Gel images were captured using a Gel imaging system (Model GelView 5000Plus, BLT Photon Technology Co., Ltd., Guangzhou, China) equipped with a UV transilluminator. For SRAP band scoring, each distinct band was scored as a dominant marker at a single locus and recorded as present (1) or absent (0) across all samples. For methodological details, refer to M. Lynch’s [17] report.

2.3. Determination of Semi-Lethal Temperature for Hybrid Progenies

Fresh leaf samples (0.5 g each) were collected from three individual plants of each parental plants and from three individual hybrid progeny plants. Samples were incubated separately at 4 °C, 0 °C, −4 °C, −8 °C, and −12 °C for 2 h each, followed by a 12 h recovery period at 4 °C. Thereafter, the samples were immersed in 15 mL of deionized water for 15 h, and their electrolyte conductivity was measured using a conductivity meter prior to boiling. Subsequently, the samples were boiled in a water bath for 10 min, and the conductivity was measured again after cooling to room temperature. Relative electrical conductivity (REC) was calculated by the formula: REC = (EC before/EC after) × 100%, where EC before and EC after denote the electrical conductivity values measured before and after boiling, respectively. The REC data were fitted to the logistic equation: y = K/(1 + ae − bx), in which y represents REC, x denotes the treatment temperature, and the parameters a, b, and K are associated with the saturation level of cellular injury. The semi-lethal temperature (LT50) was derived as: LT50 = ln (1/a)/b with 95% confidence intervals estimated via non-linear regression.

2.4. Physiological Changes and DAB, NBT Staining Analysis of Progenies Under Cold Stress

Basal buds excised from parental plants and their hybrid progenies were propagated vegetatively via stem cuttings under controlled greenhouse conditions. The rooting medium consisted of a 1:1 (v/v) mixture of humus and perlite, maintained at a constant incubation temperature of 25 ± 2 °C and a 14 h photoperiod. Seedlings with 5–6 leaves were prepared for stress assays; four male and four female parental lines, as well as four hybrid progeny plants (stem cuttings), were exposed to cold conditions. Seedlings were subjected to five temperature treatments (25 °C, 10 °C, 5 °C, 0 °C, and −5 °C) for 2 h, and each treatment included four biological replicates from the same genotype. Following treatment, three to four fully expanded apical leaves were harvested to determine physiological parameters and conduct histochemical staining. Malondialdehyde (MDA) content via the thiobarbituric acid (TBA) reaction. Superoxide dismutase (SOD) activity was measured using the nitroblue tetrazolium (NBT) photoreduction assay. Catalase (CAT) activity was determined spectrophotometrically at 240 nm. Proline (Pro) content was quantified using the acidic ninhydrin method. All enzymatic and biochemical assays were conducted following the protocols described by Gao et al. [18]. Soluble protein (SP) content was quantified using established methods reported in the literature [19]. In situ histochemical detection was carried out using 3,3′-diaminobenzidine (DAB) and nitroblue tetrazolium (NBT). Excised leaves from parental genotypes and hybrid progenies subjected to low-temperature stress were individually immersed in the respective staining buffers and incubated overnight under gentle agitation at ambient temperature to ensure uniform color development. Subsequent to staining, leaf samples were bleached with 95% ethanol and incubated in a boiling water bath until complete transparency, and images were captured to document staining phenotypes.

2.5. Transcriptome Sequencing and Analysis

Three female parent plants, three male parent plants, and three hybrid plants (stem cuttings) each exhibiting uniform growth status and comparable size were subjected to chilling stress treatment at 5 °C for 2 h. Apical one to two leaves were collected for subsequent transcriptomic and metabolomic profiling. Total RNA was extracted using the TransZol Plant RNA Extraction Kit (Tiangen Biotech Co., Ltd., Beijing, China). High-quality RNA samples were reverse-transcribed into cDNA. Library construction and transcriptome sequencing were performed by Personalbio Co., Ltd. (Shanghai, China). Paired-end 150 bp (PE150) sequencing was carried out on the Illumina NovaSeq X Plus platform (Illumina Inc., San Diego, CA, USA). Raw sequencing data (Raw Data) underwent quality control using Fastp (v0.22.0) to remove 3′ adapter sequences and to filter out reads with an average Phred quality score below Q30, yielding high-quality clean reads. Subsequently, clean reads were aligned to the reference genome (https://cgd.njau.edu.cn/asteraceae/browse/genomePage/Cmo, accessed on 12 November 2025) using HISAT2 (v2.1.0). Read counts per gene were quantified using HTSeq (version 0.9.1), and differential expression analysis was conducted using DESeq (v1.39.0) raw count data, while fragments per kilobase of transcript per million mapped reads (FPKM) values were computed separately for visualization purposes. The following significance thresholds were applied: |log2(fold change)| > 2 and false discovery rate (FDR) < 0.05. Functional enrichment analysis of Gene Ontology (GO) terms was performed using topGO v2.50.0, whereas KEGG pathway enrichment analysis was conducted using clusterProfiler v4.6.0. In both analyses, an adjusted p-value < 0.05 was considered statistically significant.

2.6. Metabolomic Analysis

Leaf samples from parental lines and hybrid progenies subjected to cold stress treatment were immediately snap-frozen in liquid nitrogen (−196 °C) and subsequently pulverized. An aliquot of 40 mg of the pulverized tissue was transferred into a 2 mL microcentrifuge tube, followed by addition of 300 μL of prechilled extraction solvent (methanol:acetonitrile:water = 2:2:1, v/v/v; containing 5 ppm 2-chlorophenylalanine as internal standard) and two grinding beads. The tubes were vortexed for 30 s, homogenized twice at 55 Hz for 60 s per cycle, sonicated for 10 min, and then incubated at −20 °C for 30 min. Following centrifugation (12,000× g, 4 °C, 10 min), the supernatants were filtered through 0.22 μm syringe filters and transferred into autosampler vials for metabolomic analysis. Untargeted metabolomic profiling was performed using a Thermo Scientific UHPLC–HRMS system (Thermo Fisher Scientific, Waltham, MA, USA) equipped with an ACQUITY UPLC HSS T3 column (Waters Corporation, Milford, MA, USA; 100 Å, 1.8 μm, 2.1 mm × 100 mm). The mobile phase consisted of 0.1% (v/v) aqueous formic acid (solvent A) and 0.1% (v/v) formic acid in acetonitrile (solvent B). Mass spectrometric data were acquired on a Thermo Orbitrap Exploris 120 mass spectrometer (Thermo Fisher Scientific, Waltham, MA, USA) operating in separate electrospray ionization (ESI) positive- and negative-ion modes. Peak detection, chromatographic alignment, and spectral deconvolution of raw metabolomic data were performed using MS-DIAL (v4.9.221218). A total of nine quality control (QC) samples were prepared by pooling equal-volume aliquots from all experimental samples. In the LC–MS analytical sequence, three QC samples were injected at the beginning to equilibrate the instrument; one QC sample was interspersed after every eight experimental samples, and an additional three QC samples were analyzed at the end of the run. Fixed-concentration internal standards were spiked into samples prior to extraction. For data preprocessing, features exhibiting a relative standard deviation (RSD) > 30% across QC samples were excluded. Furthermore, a group-wise missing-value filter was applied: metabolic features detected in fewer than 50% of samples within any given experimental group were removed. Remaining missing values were imputed using the k-nearest neighbors (k-NN) algorithm. Principal component analysis (PCA) was performed using the ropls package (v4.3.3, R) to assess overall sample clustering and analytical reproducibility. In addition, partial least squares discriminant analysis (PLS-DA) and orthogonal PLS-DA (OPLS-DA) models were constructed to identify differentially abundant metabolites. Between-group differences of metabolites were statistically evaluated by Student’s t-test, with thresholds of FDR < 0.05 and a variable importance in projection (VIP) > 1 for differential metabolite screening. One-way ANOVA was applied for comparisons across multiple groups using identical cutoff values. Enrichment analysis against the KEGG database was conducted via clusterProfiler v4.6.0, and it was set as the threshold for significant pathway enrichment.

2.7. Integrated Correlation Analysis of Transcriptomic and Metabolomic Data

Pearson’s correlation coefficients were computed across all nine biological samples (three genotypes × three biological replicates) to identify coordinated patterns between gene expression and metabolite accumulation. Given the high dimensionality of the dataset, multiple-testing correction was applied using the Benjamini–Hochberg procedure to control the false discovery rate (FDR). Gene‑metabolite pairs with significant correlations were screened after multiple‑testing correction using thresholds of FDR < 0.05 and |Pearson’s correlation coefficient r| > 0.8. Nine-quadrant partition analysis was conducted to characterize the expression trends of filtered genes and metabolites, enabling intuitive visualization of their log2 fold-change (log2 FC) profiles. Shared KEGG pathways that were significantly enriched at both the transcriptional and metabolic levels were identified by intersecting the enrichment results of DEGs and differential metabolites. Subsequently, the expression patterns of key genes and their corresponding metabolites within these commonly enriched pathways were systematically characterized.

2.8. Expression Levels of Cold Tolerance-Related Genes

The relative expression levels of GPAT, LPAAT, MAPKKK, MAPK, ICE, DREB, COR, PAP and FAD2 in the leaves of the hybrid offspring and their parents were detected by real-time fluorescence quantitative PCR (qRT-PCR). The qRT-PCR assay was performed on an Mx3005P Real-Time PCR System (Agilent Technologies, Inc., Santa Clara, CA, USA). The reaction system consisted of 2 × SuperReal PreMix Plus 10 μL (Tiangen Biotech Co., Ltd., Beijing, China), cDNA 5 μL, 50 × ROX Reference Dye(Δ) 0.4 μL, Primer F 1 μL, Primer R 1 μL, RNase-free ddH2O 2.6 μL. Reaction program: 95 °C for 2 min; 95 °C for 5 s, 55 °C for 10 s, and 72 °C for 15 s for 40 cycles, and the melting curve was selected from 60 °C to 95 °C. The internal reference gene was EF1α. The primer sequences for the cold tolerance-related genes are listed in Table 1. Each treatment was performed in triplicate. Data analysis was conducted using the 2−ΔΔCT method.

2.9. Data Analysis

All experiments were conducted in triplicate biological replicates from the same genotype. Statistical analyses were performed using SPSS (v20.0, IBM Corp., Armonk, NY, USA), with two-way ANOVA used for evaluation. Simple-effect tests with Bonferroni correction were performed for pairwise comparisons among different genotypes under the same temperature condition. The significance level was set at p < 0.05.

3. Results

3.1. Verification of Hybrid Progeny Authenticity and Evaluation of Genetic Diversity

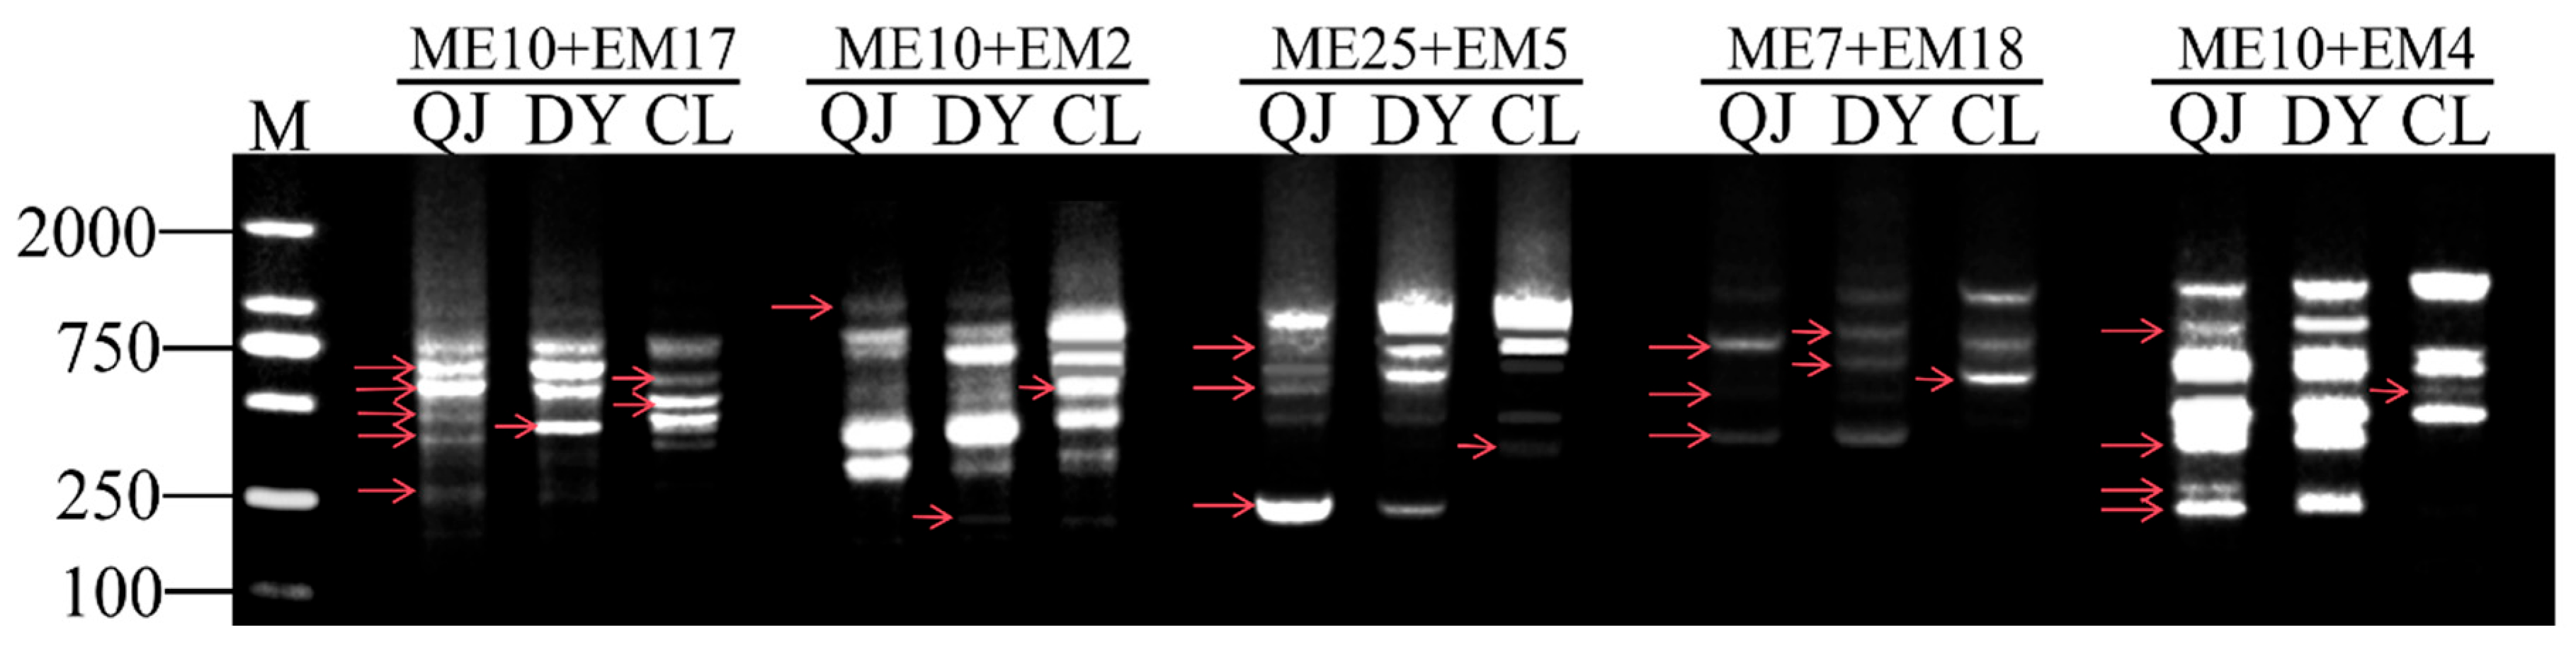
To confirm the authenticity of the hybrid progeny and assess its genetic polymorphism, SRAP-PCR analysis was performed on genomic DNA extracted from hybrid progeny and its parental plants using locus-specific primer pairs. The number of amplified DNA fragments per SRAP primer pair ranged from 3 to 10, yielding a total of 255 polymorphic bands across the 15 primer combinations. In the amplification profiles of the two sets of SRAP primers (ME10 + EM17 and ME10 + EM2), there were two characteristic bands shared by the parental and hybrid progeny. In contrast, the three sets of primers (ME25 + EM5, ME7 + EM18, and ME10 + EM4) specifically amplified three characteristic bands shared by the maternal and hybrid progeny (Figure 1 and Figure S1). Genetic diversity analysis identified 116 stable and well-resolved loci, of which 81 were polymorphic, yielding a polymorphic loci percentage (PPL) of 69.83%. Nei’s gene diversity index across all loci ranged from 0 to 0.4880, and Shannon’s information index ranged from 0 to 0.6811, revealing moderate levels of genetic diversity within the hybrid progeny and its parental plants (Table S2).

3.2. Morphological Variation and Heterosis of Hybrid Progeny

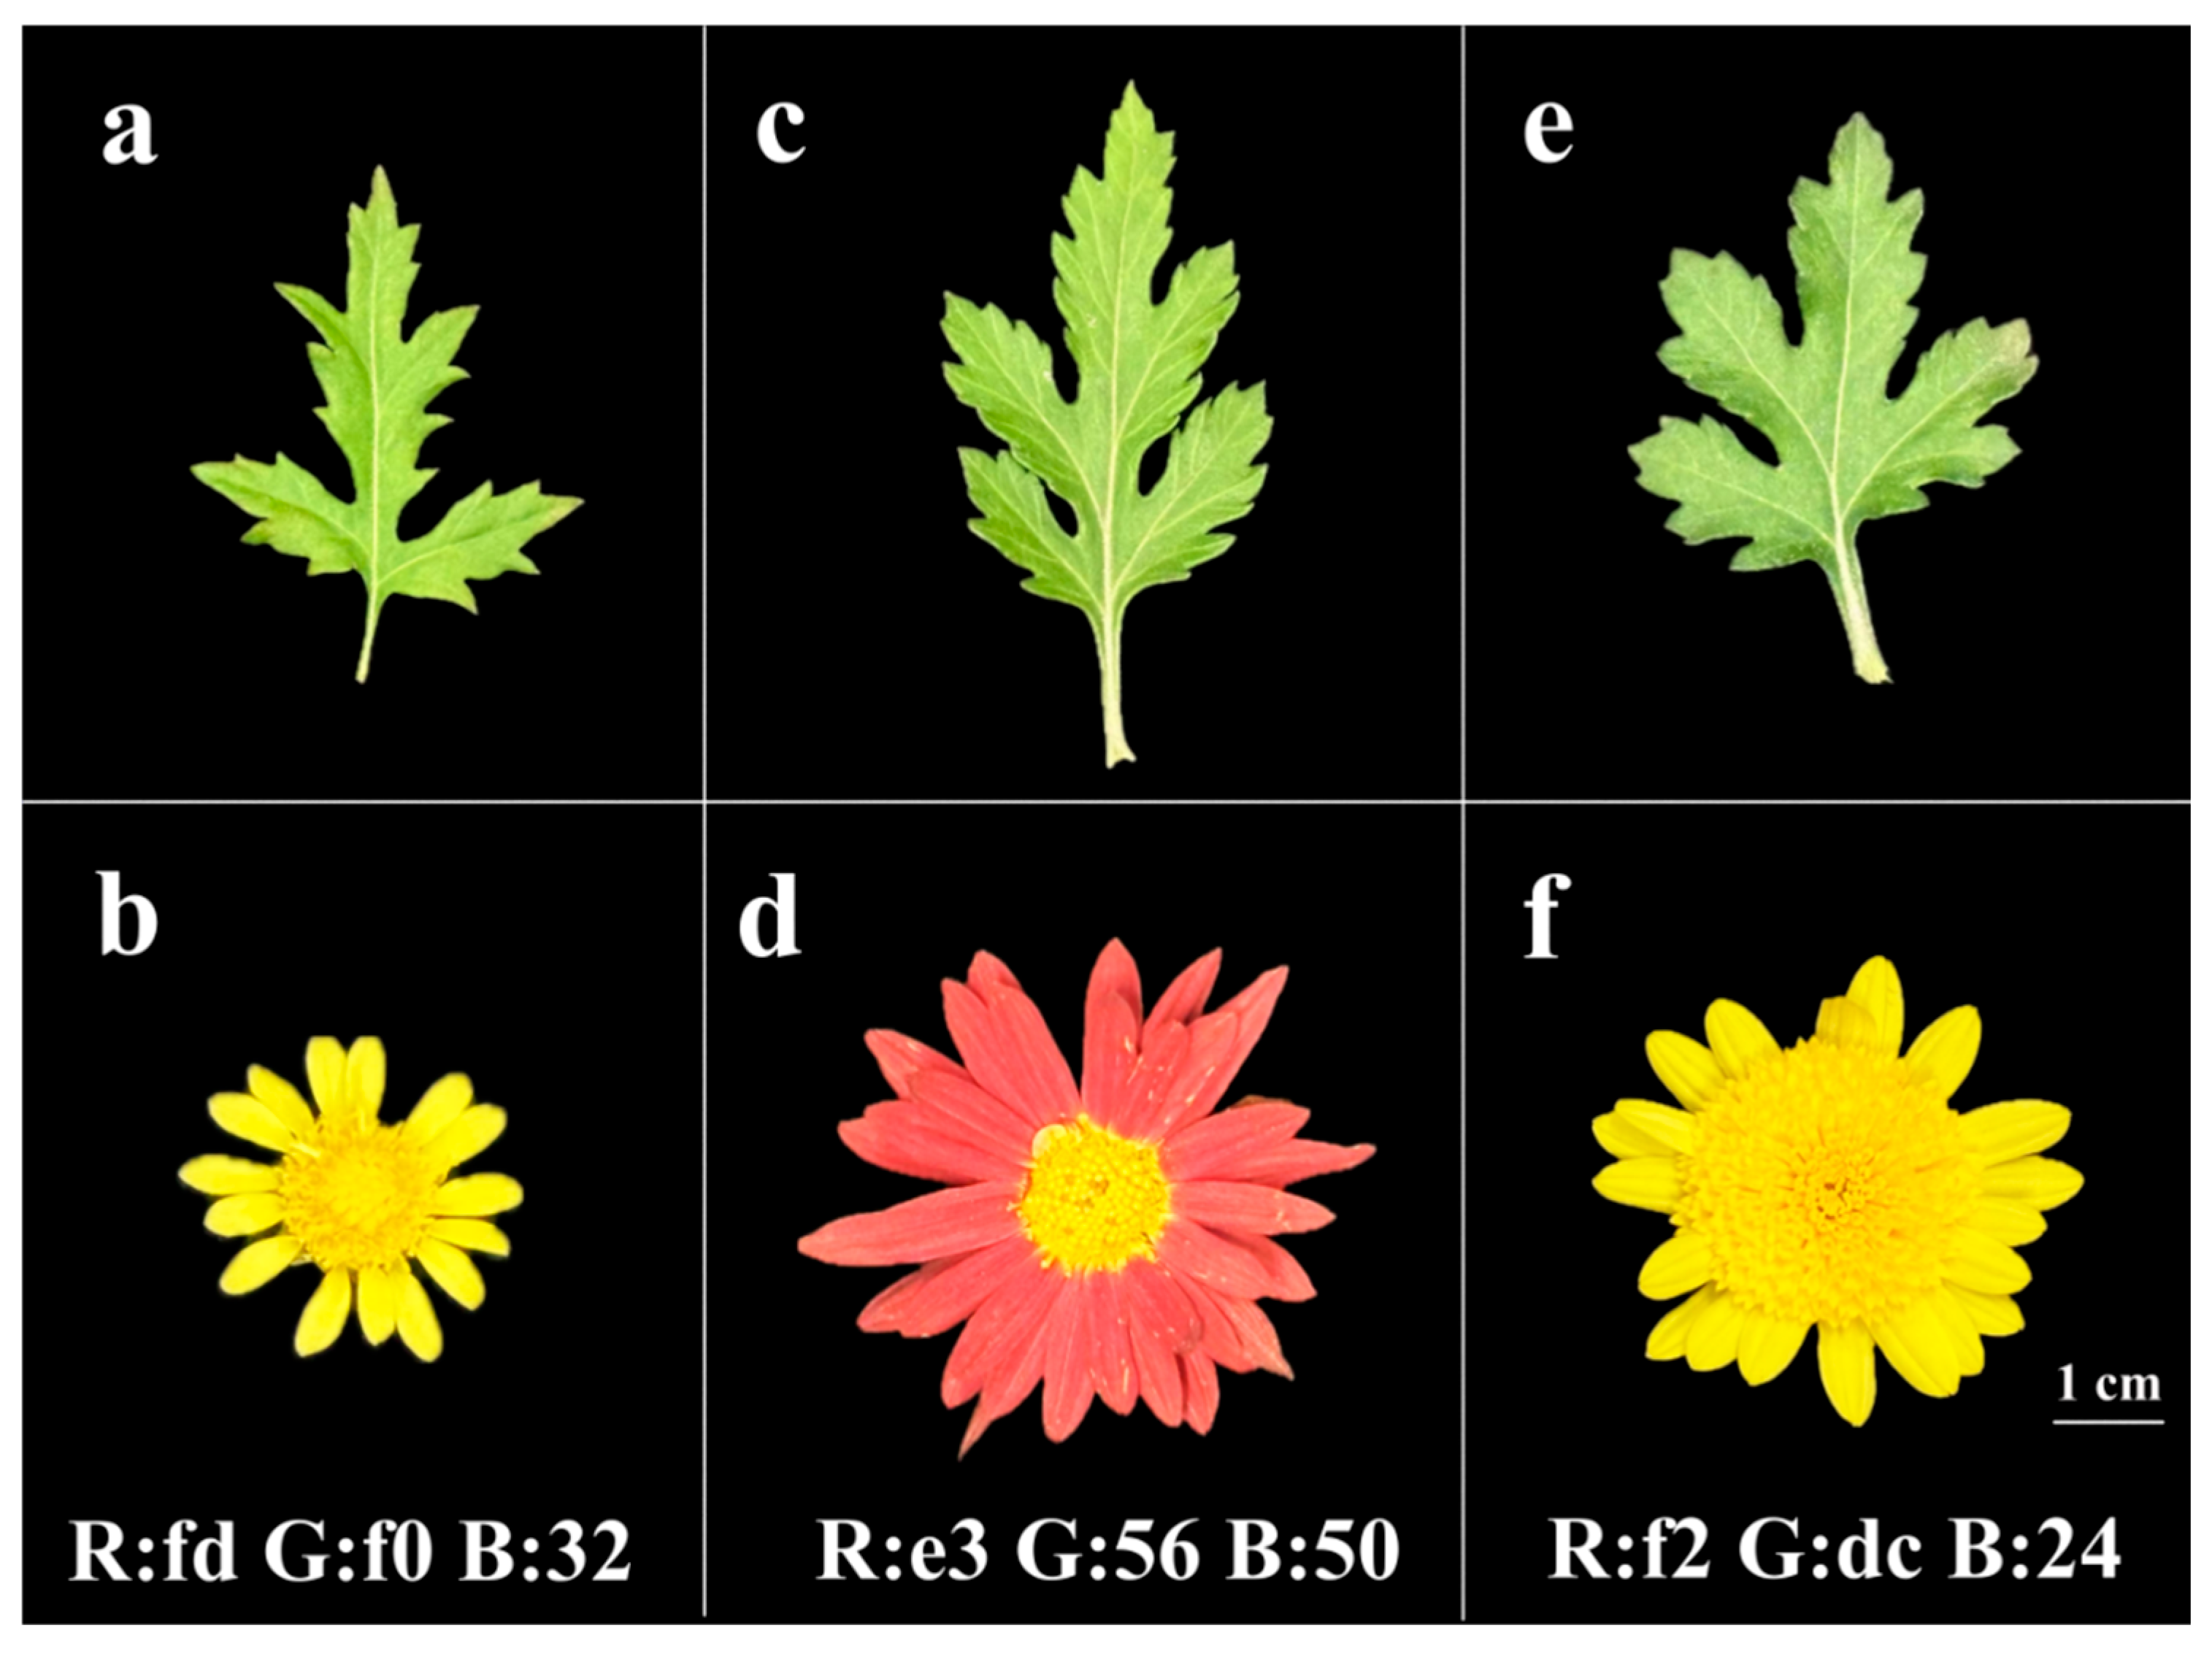
A morphological investigation was conducted on the hybrid progeny and its parental plants during the flowering stage. The hybrid progeny exhibited a plant height of 35.75 cm and a crown spread of 42.58 cm, both of which were higher than those of the maternal parent QJ but lower than those of the paternal parent CL. Leaf length, inflorescence diameter, number of ray florets, and ray floret length in the hybrid progeny were 7.1 cm, 5.44 cm, 39, and 2.55 cm, respectively, each trait exceeding the corresponding value in both parental lines. The leaves are wide, and the number and length of its tubular florets in the hybrid progeny were 1.2-fold, 1.3-fold, and 1.3-fold greater than those of the paternal parent CL, respectively. The heterobeltiosis values of hybrid progeny for leaf length, capitulum diameter, ray floret number, and ray floret length ranged from 0.33% to 1.17%. These positive mid-parent heterosis (MPH) values indicate that the hybrid’s performance for the trait exceeds the corresponding mid-parent mean. The ray floret of hybrid progeny are crimson-red, with standardized RGB values of R = e3, G = 56, B = 50. Ray floret surfaces bear discrete yellow spots and two distinct layers (Figure 2, Table 2).

3.3. Semi-Lethal Temperature of Hybrid Progeny Under Low-Temperature Stress

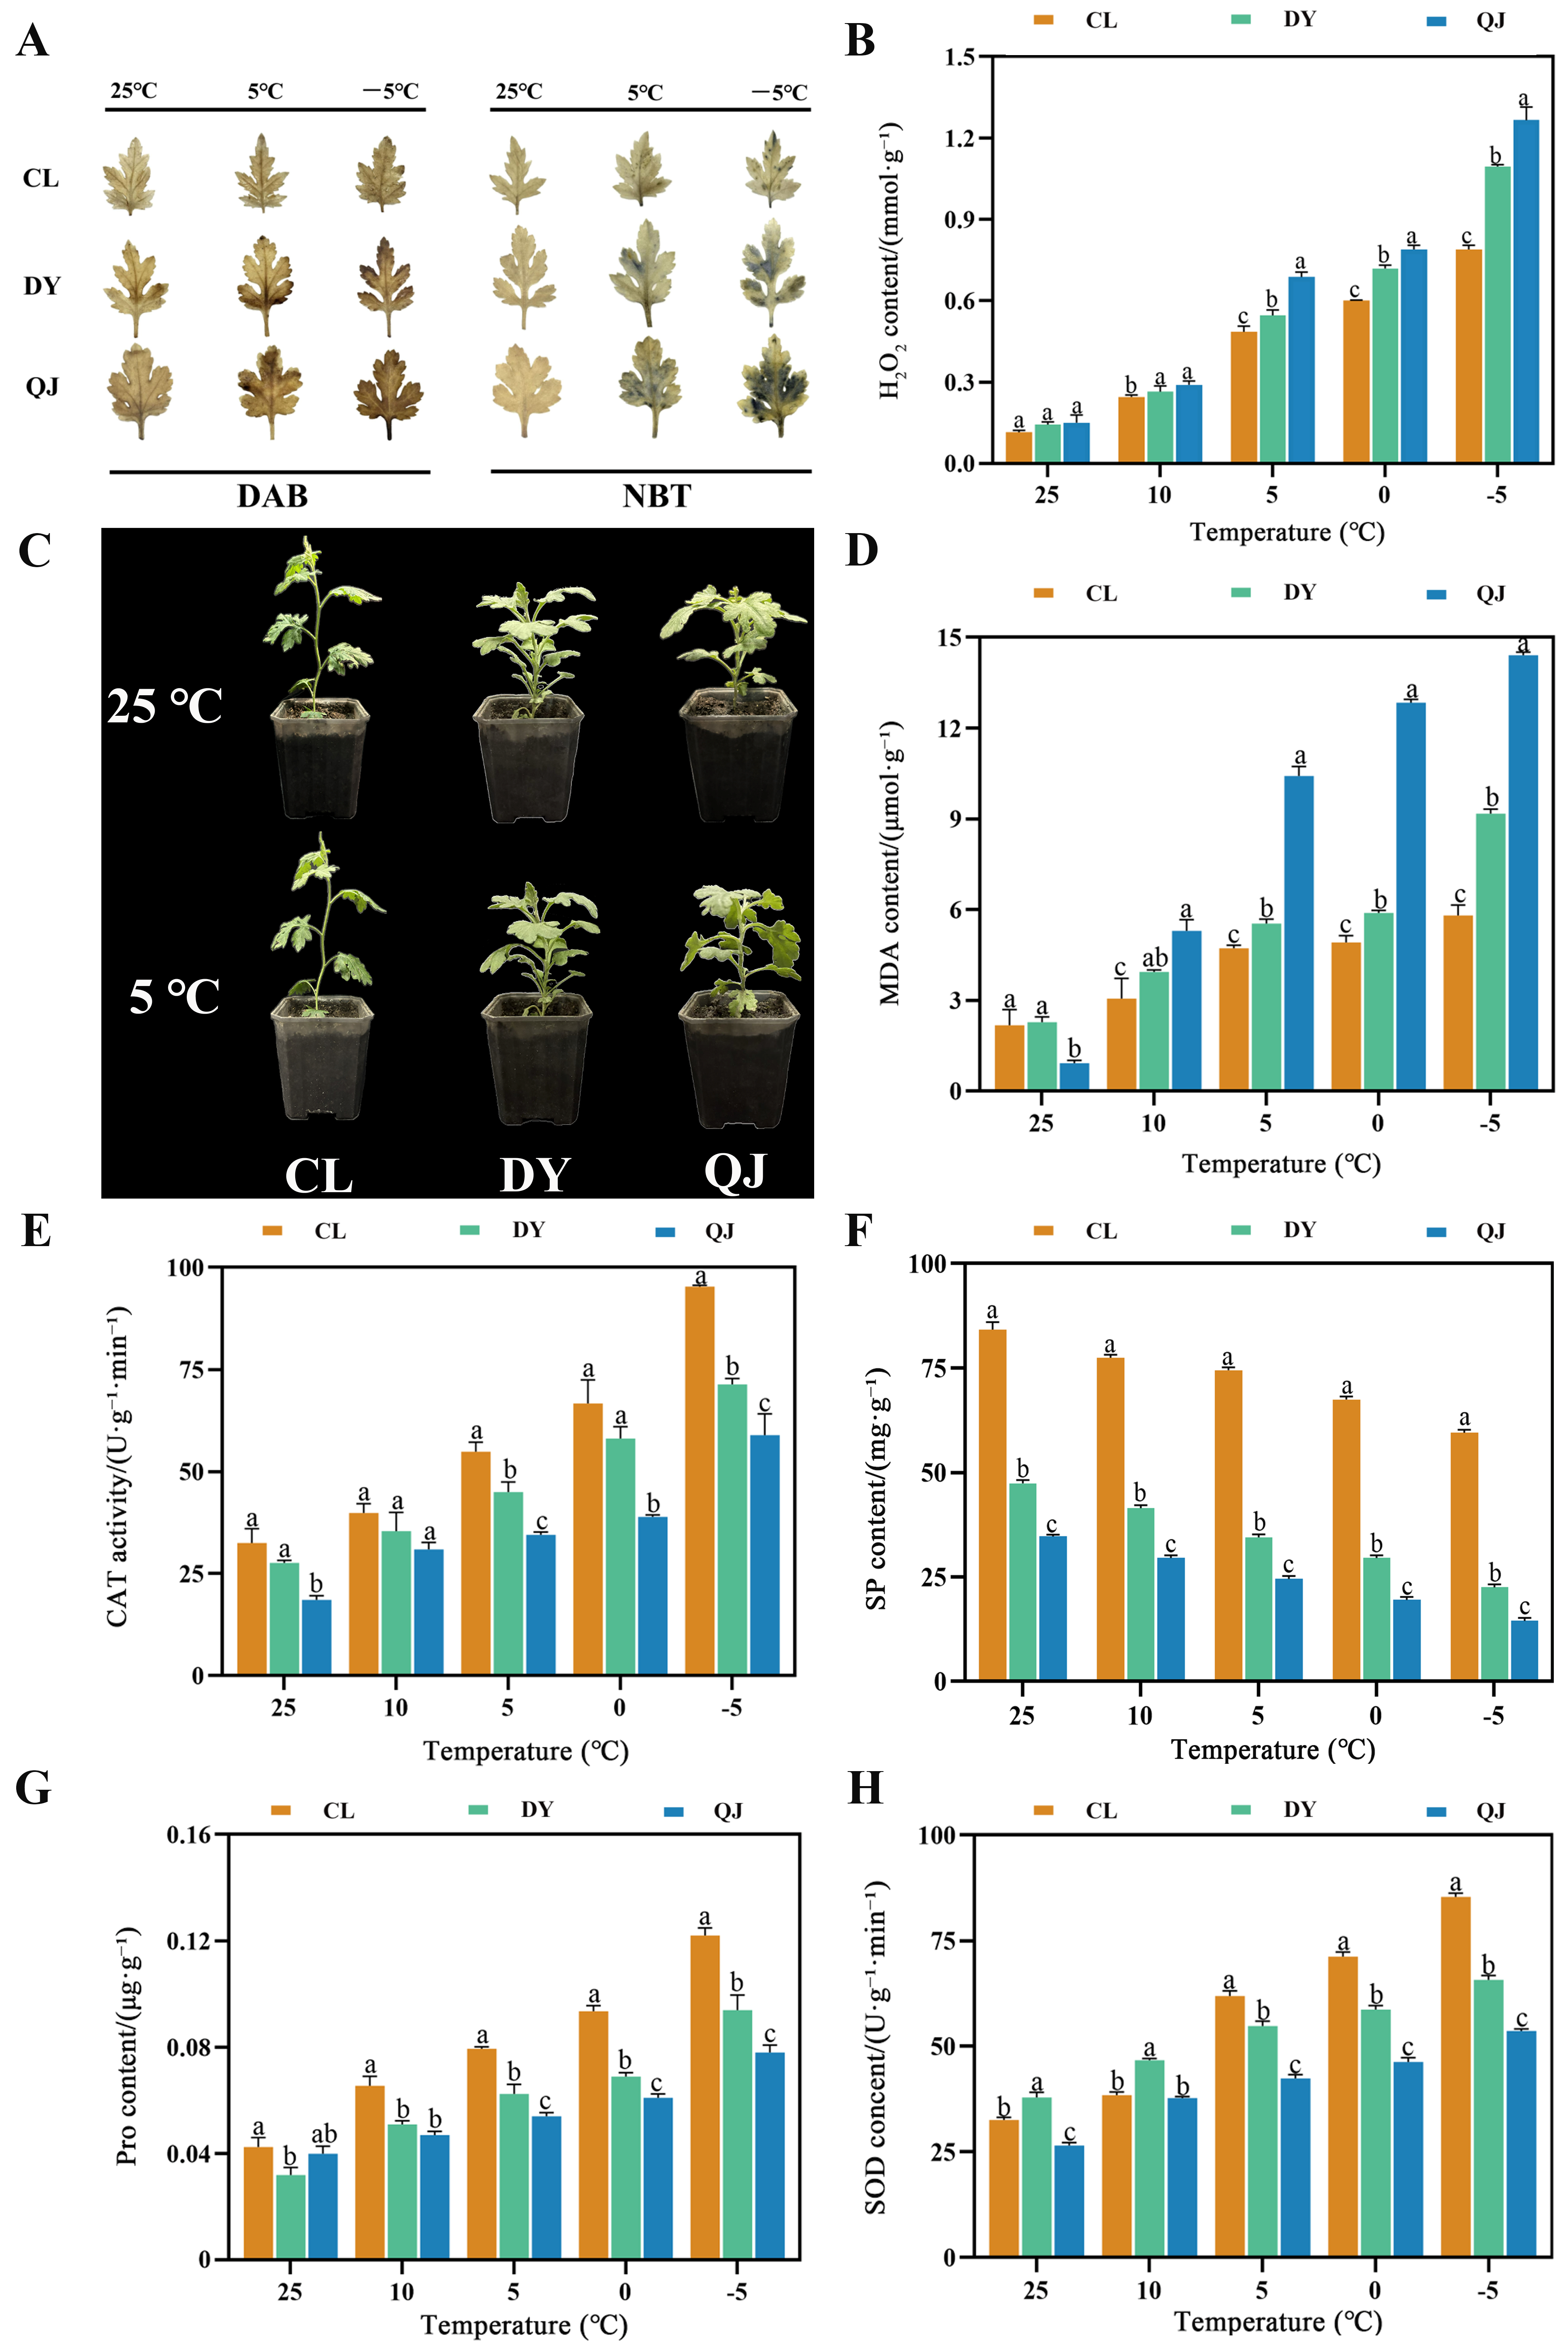
Following exposure of leaves from both parental plants and hybrid progeny to varying temperature treatments, relative electrical conductivity was measured. Results revealed that, as temperature decreased, the relative electrical conductivity of the hybrid progeny and parental plants increased progressively. At −12 °C, the relative conductivity of the maternal parent QJ was the highest, that of the paternal parent CL was the lowest, and that of the hybrid progeny fell between these two extremes. By fitting a regression equation to the relative conductivity data, the semi-lethal temperature of the test material was determined: the semi-lethal temperature of the maternal parent was −3.14 °C, and that of the hybrid progeny was −9.02 °C (Table 3). Compared with the parental plant, the semi-lethal temperature of the hybrid was significantly lower, indicating enhanced cellular membrane stability in the hybrid progeny compared with that of the maternal parent.

3.4. Phenotypic and Physiological Analysis of Hybrid Progeny Under Cold Stress

To further assess the cold tolerance of the hybrid progeny, plants were subjected to low-temperature stress treatment. Phenotypic changes and alterations in antioxidant enzyme activities were systematically observed and analyzed. After 2 h of low-temperature treatment, the leaf axillary angles of the DY were reduced compared with those of the maternal parent QJ, whereas the leaf axillary angles of the paternal CL remained unchanged (Figure 3C). The accumulation of ROS in leaves was assessed using DAB and NBT histochemical staining. Results revealed that leaf staining intensity increased with decreasing temperature. After 2 h of low-temperature treatment, DAB staining analysis revealed that, at the same treatment temperature, the maternal plant exhibited the most intense staining, followed by the progeny, whereas the paternal plant displayed the weakest staining. The primary cause of leaf color intensification is the progressive accumulation of hydrogen peroxide (H2O2) in leaf tissues. Meanwhile, NBT staining revealed that the number of blue formazan deposits on leaves was lowest in the paternal, intermediate in the hybrid progeny, and highest in the maternal (Figure 3A). H2O2 quantification revealed a gradual increase in H2O2 content in both the hybrid progeny and parental plants with decreasing temperature. At 5 °C, the maternal plant exhibited significantly higher H2O2 levels than both the hybrid progeny and the paternal plant (Figure 3B). Meanwhile, antioxidant enzyme activities and osmotic regulatory substance contents were quantified in plants subjected to varying low-temperature. The results showed that SOD and CAT activities, as well as Pro and soluble sugar contents, increased progressively with decreasing temperature in both the hybrid progeny and its parental lines. At −5 °C, SOD and CAT activities as well as Pro content in the hybrid progeny were 65.73 U·g−1·min−1, 71.34 U·g−1·min−1, and 0.094 μg·g−1, respectively, significantly exceeding those in the maternal parent. Concurrently, MDA content increased progressively with decreasing temperature. At 5 °C, the MDA content in the maternal parent was 10.42 μmol·g−1, significantly exceeding that of both the hybrid and the paternal parent (Figure 3D–H). Collectively, these findings demonstrate that the hybrid progeny possesses enhanced cold tolerance relative to the maternal parent.

3.5. Overview of RNA Sequencing

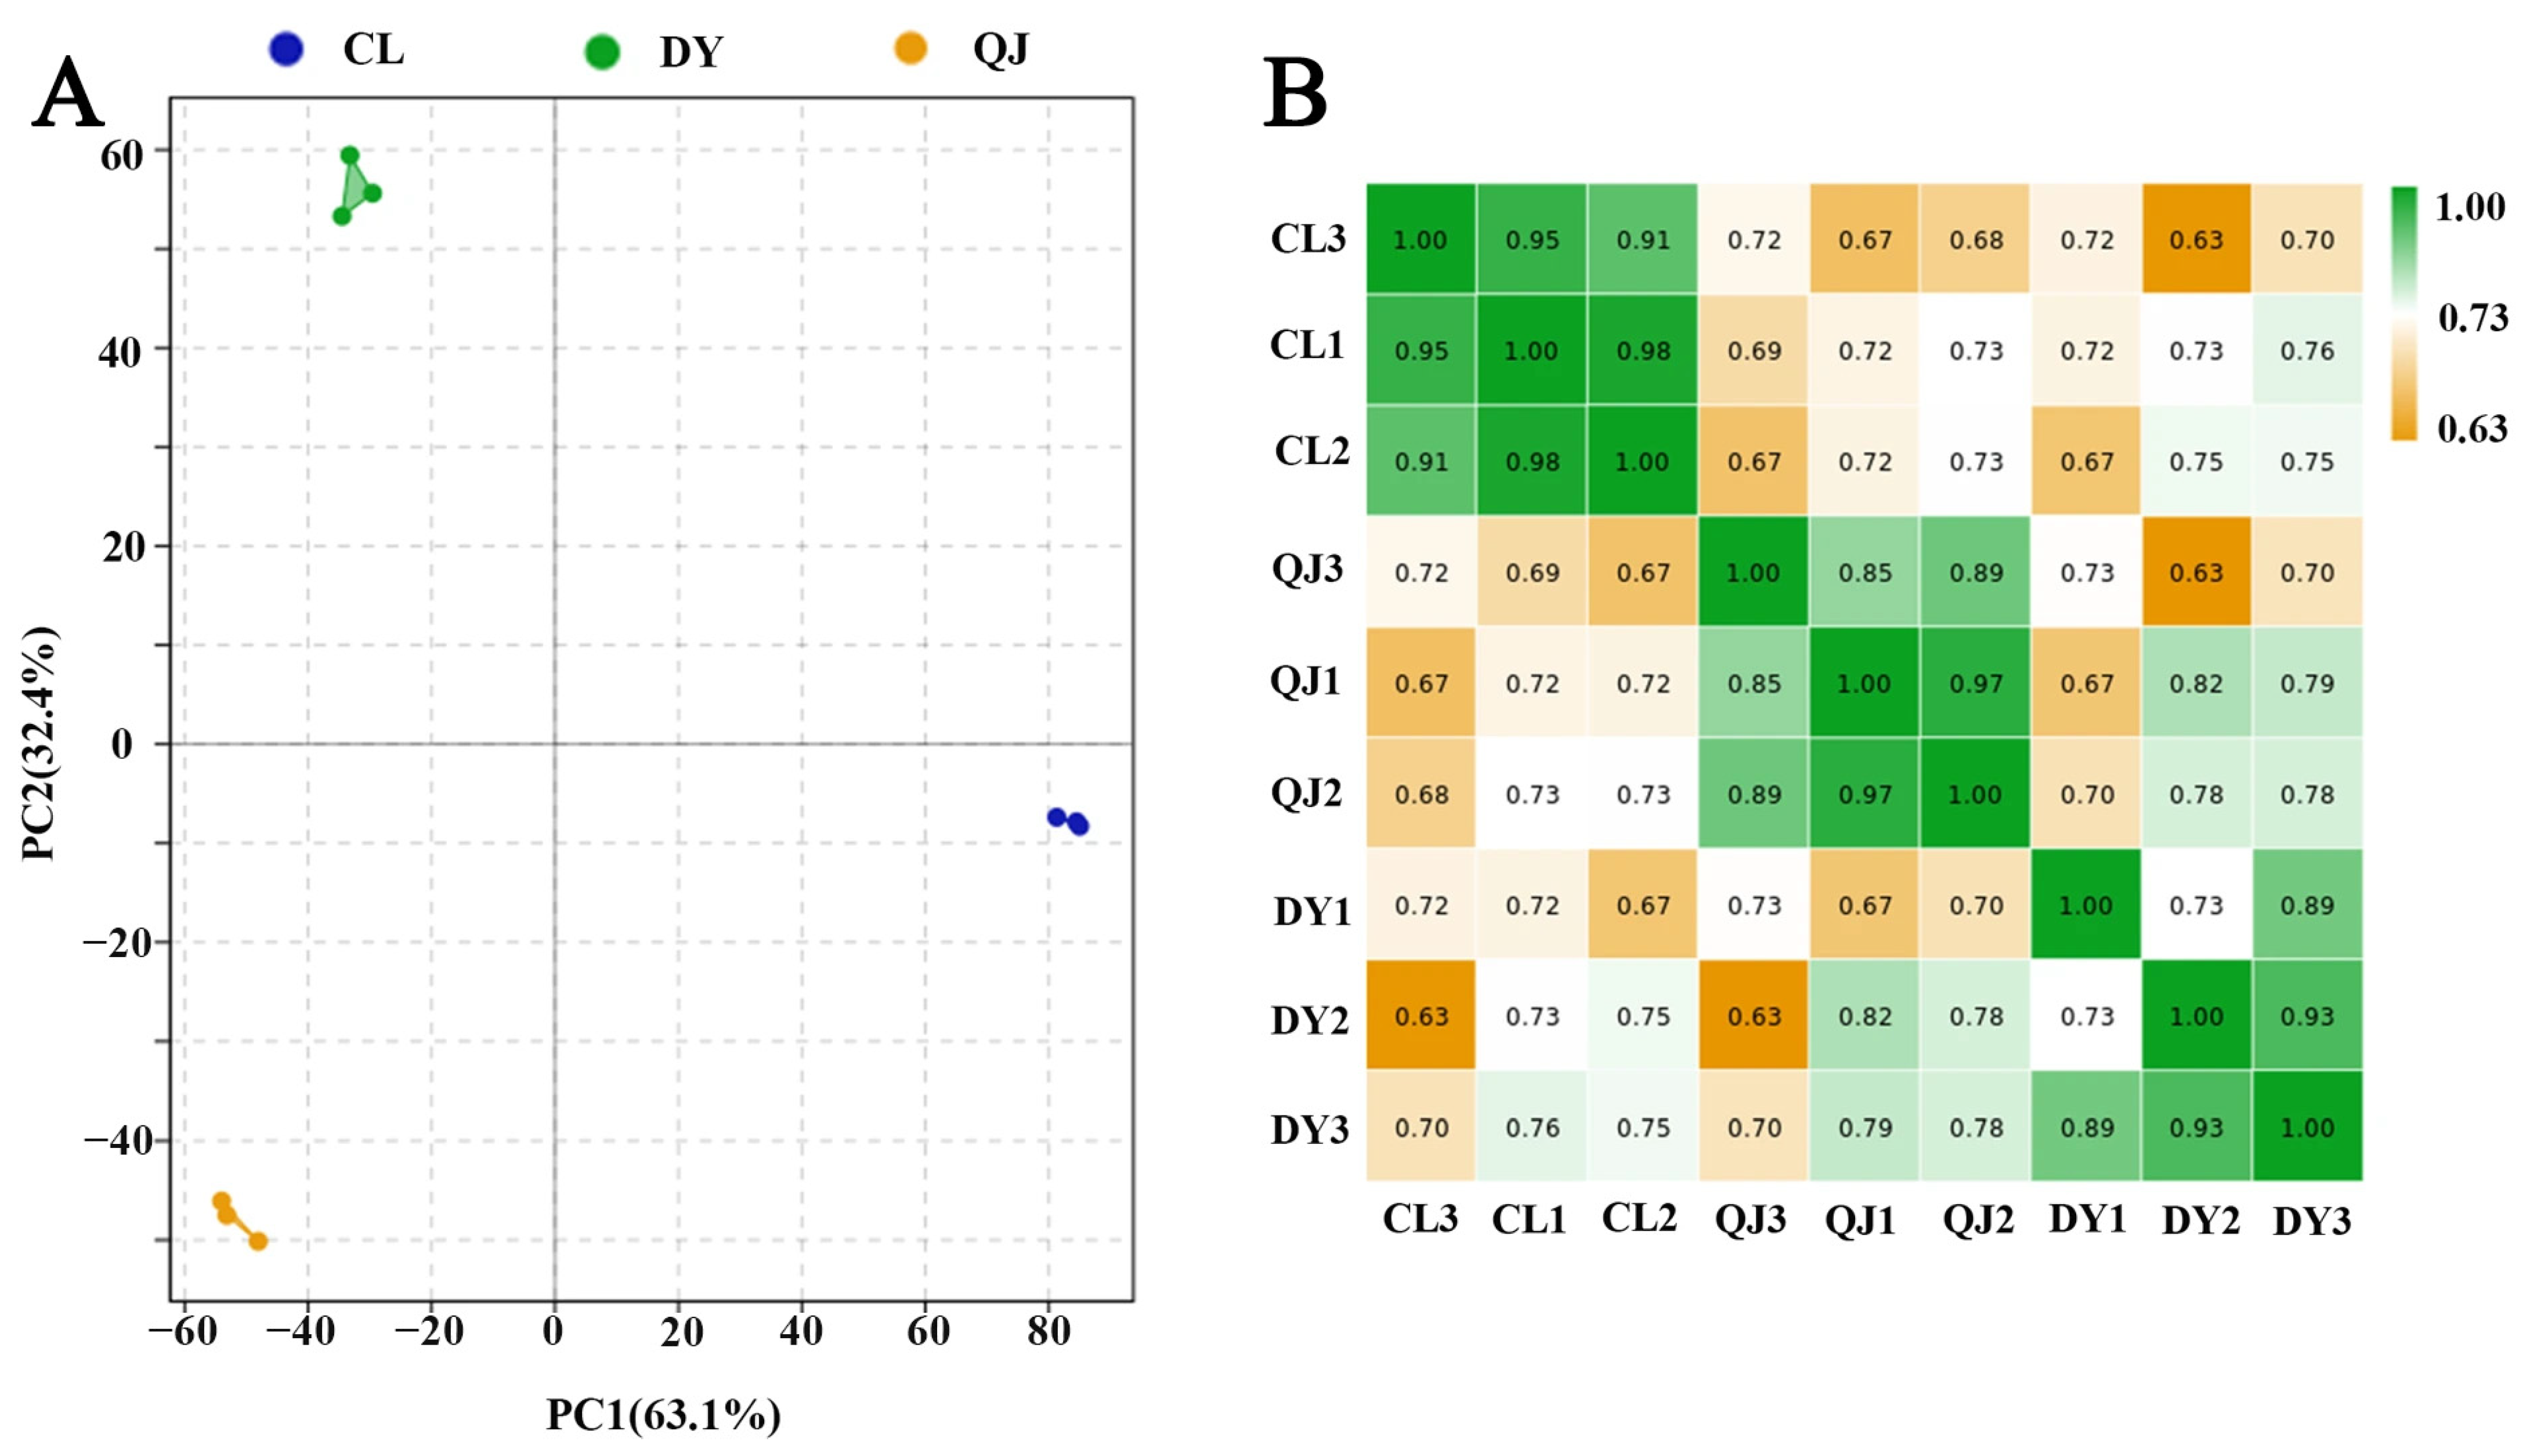
To explore the molecular regulatory network underlying low-temperature stress, transcriptome profiling was performed on the hybrid progeny and its parental plants. Nine cDNA libraries were constructed and sequenced using paired-end sequencing on the Personalbio platform. Following rigorous data quality control and filtering, a total of 42.4 Gb of high-quality, valid sequencing data was obtained. The effective data volume per sample was ≥1.11 Gb, the GC content exceeded 43.27% across all samples, and the Q30 value reached up to 96.84%. Overall, the sequencing data exhibited high reliability (Table S3). Transcriptome principal component analysis (PCA) was conducted on all the test samples and quality control (QC) samples to evaluate the expression differences of the samples and the stability of the data. The QC samples exhibit tight clustering, indicating high sequencing reproducibility; the parental lines and hybrid progeny collectively account for 63.1% of the variance explained by the first principal component (Figure 4A). All samples exhibited distinct and robust separation, which confirms the high consistent clustering of biological replicates. In the comparison parents and progeny, the Pearson correlation coefficient (PCC) ranged from 0.63 to 0.82, indicating distinct separation of expression profiles among samples. Notably, the hybrid progeny displayed expression patterns more similar to those of the male parental plant.

3.6. Gene Ontology (GO) Functional Enrichment Analysis of Differentially Expressed Genes

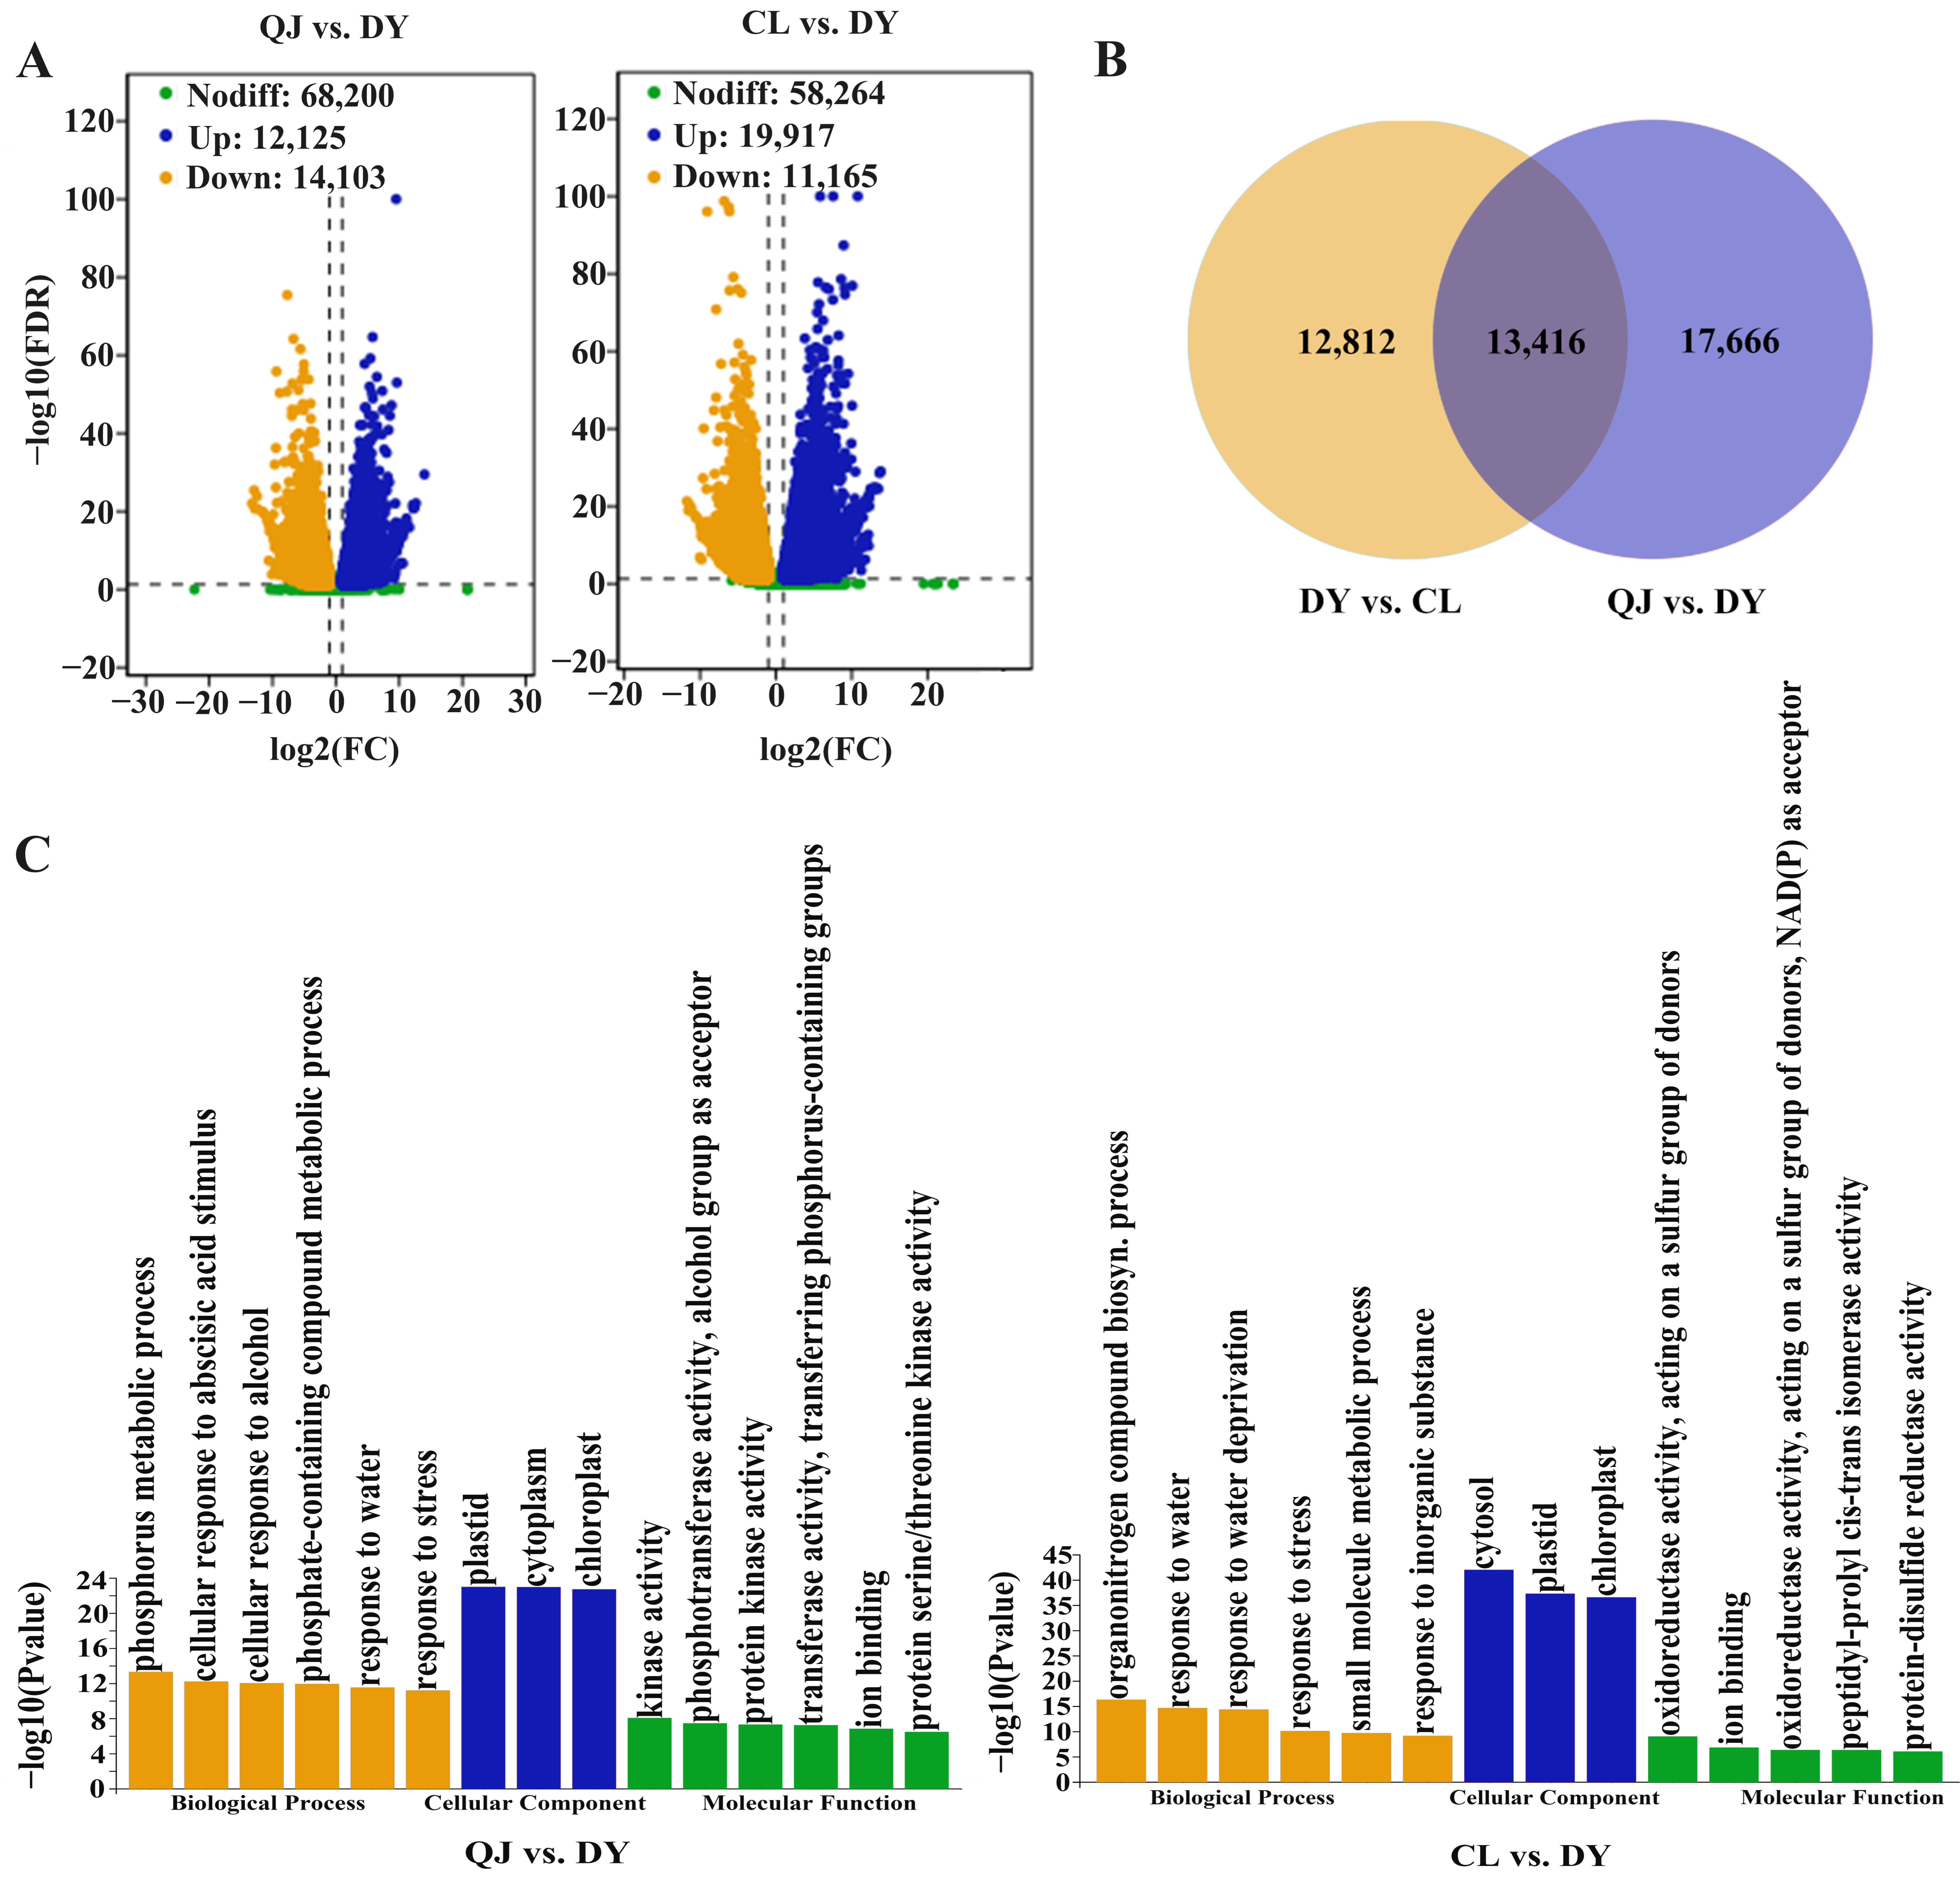
The DEGs were identified using a false discovery rate (FDR) threshold of <0.05 and an absolute fold change (|FC|) cutoff of ≥2. In the QJ vs. DY comparison, 12,125 genes were upregulated and 14,103 were downregulated; in the DY vs. CL comparison, 11,165 genes were upregulated and 19,917 were downregulated (Figure 5A). Furthermore, we identified 13,416 differentially expressed genes commonly in both the QJ versus DY and the DY versus CL comparisons (Figure 5B). GO enrichment analysis revealed that the DEGs between the two groups were significantly enriched in two major core ontological categories: Cellular Component (CC) and Biological Process (BP). DEGs between the two groups were predominantly enriched in the CC category. Specifically, in the QJ vs. DY comparison, significantly enriched terms primarily included plastids, cytoplasm, and chloroplasts; similarly, in the DY vs. CL comparison, the most prominently enriched terms were also plastids, cytoplasm, and chloroplasts (Figure 5C). This finding suggests that the chilling stress network in hybrid progeny is intimately linked to chloroplast structural integrity, plastid metabolic homeostasis, cytoplasmic antioxidant defense, and osmotic regulation.

3.7. KEGG Pathway Enrichment Analysis of DEGs in Hybrid Progeny

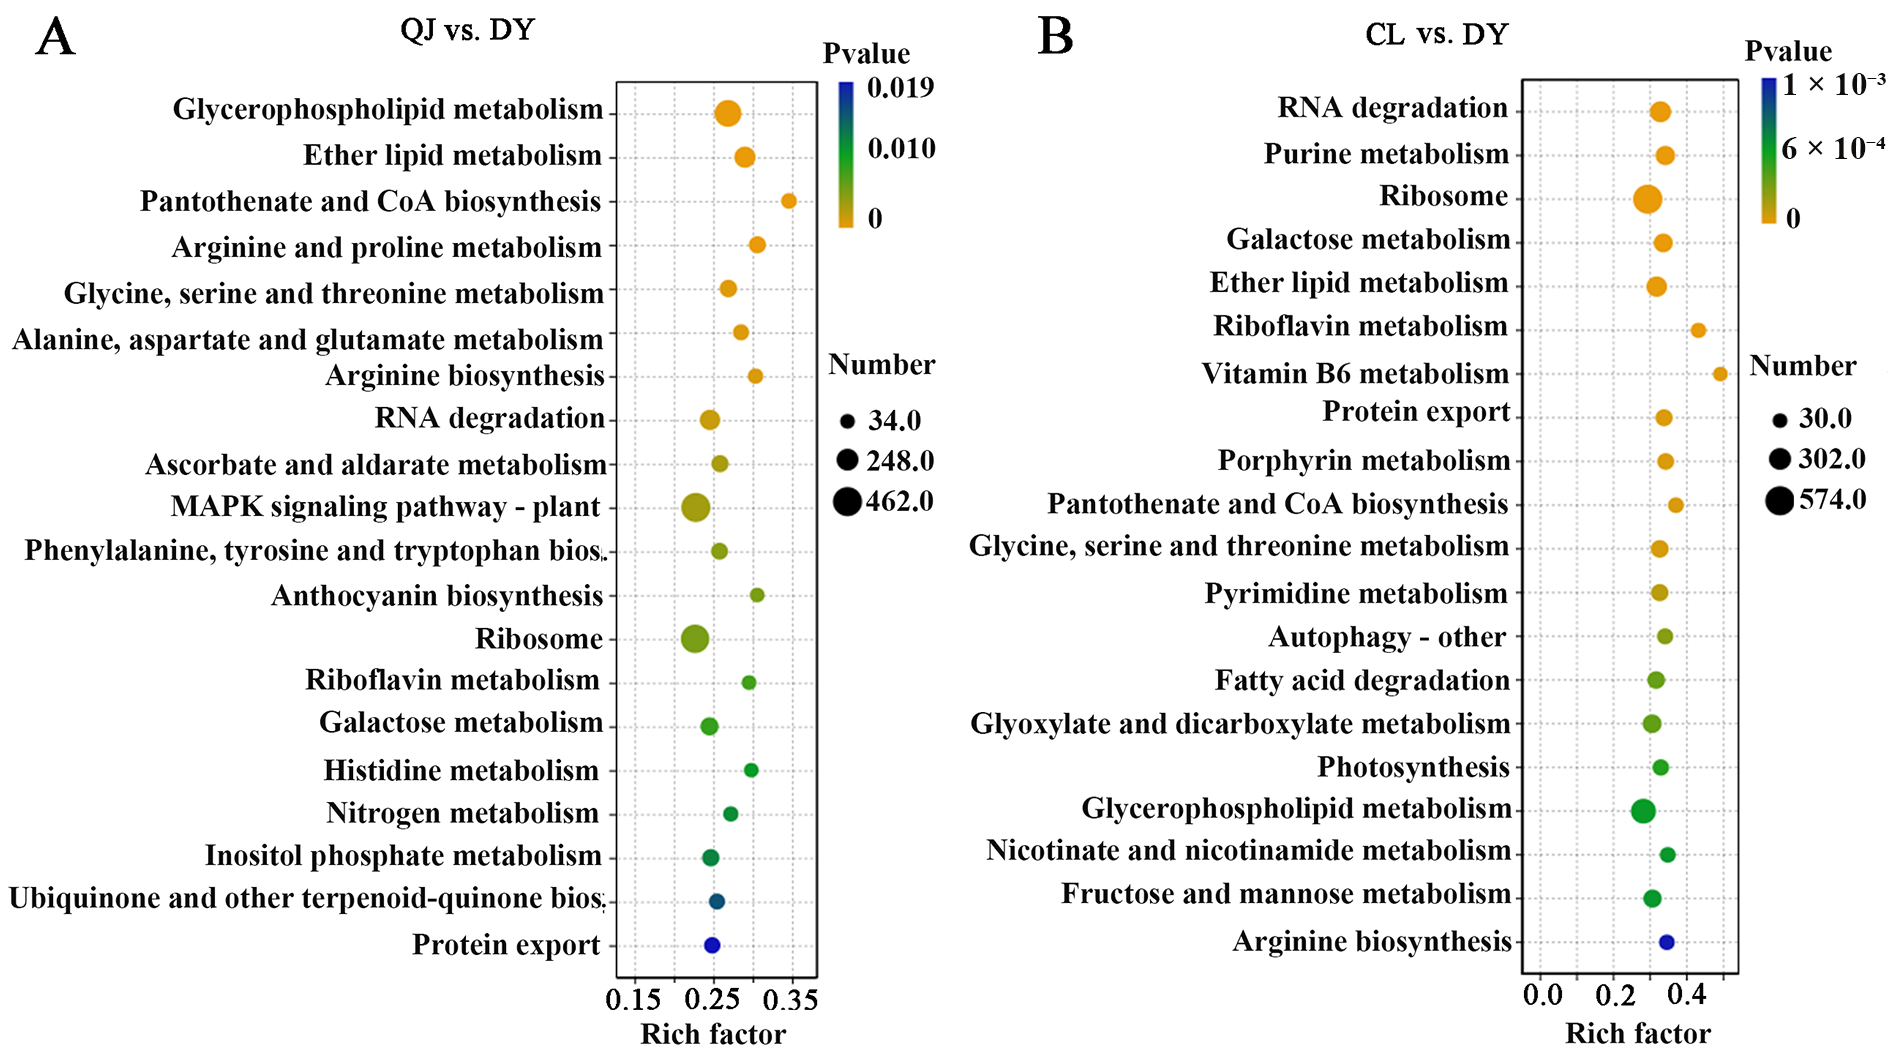
To further elucidate the regulatory network underlying cold-induced alterations in metabolic pathways in the hybrid progeny, KEGG pathway enrichment analysis was conducted on all DEGs. KEGG enrichment analysis revealed significant enrichment of DEGs in multiple metabolic pathways in the QJ vs. DY comparison, including the plant mitogen-activated protein kinase (MAPK) signaling pathway; phenylalanine, tyrosine, and tryptophan biosynthesis; anthocyanin biosynthesis; inositol phosphate metabolism; and histidine metabolism (Figure 6A). In the DY vs. CL comparison, DEGs were significantly enriched in several metabolic pathways, including fatty acid degradation; glycine, serine, and threonine metabolism; glycerophospholipid metabolism; fructose and mannose metabolism; and arginine biosynthesis (Figure 6B). This finding suggests that the aforementioned pathway may play a pivotal role in mediating the cold tolerance response in the hybrid progeny.

3.8. DEMs Analysis and Metabolic Pathway Enrichment

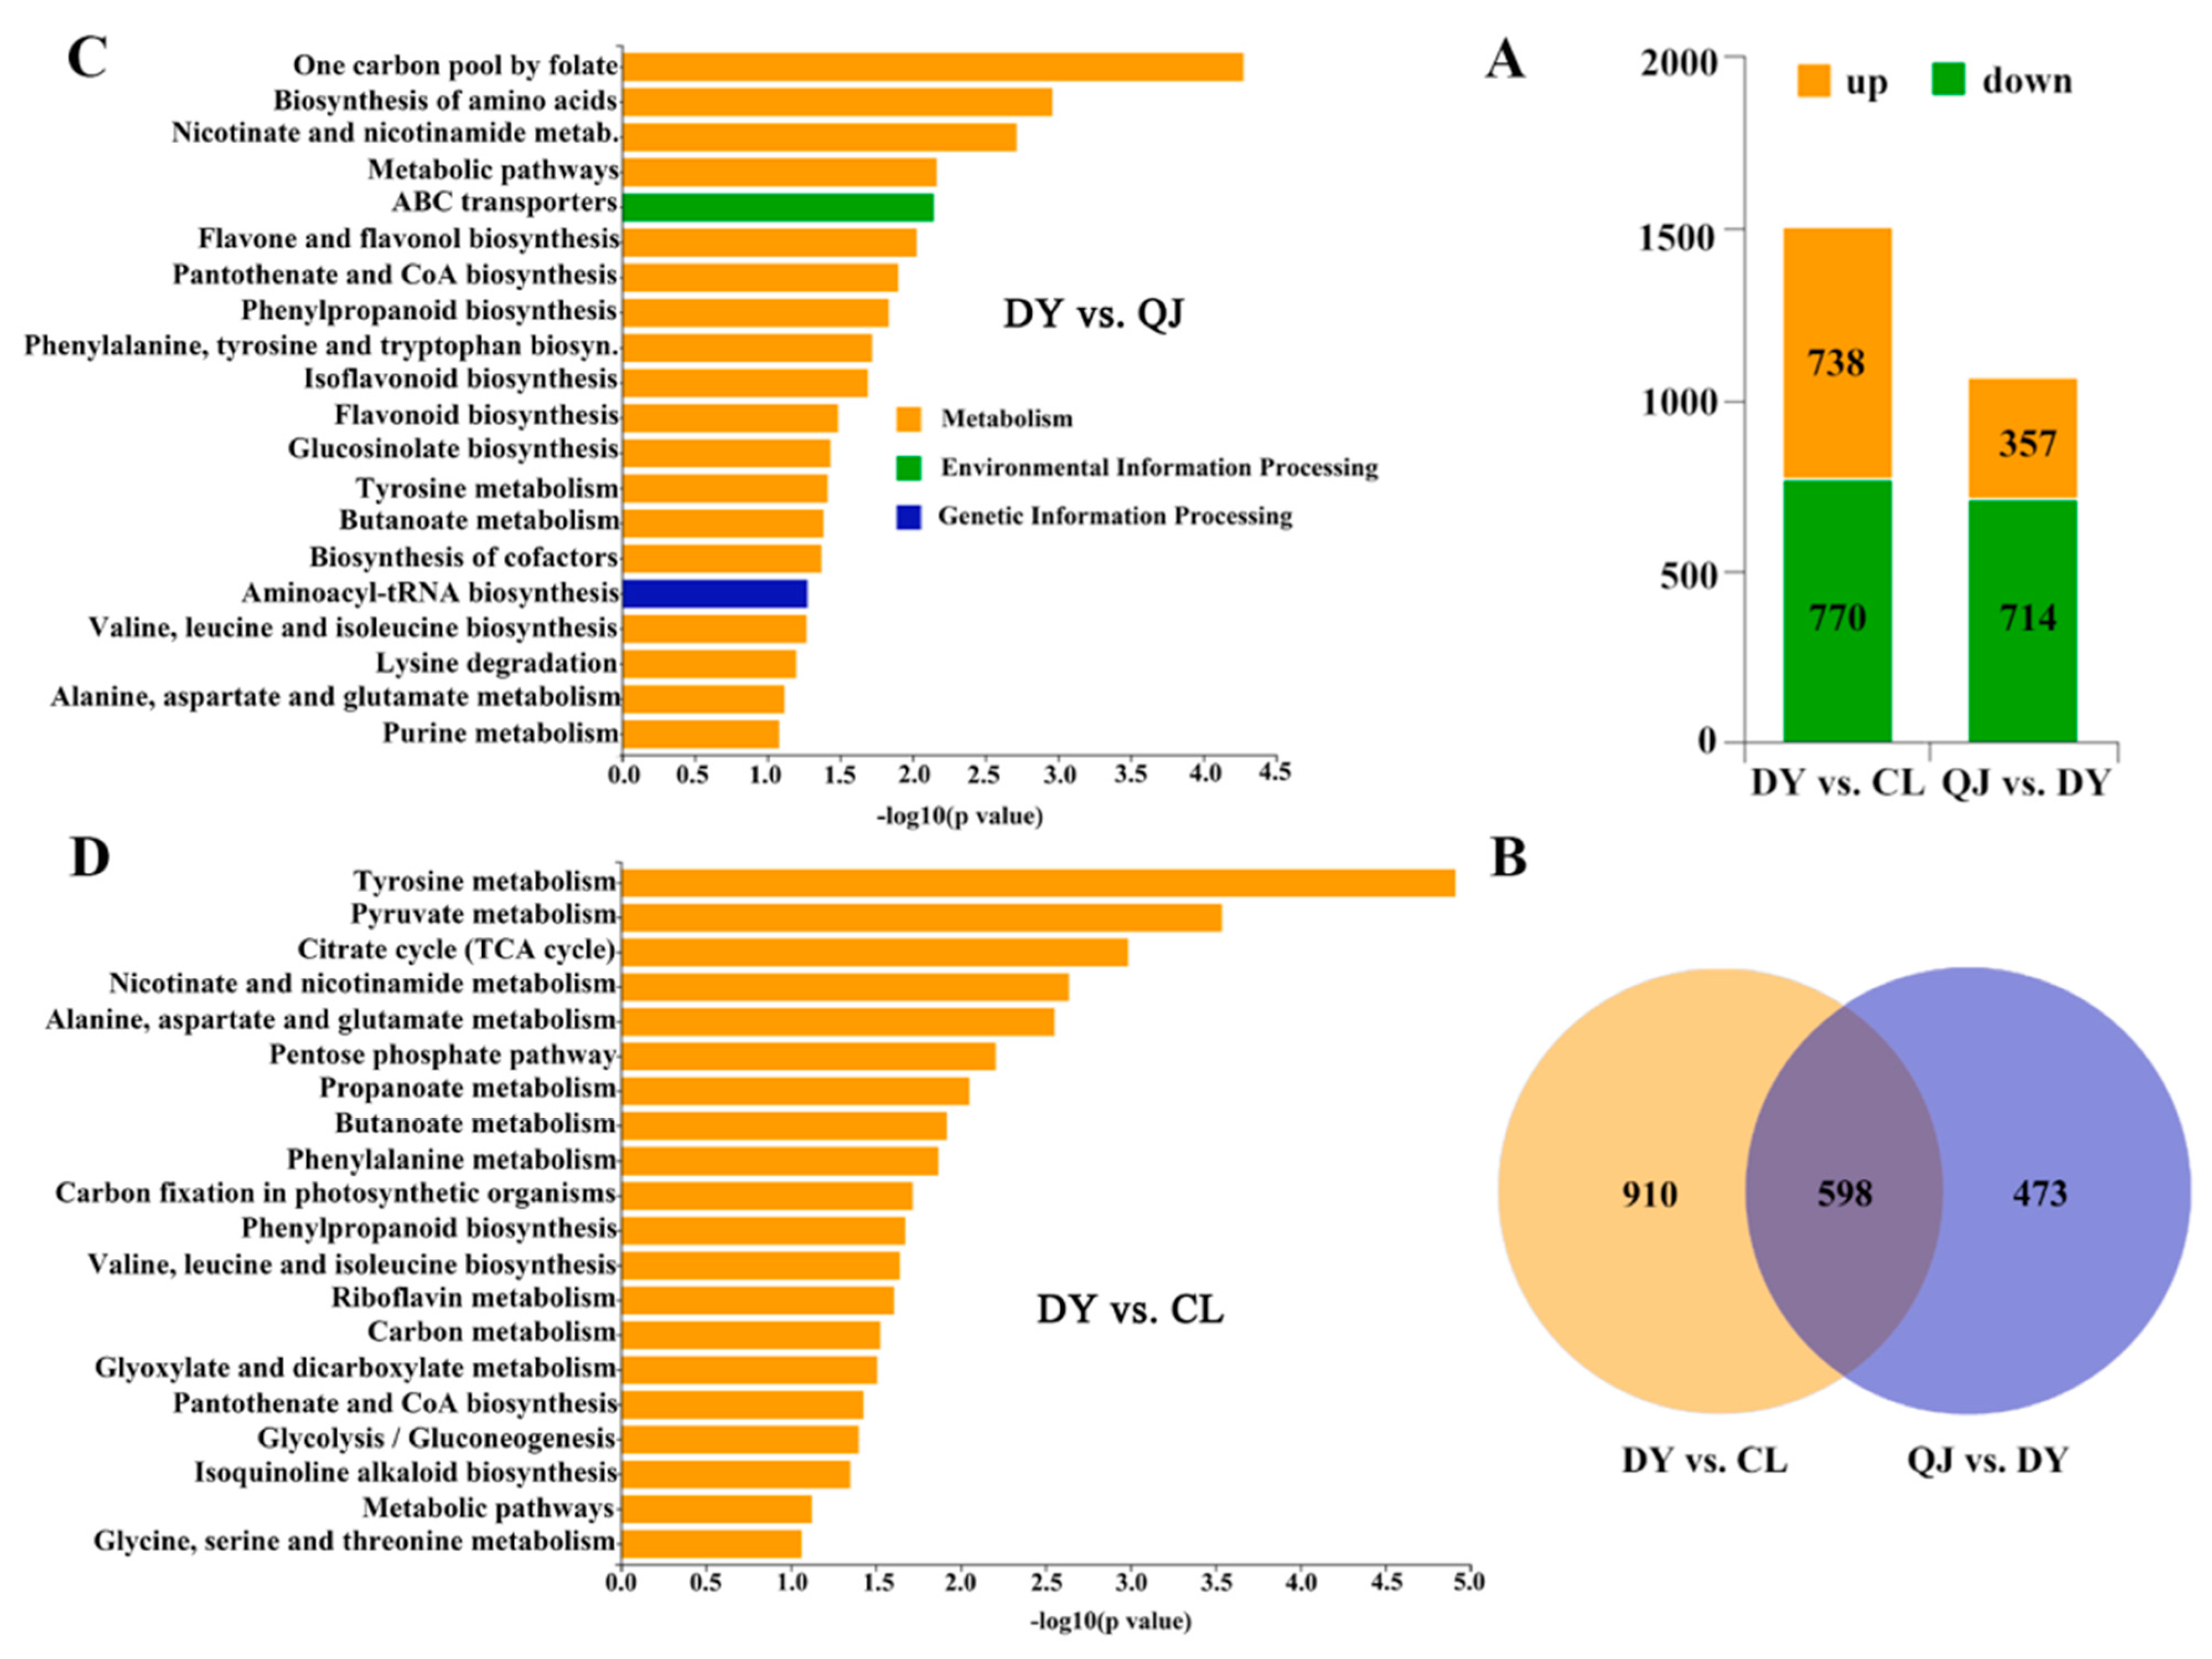
The PLS-DA model was validated using permutation testing and demonstrated excellent explanatory power, with R2 values exceeding 0.9 for both pairwise comparisons (Figure S3). Following low-temperature treatment, a total of 1508 differentially accumulated metabolites (DAMs) were identified in both the DY vs. CL groups, comprising 738 upregulated and 770 downregulated metabolites. In contrast, only 1071 DAMs were detected between the QJ vs. DY groups, of which 357 were upregulated and 714 were downregulated (Figure 7A). Furthermore, Venn diagram analysis revealed a total of 442 DAMs commonly identified across the paired comparisons of DY vs. CL and QJ vs. DY (Figure 7B). KEGG enrichment analysis of the QJ vs. DY comparison revealed significant enrichment of DAMs in multiple pathways, including phenylpropanoid biosynthesis; alanine, aspartate, and glutamate metabolism; valine, leucine, and isoleucine biosynthesis; isoquinoline alkaloid biosynthesis; riboflavin metabolism; and pantothenate and coenzyme A biosynthesis (Figure 7C). In the DY vs. CL comparison, DAMs were significantly enriched in multiple metabolic and transport pathways, including phenylpropanoid biosynthesis; flavone and flavonol biosynthesis; glucosinolate biosynthesis; valine, leucine, and isoleucine biosynthesis; tyrosine metabolism; and ABC transporter-mediated pathways (Figure 7D).

3.9. Integrated Analysis of Transcriptome and Metabolome

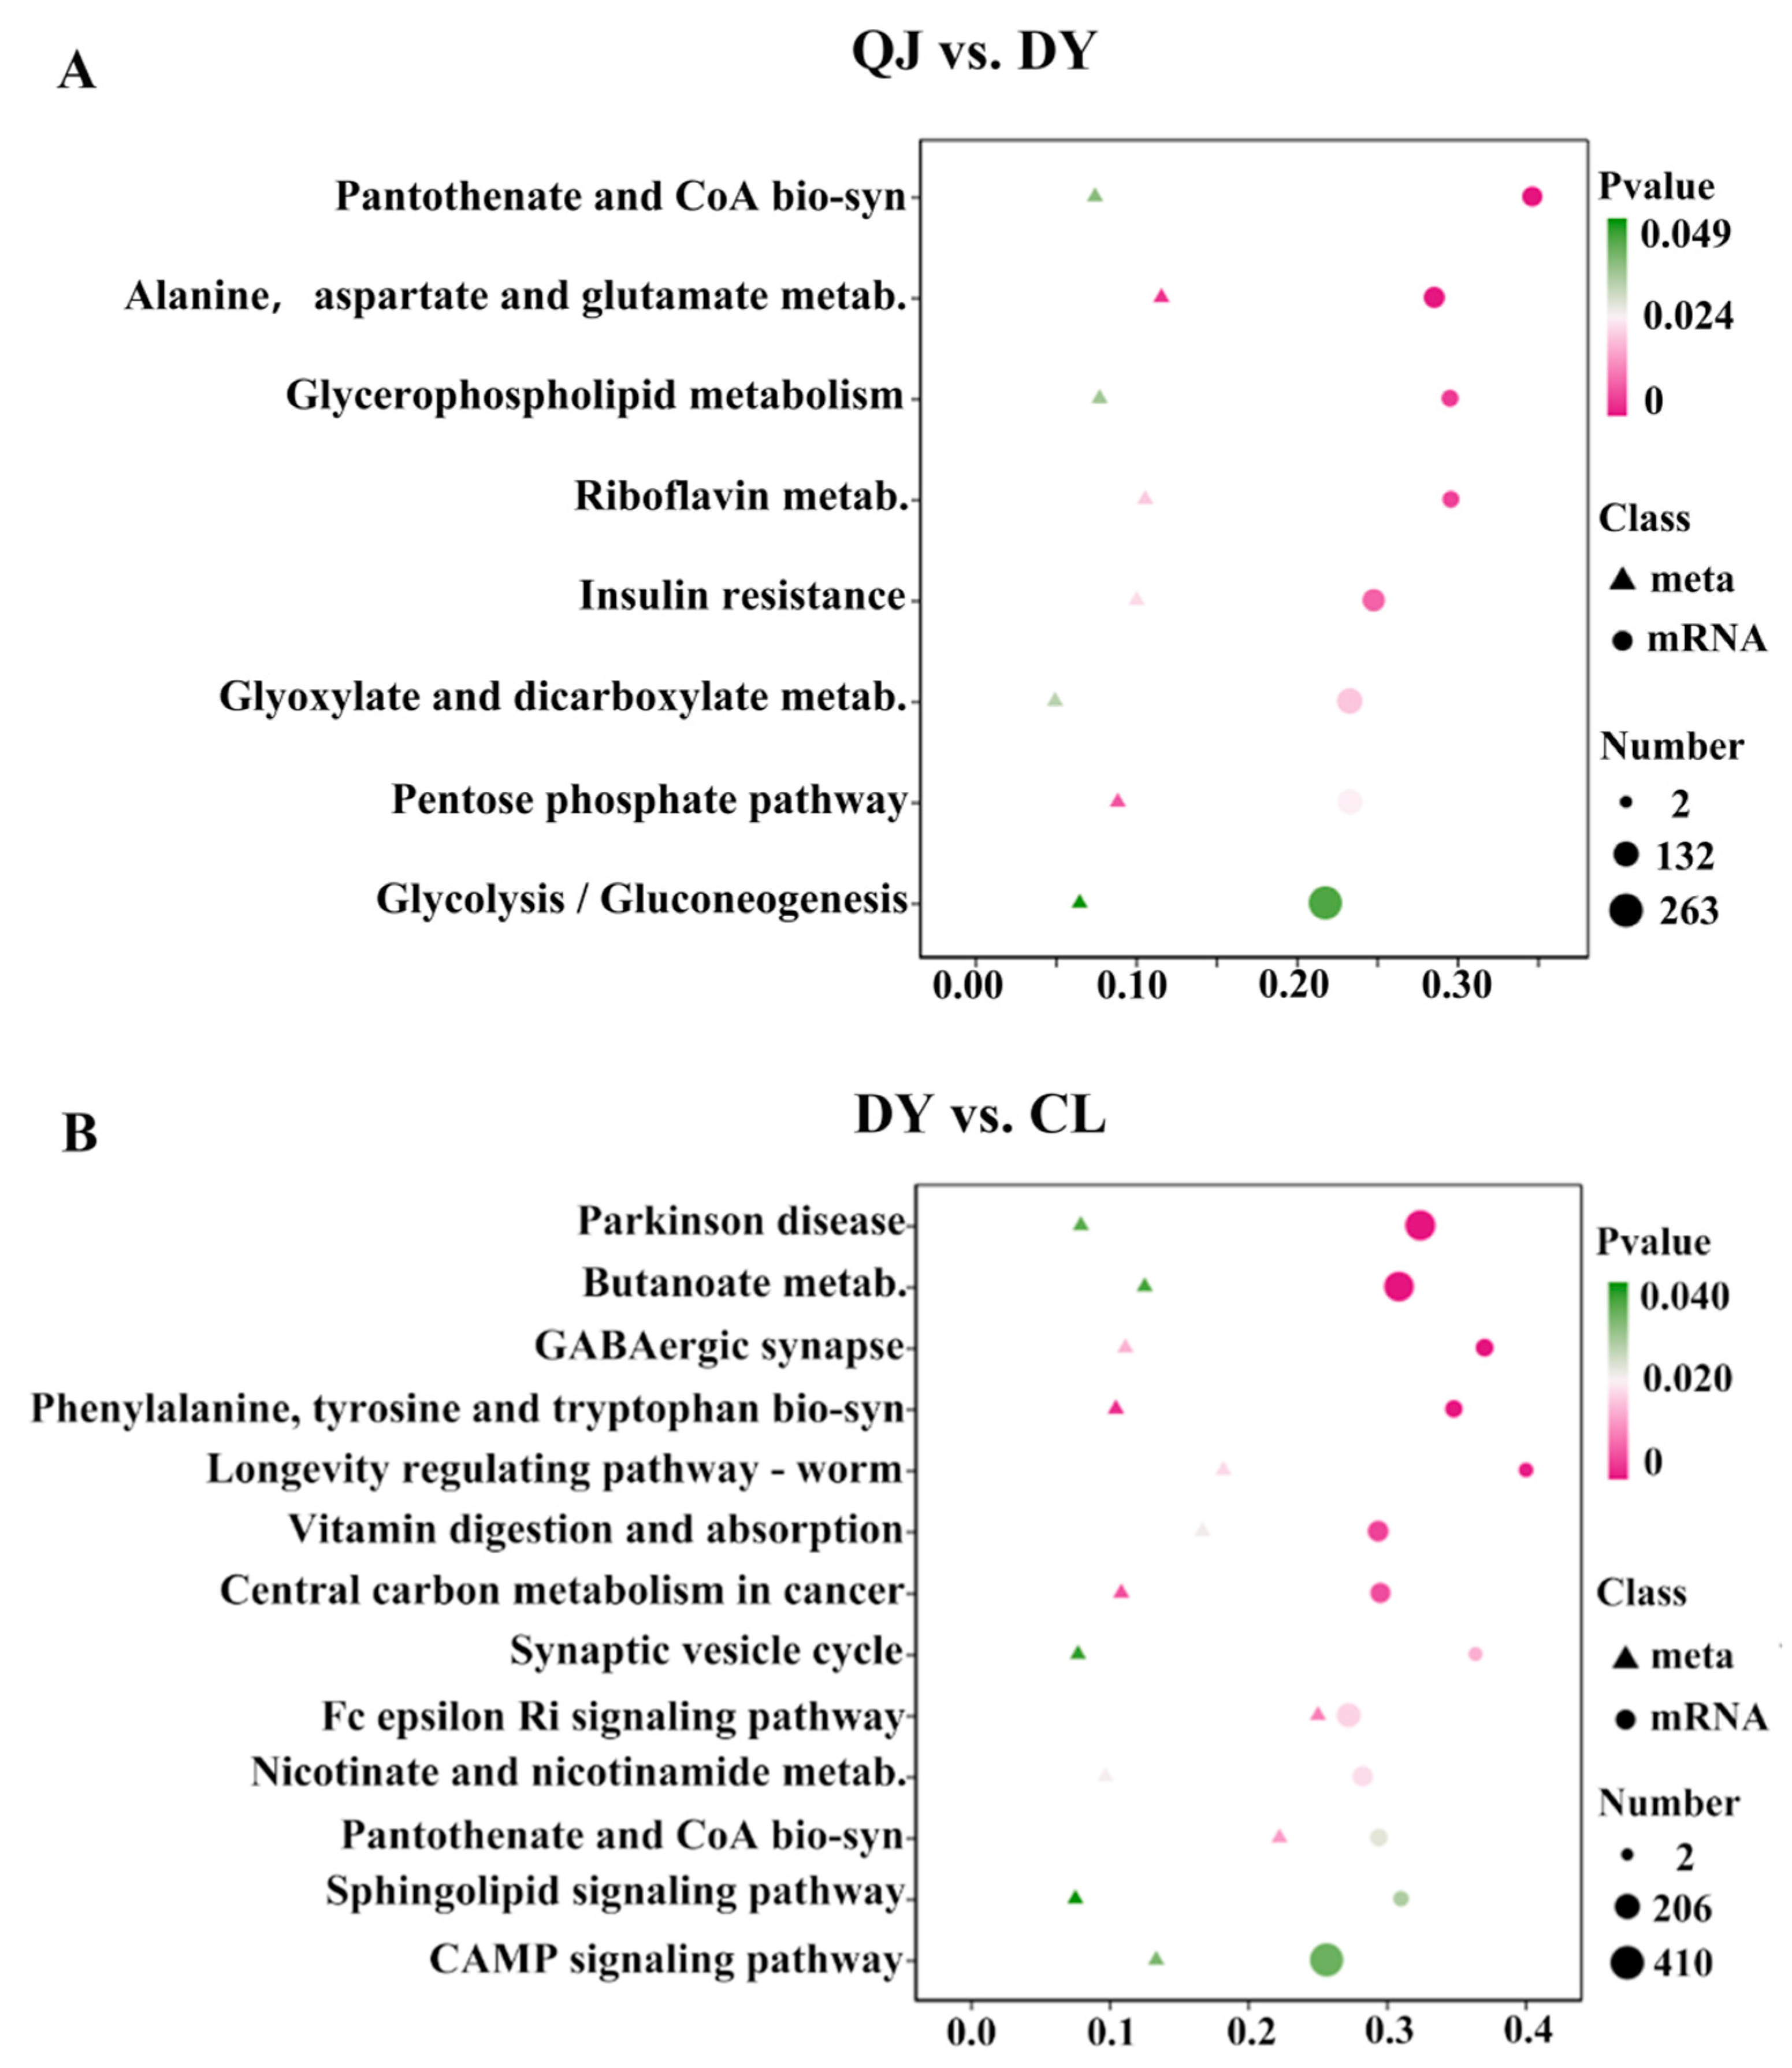
Gene–metabolite pairs were distributed across all nine quadrants and exhibited pronounced aggregation along the diagonal (quadrants I and IX) and anti-diagonal (quadrants III and VII) axes (Figure S3), suggesting coordinated transcriptional–metabolic regulation as well as compensatory shifts between these molecular layers. Gene–metabolite scatter plots spanned all nine quadrants, indicating the dataset’s suitability for downstream integrative analysis. KEGG enrichment analysis revealed that metabolic pathways associated with plant chilling stress differed between the QJ vs. DY and DY vs. CL comparisons: “Glycerophospholipid metabolism”, “Pentose phosphate pathway” and “Alanine, aspartate and glutamate metabolism” were enriched in the QJ vs. DY comparison, whereas “Sphingolipid signaling pathway” and the “Phenylalanine, tyrosine and tryptophan biosynthesis” were enriched in the DY vs. CL comparison (Figure 8A,B).

4. Discussion

Several methods are available for authenticating interspecific hybrids in chrysanthemum, including chromosome counting, molecular marker analysis, flow cytometry, and genome size estimation. Given that C. lavandulifolium is diploid (2n = 2x = 18), whereas the cultivated chrysanthemum (‘Yannong Danyun’) is hexaploid (2n = 6x = 54), chromosome counting is often impractical due to the high chromosome number and the associated risk of counting errors. Consequently, we employed SRAP molecular markers to confirm hybridity. The presence of bands shared between the hybrid progeny and the female parent (n = 30) as well as with the male parent (n = 8) provided preliminary evidence of successful interspecific hybridization. Notably, molecular marker analysis is a widely accepted, reliable, and routinely applied approach for hybrid authentication, demonstrated extensively in model plant species such as Streptocarpus [20] and Paeonia [21].
Low temperature is a major abiotic stress that constrains plant growth and development. In chrysanthemum, cold stress induces leaf dehydration, wilting, and marginal necrosis, with the young leaves and root system exhibiting the highest sensitivity to low-temperature exposure. During overwintering in northern China, extreme subfreezing temperatures frequently cause whole-plant mortality, representing a major environmental constraint that limits open-field cultivation and large-scale deployment of groundcover chrysanthemum in this region. The hybrid progeny exhibited a significantly lower semi-lethal temperature than the male parent but a higher one than the female parent (Table 3). At 5 °C, line DY exhibited significantly lower MDA content but higher SOD and CAT activities, as well as elevated Pro and soluble protein concentrations, relative to the female parent; however, all these physiological parameters were lower than those of the male parent (Figure 3D–H). These findings demonstrate that the hybrid progeny exhibits significantly enhanced cold tolerance compared with the female parent. MDA is the primary end product of membrane lipid peroxidation. Elevated MDA levels indicate intensified peroxidative damage to cellular membranes and increased membrane permeability, thereby exacerbating cold-induced injury in plants. In contrast, reduced MDA accumulation contributes to the maintenance of membrane integrity and improved cold tolerance. Enhanced activities of antioxidant enzymes promote more efficient ROS scavenging, thereby mitigating cold-induced cellular damage. In the hybrid progeny, Pro and soluble protein concentrations were significantly higher than those in the female parent. As key osmoprotectants, Pro and soluble proteins contribute to protein conformational stability and alleviate low-temperature-induced osmotic stress. Fu et al. [22] found that OsPIN5b overexpression induced massive accumulation of MDA and H2O2 and suppressed antioxidant enzyme activities under low-temperature stress, thereby compromising rice cold tolerance. Zhang et al. [23] found that DgNAC3 overexpression drastically lowered the accumulation of MDA, H2O2 and O2 while markedly elevating CAT, SOD and POD activities under low-temperature stress, reinforcing ROS scavenging ability and conferring stronger cold tolerance to transgenic chrysanthemums.
A notable observation in this study is the substantial number of DEGs identified between the hybrid (DY) and its parents, with 12,812 and 17,666 DEGs detected in the DY vs. CL and QJ vs. DY comparisons, respectively. This extensive transcriptional divergence likely reflects inherent genotypic variations between CL and the cultivar ‘QJ’, as well as the absence of a non-stressed control in our experimental design. To mitigate this limitation and ensure the reliability of candidate cold-tolerance genes, we performed qPCR validation on selected key regulators. The expression patterns of inducer of CBF expression (ICE), COR, and dehydration-responsive element-binding (DREB) were consistent with the RNA-seq data (Figure S1).
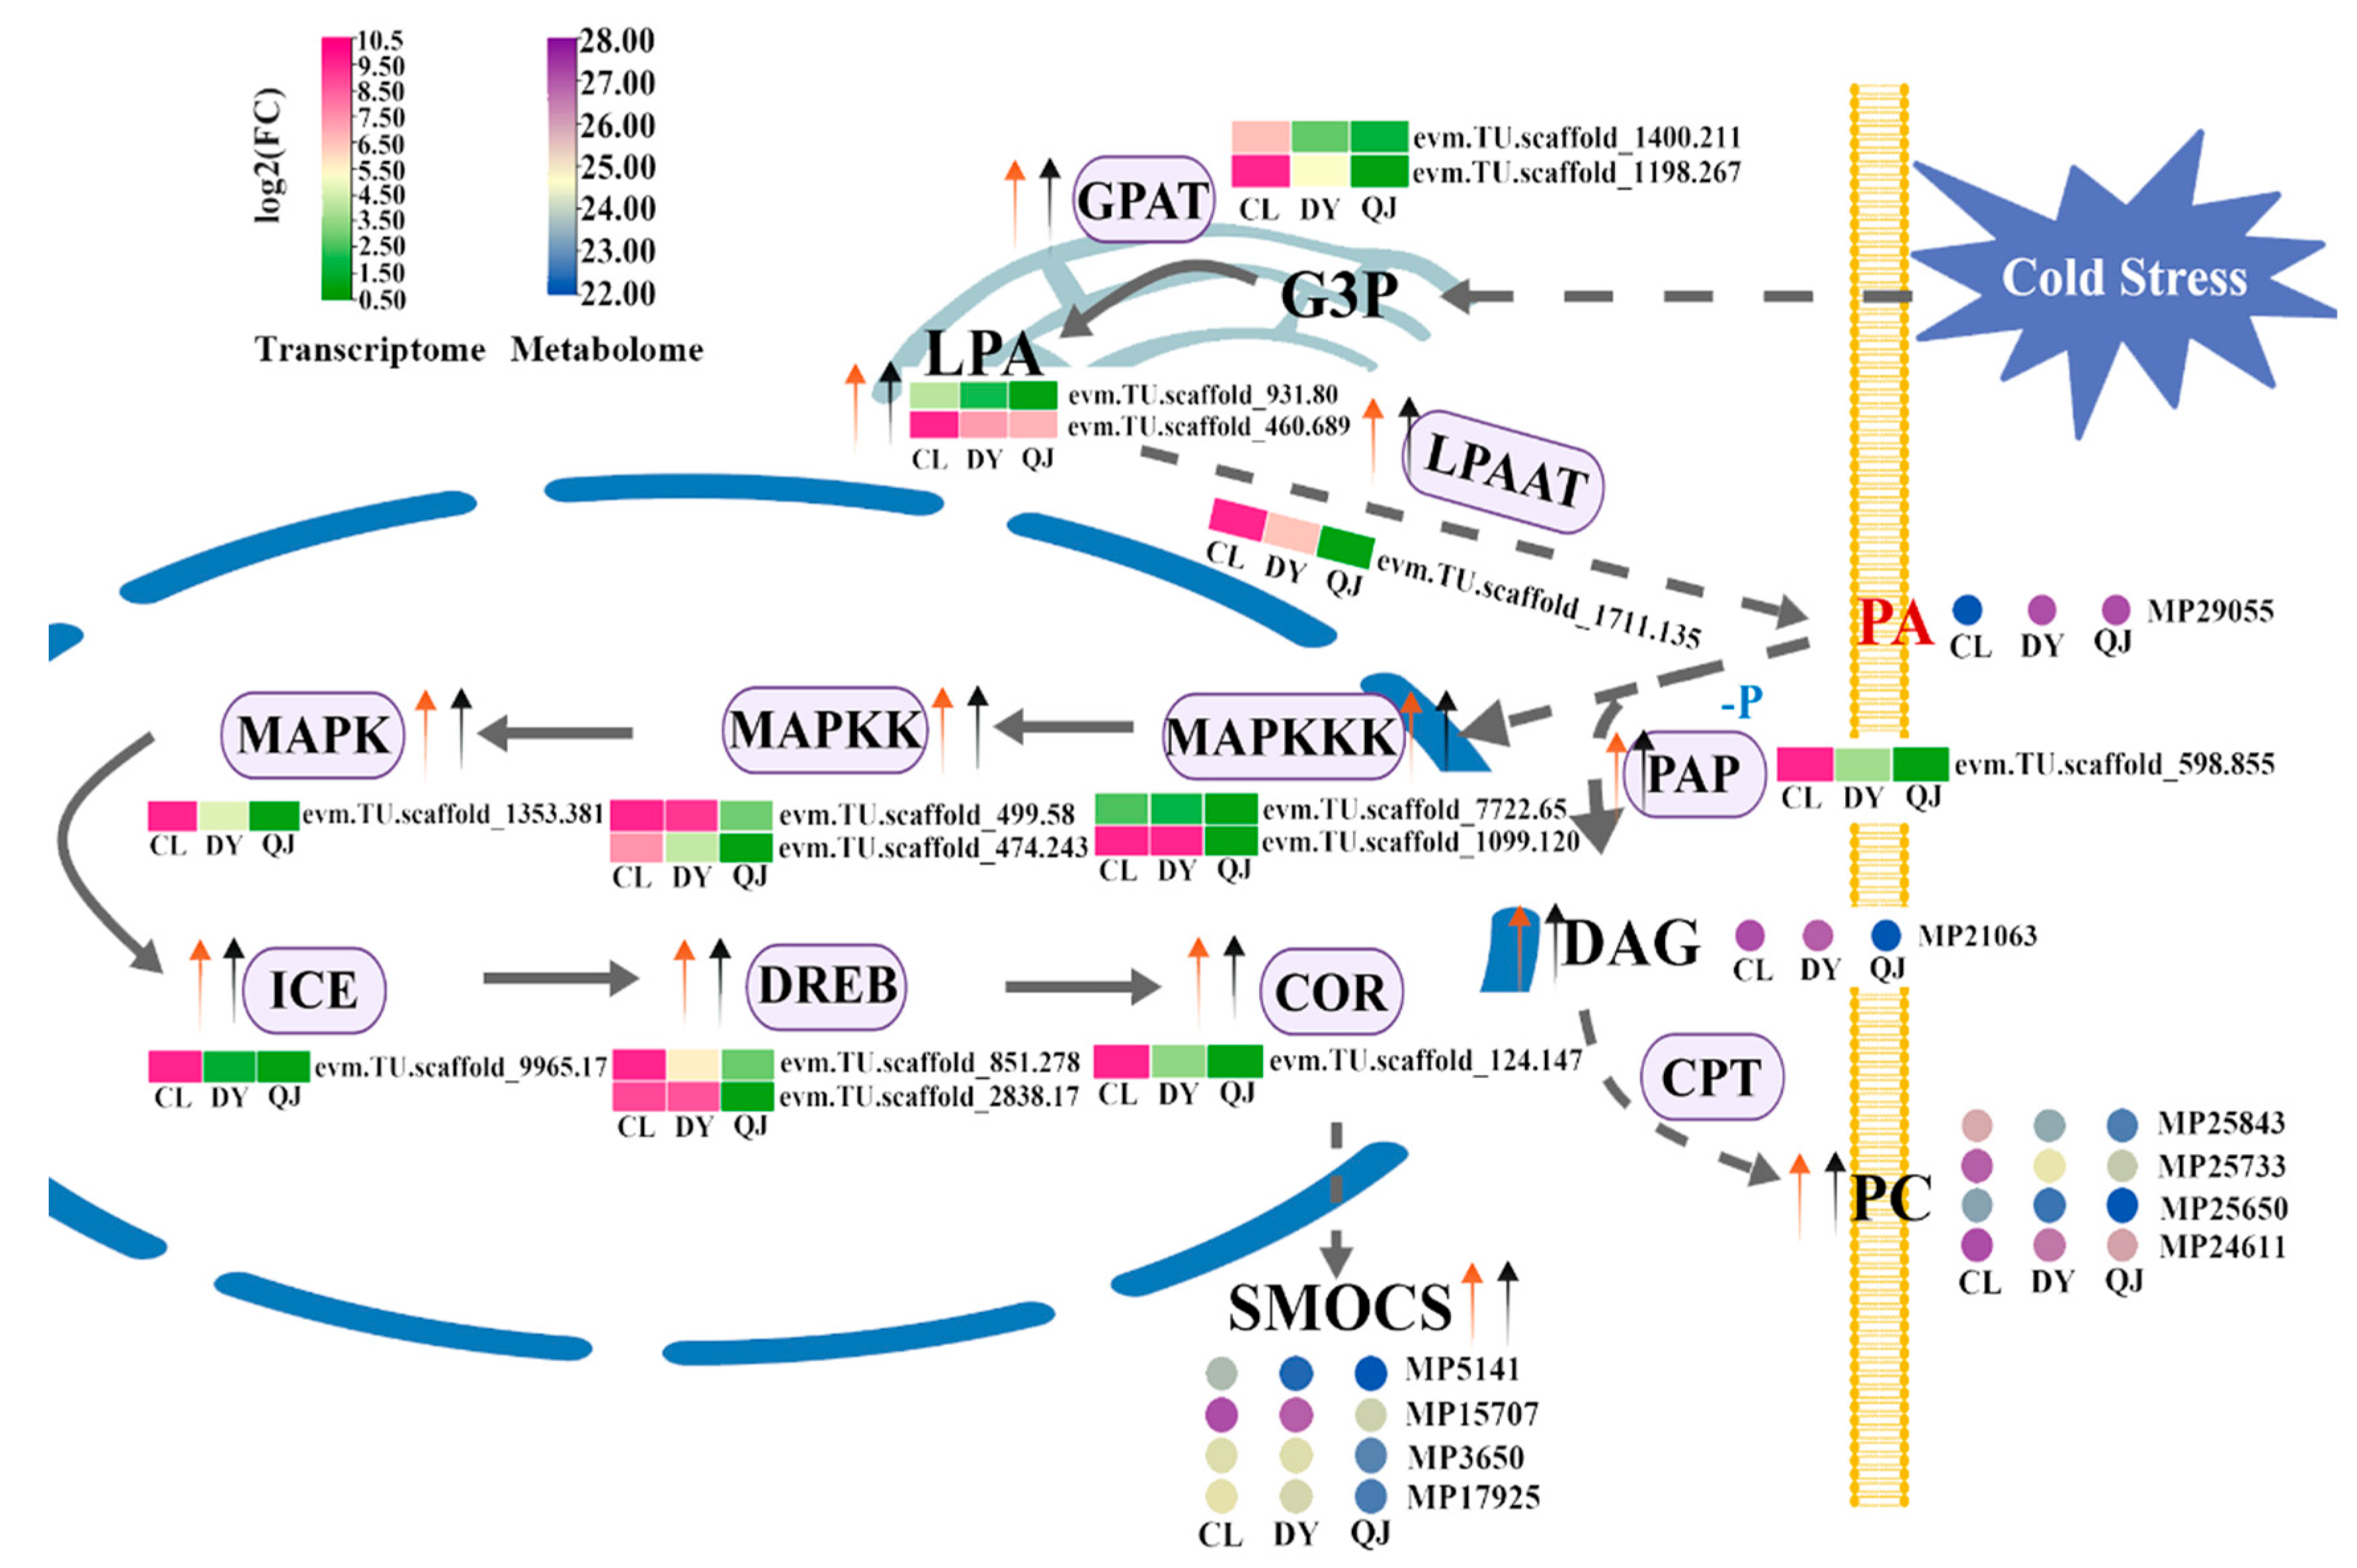
To elucidate the molecular regulatory pathways underlying enhanced cold tolerance in the hybrid progeny, integrated transcriptomic and metabolomic profiling was conducted on the hybrid line and its parental plants. KEGG pathway enrichment analysis revealed significant enrichment of both DEGs and DAMs in the glycerophospholipid metabolism pathway. Shomo et al. [24] proposed that plants enhance cold tolerance by remodeling membrane lipid composition and adjusting the relative abundance of specific lipid classes to maintain optimal plasma membrane fluidity under low-temperature stress. Following cold treatment of maize, integrated transcriptomic–metabolomic profiling identified glycerophospholipid metabolism as one of the most significantly enriched pathways [25]. Under chilling stress., glycerol-3-phosphate (G3P) localized to the endoplasmic reticulum is acylated by glycerol-3-phosphate acyltransferase (GPAT) to form lysophosphatidic acid (LPA). LPA is then further acylated by lysophosphatidic acid acyltransferase (LPAAT) to generate phosphatidic acid (PA). PA functions as a lipid second messenger that activates the MAPK cascade [26,27], leading to upregulation of cold-responsive transcription factors such as ICE, thereby enhancing cold tolerance in plants. On the one hand, PA is dephosphorylated by phosphatidic acid phosphatase (PAP) to yield diacylglycerol (DAG). DAG subsequently reacts with CDP-choline, catalyzed by DAG choline phosphotransferase (CPT), to form phosphatidylcholine (PC). This newly synthesized PC replenishes membrane phospholipids damaged by low-temperature stress (such as those undergoing lipid peroxidation), thereby restoring membrane integrity and barrier function, and ultimately enhancing plant cold tolerance (Figure 9). This study revealed that the contents of PC (MP25733), DAG (MP21063), and PA (MP29055) were significantly higher in both the paternal line and the hybrid progeny than in the maternal parent. The expression levels of mitogen-activated protein kinase kinase kinase (MAPKKK), mitogen-activated protein kinase kinase (MAPKK), MAPK, ICE, DREB and COR genes were elevated in progenies relative to maternal parents. Consistently, COR-mediated small-molecule organic compatible solutes (SMOCs) such as sucrose (MP17925), D-(+)-sorbose (MP3650), lactulose (MP15707) and L-(–)-methionine (MP5141) accumulated to significantly higher levels in progenies (Figure 9). Margutti et al. [28] showed that PA is dephosphorylated by PAP2 to generate DAG, a process that enhances cold tolerance in barley. Gao et al. [29] reported a marked accumulation of DAG in maize under low-temperature stress; among the 210 lipid species dynamically regulated in this response, and DAG functioned as substrates for subsequent PC and TAG production. Peach fruits accumulate DAG, TAG and diverse PC components to resist cold stress during late 4 °C storage, and the dynamic remodeling of the DAG/PC/TAG metabolic network serves as a key determinant of cold tolerance [30]. These findings indicate that elevated DAG levels contribute to enhanced cold tolerance in plants. In this study, metabolomic data revealed that the hybrid progeny had higher DAG levels than the maternal parent but lower levels than the paternal parent, suggesting that the hybrid progeny exhibit greater cold tolerance than the maternal parent. Under the catalysis of CPT, DAG is converted to PC via the Kennedy pathway. PC serves not only as the predominant structural phospholipid of cellular membranes but also as a critical mediator of membrane integrity maintenance and repair following cold-induced damage [31]. Metabolomic data suggest higher PC levels in hybrid progeny relative to the female parent, which may contribute to enhanced cold tolerance in the hybrid progeny. The MAPK cascade is a highly conserved signal transduction pathway present across eukaryotes, including plants and mammals. It consists of a three-tiered cascade (MAPKKK, MAPKK, and MAPK) that transmits and amplifies signals step by step through phosphorylation. As the terminal component of the cascade, MAPK integrates upstream signals and orchestrates downstream transcriptional and post-translational responses essential for plant adaptation to abiotic stress. The MAPK directly binds to the promoter region of the ICE1 gene, thereby activating the downstream CBFCOR transcriptional cascade and enhancing cold tolerance in banana [32]. This study demonstrates that MAPK gene expression is significantly upregulated in both the paternal line and the hybrid progeny, leading to transcriptional activation of downstream components in the ICE-CBF-COR signaling cascade. Concurrently, osmotic solute accumulation such as sucrose (MP17925) was significantly elevated in the hybrid progeny relative to the maternal parent (Figure 9). Collectively, these findings demonstrate that enhanced cold tolerance in the hybrid progeny is conferred, at least in part, through MAPK-dependent activation of the ICE-CBF-COR pathway.
Under cold stress, endoplasmic reticulum-localized G3P is acylated by GPAT to LPA, followed by LPAAT-catalyzed acylation to PA. PA functions as a lipid second messenger to activate the MAPK cascade and ICE, contributing to cold tolerance. Meanwhile, PA is dephosphorylated by PAP to DAG, which is then converted to PC via the Kennedy pathway (CPT-catalyzed reaction with CDP-choline). The newly synthesized PC replenishes cold-damaged membrane phospholipids, restoring membrane integrity and enhancing cold tolerance. Squares represent transcriptomic data (genes/enzymes), and circles represent metabolomic data (metabolites).

5. Conclusions

This study demonstrates that MAPK gene expression is significantly upregulated in both the paternal line and the hybrid progeny, leading to transcriptional activation of downstream components in the ICE-CBF-COR signaling cascade. Concurrently, osmotic solute accumulation such as sucrose (MP17925), was significantly elevated in the hybrid progeny relative to the maternal parent (Figure 9). Collectively, these findings demonstrate that enhanced cold tolerance in the hybrid progeny is conferred, at least in part, through MAPK-dependent activation of the ICE-CBF-COR pathway.

Supplementary Materials

The following supporting information can be downloaded at: https://www.mdpi.com/article/10.3390/agriculture16171923/s1. Figure S1: Electrophoresis for identification of hybrid progeny by SRAP‑PCR; Figure S2: Partial least squares discriminant analysis (PLS‑DA) score plots of metabolite profiles; Figure S3: Nine‑quadrant distribution diagrams from integrative transcriptome‑metabolite analysis; Figure S4: Relative expression levels of GPAT, LPAAT, MAPKKK, MAPK, ICE, DREB, COR, PAP and FAD2 genes determined by RT‑qPCR; Table S1: SRAP primer sequences; Table S2: Genetic diversity parameters estimated from SRAP markers across three germplasms (QJ, DY, and CL); Table S3: Sequencing data of nine samples.

Author Contributions

Z.L.: Writing—review and editing, writing—original draft, validation, investigation, conceptualization. C.D.: Writing—review and editing, writing—original draft, validation, resources. H.L.: Writing—original draft, methodology, investigation. X.L.: Writing—original draft, software, investigation. B.Z.: Writing—original draft, software, investigation. J.Q.: Writing—original draft, software, investigation. X.M.: Writing—original draft, software, investigation. L.Z.: Writing—review and editing, software, methodology, investigation. R.G.: Writing—review and editing, writing—original draft, resources, investigation, funding acquisition, conceptualization. All authors have read and agreed to the published version of the manuscript.

Funding

This research was funded by the Jilin Province Science and Technology Department (JJKH20220541KJ, 20260601065RC, YDZJ202501ZYTS556).

Data Availability Statement

The original contributions presented in this study are included in the article and Supplementary Materials. Further inquiries can be directed to the corresponding authors.

Acknowledgments

We thank the Science and Technology Project of the Education Department of Jilin Province (JJKH20220541KJ), Jilin Provincial Science and Technology Development Plan Project (20260601065RC), and the project funded by the Science and Technology Department of Jilin Province (YDZJ202501ZYTS556) for their support.

Conflicts of Interest

The authors declare no conflicts of interest.

Abbreviations

Abbreviation Full name
CATCatalase
CORCold-regulated
DAGDiacylglycerol
DREBDehydration-responsive element-binding
G3PGlycerol-3-phosphate
GPATGlycerol-3-phosphate acyltransferase
ICEInducer of CBF expression
LPALysophosphatidic acid
LPAATLysophosphatidic acid acyltransferase
MAPKMitogen-activated protein kinase
MAPKKMitogen-activated protein kinase kinase
MAPKKKMitogen-activated protein kinase kinase kinase
MDAMalondialdehyde
PAPhosphatidic acid
PAPPhosphatidate phosphatase
PCPhosphatidylcholine
PROProline
CPTCholinephosphotransferase
SMOCSSmall-molecule organic compatible solutes
SODSuperoxide dismutase
SPSoluble protein

References

  1. Fu, X.; Li, F.; Li, Y.; Li, X.; Zhang, X.; Ahmed, Z.F.R. New insights into controlling horticultural crop quality deterioration caused by cold stress: Epigenetic modification. Hortic. Res. 2026, 13, uhaf326. [Google Scholar] [CrossRef] [Scilit]
  2. Wang, Y.; Wang, J.; Sarwar, R.; Zhang, W.; Geng, R.; Zhu, K.M.; Tan, X.L. Research progress on the physiological response and molecular mechanism of cold response in plants. Front. Plant Sci. 2024, 15, 1334913. [Google Scholar] [CrossRef] [Scilit]
  3. Liu, J.; Liu, J.; He, M.; Zhang, C.; Liu, Y.; Li, X.; Wang, Z.; Jin, X.; Sui, J.; Zhou, W.; et al. OsMAPK6 positively regulates rice cold tolerance at seedling stage via phosphorylating and stabilizing OsICE1 and OsIPA1. Theor. Appl. Genet. 2023, 137, 10. [Google Scholar] [CrossRef] [Scilit]
  4. Park, S.U.; Jung, Y.J.; Kwon, H.J.; Lee, J.Y.; An, J.; Lee, H.U.; Jeong, J.C.; Bian, X.; Yu, T.; Kwak, S.S.; et al. IbMPK3/IbMPK6-Mediated IbSPF1 phosphorylation promotes cold stress tolerance in sweet potato. Biochem. Biophys. Res. Commun. 2025, 769, 151893. [Google Scholar] [CrossRef] [Scilit]
  5. Wang, R.; Yu, M.; Zhao, X.; Xia, J.; Cang, J.; Zhang, D. Overexpression of TaMPK3 enhances freezing tolerance by increasing the expression of ICE-CBF-COR related genes in the Arabidopsis thaliana. Funct. Plant Biol. 2024, 51, FP23144. [Google Scholar] [CrossRef] [Scilit]
  6. Huang, L.Q.; Yang, C.; Iqbal, A.; Liu, J.T.; Li, Y.K.; Bao, H.N.; Liu, H.J.; Chen, Y.L.; Li, J.; Zhang, K.; et al. Jasmonate pathway regulates sphingolipid desaturation during cold stress. New Phytol. 2025, 247, 191–208. [Google Scholar] [CrossRef] [Scilit]
  7. Liu, S.; Lin, J.; Jiang, J.; Di, Y.; Liu, X.; Li, Z. Lipid remodeling and membrane stability contribute to differential chilling olerance in two dichondra (Dichondra repens) Genotypes. Int. J. Mol. Sci. 2026, 27, 1009. [Google Scholar] [CrossRef] [Scilit]
  8. Kamiński, P.; Konopacka, M. Interspecific and intergeneric crosses for clubroot resistance in Brassica Crops. Agronomy 2025, 15, 2827. [Google Scholar] [CrossRef] [Scilit]
  9. Pei, Y.; Zhao, X.; Du, W.; Diao, W.; Zhang, W.; Xiong, B.; Ramstein, G.P.; Ottosen, C.O.; Cheng, C.; Zhao, Q.; et al. Synthetic allopolyploidy unveils hybridization-driven transcriptional reprogramming underlying thermal adaptation in Cucumis. Plant J. Cell Mol. Biol. 2025, 124, e70507. [Google Scholar] [CrossRef] [Scilit]
  10. Fechete, L.I.; Larking, A.C.; Heslop, A.; Hannaford, R.; Anderson, C.B.; Hong, W.; Prakash, S.; Mace, W.; Alikhani, S.; Hofmann, R.W.; et al. Harnessing cold adaptation for postglacial colonisation: Galactinol synthase expression and raffinose accumulation in a polyploid and its progenitors. Plant Cell Environ. 2024, 47, 4014–4030. [Google Scholar] [CrossRef] [Scilit]
  11. Liu, J.; Li, Y.; Wang, Z.; Li, H.; Wang, H. Mining minor cold resistance genes in V. vinifera based on transcriptomics. Horticulturae 2025, 11, 1538. [Google Scholar] [CrossRef] [Scilit]
  12. Shan, G.; Yin, M.; Cao, Y.; Li, X.; Liu, P.; Wang, Y.; Zhou, J.; Zhao, L.; Gao, R. Responses to salt and cold stresses of the hybrid ‘Yannong Hongxue’ × ‘Yannong Chenghuang’ and its parent species. Sci. Hortic. 2025, 350, 114323. [Google Scholar] [CrossRef] [Scilit]
  13. Miller, M.; Zhang, C.Q.; Chen, Z.J. Ploidy and hybridity effects on growth vigor and gene expression in Arabidopsis thaliana hybrids and their parents. G3 Genes|Genomes|Genet. 2012, 2, 505–513. [Google Scholar] [CrossRef] [Scilit]
  14. Sun, L.; Ghouri, F.; Jin, J.; Zhong, M.; Huang, W.; Lu, Z.; Wu, J.; Liu, X.; Shahid, M.Q. Interspecific Hybridization Enhanced Tolerance to Salinity and Cadmium Stress Through Modifying Biochemical, Physiological, and Resistance Gene Levels, Especially in Polyploid Rice: A Sustainable Way for Stress-Resilient Rice. Rice 2025, 18, 19. [Google Scholar] [CrossRef] [Scilit]
  15. Li, Y.; He, W.; Liu, Y.; Mei, C.; Wang, H.; Song, X. ClBRN1 from Chrysanthemum lavandulifolium enhances the stress resistance of transgenic Arabidopsis. PeerJ 2024, 12, e18620. [Google Scholar] [CrossRef] [Scilit]
  16. Huang, H.; Wang, Y.; Wang, S.; Wu, X.; Yang, K.; Niu, Y.; Dai, S. Transcriptome-Wide Survey and Expression Analysis of Stress-Responsive NAC Genes in Chrysanthemum lavandulifolium. Plant Sci. 2012, 193–194, 18–27. [Google Scholar] [CrossRef] [Scilit]
  17. Lynch, M.; Milligan, B.G. Analysis of population genetic structure with RAPD markers. Mol. Ecol. 1994, 3, 91–99. [Google Scholar] [CrossRef] [Scilit]
  18. Gao, T.; Wang, H.; Li, C.; Zuo, M.; Wang, X.; Liu, Y.; Yang, Y.; Xu, D.; Liu, Y.; Fang, X. Effects of heavy metal stress on physiology, hydraulics, and anatomy of three desert plants in the Jinchang Mining Area, China. Int. J. Environ. Res. Public Health 2022, 19, 15873. [Google Scholar] [CrossRef] [Scilit]
  19. Bradford, M.M. A rapid and sensitive method for the quantitation of microgram quantities of protein utilizing the principle of protein-dye binding. Anal. Biochem. 1976, 72, 248–254. [Google Scholar] [CrossRef]
  20. Hârţa, M.; Borsai, O.; Muntean, C.M.; Dina, N.E.; Fǎlǎmaş, A.; Olar, L.E.; Szabo, K.; Pamfil, D.; Ştefan, R. Assessment of Genetic Relationships between Streptocarpus x hybridus V. Parents and F1 Progenies Using SRAP Markers and FT-IR Spectroscopy. Plants 2020, 9, 160. [Google Scholar] [CrossRef] [Scilit]
  21. Hao, Q.; Liu, Z.A.; Shu, Q.Y.; Zhang, R.; De Rick, J.; Wang, L.S. Studies on Paeonia cultivars and hybrids identification based on SRAP analysis. Hereditas 2008, 145, 38–47. [Google Scholar] [CrossRef] [Scilit]
  22. Fu, X.; Chen, G.; Ruan, X.; Kang, G.; Hou, D.; Xu, H. Overexpression of OsPIN5b alters plant architecture and impairs cold tolerance in rice (Oryza sativa L.). Plants 2025, 14, 1026. [Google Scholar] [CrossRef] [Scilit]
  23. Zhang, X.; Feng, Y.; Wang, Y.; Xu, X.; Wang, Y.; Zhang, F.; Zhang, L.; Liu, Q. Genetic modulation of ROS scavenging by DgNAC3 improves cold stress tolerance in Chrysanthemum morifolium. Physiol. Plant. 2025, 177, e70593. [Google Scholar] [CrossRef] [Scilit]
  24. Shomo, Z.D.; Li, F.; Smith, C.N.; Edmonds, S.R.; Roston, R.L. From sensing to acclimation: The role of membrane lipid remodeling in plant responses to low temperatures. Plant Physiol. 2024, 196, 1737–1757. [Google Scholar] [CrossRef] [Scilit]
  25. Gu, Y.; He, L.; Zhao, C.; Wang, F.; Yan, B.; Gao, Y.; Li, Z.; Yang, K.; Xu, J. Biochemical and transcriptional regulation of membrane lipid metabolism in maize leaves under low temperature. Front. Plant Sci. 2017, 8, 2053. [Google Scholar] [CrossRef] [Scilit]
  26. Yu, L.; Nie, J.; Cao, C.; Jin, Y.; Yan, M.; Wang, F.; Liu, J.; Xiao, Y.; Liang, Y.; Zhang, W. Phosphatidic acid mediates salt stress response by regulation of MPK6 in Arabidopsis thaliana. New Phytol. 2010, 188, 762–773. [Google Scholar] [CrossRef] [Scilit]
  27. Zhou, Y.; Zhou, D.-M.; Yu, W.-W.; Shi, L.-L.; Zhang, Y.; Lai, Y.-X.; Huang, L.-P.; Qi, H.; Chen, Q.-F.; Yao, N.; et al. Phosphatidic acid modulates MPK3- and MPK6-mediated hypoxia signaling in Arabidopsis. Plant Cell 2022, 34, 889–909. [Google Scholar] [CrossRef] [Scilit]
  28. Margutti, M.P.; Gaveglio, V.L.; Reyna, M.; Pasquaré, S.J.; Racagni, G.E.; Villasuso, A.L. Differential phosphatidic acid metabolism in barley leaves and roots induced by chilling temperature. Plant Physiol. Biochem. 2018, 132, 174–182. [Google Scholar] [CrossRef] [Scilit]
  29. Gao, L.; Jiang, H.; Li, M.; Wang, D.; Xiang, H.; Zeng, R.; Chen, L.; Zhang, X.; Zuo, J.; Yang, S.; et al. Genetic and lipidomic analyses reveal the key role of lipid metabolism for cold tolerance in maize. J. Genet. Genom. 2023, 51, 326–337. [Google Scholar] [CrossRef] [Scilit]
  30. Song, C.; Wang, K.; Xiao, X.; Liu, Q.; Yang, M.; Li, X.; Feng, Y.; Li, S.; Shi, L.; Chen, W.; et al. Membrane lipid metabolism influences chilling injury during cold storage of peach fruit. Food Res. Int. 2022, 157, 111249. [Google Scholar] [CrossRef] [Scilit]
  31. Bates, P.D.; Browse, J. The significance of different diacylgycerol synthesis pathways on plant oil composition and bioengineering. Front. Plant Sci. 2012, 3, 147. [Google Scholar] [CrossRef] [Scilit]
  32. Wu, S.; Hu, C.; Zhang, S.; Deng, G.; Sheng, O.; Dou, T.; Bi, F.; He, W.; Dong, T.; Li, C.; et al. Lipid metabolism and MAPK-ICE1 cascade play crucial roles in cold tolerance of banana. Hortic. Adv. 2024, 2, 8. [Google Scholar] [CrossRef] [Scilit]
Figure 1. Electrophoresis for identification of hybrid progeny by SRAP-PCR. CL represents Chrysanthemum lavandulifolium; QJ represents ‘Yannong Qiujin’; DY represents ‘Yannong Danyun’; ME and EM denote a pair of primers; M: marker DNA (2000 bp). Arrows indicate the specific bands.
Agriculture 16 01923 g001
Figure 2. Morphological of leaves and flowers in hybrid progeny and their parents. (a,b): Leaf and flower of the male parent; (c,d): Leaf and flower of the hybrid progeny; (e,f): Leaf and flower of the female parent. RGB: color model. Bar = 1 cm.
Agriculture 16 01923 g002
Figure 3. Phenotypic and oxidative responses of hybrid progeny under cold stress. (A): DAB and NBT staining; (B): H2O2 content; (C): Morphology of the hybrid progeny and parental plants under cold stress; (D): MDA content; (E): CAT activity; (F): Soluble protein content; (G): Pro content; (H): SOD activity; CL: C. lavandulifolium (male parent); DY: ‘Yannong Danyun’ (hybrid progenies); QJ: ‘Yannong Qiujin’ (female parent). The values presented are the mean ± standard deviation of three replicates. Different lowercase letters represent significant differences among varieties at the same temperature (p < 0.05).
Agriculture 16 01923 g003
Figure 4. Overview and verification of RNA-seq data. (A): PCA based on the dataset of fragments per kilobase exon per million reads mapped; (B): Pearson correlation coefficient analysis. CL: C. lavandulifolium (male parent); DY: ‘Yannong Danyun’ (hybrid progenies); QJ: ‘Yannong Qiujin’ (female parent).
Agriculture 16 01923 g004
Figure 5. GO enrichment analysis and Venn diagram representation of differentially expressed genes. (A): Gene expression levels in volcano plots and the number of DEGs (QJ vs. DY, CL vs. DY). (B): Venn diagram of differentially expressed genes in DY vs. CL and QJ vs. DY comparisons. (C): GO functional classification of DEGs. Only the top terms in each core category are listed. CL: C. lavandulifolium (male parent); DY: ‘Yannong Danyun’ (hybrid progenies); QJ: ‘Yannong Qiujin’ (female parent). The horizontal dashed line corresponds to FDR = 0.05, and the two vertical dashed lines represent |log2(fold‑change)| = 1.
Agriculture 16 01923 g005
Figure 6. KEGG enrichment analysis of DEGs in the hybrid progeny under chilling stress. (A): QJ vs. DY comparisons. (B): DY vs. CL comparisons. Bubble size and color correspond to the gene number and Q value enriched in the pathway. The rich factor indicates the ratio of the number of DEGs mapped to a certain pathway to the total number of genes mapped to this pathway. CL: C. lavandulifolium (male parent); DY: ‘Yannong Danyun’ (hybrid progenies); QJ: ‘Yannong Qiujin’ (female parent).
Agriculture 16 01923 g006
Figure 7. KEGG pathway enrichment of differentially accumulated metabolites (DAMs) in response to chilling stress. (A): Number of DAM, orange and green represent upregulated and downregulated DAMs, respectively. (B): Venn diagram of DAMs in DY vs. CL and QJ vs. DY comparisons. (C): KEGG pathway enrichment analysis of differential metabolites between DY and QJ. (D): KEGG pathway enrichment analysis of differential metabolites between DY and CL. Top 20 items. CL: C. lavandulifolium (male parent); DY: ‘Yannong Danyun’ (hybrid progenies); QJ: ‘Yannong Qiujin’ (female parent).
Agriculture 16 01923 g007
Figure 8. Integrated KEGG pathway enrichment analysis of combined DEG and DAM datasets. (A): KEGG pathway enrichment analysis of combined transcriptomic and metabolomic data between QJ and DY. (B): KEGG pathway enrichment analysis of combined transcriptomic and metabolomic data between DY and CL. Circles (●) represent genes and triangles (▲) represent metabolites. The horizontal axis indicates enrichment score; the color gradient corresponds to p-value; the size of dotsrepresents the number of enriched molecules. CL: C. lavandulifolium (male parent); DY: ‘Yannong Danyun’ (hybrid progenies); QJ: ‘Yannong Qiujin’ (female parent).
Agriculture 16 01923 g008
Figure 9. Response pattern of glycerophospholipid metabolism pathway under low-temperature stress. Dashed arrows indicate hypothetical or inferred regulatory steps based on previous published literature. Up‑pointing arrows indicate up‑regulation. Orange symbols denote CL vs. DY, and black symbols represent DY vs. QJ.
Agriculture 16 01923 g009
Table 1. Primer sequences used for quantitative real time PCR (qPCR) analysis.
PrimerSequence (5′–3′)
qRT-GPAT-FACCGGTCGTGTTATTGGCAT
qRT-GPAT-RCTGGCTTCGTGGTAGGGTTT
qRT-LPAAT-FAAGCGGATGGACCCAAGAAG
qRT-LPAAT-RCCGACCATCCTTACTCCGTG
qRT-MAPKKK-FCCGTTATACATGGCACCGGA
qRT-MAPKKK-RAACACTCCATGCCGTTTTGC
qRT-MAPK-FTGGTACTCCTCCTCCCGAAG
qRT-MAPK-RAAGACGGTGCAGTAAGCGAA
qRT-ICE-FAGCTCCGTTGGAGTTGGAAG
qRT-ICE-RGCTGCACGTTTCTGGAACAG
qRT-DREB-FAAGTACCTGCGAAAGGGTCG
qRT-DREB-RCCAAAGCCTGCTACCTCGAT
qRT-COR-FCCATGGAACCCTTAAGGCCA
qRT-COR-RAGCAACCCATTCGAGGACAG
qRT-PAP-FTTGTTGGTGGTGCAGGAAGT
qRT-PAP-RGCCGTCAACTTCACAAACCC
qRT-FAD-FAGCACACTCATCCCTCGTTG
qRT-FAD-RGAGCCACGTGTGTGTCTGTA
EF1α-FCCATTCAAGCGACAGACTCA
EF1α-RTTTTGGTATCTGGTCCTGGAG
Table 2. Hybrid dominance of traits in the progeny of C. lavandulifolium × ‘Yannong Qiujin’.
TraitCLQJMid-Parent Value (MPV)Hybrid Progeny
Hybrid Progeny Mean
Fm
Mid-Parent
Heterosis
Hm
Mid-Parent
Heterosis Rate
RHm (%)
Leaf length
(cm)
4.63 c6.07 b5.357.10 a1.750.33
Leaf width
(cm)
2.89 c4.53 a3.713.53 b−0.18−0.05
Plant height
(cm)
89.68 a25.56 c57.6235.75 b−21.87−0.38
Crown diameter
(cm)
94.63 a52.31 b73.4742.58 c−30.89−0.42
Diameter of inflorescence (cm)1.28 c4.73 b3.015.44 a2.430.81
Number of ray flowers15 c20 b1839 a211.17
Length of ray flowers
(cm)
0.71 c2.17 b1.442.55 a1.110.77
Number of tubular flower90 c171 a131117 b−14−0.11
Length of tubular flower
(cm)
0.54 c1.55 a1.050.7 b−0.35−0.33
The values presented are the mean deviation of three replicates. Lowercase letters (p < 0.05) denote a statistically significant difference.
Table 3. Semi-lethal temperature of hybrid progeny between C. lavandulifolium and ‘Yannong Qiujin’.
VarietyRegression EquationsLT50 (°C, 95% CI)Coefficient of Determination
(R2)
‘Yannong Qiujin’y = 100/(1 + 1.71 × 10−0.42)−3.41 (−4.23 to −3.1)0.90
Hybrid progenyy = 93/(1 + 3.23 × 10−0.13)−9.02 (−9.82 to −8.73)0.90
C. lavandulifoliumy = 91/(1 + 3.57 × 10−0.11)−13.57 (−9.82 to −8.73)0.90
R2 represents the correlation coefficient.
Disclaimer/Publisher’s Note: The statements, opinions and data contained in all publications are solely those of the individual author(s) and contributor(s) and not of MDPI and/or the editor(s). MDPI and/or the editor(s) disclaim responsibility for any injury to people or property resulting from any ideas, methods, instructions or products referred to in the content.