1. Introduction
Climate change is placing increasing pressure on agricultural production through rising temperatures, changes in precipitation regimes, and increasing exposure to weather extremes, with important consequences for crop productivity and food security [
1]. Alfalfa (
Medicago sativa L.) is one of the most important perennial forage legumes due to high biomass production, nutritional value, protein content, and contribution to livestock production systems [
2,
3,
4,
5]. Its perennial growth habit, extensive root system, biological nitrogen fixation, and capacity for regrowth after cutting contribute to efficient resource use and adaptation to contrasting environments [
5,
6,
7]. However, these characteristics do not make alfalfa insensitive to climatic stress. Drought can substantially alter plant water relations, photosynthesis, metabolism, and biomass accumulation [
8,
9,
10,
11,
12,
13,
14,
15,
16,
17]. Regional climatic conditions are therefore important when evaluating the productivity, stability, and climate resilience of alfalfa production.
Although climate-related risks to European agriculture have been widely studied, long-term evidence on the response of alfalfa productivity to regional climatic variability in Romania remains limited. Existing research has commonly examined individual stressors, physiological responses, or adaptation practices, while fewer studies have considered yield performance, yield stability, and climatic exposure together at the regional scale. Regional differences in the associations of temperature and precipitation with alfalfa yield have also received limited quantitative attention in the Romanian context. To address this gap, we combine temporal trend analysis, correlation, multiple regression, yield-stability assessment, and an Alfalfa Climate Resilience Index (ACRI). The index is intended as an exploratory tool for comparison among the three regions studied, not as an externally validated predictor of resilience.
The study therefore aimed to assess climate–yield relationships in the South-Muntenia, South-East, and North-East development regions during 2006–2024 and to compare their relative climate resilience. The specific objectives were to (i) quantify temporal trends in temperature, precipitation, and alfalfa yield; (ii) estimate the direction and strength of associations between climatic variables and yield; (iii) compare regional yield stability; and (iv) examine whether an index combining yield, yield stability, precipitation, and temperature distinguishes the three regions consistently.
2. Review of Literature
2.1. Water Stress and Drought Response of Alfalfa
Alfalfa (
Medicago sativa L.) is a perennial forage legume characterized by a well-developed and extensive root system, which facilitates the uptake of water from deeper soil layers and contributes to its adaptation to water-limited environments [
5,
6,
7]. Nevertheless, drought remains one of the major abiotic constraints on alfalfa growth and productivity [
8,
9,
10,
17]. The extent of yield loss is influenced by several factors, including the severity and duration of water deficit, the plant’s developmental stage, soil water availability, genotype-specific responses, and interactions with other environmental factors. Experimental studies have shown remarkable variations among alfalfa genotypes and cultivars in their responses to drought, which supports the idea that drought adaptation is a complex and genotype-dependent trait [
8,
9,
12,
14,
15,
16,
17]. Alfalfa responds to water deficit by interacting with morphological, physiological, biochemical, and molecular mechanisms. Reported responses include alterations in root development and plant water relations, stomatal regulation, photosynthetic activity, osmotic adjustment, antioxidant defense, hormonal signaling, accumulation of compatible solutes, and regulation of stress-responsive genes [
9,
10,
11,
12,
13,
14,
15,
16,
17,
18,
19,
20,
21]. Physiological and proteomic analyses have revealed significant modifications in leaf metabolism under drought conditions [
11], whereas comparisons between cultivars have identified different physiological, hormonal, and metabolic responses to water limitation [
12]. Metabolic changes during post-cutting regrowth also contribute to alfalfa responses to water limitation [
13]. Enhanced antioxidant protection has been correlated with drought tolerance [
14], and physiological markers have been proposed for the identification of drought-tolerant alfalfa germplasm [
15,
16]. Molecular studies further reveal that alfalfa drought response involves complex regulatory networks. Recent research has identified roles for ABA signaling, antioxidant defense, photosynthetic protection, and stress-responsive genes in drought adaptation [
18,
19,
20]. At the whole-plant level, significant differences in growth and physiological and biochemical responses among alfalfa varieties further support the importance of genetic variation in drought tolerance [
21]. Collectively, these studies indicate that drought resistance cannot be attributed to a single trait but instead results from interacting physiological, biochemical, molecular, and morphological mechanisms [
10,
17,
18,
19,
20,
21].
Water availability must also be considered at the production-system level. Interannual precipitation variability can influence soil-water availability and consequently biomass production and yield stability. Recent evidence from alfalfa-based production systems demonstrates that precipitation variability affects soil-water balance and crop performance [
22]. Therefore, annual precipitation provides relevant information on climatic exposure but should not be interpreted as a direct measure of physiological drought tolerance.
2.2. Temperature Stress, Climate Variability, and Alfalfa Productivity
Temperature is an important environmental factor regulating alfalfa growth, development, photosynthesis, regrowth after cutting, and seasonal biomass production. Alfalfa can adapt to various climatic conditions; however, high temperatures may affect physiological processes and reduce productivity. Experimental studies have demonstrated the effect of heat stress on alfalfa growth and physiological traits and the large variation in heat tolerance among plant materials [
23]. Molecular regulation, including microRNA-mediated mechanisms, is also related to heat response [
24], while experimental evidence has shown that heat-induced damage is associated with reductions in photosynthetic efficiency and other physiological disturbances [
25]. Higher temperatures may intensify atmospheric evaporative demand and accelerate the depletion of soil water reserves, thereby exacerbating the adverse effects of drought. Consequently, temperature and water availability should be considered as interacting components of climatic exposure rather than as completely independent environmental factors [
9,
17,
23,
24,
25].
Evidence from Romania is particularly relevant to the present analysis. Naie et al. [
26] investigated the effects of water deficit and temperature regime on alfalfa under Romanian environmental conditions. The studies in Romania also revealed differences in ecological plasticity and productivity of alfalfa varieties [
27], while agronomic literature emphasizes the significance of climatic conditions, cultivar selection, and management for forage production in Romania [
28,
29]. These results validate the joint assessment of temperature and precipitation for the evaluation of long-term regional variability of alfalfa productivity.
2.3. From Crop Responses to Regional Production-System Resilience
The response of alfalfa production to climatic variability cannot be attributed exclusively to the intrinsic stress tolerance of the crop. Biological characteristics such as perennial growth, deep rooting, biological nitrogen fixation, and post-cutting regrowth contribute to resource acquisition and recovery after stress, but their effects on production are strongly conditioned by environmental and management factors [
5,
6,
7]. Irrigation regime, fertilization, cultivar selection, cutting regime, soil properties, and soil-water management may therefore alter the relationship between climatic exposure and observed yield [
30,
31,
32,
33,
34,
35].
Water management is particularly important because alfalfa has high biomass-production potential but substantial water requirements. Studies conducted across contrasting production environments have demonstrated strong relationships among water availability, irrigation regime, soil-water management, nutrient availability, and cultivar selection that may alter the relationship between climatic exposure and observed alfalfa productivity [
30,
31,
32,
33,
34,
35]. Deficit-irrigation strategies can increase water productivity or conserve water, although their effects on biomass production and economic returns depend on irrigation intensity, environment, cultivar, and management [
32,
34,
35].
Production-system resilience also involves the capacity to maintain productivity across years and contrasting environmental conditions. Therefore, yield stability provides information that is complementary to mean productivity. Recent research has explicitly evaluated the stability of alfalfa yield and quality traits [
36], while multi-environment studies have demonstrated substantial differences in cultivar adaptation across contrasting environments [
37]. Productivity and persistence under rainfed Mediterranean conditions are similarly associated with combinations of plant traits and environmental conditions [
38]. These results emphasize the difference between the response of individual plants or genotypes and the observed performance of regional production systems. Water scarcity can further alter the capacity of perennial alfalfa systems to sustain high yields and ecosystem functions [
39]. Irrigation technology, irrigation dose, and crop genetics can interact in determining alfalfa yield and quality [
40], while evapotranspiration-based approaches offer opportunities to improve water use efficiency [
41]. Studies in semi-arid conditions also show cultivar-dependent relationships between water productivity, yield response, and forage quality [
42]. Management responses to water limitation can include seasonal irrigation strategies [
43], sprinkler irrigation management [
44], and deficit irrigation to conserve water under limited supply [
45]. Taken together, this evidence indicates that observed alfalfa productivity under climatic stress is the result of interactions of climatic exposure, crop characteristics, water availability, and management—not of climate or genotype alone. This distinction is important when resilience is evaluated using regional agricultural data. At this scale, observed yield and interannual yield stability reflect the combined influence of crop characteristics, climatic conditions, soils, management practices, and other production factors. Consequently, regional production-system resilience should not be interpreted as equivalent to the intrinsic physiological resilience of
Medicago sativa or of a particular cultivar or genotype.
2.4. Knowledge Gap and Rationale for an Integrated Regional Assessment
Although substantial research has examined the physiological, molecular, and agronomic responses of alfalfa to drought, heat, and other abiotic stresses, comparatively less attention has been given to long-term regional relationships between climatic variability and alfalfa yield. Much of the existing literature focuses on individual stressors, controlled experiments, specific cultivars, or particular management interventions. These studies provide essential information on stress-response mechanisms but do not necessarily indicate how regional production systems perform over time under contrasting climatic conditions. Research on alfalfa drought stress has itself been strongly oriented toward stress-response mechanisms and drought-resistance technologies.
This gap is particularly relevant in Romania, where alfalfa is cultivated across regions that differ in temperature and precipitation regimes. Long-term regional comparisons can therefore provide complementary information by determining whether climatic trends are detectable, whether climatic variables are associated with annual yield, and whether the magnitude and statistical significance of these relationships differ among regions. Such an approach does not replace experimental studies of physiological stress tolerance but extends them to the regional production-system scale. A second methodological gap concerns the integration of production performance and climatic context. Yield alone describes productivity but not its interannual stability, whereas climatic indicators describe environmental conditions but not the response of the production system. To explore these dimensions jointly, the present study introduces the Alfalfa Climate Resilience Index (ACRI) as an exploratory composite indicator combining two production-performance components—normalized mean yield and yield stability—with two climatic-context components—normalized annual precipitation and inverse normalized mean annual temperature.
ACRI is not intended to quantify the intrinsic physiological resilience of Medicago sativa, individual cultivars, or genotypes, nor is it proposed as an externally validated or absolute measure of resilience. Rather, it provides a transparent, dataset-dependent framework for comparing the relative climate-resilience profiles of the regional alfalfa production systems included in the same reference dataset. Its weighting assumptions are subsequently examined through sensitivity analysis, while broader validation would require additional regions, common normalization criteria, and information on management and other agro-environmental factors.
Accordingly, the present study addresses two complementary objectives: (i) to quantify temporal climatic and yield trends and evaluate climate–yield relationships across South-Muntenia, South-East, and North-East during 2006–2024; and (ii) to explore whether the integration of production performance and climatic context through ACRI can differentiate the relative climate-resilience profiles of the three regional alfalfa production systems.
Based on these objectives, the following hypotheses were tested:
H1. Mean annual temperature exhibits a significant increasing temporal trend during 2006–2024 in the three Romanian development regions.
H2. Increasing temperature is negatively associated with alfalfa yield, with temperature variables having stronger relationships with yield than precipitation variables.
H3. The magnitude and significance of the relationships between climatic variables and alfalfa yield differ among South-Muntenia, South-East, and North-East regions.
H4. The temporal trend of alfalfa yield for 2006–2024 is negative, but the magnitude and statistical significance of the trend may vary across regions.
H5. The integration of yield performance, yield stability, precipitation, and temperature within ACRI differentiates the relative climate-resilience profiles of the three regional alfalfa production systems.
3. Materials and Methods
3.1. Study Area
The study covered three Romanian development regions with substantial alfalfa production: South-Muntenia, South-East, and North-East. These regions were selected because of their agricultural importance and contrasting climatic conditions.
South-Muntenia includes the counties of Argeș, Călărași, Dâmbovița, Giurgiu, Ialomița, Prahova, and Teleorman and is characterized by a temperate-continental climate, with relatively warm summers and periodic drought and water deficits, particularly in its southern areas. South-East includes the counties of Brăila, Buzău, Constanța, Galați, Tulcea, and Vrancea and is generally characterized by warmer and drier conditions, especially in the coastal and southern part of this region. The North-East includes the counties of Bacău, Botoșani, Iași, Neamț, Suceava, and Vaslui and offers a relatively cooler climatic setting. These regional differences formed the basis of the assessment of the spatial differences in climatic conditions, temporal trends, and climate–yield relationships in alfalfa production during 2006–2024.
3.2. Data Collection
Alfalfa production data for the 2006–2024 period were obtained from the National Institute of Statistics of Romania (INSSE) [
46]. The dataset included cultivated area (ha) and total alfalfa production (t) for the counties belonging to the three development regions considered in the study. The INSSE records available to the authors did not explicitly indicate whether total alfalfa production was reported as green mass or dry matter. Therefore, no conversion between these reporting bases was performed.
For each year, county-level data were aggregated according to the official composition of each development region. Regional alfalfa yield was calculated from total regional production and total regional cultivated area as follows:
where Yr is the regional alfalfa yield (t ha
−1), Pr is the total regional alfalfa production (t), and Ar is the total regional alfalfa cultivated area (ha).
For each year, regional alfalfa yield (t ha−1) was calculated by dividing the total alfalfa production of all counties included in the respective development region by their total alfalfa cultivated area. Total regional production and cultivated area were obtained by summing the corresponding county-level INSSE values for each year. This approach provides an area-weighted regional yield calculated as the ratio between aggregated county production and aggregated county cultivated area.
The Romanian National Meteorological Administration (ANM) provided climatic data for the same 2006–2024 period [
47]. Data were obtained from five meteorological stations distributed across the three study regions. The South-Muntenia Region was represented by the Călărași and Titu meteorological stations, the South-East Region by the Buzău and Galați meteorological stations, and the North-East Region by the Iași meteorological station. The records available to the authors identified the meteorological stations by name but did not include official station identification codes or a separate published dataset name. Because the climatic observations represent station-based point measurements rather than gridded data, they do not have a conventional spatial resolution. The climatic dataset included mean air temperature, maximum air temperature, minimum air temperature, precipitation totals, and maximum precipitation recorded within 24 h. Station-level observations were organized by calendar year and used to derive the annual climatic indicators employed in the statistical analyses.
For South-Muntenia and South-East, where two meteorological stations were available, the regional climatic value for each year and climatic indicator was calculated as the arithmetic mean of the corresponding annual values from both stations. Thus, the South-Muntenia climatic series represented the arithmetic mean of the Călărași and Titu station values, whereas the South-East series represented the arithmetic mean of the Buzău and Galați station values. For North-East, the annual climatic series corresponded to the observations from the Iași meteorological station. Because the number of available meteorological stations was limited and differed among regions, the resulting climatic series were treated as regional climatic proxies rather than as spatially exhaustive representations of climatic conditions across each development region. This limitation is particularly relevant for North-East, which was represented by the Iași meteorological station.
The same station composition and aggregation procedure were applied consistently throughout the 2006–2024 study period. Before statistical analysis, the resulting annual regional series were checked for missing values, recording inconsistencies, and implausible observations.
3.3. Climatic Indicators
Five climatic indicators were used to characterize the thermal and precipitation conditions associated with regional alfalfa production: mean annual temperature (T_avg), maximum temperature (T_max), minimum temperature (T_min), annual precipitation (Rain_total), and maximum 24 h precipitation (Rain_24h).
Mean annual temperature (T_avg) characterized the general annual thermal regime. Maximum temperature (T_max) represented exposure to high-temperature conditions that may contribute to heat stress and increased atmospheric water demand, whereas minimum temperature (T_min) characterized exposure to low-temperature extremes relevant to a perennial forage crop.
Annual precipitation (Rain_total) represented the total annual water input from precipitation, whereas maximum 24 h precipitation (Rain_24h) characterized short-duration precipitation intensity. For South-Muntenia and South-East, each annual regional indicator was obtained by arithmetically averaging the corresponding station-level annual values, as described in
Section 3.2. For North-East, the indicators corresponded to the Iași meteorological station.
These variables were considered indicators of climatic exposure and were not interpreted as direct measurements of crop water status, drought intensity, heat stress, soil moisture, or physiological stress. Their combined analysis was intended to characterize broad regional climatic conditions associated with interannual variation in alfalfa yield.
3.4. Statistical Analysis
Statistical analyses were performed using IBM SPSS Statistics 26 and Python 3.13.5. IBM SPSS Statistics 26 was used for descriptive statistics and Pearson correlation analysis. Additional analyses introduced during manuscript revision were performed in Python. Multiple linear regression models and regression diagnostics were performed using statsmodels 0.14.6. Preliminary data organization and graphical representation were performed using Microsoft Excel 2021. Statistical significance was evaluated at
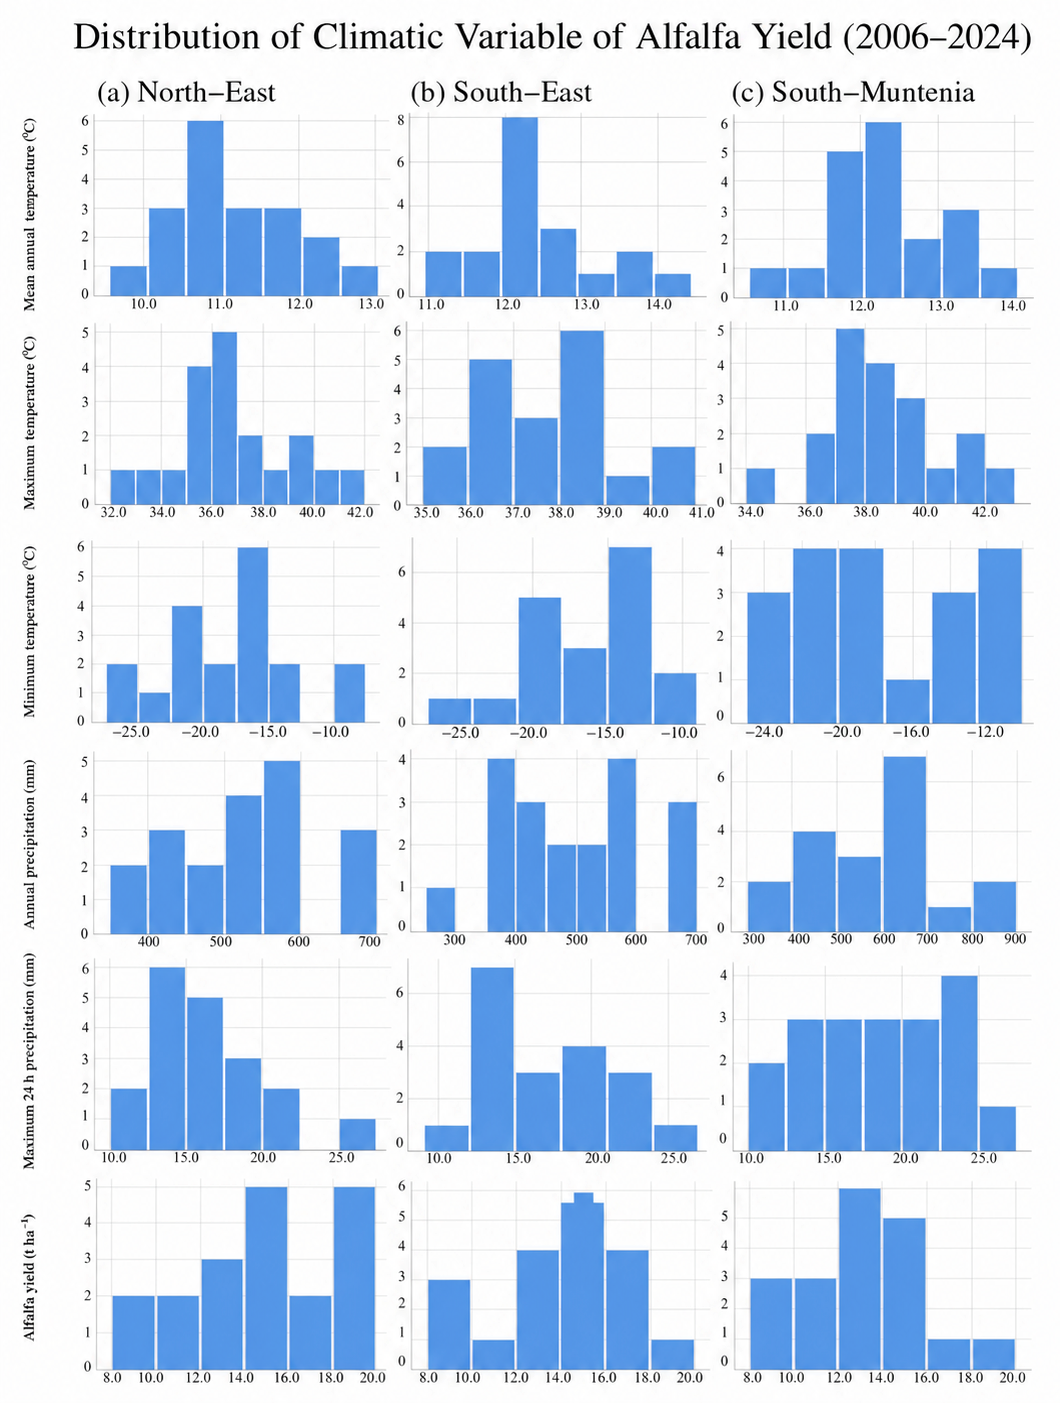
p < 0.05. Descriptive statistics (mean, standard deviation (SD), minimum, maximum, coefficient of variation (CV), and 95% confidence interval (CI)) were calculated for the climate variables and alfalfa yield. The distribution of mean annual temperature (T_avg), maximum temperature (T_max), minimum temperature (T_min), annual precipitation (Rain_total), maximum 24 h precipitation (Rain_24h), and alfalfa yield was evaluated separately for each region. Distributional characteristics were explored initially graphically using histograms (
Figure 1) with particular attention to skewness, extreme observations, and possible multimodality. Normality was formally assessed using the Shapiro–Wilk test [
48] for alfalfa yield and each climatic variable within each region (18 tests in total). None of the tests indicated a statistically significant departure from normality (W = 0.941–0.982; all
p > 0.05;
Table S1). Histograms were also inspected as a complementary graphical assessment of variable distributions (
Figure 1).
Together with the graphical assessment, these results supported the use of Pearson correlation analysis to examine the bivariate relationships between climatic variables and alfalfa yield. Temporal trends in mean annual temperature, annual precipitation, and alfalfa yield during 2006–2024 were assessed using Kendall’s rank-based trend test, and the magnitude and direction of temporal change were quantified using Sen’s slope estimator [
49]. Kendall’s tau (τ) was used to characterize the direction and strength of the monotonic association with time. These non-parametric methods do not require normally distributed observations and are appropriate for climatic and agricultural time-series data.
Pearson correlation coefficients (r) were calculated separately for South-Muntenia, South-East, and North-East to evaluate the strength and direction of the bivariate relationships between alfalfa yield and the five climatic variables. Two-tailed statistical significance was evaluated at p < 0.05. Correlation coefficients were interpreted according to their absolute magnitude as follows: 0.00–0.19, very weak; 0.20–0.39, weak; 0.40–0.59, moderate; 0.60–0.79, strong; and 0.80–1.00, very strong.
Multiple linear regression models were fitted separately for the three regions to evaluate the simultaneous associations between climatic variables and annual alfalfa yield. All five climatic predictors were entered simultaneously into each regional model:
The general multiple regression model was expressed as
where Y represents alfalfa yield; T_avg is mean annual temperature; T_max is maximum temperature; T_min is minimum temperature; Rain_total is annual precipitation; Rain_24h is maximum precipitation recorded within a 24 h period; β
0 represents the model intercept; β
1–β
5 are the unstandardized regression coefficients associated with the climatic predictors; and ε represents the residual error.
Model performance was evaluated using the coefficient of determination (R2), adjusted R2, and the overall F-test. For each predictor, the unstandardized regression coefficient (B), standard error (SE), and corresponding p-value were reported.
Regression assumptions were evaluated independently of the marginal normality assessment of the individual variables. In particular, multiple linear regression does not require the predictor variables themselves to be normally distributed; the normality assumption relevant to model-based inference concerns the distribution of model residuals. Residual normality was evaluated using the Shapiro–Wilk test [
48]. Homoscedasticity was assessed using the Breusch–Pagan test [
50], residual autocorrelation using the Durbin–Watson statistic, and multicollinearity among predictors using the variance inflation factor (VIF). Diagnostic results were considered jointly when interpreting the regression models, and individual regression coefficients were interpreted cautiously when elevated VIF values indicated substantial collinearity among climatic predictors. Given the relatively small number of annual observations available for each region (n = 19), statistical results were interpreted by considering the direction and magnitude of the estimated relationships, statistical significance, and model diagnostics together.
3.5. Development and Interpretation of the Alfalfa Climate Resilience Index (ACRI)
The Alfalfa Climate Resilience Index (ACRI) was developed as an exploratory composite indicator for comparing the relative climate resilience of regional alfalfa production systems. In the present study, ACRI is not intended to measure the intrinsic physiological resilience of Medicago sativa L. or the resilience of individual cultivars or genotypes. Instead, it integrates observed production performance with the climatic context under which that performance occurred.
Four components were included in the index: normalized mean alfalfa yield (Yn), yield stability (S), normalized annual precipitation (Pn), and inverse normalized mean annual temperature (1 − Tn) (
Table 1). These components represent two conceptually distinct dimensions. Yn and S characterize the observed performance of the regional production system, whereas Pn and (1 − Tn) characterize the climatic context. Thus, precipitation and temperature are not interpreted as direct crop-response variables or direct physiological measures of resilience. Their inclusion provides climatic context for comparing regional differences in observed yield performance and stability.
Table 1.
Components, calculation methods, and interpretation of the Alfalfa Climate Resilience Index (ACRI).
Table 1.
Components, calculation methods, and interpretation of the Alfalfa Climate Resilience Index (ACRI).
| ACRI Component | Calculation | Role in ACRI |
|---|
| Yield (Yn) | Min–max normalized mean yield | Production-performance component |
| Yield stability (S) | 1 − CV | Production-performance component |
| Precipitation (Pn) | Min–max normalized annual precipitation | Climatic-context component |
| Temperature (1 − Tn) | Inverse normalized mean annual temperature | Climatic-context component |
Mean alfalfa yield, annual precipitation, and mean annual temperature were transformed to a common dimensionless scale using min–max normalization
where X = observed value, Xmin = minimum observed value, and Xmax = maximum observed value.
Because higher mean annual temperatures represent less favorable thermal conditions for alfalfa production under warming conditions and were negatively associated with yield in the study regions, the normalized temperature component was reverse-coded as (1 − Tn) so that higher values corresponded to comparatively lower mean annual temperature (T_avg) in the study dataset. Similarly, higher Pn values corresponded to greater relative annual precipitation within the three-region reference set. The precipitation component should be interpreted as relative water-input context rather than as evidence of a monotonic beneficial effect of increasing precipitation on alfalfa yield. These climatic components therefore characterize relative climatic conditions within the study dataset and should not be interpreted as direct physiological measures of drought or heat tolerance. Yield stability was derived from the coefficient of variation (CV) of annual alfalfa yield:
where σ is the standard deviation of annual alfalfa yield and μ is the mean annual alfalfa yield during the study period.
The yield stability component was then calculated as
where S is the yield stability component and CV is the coefficient of variation in alfalfa yield.
In the present dataset, CV ranged from 0.200 to 0.218 (20.0–21.8%), corresponding to S values of 0.782–0.800. Thus, the observed CV values occupied a narrow range, and the resulting stability component remained positive and within the [0, 1] interval for all three regions. The coefficient of variation (CV) is non-negative for the data analyzed in this study because it is calculated as the ratio of a non-negative standard deviation to a positive mean yield. Nevertheless, unlike the min-max normalized components, the transformation S = 1 − CV is not mathematically guaranteed to remain within [0, 1] in every possible data set. If CV exceeds 1, S becomes negative. Future applications involving substantially greater yield variability should therefore consider a bounded normalization or an alternative transformation of the stability component. The baseline ACRI was calculated using equal weights:
Equal weighting was selected as a transparent baseline approach because no independently validated evidence was available to justify assigning greater importance to one component than to another. The weights should therefore be regarded as a methodological assumption rather than as empirically established contributions of the four components to climate resilience.
Management practices may modify the relationship between climatic conditions and observed production performance. Irrigation, fertilization, cultivar selection, cutting regime, soil management, and other agronomic interventions may mitigate climatic stress and consequently influence yield and yield stability even when regional climatic conditions remain unchanged. Consistent regional data on these factors were unavailable for the complete 2006–2024 period and therefore could not be incorporated explicitly into the present index. ACRI should consequently be interpreted as integrating the observed performance and climatic context of regional alfalfa production systems under their prevailing management conditions, rather than as separating intrinsic crop resilience from management-mediated adaptation. An important consequence of min–max normalization is that ACRI is dataset-dependent and relative to the reference population used for normalization. In the present study, the minimum and maximum values were determined exclusively from South-Muntenia, South-East, and North-East. The resulting ACRI scores therefore support within-dataset comparisons among these three regions but do not represent absolute resilience values or universal resilience thresholds. Inclusion of additional regions or production systems could alter the normalization bounds and consequently change both the normalized component values and the final ACRI scores.
For the same reason, ACRI values calculated independently for different experiments, regions, cultivars, or datasets should not be compared directly unless the same reference population and normalization bounds are used. The present regional dataset also precludes cultivar- or genotype-specific interpretations because cultivar identity was inconsistently available throughout the study period. Broader application of ACRI will therefore require external validation and recalibration using larger reference datasets and, where possible, common or externally defined normalization bounds. Accordingly, ACRI should be interpreted as an exploratory, dataset-dependent tool for within-dataset comparison of relative regional alfalfa production-system climate resilience rather than as an absolute, predictive, or physiologically validated measure of crop resilience.
3.6. ACRI Sensitivity Analysis
Because the baseline ACRI assigns equal weights to four conceptually different components, a sensitivity analysis was performed to determine whether the comparative regional ranking was strongly dependent on the assumed weighting structure. The purpose of this analysis was to evaluate the internal robustness of the regional ranking to moderate changes in component weights rather than to provide external validation of ACRI. A generalized weighted form of the index was defined as
where w
Y, w
S, w
P, and w
T represent the weights assigned to normalized mean yield, yield stability, normalized annual precipitation, and inverse normalized mean annual temperature, respectively. The weights were constrained to sum to 1:
Five weighting scenarios were evaluated. The baseline scenario assigned an equal weight of 0.25 to each component. Four alternative scenarios were then constructed by assigning a weight of 0.40 to one component and 0.20 to each of the remaining three components. The scenarios were defined as follows: (i) baseline equal-weight scenario: 0.25/0.25/0.25/0.25; (ii) yield-dominant scenario: 0.40/0.20/0.20/0.20; (iii) yield-stability-dominant scenario: 0.20/0.40/0.20/0.20; (iv) precipitation-dominant scenario: 0.20/0.20/0.40/0.20; (v) temperature-dominant scenario: 0.20/0.20/0.20/0.40.
For each weighting scenario, ACRI scores were recalculated for the three regions, and the resulting regional ranks were compared with those obtained under the equal-weight baseline. An unchanged regional ordering was interpreted as evidence that the comparative ranking was relatively insensitive to the moderate weighting changes examined. Because min–max normalization was based exclusively on the three study regions, the sensitivity analysis evaluates internal robustness to weighting assumptions within the current reference dataset and does not constitute external validation of ACRI. Furthermore, this procedure does not assess sensitivity to alternative normalization populations, management variables, or additional environmental indicators. These aspects require evaluation in future applications using broader and independently defined reference datasets.
4. Results
4.1. Temporal Trends in Climatic Variables and Alfalfa Yield
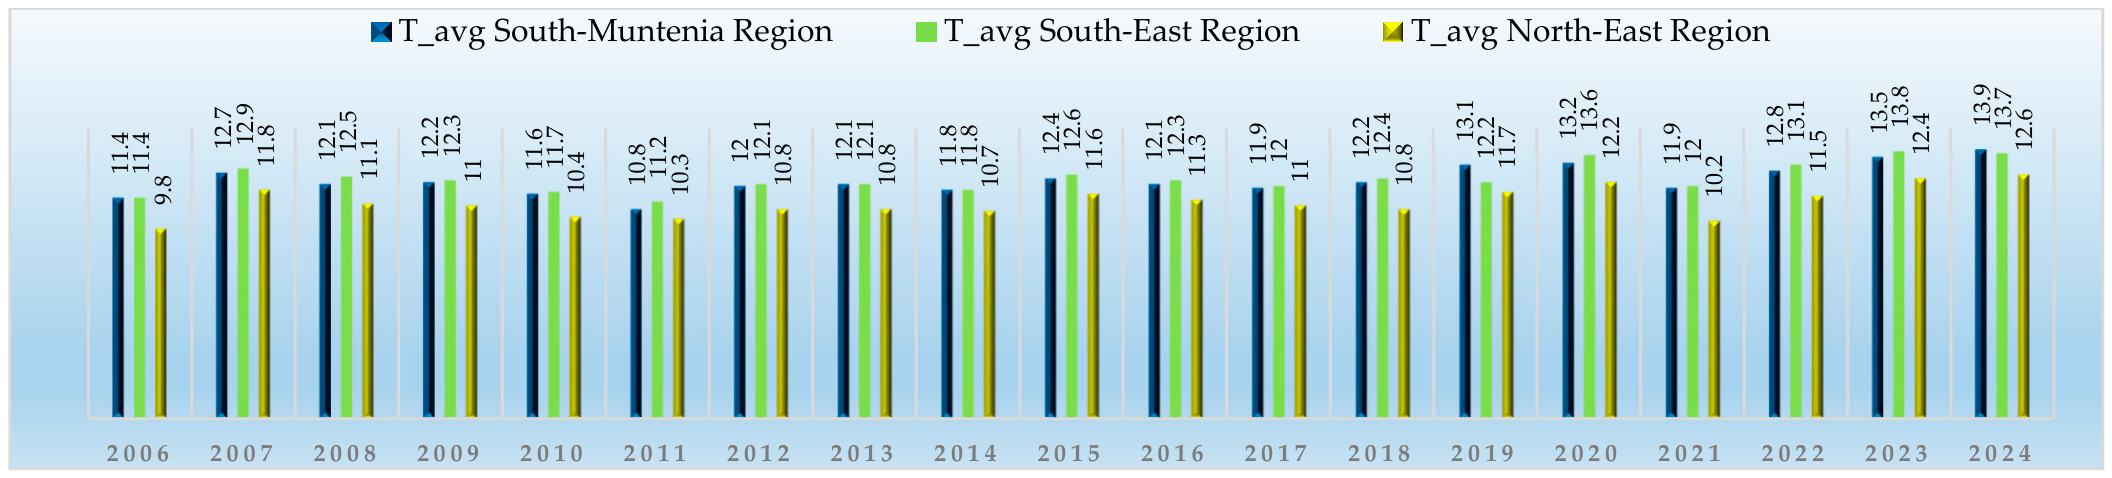
All three regions exhibited substantial interannual variation in climatic variables and alfalfa yield during 2006–2024. Mean annual temperature (T_avg) tended to rise, while precipitation and yield fluctuated more irregularly. Kendall’s analysis identified significant increases in mean annual temperature (T_avg) in each region (
Table 2). South-Muntenia had τ = 0.451 (
p = 0.008) and a Sen’s slope of +0.093 °C/year. The corresponding values were τ = 0.354 (
p = 0.035) and +0.071 °C/year in the South-East, and τ = 0.361 (
p = 0.032) and +0.100 °C/year in the North-East. The North-East therefore had the largest estimated annual temperature increase.
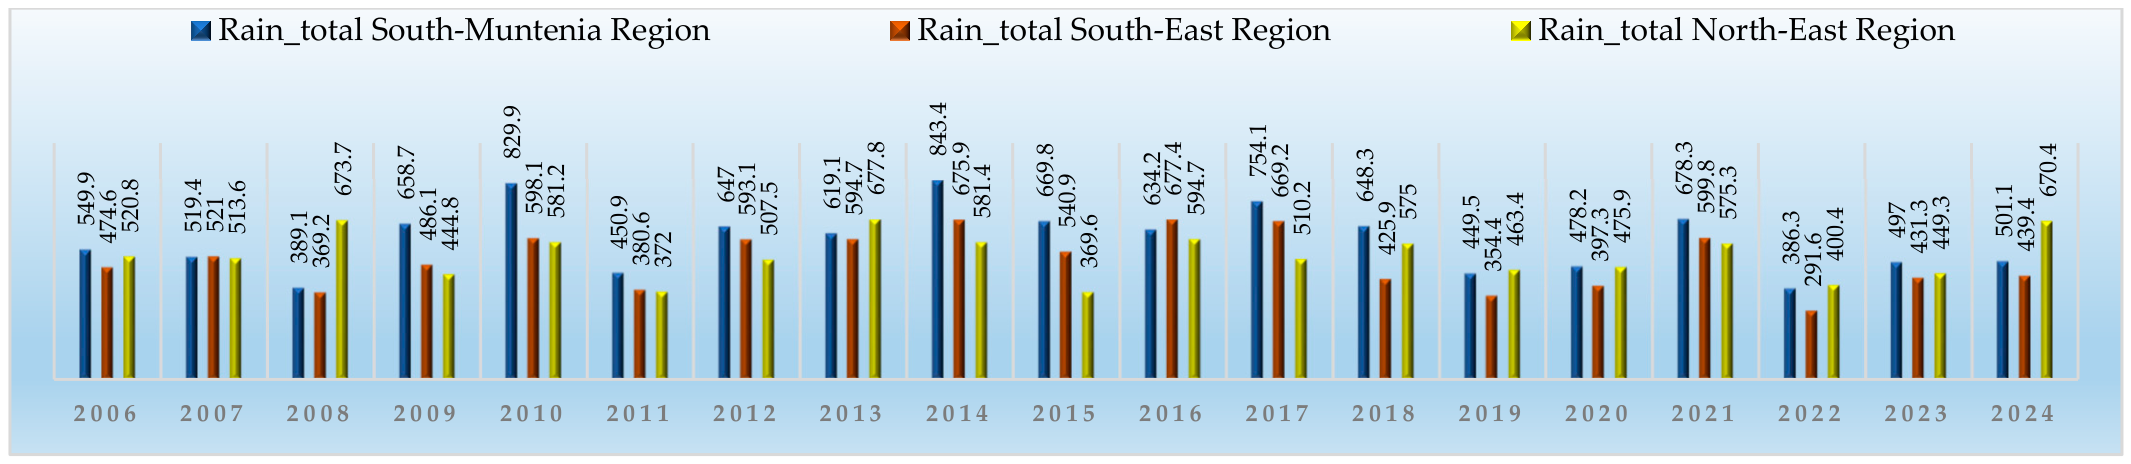
Precipitation slopes were negative but not statistically significant in any region: −3.112 mm year−1 in South-Muntenia (τ = −0.076, p = 0.679), −2.500 mm year−1 in South-East (τ = −0.053, p = 0.783), and −0.964 mm year−1 in North-East (τ = −0.088, p = 0.629). Therefore, the series indicates interannual variability rather than a significant monotonic change in annual precipitation.
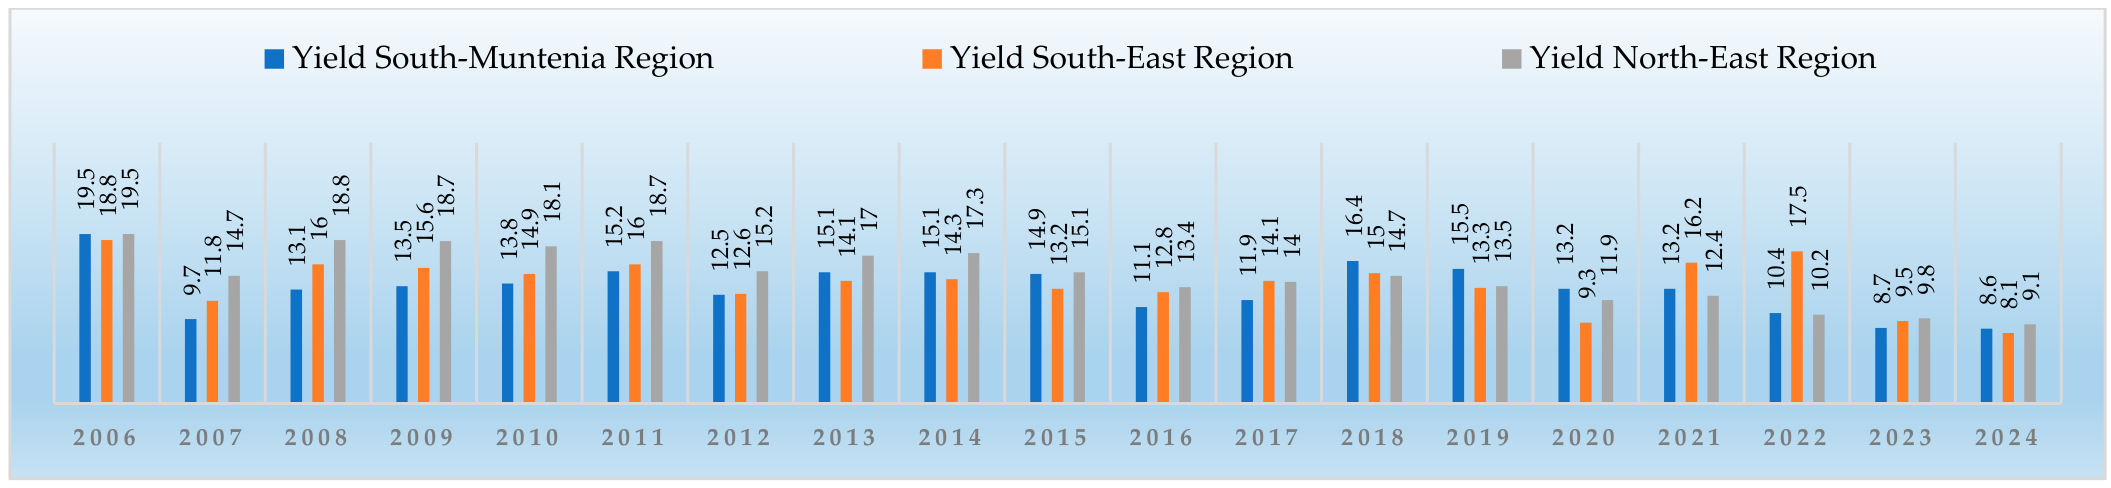
Yield also had negative Sen’s slopes in all regions. Only North-East indicated a significant monotonic decline (τ = −0.794, p < 0.001; −0.571 t ha−1 year−1). The slopes for South-Muntenia (τ = −0.265, p = 0.115; −0.238 t ha−1 year−1) and South-East (τ = −0.265, p = 0.115; −0.283 t ha−1 year−1) were negative but not statistically significant.
Figure 2,
Figure 3 and
Figure 4 present the annual evolution of mean temperature, annual precipitation, and alfalfa yield, respectively, during 2006–2024.
4.2. Relationships Between Climatic Variables and Alfalfa Yield
4.2.1. Descriptive Statistics
Descriptive statistics showed that mean alfalfa yield ranged from 13.23 ± 2.77 t ha
−1 in South-Muntenia to 14.85 ± 3.23 t ha
−1 in North-East (
Table 3). Mean annual temperature (T_avg) was highest in the South-East (12.41 ± 0.74 °C) and lowest in the North-East (11.16 ± 0.76 °C). South-Muntenia recorded the highest mean annual precipitation (589.69 ± 136.14 mm), whereas South-East recorded the lowest (501.08 ± 118.23 mm). Maximum and minimum temperatures and maximum 24 h precipitation also differed among regions, as summarized in
Table 3.
4.2.2. Pearson Correlation Analysis
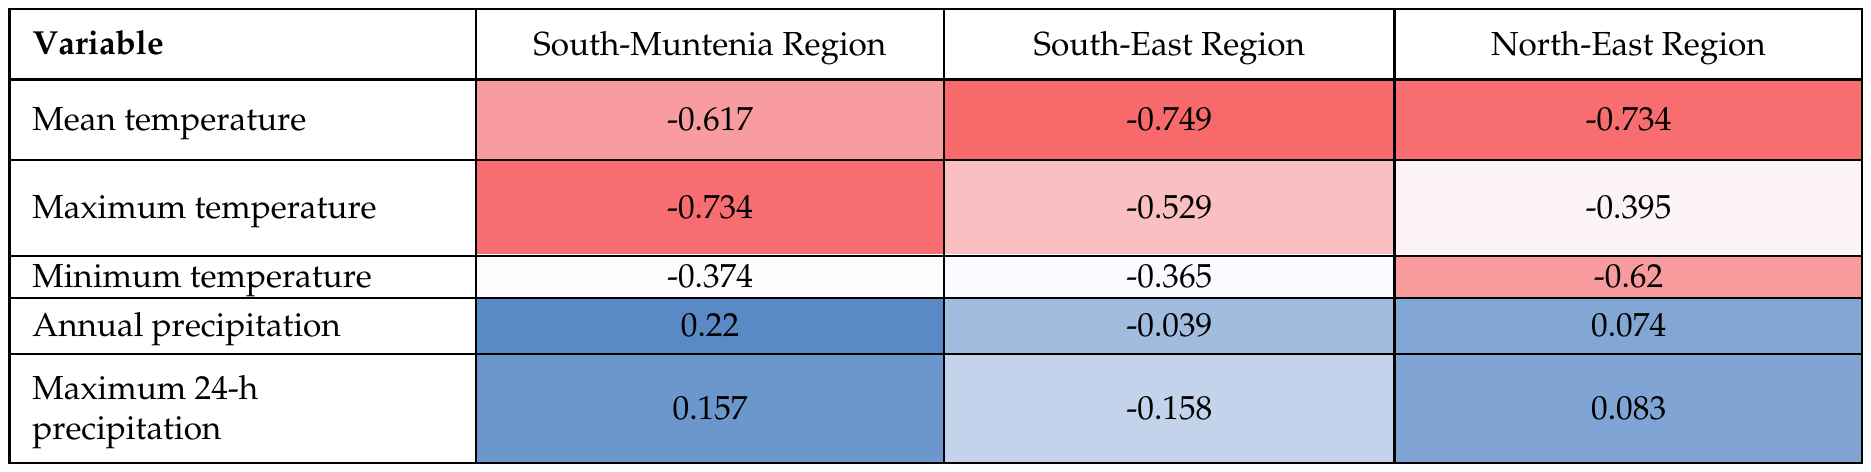
Temperature variables were generally negatively associated with alfalfa yield (
Table 4). The yield was significantly correlated with the mean annual temperature (T_avg) in South-Muntenia (r = −0.617,
p = 0.005), South-East (r = −0.749,
p < 0.001), and North-East (r = −0.734,
p < 0.001). The maximum temperature (T_max) was significantly negatively correlated with the yield in South-Muntenia (r = −0.734,
p < 0.001) and South-East (r = −0.529,
p = 0.020). In the North-East, the relationship was negative but not statistically significant (r = −0.395,
p = 0.094). Minimum temperature (T_min) showed a significant negative correlation with yield only in North-East (r = −0.620,
p = 0.005).
Neither annual precipitation (Rain_total) nor maximum 24 h precipitation (Rain_24h) was significantly correlated with yield in any region (
p > 0.05). The largest negative coefficient was observed for mean annual temperature (T_avg) in South-East (r = −0.749,
p < 0.001), while annual precipitation in South-East showed the weakest association (r = −0.039,
p = 0.875). The heatmap in
Figure 5 summarizes this pattern: temperature coefficients are predominantly negative, whereas the precipitation coefficients are small and non-significant.
4.3. Multiple Linear Regression Analysis
For each region, alfalfa yield was regressed simultaneously on T_avg, T_max, T_min, Rain_total, and Rain_24h. The South-Muntenia model was statistically significant (F = 4.689, p = 0.011), explaining 64.3% of the observed variation in alfalfa yield (R2 = 0.643; adjusted R2 = 0.506). Among the five climatic predictors, T_max was the only statistically significant predictor (B = −0.958, SE = 0.320, p = 0.010). The coefficients for T_avg, T_min, Rain_total, and Rain_24h were not statistically significant.
The South-East model was also statistically significant (F = 6.205,
p = 0.004), explaining 70.5% of yield variation (R
2 = 0.705; adjusted R
2 = 0.591). T_avg was the only statistically significant individual predictor (B = −4.430, SE = 1.223,
p = 0.003), while T_max, T_min, Rain_total and Rain_24h were not significant. The North-East regression model showed the highest explanatory capacity (F = 14.901,
p < 0.001), with R
2 = 0.851 and adjusted R
2 = 0.794. Significant coefficients were obtained for T_avg (B = −2.217, SE = 0.813,
p = 0.017), T_min (B = −0.395, SE = 0.108,
p = 0.003), Rain_total (B = −0.021, SE = 0.006,
p = 0.003), and Rain_24h (B = 0.608, SE = 0.157,
p = 0.002). T_max was not statistically significant (
p = 0.187) (
Table 5).
Table 5.
Multiple linear regression analysis of climatic variables associated with alfalfa yield in the Romanian development regions (2006–2024).
Table 5.
Multiple linear regression analysis of climatic variables associated with alfalfa yield in the Romanian development regions (2006–2024).
| Region | Predictor | B | SE | p-Value | R2 | Adjusted R2 |
|---|
| South-Muntenia | T_avg | −1.320 | 0.857 | 0.147 | 0.643 | 0.506 |
| | T_max | −0.958 | 0.320 | 0.010 | | |
| | T_min | 0.027 | 0.176 | 0.880 | | |
| | Rain_total | −0.004 | 0.007 | 0.519 | | |
| | Rain_24h | 0.114 | 0.220 | 0.614 | | |
| South-East | T_avg | −4.430 | 1.223 | 0.003 | 0.705 | 0.591 |
| | T_max | 0.129 | 0.406 | 0.755 | | |
| | T_min | 0.310 | 0.204 | 0.152 | | |
| | Rain_total | 0.003 | 0.010 | 0.806 | | |
| | Rain_24h | −0.289 | 0.271 | 0.306 | | |
| North-East | T_avg | −2.217 | 0.813 | 0.017 | 0.851 | 0.794 |
| | T_max | −0.324 | 0.233 | 0.187 | | |
| | T_min | −0.395 | 0.108 | 0.003 | | |
| | Rain_total | −0.021 | 0.006 | 0.003 | | |
| | Rain_24h | 0.608 | 0.157 | 0.002 | | |
4.4. Regression Diagnostics
Diagnostic results are reported in
Table 6. Shapiro–Wilk tests did not detect significant departures from residual normality in South-Muntenia (W = 0.933,
p = 0.198), South-East (W = 0.985,
p = 0.983), or North-East (W = 0.944,
p = 0.309). Breusch–Pagan tests were also non-significant in South-Muntenia (
p = 0.562), South-East (
p = 0.052), and North-East (
p = 0.183), although the South-East value was close to the 0.05 threshold. Durbin–Watson statistics were 1.697, 1.498, and 1.386, respectively. VIFs ranged from 1.58 to 4.51 in South-Muntenia and from 2.26 to 3.22 in North-East. South-East had higher VIFs for Rain_total (8.05), Rain_24h (7.13), T_avg (4.62), and T_min (4.29). These were considered when interpreting the regression coefficients.
4.5. Alfalfa Yield Performance and Stability
The descriptive analysis of alfalfa yield showed differences in the average productivity between the three regions in 2006–2024. The highest average yield was registered in North-East (14.85 t ha−1), followed by South-East (13.85 t ha−1) and South-Muntenia (13.23 t ha−1). The values of the standard deviation varied between 2.77 and 3.23 t ha−1 in the three regions. The lowest coefficient of variation was registered in South-East (0.200), followed by South-Muntenia (0.209) and North-East (0.218). Thus, the three regions exhibited relatively similar levels of interannual yield variability. The 95% confidence intervals for mean yield overlapped among regions.
4.6. Alfalfa Climate Resilience Index (ACRI)
Under the equal-weight formulation, the ACRI scores differed among the three regional alfalfa production systems. Within the three-region reference dataset, North-East obtained the highest ACRI score (0.760), followed by South-Muntenia (0.469) and South-East (0.295) (
Table 7). These values represent relative, dataset-dependent comparisons and should not be interpreted as absolute measures of intrinsic alfalfa resilience.
The component structure underlying the ACRI scores differed among regions. North-East had the highest normalized mean yield component (Yn = 1.000) and the highest inverse normalized mean annual temperature component (1 − Tn = 1.000), whereas its normalized annual precipitation component was 0.259. South-Muntenia had the highest normalized precipitation component (Pn = 1.000) but the lowest normalized mean yield component (Yn = 0.000). The South-East region had an intermediate normalized mean yield component (Yn = 0.381), but it recorded the lowest normalized precipitation (Pn = 0.000) and inverse normalized mean annual temperature (1 − Tn = 0.000) components. The yield-stability component varied comparatively little among regions, ranging from 0.782 to 0.800. These values correspond to the components used in the calculation of the baseline ACRI. Importantly, Yn and S represent production-performance components, whereas Pn and (1 − Tn) represent climatic-context components. Therefore, the higher ACRI score obtained for North-East (
Figure 6) reflects the combined position of its observed production performance and climatic context relative to the other two regions included in the reference dataset. It does not indicate greater intrinsic physiological resilience of alfalfa plants, cultivars, or genotypes.
Figure 6.
Relative Alfalfa Climate Resilience Index (ACRI) scores for the three Romanian development regions during 2006–2024. ACRI values represent within-dataset comparisons of regional alfalfa production systems and are not absolute measures of intrinsic crop resilience.
Figure 6.
Relative Alfalfa Climate Resilience Index (ACRI) scores for the three Romanian development regions during 2006–2024. ACRI values represent within-dataset comparisons of regional alfalfa production systems and are not absolute measures of intrinsic crop resilience.
The regional comparison showed distinct combinations of production-performance and climatic-context components. Within the three-region reference dataset, North-East obtained the highest relative ACRI score under both the baseline formulation and all alternative weighting scenarios, South-Muntenia occupied the intermediate position, and South-East obtained the lowest relative score. The regional ordering was therefore stable across the weighting scenarios evaluated.
4.7. ACRI Sensitivity Analysis and Regional Comparison
The sensitivity analysis evaluated whether the regional ordering obtained with the baseline ACRI depended strongly on the assumed equal weighting of its four components. In addition to the baseline weighting scheme (0.25/0.25/0.25/0.25), four alternative scenarios assigned a weight of 0.40 to one component and 0.20 to each of the remaining three components.
The alternative weighting schemes changed the ACRI scores but did not alter the regional ordering. North-East retained the highest relative ACRI score under all five scenarios, South-Muntenia remained in the intermediate position, and South-East consistently had the lowest relative score. Under the recalculated weighting scenarios, North-East ranged from 0.660 to 0.808, South-Muntenia from 0.375 to 0.575, and South-East from 0.236 to 0.396.
The unchanged ordering, North-East > South-Muntenia > South-East, indicates that the within-dataset regional ranking was internally robust to the moderate weighting changes examined. However, this result refers only to weighting sensitivity within the present three-region reference dataset and should not be interpreted as external validation of ACRI. The component profiles also differed among regions. North-East combined the highest normalized mean yield (Yn) with the highest inverse normalized mean annual temperature component (1 − Tn). South-Muntenia had the highest normalized annual precipitation component (Pn), whereas South-East had the highest yield-stability component (S) but the lowest Pn and (1 − Tn) values (
Table 8). Thus, the regional ordering resulted from the combined contribution of production-performance and climatic-context components rather than from any single indicator.
Table 8.
Sensitivity of relative ACRI scores and regional rankings to alternative component-weighting scenarios.
Table 8.
Sensitivity of relative ACRI scores and regional rankings to alternative component-weighting scenarios.
| Scenario | Yn | S | Pn | 1 − Tn | North-East | South-Muntenia | South-East | Ranking |
|---|
| Equal weights | 0.25 | 0.25 | 0.25 | 0.25 | 0.760 | 0.469 | 0.295 | NE > SM > SE |
| Yield-dominant | 0.40 | 0.20 | 0.20 | 0.20 | 0.808 | 0.375 | 0.312 | NE > SM > SE |
| Stability-dominant | 0.20 | 0.40 | 0.20 | 0.20 | 0.765 | 0.533 | 0.396 | NE > SM > SE |
| Precipitation-dominant | 0.20 | 0.20 | 0.40 | 0.20 | 0.660 | 0.575 | 0.236 | NE > SM > SE |
| Temperature-dominant | 0.20 | 0.20 | 0.20 | 0.40 | 0.808 | 0.392 | 0.236 | NE > SM > SE |
This result refers specifically to the weighting sensitivity of the index within the three-region dataset and does not constitute external validation of ACRI.
5. Discussion
5.1. Climate Trends in Relation to Previous Studies
A clear warning signal was detected in all three regions during 2006–2024. Sen’s slopes ranged from +0.071 °C/year in South-East to +0.100 °C/year in North-East, and all three Kendall tests were statistically significant. This regional pattern is consistent with broader evidence of ongoing climate warming and increasing climate-related risks reported by the IPCC [
1] and the European Environment Agency [
51]. European agricultural systems are increasingly exposed to adverse weather associated with climate change [
52], while changes in temperature and water availability have long been recognized as important determinants of European agricultural productivity and adaptation requirements [
53].
Annual precipitation followed a different pattern. Although Sen’s slopes were negative in all regions (−0.964 to −3.112 mm year−1), none was statistically significant. The data therefore support strong interannual variability but not a monotonic decline in annual precipitation over the study period. For alfalfa, annual totals are only one part of crop water supply; rainfall timing, soil-water storage, and evaporative demand can alter the amount of water available during regrowth and biomass accumulation.
The regional means also show that climatic exposure was not uniform. South-East combined the highest mean annual temperature (T_avg) with the lowest mean annual precipitation; North-East was cooler, and South-Muntenia received the highest mean annual precipitation. These contrasts illustrate why a single national climate–yield relationship could mask important regional differences.
Even without a significant trend in annual precipitation, water availability remained important. Ni et al. [
22] showed that precipitation variability can alter soil-water balance in alfalfa-based systems, illustrating why annual totals may not fully capture the timing and persistence of water limitation. This interpretation is also consistent with evidence showing that alfalfa productivity and water-use efficiency depend on the interaction between water availability, evapotranspiration, irrigation, and management [
31,
32,
33,
34,
35,
36,
37,
38,
39,
40,
41,
42,
43,
44,
45]. In the present dataset, however, the stronger statistical signal came from temperature, whereas precipitation was characterized mainly by year-to-year variability.
5.2. Climate Change Effects on Alfalfa Productivity
Yield in 2024 was lower than in 2006 in each region, but the endpoint comparison should not be treated as equivalent to a significant long-term trend. Sen’s slopes were negative in South-Muntenia (−0.238 t ha−1 year−1), South-East (−0.283 t ha−1 year−1), and North-East (−0.571 t ha−1 year−1). However, Kendall’s test identified a significant decline only in North-East (τ = −0.794, p < 0.001); the South-Muntenia and South-East trends were not significant (both p = 0.115). Thus, the data support a downward tendency in all regions but statistical evidence of a monotonic decline only in North-East.
The bivariate results point more consistently to temperature than to precipitation. Mean annual temperature (T_avg) was negatively correlated with yield in all three regions (r = −0.617 to −0.749). Maximum temperature was significant in South-Muntenia and South-East, whereas minimum temperature was significant in North-East. By comparison, annual precipitation and maximum 24 h precipitation were not significantly correlated with yield.
These associations indicate a stronger relationship between thermal conditions and interannual yield variation than the precipitation indicators included in this analysis. However, they should not be read as direct causal effects. Yield is also influenced by evapotranspiration, rainfall timing, soil-water storage, soil properties, cultivar choice, cutting regime, and other management factors that were not represented in the dataset. The direction of the temperature relationships is consistent with experimental evidence showing that heat and water stress can restrict alfalfa growth and productivity. Water deficit impacts plant water relations, stomatal regulation, photosynthesis, metabolism, antioxidant activity, and biomass accumulation [
9,
10,
11,
12,
13,
14,
15,
16,
17], and molecular studies confirm the involvement of ABA signaling and other stress-response pathways [
18,
19,
20,
21]. Similarly, heat stress can reduce growth and photosynthetic performance in alfalfa [
23,
24,
25]. In Romania, Naie et al. [
26] reported the effects of water deficit and air temperature on alfalfa, while Petcu et al. [
16] showed physiological differences among alfalfa genotypes exposed to drought. These studies provide plausible physiological and agronomic context for the statistical associations observed in the present study, although these mechanisms were not measured directly in our analysis.
The multivariable models further showed that the climatic associations were region-specific. They explained 64.3% of yield variation in South-Muntenia (R2 = 0.643; adjusted R2 = 0.506), 70.5% in South-East (R2 = 0.705; adjusted R2 = 0.591), and 85.1% in North-East (R2 = 0.851; adjusted R2 = 0.794). T_max was the only significant predictor in South-Muntenia, T_avg was the only significant predictor in South-East, and T_avg, T_min, Rain_total, and Rain_24h were significant in North-East.
The diagnostic tests qualify the interpretation of these coefficients. Residual normality and homoscedasticity tests were non-significant in all three models, but multicollinearity was more pronounced in South-East, where VIF reached 8.05 for Rain_total and 7.13 for Rain_24h. Individual coefficients in that model should therefore be interpreted cautiously because correlated predictors can make coefficient estimates unstable even when the overall model is informative.
The North-East model also illustrates why bivariate and multivariable results need not agree. Rain_total and Rain_24h were not significant in the Pearson analysis, yet their coefficients were significant after the other climatic variables were controlled. Such conditional coefficients can reflect shared variation among predictors and should not be interpreted as evidence that greater annual rainfall itself reduces yield. Given the small sample size and correlations among climatic predictors, these conditional coefficients should be regarded as model-specific associations rather than independent causal effects. The comparatively strong climate–yield relationships observed for the North-East should be interpreted with additional caution because the climatic series for this region was represented by the Iași station alone. Consequently, these results characterize associations with the available climatic proxy and should not be generalized to the full spatial climatic variability of the North-East development region.
5.3. Regional Production-System Climate Resilience, ACRI and Adaptation
The ACRI-based assessment differentiated the relative climate-resilience profiles of the three regional alfalfa production systems within the study dataset. Under the baseline equal-weight formulation, North-East obtained the highest ACRI value (0.760), followed by South-Muntenia (0.469) and South-East (0.295). This ranking resulted from the combined contribution of two production-performance components, normalized mean yield (Yn) and yield stability (S), and two climatic-context components, normalized annual precipitation (Pn) and inverse normalized mean annual temperature (1 − Tn). An important distinction concerns the interpretation of these scores. ACRI does not measure the intrinsic physiological resilience of Medicago sativa L. or of individual cultivars or genotypes. Because the index combines observed production performance with climatic-context variables, a higher ACRI value cannot be attributed exclusively to the greater biological resilience of the crop. Instead, it reflects the relative position of each regional production system according to the four components included in the index and within the common three-region reference dataset. In particular, Pn represents relative annual water-input context within the reference dataset and does not imply that increasing annual precipitation necessarily produces a proportional improvement in alfalfa yield or resilience.
This distinction is particularly relevant for North-East. Although this region obtained the highest ACRI value, it also showed the only statistically significant monotonic decline in alfalfa yield during 2006–2024. Its first-place ACRI ranking, therefore, does not indicate an absence of climate-related production risk or demonstrate greater intrinsic physiological tolerance of alfalfa. Rather, North-East combined the highest normalized mean yield with the highest inverse normalized mean annual temperature component, together with the other performance and climatic-context components included in the index.
Management practices provide an additional source of variation that must be considered when interpreting ACRI. Irrigation, fertilization, cultivar selection, cutting regime, soil management, and other agronomic interventions can modify the extent to which climatic conditions are translated into yield and interannual yield stability. This interpretation is supported by studies demonstrating substantial effects of irrigation strategies, water availability, cultivar selection, and management on alfalfa productivity and water-use efficiency [
30,
31,
32,
33,
34,
35,
36,
37,
38,
39,
40,
41,
42,
43,
44,
45]. Because consistent regional information on these factors was not available for the complete 2006–2024 period, their independent contributions could not be quantified.
The sensitivity analysis showed that changing the component weights altered the ACRI values but not the regional ordering. When one component at a time was assigned a weight of 0.40, and the remaining components were assigned weights of 0.20, the order North-East > South-Muntenia > South-East persisted under all four alternative scenarios.
This result indicates that the within-dataset regional ranking was internally robust to the moderate weighting changes examined.
However, weighting robustness should not be interpreted as external validation of ACRI. Min–max normalization was based exclusively on the three regions included in this study, making the normalized components and resulting ACRI scores dependent on the reference dataset. Inclusion of additional regions or production systems could alter the normalization bounds and consequently change both component values and final ACRI scores. For the same reason, ACRI values obtained from independently normalized datasets, experiments, or cultivar groups should not be compared directly unless common reference bounds are used.
The yield-stability component also requires consideration when extending ACRI to other datasets. In the present study, CV ranged from 0.200 to 0.218 and the corresponding S values from 0.782 to 0.800, indicating a narrow range of interannual yield variability among the three regions. However, because S = 1 − CV is not mathematically constrained to remain within [0, 1] when CV exceeds 1, future applications involving substantially greater yield variability should consider a bounded normalization or an alternative transformation of the stability component.
A stronger evaluation of ACRI will therefore require larger reference datasets, including additional Romanian and, where appropriate, European alfalfa-growing regions, together with common or externally defined normalization bounds and alternative weighting approaches. Incorporating seasonal precipitation, evapotranspiration, soil moisture, drought indices, soil properties, cultivar information, irrigation, and other management variables would also allow climatic context and production-system performance to be characterized more comprehensively.
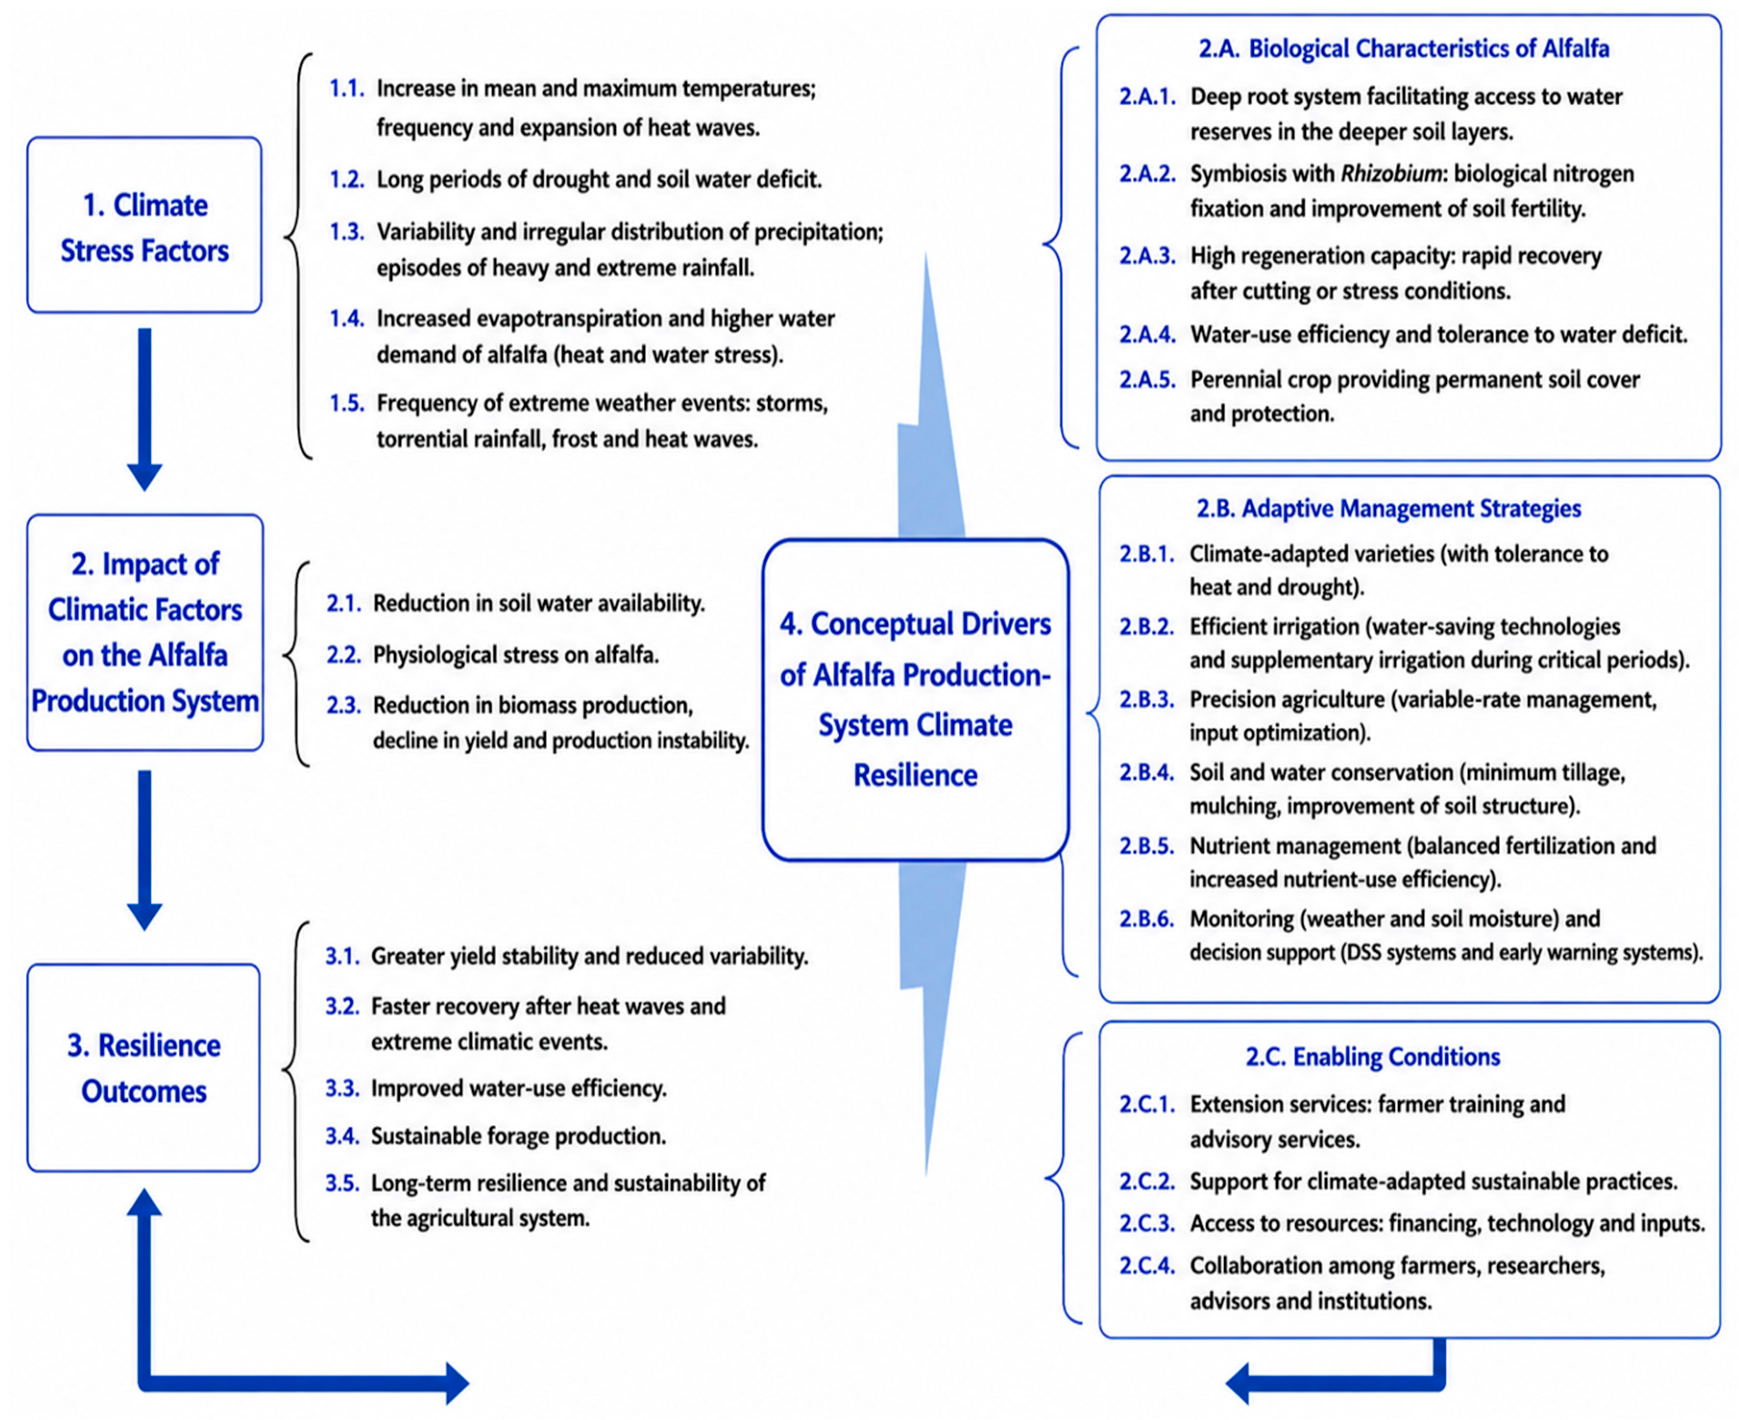
Figure 7 places the quantitative analyses within a broader conceptual framework linking climatic stressors, crop-related resilience attributes, adaptive management, and enabling conditions. The relationships represented by the arrows are conceptual rather than statistically estimated causal pathways and should therefore not be interpreted as effects demonstrated by the present dataset. Their empirical evaluation would require additional variables and analytical designs beyond those used in this study.
This interpretation is consistent with broader views of agricultural resilience, in which resilience emerges from interactions among crop characteristics, environmental conditions, resource availability, management, and the capacity of production systems to adapt to climate stress. Sustainable intensification and knowledge transfer have been identified as relevant pathways for strengthening the climate resilience of forage ecosystems [
54]. At the broader agricultural-system level, agroecological approaches emphasizing biodiversity and ecosystem functioning may also contribute to adaptation under the current climate emergency [
55]. These perspectives support the production-system interpretation adopted here, while ACRI remains an exploratory framework developed specifically for relative comparison among the regional alfalfa production systems included in the present dataset.
5.4. Implications for Sustainable Forage Production and Agricultural Policy
The regional results indicate different potential adaptation priorities:
The South-East region was characterized by a relatively high mean annual temperature, low annual precipitation, and the lowest value of relative ACRI among the three regions in the reference dataset. This profile suggests a relatively unfavorable combination of the production-performance and climate-context components included in ACRI, rather than the intrinsically lower biological resilience of alfalfa in this region. Among possible adaptation measures in light of the observed climatic conditions are improved water-use efficiency, efficient irrigation where feasible, soil-water conservation, drought- and heat-tolerant cultivars, and improved agroclimatic monitoring.
The South-Muntenia region was in the middle of the ACRI-based comparison and had the highest mean annual precipitation of the three regions, while maximum temperature was significantly associated with yield. These findings suggest that adaptation strategies in this region should consider both water management and measures aimed at reducing production vulnerability under high-temperature conditions.
The North-East region obtained the highest relative ACRI value within the three-region reference dataset but also showed the only statistically significant monotonic decline in alfalfa yield during 2006–2024. Its higher ACRI value should therefore not be interpreted as evidence of intrinsic crop resilience or an absence of climate-related production risk. Rather, it reflects the combined production-performance and climatic-context components included in the index. Continued climatic monitoring and preventive adaptation measures therefore remain relevant for this region.
From an agricultural-policy perspective, these regional contrasts support differentiated rather than uniform adaptation strategies. Depending on regional needs and local feasibility, policy support could include improvements in water-management infrastructure, access to drought- and heat-tolerant cultivars, precision-irrigation technologies, strengthened regional monitoring and early-warning systems, and advisory services that translate climatic information into farm-level management decisions. The relevance of irrigation efficiency, deficit irrigation, water-productivity management, and cultivar-specific responses is supported by extensive alfalfa-specific evidence [
30,
31,
32,
33,
34,
35,
36,
37,
38,
39,
40,
41,
42,
43,
44,
45], while sustainable intensification and knowledge transfer may contribute to broader forage-system climate resilience [
54].
These measures represent implications derived from the observed regional patterns and supporting literature rather than interventions evaluated directly in the present study. Their effectiveness under Romanian conditions should therefore be assessed in relation to local agronomic, economic, management, and environmental conditions before specific implementation recommendations are made.
5.5. Study Limitations
This study has several limitations. First, the analysis was based on 19 annual observations per region, which limits statistical power and requires cautious interpretation of the multiple regression coefficients. Second, the INSSE records available to the authors did not explicitly indicate whether total alfalfa production was reported as green mass or dry matter. No conversion between these reporting bases was therefore performed, and this uncertainty may limit direct comparisons with studies that explicitly report alfalfa yield on a dry-matter or green-mass basis. Third, the climatic data consisted of station-based point observations rather than gridded data and therefore did not have a conventional spatial resolution. The ANM records available to the authors identified the stations by name but did not include official station identification codes or a separate published dataset name. Moreover, the climatic series were derived from a limited number of ANM stations and therefore represent regional climatic proxies rather than spatially exhaustive climatic conditions. This limitation is particularly relevant for North-East, which was represented by the Iași station alone. Fourth, the annual climatic indicators do not capture seasonal rainfall distribution, evapotranspiration, soil moisture, or drought intensity. Finally, consistent regional data on soil properties, cultivars, irrigation, cutting regimes, and other management factors were unavailable. ACRI is also dataset-dependent because its normalization was based on only three regions and should therefore be considered an exploratory comparative index rather than an externally validated measure of climate resilience.
6. Conclusions
Across the three Romanian development regions, mean annual temperature increased significantly during 2006–2024 (Sen’s slopes: +0.071 to +0.100 °C/year), whereas annual precipitation showed no statistically significant monotonic trend. Alfalfa yield declined in all three regions, although the decrease was statistically significant only in the North-East (τ = −0.794, p < 0.001). Mean annual temperature was consistently and negatively associated with yield, while annual precipitation and maximum 24 h precipitation showed no significant bivariate relationships. The regional regression models explained 64.3–85.1% of yield variation, indicating that the climatic drivers of alfalfa productivity are region-specific. However, the individual regression coefficients for South-East should be interpreted cautiously because of multicollinearity.
The ACRI assessment produced a consistent within-dataset ranking of North-East (0.760), South-Muntenia (0.469), and South-East (0.295), which remained unchanged under the alternative weighting scenarios. By integrating yield, yield stability, precipitation, and temperature, ACRI provides a comparative assessment of regional production performance under contrasting climatic conditions. Nevertheless, the index is dataset-dependent and should be interpreted with caution as a measure of physiological crop resilience, particularly because management practices, cultivar composition, and soil characteristics were not included.
Overall, warming represents a common pressure across the three regions, while its relationship with alfalfa productivity varies regionally. Broader application of ACRI requires validation using longer and more spatially extensive datasets, common normalization bounds, and additional seasonal climatic, water-balance, soil, cultivar, and management variables.