Article

Long-Term Green Manure Incorporation with Reduced Chemical Fertilizer Enhances Soil Quality and Rice Yield by Altering Soil Microbial Communities’ Structure and Functions in Paddy Soils

1
Institute of Plant Nutrition, Resources and Environment, Henan Academy of Agricultural Sciences, Zhengzhou 450002, China
2
Henan Key Laboratory of Agricultural Resources and Environment, Zhengzhou 450002, China
3
Institute of Plant Nutrition, Resources and Environment, Xinyang Academy of Agricultural Sciences, Xinyang 464000, China
4
Institute of Agricultural Resources and Regional Planning, Chinese Academy of Agricultural Sciences, Beijing 100081, China
*
Author to whom correspondence should be addressed.
Agriculture 2026, 16(15), 1670; https://doi.org/10.3390/agriculture16151670
Submission received: 17 June 2026 / Revised: 26 July 2026 / Accepted: 29 July 2026 / Published: 3 August 2026

Abstract

Excessive use of chemical fertilizers degrades soil health and threatens sustainable crop production, which can be mitigated by partially substituting chemical fertilizers with Chinese milk vetch (Astragalus sinicus L., MV, as green manure). However, the mechanisms through which MV incorporation alters soil microbial community structure and function, enhances soil quality and crop productivity, as well as its long-term effects in paddy soils, are still not fully understood. In this study, we investigated the responses of soil physical, chemical, and biological properties (to comprehensively evaluate soil quality); microbial community structure and function; rice productivity; and the sustainable yield index (SYI) to five fertilizer treatments based on a 13-year field experiment in a paddy’s soil in Henan, China. The treatments included: CK (no chemical fertilizer and no MV), F100 (100% chemical fertilizer), MVF80, MVF60 and MVF40 (80%, 60%, and 40% of the chemical fertilizer rate combined with MV, respectively). Compared with the F100 treatment, MVF60 slightly increased rice yield by 1.71% and significantly improved SYI by 5.10%. All MV treatments significantly increased soil organic carbon (SOC, by 14.4–16.3%) and microbial biomass carbon (MBC, by 16.7–20.1%). MVF60 and MVF40 significantly reduced bulk density, and increased macroaggregate content and mean weight diameter (MWD). MVF80 significantly enriched soil total phosphorus (TP), total potassium (TK), mineral nitrogen (Nmin), and urease (UE). The improvement in these soil properties resulted in a marked increase (by 11.6–20.1%) in the soil quality index (SQI) under all MV treatments. Random forest analysis identified MBC and Nmin as the most important predictors of SQI. Moreover, MV incorporation increased the relative abundance of beneficial taxa (Firmicutes, Clostridium_sensu_stricto_1, Bradyrhizobium, and Nigrospora), which were positively correlated with SQI (p < 0.05), while reducing the relative abundance of pathogenic fungal genera such as Fusarium. Furthermore, regression analysis revealed strong positive correlations between SQI and both rice yield and SYI. In summary, long-term MV incorporation with a 40% reduction in chemical fertilizer (MVF60) constitutes an effective and sustainable nutrient management approach for rice production in southern China. This practice enhances soil quality through improved physical structure, nutrient cycling, and microbial community structure and function, ultimately resulting in higher and more stable yields.

1. Introduction

By 2050, the global population is expected to reach between 9 and 11 billion, and food demand is anticipated to increase by 70% [1,2]. To meet this growing demand on limited arable land, it is urgent to enhance cultivated land productivity [3]. Over the past few decades, reliance on excessive chemical fertilizers and intensive agricultural practices has increased food production but at a high environmental cost, including soil quality decline and greenhouse gas emissions [4,5]. These factors, in turn, have constrained agricultural production [6]. Therefore, developing sustainable alternative strategies is critical for maintaining and enhancing crop yields while preserving soil health and resilience.
The combined application of organic and inorganic fertilizers is a sustainable agricultural practice. It not only mitigates the loss of soil fertility and biodiversity associated with long-term chemical fertilizer application but also enhances overall soil quality [7,8]. Green manure, particularly Chinese milk vetch, is a clean organic fertilizer that can promote nutrient cycling and organic matter accumulation through biological nitrogen fixation by symbiotic rhizobia, thereby improving soil quality [9,10]. Previous reports based on data from eight provinces in southern China have shown that the combination of leguminous green manure with 60% chemical fertilizer can achieve the same rice yield as chemical fertilizer alone, while improving fertilizer use efficiency and reducing carbon and nitrogen footprints [11]. Furthermore, the combination of green manure and chemical fertilizer alters soil properties, such as soil organic matter and other physicochemical indicators. Some studies have indicated that substituting 20–40% of chemical fertilizer with green manure enhances the content of various nitrogen and phosphorus components as well as soil organic matter accumulation [12]. Moreover, replacing 20% of chemical nitrogen fertilizer significantly increased soil organic carbon storage while effectively maintaining crop yield [13]. Previous studies have also found that reduced mineral fertilization (NPK) combined with green manure improves soil macroaggregation and increased aggregate stability [14]. A six-year field experiment at a fixed site found that green manure incorporation combined with a 15% nitrogen reduction enhanced soil urease activity while simultaneously inhibiting nitrate and nitrite reductase activities, thereby reducing gaseous nitrogen loss [15].
Soil quality needs to be comprehensively evaluated by integrating physicochemical and biochemical properties to evaluate soil quality [16]. The soil quality index (SQI) has been used in several studies to assess the long-term effects of green manure combined with reduced chemical fertilizer on soil quality. In a double-rice cropping system, the substitution of 40% of chemical fertilizer with leguminous green manure in the early rice season, and 20% in the late rice season, resulted in a significant improvement in the SQI [17]. A 12-year experiment found that substituting 60% of chemical fertilizer with the leguminous green manure still significantly improved SQI [18]. However, these studies evaluated soil quality using only chemical indicators (e.g., organic matter and total nitrogen), while neglecting physical (e.g., bulk density, aggregate) and biological (e.g., soil enzyme activities) indicators, making it difficult to fully capture the overall impact of green manure incorporation with reduced chemical fertilizer on soil quality.
Soil microorganisms are crucial for soil quality and crop production, being closely related to soil structure, organic matter, nutrient availability, and biological activity [19]. Prolonged use of chemical fertilizers can lead to a decline in soil microbial diversity, thereby interfering with nutrient cycling and increasing nutrient loss [20,21]. Green manure crops can enhance soil nutrient availability and promote the proliferation of beneficial microorganisms, thereby improving soil ecological functions throughout their growth and decomposition phases [22]. Previous studies have found that planting green manure increases the relative abundance of Actinobacteria, while reducing the relative abundance of Chloroflexia and Acidobacteria for a low fertility farmland system [23]. Based on a 7-year potato cropping field experiment, green manure significantly enriches key microbial groups closely related to soil nutrient cycling and plant growth promotion, including bacterial groups such as Xanthomonadaceae, Rhizobiaceae, and Sphingomonasceae [24]. Several studies have further demonstrated that leguminous green manure can promote the enrichment of beneficial taxa such as Proteobacteria while suppressing Acidobacteria, thereby strengthening the stability of bacterial communities in the rice rhizosphere [18]. Although extensive research has confirmed that planting and utilizing green manure alters microbial communities, more attention has been paid to bacterial communities, while research on fungal communities remains extremely scarce. Bacteria and fungi play different but complementary roles in soil organic matter decomposition, nutrient cycling, and ecosystem stability. Bacteria are more efficient in ingesting simple organic compounds as substrates, whereas fungi are more efficient at decomposing complex compounds [25]. Therefore, under long-term green manure incorporation with reduced chemical fertilizer, it is necessary to simultaneously examine the diversity, composition, and functional characteristics of both bacterial and fungal communities, as well as their correlations with multi-attribute soil quality indicators. Currently, research in this area is lacking.
Therefore, this study aims to investigate the effects of incorporating equal amounts of leguminous green manure (Chinese milk vetch, MV) and reducing chemical fertilizer application on soil physicochemical and microbial properties, as well as rice yield through a 13-year field experiment of MV–rice rotation. The objectives of this study are to: (1) comprehensively evaluate the impact of green manure combined with chemical fertilizers on soil quality, rice yield, and yield sustainability; (2) analyze the differential responses of soil bacterial and fungal community structure and function to long-term MV application with reduced chemical fertilizer; and (3) determine the optimal proportion of fertilizer reduction under MV incorporation in paddy soil, thereby providing guidance for regional sustainable agricultural production.

2. Materials and Methods

2.1. Experimental Site Description

A long-term field experiment was conducted at the Xinyang Academy of Agricultural Sciences Experimental Park (32°07′ N, 114°05′ E) in southern Henan Province, China. This site is located on the northern edge of the subtropical humid zone, in the transitional zone between subtropical and warm temperate climate. The average annual temperature and rainfall are 15.1 °C and 1149.7 mm, respectively. The air is humid, with an annual average relative humidity of 75–80%. The soil is classified as yellow-brown gley paddy soil. In the top 20 cm soil profile, the pH was 6.91 (1:2.5 soil/water), soil organic carbon (SOC) was 12.5 g kg−1, total nitrogen (TN) was 1.37 g kg−1, alkali solution nitrogen was 82.1 mg kg−1, available phosphorus (AP) was 7.78 mg kg−1, and available potassium (AK) was 85.8 mg kg−1.

2.2. Experiment Design and Field Management

A 13-year field experiment was conducted from 2008 to 2020, with five treatments arranged in a randomized complete block design with four replicates: (1) CK, a control with winter fallow and no chemical fertilizers; (2) F100, winter fallow with 100% of the recommended chemical fertilizers (165 kg N ha−1, 112.5 kg P2O5 ha−1, 112.5 kg K2O ha−1); (3) MVF80, 22.5 Mg ha−1 fresh Chinese milk vetch (MV) with 80% of the recommended N and K fertilizers; (4) MVF60, 22.5 Mg ha−1 fresh MV with 60% of the recommended N and K fertilizers; and (5) MVF40, 22.5 Mg ha−1 fresh MV with 40% of the recommended N and K fertilizers. In our experimental design, each plot had an area of 6.67 m2 (3.33 m × 2.0 m), each plot was separated by field ridges (30 cm wide and 25 cm high), and each ridge was covered with black plastic film. In addition, each plot was equipped with independent water inlets and drainage channels to prevent cross contamination of water and nutrients between adjacent plots. The N, P, and K fertilizers used in the experiment were urea (46% N), calcium superphosphate (12% P2O5), and potassium chloride (60% K2O), respectively. The amount of P fertilizer applied in the fertilizer reduction treatments was the same as that applied in the F100 treatment. For all treatments, 50% of N and K fertilizers and 100% P fertilizer were applied as basal fertilizers one day before rice transplanting. An additional 30% N fertilizer was applied during the rice tillering stage, and the remaining 20% N and 50% K fertilizers were applied during the booting stage.
The MV (cv. ‘Xinzi 1’) was directly sown after rice harvest at a rate of 37.5 kg ha−1, and was harvested and weighed annually at the full-bloom stage (30 days before rice transplanting). A total of 15.0 kg (equivalent to 22.5 Mg ha−1) of fresh MV was incorporated into each plot, except for the CK and F100 treatments. The fresh MV had a water content of approximately 90%, and the concentrations of N, P, and K in oven-dried MV were 3.75, 0.34, and 3.50%, respectively. The average annual input of nitrogen, phosphorus, and potassium for each treatment is shown in Table S1. The rice variety in this experiment was “Long Jing You Ti Zhan”. Seeds were sown in late April, transplanted in late May, and harvested in late September during every year. Rice seedlings were manually transplanted at a spacing of 16.7 cm × 20 cm, with two seedlings per hill. At maturity, all rice plants in each plot were manually harvested for yield determination. Field crop management (e.g., irrigation, pest and disease control) followed the recommendations of the local agricultural technology department.

2.3. Soil Sampling and Soil Properties Analysis

After rice harvest in September 2020, soil samples were collected from each plot. Five soil cores (0–20 cm depth) were randomly collected from each plot and mixed to form one composite sample. Each composite sample was divided into two categories: fresh soil samples and air-dried samples. A portion of the fresh soil samples was stored at 4 °C for analysis of mineral nitrogen (Nmin), microbial biomass carbon (MBC), microbial biomass nitrogen (MBN), and enzyme activities, while another portion was stored at −80 °C for microbial community analysis. Air-dried soil samples [26] were ground and passed through a 2 mm sieve for determination of cation exchange capacity (CEC), passed through a 1 mm sieve for determination of AP and AK, and passed through a 0.15 mm sieve for determination of SOC, TN, total phosphorus (TP), and total potassium (TK) concentrations.
Soil bulk density (BD) was determined by the core method. Soil aggregate stability was assessed by the wet-sieving method and expressed as mean weight diameter (MWD) [27]. Briefly, air-dried soil samples (50 g) were placed on a set of sieves with mesh sizes of 2 mm and 0.25 mm and pre-wetted by capillary action for 10 min. The sieves were then oscillated vertically in water for 30 min at 30 oscillations per minute. Aggregates retained on each sieve were collected, oven-dried at 60 °C and weighed. Three aggregate size fractions were obtained: large macroaggregates (>2 mm), small macroaggregates (0.25–2 mm), and microaggregates (<0.25 mm).
SOC and TN concentrations were determined using a vario MACRO elemental analyzer (Elementar, Langenselbold, Germany). Total P (TP) was determined by H2SO4–HClO4 digestion followed by molybdenum antimony anti-colorimetry, and total K (TK) was determined by the NaOH melting method. The Nmin was extracted with 2 M KCl solution (soil:extractant = 1:10, w/v) and determined by a continuous flow autoanalyzer (AA3, SEAL Analytical, Hanover, Germany). AP was extracted with 0.5 mol L−1 NaHCO3, and the AK was extracted with 1 mol L−1 ammonium molybdate and analyzed by flame photometry. CEC was determined by the NH4OAc exchange method [28,29].
Urease activity (UE) was measured by the indophenol blue colorimetric method. Acid phosphatase activity (ACP) was determined using disodium phenyl phosphate as substrate. Sucrase activity (SC) was assayed by the 3,5-dinitrosalicylic acid (DNS) method. Catalase activity (CAT) was determined by permanganate titration [30]. Microbial biomass carbon (MBC) and microbial biomass nitrogen (MBN) were determined by the chloroform fumigation-–extraction method [31].

2.4. DNA Extraction, PCR Amplification, and MiSeq Sequencing of the Soil

Total DNA was extracted from soil samples using the E.Z.N.A.® Soil DNA Kit (Omega Bio-tek, Norcross, GA, USA) according to the manufacturer’s instructions. The V3-V4 hypervariable region of the bacterial 16S rRNA gene and the ITS1 variable region of the fungal ITS gene were amplified using the universal primers 338F/806R (5′-ACTCCTACGGGAGGCAGCAG-3′/5′-GGACTACHVGGGTWTCTAAT-3′ and ITS1F/ITS2R (5′-CTTGGTCATTTAGAGGAAGTAA-3′/5′-GCTGCGTTCTTCATCGATGC-3′). Amplicons were sequenced with the Illumina MiSeq PE300 platform (Illumina, San Diego, CA, USA) following the standard protocols of Majorbio Bio-Pharm Technology Co., Ltd., (Shanghai, China). Raw sequences were demultiplexed, quality-filtered using fastp (https://github.com/OpenGene/fastp, version 0.20.0, 22 October 2020), and merged using FLASH (https://sourceforge.net/p/flashpage/code/ci/master/tree/, version 1.2.7, 22 October 2020).

2.5. Calculation and Statistical Analysis

The sustainable yield index (SYI) was used to assess the sustainability of rice production and was calculated as follows:
SYI = (Ymean − σ)/Ymax
where Ymean is the mean yield over the experimental period, σ is the standard deviation of annual rice yields, and Ymax is the maximum yield achieved.
Mean weight diameter (MWD) was used to assess soil aggregate stability and was calculated as follows:
M W D = i = 1 n Di × P i
where Di is the mean diameter of each sieve fraction (mm), Pi is the proportion of aggregates retained on the corresponding sieve relative to the total weight of aggregates, and n is the number of aggregate fractions.
The soil quality index (SQI) [31,32] was calculated using the Soil Quality Index Area Method. Soil indicators were first normalized to values between 0 and 1 using a linear scoring function (Equations (3) and (4)). Then, the SQI was calculated by comparing the area on the radar chart generated by each soil parameter (Equation (5)):
SLi+ = X/Xmax
SLi = Xmin/X
SQI area = 0.5   ×   i = 1 n S L i 2   ×   sin ( 2 π / n )
where SLi+ is the standardized value for “more is better” indicators (positive indicators, e.g., SOC, MBC, enzyme activities), SLi is the standardized value for “less is better” indicators (negative indicators, e.g., bulk density), X is the measured value of each soil indicator, and Xmax and Xmin are the maximum and minimum measured values of each soil indicator, respectively.

2.6. Statistical Analyses

Two-way analysis of variance (ANOVA) was used to assess the effects of treatment and year on rice yield and SYI. One-way ANOVA was used to analyze soil properties (BD, MWD, SOC, TN, TP, TK, Nmin, AP, AK, CEC, MBC, MBN, enzyme activities, and SQI), alpha diversity indices (Chao1 and Shannon), bacterial and fungal community compositions, and microbial function (FAPROTAX prediction and FUNGuild annotation). Treatment effects on rice yield and soil properties were further determined by multiple comparisons, and treatment means were separated using Duncan’s multiple range test at a significance level of p < 0.05. All statistical analyses were performed using SAS software (version 9.4, SAS Institute Inc., Cary, NC, USA).
Spearman correlation coefficients between microbial community structure, soil properties, and rice yield were calculated using SPSS software (version 20.0). Random forest analysis was performed to assess the importance of soil properties in predicting SQI using the “randomForest” package in R (version 4.1.2). Redundancy analysis (RDA) was conducted to estimate the relationships between soil physicochemical properties and microbial community structure using Canoco software (version 5.0).

3. Results

3.1. Rice Yield and Sustainability Yield Index

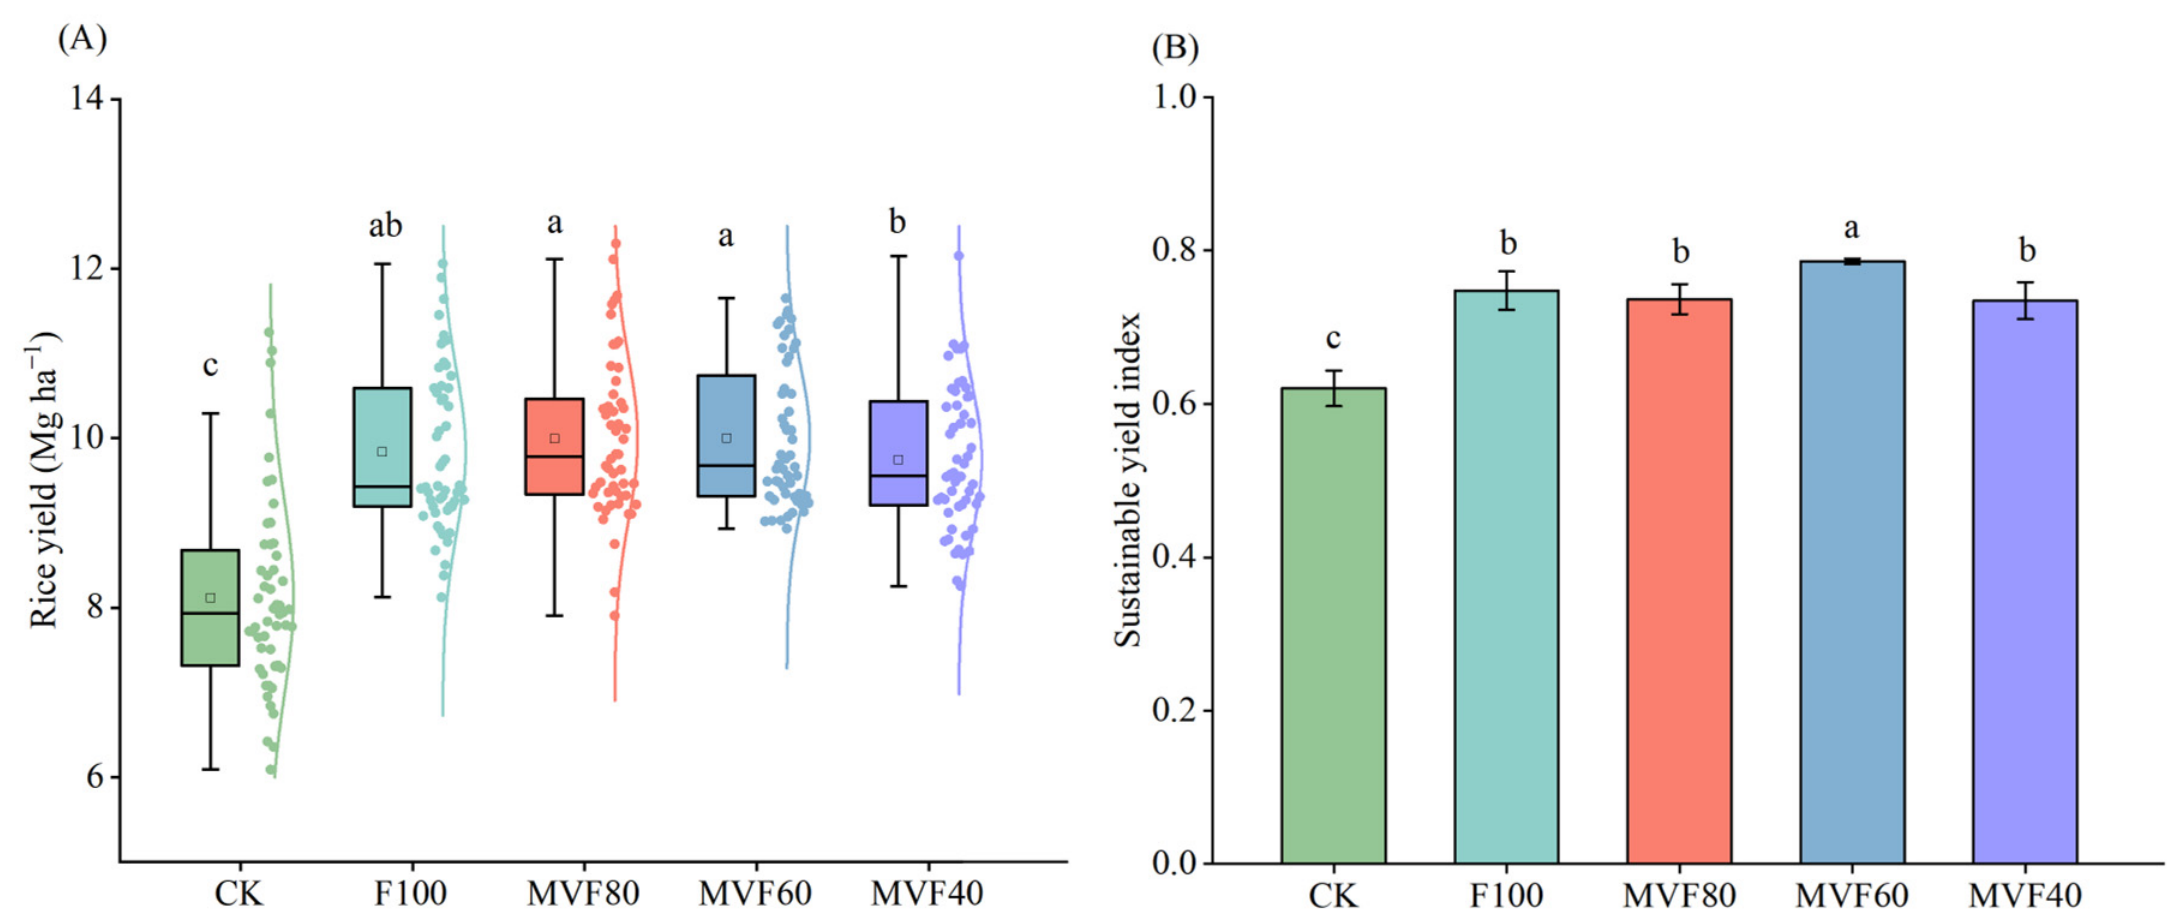
The sole application of 100% chemical fertilizer or MV application with reduced chemical fertilizer obviously increased rice yield and the sustainability yield index (SYI) (Figure 1). Rice yields under all four fertilization treatments were markedly higher (by 21.2–23.2%) than that under the CK treatment, but no significant differences were observed among the four fertilized treatments (Figure 1A). Across 13 years, the average rice yield under the four fertilization treatments exhibited the following order: MVF40 < F100 < MVF80 < MVF60. Compared with the F100 treatment, rice yields in the MVF60 and MVF80 treatments were slightly increased by 1.71 and 1.58%, respectively. Similarly, the SYI was significantly increased (by 18.5–26.7%) under all four fertilization treatments compared with CK. Notably, the SYI under MVF60 was significantly higher (by 5.10%) than that under F100, whereas no significant differences were observed among the MVF80, MVF40, and F100 treatments (Figure 1B).

3.2. Soil Properties and Soil Quality Index

After 13 years of MV application with chemical fertilizer, marked treatment effects were observed for most soil properties, with the exception of AK, urease, and sucrase (Table 1). Compared with F100, soil BD under MVF60 and MVF40 was significantly reduced by 8.66 and 11.0%, respectively. All MV application treatments markedly increased SOC and MBC compared with F100, with increases ranging from 14.4 to 16.3% for SOC and 16.7–20.1% for MBC; however, no significant differences were observed among the MV treatments themselves. Relative to CK, the TN, Nmin, AP, ACP, and CAT were significantly improved by 27.1, 46.4, 115, 25.2, and 6.00%, respectively. Compared with F100, Nmin under the MVF80 and MVF40 treatments was significantly improved by 23.6 and 32.9%, respectively, and ACP under MVF40 was significantly improved by 12.2%, whereas no significant differences were observed among the four fertilization treatments for TN, AP, or CAT. TP and TK under MVF80 were significantly higher than under the other treatments. MBN under MVF80 was higher than under CK, MVF60, and MVF40, and slightly higher than under F100. CEC under MVF60 and MVF40 was significantly increased by 14.9 and 20.7%, respectively, compared with CK, and by 15.8 and 21.7%, respectively, compared with F100. Compared with the CK and F100 treatments, the UE under MVF80 was significantly increased by 18.3 and 14.6%, respectively, and was slightly increased under MVF60 and MVF40. The CAT under MVF60 and MVF40 was significantly improved by 78.0 and 49.2%, respectively, but no significant changes were observed among the four fertilization treatments.
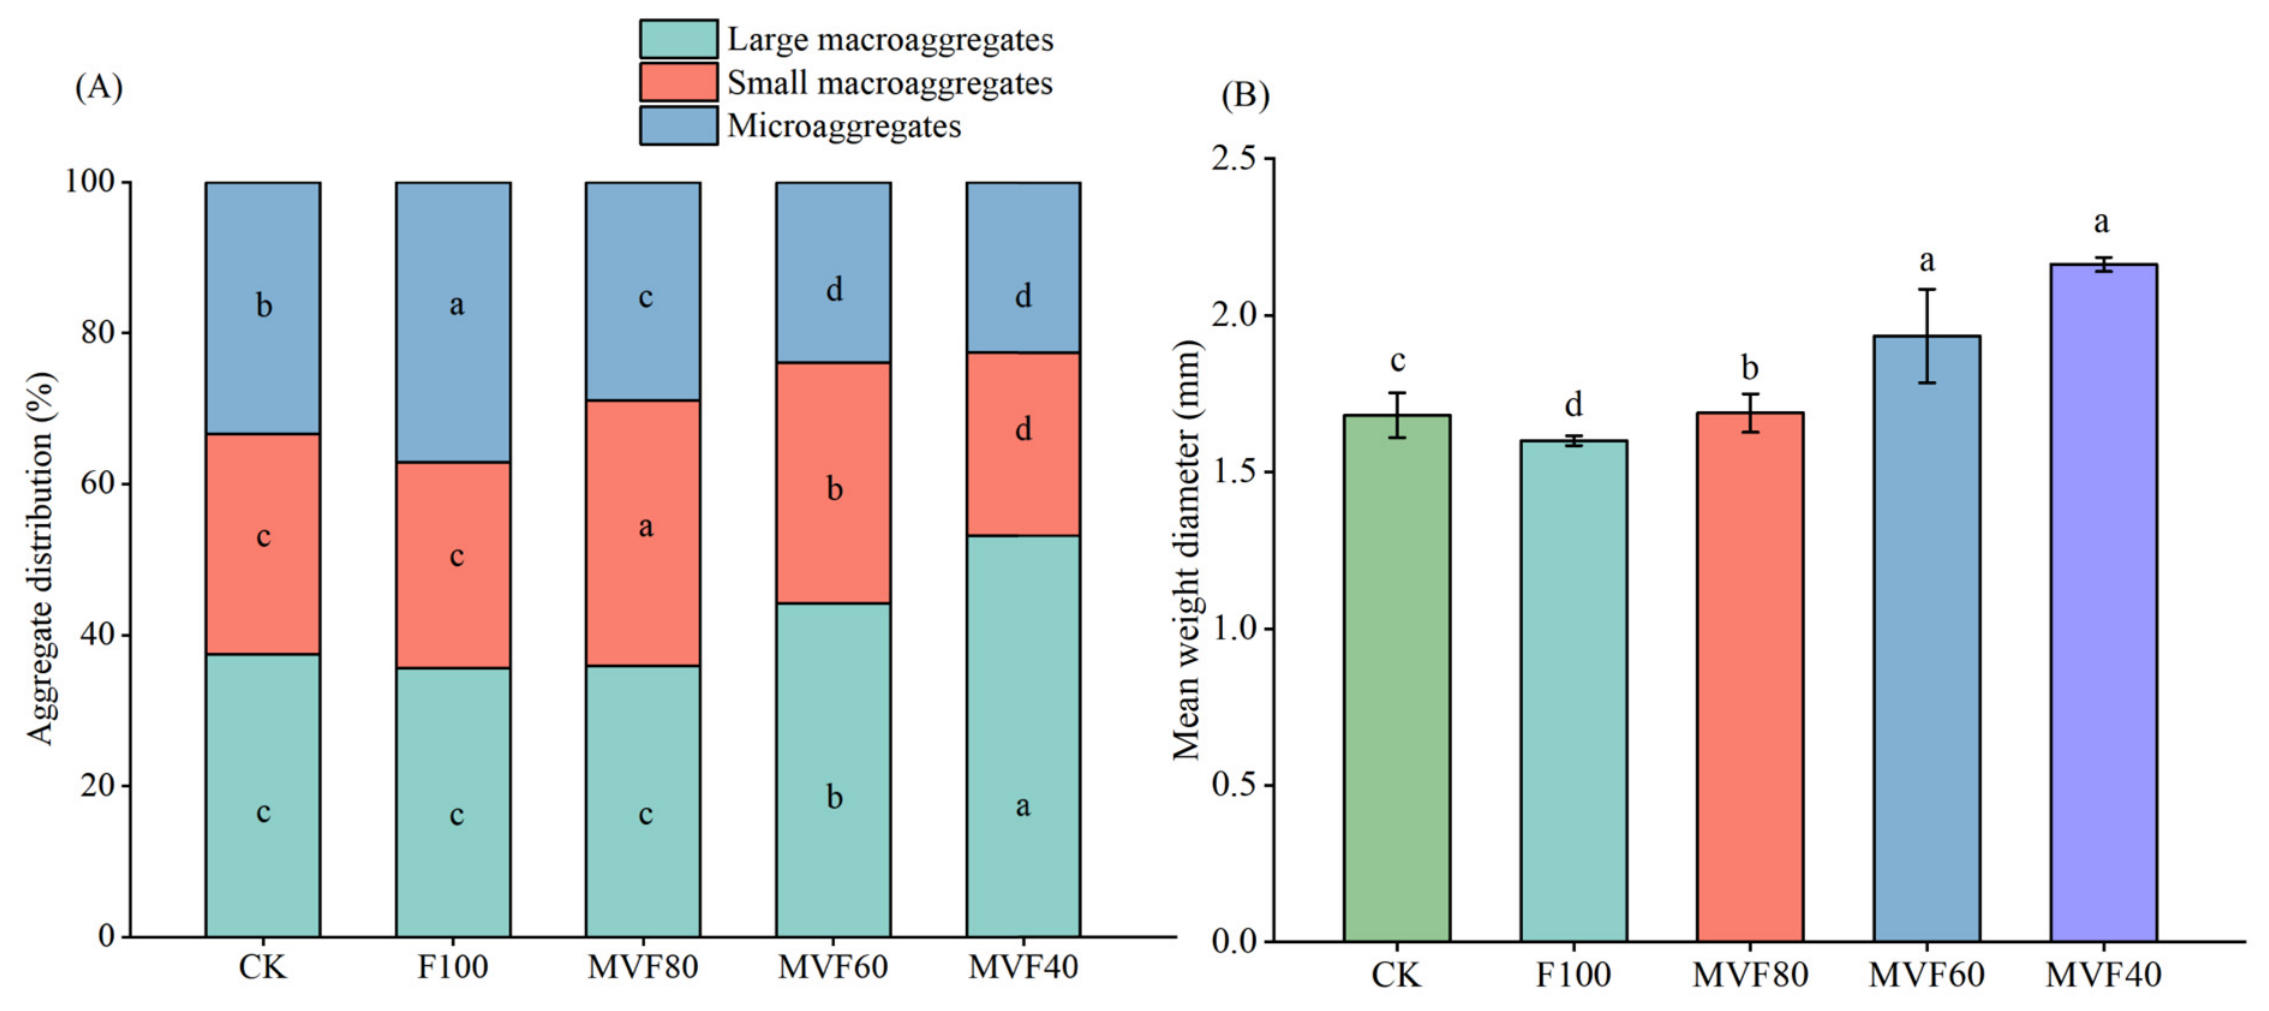
MV application increased the proportion of macroaggregates (>0.25 mm) and reduced the proportion of microaggregates (<0.25 mm) (Figure 2A). The proportion of >2 mm aggregates under MVF40 was significantly higher (by 20.5–49.3%) than under the other treatments, and under MVF60 was significantly higher (by 17.9–24.0%) than under the other three treatments. The proportion of 0.25–2 mm aggregates was highest under MVF80, significantly exceeding that under the other treatments by 10.5–45.1%. Compared with CK and F100, the proportion of 0.25–2 mm aggregates under MVF60 was significantly increased by 9.25 and 16.7%, respectively, while under MVF40 it was significantly reduced by 16.8 and 11.2%, respectively. The proportion of <0.25 mm aggregates was highest under F100, significantly exceeding that under all the MV treatments by 28.2–64.3%. Under MVF80, this proportion was significantly higher than under MVF60 and MVF40 (by 20.6 and 28.2%, respectively), with no significant difference between MVF60 and MVF40. The mean weight diameter (MWD) under all the MV treatments was significantly increased by 0.44–28.7% and 5.50–35.2% compared with CK and F100, respectively, and MWD under MVF60 and MVF40 was significantly higher (by 14.6 and 28.1%) than under MVF80, with no significant difference between MVF60 and MVF40 (Figure 2B).
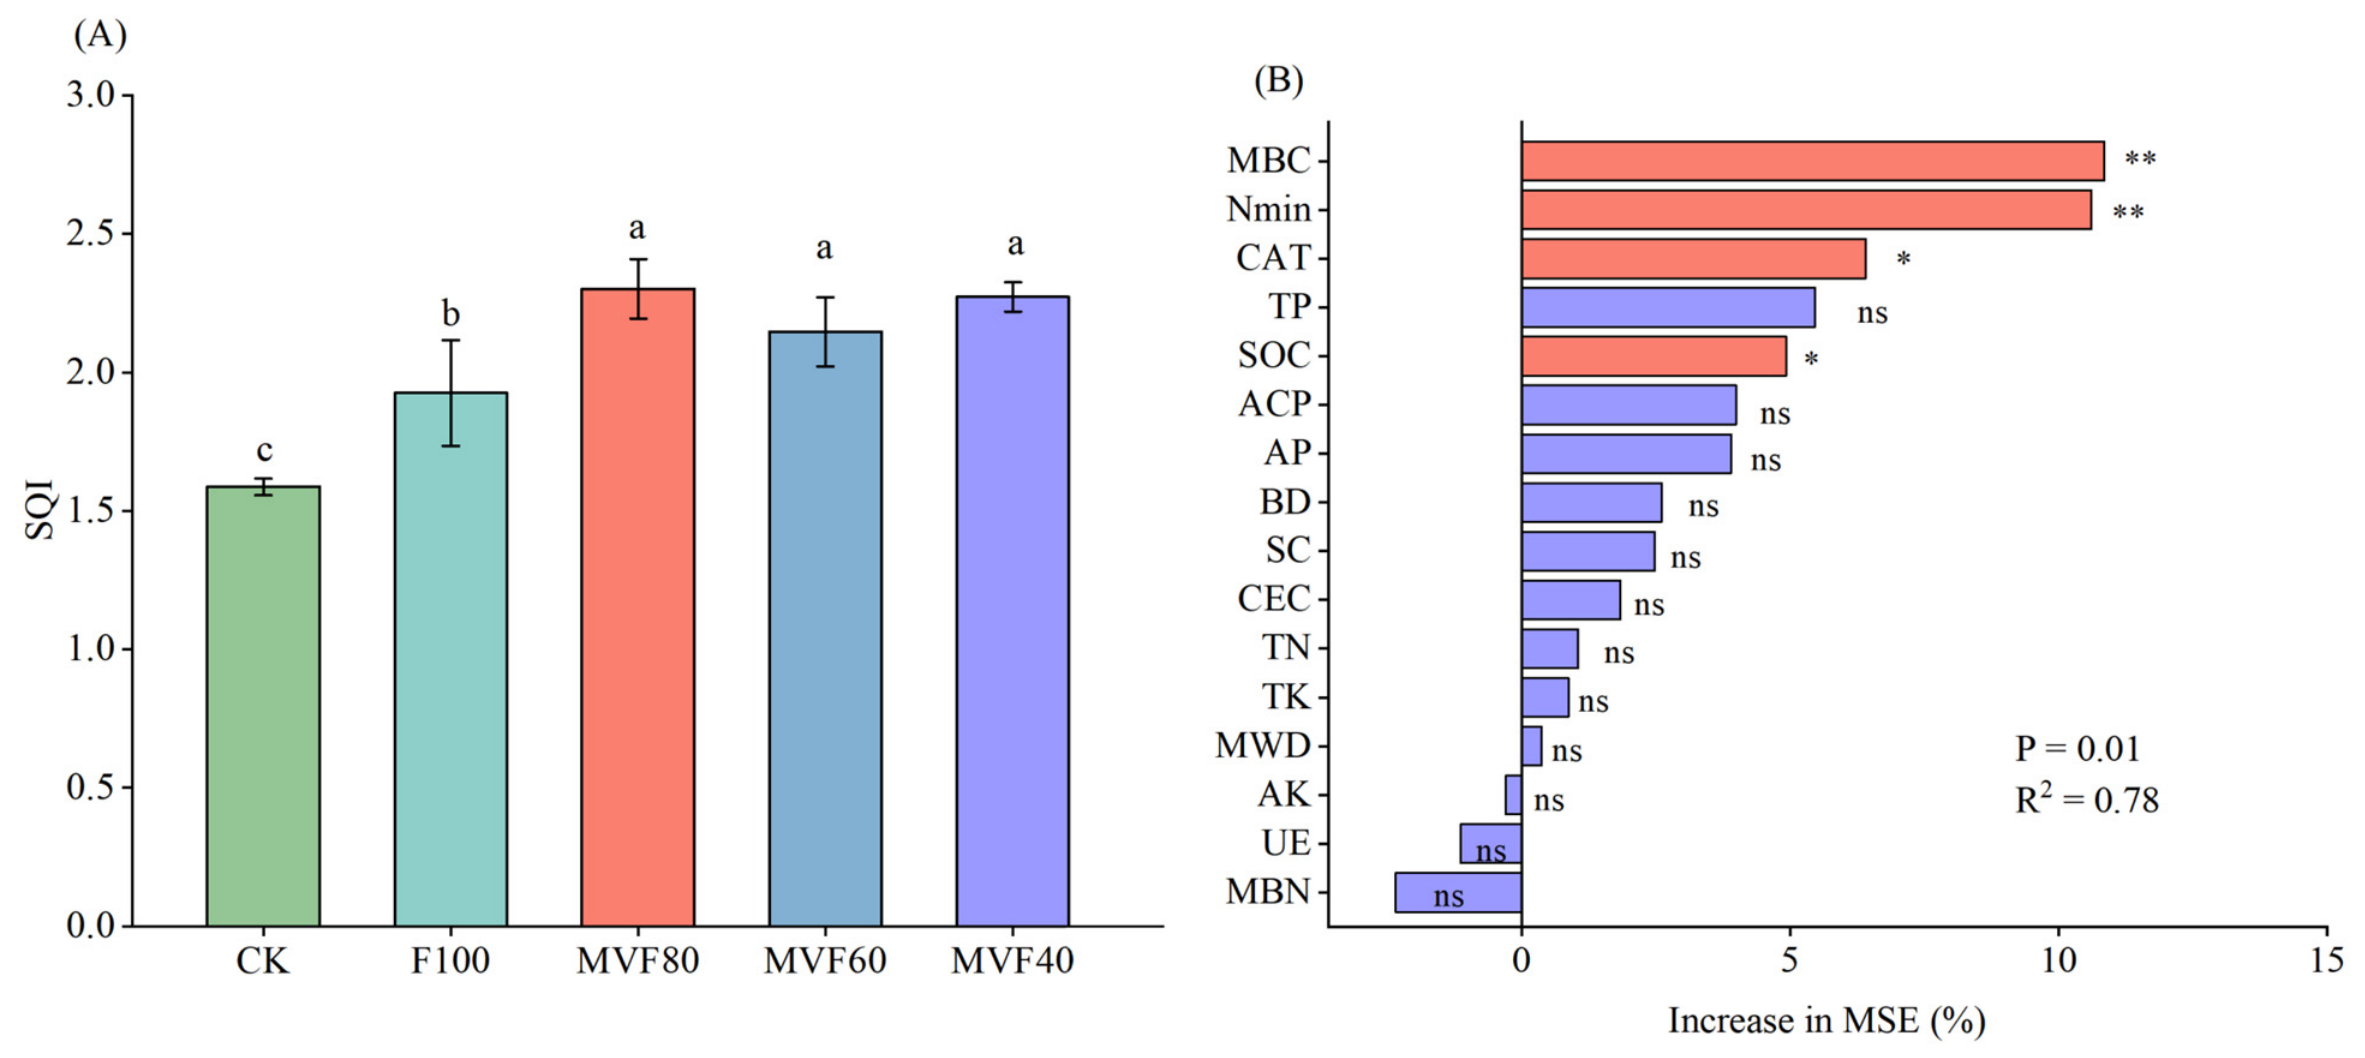
The complete dataset, through integrating soil physical, chemical, and biological properties, included 15 soil indicators for comprehensively evaluating soil quality index (SQI) (Figure 3A). SQI under F100 was significantly higher (by 22.0%) than under CK. Compared with F100, SQI under the three MV treatments was significantly increased by 11.6–20.1%, with no significant differences among them. Random forest regression identified MBC as the most important predictor of SQI, followed by Nmin, CAT, TP, and SOC (Figure 3B).

3.3. Soil Microbial Community Diversity

The Chao1 index of fungal community was markedly affected by the treatments (Table 2). Compared with F100, the Chao1 index of fungal community under MVF40 was significantly reduced by 24.2%, whereas it was slightly reduced under MVF80 and MVF60. No marked effects of treatment were observed for bacterial Chao1 or Shannon indices, or for the fungal Shannon index. Compared with F100, bacterial Chao1 and Shannon indices under the three MV treatments were slightly reduced, while the fungal Shannon index under MVF60 and MVF40 was slightly increased; however, none of these differences were statistically significant.
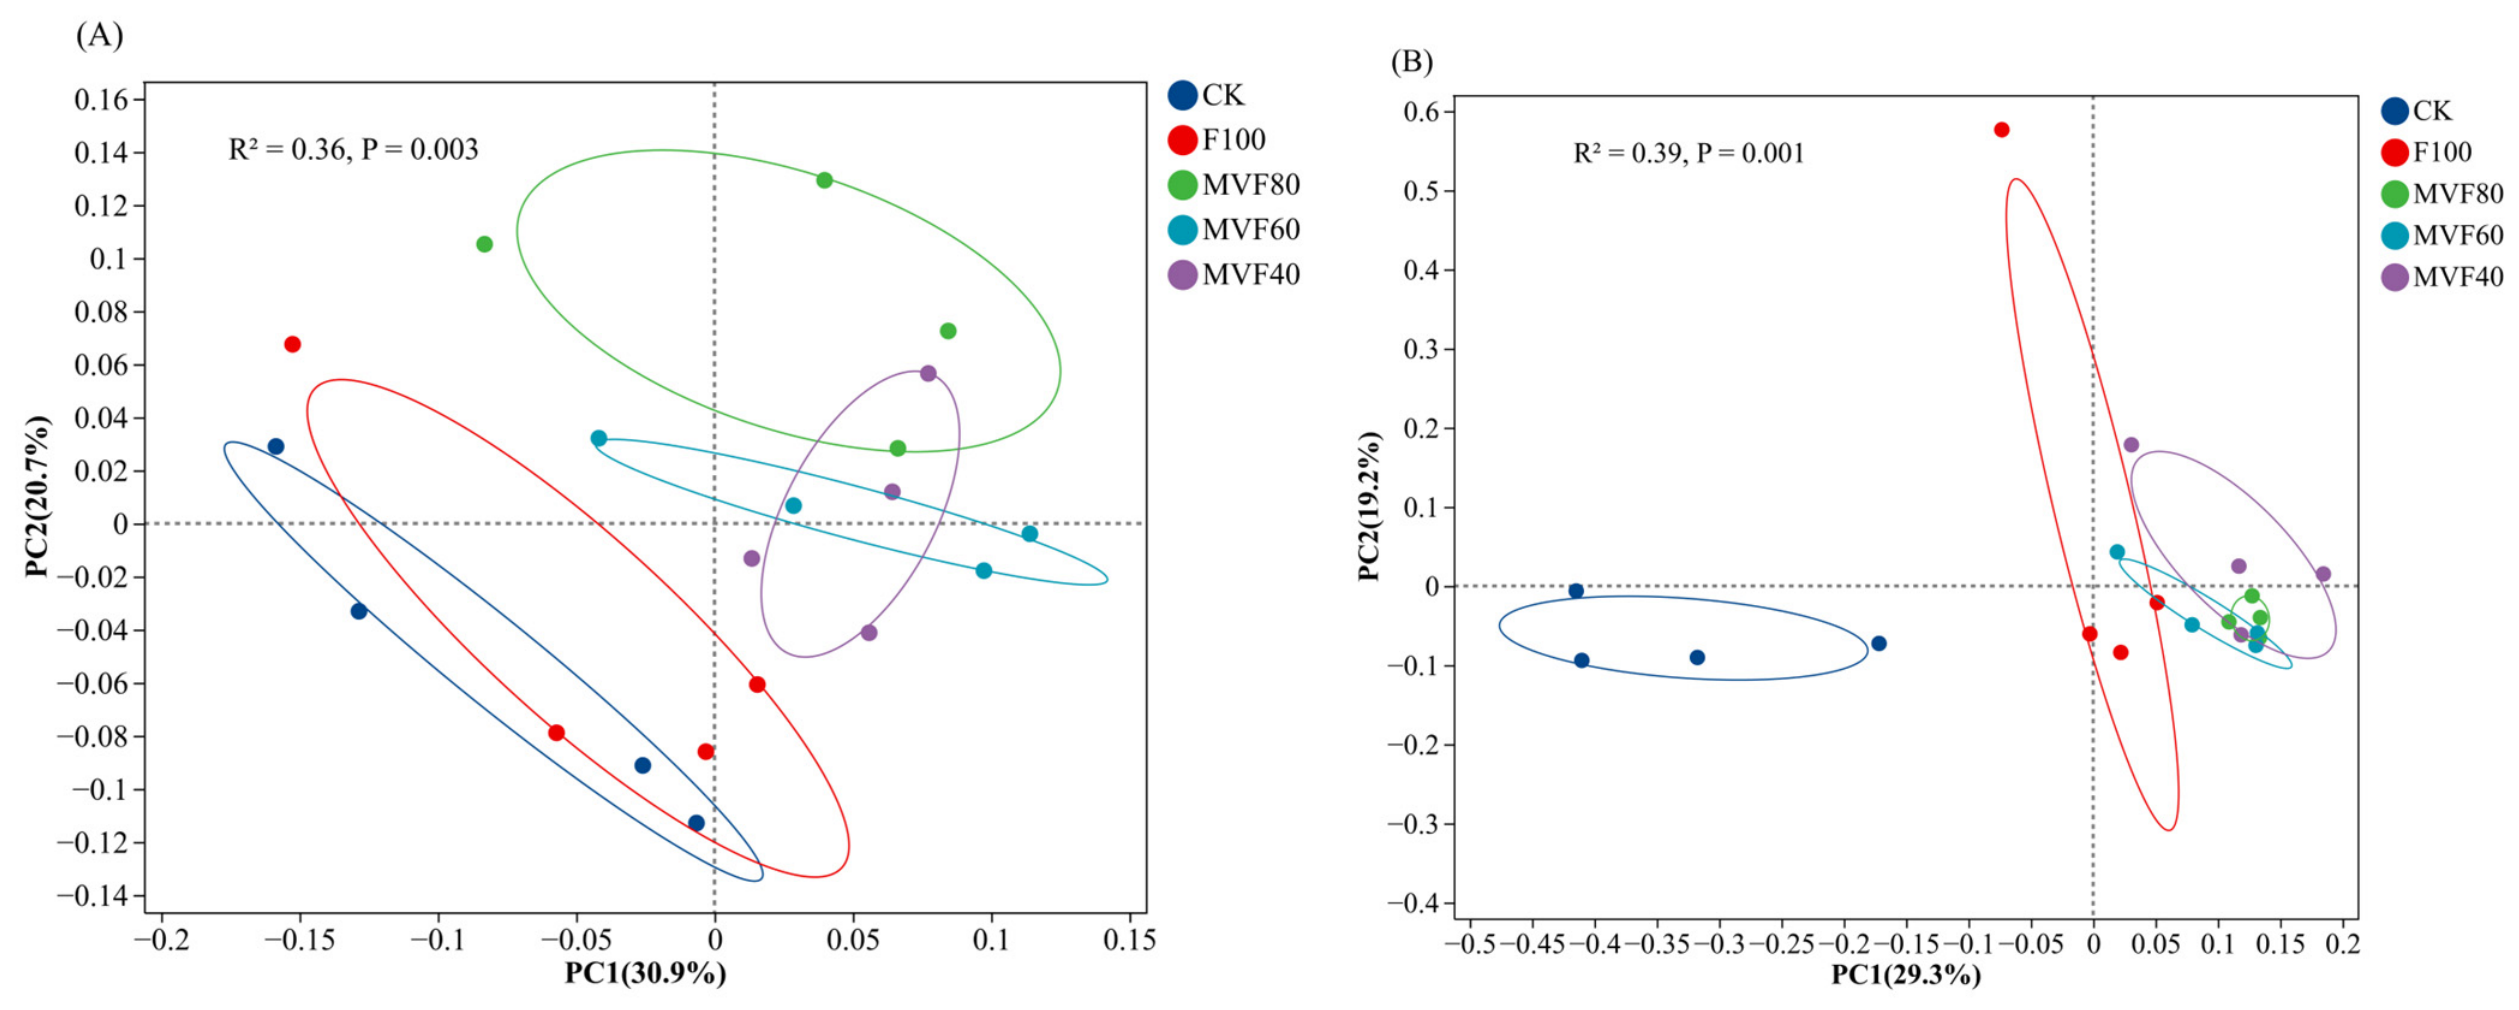
Principal coordinate analysis (PCoA) based on Bray–Curtis distances revealed the differences in microbial community structure among treatments at the genus level (Figure 4). For bacterial and fungal communities, the first two principal coordinates (PC1 and PC2) explained 36 and 39% of the total variation, respectively. Permutational multivariate analysis of variance (PERMANOVA) revealed significant treatment effects on both bacterial (R2 = 0.36, p = 0.003) and fungal (R2 = 0.39, p = 0.001) beta diversity, indicating that long-term MV application with reduced chemical fertilizer significantly shaped both community compositions. Notably, both the explained variance and significance level were higher for the fungal community, suggesting that fungi were more sensitive than bacteria to these treatments.

3.4. Soil Microbial Community Composition

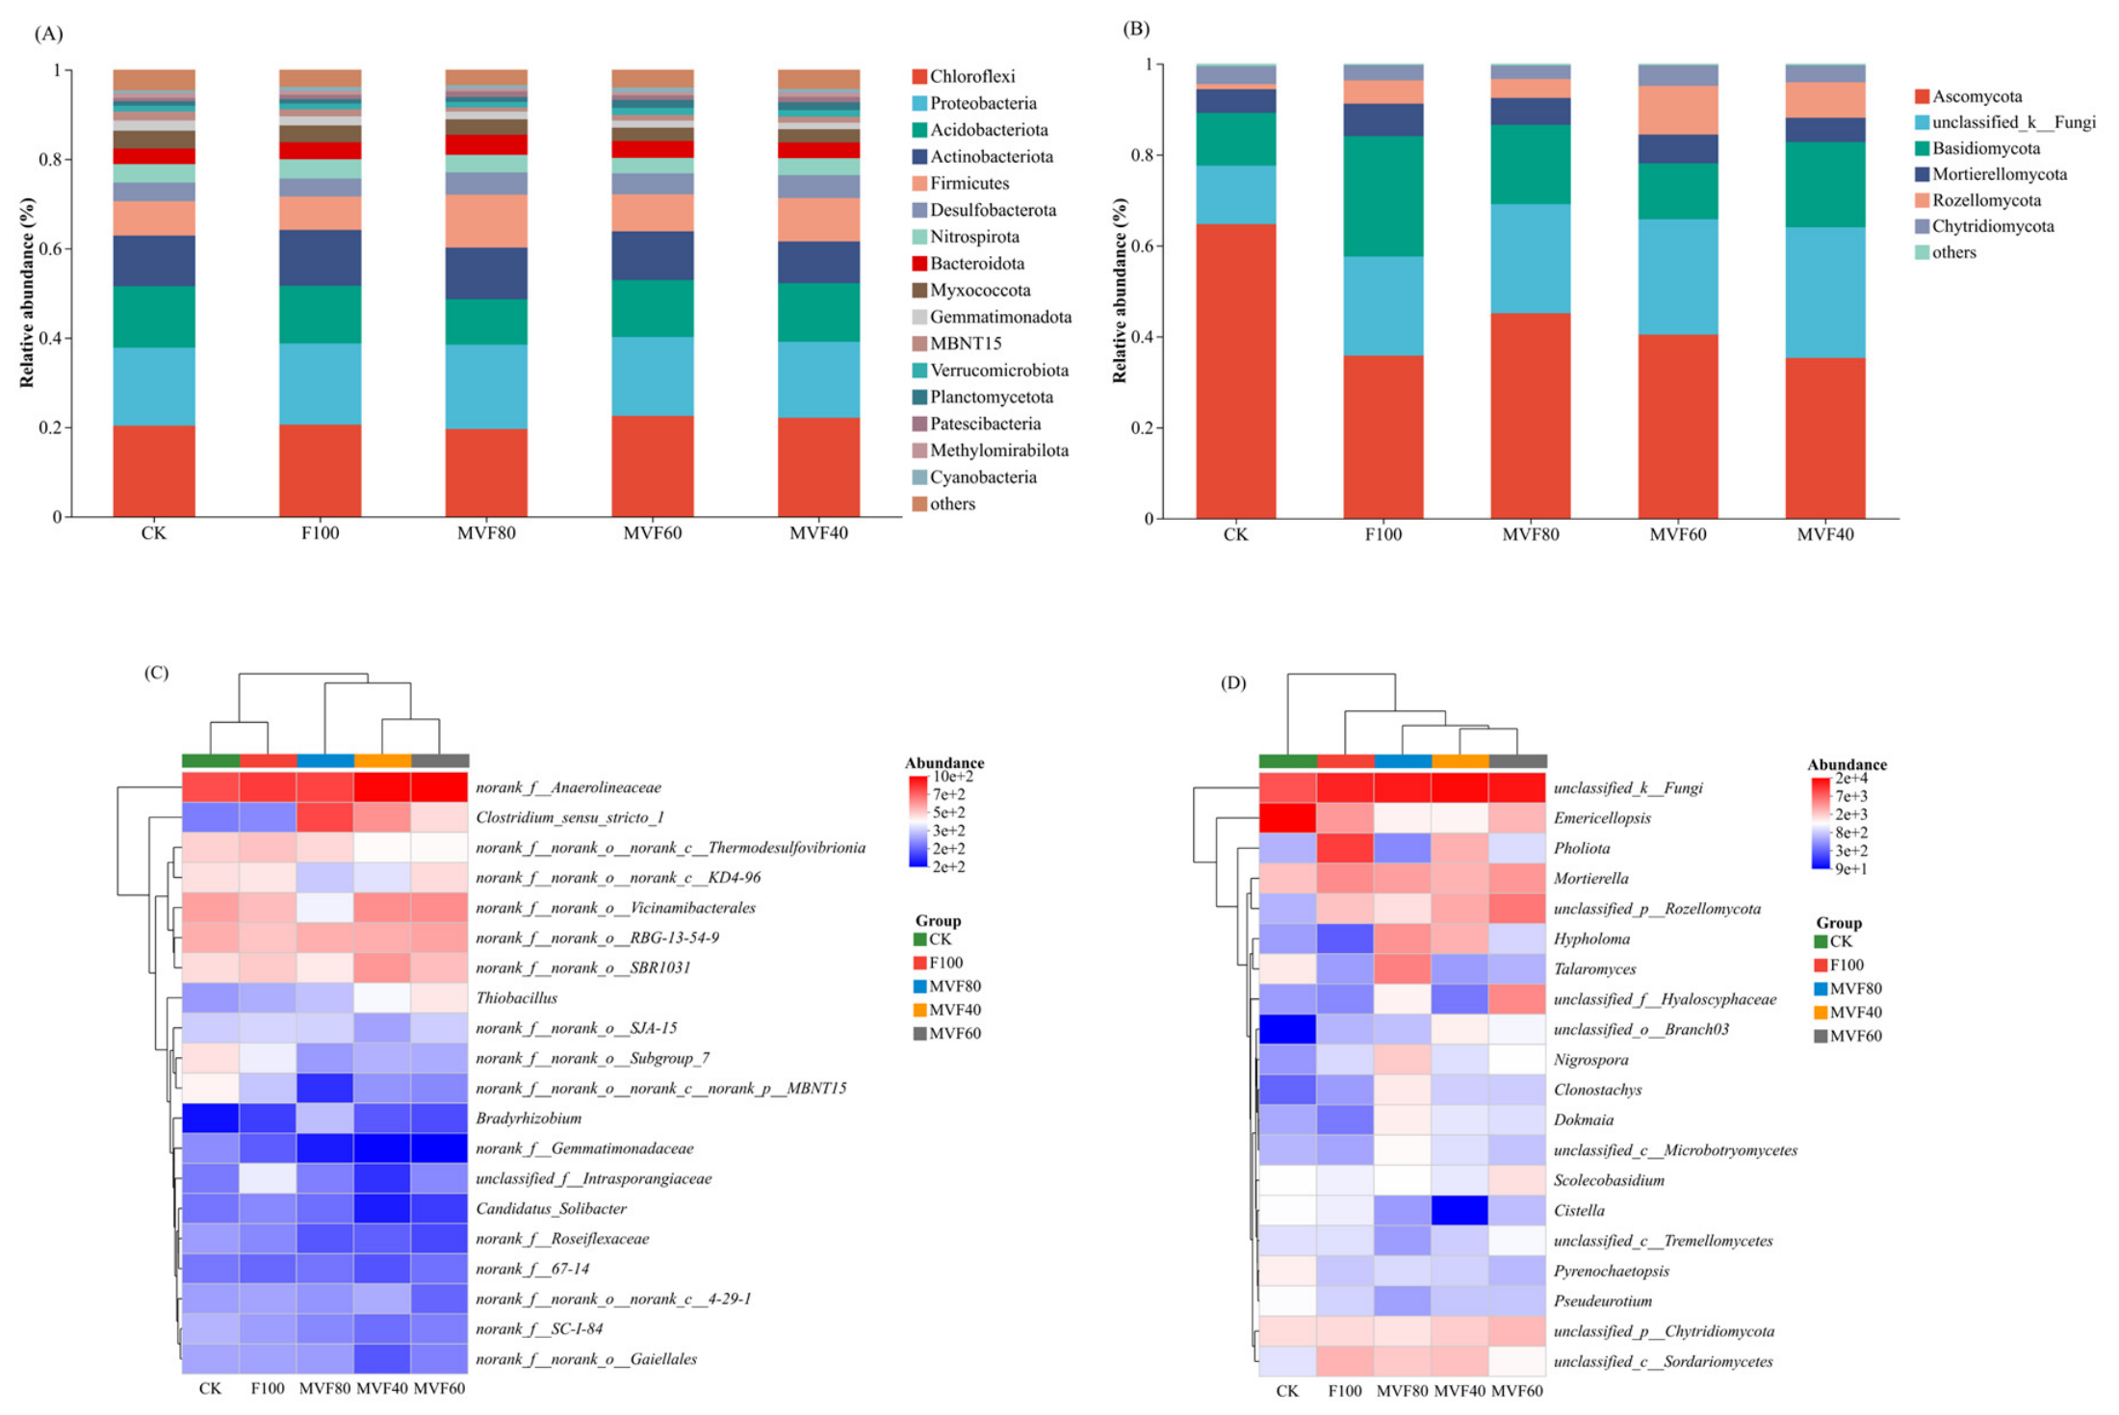
The top ten bacteria phyla were Chloroflexi (19.6–22.5%), Proteobacteria (17.0–18.8%), Acidobacteriota (10.2–13.8%), Actinobacteriota (9.34–12.5%), Firmicutes (7.48–11.8%), Desulfobacterota (4.01–5.13%), Nitrospirota (3.50–4.33%), Bacteroidota (3.47–4.47%), Myxococcota (2.98–4.02%), and Gemmatimonadota (1.45–2.26%) (Figure 5A). The relative abundances of Actinobacteriota, Firmicutes, Myxococcota, and Gemmatimonadota were markedly affected by treatment (Table S2). Compared with F100, the relative abundances of Actinobacteriota and Gemmatimonadota were reduced under all the MV treatments. The relative abundance of Firmicutes increased under all the MV treatments. The relative abundances of Myxococcota reduced under all the MV treatments. No significant differences were observed for the other six phyla.
The top 20 bacterial genera are presented in the form of a heatmap with a total relative abundance of 32.7–38.1% (Figure 5C). The relative abundances of Clostridium_sensu_stricto_1, norank_f__norank_o__Subgroup_7, Candidatus_Solibacter, Bradyrhizobium, Bacillus, norank_f__Bacteroidetes_vadinHA17, Haliangium and Bryobacter were markedly affected by treatment (Table S3). Compared with F100, the relative abundances of Clostridium_sensu_stricto_1, Bradyrhizobium and Haliangium under all the MV treatments were higher (especially for MVF80). In contrast, the relative abundances of norank_f__norank_o__Subgroup_7 and Bacillus were reduced under the MV treatments (significantly for MVF80 and MVF40, respectively). The relative abundances of Candidatus_Solibacter under MVF60 and MVF40, and the relative abundances of Bryobacter under all the MV treatments, were significantly lower than under F100.
For fungi, Ascomycota was the dominant phylum (35.3–64.7%), followed by unclassified_k__Fungi (12.8–28.7%), Basidiomycota (11.6–26.5%), Mortierellomycota (5.21–7.13%), Rozellomycota (1.13–10.7%) and Chytridiomycota (2.97–4.54%) (Figure 5B). The relative abundance of Ascomycota was markedly affected by treatment (Table S4). The relative abundance of Ascomycota was significantly lower under all four fertilized treatments than under CK, with no significant differences among the fertilized treatments. The relative abundances of Basidiomycota and Mortierellomycota tended to be lower, while the relative abundances of Rozellomycota and Chytridiomycota tended to be higher, under the MV treatments compared with F100, but these differences were not statistically significant.
The top 20 fungal genera are presented in the form of a heatmap with a total relative abundance of 65.2–85.9% (Figure 5D). The relative abundances of Emericellopsis, Nigrospora, unclassified_f__Lasiosphaeriaceae, Fusarium, Clavulinopsis and Myrmecridium were markedly affected by treatment (Table S5). The relative abundances of Emericellopsis were significantly lower under all four fertilized treatments than under CK, and slightly lower under the MV treatments than under F100. Compared with F100, the relative abundances of Nigrospora, Clavulinopsis and Myrmecridium increased under the MV treatments (significantly for MVF80), while the relative abundances of Fusarium were reduced under the MV treatments (significantly for MVF40).

3.5. Functional Analysis of Soil Microbial Communities

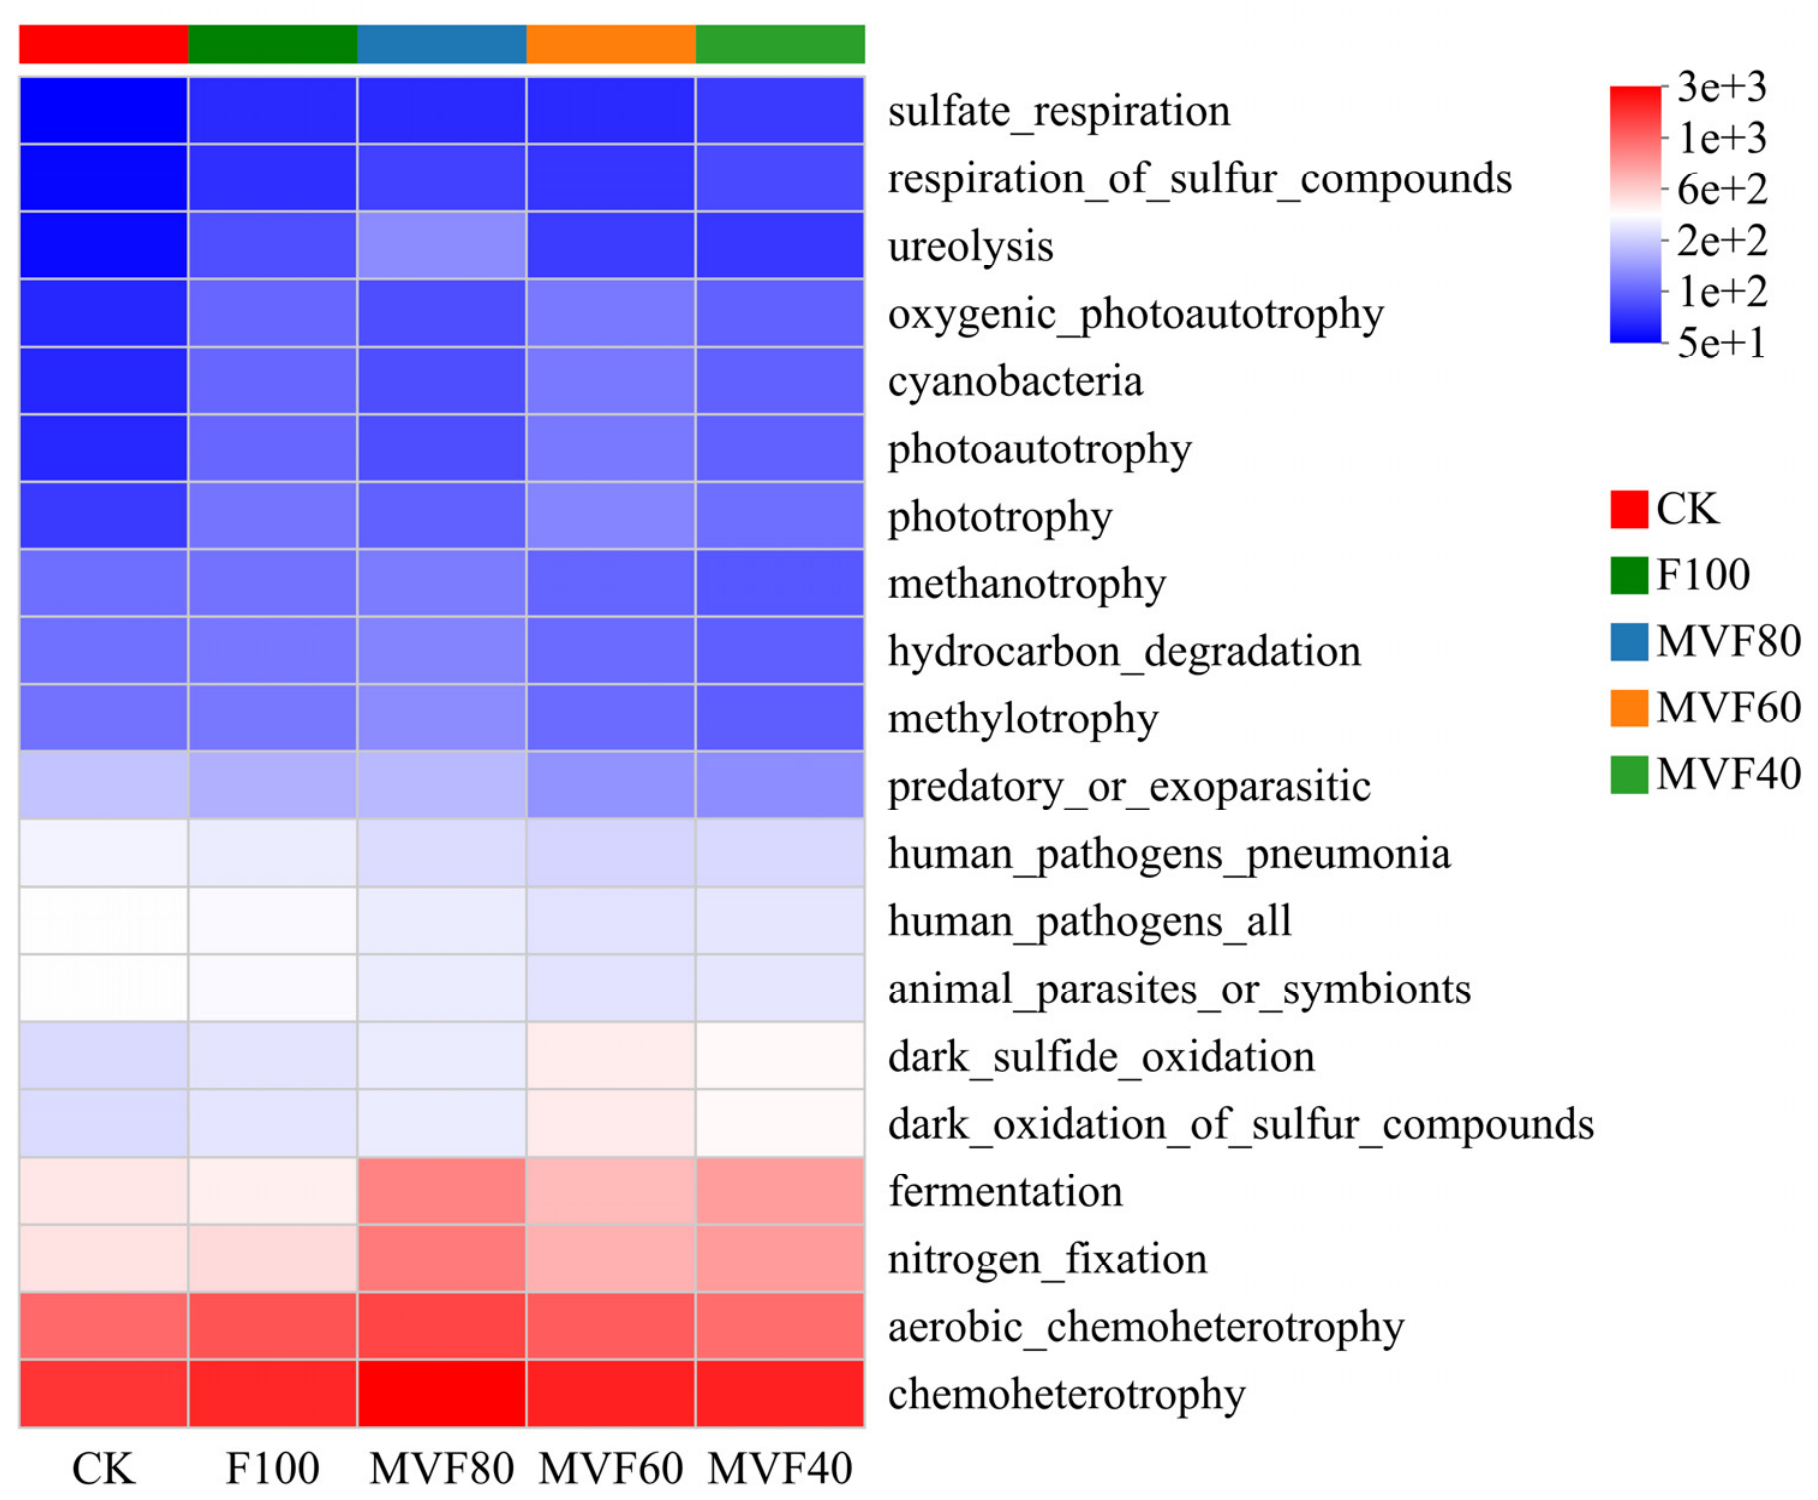
FAPROTAX prediction revealed that the top 20 bacterial functional groups accounted for 93.5–94.8% of total sequences (Figure 6). The relative abundances of aerobic_chemoheterotrophy, nitrogen_fixation, fermentation, animal_parasites_or_symbionts, human_pathogens_all, human_pathogens_pneumonia, predatory_or_exoparasitic and chitinolysis were significantly affected by treatment (Table S6). Compared with F100, the relative abundances of aerobic_chemoheterotrophy, animal_parasites_or_symbionts, human_pathogens_all and chitinolysis were significantly reduced under all the MV treatments, while the relative abundances of nitrogen_fixation and fermentation were increased. The relative abundances of human_pathogens_pneumonia were reduced under the MV treatments (significantly for MVF80 and MVF60), and the relative abundance of predatory_or_exoparasitic was reduced, and the reductions in MVF60 and MVF40 were statistically significant (significantly for MVF60 and MVF40).
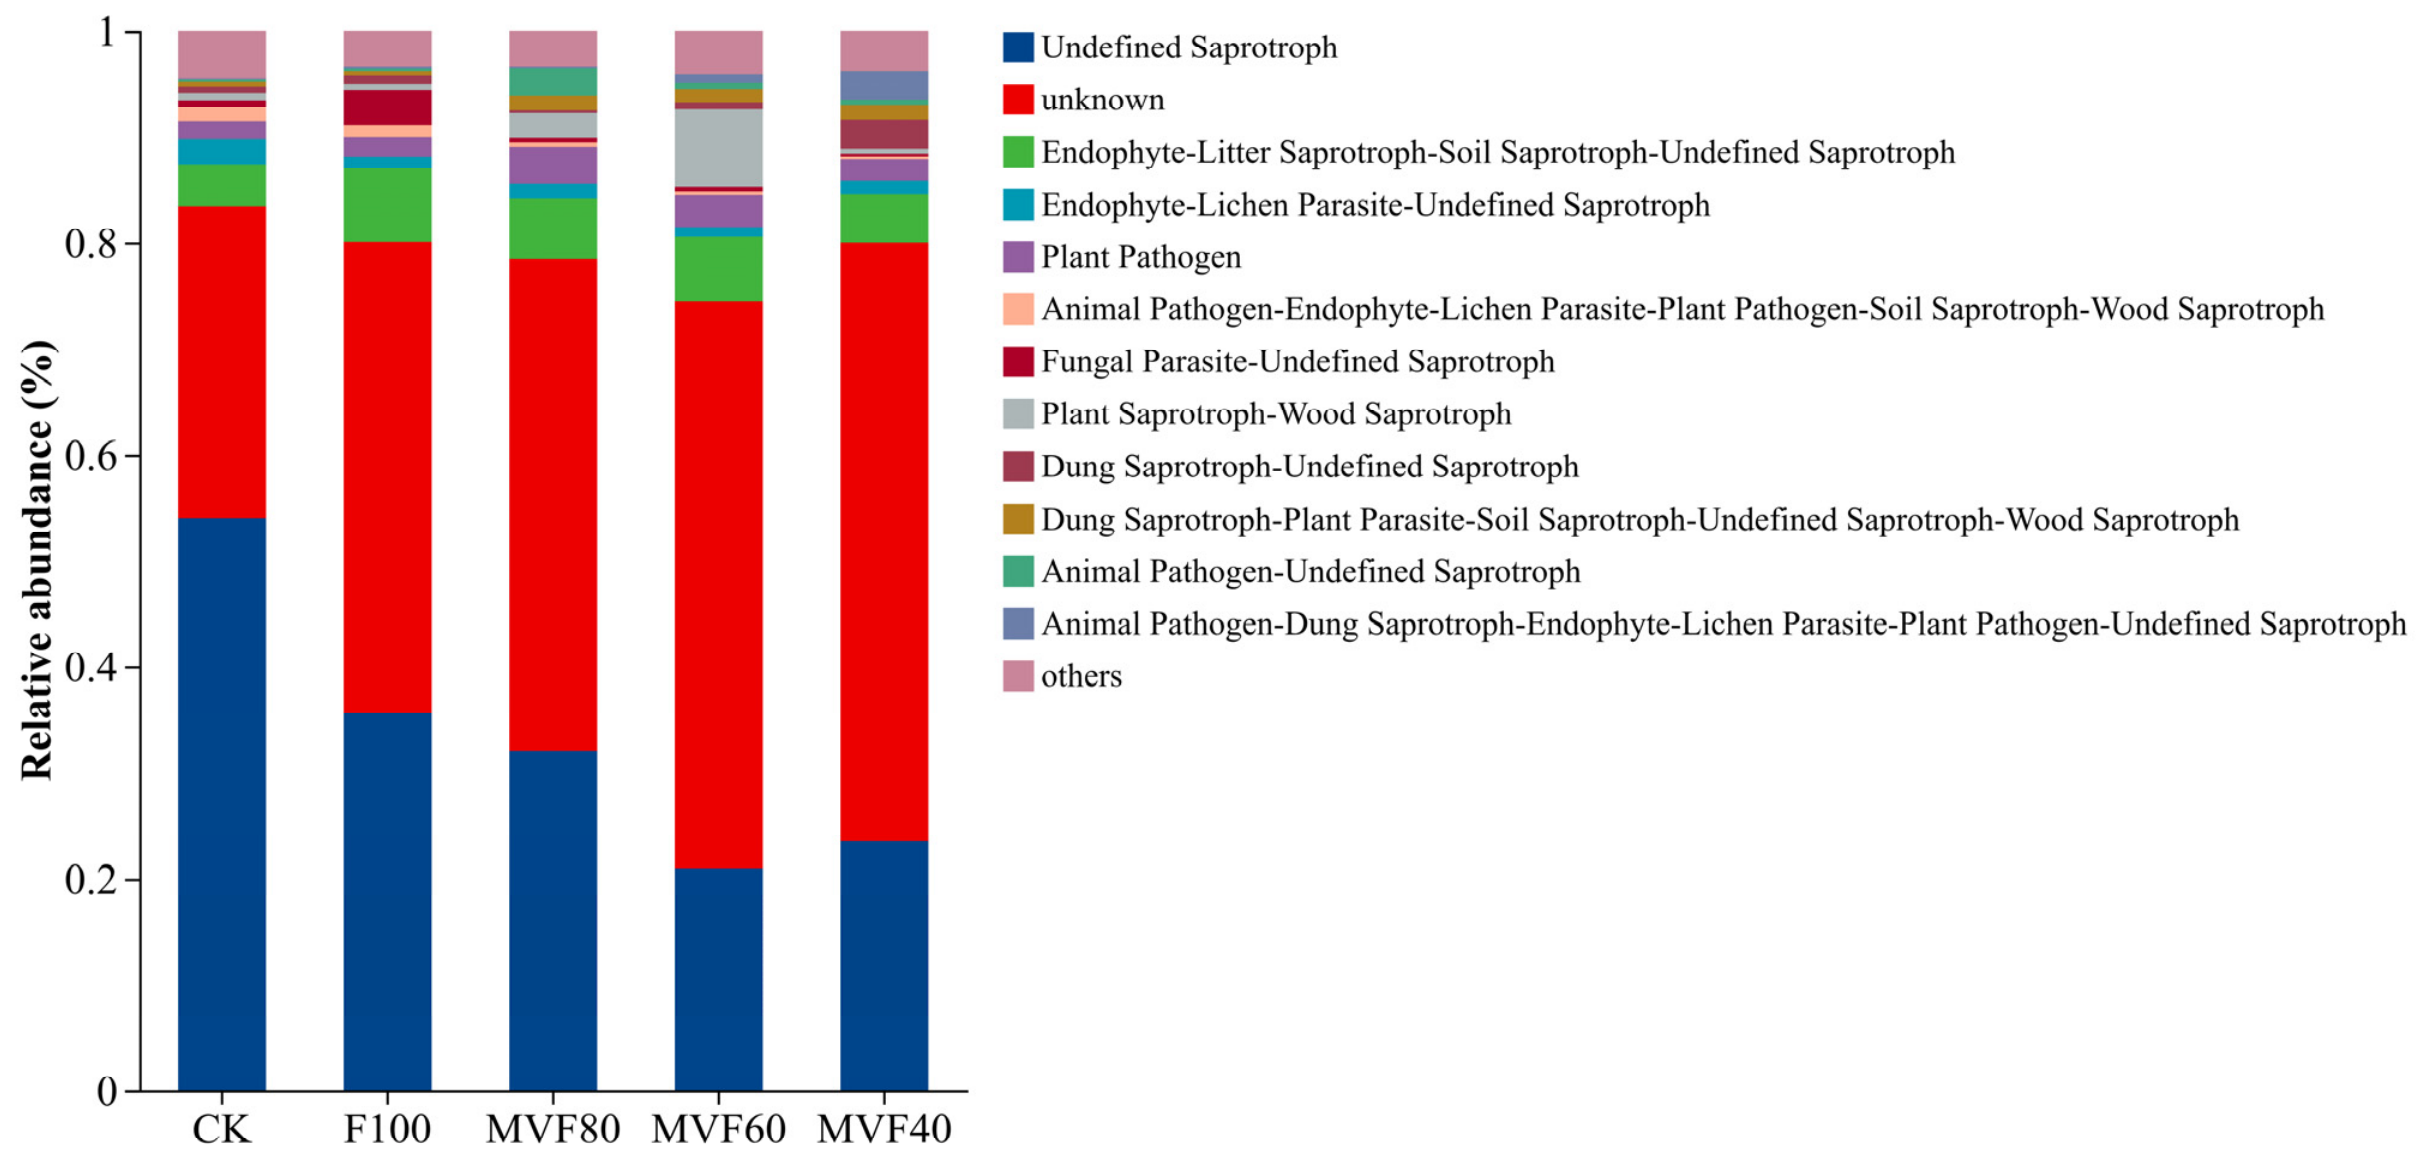
FUNGuild annotation showed that the top 12 fungal functional groups accounted for 87.9–95.2% of the total sequences (Figure 7). The relative abundances of Undefined Saprotroph, unknow and Animal Pathogen–Endophyte–Lichen Parasite–Plant Pathogen–Soil Saprotroph–Wood Saprotroph were significantly affected by treatment (Table S7). Compared with CK, the relative abundances of Animal Pathogen–Endophyte–Lichen Parasite–Plant Pathogen–Soil Saprotroph–Wood Saprotroph under the three MV treatments were significantly reduced under all three MV treatments. Compared with F100, the relative abundances of Animal Pathogen–Endophyte–Lichen Parasite–Plant Pathogen–Soil Saprotroph–Wood Saprotroph under the MVF40 treatment were significantly reduced, and under the MVF60 and MVF80 treatments slightly reduced.

3.6. Correlation Analysis

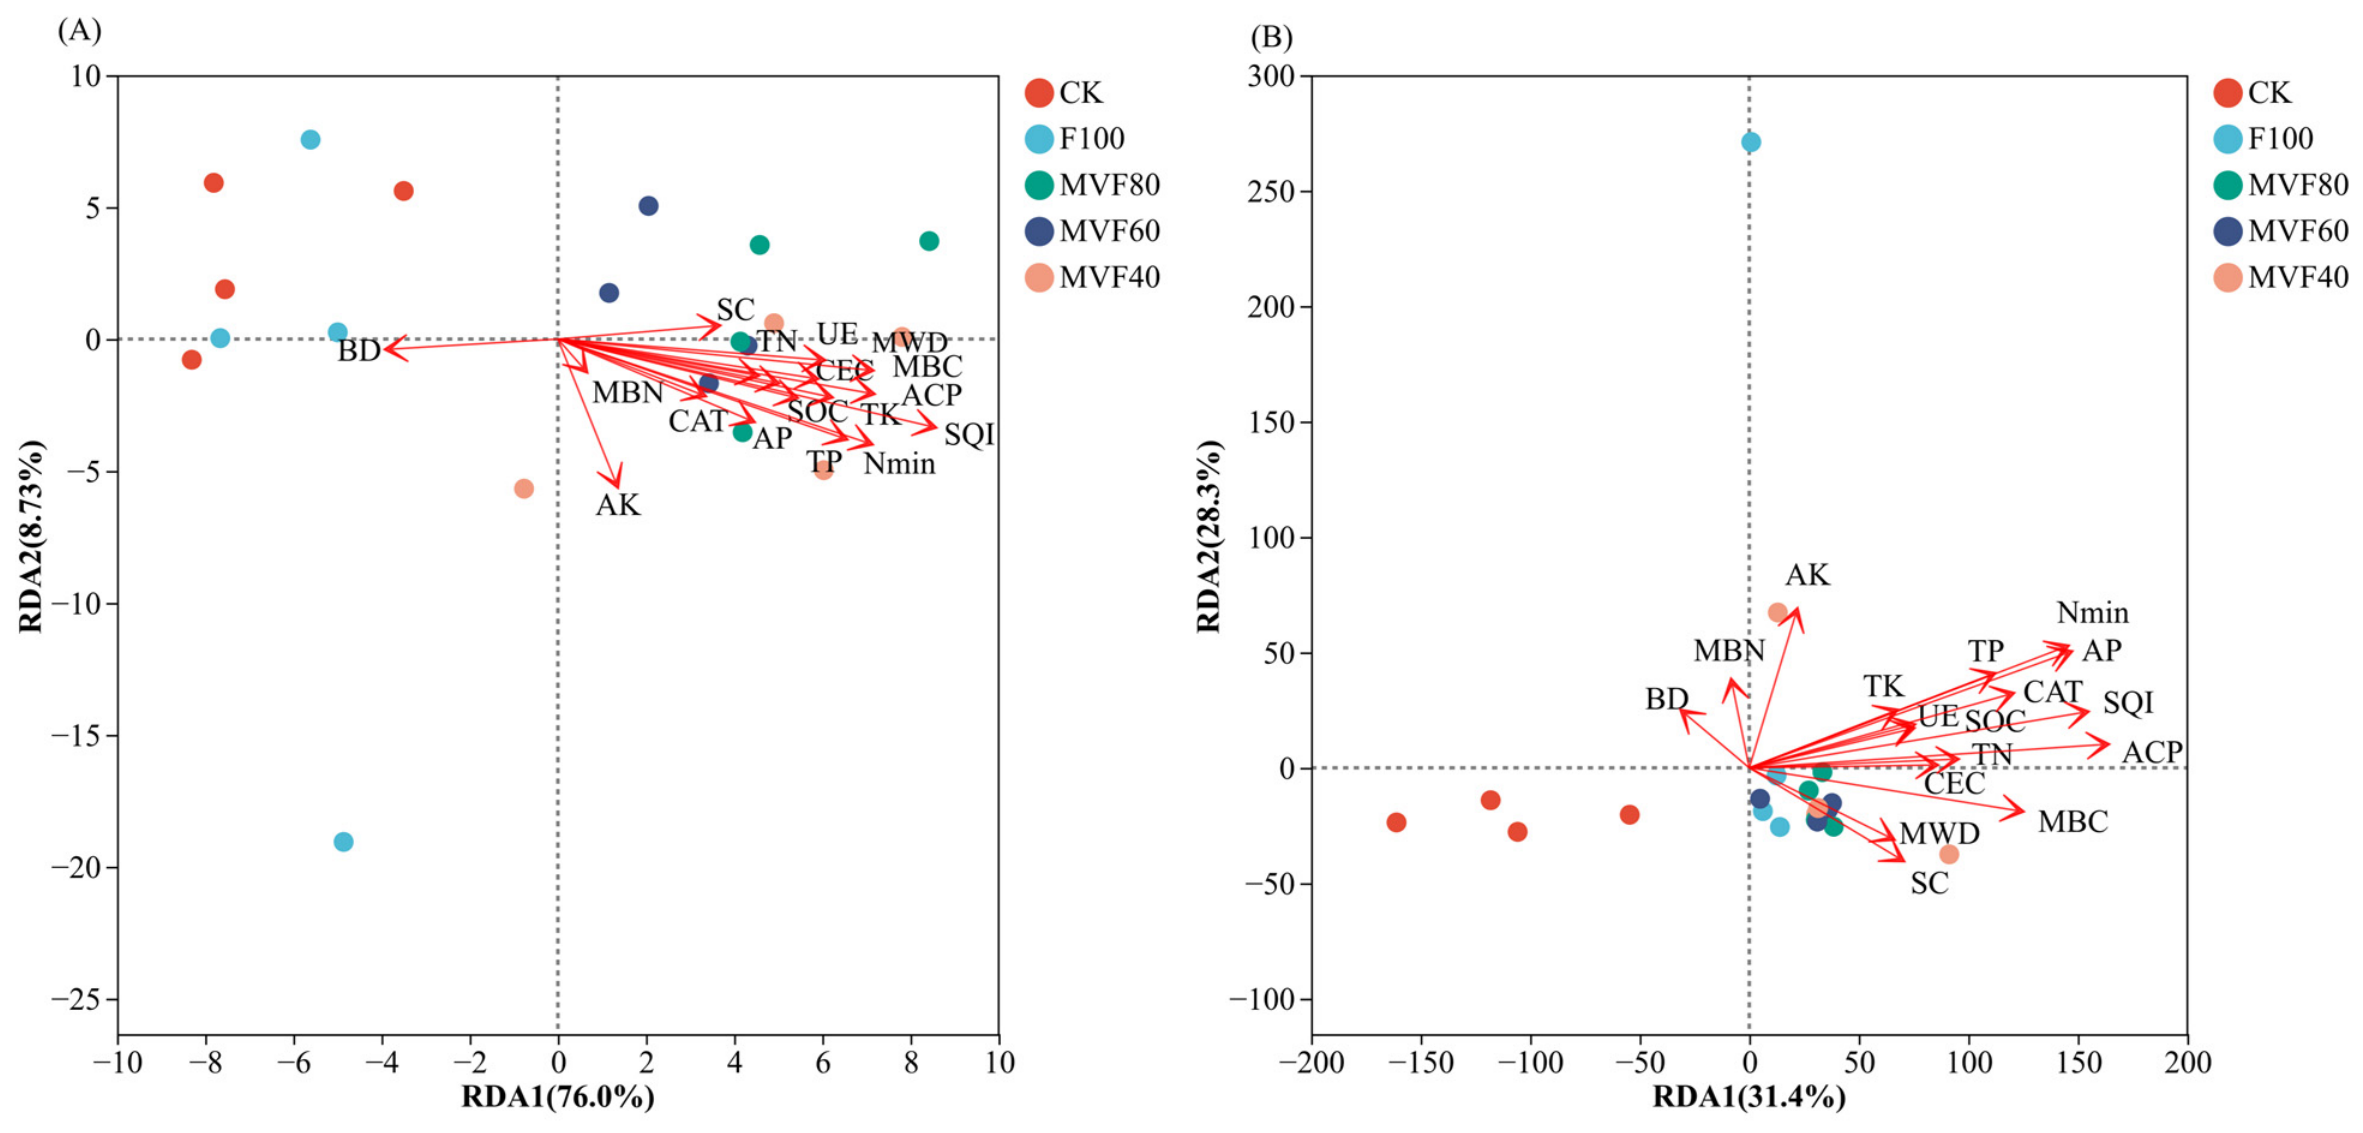
Redundancy analysis (RDA) was performed to elucidate relationships between soil microbial community composition (genus level) and key environmental factors (Figure 8). The RDA model explained 84.7 and 59.7% of the total variation in the bacterial and fungal community compositions. MWD, SOC, TK and UE were markedly (p < 0.05) correlated with the soil bacterial community composition, while TP, Nmin, ACP, MBC, and SQI were highly significantly (p < 0.01) correlated. For fungi, TP was significantly (p < 0.05) correlated, and Nmin, AP, ACP, CAT, MBC, and SQI were highly significantly (p < 0.01) correlated.
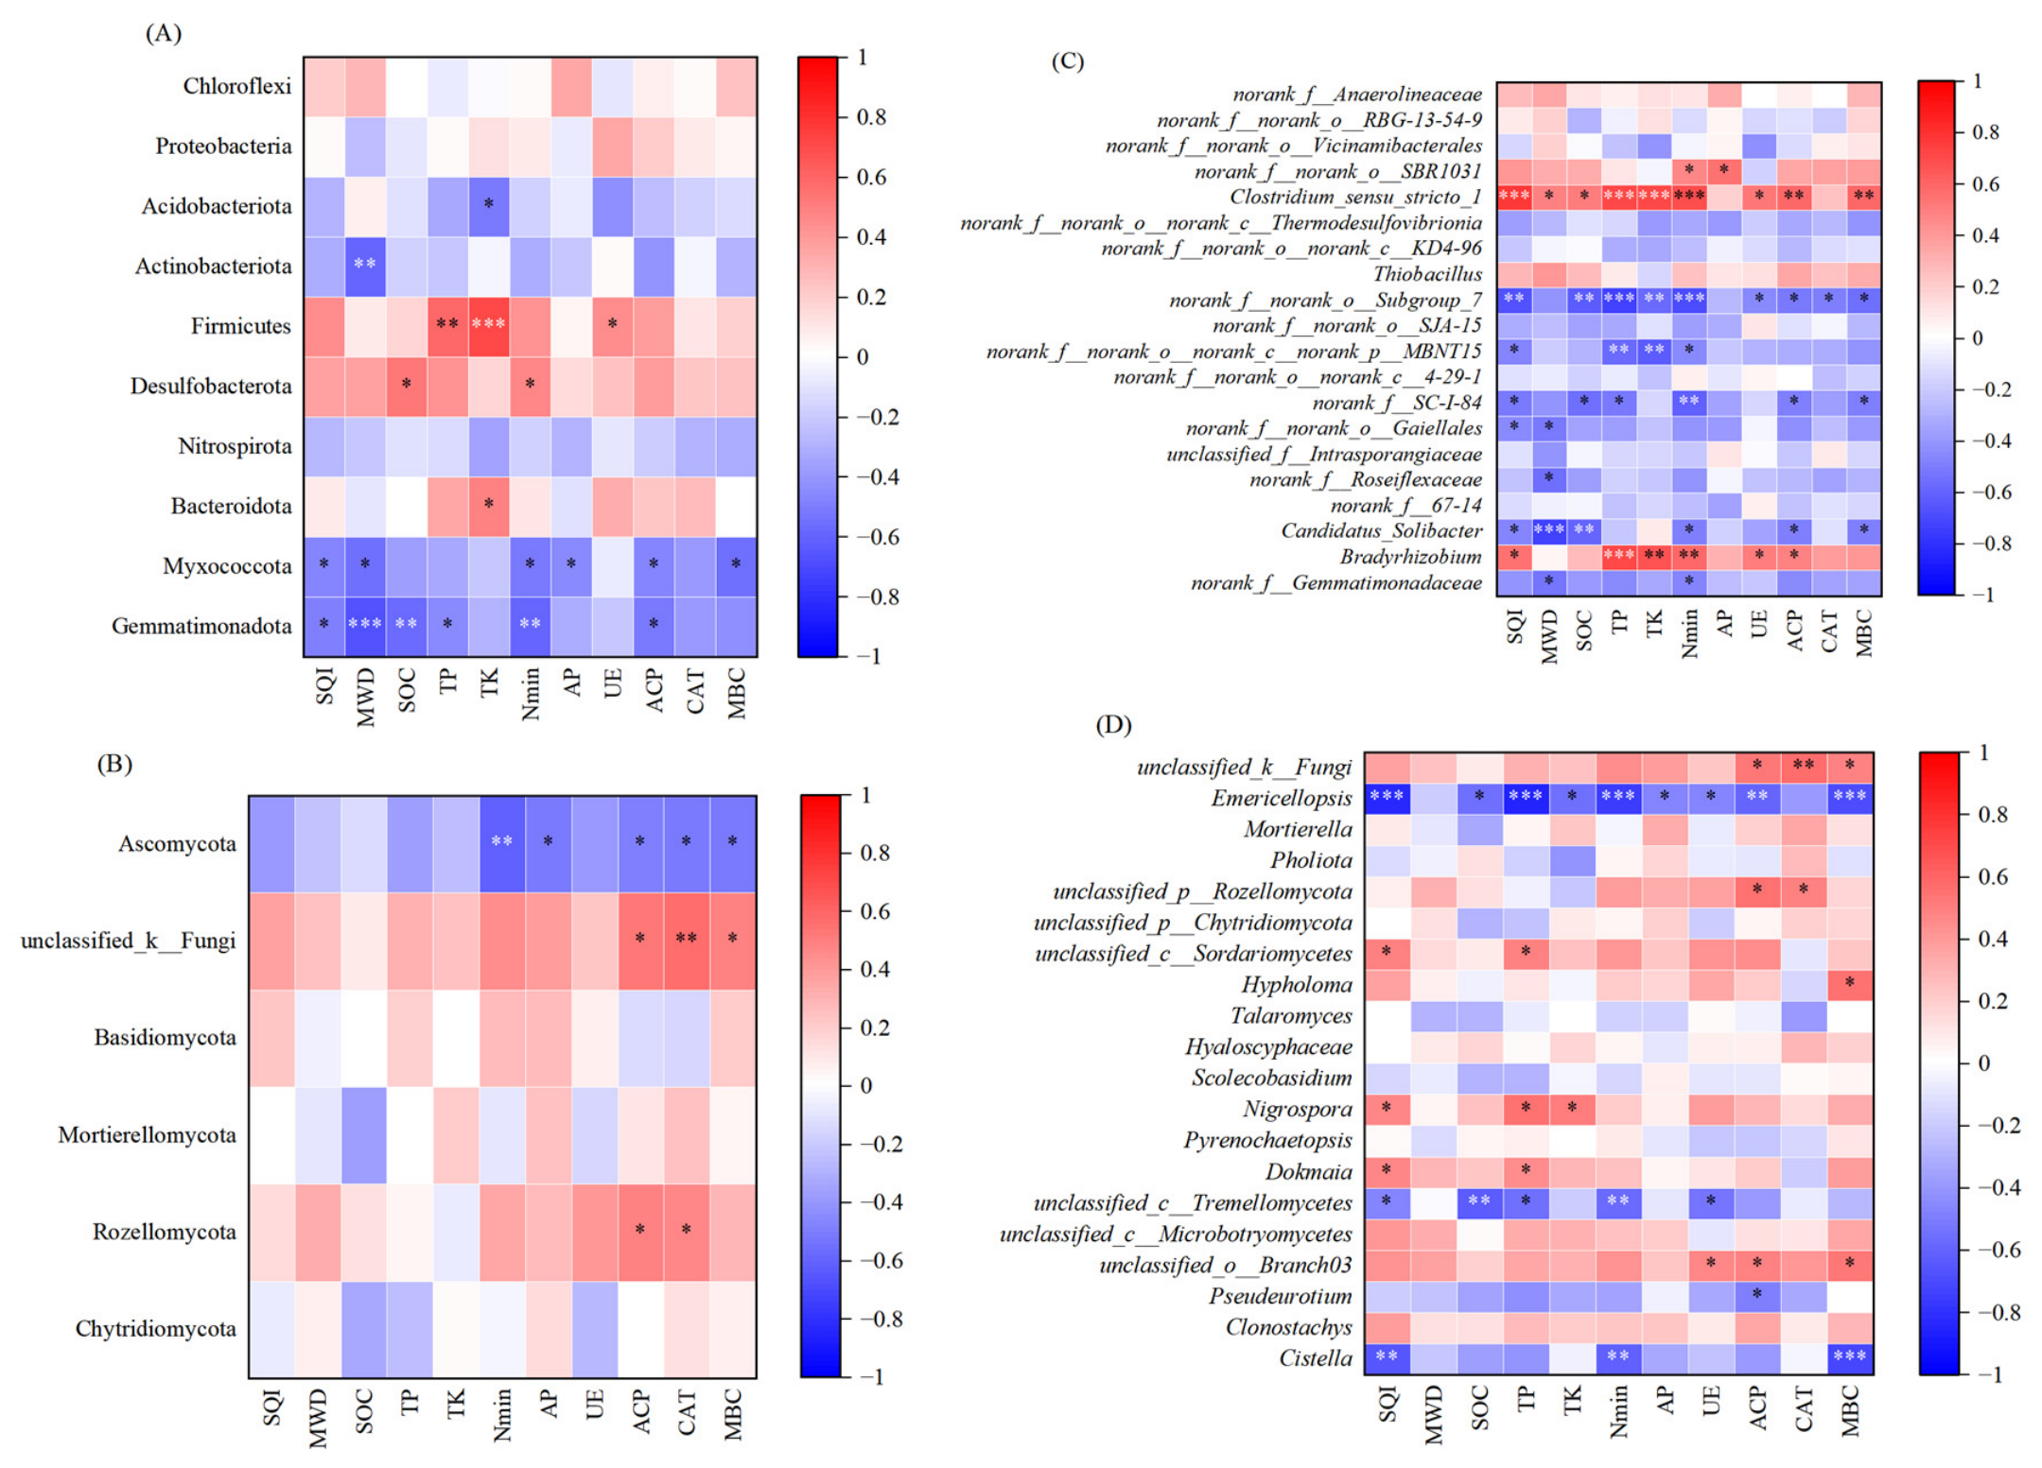
Spearman correlations between dominant microbial taxa and the 11 RDA-selected environmental factors are shown in Figure 9. At the phylum level, Acidobacteriota was negatively correlated with TK (p < 0.05), while Bacteroidota was positively correlated with TK (p < 0.05). Actinobacteriota was negatively correlated with MWD (p < 0.01). Firmicutes showed positive correlations with TP (p < 0.01), TK (p < 0.001), and UE (p < 0.05); Desulfobacterota was positively correlated with SOC and Nmin (p < 0.05). Myxococcota was negatively correlated with SQI, MWD, Nmin, AP, ACP, and MBC (p < 0.05). Gemmatimonadota was negatively correlated with SQI (p < 0.05), MWD (p < 0.001), SOC (p < 0.01), TP (p < 0.05), Nmin (p < 0.01), and ACP (p < 0.05). Ascomycota was negatively correlated with Nmin (p < 0.01), AP, ACP, CAT, and MBC (p < 0.05), whereas Rozellomycota was positively correlated with ACP and CAT (p < 0.05).
At the genus level, Clostridium_sensu_stricto_1 showed significant positive correlations with SQI, TP, TK, Nmin (p < 0.001), ACP, MBC (p < 0.01), MWD, SOC, and UE (p < 0.05). Bradyrhizobium showed significant positive correlations with TP (p < 0.001) TK, Nmin (p < 0.01), SQI, UE, and ACP (p < 0.05). norank_f__norank_o__Subgroup_7 was negatively correlated with all 11 factors (p < 0.05) except MWD and AP. Candidatus_Solibacter was negatively correlated with MWD, SOC (p < 0.001), SQI, Nmin, ACP and MBC (p < 0.05). Emericellopsis was negatively correlated with all 11 factors (p < 0.05) except MWD and CAT. Nigrospora and Dokmaia were positively correlated with SQI and TP (p < 0.05). The unclassified_c__Tremellomycetes showed significant negative correlation with SOC, Nmin (p < 0.01), SQI, TP, and UE (p < 0.05). Cistella was negatively correlated with SQI, Nmin (p < 0.001) and MBC (p < 0.01).
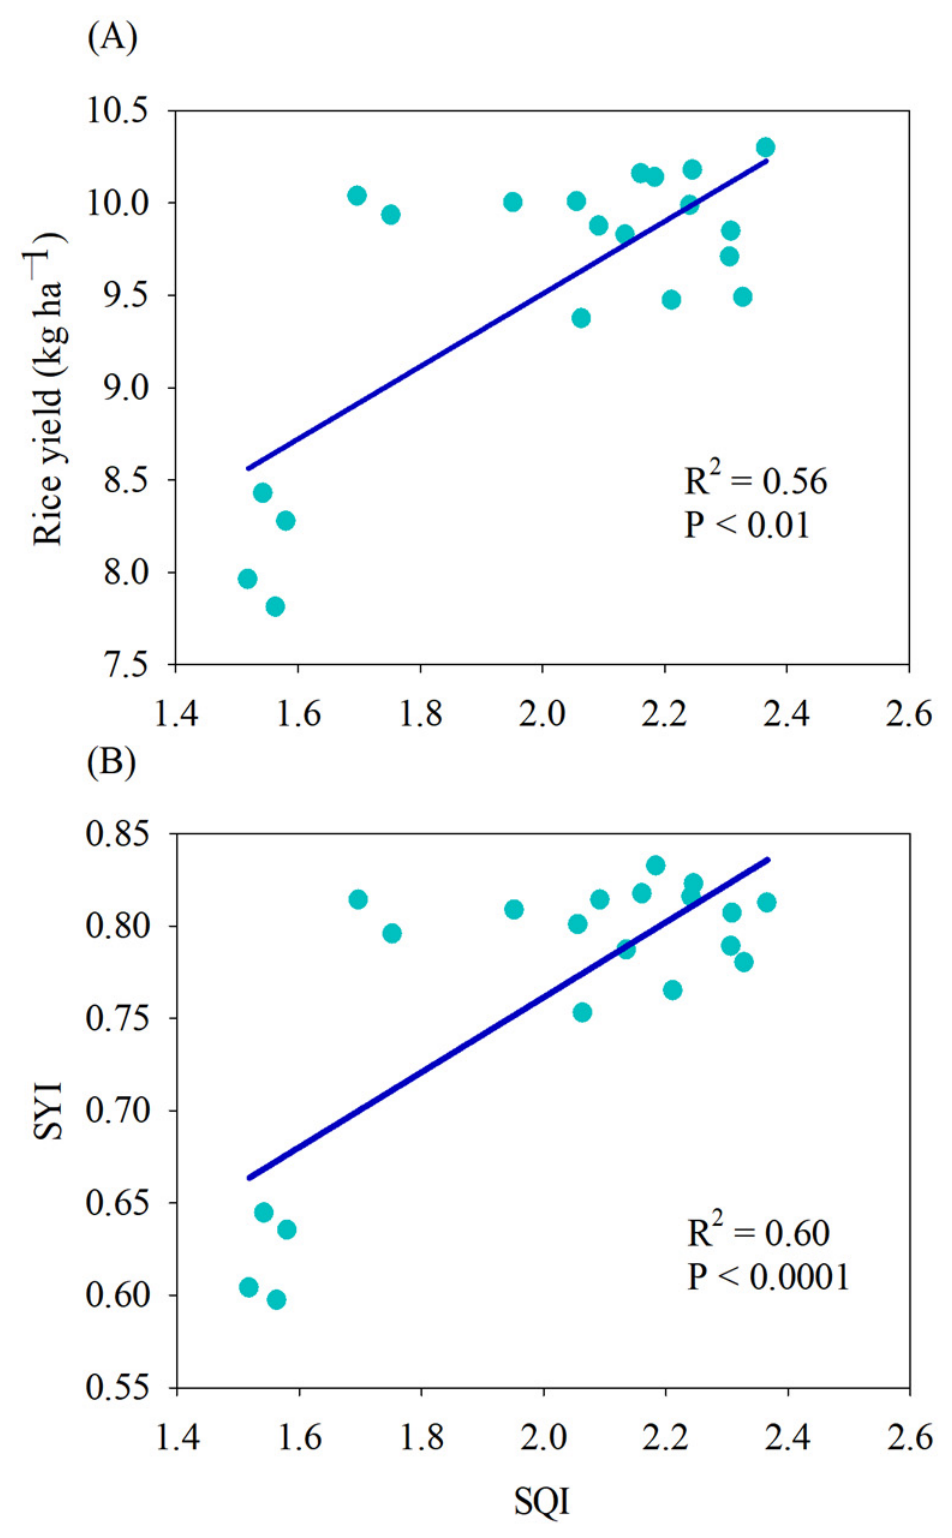
Finally, to elucidate the relationships among soil quality, productivity, and sustainability, we analyzed the correlations among SQI, average rice yield, and SYI (Figure 10). Both rice yield and SYI increased progressively with increasing SQI. Low SQI values corresponded to low yield and SYI, whereas when SQI exceeded 1.90, both yield and SYI improved substantially. These results demonstrate that long-term MV incorporation with reduced chemical fertilizer achieves a synergistic improvement in rice productivity and sustainability.

4. Discussion

Our 13-year field trial demonstrated that MV application with reduced chemical fertilizer (20–40%, MVF80 and MVF60) not only maintained but slightly increased rice yield (1.58–1.71%) compared to the use of 100% chemical fertilizer alone (F100). Moreover, the SYI was markedly improved under MVF60. These results were consistent with previous studies [11,17]. These improvements in both rice yield and sustainability under MV application with reduced chemical fertilizer in paddy soil may be attributed to (i) the alteration of soil physical, chemical, and biological properties due to MV application, and then improving soil quality; and (ii) the reshaping of soil microbial community composition and function due to the improvement of soil microenvironment, particularly the enrichment of specific functional microbial communities, which is conducive to improving soil quality and crop production.

4.1. Effect of MV Incorporation with Reduced Chemical Fertilizer on Soil Properties

Long-term application of legume green manure can effectively improve soil structure and nutrient status, thereby increasing soil fertility levels, mainly owing to its biological nitrogen fixation capacity and the return of fresh organic materials [33]. Previous studies generally used indicators reflecting soil nutrient levels to evaluate soil quality; in contrast, this study developed a comprehensive SQI integrating 15 soil physical, chemical, and biological indicators. SQI under all the treatments of MV incorporation with reduced chemical fertilizer was significantly increased compared with F100, which is similar to Mao et al. [34], who reported an increase in SQI in a post-wheat green manuring system under 30% fertilizer reduction Nmin as the primary contributors to SQI improvement.
In this study, MV application with reduced chemical fertilizer enhanced soil physical structure by reducing soil BD, increasing the number of large macroaggregates and MWD, particularly under MVF60 and MVF40, which is consistent with the reports of Lyu et al. [19]. These effects might be attributable to increased soil porosity due to root penetration of MV and the occupation of soil space by continuously added MV residues [35], as well as the production of organic colloids such as polysaccharides and humus during MV residue decomposition. These colloids form organic–mineral complexes with soil clay minerals and promote the aggregation of microaggregates into macroaggregates [36,37]. MV application with reduced chemical fertilizer also enriched nutrient pools and improved nutrient availability by increasing SOC, MBC and Nmin. Many studies have demonstrated that leguminous green manure straw is rich in carbon and nitrogen nutrients, which directly increase the soil organic carbon pool and provide sufficient resources for microbial growth, thereby promoting microbial proliferation and increasing MBC after incorporation [38,39]. In addition, the biological nitrogen fixation capacity of leguminous green manure (MV) and the mineralization during green manure decomposition can increase soil mineral nitrogen content and improve soil nitrogen availability [40]. We also found that the MVF80 treatment exhibited higher soil TN, TP, and TK contents, which may be attributable to the long-term cumulative effect of greater total nutrient inputs, consequently enhancing soil nutrient reserves. MV application with reduced chemical fertilizer elevated the activities of UE and ACP, which are involved in nitrogen transformation and phosphorus mineralization [41], thereby promoting soil nitrogen and phosphorus cycling and collectively shaping a healthier soil environment. Our results are similar to those of Chen et al. [42], who reported that MV addition increased soil UE and neutral phosphatase activity in high-fertility paddy fields.

4.2. Effect of MV Incorporation with Reduced Chemical Fertilizer on Soil Microbial Community Structure and Function

This study showed that long-term MV incorporation with reduced chemical fertilizer markedly affected soil microbial community structure, and that fungal communities were more sensitive than bacterial communities based on PERMANOVA, which is similar to the results of Liang et al. [43]. These results might be explained by the fact that fungi are mostly saprophytic microorganisms that rely on complex organic substances (such as lignin and cellulose) as carbon and energy sources [44]. After MV incorporation, the organic matter produced by MV decomposition provides them with abundant substrates [45]. The slightly increased relative abundance of Ascomycota under the MVF80 and MVF60 treatments compared with F100 also confirms this effect. Nigrospora is a dominant fungal genus and also belongs to the phylum Ascomycota, and is involved in the decomposition of crop residues [46]; MV incorporation increased the relative abundance of Nigrospora, especially under MVF80. Our research also found that MV incorporation reduced the relative abundance of pathogenic fungal genera such as Fusarium, in agreement with the reports of Zhou et al. [44], who discovered that the application of organic resources rich in cellulose, such as alfalfa straw, significantly reduced the relative abundance of Fusarium.
For bacteria, MV incorporation increased the relative abundance of Firmicutes, especially under MVF80, which is consistent with the reports of Gao et al. [47]. Firmicutes can effectively regulate soil carbon and nitrogen cycling by secreting enzymes to decompose organic carbon and participating in various nitrogen metabolism functions such as nitrogen fixation, nitrification, and denitrification, which may be conducive to improving soil quality [48,49]. Actinobacteria also play an important role in soil carbon and nitrogen cycling but exhibit oligotrophic characteristics in rice fields and have a high demand for nutrients [50]. MV incorporation reduced the relative abundance of Actinobacteriota, especially under MVF40, which is similar to the reports of Fan et al. [51]. This result might be because green manure incorporation increased the abundance of microbial communities with strong nutrient acquisition capabilities (e.g., Firmicutes) and increased competition pressure for nutrients, ultimately leading to a reduction in the relative abundance of Actinobacteriota [52]. MV incorporation increased the relative abundance of beneficial bacterial genera (e.g., Clostridium-sensu-stricto_1 and Bradyrhizobium) but decreased the relative abundance of the deleterious bacteria Candidatus_Solibacter. Clostridium-sensu-stricto_1 and Bradyrhizobium are conducive to nutrient cycling, organic matter degradation, and enhancing plant stress resistance. Zhang et al. [53] also found that the application of microbial organic fertilizer increased the relative abundance of Clostridium-sensu-stricto_1 in a pepper continuous cropping system, and Lu et al. [54] indicated that organic fertilizer substitution increased the relative abundance of Bradyrhizobium in tomato field soil. Liu et al. [55] also reported that application of arbuscular mycorrhizal fungi biofertilizer significantly decreased the abundances of Candidatus_Solibacter.
At the functional level, FAPROTAX prediction showed that MV incorporation increased the relative abundance of functional groups related to nitrogen fixation and fermentation. This might be due to the fact that MV can not only fully utilize natural resources (light, water, and heat) to increase carbon sequestration, but also fix atmospheric nitrogen through rhizobia and enrich it in MV straw [56]. On the other hand, most bacteria in the soil can promote their own growth and reproduction by degrading carbon and nitrogen compounds in organic materials [57]. Therefore, MV incorporation increases the abundance of bacterial functional groups related to carbon and nitrogen cycling. Based on FAPROTAX prediction, we also found that MV incorporation reduced the relative abundance of functional groups related to pathogenic bacteria (animal_parasites_or_symbionts, human_pathogens_all, and human_pathogens_pneumonia) under the MV treatments, and FUNGuild annotation revealed a reduction in the multi-functional pathogen guild (Animal Pathogen–Endophyte–Lichen Parasite–Plant Pathogen–Soil Saprotroph–Wood Saprotroph), in agreement with the reports of Lu et al. [58]. This might be because long-term MV incorporation with reduced chemical fertilizers optimized the physical structure and nutrient availability, effectively improved soil quality, and increased soil microbial activity, thereby inhibiting the proliferation of potential pathogenic microorganisms [59].

4.3. Relationships Among Soil Properties, Microbial Communities, Soil Quality, and Yield

In our study, SQI, MBC, and Nmin were among the strongest environmental drivers of both bacterial and fungal community structures based on RDA, validating the central role of soil quality and microbial biomass in shaping the microbial landscape. These results are similar to the reports of Liu et al. [60] and Xia et al. [61]. We observed significantly positive relationships between beneficial bacterial genera (Clostridium-sensu-stricto_1 and Bradyrhizobium) and soil properties (e.g., SQI, SOC, MBC, TP, TK, and Nmin), suggesting their active roles in carbon decomposition and nitrogen fixation. Conversely, oligotrophic bacterial genus Candidatus_Solibacter declined under the MV treatments, reflecting a shift from a nutrient-limited to a nutrient-rich environment. The significant negative correlation between Candidatus_Solibacter and most soil properties (e.g., SQI, MWD, SOC, Nmin, ACP, and MBC) further supports this hypothesis. Most importantly, SQI showed a strong positive correlation with both rice yield (R2 = 0.56) and SYI (R2 = 0.60), in agreement with previous studies by Xu et al. [62] and Gan et al. [63]. In summary, these findings suggest that long-term MV incorporation with reduced chemical fertilizer alters soil properties and microbial community structure and function, which in turn enhances soil quality, and ultimately leads to higher and more stable rice yields.

4.4. Potential Limitations of This Study

Although this 13-year field experiment provides reliable and robust findings, several limitations should be acknowledged. Soil samples were collected only once, at the end of the experiment (September 2020). While long-term trials inherently reflect the cumulative effects of the treatments, this single sampling time point does not allow us to assess the temporal dynamics of soil microbial communities or soil quality evolution during the experimental period. Future studies with multi-year sampling campaigns are needed to elucidate the trajectories of microbial community assembly and soil quality development under the green manure–rice cropping system. In addition, our sampling was limited to the topsoil (0–20 cm), which is the primary zone of green manure incorporation and rice root activity. However, green manure roots may penetrate deeper soil layers, and long-term green manure return may also affect subsoil properties and microbial communities. Future research should explore the effects of green manure incorporation on deeper soil profiles.
Furthermore, the functional predictions derived from FAPROTAX (for bacteria) and FUNGuild (for fungi) are based on taxonomic annotation rather than direct functional assays (e.g., metagenomics, metatranscriptomics). Although these predictive tools are widely accepted and validated in numerous soil microbial ecology studies [18,64], they are inherently inferential and may not fully capture the complexity of actual functional processes in the soil environment. Moreover, while we have identified correlations between microbial community shifts and soil quality improvement, the specific mechanisms by which beneficial taxa and functional genes contribute to soil quality enhancement under long-term green manure incorporation with reduced chemical fertilizer remain to be fully elucidated. Therefore, future studies employing metagenomic or metatranscriptomic approaches will be valuable for unraveling the contributions of key microbial communities and functional genes to soil quality enhancement, further elucidating the mechanisms by which green manure incorporation synergistically improves soil quality and yield sustainability, and informing regional agricultural policies and management practices.

5. Conclusions

In this study, we demonstrated that long-term MV incorporation with reduced chemical fertilizer (20–40%, particularly MVF60) not only sustained but slightly increased rice yield by 1.71% and significantly improved yield sustainability (SYI, by 26.7%) compared with conventional chemical fertilizer alone. The synergistic improvements in crop productivity and sustainability were primarily attributed to two integrated mechanisms: (i) MV incorporation improved soil physical structure (reduced bulk density, increased macroaggregates and MWD), enriched nutrient pools (SOC, Nmin, and available P), and elevated enzyme activities (urease and acid phosphatase), collectively enhancing the comprehensive soil quality index (SQI); and (ii) MV incorporation reshaped soil microbial communities, enriched beneficial taxa (e.g., Clostridium_sensu_stricto_1, Bradyrhizobium, and Nigrospora) and functional groups (nitrogen fixation and fermentation), while suppressing pathogenic groups (e.g., Fusarium and multi-functional pathogen guilds). Moreover, SQI showed strong positive correlations with both rice yield and sustainability index. We conclude that MV incorporation with 40% chemical fertilizer reduction is strongly recommended for rice production in the South China and similar transitional climate zones. These findings provide practical guidance for farmers and policymakers to further reduce fertilizer inputs, enhance agronomic efficiency, and improve soil quality in green manure–rice rotation systems, thereby contributing to regional green and sustainable agricultural development.

Supplementary Materials

The following supporting information can be downloaded at: https://www.mdpi.com/article/10.3390/agriculture16151670/s1, Table S1: The total input of nitrogen, phosphorus, and potassium for each treatment (kg ha−1 yr−1); Table S2: Relative abundance of the dominant phyla of bacteria after 13 years of the different fertilization treatments; Table S3: Relative abundance of bacterial genus with significant differences between different fertilization treatments; Table S4: Relative abundance of the dominant phyla of fungi after 13 years of the different fertilization treatments; Table S5: Relative abundance of fungal genus with significant differences between different fertilization treatments; Table S6: Relative abundance of predicted bacterial functional groups with significant differences between different fertilization treatments; Table S7: Relative abundance of fungal functional guilds with significant differences between different fertilization treatments.

Author Contributions

C.L. designed the research and supervised the project. J.Z., M.T., C.Z., G.D. and L.Z. collected and analyzed the data. Y.L. and W.C. provided a platform and technical service for field experiments. J.Z. wrote the manuscript. All authors have read and agreed to the published version of the manuscript.

Funding

The current work was funded by the Natural Science Foundation of Henan (242300421577), the Excellent Youth Science and Technology Fund of Henan Academy of Agricultural Sciences (2024YQ10), the Basic Research Business Fund of Henan Academy of Agricultural Sciences (2026ZC53), the Henan Provincial Science and Technology Research Project (262102110229), the Doctoral Innovation Project of Henan Academy of Agricultural Sciences (No. 2026BX38), and the earmarked fund for CARS-Green manure (CARS-22).

Data Availability Statement

The original contributions presented in this study are included in the article/Supplementary Material. Further inquiries can be directed to the corresponding author.

Conflicts of Interest

The authors declare no conflicts of interest.

Abbreviations

The following abbreviations are used in this manuscript:
MVChinese milk vetch
Fchemical fertilizer
BDbulk density
MWDmean weight diameter
SOCsoil organic carbon
TNtotal nitrogen
TPtotal phosphorus
TKtotal potassium
Nminmineral nitrogen
APavailable phosphorus
AKavailable potassium
CECcation exchange capacity
MBCmicrobial biomass carbon
MBNmicrobial biomass nitrogen
SQIsoil quality index
UEurease
ACPacid phosphatase
SCsucrase
CATcatalase
SYIsustainable yield index

References

  1. Li, G.; Liu, J.; Yao, J.; He, T.; Xiao, J.; Nangia, V.; Liu, Y. Wheat/pea intercropping with reduced nitrogen inputs maintains crop productivity but lowers soil nitrate residues and N2O emissions: Evidence at crop and cropping system levels. Agric. Ecosyst. Environ. 2026, 404, 110354. [Google Scholar]
  2. Fan, Z.; Qiang, B.; Zhang, X.; Lin, Y.; Wu, Y.; Zhao, X.; Liu, E.; Cai, T.; Zhang, P.; Liu, T.; et al. Optimizing light and nitrogen distribution in maize-soybean intercropping systems to enhance crop yield. Eur. J. Agron. 2026, 172, 127853. [Google Scholar]
  3. Montgomery, D.R. Soil security and global food security. Front. Agric. Sci. Eng. 2024, 11, 297–302. [Google Scholar]
  4. Yang, J.; Ren, Y.; Jia, M.; Huang, S.; Guo, T.; Liu, B.; Liu, H.; Zhao, P.; Wang, L.; Jie, X. Improving soil quality and crop yield of fluvo-aquic soils through long-term organic-inorganic fertilizer combination: Promoting microbial community optimization and nutrient utilization. Environ. Technol. Innov. 2025, 37, 104050. [Google Scholar] [CrossRef] [Scilit]
  5. Yu, R.; Zhou, J.; Chang, F.; Song, J.; Wang, J.; Li, X.; Zhang, H.; Cao, J.; Li, X.; Liu, H.; et al. Green manure co-application boosts arid agroecosystem sustainability: Mixed sowing of feed rape and hairy vetch modulates N input and enzymes for optimized wheat production. Field Crop. Res. 2026, 341, 110389. [Google Scholar] [CrossRef] [Scilit]
  6. Deng, S.; Abdellah, Y.; Chen, H.; Gao, P.; Abdallah, M.; Rana, M.; Yu, F.; Dai, Q.; Wang, R.; Wang, R. Optimizing agricultural management practices to promote ratoon rice yield during ratoon crop: A comprehensive global meta-analysis. Field Crop. Res. 2025, 328, 109943. [Google Scholar] [CrossRef] [Scilit]
  7. Liu, J.; Shu, P.; Song, W.; Shi, W.; Li, M.; Zhang, W.; Li, Z.; Liu, G.; Yuan, F.; Zhang, S.; et al. Long-term organic fertilizer substitution increases rice yield by improving soil properties and regulating soil bacteria. Geoderma 2021, 404, 115287. [Google Scholar] [CrossRef] [Scilit]
  8. Wang, J.; Yang, X.; Huang, S.; Wu, L.; Cai, Z.; Xu, M. Long-term combined application of organic and inorganic fertilizers increases crop yield sustainability by improving soil fertility in maize–wheat cropping systems. J. Integr. Agric. 2025, 24, 290–305. [Google Scholar]
  9. Yuan, B.; Dong, Y.; Hu, A.; Wang, Y.; Sun, Y.; Li, C. Effects of green manure intercropping on soil nutrient content and bacterial community structure in litchi orchards in China. Front. Environ. Sci. 2023, 10, 1059800. [Google Scholar] [CrossRef] [Scilit]
  10. Wei, J.; Yin, W.; Chai, Q.; Fan, Z.; Hu, F.; Zhao, L. How does the long-term return of mix-sowing green manures increase nitrogen utilization and decrease ecological costs of wheatland under reduced chemical nitrogen input? Resour. Environ. Sustain. 2025, 21, 100220. [Google Scholar] [CrossRef] [Scilit]
  11. Gao, S.; Zhou, G.; Chang, D.; Liang, H.; Nie, J.; Liao, Y.; Lu, Y.; Xu, C.; Liu, J.; Wu, J.; et al. Southern China can produce more high-quality rice with less N by green manuring. Resour. Conserv. Recycl. 2023, 196, 107025. [Google Scholar] [CrossRef] [Scilit]
  12. Li, Z.; Zhang, X.; Xu, J.; Cao, K.; Wang, J.; Xu, C.; Cao, W. Green manure incorporation with reductions in chemical fertilizer inputs improves rice yield and soil organic matter accumulation. J. Soils Sediments 2020, 20, 2784–2793. [Google Scholar] [CrossRef] [Scilit]
  13. Wang, P.; Yu, A.; Jiang, K.; Pang, X.; Huo, J.; Wang, Y.; Shang, Y.; Hou, S. Green manure incorporation with 20% nitrogen reduction enhances soil organic carbon storage by improving aggregate stability and functional group composition. Agric. Ecosyst. Environ. 2026, 401, 110298. [Google Scholar] [CrossRef] [Scilit]
  14. Kamran, M.; Huang, L.; Nie, J.; Geng, M.; Lu, Y.; Liao, Y.; Zhou, F.; Xu, Y. Effect of reduced mineral fertilization (NPK) combined with green manure on aggregate stability and soil organic carbon fractions in a fluvo-aquic paddy soil. Soil Tillage Res. 2021, 211, 105005. [Google Scholar] [CrossRef] [Scilit]
  15. Qiu, H.; Yin, W.; Li, P.; Zhang, D.; Wei, J.; Zhao, L.; Wang, P.; Fan, Z.; Hu, F. Green manure returning improves wheat yield and N utilization efficiency by minimizing N loss in Oasis irrigation area of China. Crop J. 2025, 13, 1884–1897. [Google Scholar] [CrossRef] [Scilit]
  16. Jia, R.; Zhou, J.; Chu, J.; Shahbaz, M.; Yang, Y.; Jones, D.; Zang, H.; Razavi, B.; Zeng, Z. Insights into the associations between soil quality and ecosystem multifunctionality driven by fertilization management: A case study from the North China Plain. J. Clean. Prod. 2022, 362, 132265. [Google Scholar] [CrossRef] [Scilit]
  17. Zhang, J.; Nie, J.; Cao, W.; Gao, Y.; Lu, Y.; Liao, Y. Long-term green manuring to substitute partial chemical fertilizer simultaneously improving crop productivity and soil quality in a double-rice cropping system. Eur. J. Agron. 2023, 142, 126641. [Google Scholar] [CrossRef] [Scilit]
  18. Xiao, J.; Zhang, J.; Yuan, H.; Xie, X.; Gao, Y.; Lu, Y.; Liao, Y.; Nie, J. Long-term application of legume green manure improves rhizosphere soil bacterial stability and reduces bulk soil bacterial stability in rice. Eur. J. Soil Biol. 2024, 122, 103652. [Google Scholar] [CrossRef] [Scilit]
  19. Lyu, H.; Yu, A.; Chai, Q.; Wang, F.; Wang, Y.; Wang, P.; Shang, Y.; Yang, X. Enhancing soil quality and crop yield by increasing dominant bacterial abundance and reducing bacterial diversity under no-tillage with total green manure incorporation. Agric. Ecosyst. Environ. 2025, 378, 109303. [Google Scholar] [CrossRef] [Scilit]
  20. Bender, S.; Schulz, S.; Martinez-Cuesta, R.; Laughlin, R.; Kublik, S.; PfeifferZakharova, K.; Vestergaard, G.; Hartman, K.; Parlade, E.; Rombke, J.; et al. Simplification of soil biota communities impairs nutrient recycling and enhances above- and belowground nitrogen losses. New Phytol. 2023, 240, 2020–2034. [Google Scholar] [CrossRef] [Scilit] [PubMed]
  21. Wang, X.; Feng, J.; Ao, G.; Qin, W.; Han, M.; Shen, Y.; Liu, M.; Chen, Y.; Zhu, B. Globally nitrogen addition alters soil microbial community structure, but has minor effects on soil microbial diversity and richness. Soil Biol. Biochem. 2023, 179, 108982. [Google Scholar] [CrossRef] [Scilit]
  22. Khan, A.; Chen, Y.; Asghar, R.; Azeem, I.; Shah, T.; Cao, W.; Zhang, D.; Gao, Y. P-solubilising bacteria and P-cycling genes drive soil P transformation during green manure decomposition. Agric. Ecosyst. Environ. 2025, 394, 109875. [Google Scholar] [CrossRef] [Scilit]
  23. Yang, R.; Song, S.; Chen, S.; Du, Z.; Kong, J. Adaptive evaluation of green manure rotation for a low fertility farmland system: Impacts on crop yield, soil nutrients, and soil microbial community. Catena 2023, 222, 106873. [Google Scholar] [CrossRef] [Scilit]
  24. Zeng, Q.; Yin, M.; Fu, L.; Singh, B.; Liu, S.; Chen, H.; Ge, A.; Han, L.; Zhang, L. Green manure substitution for potassium fertilizer promotes agro-ecosystem multifunctionality via triggering interactions among soil, plant and rhizosphere microbiome. Plant Soil 2024, 498, 431–450. [Google Scholar]
  25. Wang, C.; Kuzyakov, Y. Mechanisms and implications of bacterial-fungal competition for soil resources. ISME J. 2024, 18, wrae073. [Google Scholar] [CrossRef] [Scilit] [PubMed]
  26. Bao, S.D. Soil and Agricultural Chemistry Analysis; China Agriculture Press: Beijing, China, 2000. (In Chinese) [Google Scholar]
  27. Dai, W.; Feng, G.; Huang, Y.; Adeli, A.; Jenkins, J. Influence of cover crops on soil aggregate stability, size distribution and related factors in a no-till field. Soil Tillage Res. 2024, 244, 106197. [Google Scholar] [CrossRef] [Scilit]
  28. Huang, J.; Xu, Y.; Peng, M.; Jia, R.; Chu, J.; Kumar, A.; Ren, C.; Yang, Y.; Wang, D.; Wang, X. Navigating the trade-offs in crop production and soil quality through alternative cropping. Field Crop. Res. 2024, 318, 109597. [Google Scholar] [CrossRef] [Scilit]
  29. Jiang, Y.; Lin, X.; Wang, H.; Xu, Y.; Lin, W. Effect of intercropping with forage soybean on the rhizosphere soil nutrients of tea plants. Catena 2025, 255, 109060. [Google Scholar] [CrossRef] [Scilit]
  30. Wang, Y.; Yang, W.; Ming, R.; Jing, W.; Cui, H.; Zhang, Y.; Lu, P. A novel perspective on atrazine-induced stress in potato seedlings and its alleviation by green manure (Vicia villosa): Insights from physiological and underlying mechanisms. J. Hazard. Mater. 2025, 498, 139926. [Google Scholar] [CrossRef] [Scilit] [PubMed]
  31. Liu, Q.; Yao, W.; Zhou, J.; Peixoto, L.; Qi, Z.; Mganga, K.; Yang, Y.; Zeng, Z.; Zang, H. Winter green manure cultivation benefits soil quality and ecosystem multifunctionality under upland paddy rotations in tropics. Plant Soil 2025, 511, 395–407. [Google Scholar]
  32. Kuzyakov, Y.; Gunina, A.; Zamanian, K.; Tian, J.; Luo, Y.; Xu, X.; Yudina, A.; Aponte, H.; Alharbi, H.; Ovsepyan, L.; et al. New approaches for evaluation of soil health, sensitivity and resistance to degradation. Front. Agric. Sci. Eng. 2020, 7, 282–288. [Google Scholar] [CrossRef] [Scilit]
  33. Wang, X.; Wang, Y.; Nan, Y.; Yu, A.; Zhao, C.; Yin, W.; Hu, F.; Zhang, H.; Chai, Q.; Fan, Z. Recent advances in soil carbon sequestration and emission reduction within legume green manure enhanced rotation systems: A review. J. Agric. Food Res. 2026, 26, 102664. [Google Scholar] [CrossRef] [Scilit]
  34. Mao, X.; Cui, H.; Liu, R.; Zhang, J.; Yu, A.; Chang, D.; Cao, W. Using attapulgite to reduce nitrous oxide emissions in a post-wheat green manuring system under 30% fertilizer reduction. Eur. J. Agron. 2026, 179, 128186. [Google Scholar] [CrossRef] [Scilit]
  35. Ogilvie, C.; Ashiq, W.; Vasava, H.B.; Biswas, A. Quantifying root-soil interactions in cover crop systems: A review. Agriculture 2021, 11, 218. [Google Scholar] [CrossRef] [Scilit]
  36. Huang, Y.; Huang, L.; Nie, J.; Geng, M.; Lu, Y.; Liao, Y.; Xue, B. Effects of substitution of chemical fertilizer by Chinese milk vetch on distribution and composition of aggregates-associated organic carbon fractions in paddy soils. Plant Soil 2022, 481, 641–659. [Google Scholar] [CrossRef] [Scilit]
  37. Park, S.; Lee, J. Green manure improves humification and aggregate stability in paddy soils. Soil Biol. Biochem. 2025, 206, 109796. [Google Scholar] [CrossRef] [Scilit]
  38. Zhou, G.; Li, G.; Liang, H.; Liu, R.; Ma, Z.; Gao, S.; Chang, D.; Liu, J.; Chadwick, D.; Jones, D.; et al. Green manure coupled with straw returning increases soil organic carbon via decreased priming effect and enhanced microbial carbon pump. Glob. Change Biol. 2025, 31, e70232. [Google Scholar] [CrossRef] [Scilit] [PubMed]
  39. Xu, X.; Li, X.; Liu, Z.; Fan, Z.; Yin, W.; Hu, F.; Chai, Q. Green manure intercropping increases soil microbial necromass and lignin contents under reduced nitrogen fertilization in maize production. Soil Tillage Res. 2026, 263, 107248. [Google Scholar] [CrossRef] [Scilit]
  40. Liu, L.; Zhu, Q.; Chen, K.; Zhang, X.; Yang, Y.; Zhu, Y.; Meng, L.; Zhu, T.; Elrys, A.; Müller, C. The ability of legumes to alleviate soil microbial N limitation in degraded ecosystems depends on free-living N fixation and organic N mineralization. Soil Biol. Biochem. 2026, 221, 110223. [Google Scholar] [CrossRef] [Scilit]
  41. Dong, X.; Xiao, Y.; Wang, Z.; Li, M.; Han, S.; Zhao, K.; Ren, F.; Zheng, J. Microbial nitrogen-phosphorus imbalance induced by low-and high carbon-nitrogen ratio straw addition promotes soil CO2 emissions. Agric. Ecosyst. Environ. 2026, 396, 110029. [Google Scholar] [CrossRef] [Scilit]
  42. Chen, L.; Li, S.; Zhang, H.; Song, Y.; Zhang, X.; Qiu, W.; Lei, Y.; Fei, Y.; Nie, H.; Yi, J. Organic fertilization reshapes microbial networks and CN cycling gene abundances to regulate rice yield and quality in high-fertility paddy fields. Agric. Ecosyst. Environ. 2026, 410, 110542. [Google Scholar] [CrossRef] [Scilit]
  43. Liang, H.; Gao, S.; Li, S.; Wang, Y.; Fu, L.; Li, Z.; Dong, W.; Wei, C.; Tang, H.; He, T.; et al. Green manuring improved tobacco performance by modulating soil microbial species pool and microbial communities across soil-root continuum. Ind. Crop. Prod. 2026, 245, 123244. [Google Scholar] [CrossRef] [Scilit]
  44. Zhou, X.; Yan, Y.; Li, Y.; Liu, L.; Zhou, J.; Dai, C.; Cai, Z.; Huang, X. Application of cellulose-rich organic resource improves soil quality and plant growth by recruiting beneficial microorganisms. Appl. Soil Ecol. 2025, 207, 105909. [Google Scholar] [CrossRef] [Scilit]
  45. Chang, F.; Zhang, H.; Zhao, P.; Zhao, N.; Song, J.; Yu, R.; Wang, J.; Han, D.; Liu, X.; Jie, Z.; et al. Green manure roots return drives saline-alkali soil organic carbon accumulation via microbial necromass formation. Soil Tillage Res. 2025, 251, 106550. [Google Scholar] [CrossRef] [Scilit]
  46. Huang, K.; Li, M.; Li, R.; Rasul, F.; Shahzad, S.; Wu, C.; Shao, J.; Huang, G.; Li, R.; Almari, S.; et al. Soil acidification and salinity: The importance of biochar application to agricultural soils. Front. Plant Sci. 2023, 14, 1206820. [Google Scholar] [CrossRef] [Scilit] [PubMed]
  47. Gao, S.; Cao, W.; Zhou, G.; Rees, R.M. Bacterial communities in paddy soils changed by milk vetch as green manure: A study conducted across six provinces in South China. Pedosphere 2021, 31, 521–530. [Google Scholar] [CrossRef] [Scilit]
  48. Pang, G.; Cai, F.; Li, R.; Zhao, Z.; Li, R.; Gu, X.; Shen, Q.R.; Chen, W. Trichoderma-enriched organic fertilizer can mitigate microbiome degeneration of monocropped soil to maintain better plant growth. Plant Soil 2017, 416, 181–192. [Google Scholar] [CrossRef] [Scilit]
  49. Kong, J.; He, Z.; Chen, L.; Yang, R.; Du, J. Efficiency of biochar, nitrogen addition, and microbial agent amendments in remediation of soil properties and microbial community in Qilian Mountains mine soils. Ecol. Evol. 2021, 11, 9318–9331. [Google Scholar] [CrossRef] [Scilit] [PubMed]
  50. Yang, J.; Zhou, Z.; Li, Y.; Hu, H.; Sun, Z.; Yuan, C. Differences in life history strategies of bacteria between paddy and upland soils and implications for carbon sequestration. Geoderma 2026, 471, 117856. [Google Scholar] [CrossRef] [Scilit]
  51. Fan, C.; Liu, J.; He, G.; Bao, M.; He, H.; Wang, C.; Li, G. Dynamic coupling mechanisms of wheat yield-soil nutrient-soil bacteria under optimal external nutrient inputs. Plant Soil 2025. [Google Scholar] [CrossRef] [Scilit]
  52. Dong, J.; Wang, P.; Cong, P.; Song, W.; Zheng, X.; Liu, N.; Wang, Y.; Xiao, X.; Zhai, Z.; Li, Y.; et al. Granulated straw incorporation with rotary tillage increases the content of soil organic carbon fractions and available nutrients and shifts bacterial communities in East China. Front. Plant Sci. 2025, 16, 1520760. [Google Scholar] [CrossRef] [Scilit] [PubMed]
  53. Zhang, C.; Zhang, L.; Cao, Y.; Zhang, S.; Hou, C.; Zhang, C. Effects of microbial organic fertilizer, microbial inoculant, and quicklime on soil microbial community composition in pepper (Capsicum annuum L.) continuous cropping system. Horticulturae 2024, 10, 1142. [Google Scholar] [CrossRef] [Scilit]
  54. Lu, C.; Luo, J.; Sheng, T.; Xie, Y.; Xian, Y.; Jiang, Y.; Li, X.; Yao, M. Diazotrophic communities shift with organic fertilizer substitution and growth stages in tomato field soil. Eur. J. Soil Biol. 2025, 126, 103746. [Google Scholar] [CrossRef] [Scilit]
  55. Liu, N.; Shao, C.; Sun, H.; Liu, Z.; Guan, Y.; Wu, L.; Zhang, L.; Pan, X.; Zhang, Z.; Zhang, Z.; et al. Arbuscular mycorrhizal fungi biofertilizer improves American ginseng (Panax quinquefolius L.) growth under the continuous cropping regime. Geoderma 2020, 363, 114155. [Google Scholar] [CrossRef] [Scilit]
  56. Baath, G.; Sarkar, S.; Northup, B.; Sapkota, B.; Gowda, P.; Flynn, K. Summer pulses as sources of green manure and soil cover in the US Southern Great Plains. Crop Environ. 2023, 2, 66–74. [Google Scholar] [CrossRef] [Scilit]
  57. Zhao, L.; Liu, Y.; Wang, Z.; Yuan, S.; Qi, J.; Zhang, W.; Wang, Y.; Li, X. Bacteria and fungi differentially contribute to carbon and nitrogen cycles during biological soil crust succession in arid ecosystems. Plant Soil 2020, 447, 379–392. [Google Scholar] [CrossRef] [Scilit]
  58. Lu, J.; Xing, X.; Kang, Y.; Yin, J.; Yuan, D.; Liu, J. Replacement of chemical fertilizer with green manure at different proportions affects fungal community in the paddy field of Ultisol. Acta Microbiol. Sin. 2025, 65, 323–336. [Google Scholar]
  59. Lei, G.; Han, Z.; Wang, X.; Malacrinò, A.; Kang, T.; Zhang, D.; Zhang, J.; Zhang, Z.; Wu, H. Synthetic microbial communities rescues strawberry from soil-borne disease by enhancing soil functional microbial abundance and multifunctionality. J. Adv. Res. 2026, 83, 113–128. [Google Scholar] [CrossRef] [Scilit] [PubMed]
  60. Liu, W.; Zhu, Z.; Lu, Z.; Oladele, O.; Dang, Y.; Zhao, X.; Zhang, H. Soil quality associated with microbial community characteristics and dominant taxa across different tillage practices. Land Degrad. Dev. 2024, 35, 4682–4695. [Google Scholar] [CrossRef] [Scilit]
  61. Xia, H.; Chen, Y.; Yu, Z.; Zeng, X.; Yin, S.; Li, X.; Zhang, K. Plant carbon allocation, soil carbon and nutrient condition, and microbial community jointly regulate microbial biomass carbon accumulation. Plant Soil 2025, 513, 1503–1520. [Google Scholar] [CrossRef] [Scilit]
  62. Xu, Y.; Hou, Q.; Xiang, J.; Gao, M.; Shao, P.; Chen, S.; Fu, Z.; Long, P.; Huang, C. Evaluation of soil quality and system sustainability in ratoon rice paddy field under green manure application in central China. Field Crop. Res. 2025, 333, 110087. [Google Scholar] [CrossRef] [Scilit]
  63. Gan, J.; Xu, X.; Tang, S.; Han, K.; Sun, T.; Ma, J.; Yang, X.; Liu, X.; Fu, H.; Pang, Z.; et al. Long-term cultivation of indica-japonica hybrid rice reshapes the sustainability of rice systems by simultaneously enhancing yield, nitrogen use efficiency, and soil health. Eur. J. Agron. 2026, 175, 127973. [Google Scholar] [CrossRef] [Scilit]
  64. Yu, Y.; Zheng, L.; Zhou, Y.; Sang, W.; Zhao, J.; Liu, L.; Li, C.; Xiao, C. Changes in soil microbial community structure and function following degradation in a temperate grassland. J. Plant Ecol. 2021, 14, 384–397. [Google Scholar] [CrossRef] [Scilit]
Figure 1. Rice yield (A) and sustainable yield index (B) across different fertilization treatments during the 13-year experimental period (2008–2020). In the box plots (A), the central horizontal line indicates the median, while the small squares represent the mean. The lower and upper box boundaries correspond to the 25th and 75th percentiles, respectively, and the whisker caps extend to the 5th and 95th percentiles; outliers are shown as individual dots. Each box summarizes 52 observations (13 years × 4 replicates). In the bar graph (B), vertical error bars indicate the standard deviation of the mean (n = 4). Different lowercase letters above the boxes or bars denote significant differences among treatments at p < 0.05.
Agriculture 16 01670 g001
Figure 2. Aggregate distribution (A) and mean weight diameter (B) under the different fertilization treatments. Different lowercase letters indicate significant differences among the different fertilization treatments at p < 0.05.
Agriculture 16 01670 g002
Figure 3. Soil quality index (SQI) (A) under the different fertilization treatments, and contribution of soil properties to SQI (B). The red column in Figure B represents that this soil characteristic index is significant, while the blue column represents that this soil characteristic index is not significant. Different lowercase letters indicate significant differences among the different fertilization treatments at p < 0.05. The contribution of soil properties to SQI represented the importance of variables by random forest classification analysis. ns, no significant difference; * p < 0.05; ** p < 0.01; BD, bulk density; MWD, mean weight diameter; SOC, soil organic carbon; TN, total nitrogen; TP, total phosphorus; TK, total potassium; Nmin, mineral nitrogen; AP, available P (Olsen-P); AK, available K; CEC, cation exchange capacity; UE, urease; ACP, acid phosphatase; SC, sucrase; CAT, catalase; MBC, microbial biomass carbon; MBN, microbial biomass nitrogen.
Agriculture 16 01670 g003
Figure 4. Effect of different fertilization treatments on bacterial (A) and fungal (B) community structure on genus level (PCoA analysis).
Agriculture 16 01670 g004
Figure 5. The composition of the soil microbial community under the different fertilization treatments. (A,B) are the soil bacterial and fungal compositions on the phylum level; (C,D) are the heatmaps of the top 20 soil bacterial and fungal compositions on the genus level. “aE+b” represents “a × 10b”.
Agriculture 16 01670 g005
Figure 6. Predicted bacterial functional groups based on FAPROTAX analysis across different fertilization treatments. “aE+b” represents “a × 10b”.
Agriculture 16 01670 g006
Figure 7. Relative abundance of fungal functional guilds based on FUNGuild annotation across different fertilization treatments.
Agriculture 16 01670 g007
Figure 8. Redundancy analysis (RDA) of bacterial (A) and fungal (B) community structure on genus level by soil properties.
Agriculture 16 01670 g008
Figure 9. The correlation between the main phyla and genera of bacteria and fungi and soil properties. (A,B) are soil bacterial and fungal compositions on the phylum level; (C,D) are the heatmaps of the top 20 soil bacterial and fungal compositions on the genus level. * p < 0.05; ** p < 0.01; *** p < 0.001; MWD, mean weight diameter; SOC, soil organic carbon; TP, total phosphorus; TK, total potassium; Nmin, mineral nitrogen; AP, available P (Olsen-P); UE, urease; ACP, acid phosphatase; CAT, catalase; MBC, microbial biomass carbon.
Agriculture 16 01670 g009
Figure 10. Correlation between soil quality index, rice yield, and sustainable yield index. (A) is the correlation between soil quality index (SQI) and rice yield; (B) is the correlation between SQI and sustainable yield index (SYI). Each point represents an individual plot (n = 20), with different treatments; the solid line indicates the linear regression fit, the coefficients of determination (R2), and P values are shown in each panel.
Agriculture 16 01670 g010
Table 1. Effect of different fertilization treatments on soil properties.
TreatmentCKF100MVF80MVF60MVF40ANOVA
BD1.22 ± 0.06 ab1.27 ± 0.04 a1.24 ± 0.08 ab1.16 ± 0.05 bc1.13 ± 0.07 c*
SOC (g kg−1)10.6 ± 0.25 bc10.4 ± 0.92 c12.1 ± 0.49 a11.9 ± 1.03 ab12.1 ± 1.25 a*
TN (g kg−1)1.07 ± 0.06 c1.36 ± 0.08 ab1.51 ± 0.17 a1.23 ± 0.23 bc1.25 ± 0.15 bc*
TP (g kg−1)0.25 ± 0.03 c0.29 ± 0.05 bc0.40 ± 0.05 a0.29 ± 0.05 bc0.34 ± 0.02 b**
TK (g kg−1)7.04 ± 0.49 b7.23 ± 0.83 b8.58 ± 0.26 a7.14 ± 0.74 b7.51 ± 0.55 b*
Nmin (mg kg−1)11.0 ± 1.22 d16.1 ± 2.17 c19.9 ± 1.79 ab17.1 ± 1.98 bc21.4 ± 2.90 a***
AP (mg kg−1)6.23 ± 0.76 b13.4 ± 1.83 a11.6 ± 1.04 a13.0 ± 1.85 a13.1 ± 1.07 a***
AK (mg kg−1)50.6 ± 2.14 a53.0 ± 12.18 a52.2 ± 6.61 a51.3 ± 4.56 a54.3 ± 2.38 ans
CEC (cmol kg−1)12.1 ± 0.45 b12.0 ± 0.48 b12.5 ± 0.83 b13.9 ± 0.79 a14.6 ± 0.50 a***
urease (U g−1)1561 ± 26.7 b1612 ± 73.9 b1847 ± 243 a1659 ± 114 ab1717 ± 119 abns
acid phosphatase (U g−1)151 ± 22.2 c189 ± 6.85 b194 ± 18.7 ab188 ± 3.22 b212 ± 7.35 a***
sucrase (U g−1)2.64 ± 0.76 b3.01 ± 0.98 ab3.17 ± 1.51 ab4.70 ± 1.36 a3.94 ± 1.05 ans
catalase (U g−1)0.50 ± 0.002 b0.53 ± 0.02 a0.52 ± 0.01 a0.53 ± 0.01 a0.53 ± 0.01 a*
MBC (mg kg−1)201 ± 10.3 b209 ± 17.1 b245 ± 25.5 a251 ± 23.3 a244 ± 13.2 a**
MBN (mg kg−1)11.1 ± 1.57 b11.7 ± 1.62 ab13.7 ± 1.76 a10.4 ± 0.92 b10.2 ± 0.81 b*
Values are expressed as mean ± standard deviation. Means were compared using one-way analysis of variance (ANOVA) with four replicates per treatment, and significant differences between treatments were assessed by Duncan’s multiple range test at p < 0.05. Different lowercase letters denote statistically significant differences. Notes: MV, Chinese milk vetch; F, chemical fertilizer; BD, bulk density; SOC, soil organic carbon; TN, total nitrogen; TP, total phosphorus; TK, total potassium; N min, mineral nitrogen; AP, available phosphorus; AK, available potassium; CEC, cation exchange capacity; MBC, microbial biomass carbon; MBN, microbial biomass nitrogen. ns, no significant difference; * p < 0.05; ** p < 0.01; *** p < 0.001.
Table 2. Effect of different fertilization treatments on diversity of bacterial and fungal communities.
TreatmentBacteriaFungi
Chao1ShannonChao1Shannon
CK4237 ± 165 a6.99 ± 0.07 a1192 ± 98.2 bc4.13 ± 0.58 a
F1004452 ± 141 a7.00 ± 0.07 a1431 ± 114 a4.55 ± 0.93 a
MVF804307 ± 104 a6.92 ± 0.09 a1406 ± 71.0 a4.52 ± 0.34 a
MVF604328 ± 31.2 a6.95 ± 0.06 a1319 ± 176 ab4.82 ± 0.62 a
MV404395 ± 225 a6.98 ± 0.05 a1085 ± 93.0 c4.67 ± 0.28 a
ANOVAnsns**ns
Values (mean ± standard deviation) were tested in analysis of variance (ANOVA) with four replicates in each treatment, and followed by different letters in each column indicating significant differences between treatments (p < 0.05) from each other according to Duncan’s multiple comparison test. ns, no significant difference; ** p < 0.01.
Disclaimer/Publisher’s Note: The statements, opinions and data contained in all publications are solely those of the individual author(s) and contributor(s) and not of MDPI and/or the editor(s). MDPI and/or the editor(s) disclaim responsibility for any injury to people or property resulting from any ideas, methods, instructions or products referred to in the content.