Article

Nutritional Status Enhances Honey Bee Colony Development and Soybean Yield, While Exposure to a Triple-Action Fungicide During Pollination Does Not Compromise Social Stability

by
Matheus Franco Trivellato
1,
Yara Martins Molina Ferraz
1,
Cássia Regina de Avelar Gomes
1,
Aline Yukari Kato
1,
Samir Moura Kadri
2,
Ricardo de Oliveira Orsi
3,
David De Jong
4 and
Daniel Nicodemo
5,*
1
Graduate Program in Animal Science, School of Agricultural and Veterinarian Sciences, São Paulo State University (Unesp), Jaboticabal 14884-900, SP, Brazil
2
Department of Animal Science, College of Agricultural and Technology Sciences, São Paulo State University (Unesp), Dracena 17915-899, SP, Brazil
3
Department of Animal Production and Medicine Veterinary Preventive, College of Veterinary Medicine and Animal Sciences, São Paulo State University (Unesp), Botucatu 18610-034, SP, Brazil
4
Genetics Department, Ribeirão Preto Medical School, University of São Paulo, Ribeirão Preto 14049-900, SP, Brazil
5
Department of Animal Science, School of Agricultural and Veterinarian Sciences, São Paulo State University (Unesp), Jaboticabal 14884-900, SP, Brazil
*
Author to whom correspondence should be addressed.
Agriculture 2026, 16(15), 1667; https://doi.org/10.3390/agriculture16151667
Submission received: 30 June 2026 / Revised: 29 July 2026 / Accepted: 30 July 2026 / Published: 3 August 2026
(This article belongs to the Special Issue New Insights into Improving Pollinator Health and Productivity)

Abstract

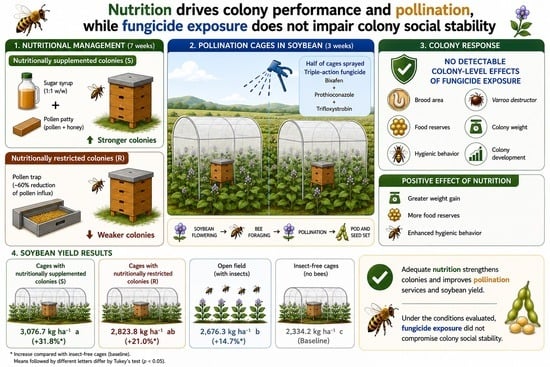
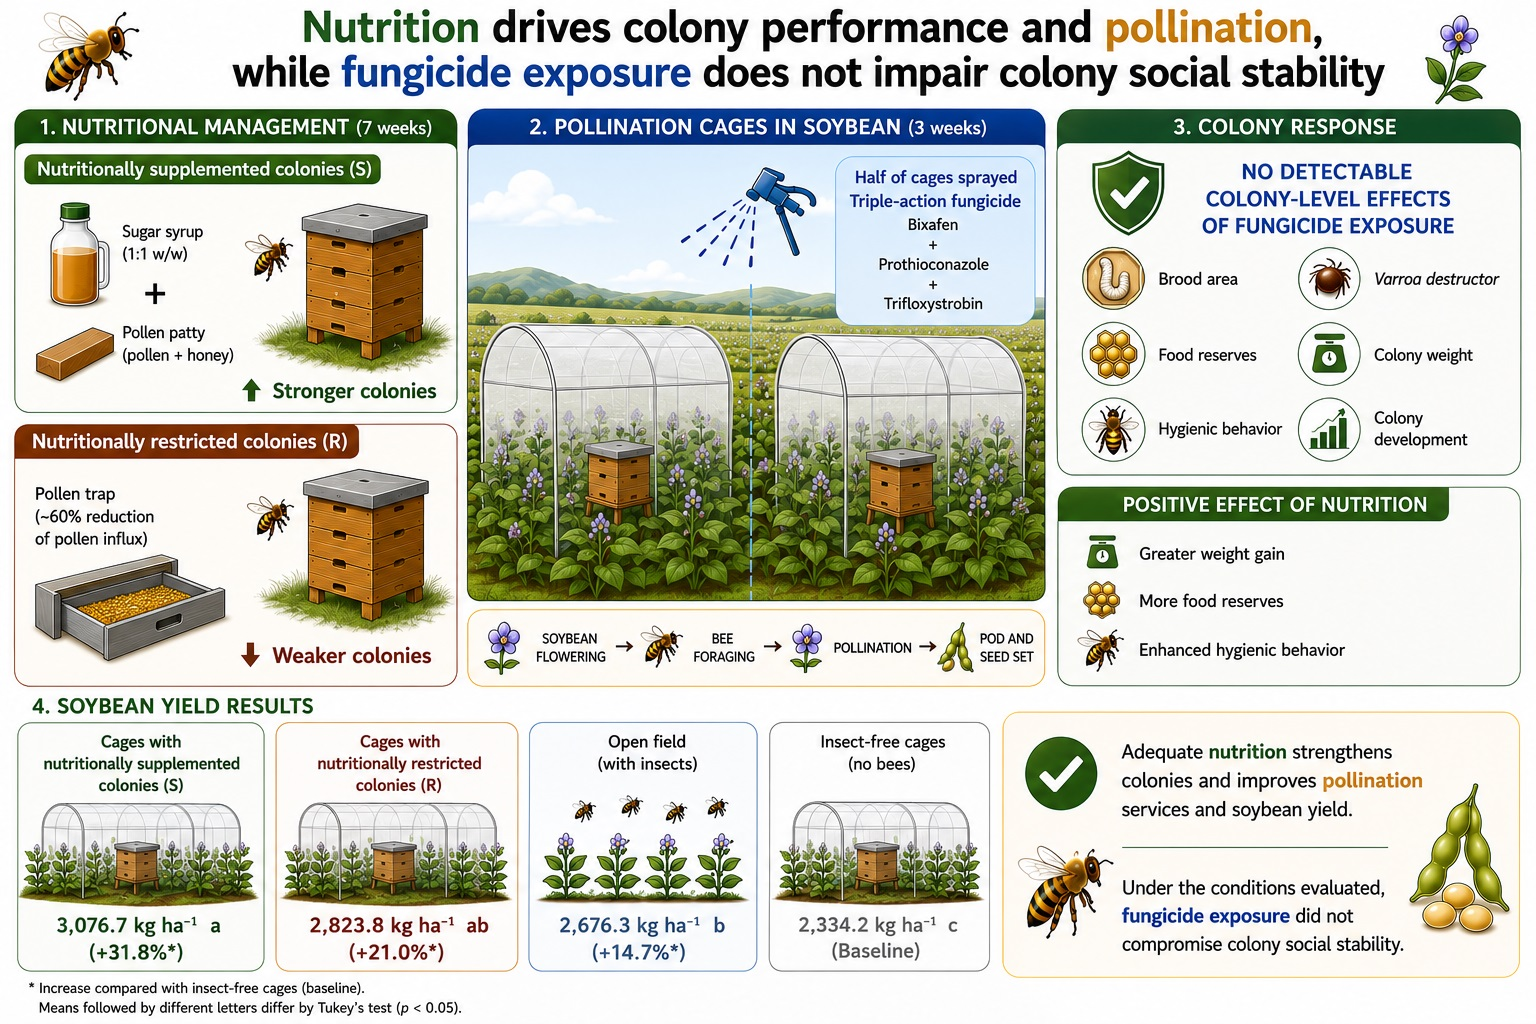
Adequate nutrition is essential for honey bee colony development and may influence pollination services provided to agricultural crops. In contrast, fungicides commonly used in agriculture have been associated with physiological and behavioral alterations in individual bees, although their consequences at the colony level remain poorly understood. This study evaluated the effects of colony nutritional status and exposure to a commercial fungicide containing bixafen, prothioconazole, and trifloxystrobin on honey bee colony development and soybean pollination efficiency. Twelve honey bee colonies were maintained under nutritional supplementation or restriction (n = 6) for seven weeks. Subsequently, each group was subdivided according to fungicide exposure or no exposure while colonies were confined in soybean pollination cages. Colony weight, food reserves, hygienic behavior, brood area, and Varroa destructor infestation were monitored throughout the experiment, and soybean yield was assessed at harvest. Nutritional supplementation improved colony performance, increasing weight gain, food reserves, hygienic behavior efficiency, and soybean yield, which increased by 31.8% (3076.7 vs. 2334.2 kg ha−1) compared with pollinator-excluded plots. Fungicide exposure did not affect colony development, food reserves, hygienic behavior, or mite infestation, regardless of nutritional status. Confinement reduced colony weight and brood area, but supplemented colonies resumed weight gain after returning to the apiary, whereas food restricted colonies maintained stable weights. These findings demonstrate that nutritional status is a key determinant of honey bee colony performance and pollination efficiency, whereas no measurable adverse effects of fungicide exposure on colony performance were detected.

Graphical Abstract

1. Introduction

Pollination has become an increasingly important component of modern crop production, as the effectiveness of pollination services depends on the abundance, health, and functional capacity of pollinator populations. Among managed pollinators, honey bees (Apis mellifera L.) are the most widely used worldwide, contributing to the production of numerous agricultural crops. Their extensive use in managed pollination programs results from several characteristics, including the high floral constancy of individual workers during foraging, together with colony-level traits such as a generalist foraging strategy, ecological plasticity, and ease of management [1]. Honey bees are estimated to provide up to half of all bee-mediated pollination services in agricultural systems globally [2]. Therefore, maintaining healthy and well-functioning colonies is essential for ensuring the stability and efficiency of pollination services in agricultural landscapes.
Among crops benefiting from honey bee activity is soybean [Glycine max (L.) Merr.], whose productivity can be enhanced by honey bee visitation despite its predominantly self-pollinating reproductive system [3,4]. Honey bee visitation to soybean flowers can increase both crop yield and production quality [3,5]. Although soybean is generally considered to exhibit little to modest dependence on animal pollination, its extensive cultivation area means that even relatively small pollination benefits translate into substantial agricultural gains, making it one of the crops of greatest economic relevance associated with pollination services in Brazil [6]. Pollination effectiveness is directly linked to the ability of colonies to maintain robust populations, highlighting the importance of understanding the factors that regulate colony development and performance [7].
Nutrition is one of the main factors regulating honey bee colony development. The availability and quality of food resources directly influence brood production, population growth, food reserve accumulation, worker longevity, hygienic behavior, and colony immunocompetence [8,9,10]. Consequently, well-nourished colonies tend to exhibit greater population strength and increased capacity to exploit floral resources available in the landscape, potentially enhancing foraging activity and pollination service delivery [7]. Because colony strength is a major determinant of pollination efficiency, nutritional conditions may directly influence the ecosystem services provided by managed honey bee colonies.
However, the ability of colonies to provide pollination services depends not only on nutritional resource availability but also on their capacity to cope with stressors commonly present in agricultural environments, including pesticide exposure [11]. Among pesticides, fungicides have historically been considered less harmful to bees than insecticides because of their low acute toxicity to adult workers. Nevertheless, increasing evidence indicates that exposure to certain fungicides may induce sublethal effects in brood and adult bees, including physiological, immunological, metabolic, and behavioral alterations, as well as reduced survival and longevity [12,13,14].
Although these effects may compromise biological processes relevant to bee performance, most available evidence has been obtained from laboratory studies conducted at the individual-bee level, and their implications for colony functioning remain poorly understood. Honey bee colonies operate as superorganisms, in which social organization, division of labor, and collective regulation of resources and behaviors may buffer environmental stressors [15,16]. Therefore, physiological or molecular responses observed in individual workers may not necessarily result in measurable impairment at the colony level. This knowledge gap highlights the importance of evaluating commercial fungicide formulations at the colony level, as interactions among active ingredients may produce responses that differ from those of individual compounds.
Among these formulations, a triple-action fungicide containing bixafen, prothioconazole, and trifloxystrobin is widely used in crops such as soybean, maize, and sunflower in Brazil [17]. Exposure of honey bees to this formulation and its individual active ingredients has been associated with physiological, molecular, and immunological alterations [18,19,20] at field-relevant doses [21]. Nevertheless, the extent to which these responses translate into detectable changes in colony development, homeostasis, and pollination performance remains unclear.
Although the effects of nutrition on colony development and the sublethal effects of fungicides at the individual-bee level have been extensively investigated, studies simultaneously evaluating how colony nutritional status influences responses to fungicide exposure and the potential consequences of this interaction for colony development and pollination services remain scarce. Therefore, this study aimed to evaluate the effects of nutritional supplementation and exposure to a triple-action fungicide on honey bee colony development and soybean productivity.

2. Materials and Methods

2.1. Study Site and Experimental Period

The experiment was conducted in Dracena, São Paulo State, Brazil (21°27′35″ S, 51°33′28″ W; 421 m above sea level), from August 2023 to April 2024. Colony management was carried out throughout the experimental period, as described in the following sections. No health-related treatments, including acaricides or antibiotics, had been applied to the colonies before the experiment, and none were administered during the study. Soybeans were planted during the recommended growing season, with sowing performed in November 2023.

2.2. Honey Bees Colonies and Nutritional Management

Twelve Africanized honey bee (A. mellifera) colonies were used, established in standard Langstroth five-frame hives, initially composed of three combs covered by adult bees, three combs containing predominantly brood, and two combs containing food stores. Colonies remained in these five-frame hives throughout the experimental period. Before treatment allocation, colonies were ranked according to initial brood area and adult bee population and randomly assigned to treatments to ensure comparable starting conditions among experimental groups.
The colonies were divided into two groups for nutritional management. Colonies in the supplemented group (S) received 500 g of sugar syrup per week, provided in Boardman feeders and prepared with equal proportions (w/w) of potable water and sucrose. Additionally, these colonies received a protein supplement consisting of a mixture of four parts bee-collected pollen and one part honey (w/w), offered as a 100 g patty placed directly on top of the brood frames. The honey and pollen used were obtained from healthy colonies in the same apiary where the experiment was conducted. Supplemental food was provided once per week for seven weeks. The sugar syrup and protein patties were completely consumed before the next weekly feeding, and no food residues were observed.
During the same period, the restricted nutrition group (R) received no supplemental food and relied exclusively on naturally available forage resources, while pollen traps reduced pollen influx by approximately 60% [18,19,20,22]. Trapped pollen pellets were collected and removed daily. All colonies remained free-flying throughout this phase, with access to natural floral resources.
After the initial seven-week feeding period, the colonies were transferred to pollination cages containing soybean plants (G. max) at the early flowering stage. During the subsequent three weeks, colonies were not subjected to experimental feeding management and relied on nectar and pollen from soybean flowers, as well as water from the irrigation system, as food sources. At the end of the confinement period, the colonies were returned to the apiary, and the feeding management was resumed for an additional seven weeks.

2.3. Soybean Cultivation

Soybean cultivar 95Y95IPRO, with indeterminate growth habit, was sown in a 3000 m2 area at a planting density of 255,000 plants per hectare. Soil samples were collected 60 days prior to sowing for chemical analysis to adjust pH and ensure balanced nutrient availability, following the recommendations of Cantarella et al. (2022) [23]. Irrigation was provided using a sprinkler system to meet the crop’s water requirements.

2.4. Fungicide Application and Soybean Pollination

In the soybean experimental field, 24 plots of 6.0 × 4.0 m were demarcated. Eighteen of these plots were covered with white polyamide mesh (1 mm mesh size) for entomological isolation during the flowering period. To support each cage, three pairs of iron rods (3/8″) were anchored into the soil on each side of the plots, spaced 2.0 m apart. PVC pipes (3/4″) were fitted onto these rods, crossing the plot transversally to form three arches, reaching a height of 2.0 m at the center. To ensure structural stability, three iron bars (5 mm) were installed longitudinally, connecting the PVC arches at the top and sides. The mesh was stretched over this frame, creating an arched cage. The remaining six plots remained uncovered.
When the plants reached the full flowering stage (R2), with open flowers on at least two of the upper nodes, the hives containing the honey bee colonies were transported to the experimental area at night. The hives were placed on 30 cm high stands along one of the side walls, remaining entirely inside the cage. Six cages did not receive hives and, therefore, excluded biotic pollinators. In six open plots, flowers were freely visited by insects. Thus, four pollination treatments were established: 1. with bees from colonies that had received nutritional supplementation; 2. with bees from colonies that had been under nutritional restriction; 3. without floral visitors (caged control); and 4. with open insect visitation under open-field conditions.
The day following the introduction of the hives, around 10:00 AM, the plants were treated with the commercial fungicide Fox® Xpro (Agro Bayer, São Paulo, Brazil) containing the active ingredients bixafen (125 g L−1), prothioconazole (175 g L−1), and trifloxystrobin (150 g L−1) [17]. The dosage used was 0.5 L ha−1 in a spray volume of 144 L ha−1, following the manufacturer’s recommendations for the control of powdery mildew (Erysiphe diffusa (Cooke & Peck) U. Braun & S. Takam) [17]. The application was made using a sprayer calibrated at 200 kPa pressure, with the spray nozzle positioned 0.5 m above the canopy. To ensure operator safety, a respirator, nitrile gloves, safety goggles, and a protective beekeeping suit were worn during the application. No other pesticides were applied to the soybean plants.
Half of the cages and half of the open plots were treated with the fungicide. Consequently, three colonies with nutritional supplementation and three with nutritional restriction remained in cages where plants were treated with the test fungicide. Exposure was considered to occur through direct contact with spray droplets during application and through subsequent contact with residues on soybean plants, including flowers, leaves, and stems. However, residue analyses were not performed, and the actual levels of fungicide exposure experienced by the colonies were not quantified. The remaining colonies were not exposed to the fungicide.
From this point onwards, the previous nutritional management of the colonies and the exposure to the fungicide were considered as sources of variation. Each nutritional group was subdivided into two (n = 3), resulting in four treatments: colonies with nutritional supplementation exposed to the fungicide (S_F+), colonies with nutritional supplementation not exposed to the fungicide (S_F−), colonies with nutritional restriction exposed to the fungicide (R_F+), and colonies with nutritional restriction not exposed to the fungicide (R_F−), with three colonies per treatment.

2.5. Weight Changes in Honey Bee Colonies

Colony weight was recorded weekly throughout the experimental period (17 weeks). The weighing schedule was chronologically divided into three phases: the initial nutritional management phase (Phase 1; weeks 1 to 7), the cage confinement period with or without fungicide exposure (Phase 2; weeks 8 to 10), and the post-confinement recovery phase (Phase 3; weeks 11 to 17). Data were collected with a digital electronic scale (Suryha, Caixias do Sul, Brasil, 100 kg capacity). To standardize the measurements, the weights of the external feeders (Boardman) and pollen traps were subtracted from the total mass.

2.6. Colony Strength Dynamics

Comb frame mapping was conducted four times for each hive: three assessments occurred prior to the introduction of the hives into the pollination cages (days 0, 28, and 48 of the initial nutritional management); the final assessment was made two weeks after removing the hives from confinement (day 84). To measure brood, honey, and pollen areas, an adapted version of the method proposed by Al-Tikrity et al. (1971) [24] was used. The adaptation consisted of replacing direct measurements on frames with digital image analysis. Photographs of both sides of the frames were taken using an 18 MP Canon digital camera (Canon Inc., Tokyo, Japan), and the images were subsequently analyzed using ImageJ software (version 1.54p, NIH, Bethesda, MD, USA) by overlaying a digital grid with 2 × 2 cm squares to quantify the respective areas (cm2).

2.7. Varroa destructor Infestation Dynamics

V. destructor mite infestation levels on adult bees were assessed four times, on the exact same days as the comb frame mapping. Adult infestation was selected because it provides a standardized measure suitable for repeated non-destructive monitoring. The quantification of mites on adult worker bees followed the method described by Stort et al. (1981) [25]. Samples of approximately 100 bees per colony were collected by removing a comb and shaking the adhering bees into an aluminum funnel (34 cm in height, with an upper outer diameter of 30 cm and a lower spout diameter of 5.9 cm). The funnel directed the bees into a 500 mL disposable round plastic container, fitted with a plastic lid and containing 70% ethanol. In the laboratory, the containers were agitated on a Kline shaker for 30 min. Subsequently, the contents were sieved to retain the bees, while the liquid was passed through a fine cloth to collect the dislodged mites. Finally, both mites and bees were counted to determine the adult bee infestation rate, calculated as the ratio of the number of mites to the total number of bees collected, and expressed as a percentage.

2.8. Hygienic Behavior Dynamics

Hygienic behavior was evaluated four times, with each assessment initiated 48 h prior to comb frame mapping, using the pin-killed brood assay on capped brood (adapted from Gramacho et al. 1999 [26]). In each colony, 100 capped worker brood cells on a single comb were selected and pierced with a number 2 insect pin to kill the pupae. The number of uncapped cells and the number of removed pupae were recorded at 12, 24, and 36-h intervals.

2.9. Soybean Grain Yield and 100-Seed Weight

At the end of the crop cycle, plants in all experimental units (demarcated plots) were manually harvested to measure soybean grain yield. Each experimental unit was subdivided into three 8 m2 subplots. The total grain weight obtained from each subplot was measured and adjusted to a standard moisture content of 13% using a grain moisture and impurity tester (Gehaka, model G650i, Gehaka, São Paulo, Brazil). Grain yield was estimated in kg ha−1 based on the mass obtained from the net area of each subplot. Additionally, to determine the 100-seed weight, three subsamples of 100 seeds were collected from each subplot, totaling nine subsamples per experimental unit. For both grain yield and 100-seed weight, values from subplots and subsamples were averaged per plot prior to statistical analysis, ensuring that the individual plot was treated as the independent experimental unit.

2.10. Statistical Analysis

The temporal dynamics of colony weight, comb frame mapping, V. destructor infestation rates, and hygienic behavior during the initial nutritional management period (Phase 1; seven weeks) were analyzed using repeated-measures linear mixed models. The models included nutritional management, time, and their interaction as fixed effects. For hygienic behavior, time represented successive evaluations at 12, 24, and 36 h within the same pin-test event. To account for repeated observations within the same experimental unit, colony was specified as the subject in the repeated-measures covariance structure (SUBJECT = colony) for hygienic behavior, whereas a random intercept for colony was included in the other temporal models. Models were fitted using Restricted Maximum Likelihood (REML), and degrees of freedom were adjusted using the Kenward–Roger approximation.
To evaluate the overall response associated with confinement, fungicide exposure, and subsequent recovery, bee-related variables were assessed based on changes (Δ) between the last pre-confinement assessment (day 48) and the post-recovery assessment (day 84). Thus, these Δ values capture the combined impact of the three-week confinement period (with or without fungicide exposure) and the two-week post-confinement recovery phase after returning to the apiary. For hygienic behavior, only the 36-h measurement was used to calculate Δ. These Δ values were analyzed using PROC GLM in a 2 × 2 factorial design (nutritional management × fungicide exposure).
Colony weight was additionally monitored after the confinement period (Phase 3) and analyzed using repeated-measures linear mixed models following the same general approach described for Phase 1.
Soybean grain yield (kg ha−1) and 100-seed weight were analyzed using analysis of variance (ANOVA) in a 4 × 2 factorial arrangement (pollination treatment × fungicide application), and means were compared using Tukey’s test (p < 0.05). Model assumptions, including normality of residuals and homogeneity of variances, were assessed for all analyses. No data transformations were required. All analyses were performed using SAS version 9.4 OnDemand for Academics [27].

3. Results

3.1. Honey Bee Colony Weight Changes

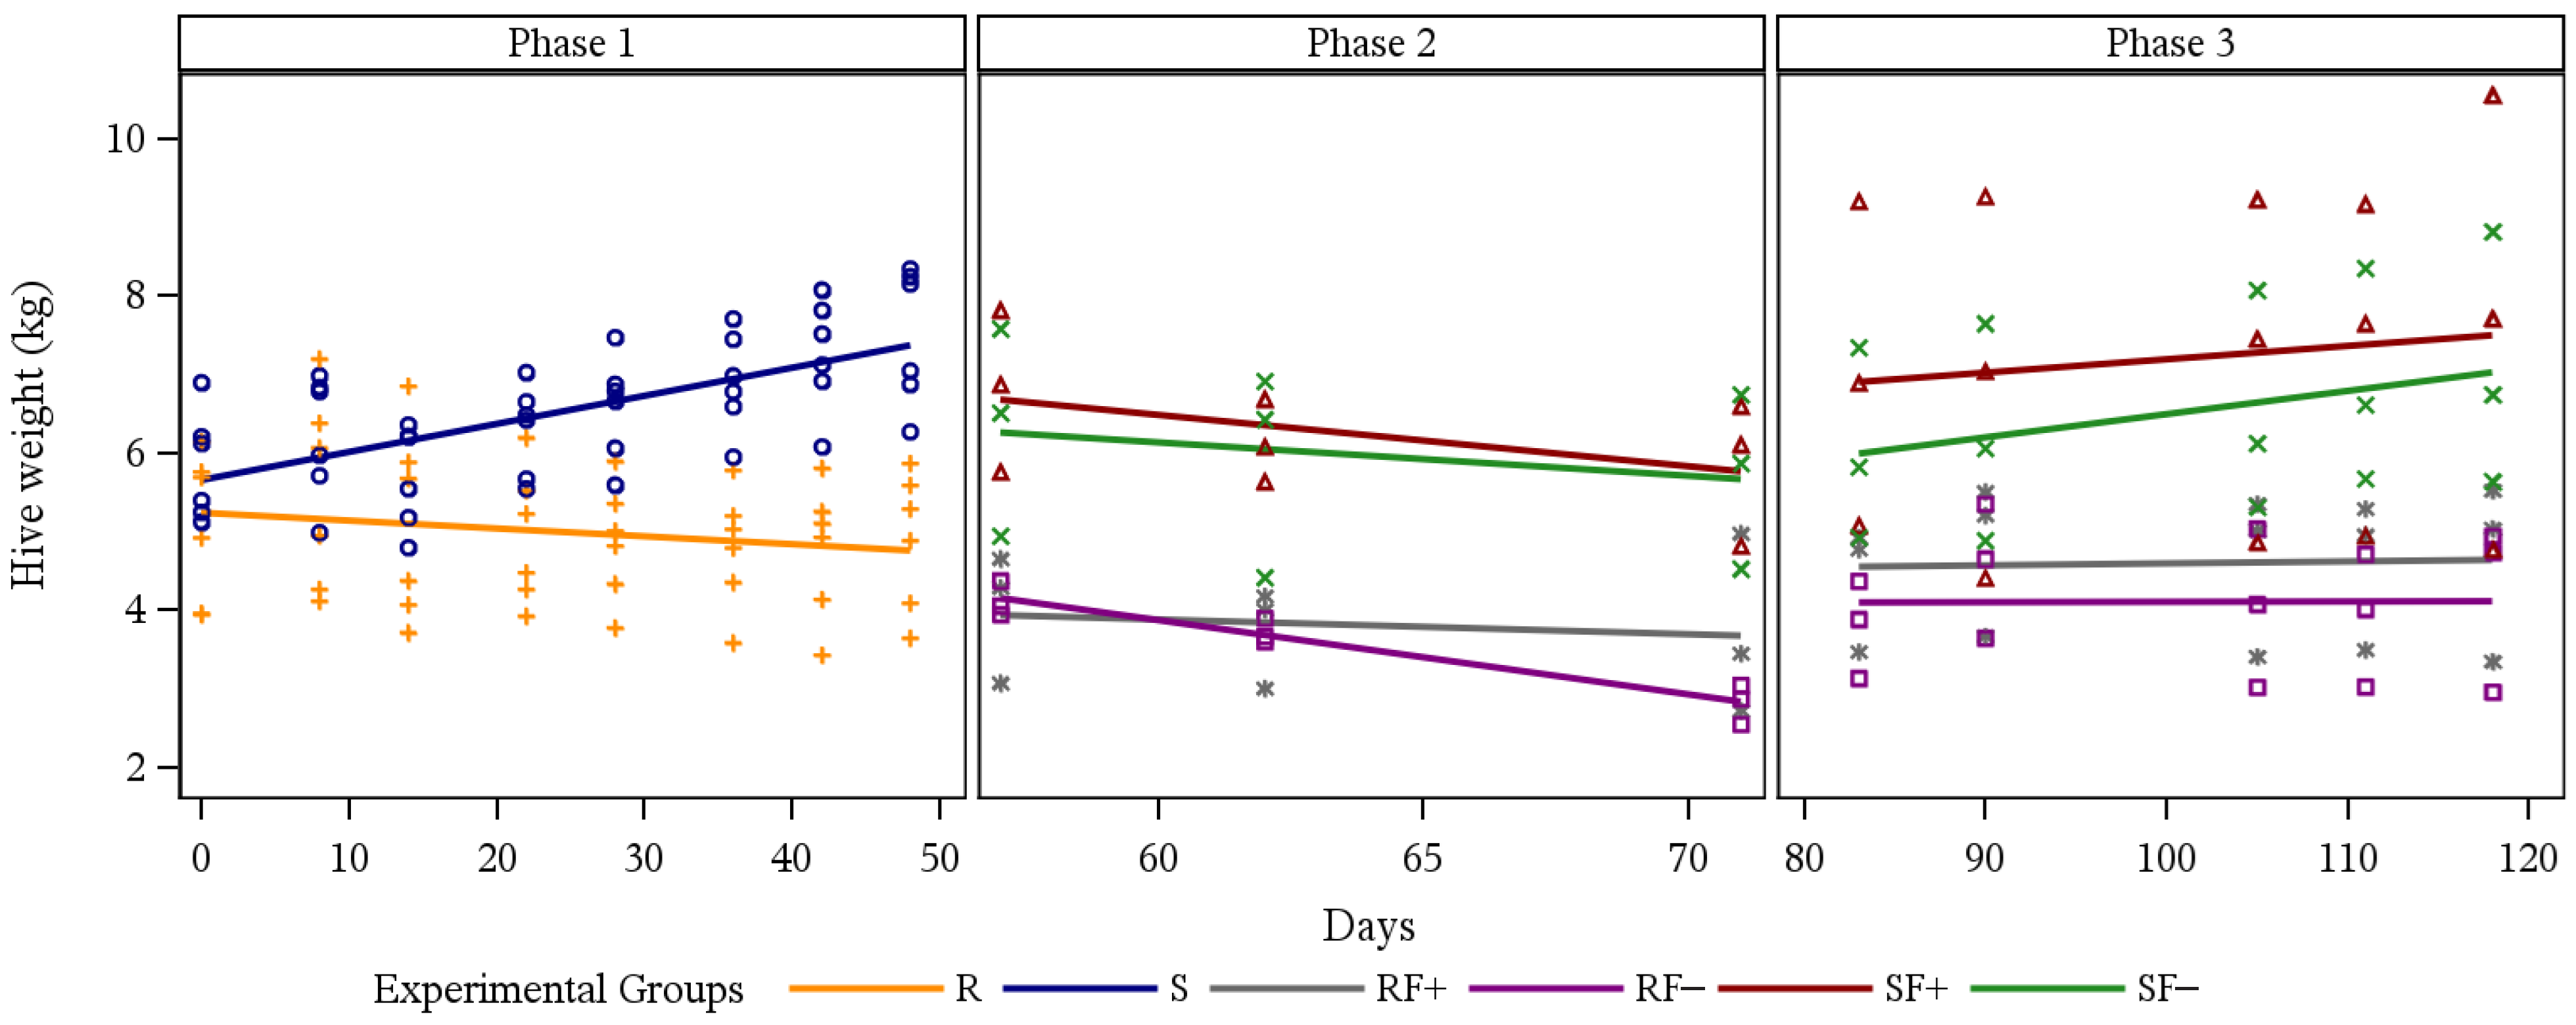
A highly significant interaction between time and nutritional management was observed throughout the initial seven-week feeding period (F(1, 82) = 109.38, p < 0.001). Colonies subjected to restricted nutrition exhibited a significant linear decline in weight (−10.0 ± 3.9 g day−1; t(82) = −3.24, p = 0.002), whereas nutritionally supplemented colonies showed a significant upward trajectory (35.7 ± 4.37 g day−1; interaction t(82) = 10.46, p < 0.001), resulting in continuous weight gain during Phase 1 (Figure 1).
During Phase 2, only the effect of time was significant (F(1, 21) = 25.45, p < 0.001), with a generalized reduction in colony weight over the three-week period (−69.6 ± 18.9 g day−1; t(21) = −3.68, p = 0.001). This decline occurred similarly across the four experimental subgroups (S_F+, S_F−, R_F+, and R_F−), indicating that neither the time × fungicide interaction ((F(1, 21) = 1.46, p = 0.24) nor the time × nutrition interaction ((F(1, 21) = 0.01, p = 0.90) influenced colony weight dynamics during this phase (Figure 1).
In Phase 3, colony weight dynamics were again significantly influenced by nutritional management (time × nutrition interaction; F(1, 45) = 14.14, p < 0.001) (Figure 1). Colonies under restricted nutrition showed no significant change in weight over time (+4.1 ± 5.0 g day−1; t(45) = 0.81, p = 0.42), whereas supplemented colonies exhibited weight recovery, with an average gain of +25.84 ± 5.79 g day−1 throughout the seven-week period following their removal from the pollination cages (t(45) = 3.76, p < 0.001). No prolonged effect of prior fungicide exposure on colony weight dynamics was detected during this phase (time × fungicide interaction; F(1, 45) = 0.81, p = 0.37).

3.2. Colony Strength Dynamics

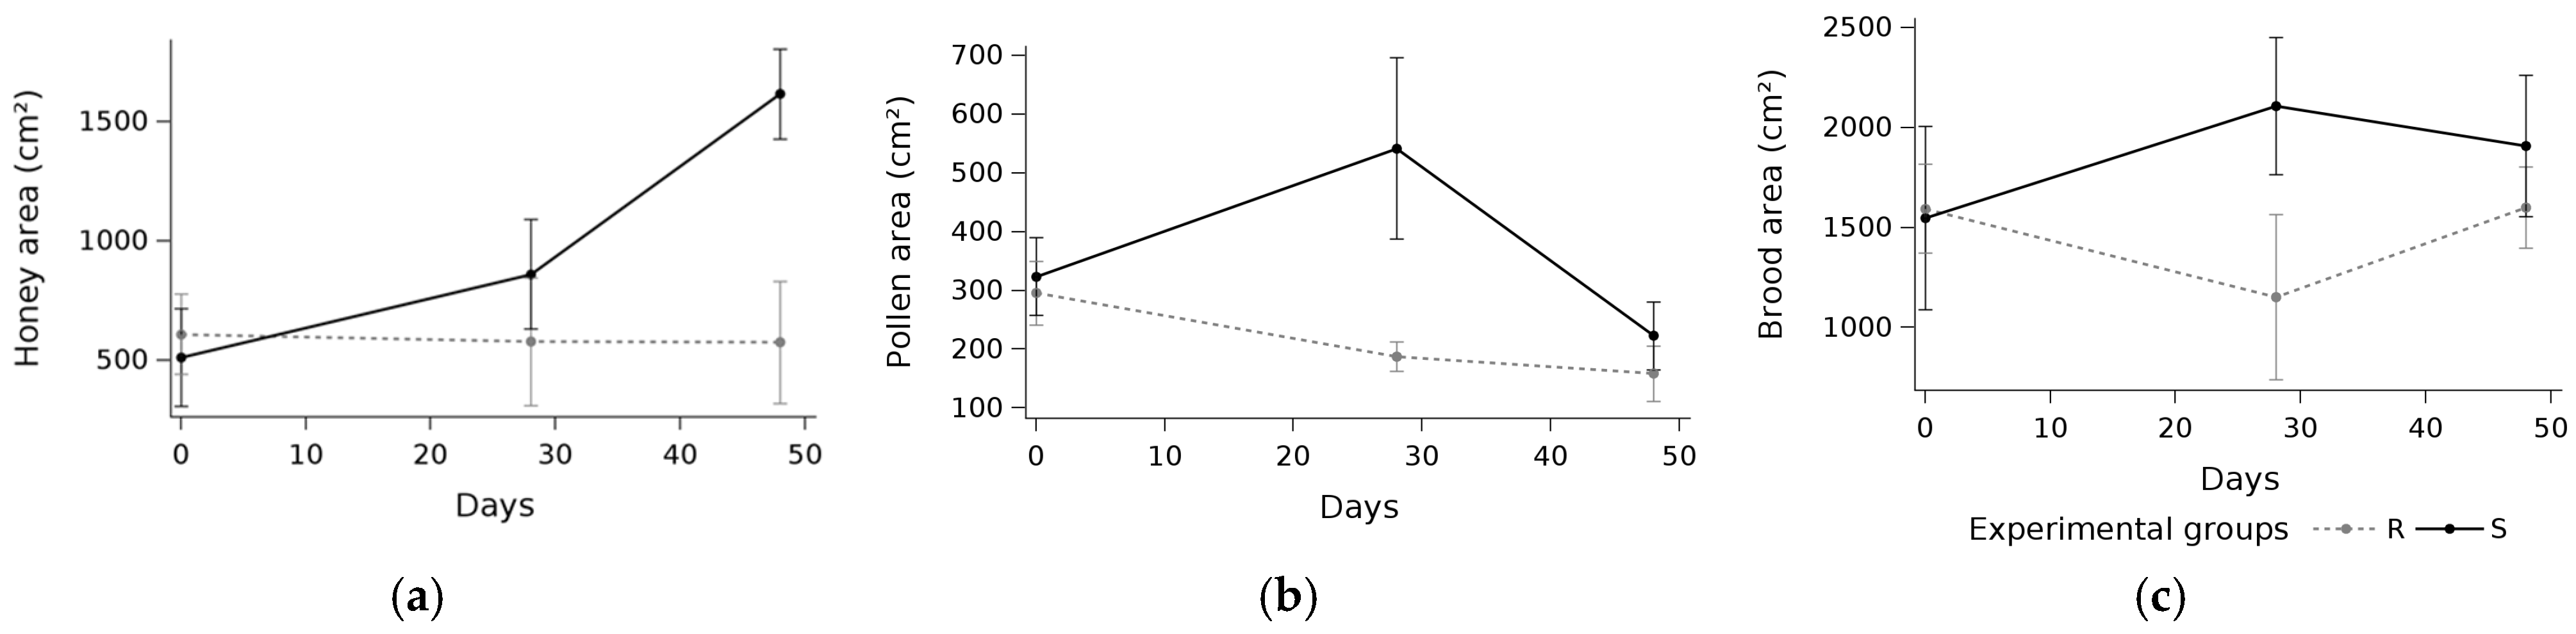
Analysis of the honey storage area during the initial feeding period revealed a significant interaction between nutritional management and time (F(2, 20.5) = 8.87, p < 0.002). Colonies subjected to restricted nutrition maintained stable honey stores throughout the initial seven-week period (608.0 ± 168.3 cm2 at Day 0 to 574.0 ± 256.5 cm2 at Day 48), whereas colonies receiving nutritional supplementation tripled their area of stored honey food reserves, increasing from 511.3 ± 205.6 cm2 at Day 0 to 1614.7 ± 187.9 cm2 at Day 48 (Figure 2a).
For the pollen storage area, no significant interaction was detected between nutritional management and time (F(2, 22.3) = 2.87, p = 0.078). However, the effect of nutritional management was significant (F(1, 15.1) = 4.98, p = 0.04), indicating that supplemented colonies (S) maintained larger pollen reserves than restricted colonies (R) throughout the initial evaluation period (Figure 2b). In the restricted nutrition group (R), the pollen storage area showed a declining trend, decreasing from 295.3 ± 54.0 cm2 at Day 0 to 158.7 ± 47.1 cm2 at Day 48, although this reduction was not statistically significant (interaction F(2, 22.3) = 2.87, p = 0.078).
Regarding brood area, no significant effects were detected for nutritional management (F(1, 11.3) = 1.17, p = 0.30), time (F(2, 20.4) = 0.20, p = 0.82), or their interaction (F(2, 20.4) = 2.50, p = 0.11). Colonies began the experiment with similar brood areas (1546.7 ± 459.4 cm2 for S and 1594.0 ± 221.5 cm2 for R), and at the end of Phase 1 (Day 48), the supplemented group exhibited a numerically larger mean brood area (1906.7 ± 353.8 cm2) than the restricted group (1600.0 ± 202.3 cm2), although this difference was not statistically significant (F(2, 20.4) = 2.50, p = 0.11) (Figure 2c).
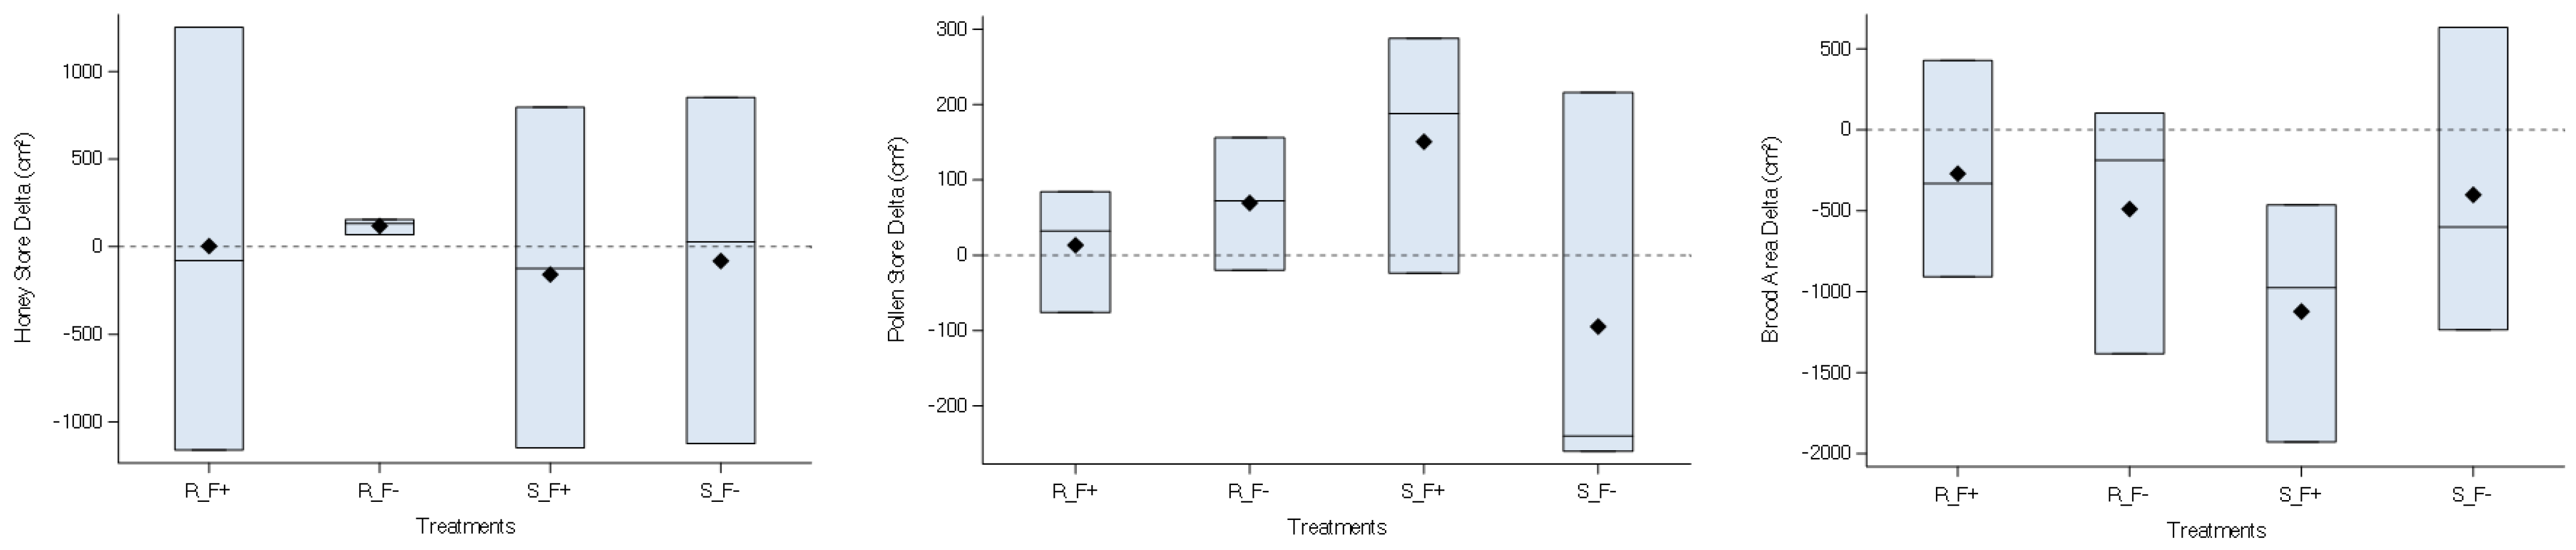
The remaining comb-mapping analyses compared data collected between days 48 and 84 of the experiment, encompassing the period of confinement in pollination cages, with or without fungicide exposure, followed by two weeks after the colonies had been returned to the apiary. For honey storage area, a slight overall net reduction was observed, with a mean global Δ of −29.33 cm2 (Figure 3). No significant effects were detected for nutritional management (F(1, 8) = 0.12, p = 0.74), fungicide exposure (F(1, 8) = 0.03, p = 0.86), or their interaction (F(1, 8) < 0.01, p = 0.97). The model exhibited low explanatory power (R2 = 0.02) and high residual variability (Root MSE = 920.95).
Regarding pollen reserves, the overall pattern revealed a positive mean Δ (+34.7 cm2), indicating a slight net accumulation of this resource during the evaluated interval (Figure 3). Although the model explained a larger proportion of the variability (R2 = 0.29; Root MSE = 167.53), no significant effects were detected for nutritional management (F(1, 8) = 0.02, p = 0.89), fungicide exposure (F(1, 8) = 0.96, p = 0.36), or their interaction (F(1, 8) = 2.43, p = 0.16). Numerical differences were observed within the supplemented group, as the subgroup not exposed to fungicide (S_F−) showed a tendency toward a net reduction in pollen storage area (LSMean = −94.67 cm2), whereas the fungicide-exposed subgroup (S_F+) tended to accumulate pollen reserves, exhibiting the largest positive Δ among all treatments (LSMean = +150.67 cm2) (Figure 3).
Comparison of brood areas (Figure 3) revealed no significant effects of nutritional management (F(1, 8) = 0.69, p = 0.43), fungicide exposure (F(1, 8) = 0.30, p = 0.60), or their interaction (F(1, 8) = 1.05, p = 0.34), with an overall mean reduction of −571.00 cm2. Residual variability was high (Root MSE = 794.44) relative to the magnitude of the observed effects (R2 = 0.20). Within the restricted nutrition group (R_F− and R_F+), mean Δ values were similar and indicated comparable brood-area reductions (LSMean = −489.33 cm2 and −270.7 cm2, respectively). Among supplemented colonies, the fungicide-exposed subgroup (S_F+) showed a greater tendency toward brood-area decline, exhibiting the lowest Δ value among all treatments (LSMean = −1122.67 cm2).

3.3. V. destructor Infestation Dynamics

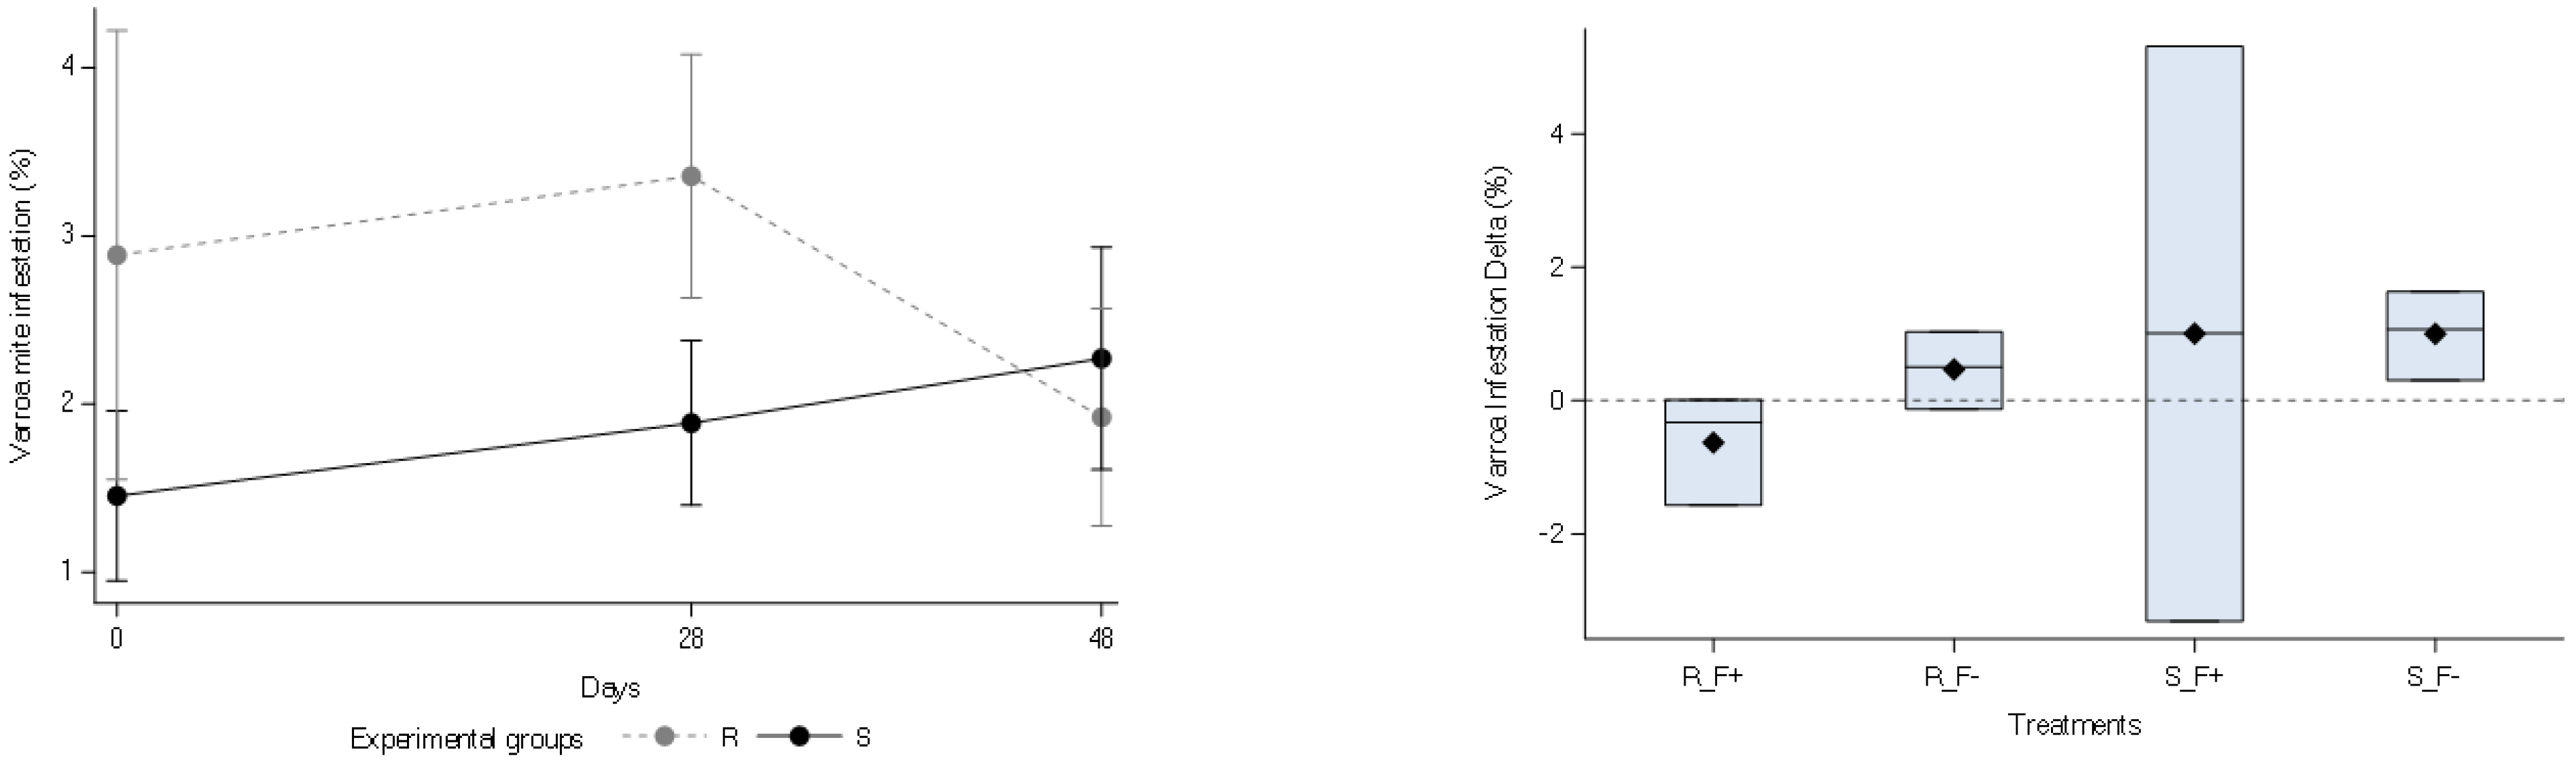
During the first seven weeks of the experiment, V. destructor infestation rates remained stable, with no significant effects detected for nutritional management (F(1, 9.5) = 0.88, p = 0.37), time (F(2, 18.7) = 0.70, p = 0.51), or their interaction (F(2, 18.7) = 1.49, p = 0.25) (Figure 4). The consistency across groups was reflected by the low residual variation in the model (Root MSE = 1.95). Descriptively, in the restricted nutrition group (R), V. destructor infestation peaked at Day 28 (3.36 ± 0.72%) before declining by 1.44 percentage points to 1.92 ± 0.65% by Day 48, though this reduction was not statistically significant (t(18.2) = 1.90, p = 0.074). Conversely, the supplemented group (S) showed a continuous numerical increase from 1.45 ± 0.50% on Day 0 (1.89 ± 0.49% on Day 28) to 2.27 ± 0.66% on Day 48 (t(18.2) = −0.51, p = 0.62). Overall, no significant main effects or interactions were detected for nutritional management (F(1, 9.5) = 0.88, p = 0.37), time (F(2, 18.7) = 0.70, p = 0.51), or their interaction (F(2, 18.7) = 1.49, p = 0.25).
Regarding the change in infestation rates (Δ) between days 48 and 84, an overall mean increase of +0.46% was observed. However, no significant differences were found for nutritional management (F(1, 8) = 0.70, p = 0.42), fungicide exposure (F(1, 8) = 0.18, p = 0.68), or their interaction (F(1, 8) = 0.18, p = 0.68). The model fit accounted for a small portion of the total variance (R2 = 0.12; Root MSE = 2.24) (Figure 4). Specifically, the estimated least-squares means (LSMeans) for the change in infestation rate were +1.00% for the supplemented control group (S_F−), +1.00% for the supplemented fungicide group (S_F+), +0.47% for the restricted control group (S_F−), and −0.63% for the restricted fungicide group (R_F+).

3.4. Hygienic Behavior Dynamics

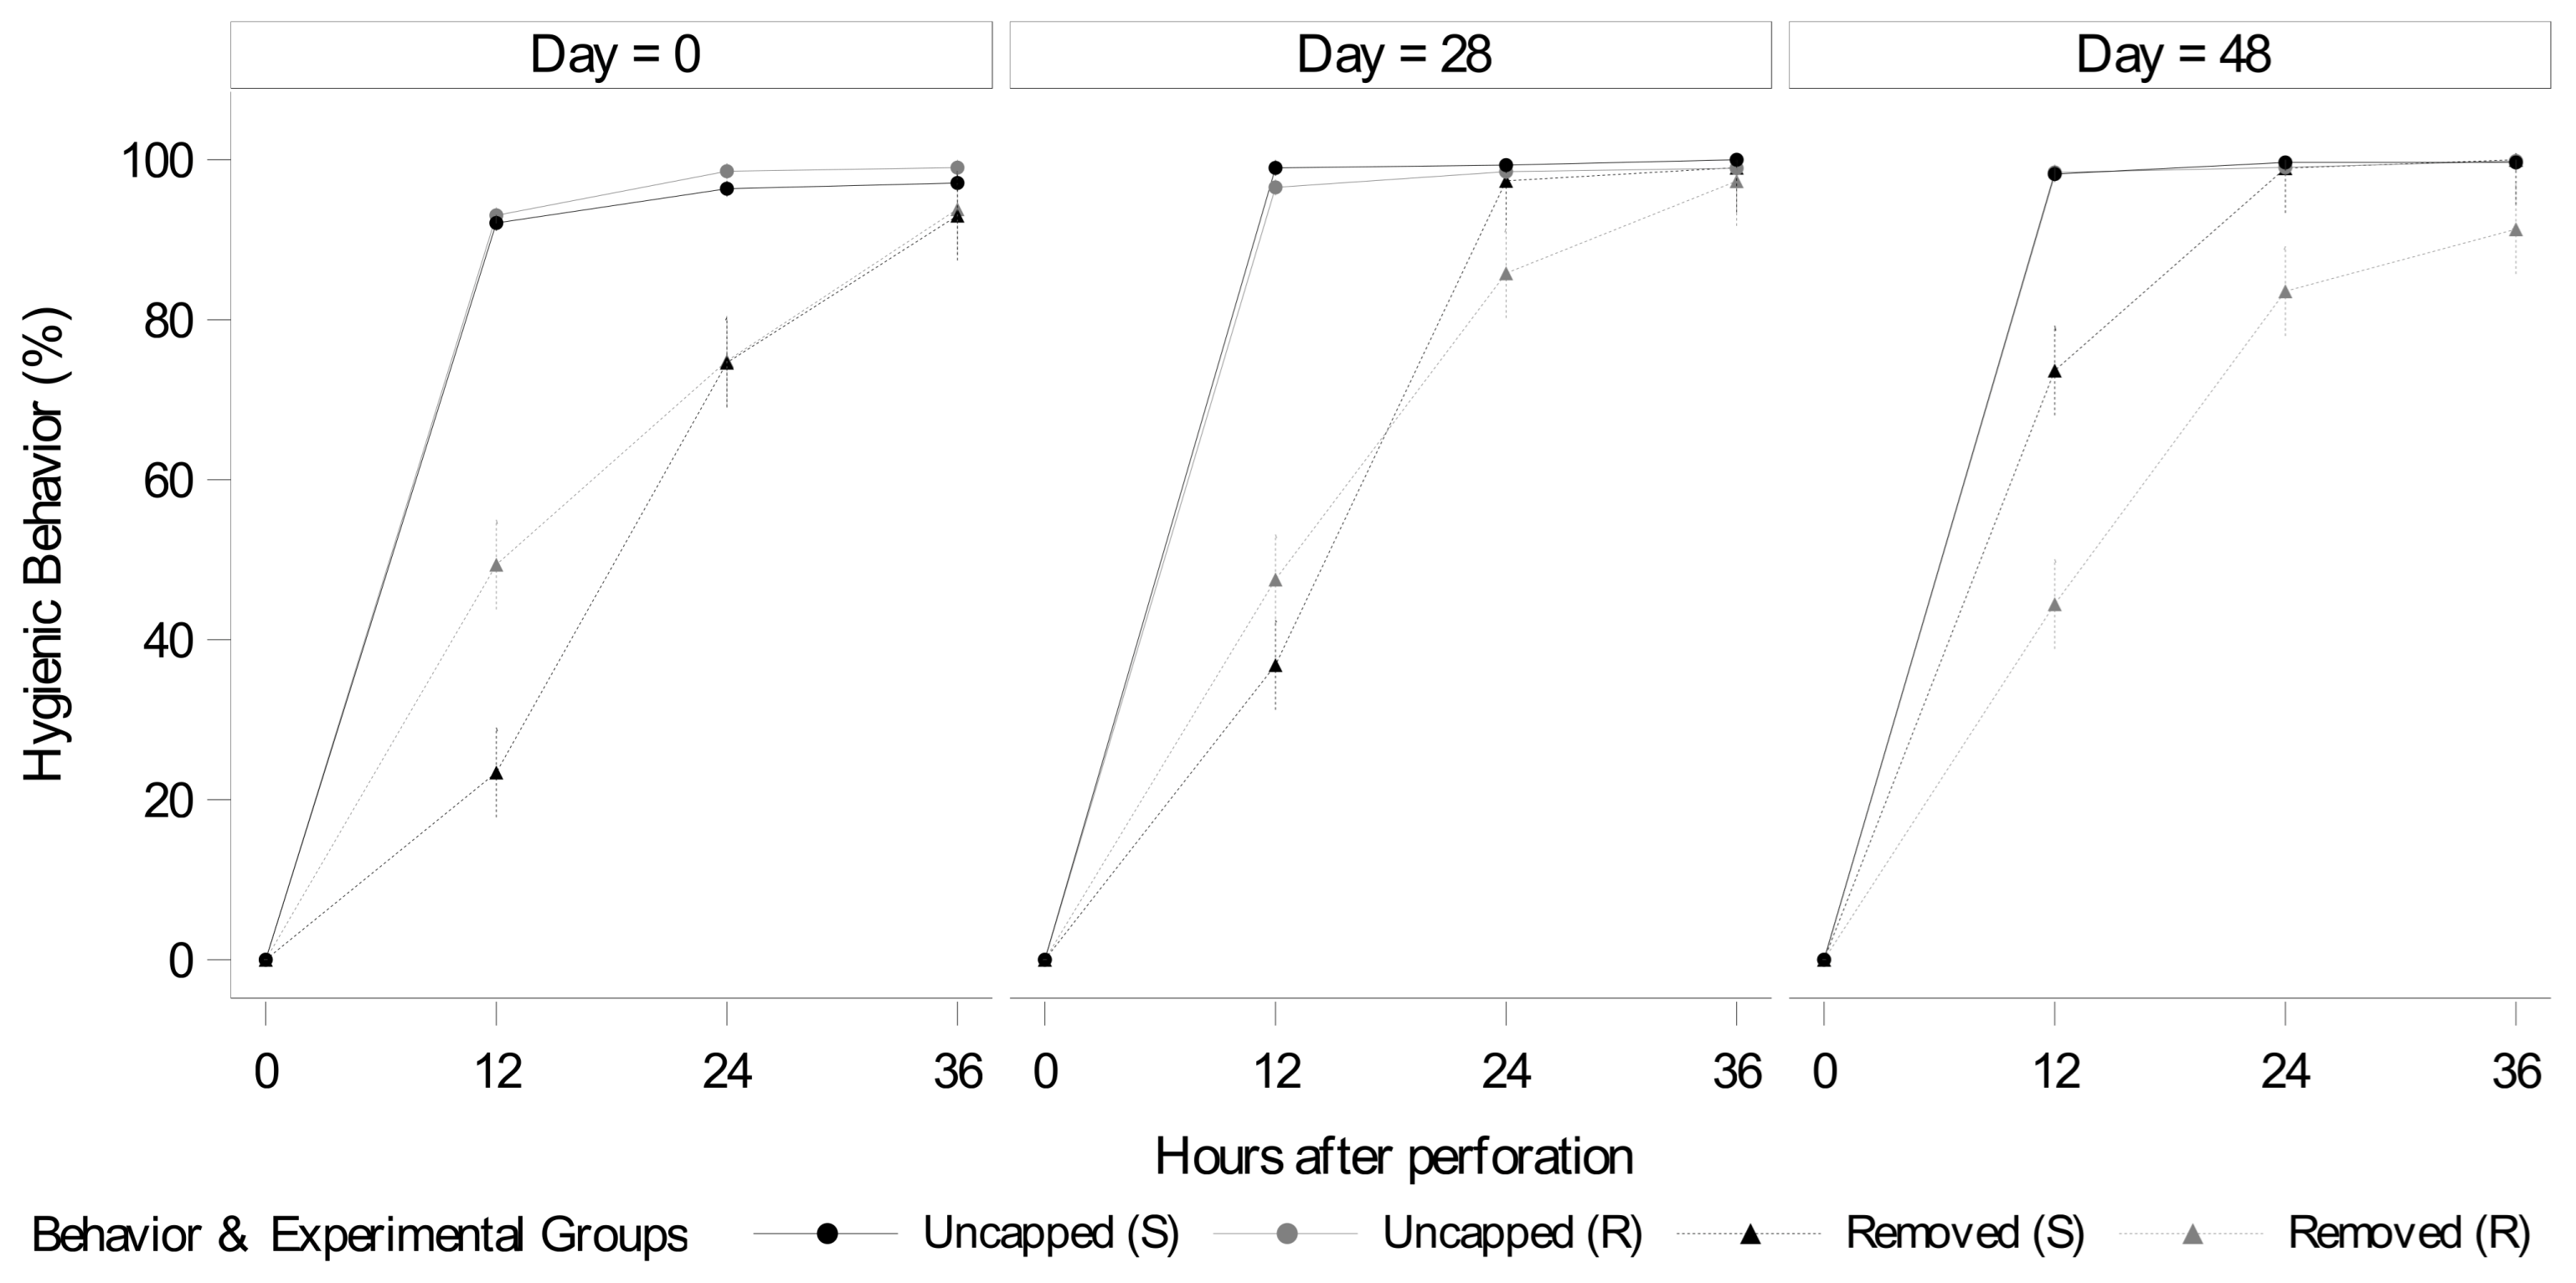
The uncapping rate of hygienic behavior during Phase 1 of the experiment was not significantly affected by nutritional management ((F(1, 11) = 0.01, p = 0.93). However, a significant interaction was observed between the evaluation day and time (F(4, 66.8) = 4.59, p < 0.003). This interaction reflected differences in uncapping rates across evaluation times depending on the day of assessment (Figure 5). While the mean uncapping rate at 12 h was approximately 92.50% on day 0, this initial count exceeded 97.50% on days 28 and 48. Despite this difference in response speed during the first 12 h, total uncapping rates leveled off near 100% across all evaluation days when considering the full 36-h observation period.
The brood removal rate was significantly affected by a three-way interaction between nutritional management, experimental day, and evaluation time (F(4, 75.2) = 4.34, p = 0.003). On day 0, colonies under nutritional restriction (R) exhibited a faster initial cleaning response at 12 h (49.38 ± 5.60%) compared to the supplemented group (S) (23.40 ± 5.60%), although both treatments achieved a hygienic efficiency above 93% at 36 h. By the end of this experimental phase (day 48), a reversal in behavioral dynamics was observed, as colonies in the supplemented group showed a substantial increase in brood removal speed, reaching 73.65 ± 5.60% within the first 12 h and achieving 100% cleaning at 36 h. In contrast, the restricted group displayed a reduced response capacity over the same period, with 44.45 ± 5.60% removal at 12 h and 91.31 ± 5.60% at 36 h.
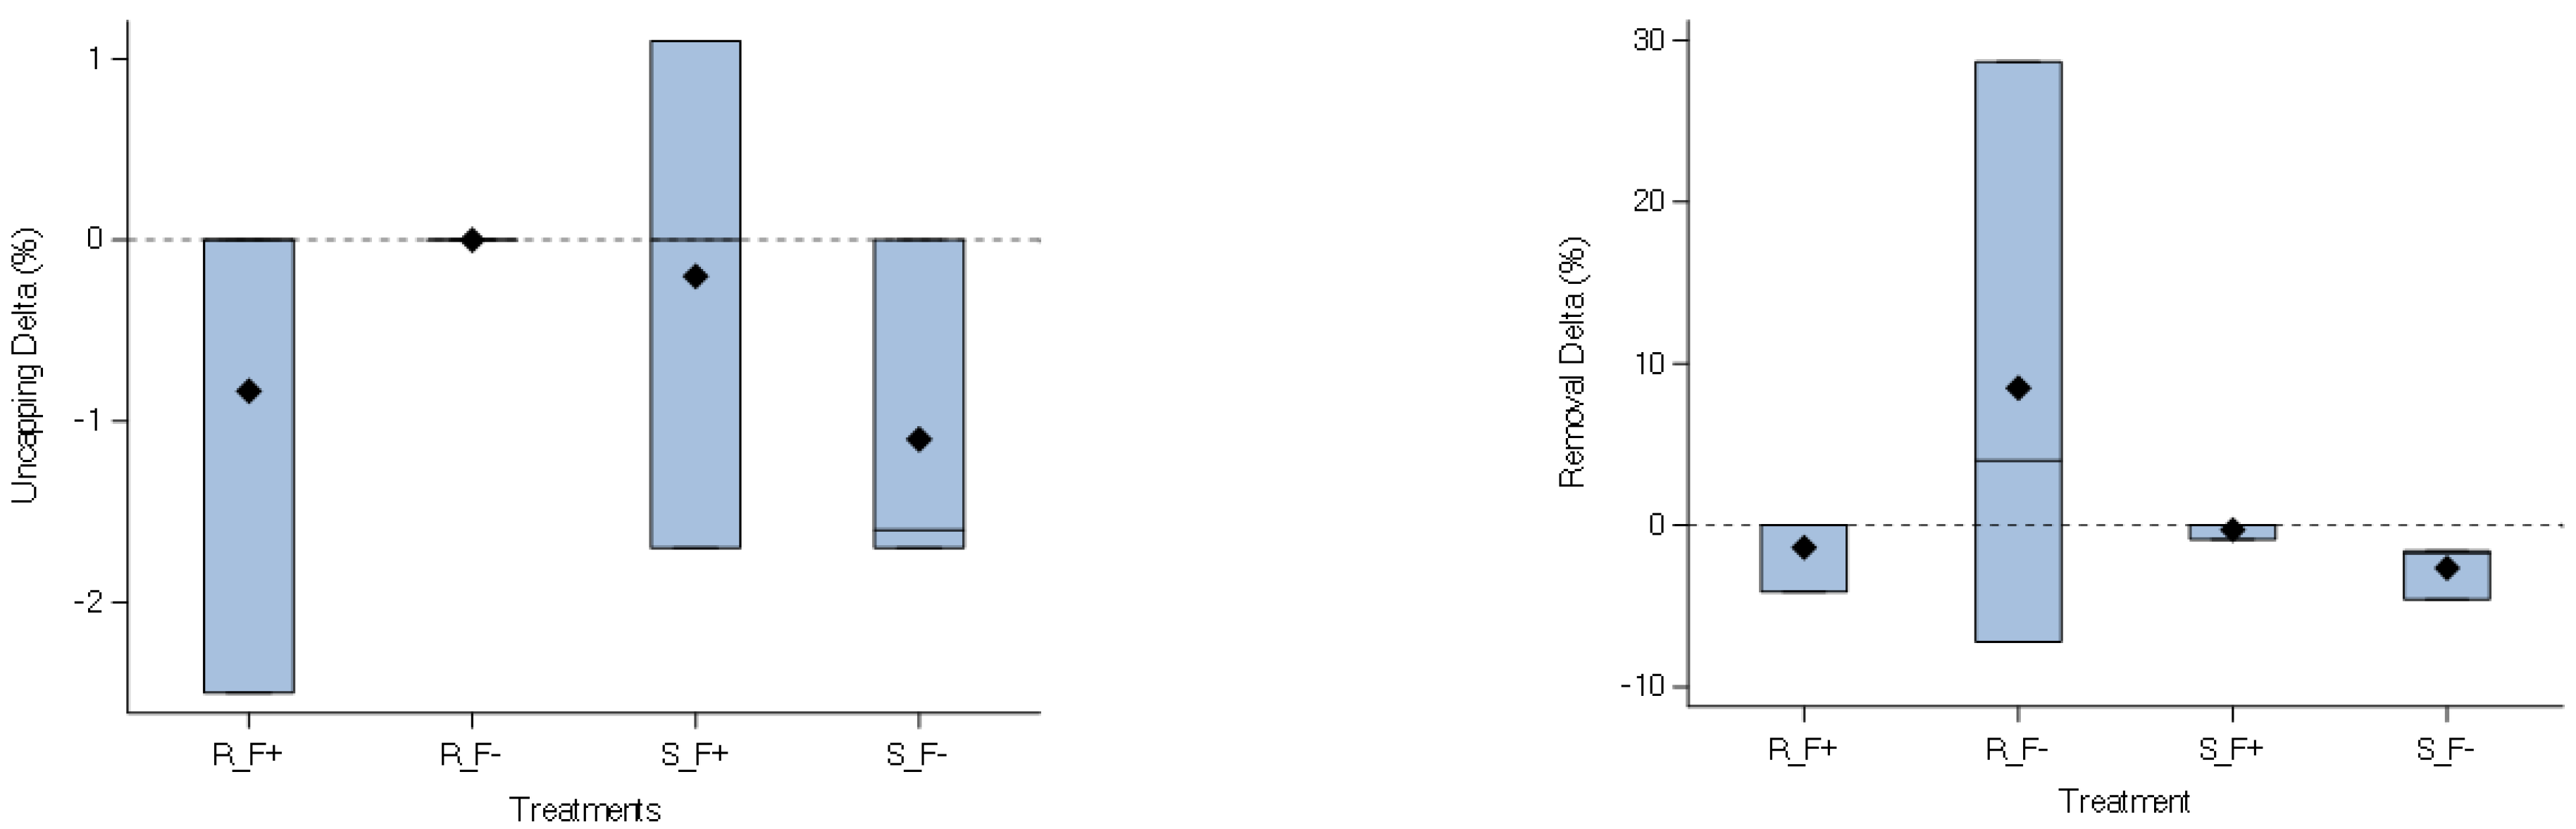
The analysis of colony resilience regarding hygienic behavior, measured by the variation (Delta) in uncapping between days 48 and 84, at 36 h after brood cell perforation, revealed no significant effects for nutritional management (F(1, 8) = 0.13, p = 0.73), fungicide exposure (F(1, 8) < 0.01, p = 0.96), or the interaction between these factors ((F(1, 8) = 1.81, p = 0.22). This model yielded a coefficient of determination (R2) of 0.19 and a root mean square error (Root MSE) of 1.12%. The colonies demonstrated good resilience for this trait, with an overall mean delta of −0.53% (Figure 6).
Similarly, resilience regarding larval removal did not differ significantly among treatments, showing no significant main effects for nutritional management (F(1, 8) = 0.88, p = 0.377) or fungicide exposure (F(1, 8) = 0.49, p = 0.504) nor a significant interaction (F(1, 8) = 1.30, p = 0.288) (R2 = 0.25; Root MSE = 9.29%) (Figure 6). The overall mean delta for removal was +1.04%, although only the subgroup of colonies under nutritional restriction and without fungicide exposure presented a positive delta. For the remaining subgroups, the delta ranged from −0.29% (S_F+) to −2.64% (S_F−) (Figure 6).

3.5. Soybean Grain Yield and 100-Seed Weight

Soybean grain yield was significantly influenced by the type of pollination (F(3, 58) = 9.67, p < 0.001), whereas fungicide use ((F(1, 58) = 0.01, p = 0.94) and the interaction between these factors (F(3, 58) = 0.28, p = 0.84) showed no significant effects (Table 1). The highest yield was obtained using colonies that received supplemented feeding (S), which significantly outperformed both the open-field treatment with free insect visitation (p < 0.001) and the insect-free cage treatment (p < 0.001). Colonies subjected to restricted feeding resulted in an intermediate yield), being significantly superior to the insect-free cage treatment (p = 0.014) but not differing significantly from the open-field treatment or the cages with supplemented colonies (p = 0.57). Regarding the phytosanitary factor, mean yields were equivalent between plants treated with fungicide and untreated plants, indicating no effect of fungicide application on soybean yield (Table 1).
The 100-seed weight was not significantly influenced by the pollination type (F(3, 16) = 2.51, p = 0.10), fungicide use (F(1, 16) = 2.00, p = 0.18), or the interaction between the factors (F(3, 16) = 2.21, p = 0.13) (Table 1). Numerically, the means ranged from 13.2 ± 0.2 g (insect-free cages) to 13.7 ± 0.2 g (cages with supplemented colonies). Regarding the phytosanitary factor, the mean seed weights were not significantly different between plants with (13.4 ± 0.1 g) and without (13.6 ± 0.1 g) fungicide application, showing no response to this management under the tested conditions.

4. Discussion

4.1. Colony Development According to Nutritional Management

In this study, during the initial nutritional management (Phase 1), supplemented colonies became heavier, accumulated more honey, and exhibited greater hygienic behavior efficiency than colonies subjected to nutritional restriction (Figure 1, Figure 2, Figure 4 and Figure 5). These findings support those of Branchiccella et al. (2019) [28], who demonstrated that nutritional stress compromises colony social immunity and reduces both adult bee and brood populations. Overall, adequate nutritional input appears to positively modulate social immunity and worker functional plasticity, preventing food scarcity from disrupting task allocation and accelerating the onset of foraging activities [10], a scenario likely experienced by nutritionally restricted colonies.
At the baseline assessment (Day 0), nutritionally restricted colonies removed dead brood more rapidly during the first 12 h (49.4% vs. 23.4%). However, after 48 days of nutritional management, this pattern was reversed. Supplemented colonies increased brood removal to 73.7% within the first 12 h and achieved complete removal by 36 h, whereas the efficiency of restricted colonies declined by approximately 10% (Figure 5). This contrast suggests that greater food availability optimized colony defense tasks. Although hygienic behavior is strongly influenced by genetic factors, its expression can also be modulated by colony nutritional conditions. Bigio et al. (2013) [29] reported reduced hygienic efficiency in colonies facing high brood demand and lacking carbohydrate supplementation. More recently, Stanimirović et al. (2022) [30] demonstrated that dietary supplementation enhanced hygienic behavior, while Jovanovic et al. (2025) [31] reported improvements in both hygienic and grooming behaviors following vitamin B supplementation under field conditions. Therefore, the present findings provide additional evidence that nutritional status can influence the expression of hygienic behavior, further supporting the growing body of evidence that adequate nutrition enhances colony social immunity.
Despite the greater overall vigor of supplemented colonies, brood area and protein reserves indicated a non-linear population adjustment toward the end of this phase (Figure 2). Although supplemented colonies maintained larger pollen stores and substantially increased energetic reserves, brood area tended to stabilize between Days 28 and 48 (Figure 2c). One possible explanation is that the greater accumulation of food reserves physically restricted the comb area available for oviposition, as brood production depends on the spatial organization of brood and food stores within the nest [32,33]. Additionally, this pattern may reflect an adaptive response to changes in floral resource availability. Regardless of the underlying mechanism, supplemented colonies maintained superior nutritional reserves compared with restricted colonies at the end of the experimental period.
Fluctuations in brood area were associated with the infestation dynamics of V. destructor, which remained below the economic injury level in both groups [34], a common pattern in Africanized honey bees [35]. A slight divergence was observed at the end of the period, characterized by a modest decline in infestation rates in nutritionally restricted colonies (1.92 ± 0.64%) and a gradual increase in supplemented colonies (from 1.45 ± 0.50% to 2.27 ± 0.66%) (Figure 4). This pattern is consistent with the reproductive biology of V. destructor and the host–parasite equilibrium commonly observed in Africanized honey bees, in which mite populations typically remain at low levels due to reduced reproductive success [36] and host tolerance mechanisms [37].
Because V. destructor depends on capped brood cells for reproduction, the greater brood availability in supplemented colonies, particularly on Day 28, likely increased the availability of hosts. However, population growth of the mite remained limited, possibly due to the more efficient hygienic behavior observed in supplemented colonies. This defense mechanism may promote the selective removal of infested brood and consequently reduce the reproductive success of V. destructor [38,39,40].
Regardless of the regulatory mechanism involved, the final reduction in brood area observed in supplemented colonies may have created favorable conditions for the beginning of Phase 2 (Figure 2c). When introduced into pollination cages, these colonies exhibited greater biomass, larger energetic reserves, and a lower relative investment in brood production. Such characteristics may enhance colony resilience during temporary periods of environmental restriction by reducing the nutritional demands associated with brood maintenance and preserving resources for the adult population [41].

4.2. Influence of Nutritional Status and Fungicide Exposure on Colony Development

During Phase 2, colonies were confined in cages containing flowering soybean plants to isolate the effects of fungicide exposure. Weight loss and reductions in brood area were observed in all colonies, regardless of previous nutritional management or fungicide exposure (Figure 1 and Figure 3). This pattern indicates that the environmental stress associated with confinement, combined with limited food availability, exerted a predominant influence, overshadowing the effects of the experimental factors under investigation.
The decline in hive weight reflects the metabolic costs associated with restricted floral resources within the cages [42]. The most pronounced effect on colony development representing the net overall response to confinement and subsequent recovery was observed in brood dynamics. Even though the final comb mapping was conducted two weeks after colonies were removed from the cages and both nutritional regimes had been resumed, an average reduction of 571.0 cm2 in brood area was recorded (Figure 3). This finding indicates that confinement, coupled with limited floral resource availability, was sufficient to trigger substantial demographic contraction within the colonies. Although supplemented colonies entered this phase with greater nutritional reserves, a condition generally associated with increased resilience to environmental and sanitary stressors [43], this advantage was insufficient to prevent the negative effects of confinement on colony development.
The reduction in brood area may be interpreted as an adaptive response to nutritional stress, as brood represents one of the major nutritional sinks within a colony [42]. Consequently, reduced investment in larval development likely contributed to preserving colony food reserves during confinement. This response helps explain the relatively modest changes observed in honey and pollen stores, suggesting a balance between resource consumption and replenishment (Figure 3). Therefore, the relative stability of these reserves should not necessarily be interpreted as the absence of nutritional stress but rather as a compensatory response to the conditions imposed by confinement. Similar impacts of confinement, particularly on brood area, have previously been reported in managed pollination systems for tomato [44] and zucchini crops [45].
Although pollination cages impose spatial and floral restrictions, this setup provided a conservative, worst-case scenario model that ensured a direct causal link between fungicide exposure and biological outcomes. The fungicide was applied immediately after colony introduction, enabling multiple contact pathways, while a three-week confinement with exclusively treated plants ensured continuous contact with foliage and floral residues. Nevertheless, no episodes of mass worker mortality, sudden colony collapse, or hive abandonment were recorded, aligning with previous field and semi-field studies reporting minimal acute colony-level impacts following fungicide exposure [46].
This absence of overt colony-level toxicity, despite potential individual physiological responses, stems from the social resilience of the colony as a superorganism, with collective mechanisms and demographic compensation offsetting localized stress before it manifests as population decline [47]. Likewise, the stability of sanitary indicators, including the minimal variation in V. destructor infestation rates (+0.46%), measured as the net change between pre-confinement and post-recovery, further supports the maintenance of basic biological equilibrium following the combined confinement and apiary recovery phase (Figure 4).
Similarly, the resilience of hygienic behavior, which preserved brood uncapping and removal rates (Figure 6), indicates that adult bees maintained their neurological integrity and functional performance. Taken together, these findings suggest that the primary stressor affecting colony weight and population-related parameters was the confinement-associated restriction of resources within the monoculture system, while the potential contribution of fungicide exposure under the tested conditions appeared limited. Although no colony-level effects of fungicide exposure were detected under the conditions tested, these results should be interpreted within the scope of the experimental exposure scenario, which combined semi-field confinement and controlled contact with treated plants. The limited number of colonies per treatment combination (n = 3) may restrict the detection of subtle interaction effects, whereas the main effects of nutritional management and fungicide exposure were evaluated with six colonies per factor level.
The results obtained in this study reveal an important contrast with investigations focused on individual bee responses, demonstrating that effects observed at the individual level do not necessarily translate into immediately detectable damage at the colony level. While the present study evaluated the macrostructural effects of the commercial fungicide on colony development, previous studies employed environmentally relevant exposure levels of the active ingredients bixafen, prothioconazole, and trifloxystrobin, established from realistic agricultural application scenarios [21].
Freitas et al. [18] demonstrated that forager bees topically exposed to these fungicides, individually or in combination, exhibited increased oxidative stress markers, including elevated lipid peroxidation, regardless of the nutritional status of their source colonies. In addition, alterations in antioxidant enzyme activity were detected, indicating that even environmentally relevant doses were capable of inducing metabolic imbalance in individually exposed adult bees. Similarly, Alves et al. (2024) [19] found that ingestion of pollen contaminated with the same active ingredients induced oxidative stress and reduced the longevity of newly emerged workers. However, bees originating from well-nourished colonies exhibited more efficient antioxidant responses and lower survival impairment, suggesting a protective effect of adequate nutritional status.
Similarly, Kato et al. (2024) [22] reported that exposure of forager bees altered the regulation of genes associated with detoxification, immunity, and antioxidant defense. These effects were more pronounced when the three active ingredients were applied as a mixture, particularly in bees originating from nutritionally restricted colonies, including altered expression of antioxidant genes (CAT, GPX-1, and SOD-1) and reduced expression of immune-related genes. Furthermore, Ferraz et al. (2025) [20] demonstrated that adequate nutritional status enhances bee resilience to fungicide exposure, indicating that nutritional factors can modulate the magnitude of these responses. Collectively, these findings demonstrate that the active ingredients comprising the fungicide that we applied have the potential to induce sublethal physiological and molecular effects, supporting evidence that fungicides can affect metabolic, immunological, and physiological processes in bees even at non-lethal exposure levels [12,14].
In our study, however, the absence of evident fungicide-related effects on colony functional integrity highlights a fundamental difference between responses observed in isolated individuals and those expressed at the colony level. Laboratory assays using individual workers tend to maximize the detection of biochemical, physiological, and molecular alterations under controlled exposure conditions. In contrast, honey bee colonies function as superorganisms endowed with collective mechanisms of social resilience, including division of labor, population turnover, and behavioral plasticity, that buffer part of these impacts and help maintain colony homeostasis under environmental stress [47]. Consequently, alterations detected in individual bees do not necessarily translate into measurable impairment of colony performance, helping to explain the challenges of extrapolating results from individual-level assays to colony-level parameters [48].
The semi-field results suggest that the nutritional and environmental stress associated with confinement exerted a stronger influence on colony performance than fungicide exposure under the conditions evaluated. This interpretation is supported by evidence that both the availability and quality of food resources are key determinants of honey bee colony health and performance [43,49]. Consistent with this hypothesis, mite infestation rates, hygienic behavior, and stored food areas were not affected by either fungicide exposure or nutritional management, indicating the maintenance of important mechanisms of colony homeostasis and social organization throughout the experimental period.

4.3. Delayed Effects of Fungicide Exposure

Two weeks after the colonies were returned to the apiary and the nutritional management adopted in Phase 1 was resumed, colony development trajectories once again became strongly influenced by food availability. During the subsequent seven weeks of monitoring, previously supplemented colonies exhibited continuous recovery in hive weight, with an average increase of +25.84 g day−1, whereas colonies subjected to nutritional restriction merely stabilized their weight over the same period (Figure 1). This contrast indicates that the recovery observed during Phase 3 was directly associated with both the restoration of nutritional input and the pre-existing structural condition of the colonies.
Supplemented colonies entered Phase 3 with greater energetic reserves and, likely, a larger functional workforce than nutritionally restricted colonies (Figure 3). Colony structure directly influences the capacity to respond to renewed resource availability, as the acquisition, processing, storage, and allocation of resources depend on the coordinated activities of workers responsible for foraging, food distribution, storage, and brood care. Demographic models indicate that colony growth and recovery are strongly dependent on the size and composition of the worker population, which determine the efficiency with which available resources are acquired and processed [50].
Therefore, the weight gain observed in supplemented colonies reflects not only an immediate response to the reintroduction of food supplements but also the persistence of the biological vigor established during Phase 1. In contrast, colonies subjected to nutritional restriction exhibited a lower capacity to convert available resources into population growth, likely due to their comparatively smaller reserves and reduced nutritional input. This interpretation is consistent with evidence that nutritional stress can alter worker performance and colony organization, with effects that may persist beyond the period of nutritional stress and influence subsequent colony development [51].
The recovery observed after colonies returned to the apiary further supports the interpretation that no detectable residual effects were associated with prior exposure to the evaluated fungicide. All colonies, including those previously exposed to the fungicide, appeared to retain a similar capacity for social reorganization, resource exploitation, and renewed growth, indicating preservation of colony functionality and population dynamics (Figure 1, Figure 3, Figure 4 and Figure 6).
This finding is particularly relevant because colony-level effects of sublethal pesticide exposure may require prolonged monitoring beyond the exposure period to adequately assess both adverse effects and colony recovery [52]. Moreover, behavioral alterations induced by environmental stressors may persist over time and compromise long-term colony performance [51]. Nevertheless, even under a worst-case experimental scenario characterized by confinement, exclusive access to a soybean-based monofloral diet (soybean pollen and nectar), and controlled fungicide exposure, no evidence of chronic impairment in recovery capacity or colony resilience was detected within the seven-week post-confinement monitoring period.

4.4. Pollination and Soybean Yield

Soybean productivity was strongly associated with the presence of pollinators, highlighting the functional role of honey bees as yield-enhancing agents in a predominantly self-pollinated crop [53]. The highest yields were observed in plots pollinated by colonies maintained within cages, where bees had exclusive access to soybean flowers, resulting in intense foraging activity on the crop. Under these conditions, yield increased by approximately 31.8% in plots pollinated by supplemented colonies and by 21.0% in those pollinated by nutritionally restricted colonies compared with the treatment without confined bees. Similarly, open-field conditions increased yield by 14.7% compared with the treatment without confined bees (Table 1), suggesting lower effective visitation intensity per unit area.
This pattern is consistent with the pollination ecology literature, which demonstrates that pollination efficiency depends not only on pollinator abundance but also on the configuration and relative availability of floral resources within the environment [53,54,55]. In systems dominated by a single floral resource, such as caged monocultures, foraging activity tends to be concentrated on the target crop, increasing visitation rates per unit area. In contrast, in open and more heterogeneous landscapes, the presence of multiple floral resources can redistribute foraging effort [56,57], reducing visitation constancy to the focal crop and consequently lowering pollination efficiency at the field scale [58,59].
Our findings are consistent with previous studies showing that the introduction of honey bees into soybean fields can increase yield by approximately 8% to 18% under controlled pollination conditions [60]. In open-field systems, however, average gains are generally more modest, typically ranging from 5% to 13%, although higher values may occur under conditions of elevated pollinator density and strong synchrony between flowering and peak foraging activity [3,5,61].
Floral visitation intensity is one of the primary factors associated with increased productivity in pollinator-dependent crops, as higher pollinator densities generally promote greater pollen deposition and higher agricultural output [62]. In this context, colony nutritional status may act as an important modulator of pollination efficiency by influencing worker population size, individual physiological performance, and the capacity to exploit floral resources. Pollen quality and nutritional composition play fundamental roles in worker development and colony functioning, affecting processes related to foraging activity and population maintenance [63,64]. Furthermore, evidence indicates that bees adjust their foraging decisions in response to the nutritional quality of available resources, altering patterns of resource exploitation and floral investment [64,65]. Although these mechanisms were not directly evaluated in our study, they provide a biologically plausible explanation for the differences in yield observed between areas pollinated by supplemented colonies and those pollinated by nutritionally restricted colonies.
Regarding the mechanisms involved, supplemented colonies are generally associated with greater physiological vigor and a larger population of active workers, which may increase floral visitation rates relative to colonies subjected to nutritional restriction. Previous studies have demonstrated a positive relationship between colony strength and pollination services in agricultural crops [66], suggesting that variation in colony population structure can modulate floral visitation intensity. Consequently, even under confinement and homogeneous floral availability, differences in colony nutritional status may translate into variation in pollen transfer efficiency and, ultimately, crop reproductive success [64,67].
With respect to crop protection practices, the absence of fungicide effects and of any interaction between fungicide application and pollination systems indicates that fungicide treatment did not compromise colony performance or crop yield under the evaluated conditions (Table 1). These findings suggest that the product did not interfere with either foraging activity or colony functionality during the critical flowering period. This result is particularly relevant because the maintenance of bee activity during bloom is considered a key determinant of successful supplementary pollination in soybean [5]. Furthermore, the absence of detectable negative effects on colony performance suggests that exposure remained below levels capable of producing measurable impairment in worker functionality. Taken together, these findings demonstrate no measurable adverse impact of the fungicide application or its interaction with pollination systems within the context of the present study. Given the variability in responses reported in the literature for different active ingredients and application scenarios, these results reinforce the need for case-specific evaluations of crop protection strategies under field conditions.

5. Conclusions

Nutritional supplementation contributed to improved colony performance, as evidenced by greater weight gain, increased food reserves, and enhanced hygienic behavior. In addition, supplemented colonies produced the highest increases in soybean yield, indicating that adequate colony nutritional status supports the provision of pollination services.
Under the conditions evaluated, exposure to the triple-action fungicide containing bixafen, prothioconazole, and trifloxystrobin did not affect colony development, food reserves, brood area, V. destructor infestation rates, or hygienic behavior, regardless of the nutritional management adopted. The maintenance of these parameters under controlled conditions highlights the social resilience of honey bee colonies, demonstrated by the preservation of colony functionality and homeostasis specifically within the evaluated exposure regime, with no evidence of detectable residual effects on colony performance over the experimental period.

Author Contributions

M.F.T.: conceptualization, validation, investigation, resources, data curation. Y.M.M.F.: investigation, resources, data curation. C.R.d.A.G.: investigation, resources, data curation. A.Y.K.: investigation, resources, data curation. S.M.K.: writing—original draft, writing—review and editing. R.d.O.O.: writing—original draft, writing—review and editing. D.D.J.: conceptualization, writing—original draft, writing—review and editing. D.N.: conceptualization, formal analysis, writing—original draft, writing—review and editing, project administration. All authors have read and agreed to the published version of the manuscript.

Funding

This research was supported by grants from Fundação de Amparo à Pesquisa do Estado. de S.o Paulo—FAPESP (process no. 2021/00702-1) to Daniel Nicodemo and by the Coordenação de Aperfeiçoamento de Pessoal de Nivel Superior-Brasil (CAPES)-Finance Code 001 to Matheus Franco Trivellato.

Data Availability Statement

The raw data supporting the conclusions of this article will be made available by the authors on request.

Conflicts of Interest

The authors declare no conflicts of interest.

References

  1. Hung, K.L.J.; Kingston, J.M.; Albrecht, M.; Holway, D.A.; Kohn, J.R. The worldwide importance of honey bees as pollinators in natural habitats. Proc. Biol. Sci. 2018, 285, 20172140. [Google Scholar] [CrossRef] [PubMed]
  2. Kleijn, D.; Winfree, R.; Bartomeus, I.; Carvalheiro, L.G.; Henry, M.; Isaacs, R.; Klein, A.-M.; Kremen, C.; M’Gonigle, L.K.; Rader, R.; et al. Delivery of crop pollination services is an insufficient argument for wild pollinator conservation. Nat. Commun. 2015, 6, 7414. [Google Scholar] [CrossRef] [PubMed]
  3. Blettler, D.C.; Fagúndez, G.A.; Caviglia, O.P. Contribution of honeybees (Apis mellifera L.) to soybean yield. Apidologie 2018, 49, 101–111. [Google Scholar]
  4. Gazzoni, D.L.; Hoffmann-Campo, C.B.; Zocolo, G.J.; Fernandes, M.C. Pollination as an Ecosystem Service in Soybean Production for Climate Change Mitigation. Pesqui. Agropecu. Bras. 2025, 60, e04108. [Google Scholar] [CrossRef]
  5. Gazzoni, D.L.; Paz Barateiro, J.V.G.R. Soybean yield is increased through complementary pollination by honey bees. J. Apic. Res. 2024, 63, 801–812. [Google Scholar]
  6. Giannini, T.C.; Cordeiro, G.D.; Freitas, B.M.; Saraiva, A.M.; Imperatriz-Fonseca, V.L. The dependence of crops for pollinators and the economic value of pollination in Brazil. J. Econ. Entomol. 2015, 108, 849–857. [Google Scholar] [CrossRef] [PubMed]
  7. Evans, S.K.; Clouston, G.; Regev, Y.; Walsh, E.M.; Ihle, K.; Rinkevich, F.; Simone-Finstrom, M.; Evans, H. Effect of Honey Bee Colony Strength on Foraging Productivity and Its Application to Precision Pollination. Insects 2026, 17, 163. [Google Scholar] [CrossRef] [PubMed]
  8. Tsuruda, J.M.; Chakrabarti, P.; Sagili, R.R. Honey Bee Nutrition. Vet. Clin. N. Am. Food Anim. Pract. 2021, 37, 505–519. [Google Scholar] [CrossRef] [PubMed]
  9. Bryś, M.S.; Skowronek, P.; Strachecka, A. Pollen Diet—Properties and Impact on a Bee Colony. Insects 2021, 12, 798. [Google Scholar] [CrossRef] [PubMed]
  10. Corona, M.; Branchiccela, B.; Alburaki, M.; Palmer-Young, E.C.; Madella, S.; Chen, Y.; Evans, J.D. Decoupling the effects of nutrition, age, and behavioral caste on honey bee physiology, immunity, and colony health. Front. Physiol. 2023, 14, 1149840. [Google Scholar] [CrossRef] [PubMed]
  11. Sánchez-Bayo, F.; Wyckhuys, K.A.G. Worldwide Decline of the Entomofauna: A Review of Its Drivers. Biol. Conserv. 2019, 232, 8–27. [Google Scholar] [CrossRef]
  12. Pettis, J.S.; Lichtenberg, E.M.; Andree, M.; Stitzinger, J.; Rose, R.; vanEngelsdorp, D. Crop Pollination Exposes Honey Bees to Pesticides Which Alters Their Susceptibility to the Gut Pathogen Nosema ceranae. PLoS ONE 2013, 8, e70182. [Google Scholar] [CrossRef] [PubMed]
  13. Cullen, M.G.; Thompson, L.J.; Carolan, J.C.; Stout, J.C.; Stanley, D.A. Fungicides, herbicides and bees: A systematic review of existing research and methods. PLoS ONE 2019, 14, e0225743. [Google Scholar] [CrossRef] [PubMed]
  14. Fisher, A.; Coleman, C.; Hoffmann, C.; Fritz, B.; Rangel, J. The Synergistic Effects of Almond Protection Fungicides on Honey Bee (Apis mellifera) Forager Survival. J. Econ. Entomol. 2021, 114, 1032–1039. [Google Scholar]
  15. Seeley, T.D. The honey bee colony as a superorganism. Am. Sci. 1989, 77, 546–553. [Google Scholar]
  16. Cremer, S.; Armitage, S.A.O.; Schmid-Hempel, P. Social immunity. Curr. Biol. 2007, 17, R693–R702. [Google Scholar] [CrossRef] [PubMed]
  17. Bayer. Fox® Xpro: Fungicida; Bayer, S.A.: São Paulo, Brazil, 2019; Available online: https://www.agro.bayer.com.br/d/fungicida-bcs-fox-xpro-br (accessed on 22 May 2026).
  18. Freitas, T.A.L.; Alves, T.R.R.; Trivellato, M.F.; Kato, A.Y.; Gomes, C.R.A.; Ferraz, Y.M.M.; Vicente, E.F.; De Jong, D.; Miranda, C.A.; Mingatto, F.E.; et al. Food supplementation does not prevent oxidative stress in forager honey bees exposed to the fungicides bixafen, prothioconazole and trifloxystrobin. J. Apic. Res. 2024, 64, 1120–1131. [Google Scholar] [CrossRef]
  19. Alves, T.R.R.; Trivellato, M.F.; Freitas, T.A.L.; Kato, A.Y.; Gomes, C.R.A.; Ferraz, Y.M.M.; Serafim, J.A.; De Jong, D.; Prado, E.P.; Vicente, E.F.; et al. Pollen contaminated with a triple-action fungicide induced oxidative stress and reduced longevity though with less impact on lifespan in honey bees from well-fed colonies. Environ. Toxicol. Pharmacol. 2024, 112, 104587. [Google Scholar] [CrossRef] [PubMed]
  20. Ferraz, Y.M.M.; Kato, A.Y.; Freitas, T.A.L.; Gomes, C.R.A.; Alves, T.R.R.; Trivellato, M.F.; Kadri, S.M.; Orsi, R.O.; De Jong, D.; Biller, J.D.; et al. Colony nutrition enhances bee resilience to fungicides, while the benefit of propolis supplementation depends on stress conditions. Agriculture 2025, 15, 1665. [Google Scholar] [CrossRef]
  21. Freitas, T.A.L.; Kato, A.Y.; Gomes, C.R.A.; Alves, T.R.R.; Ferraz, Y.M.M.; Serafim, J.A.; Silva, M.A.G.; De Jong, D.; Prado, E.P.; Vicente, E.F.; et al. Contact exposure of honey bees and social stingless bees to fungicide sprayed on cotton and soybean in a controlled field simulation system. J. Appl. Entomol. 2024, 148, 861–869. [Google Scholar] [CrossRef]
  22. Kato, A.Y.; Freitas, T.A.L.; Gomes, C.R.A.; Alves, T.R.R.; Ferraz, Y.M.M.; Trivellato, M.F.; De Jong, D.; Biller, J.D.; Nicodemo, D. Bixafen, prothioconazole, and trifloxystrobin alone or in combination have a greater effect on health-related gene expression in honey bees from nutritionally deprived than from protein-supplemented colonies. Insects 2024, 15, 523. [Google Scholar] [CrossRef] [PubMed]
  23. Cantarella, H.; Mattos, D., Jr.; Boaretto, R.M.; Quaggio, J.A.; Raij, B.V. Recomendações de Adubação e Calagem para o Estado de São Paulo, 2nd ed.; Instituto Agronômico: Campinas, Brazil, 2022.
  24. Al-Tikrity, W.S.; Hillmann, R.C.; Benton, A.W.; Clarke, W.W. A new instrument for brood measurement in a honeybee colony. Am. Bee J. 1971, 111, 20–26. [Google Scholar]
  25. Stort, A.C.; Gonçalves, L.S.; Malaspina, O.; Moura-Duarte, F.A. Study on sineacar effectiveness in controlling Varroa jacobsoni. Apidologie 1981, 12, 289–297. [Google Scholar] [CrossRef][Green Version]
  26. Gramacho, K.P.; Gonçalves, L.S.; Rosenkranz, P.; De Jong, D. Influence of body fluid from pin-killed honey bee pupae on hygienic behavior. Apidologie 1999, 30, 367–374. [Google Scholar] [CrossRef]
  27. SAS Institute Inc. SAS OnDemand for Academics: Statistical Software, Version 9.4; SAS Institute Inc.: Cary, NC, USA, 2013. Available online: https://www.sas.com/pt_br/software/on-demand-for-academics.html (accessed on 25 May 2026).
  28. Branchiccella, B.; Castelli, L.; Corona, M.; Díaz-Cetti, S.; Invernizzi, C.; Martínez-López, W.; Santos, E.; Silva, C.; Zunino, P.; Antúnez, K. Nutritional stress compromises the immune system of honey bees. Sci. Rep. 2019, 9, 10146. [Google Scholar]
  29. Bigio, G.; Schürch, R.; Ratnieks, F.L. Hygienic behavior in honey bees (Hymenoptera: Apidae): Effects of brood, food, and time of the year. J. Econ. Entomol. 2013, 106, 2280–2285. [Google Scholar] [CrossRef] [PubMed]
  30. Stanimirović, Z.; Glavinić, U.; Ristanić, M.; Jelišić, S.; Vejnović, B.; Niketić, M.; Stevanović, J. Diet Supplementation Helps Honey Bee Colonies in Combat Infections by Enhancing Their Hygienic Behaviour. Acta Vet. 2022, 72, 145–166. [Google Scholar] [CrossRef]
  31. Jovanovic, N.M.; Glavinic, U.; Stevanovic, J.; Ristanic, M.; Vejnovic, B.; Dolasevic, S.; Stanimirovic, Z. A Field Trial to Demonstrate the Potential of a Vitamin B Diet Supplement in Reducing Oxidative Stress and Improving Hygienic and Grooming Behaviors in Honey Bees. Insects 2025, 16, 36. [Google Scholar] [CrossRef] [PubMed]
  32. Seeley, T.D. The Wisdom of the Hive: The Social Physiology of Honey Bee Colonies; Harvard University Press: Cambridge, MA, USA, 1995. [Google Scholar]
  33. Winston, M.L. The Biology of the Honey Bee; Harvard University Press: Cambridge, MA, USA, 1987. [Google Scholar]
  34. Jack, C.J.; Ellis, J.D. Integrated Pest Management Control of Varroa destructor (Acari: Varroidae), the Most Damaging Pest of Apis mellifera L. (Hymenoptera: Apidae) Colonies. J. Insect Sci. 2021, 21, 6. [Google Scholar] [CrossRef] [PubMed]
  35. Pinto, F.A.; Teixeira, E.W.; Cestaro, L.G.; Martins, M.F.; Alves, M.L.T.M.F.; Message, D. Varroa destructor in Africanized Honey Bees in Brazil: Genetic and Reproductive Profile. Sociobiology 2022, 69, e7340. [Google Scholar] [CrossRef]
  36. Carneiro, F.E.; Torres, R.R.; Strapazzon, R.; Ramirez, S.A.; Guerra, J.V., Jr.; Koling, D.F.; Moretto, G. Changes in the reproductive ability of the mite Varroa destructor (Anderson and Trueman) in Africanized honey bees (Apis mellifera L.) colonies in southern Brazil. Neotrop. Entomol. 2007, 36, 949–952. [Google Scholar] [CrossRef] [PubMed]
  37. Moretto, G.; de Mello, L.J., Jr. Infestation and distribution of the mite Varroa jacobsoni in Africanized honey bee (Apis mellifera) colonies. Interciencia 2001, 26, 394–396. [Google Scholar]
  38. Kim, S.H.; Mondet, F.; Hervé, M.; Mercer, A.R. Honey Bees Performing Varroa Sensitive Hygiene Remove the Most Mite-Compromised Bees from Highly Infested Patches of Brood. Apidologie 2018, 49, 335–345. [Google Scholar] [CrossRef]
  39. Harris, J.W.; Danka, R.G.; Villa, J.D. Changes in Infestation, Cell Cap Condition, and Reproductive Status of Varroa destructor (Mesostigmata: Varroidae) in Brood Exposed to Honey Bees with Varroa Sensitive Hygiene. Ann. Entomol. Soc. Am. 2012, 105, 512–518. [Google Scholar] [CrossRef]
  40. Panziera, D.; van Langevelde, F.; Blacquière, T. Varroa sensitive hygiene contributes to naturally selected varroa resistance in honey bees. J. Apic. Res. 2017, 56, 635–642. [Google Scholar] [CrossRef]
  41. Seeley, T.D. Honeybee Ecology: A Study of Adaptation in Social Life; Princeton University Press: Princeton, NJ, USA, 1985. [Google Scholar]
  42. Debnam, S.E.; McCormick, M.B.; Callaway, R.M.; Woods, H.A. Energetic Costs of Raising Brood in Honey Bee Colonies Are High, but Heater Bees Are Cheap. J. Insect Physiol. 2024, 153, 104613. [Google Scholar] [CrossRef] [PubMed]
  43. Dolezal, A.G.; Toth, A.L. Feedbacks Between Nutrition and Disease in Honey Bee Health. Curr. Opin. Insect Sci. 2018, 26, 114–119. [Google Scholar] [CrossRef] [PubMed]
  44. Sabara, H.A.; Winston, M.L. Managing honey bees (Hymenoptera: Apidae) for greenhouse tomato pollination. J. Econ. Entomol. 2003, 96, 547–554. [Google Scholar] [CrossRef] [PubMed]
  45. Gomes, C.R.A.; Batista, M.A.M.; Ferraz, Y.M.M.; Trivellato, M.F.; Siniscalchi, G.A.; Polycarpo, G.V.; Rigobelo, E.C.; De Jong, D.; Nicodemo, D. A Hive entrance system that directs honey bees inside or outside a greenhouse reduced colony decline while effectively pollinating zucchini squash. Agriculture 2024, 14, 805. [Google Scholar] [CrossRef]
  46. Wueppenhorst, K.; Alkassab, A.T.; Beims, H.; Ernst, U.R.; Friedrich, E.; Illies, I.; Janke, M.; Kirchner, W.H.; Seidel, K.; Steinert, M.; et al. Honey bee colonies can buffer short-term stressor effects of pollen restriction and fungicide exposure on colony development and the microbiome. Ecotoxicol. Environ. Saf. 2024, 282, 116723. [Google Scholar] [CrossRef] [PubMed]
  47. Ulgezen, Z.N.; van Dooremalen, C.; van Langevelde, F. Understanding Social Resilience in Honeybee Colonies. Curr. Res. Insect Sci. 2021, 1, 100021. [Google Scholar] [CrossRef] [PubMed]
  48. Minucci, J.M.; Curry, R.; DeGrandi-Hoffman, G.; Douglass, C.; Garber, K.; Purucker, S.T. Inferring Pesticide Toxicity to Honey Bees from a Field-Based Feeding Study Using a Colony Model and Bayesian Inference. Ecol. Appl. 2021, 31, e02442. [Google Scholar] [CrossRef] [PubMed]
  49. Brodschneider, R.; Crailsheim, K. Nutrition and Health in Honey Bees. Apidologie 2010, 41, 278–294. [Google Scholar] [CrossRef]
  50. Khoury, D.S.; Myerscough, M.R.; Barron, A.B. A quantitative model of honey bee colony population dynamics. PLoS ONE 2011, 6, e18491. [Google Scholar] [CrossRef] [PubMed]
  51. Scofield, H.N.; Mattila, H.R. Honey Bee Workers That Are Pollen Stressed as Larvae Become Poor Foragers and Waggle Dancers as Adults. PLoS ONE 2015, 10, e0121731. [Google Scholar] [CrossRef] [PubMed]
  52. Thompson, H.; Overmyer, J.; Feken, M.; Ruddle, N.; Vaughan, S.; Scorgie, E.; Bocksch, S.; Hill, M. Thiamethoxam: Long-Term Effects Following Honey Bee Colony-Level Exposure and Implications for Risk Assessment. Sci. Total Environ. 2019, 654, 60–71. [Google Scholar] [CrossRef] [PubMed]
  53. Klein, A.M.; Vaissière, B.E.; Cane, J.H.; Steffan-Dewenter, I.; Cunningham, S.A.; Kremen, C.; Tscharntke, T. Importance of pollinators in changing landscapes for world crops. Proc. R. Soc. B 2007, 274, 303–313. [Google Scholar] [CrossRef] [PubMed]
  54. Westphal, C.; Steffan-Dewenter, I.; Tscharntke, T. Mass flowering crops enhance pollinator densities at a landscape scale. Ecol. Lett. 2003, 6, 961–965. [Google Scholar] [CrossRef]
  55. Ricketts, T.H.; Regetz, J.; Steffan-Dewenter, I.; Cunningham, S.A.; Kremen, C.; Bogdanski, A.; Gemmill-Herren, B.; Greenleaf, S.S.; Klein, A.M.; Mayfield, M.M.; et al. Landscape effects on crop pollination services: Are there general patterns? Ecol. Lett. 2008, 11, 499–515. [Google Scholar] [CrossRef] [PubMed]
  56. Gonzales, D.; Hempel de Ibarra, N.; Anderson, K. Remote Sensing of Floral Resources for Pollinators—New Horizons from Satellites to Drones. Front. Ecol. Evol. 2022, 10, 869751. [Google Scholar] [CrossRef]
  57. Fijen, T.P.M.; Eeraerts, M.; Osterman, J.; Beyer, N.; Hass, A.; Lundin, O.; Westphal, C. Crop Diversification for Pollinator Conservation. Landsc. Ecol. 2025, 40, 19. [Google Scholar] [CrossRef]
  58. Shaw, R.F.; Phillips, B.B.; Doyle, T.; Pell, J.K.; Redhead, J.W.; Savage, J.; Woodcock, B.A.; Bullock, J.M.; Osborne, J.L. Mass-Flowering Crops Have a Greater Impact than Semi-Natural Habitat on Crop Pollinators and Pollen Deposition. Landsc. Ecol. 2020, 35, 513–527. [Google Scholar] [CrossRef]
  59. Desaegher, J.; Sheeren, D.; Ouin, A. Optimising Spatial Distribution of Mass-Flowering Patches at the Landscape Scale to Increase Crop Pollination. J. Appl. Ecol. 2021, 58, 1876–1887. [Google Scholar] [CrossRef]
  60. Chiari, W.C.; Toledo, V.A.A.; Ruvolo-Takasusuki, M.C.C.; Oliveira, A.J.B.; Sakaguti, E.S.; Attencia, V.M.; Costa, F.M.; Mitsui, M.H. Pollination of soybean (Glycine max L. Merril) by honeybees (Apis mellifera L.). Braz. Arch. Biol. Technol. 2005, 48, 31–36. [Google Scholar] [CrossRef]
  61. Milfont, M.O.; Rocha, E.E.M.; Lima, A.O.N.; Freitas, B.M. Higher soybean production using honeybee and wild pollinators, a sustainable alternative to pesticides and autopollination. Environ. Chem. Lett. 2013, 11, 335–341. [Google Scholar] [CrossRef]
  62. Rollin, O.; Garibaldi, L.A. Impacts of honeybee density on crop yield: A meta-analysis. J. Appl. Ecol. 2019, 56, 1152–1163. [Google Scholar] [CrossRef]
  63. DeGrandi-Hoffman, G.; Chen, Y.; Huang, E.; Huang, M.H. The Effect of Diet on Protein Concentration, Hypopharyngeal Gland Development and Virus Load in Worker Honey Bees (Apis mellifera L.). J. Insect Physiol. 2010, 56, 1184–1191. [Google Scholar] [CrossRef] [PubMed]
  64. Vaudo, A.D.; Tooker, J.F.; Patch, H.M.; Biddinger, D.J.; Coccia, M.; Crone, M.K.; Fiely, M.; Francis, J.S.; Hines, H.M.; Hodges, M.; et al. Pollen Protein: Lipid Macronutrient Ratios May Guide Broad Patterns of Bee Species Floral Preferences. Insects 2020, 11, 132. [Google Scholar] [CrossRef] [PubMed]
  65. Crone, M.K.; Biddinger, D.J.; Grozinger, C.M. Wild Bee Nutritional Ecology: Integrative Strategies to Assess Foraging Preferences and Nutritional Requirements. Front. Sustain. Food Syst. 2022, 6, 847003. [Google Scholar] [CrossRef]
  66. Grant, K.J.; DeVetter, L.W.; Melathopoulos, A.P. Honey Bee (Apis mellifera) Colony Strength and Its Effects on Pollination and Yield in Highbush Blueberries (Vaccinium corymbosum). PeerJ 2021, 9, e11634. [Google Scholar] [CrossRef] [PubMed]
  67. Dainese, M.; Martin, E.A.; Aizen, M.A.; Albrecht, M.; Bartomeus, I.; Bommarco, R.; Carvalheiro, L.G.; Chaplin-Kramer, R.; Gagic, V.; Garibaldi, L.A.; et al. A global synthesis reveals biodiversity-mediated benefits for crop production. Sci. Adv. 2019, 5, eaax0121. [Google Scholar] [CrossRef] [PubMed]
Figure 1. Changes in hive weight throughout the experiment. Phases 1, 2, and 3 represent the chronological phases of the study. Points represent individual colony observations (with each symbol representing an individual hive according to its treatment), whereas lines indicate growth trajectories estimated by linear mixed models. Phase 1: initial nutritional management (R, restricted nutrition colonies; S, supplemented colonies) (n = 6). Phase 2: confinement of colonies (R and S) in pollination cages with (F+) or without (F−) fungicide exposure (n = 3). Phase 3: colonies returned to nutritional management, considering previous fungicide exposure (n = 3).
Agriculture 16 01667 g001
Figure 2. Changes in honey storage area (a), pollen storage area (b), and brood area (c) (cm2) in honey bee colonies subjected to different nutritional management regimes (S = Supplemented; R = Restricted nutrition) during the 48-day period preceding the pollination cage experiment (Phase 1). Points represent estimated means, and vertical bars indicate the standard error of the mean (n = 6).
Agriculture 16 01667 g002
Figure 3. Resilience dynamics of honey bee colonies from pre-confinement (day 48) and two weeks after removal from the pollination cages (day 84), based on mapping of honey, pollen, and brood areas. Data are expressed as Δ values for colonies subjected to two nutritional management regimes (S: Supplemented; R: Restricted) and two levels of fungicide exposure (n = 3). Panels show honey storage area (left), pollen storage area (center), and brood area (right). Diamonds represent arithmetic means, and boxplots indicate the interquartile distribution. The horizontal dashed line at zero represents the initial status (day 48); negative values indicate a net loss during the evaluated period.
Agriculture 16 01667 g003
Figure 4. Dynamics of Varroa destructor infestation rates in honey bee colonies subjected to different nutritional management regimes (S: Supplemented; R: Restricted) and fungicide exposure. (Left panel) shows the evolution of the infestation rate (%) during the pre-confinement period (days 0 to 48), with points representing estimated means, lines indicating trends (solid for S; dashed for R), and vertical bars indicating the standard error (n = 6). (Right panel) displays sanitary resilience expressed as the Delta variation between pre- (day 48) and post-confinement (day 84) under two levels of fungicide exposure; boxplots indicate the interquartile distribution, diamonds represent arithmetic means, and the horizontal dashed line at zero represents the initial status (day 48). Positive values indicate an increase in the parasitic load during the evaluated period (n = 3).
Agriculture 16 01667 g004
Figure 5. Dynamics of hygienic behavior in honey bee colonies subjected to different nutritional managements (S: Supplemented; R: Restriction) over a 36-h evaluation period. Each panel corresponds to a specific experimental time point (Days 0, 28, and 48). Solid lines indicate the uncapping rate of dead brood (uncapped cells), and dashed lines indicate the effective brood removal rate. Markers represent the estimated means (LS-Means), and vertical bars indicate the standard error (n = 6).
Agriculture 16 01667 g005
Figure 6. Dynamics of hygienic behavior resilience in honey bee colonies. The graphs display sanitary resilience expressed as the Delta variation (%) of uncapping and removal rates between pre- (day 48) and post-confinement (day 84) under two levels of fungicide exposure (F+: exposed; F−: control) and two nutritional managements (S: Supplemented; R: Restricted). Diamonds indicate the means, and boxplots represent the interquartile range. The horizontal dashed line at zero represents the baseline performance (day 48); negative values indicate a net loss in cleaning efficiency during the recovery period (n = 3).
Agriculture 16 01667 g006
Table 1. Soybean grain yield (kg ha−1) and 100-seed weight (g) according to pollination conditions (restricted access in cages using colonies with supplemented [S] or restricted [R] feeding, insect-free cages or open field) and fungicide application.
EffectsYield (kg ha−1)100-Seed Weight (g)
Pollination groups
   Caged S3076.7 ± 72.0 a *13.7 ± 0.1
   Caged R2823.8 ± 53.2 ab13.6 ± 0.2
   Insect-free cage2334.2 ± 24.3 c13.2 ± 0.2
   Open Field 2676.3 ± 59.3 b13.4 ± 0.1
Pesticide use
   With fungicide2722.8 ± 59.313.4 ± 0.1
   Without fungicide2733.3 ± 59.613.6 ± 0.1
Sources of VariationProbability (p-value)
Pollination (a)<0.0010.096
Fungicide (b)0.8950.177
Interaction (a × b)0.5470.126
* Means followed by different lowercase letters within the same column differ significantly by Tukey’s test (p < 0.05).
Disclaimer/Publisher’s Note: The statements, opinions and data contained in all publications are solely those of the individual author(s) and contributor(s) and not of MDPI and/or the editor(s). MDPI and/or the editor(s) disclaim responsibility for any injury to people or property resulting from any ideas, methods, instructions or products referred to in the content.