Article

Effects of Force-Feeding on Liver Lipid Accumulation and Fatty Acid Profiles in Mule Ducks

Engineering Research Center for Animal Breeding and Sustainable Production, College of Animal Sciences, Fujian Agriculture and Forestry University, Fuzhou 350002, China
*
Author to whom correspondence should be addressed.
Agriculture 2026, 16(15), 1645; https://doi.org/10.3390/agriculture16151645
Submission received: 30 June 2026 / Revised: 28 July 2026 / Accepted: 29 July 2026 / Published: 31 July 2026
(This article belongs to the Section Farm Animal Production)

Abstract

This study characterized lipid accumulation in force-fed mule duck foie gras (fatty liver) and evaluated its association with hepatic physiological status. Thirty-six healthy male mule ducks (67 ± 2 days of age) were randomly assigned to a control group (CON) or force-fed group (O-F). Serum and liver samples were collected for further analysis on days 6, 12, and 18. Compared with the CON group, force-feeding markedly increased liver weight on days 6, 12, and 18, with average increases of 100 g, 200 g, and 430 g, respectively (p < 0.01). No significant differences were observed in hepatic oxidative stress markers, inflammatory cytokines, and biochemical indicators of liver injury on days 6, 12, and 18 between the control and force-fed groups (p > 0.05). Furthermore, both untargeted lipidomic Orthogonal Partial Least Squares—Discriminant Analysis (OPLS-DA) and targeted fatty acid analysis revealed clear metabolic separation between the two groups on day 18. Compared with CON, total hepatic unsaturated fatty acids increased by 60.7% in O-F ducks on day 18 (p < 0.01), with oleic acid, linoleic acid, α-linolenic acid, and eicosapentaenoic acid increasing by approximately 400%, 100%, 300%, and 35%, respectively (p < 0.01). These results indicate that short-term force-feeding alters the hepatic fatty acid profile through lipid accumulation, while circulating markers of liver injury remain unaffected.

1. Introduction

Foie gras is produced through the short-term force-feeding of geese or ducks during the late growth stage with high-energy carbohydrate-rich diets, which induces rapid hepatic enlargement and excessive lipid accumulation in the liver [1,2]. The global demand for foie gras exceeds 30,000 tons yearly, and the mule duck has become the dominant breed in foie gras production due to its high liver yield [3,4,5]. However, the force-feeding-induced fatty liver formation in mule ducks raises significant health and welfare concerns regarding foie gras production. A comprehensive assessment of foie gras quality and nutritional composition would not only address consumer concerns about liver characteristics but also identify potential nutritional intervention targets to counteract the adverse effects associated with force-feeding practices.
Regarding the physiological responses during the formation of fatty liver in waterfowl, the existing literature presents dual findings. On the one hand, force-feeding induces significant metabolic stress in the liver of mule ducks and Tianfu meat geese, characterized by increased oxidative and inflammatory signaling cascades, and aggravated hypoxic responses [6,7,8,9], as well as altered lipid metabolic pathways [10,11,12]. Excessive lipid deposition may further disrupt hepatocyte homeostasis by promoting the production of reactive oxygen species and the lipid peroxidation of mule ducks [13], and potentially exert negative impacts on the behavior, respiratory function, and physiological stress levels of Poland geese and Landes geese [14]. On the other hand, other studies have revealed that the reconfiguration of the fatty acid profile accompanying foie gras formation can substantially alleviate this metabolic stress. In Landes geese, lipid accumulation induces a substantial enrichment of unsaturated fatty acids (UFAs); oleic acid (C18:1) accounts for approximately 45% of UFAs [15]. In Beijing ducks, the proportion of UFAs in total fatty acids is approximately 70% [16]. These UFAs not only suppress saturated fatty acid-induced ceramide accumulation and hepatic inflammatory responses [17,18], but also enhance the liver’s antioxidant defense system through the preferential accumulation of n-3 polyunsaturated fatty acids (PUFAs), which significantly elevates the activities of antioxidant enzymes [superoxide dismutase (SOD), catalase (CAT) and glutathione peroxidase 1 (GPX1)], sustains reduced glutathione (GSH) levels, and minimizes the accumulation of lipid hydroperoxides [6]. Importantly, even under conditions of severe steatosis, hepatocytes from French Landes grey geese, Polish white geese, and Tianfu meat geese maintain stable phosphatidylcholine (PC)/phosphatidylethanolamine (PE) ratios, thereby preserving cell membrane integrity and functional homeostasis [7,8]. While oxidative stress, cellular injury, and animal welfare during foie gras production are well-studied in geese, it remains unclear whether force-feeding induces similar hepatic stress in mule ducks, and whether this stress correlates with changes in the hepatic fatty acid profile.
Therefore, we hypothesize that short-term force-feeding may alter fatty acid composition in mule ducks but not affect liver injury markers. In the present study, a force-feeding model in mule ducks was established to evaluate markers of hepatic injury, inflammatory and oxidative stress indicators, and lipid composition. These results provide a scientific basis for balancing production efficiency and animal welfare in foie gras production.

2. Materials and Methods

All experimental and management procedures involving ducks were conducted in strict accordance with the animal welfare and ethical guidelines established by the Animal Care and Use Ethics Committee of Fujian Agriculture and Forestry University, China (PZCASFAFU24003).

2.1. Experiment Design and Sample Collection

A total of 36 healthy male mule ducks, aged 67 ± 2 days and weighing 3.3 ± 0.2 kg, were randomly assigned to two dietary treatments and three time points (6, 12, and 18 days), resulting in six groups, control diet for 6 days (6 CON), control diet for 12 days (12 CON), control diet for 18 days (18 CON), force-feeding diet for 6 days (6 O-F), force-feeding diet for 12 days (12 O-F), and force-feeding diet for 18 days (18 O-F). Ducks were force-fed in force-feeding diet groups according to the production application dosage using a pneumatic force-feeding system. The specific feeding amounts are provided in Table S1. All ducks were individually housed in cages measuring 20 cm × 45 cm, with each group consisting of 6 replicates, each containing 1 duck (1 duck per cage). Ducks had ad libitum access to drinking water throughout the 18-day experimental period. The housing environment was maintained at 22 ± 2 °C with adequate ventilation, and manure was removed and cleaned daily to ensure optimal hygiene. The control group was fed a conventional diet meeting the Nutrient Requirements of Poultry for Muscovy ducks [19] (Tables S2 and S3). The force-feeding group received a force-feeding diet based on prior formulation [20], containing 96.9% corn, 2.0% duck oil, 0.5% salt, 0.3% limestone, 0.2% premix, and 0.1% dicalcium phosphate.
All samples were collected in winter. Blood samples were collected from ducks following a 12-h fasting period on days 6, 12, and 18, and serum was subsequently obtained. The serum samples were stored at −80 °C for subsequent analysis. The ducks were then euthanized, and liver tissues were immediately excised, weighed, and recorded. A 2–3 g sample of liver tissue was obtained from the tip of the right lobe, rinsed with sterile physiological saline, placed in sterile sampling bags, and snap-frozen in liquid nitrogen for future analyses.

2.2. Untargeted Lipidomics Analysis

Lipid profiling was performed using Liquid Chromatography-Mass Spectrometry (LC–MS) technology based on an untargeted metabolomics approach, employing the High-Performance Liquid Chromatography-Quadrupole (UHPLC-Q) Exactive system (Thermo Fisher Scientific, Waltham, MA, USA). Liver tissues were extracted using low-temperature ultrasonication, and chromatographic separation was performed using an HSS T3 column (100 mm × 2.1 mm, 1.8 μm, Waters Corporation, Milford, MA, USA). Mass spectrometric analysis was conducted on a Thermo UHPLC-Q Exactive system equipped with an electrospray ionization (ESI) source, with data acquired in both positive and negative ion modes.
Lipidomic data were analyzed using the metaboanalyst platform and Majorbio Cloud Platform (https://www.majorbio.com, accessed on 20 June 2026) [21]. Cluster analysis, correlation analysis, principal component analysis (PCA), Partial Least Squares—Discriminant Analysis (PLS-DA), and OPLS-DA were performed using R software (v4.3.0). Differential lipids were screened based on the OPLS-DA model. Lipid metabolites with fold changes (FC) ≥ 1.20 or ≤0.83 (corresponding to log2FC ≥ 0.26 or ≤ −0.27), p < 0.05, and Variable Importance in Projection (VIP) ≥ 1 were defined as differential lipid metabolites. Kyoto Encyclopedia of Genes and Genomes (KEGG) compound classification was based on KEGG Compound Release 2017-05-01. KEGG functional pathway enrichment analysis was conducted using KEGG Pathway Release 2017-05-01 and the scipy (Python) library (version 1.0.0). Correlation and heatmap analyses were similarly based on KEGG Pathway Release 2017-05-01 and scipy (Python) version 1.0.0. VIP analysis was performed using ropls (R)–scipy (Python) version 1.6.2−1.0.0, while PCA and other statistical analyses were completed using the ropls R package (version 1.6.2).

2.3. Targeted Analysis of Fatty Acids

Liver tissues were extracted and pretreated using low-temperature ultrasonication [22]. Gas chromatography analysis was performed on a Trace 1300 GC system (Thermo Fisher Scientific, Waltham, MA, USA). The GC was fitted with a capillary column Thermo TG-FAME (50 m × 0.25 mm ID × 0.20 μm, Thermo Fisher Scientific, Waltham, MA, USA) and helium was used as the carrier gas at 0.63 mL/min. Injection was made in split mode at 8:1 with an injection volume of 1 μL and an injector temperature of 250 °C. The temperature of the ion source and MS transfer line were 300 °C and 280 °C, respectively. The column temperature was programmed to increase from an initial temperature of 80 °C, which was maintained for 1 min, followed by an increase to 160 °C at 20 °C/min, which was maintained for 1.5 min, and increase to 196 °C at 3 °C/min, which was maintained for 8.5 min, and finally to 250 °C at 20 °C/min, where it was kept at this temperature for 3 min.
Metabolite mass spectrometry detection was carried out using a TSQ 9000 mass spectrometer (Thermo Fisher Scientific, Waltham, MA, USA) under electron impact ionization (EI) mode, operating in selected ion monitoring (SIM) mode (Beccaria et al., 2018 [23]). Principal component analysis (PCA), Partial Least Squares—Discriminant Analysis (PLS-DA), and correlation analysis were applied for dimensionality reduction and visualization of the targeted quantitative analysis data. Differential fatty acids were screened based on the PLS-DA model (VIP > 1.0 and p < 0.05).

2.4. ELISA

Enzyme-linked immunosorbent assay (ELISA) kits were employed, following the manufacturer’s instructions, to quantify the concentrations of superoxide dismutase (SOD), malondialdehyde (MDA), glutathione peroxidase (GSH-Px), catalase (CAT), alanine aminotransferase (ALT), aspartate aminotransferase (AST), glucose (GLU), alkaline phosphatase (ALP), interleukin (IL)-1, IL-22, IL-17, IL-6, IL-4, tumor necrosis factor-α (TNF-α), and transforming growth factor-β1 (TGF-β1) in liver tissues of mule ducks. Detailed information on the assay kits is provided in Table S4. Sample absorbance was measured at 450 nm using a microplate reader (Epoch, BioTek Instruments, Winooski, VT, USA), and concentrations were calculated accordingly. The intra- and inter-assay coefficients of variation were below 10% and 15%, respectively.

2.5. Statistical Analysis

The normality of liver weight data distribution was assessed using Q–Q plots, and the homogeneity of variances was evaluated using Levene’s test. For variables that fail to satisfy the normality assumption, appropriate data transformations were performed according to their distribution characteristics, including logarithmic transformation or square root transformation. When the assumptions of normality and the homogeneity of variance were met, data were analyzed using two-way ANOVA to evaluate the effects of the feeding model, treatment duration and their interaction. When a significant interaction effect was detected, Tukey’s multiple comparison test was subsequently performed for pairwise comparisons among groups. For the analysis of fatty acid content, only exploratory comparison was conducted on the mean values of two independent groups on day 18; thus, a two-tailed independent samples t-test was adopted, and Welch’s correction was applied in cases of unequal variances. All statistical analyses were conducted using IBM SPSS Statistics version 17.0 (IBM Corp., Armonk, NY, USA).
Data from lipidomics and targeted fatty acid analyses were identified and quantified using lipid search software (Thermo Fisher Scientific, USA). Results are presented as the mean ± standard error of the mean (SEM). Statistical significance was set at p ≤ 0.05, with n = 6.

3. Results

3.1. Liver Weight in Mule Ducks

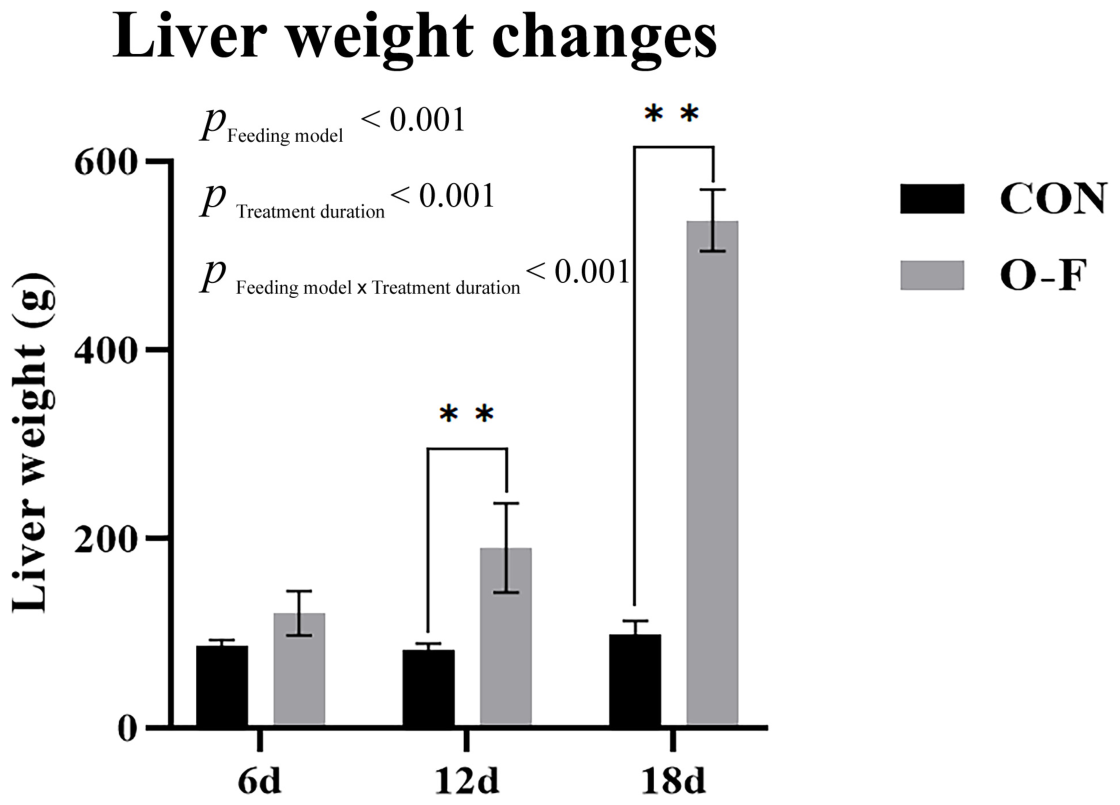
Significant main effects of the feeding model and treatment duration, as well as a significant interaction between the feeding model and treatment duration, were observed for average liver weight in mule ducks (p < 0.001). The treatment duration effect showed that liver weights in the CON group and O-F group increased significantly with treatment duration (p < 0.001), while no significant difference in liver weight was observed between the two feeding regimes on day 6 (p > 0.05). Liver weight in the force-feeding group was significantly higher than that in the ad libitum group both on day 12 and 18 (p < 0.001, Figure 1).

3.2. Inflammation, Oxidative Stress and Liver Injury Markers

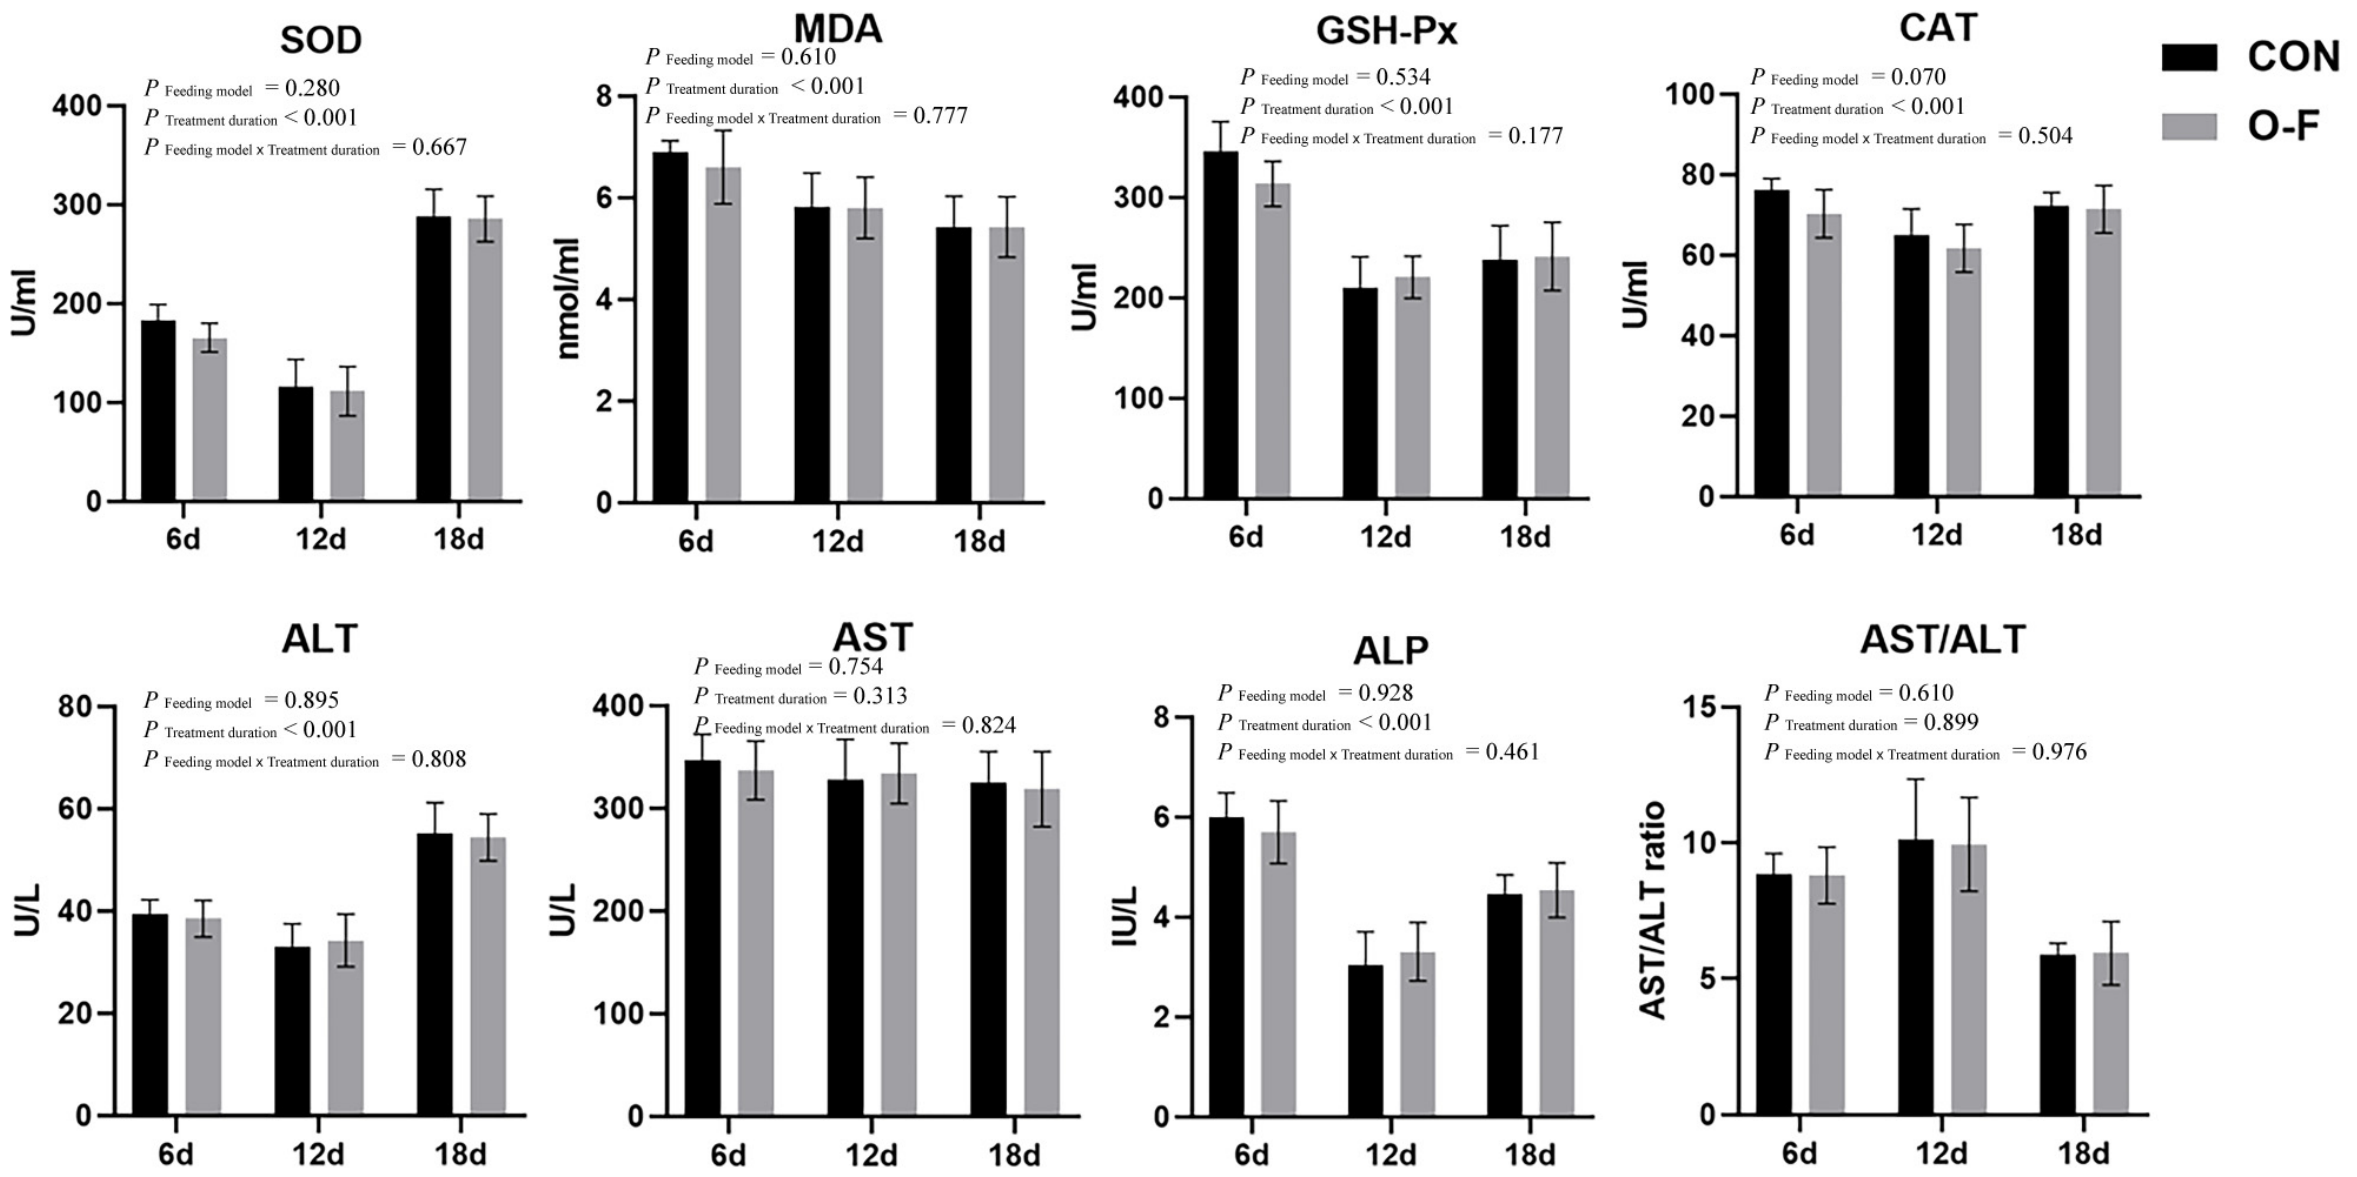
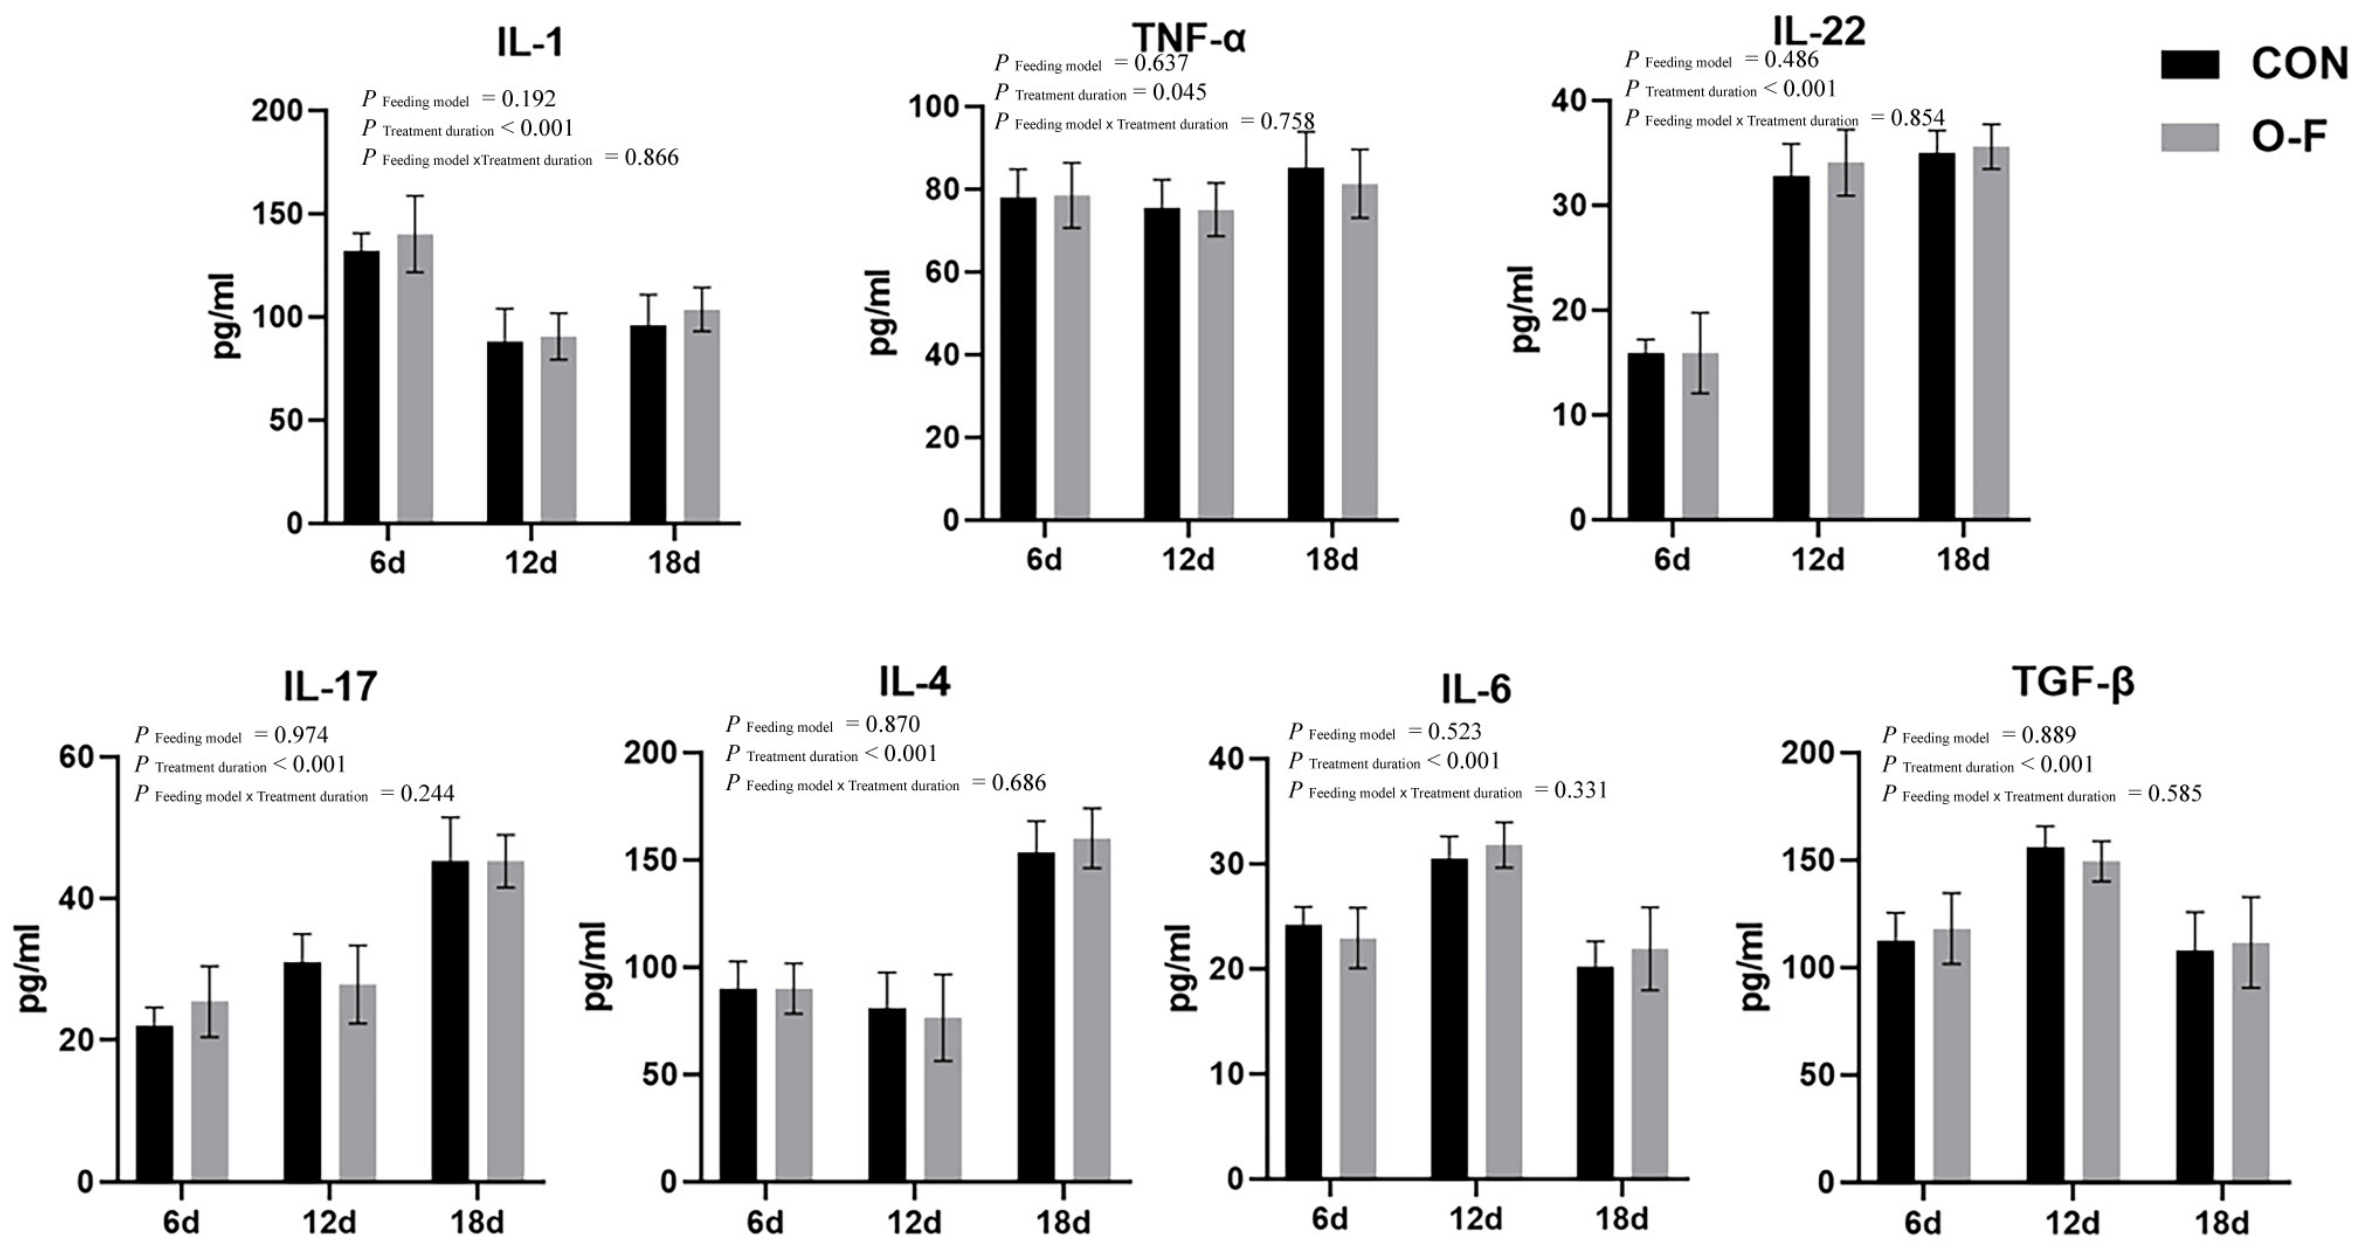
Hepatic levels of SOD, MDA, GSH-Px, CAT, ALT, ALP, IL-1, TNF-α, IL-22, IL-17, IL-4, IL-6, and TGF-β1, as well as the AST/ALT ratio, were significantly affected by treatment duration (p < 0.001) but not by the feeding model, with no significant interaction between the treatment duration and feeding model (p > 0.05). No significant effects of the feeding model, treatment duration, or the interaction between feeding model and treatment duration were observed for liver AST level in mule ducks (p > 0.05, Figure 2 and Figure 3).

3.3. The Lipidomic Profile of Fatty Liver in Force-Feeding Mule Ducks

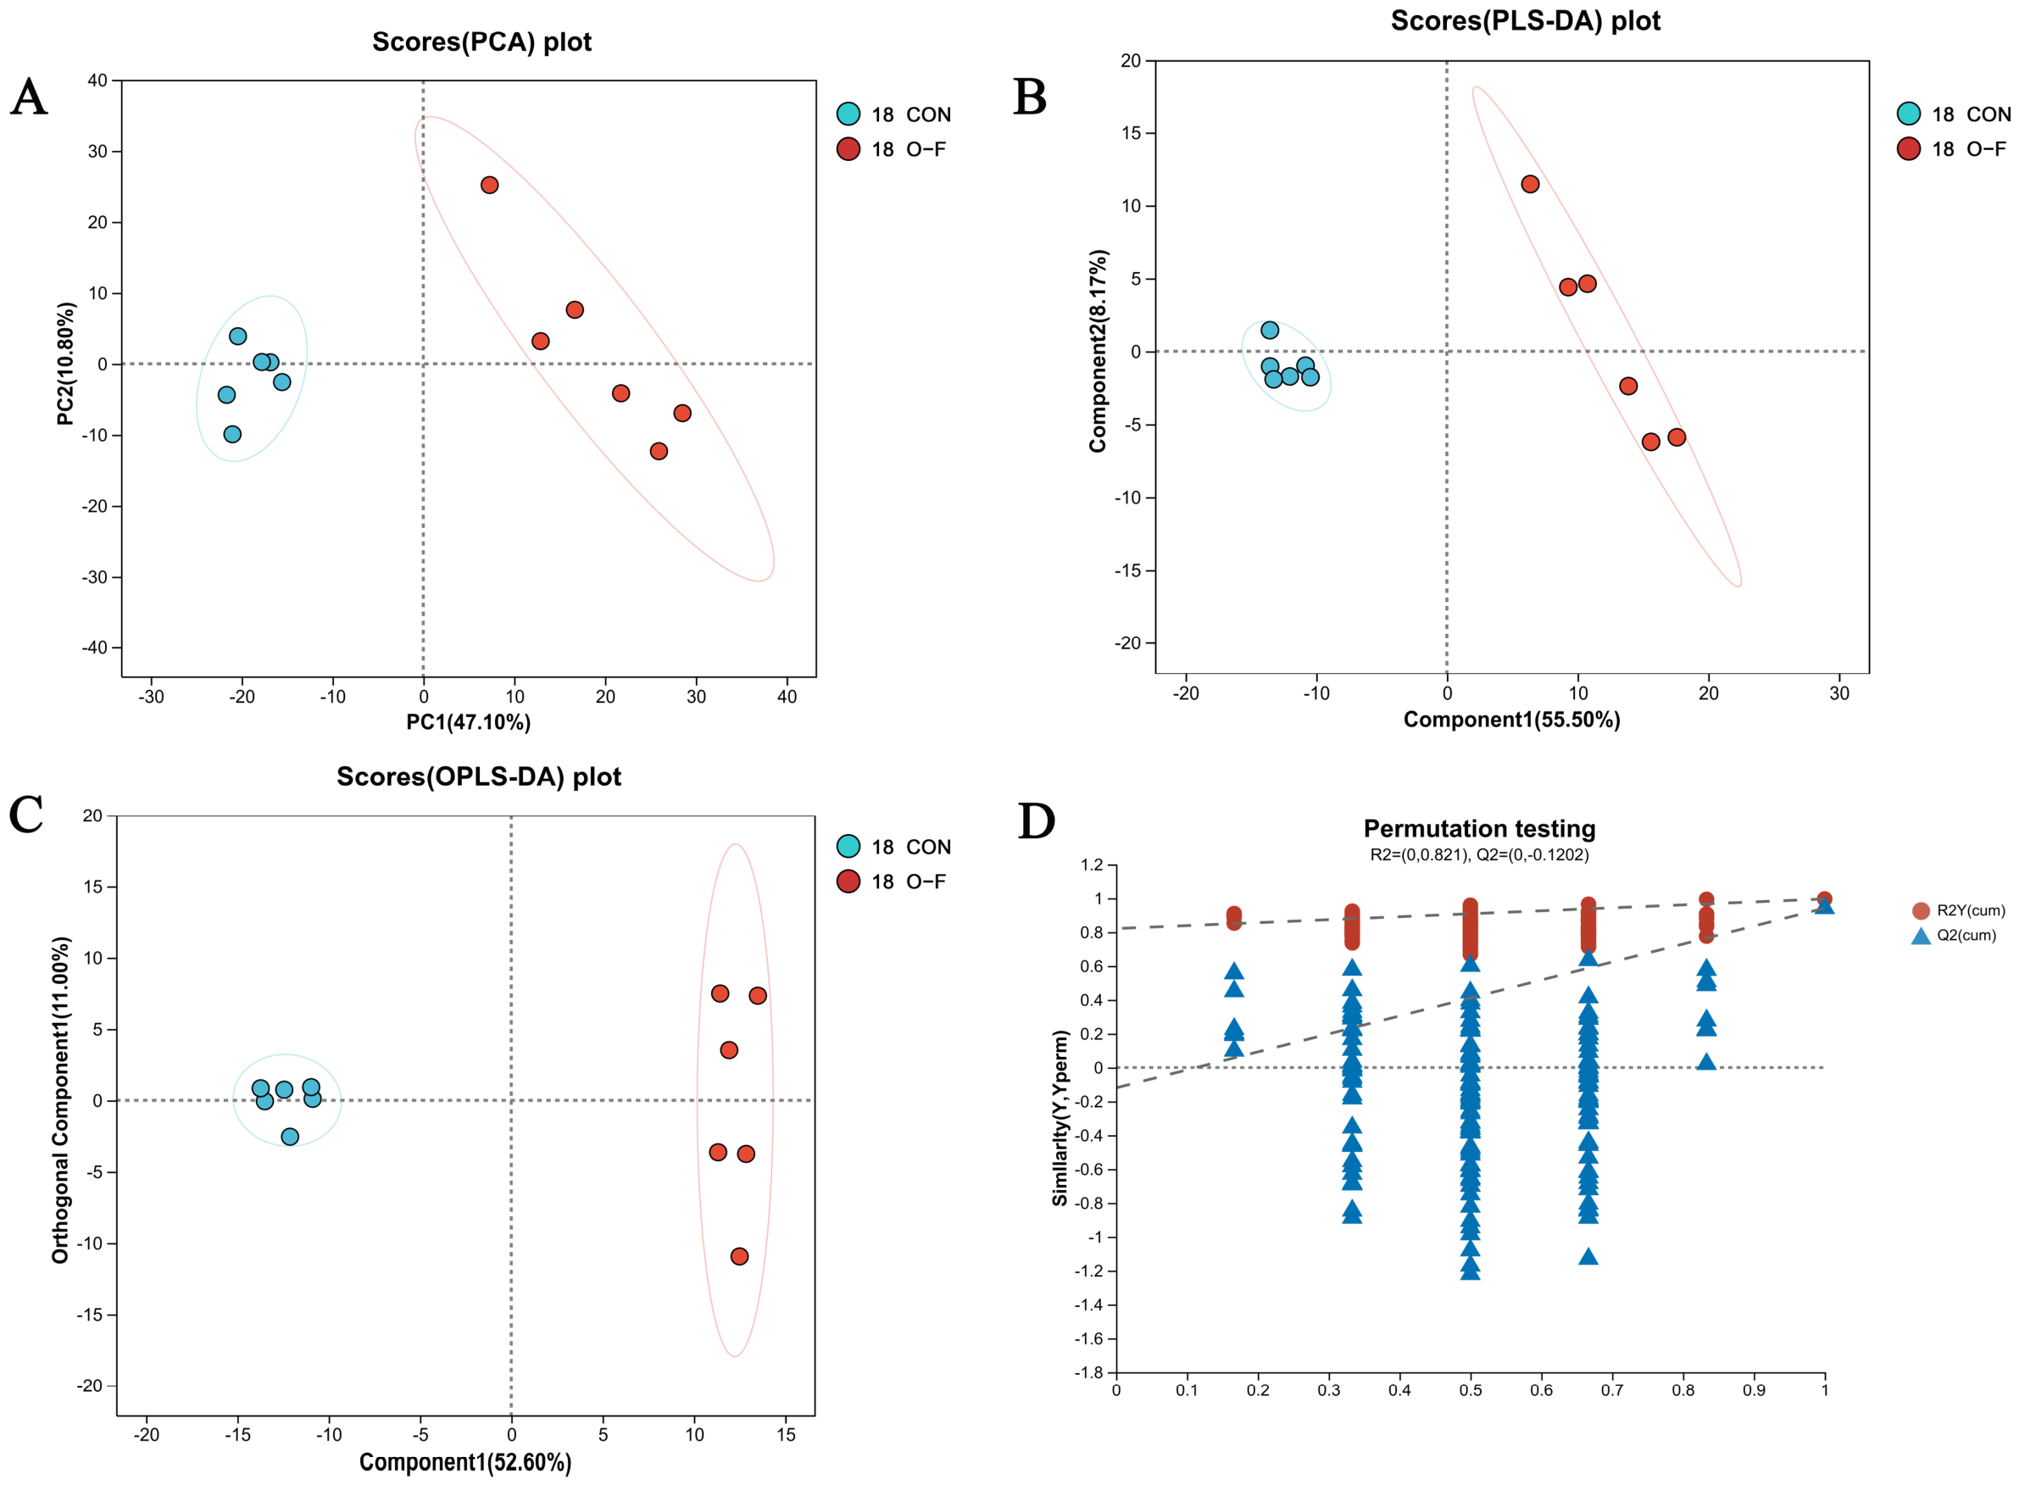
A clear separation between the 18 O-F group and the 18 CON group was observed in the PCA score plot (Figure 4A). The predictive parameters of the OPLS-DA model were R2Y = 0.994 and Q2 = 0.958 (Figure 4B,C). Furthermore, after 200 permutation tests, the Q2 intercept with the Y-axis was negative and less than 0.05 (p < 0.05, Figure 4D).
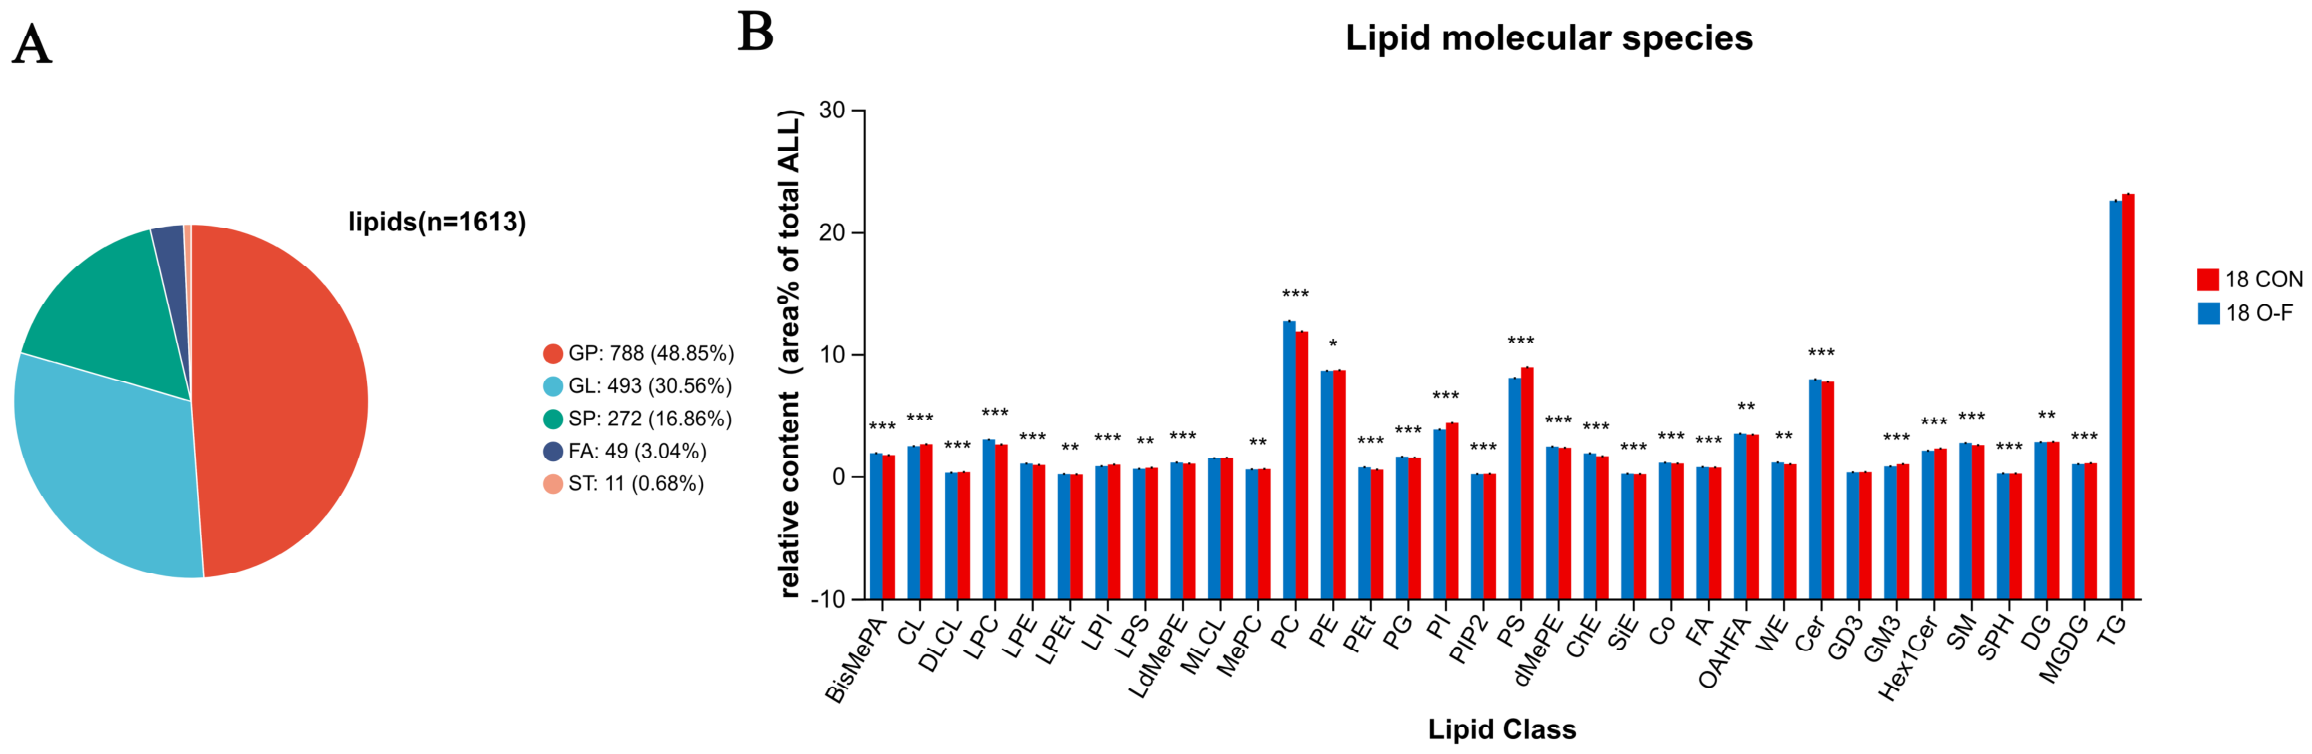
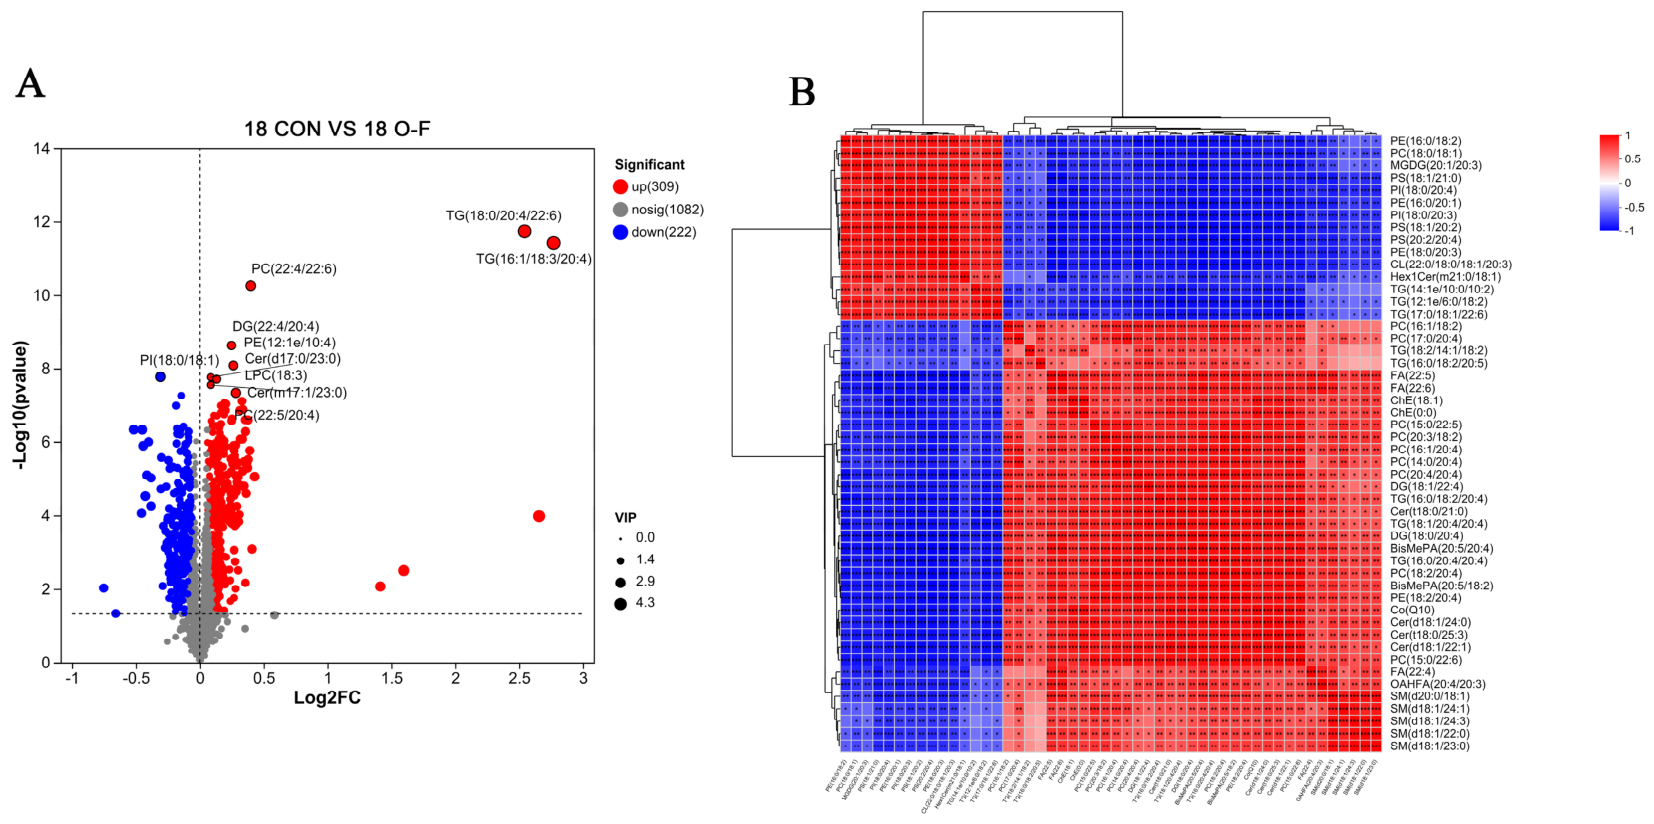
Hepatic lipid profiles induced by force-feeding showed the detection of a total of 1613 lipid species, classified by major categories such as glycerophospholipids (GP, 788 species, 48.85%), glycerolipids (GL, 493 species, 30.56%), sphingolipids (SP, 272 species, 16.86%), fatty acyls (FA, 49 species, 3.04%), and sterols (ST, 11 species, 0.68%) (Figure 5A). Comparing liver samples from the 18 O-F group with the 18 CON group, 531 differential lipid metabolites were identified, with 309 upregulated and 222 downregulated, and triglyceride (TG) being the most significantly affected lipid category (p < 0.01, Figure 6A). At the subclass level, the predominant lipid molecules in mule duck liver were TG (25.53%), PC (12.03%), and PE (10.07%) (Figure 5B).
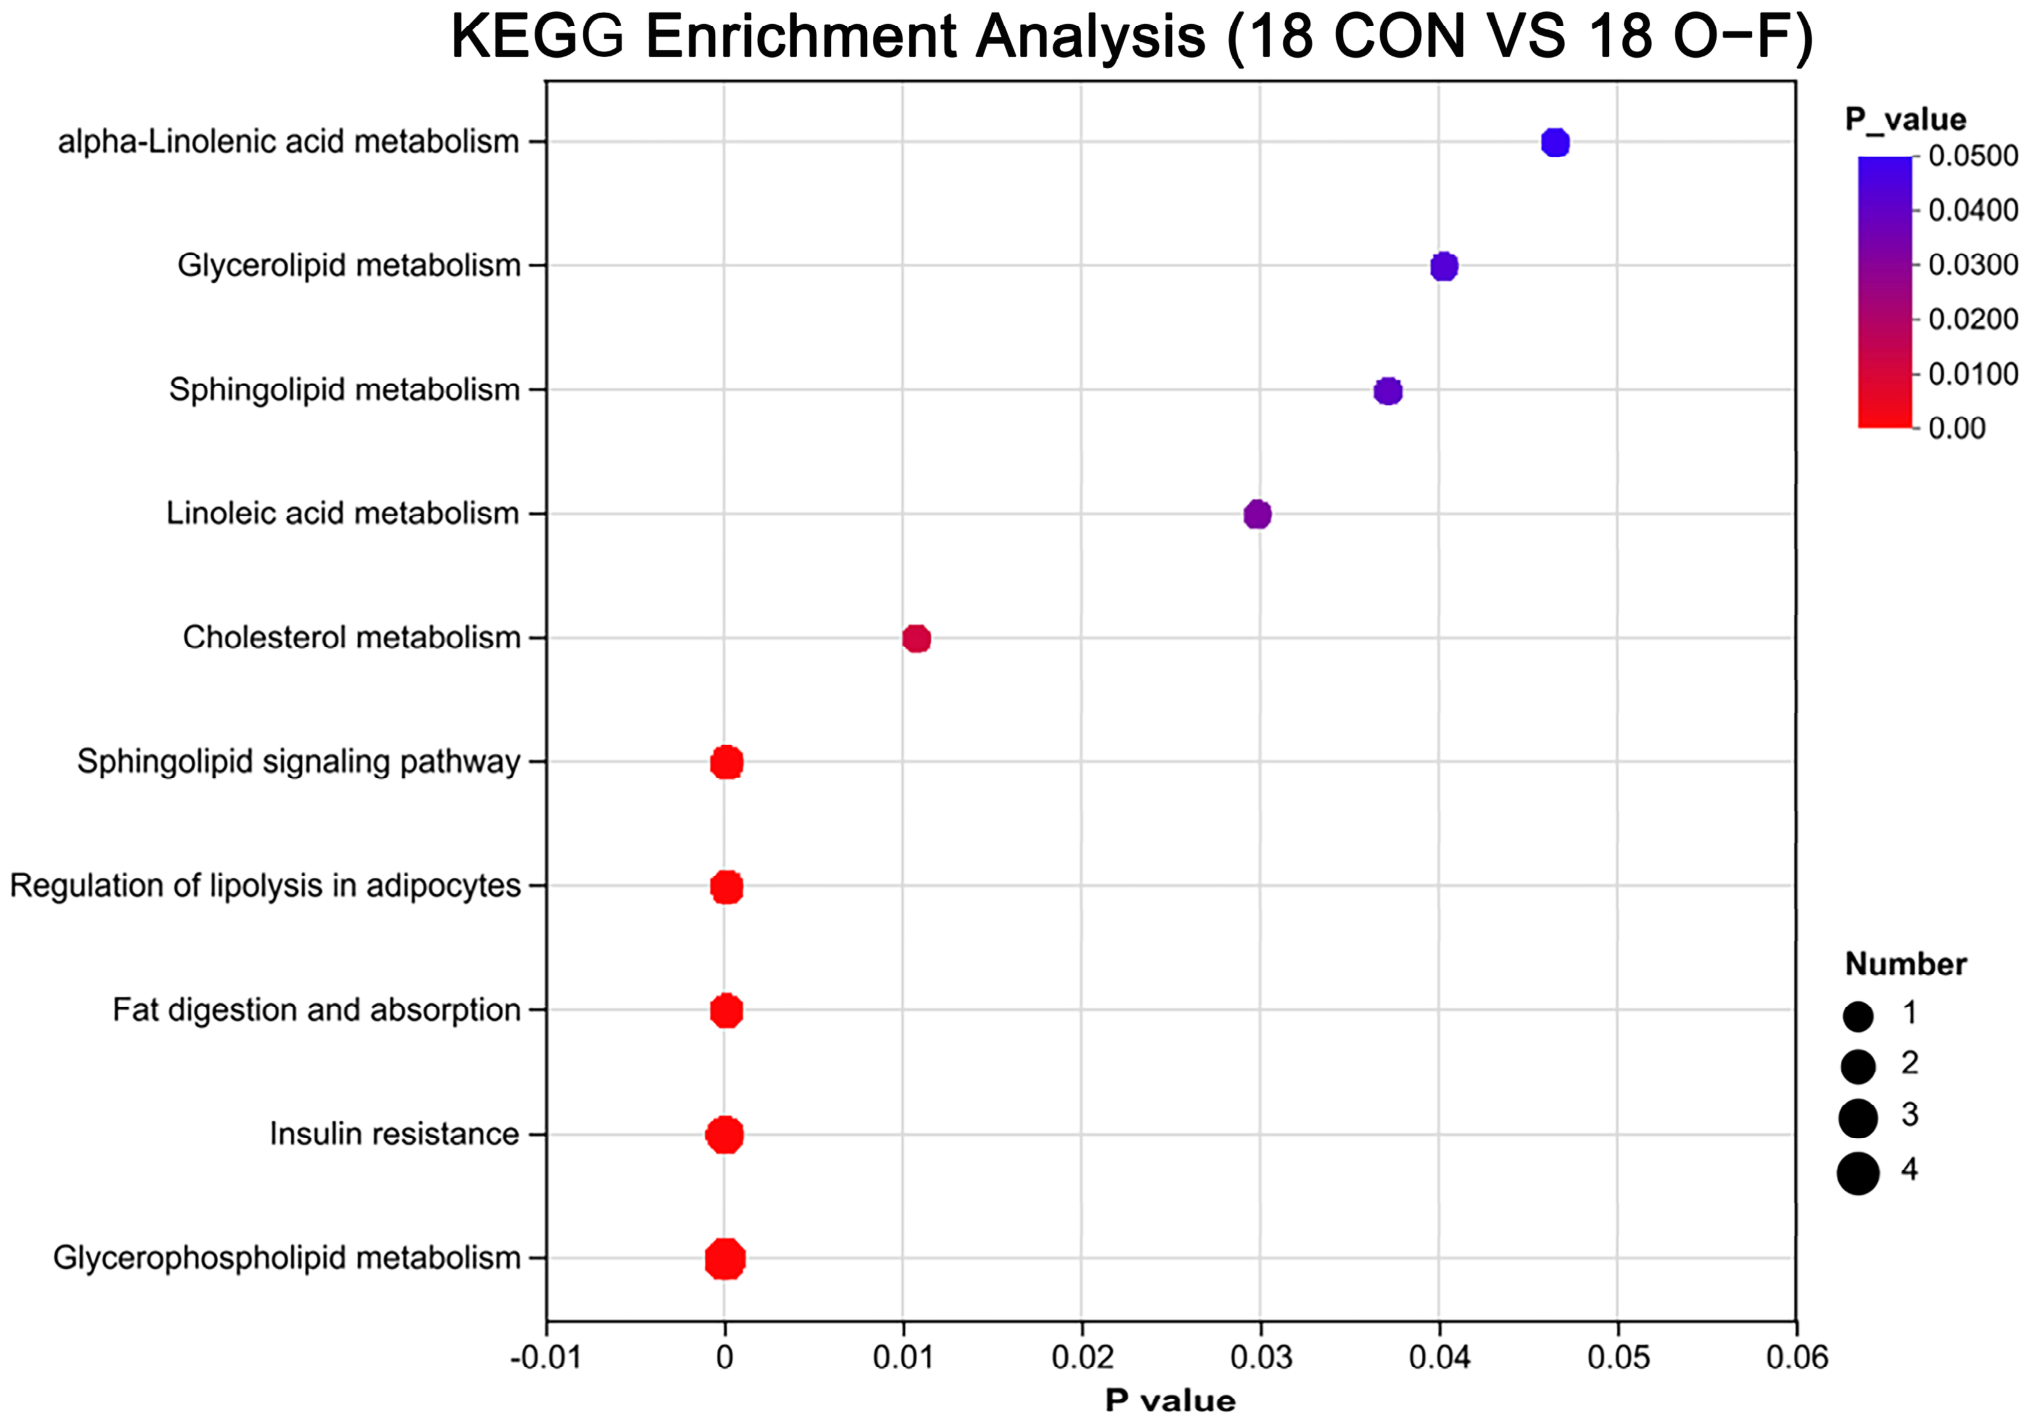
Force-feeding increased hepatic lysophosphatidylcholine (LPC) levels while decreasing DG levels (p < 0.01, Figure 5B); however, the PC/PE ratio showed no significant difference between the 18 CON group and the 18 O-F group (p > 0.05, Figure 5B). Additionally, the correlation analysis revealed that, among the top 10 correlations, the most significant were the positive correlations between TG and DG, as well as between SM and Cer (Figure 6B, p < 0.01). Conversely, DG showed negative correlations with PC and PE (p < 0.01, Figure 6B). The top 10 KEGG pathway analysis results illustrate that these differentially expressed lipids were primarily enriched in several critical metabolic and immune pathways, including glycerophospholipid metabolism, insulin resistance, fat digestion and absorption, the regulation of lipolysis in adipocytes, sphingolipid signaling pathway, cholesterol metabolism, linoleic acid metabolism, sphingolipid metabolism, glycerolipid metabolism, and alpha-linolenic acid metabolism (Figure 7).

3.4. Fatty Acid Proportions in the Livers of Force-Fed Mule Ducks

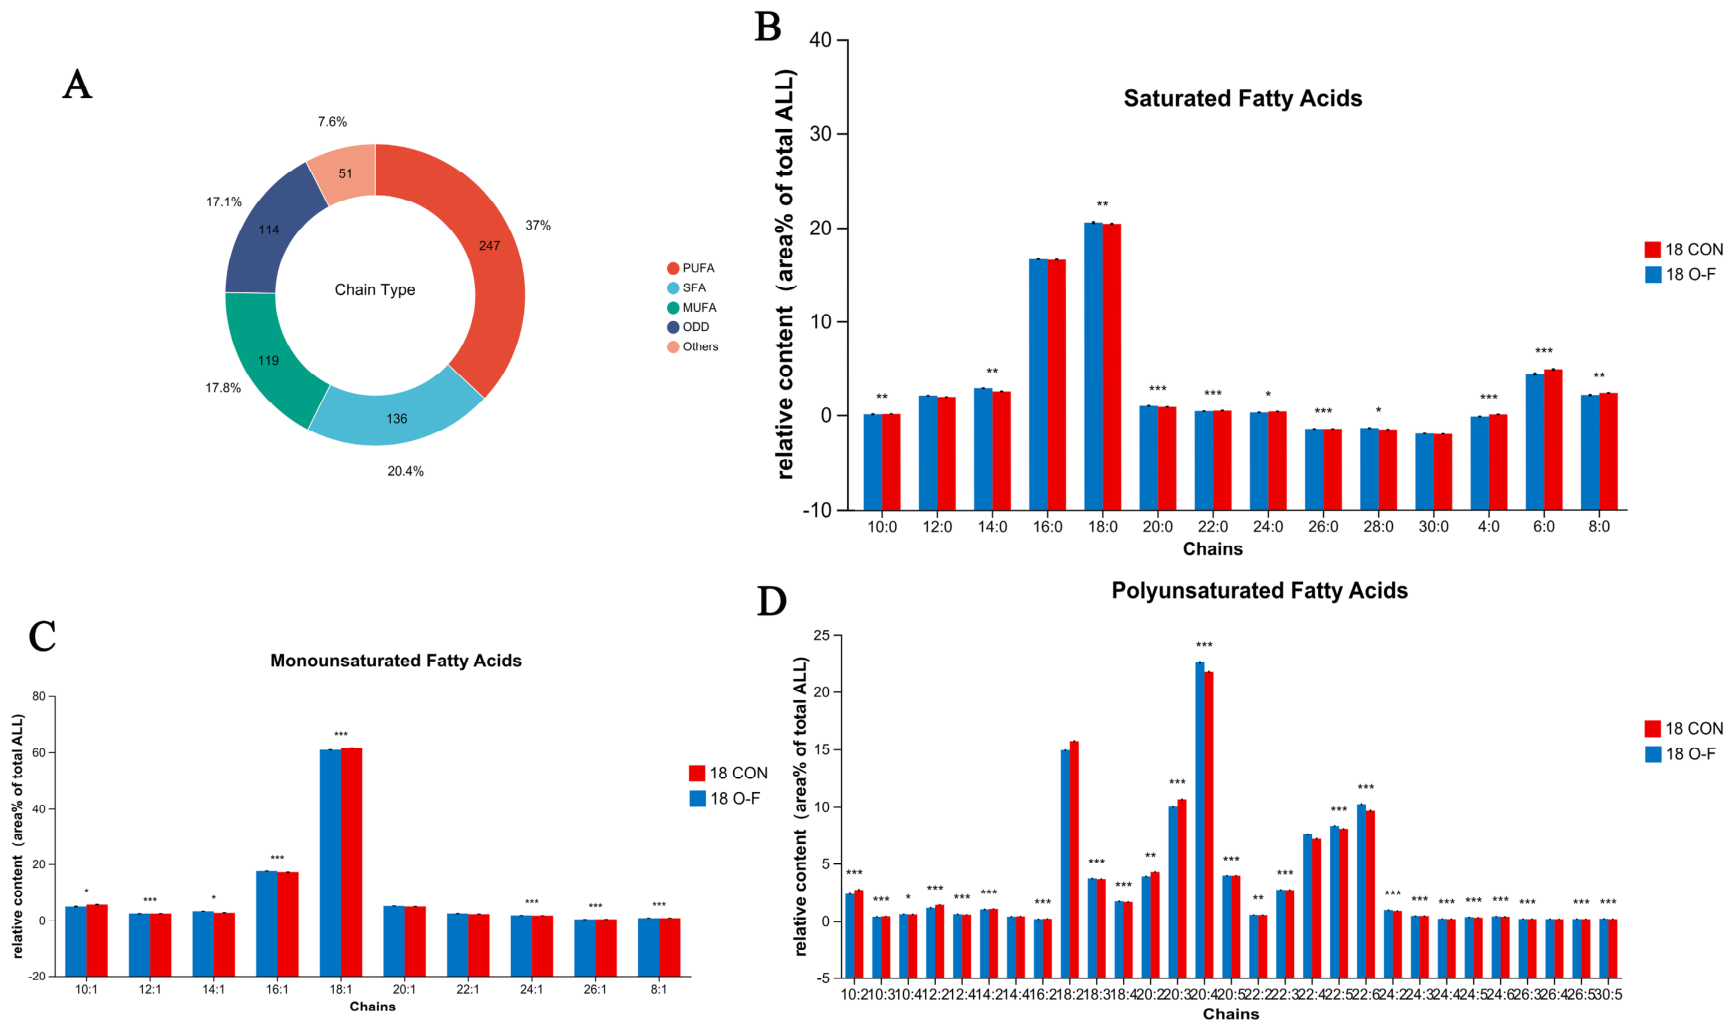
Fatty acid profiles in gavage-induced mule duck livers were characterized, and a total of 667 fatty acids were detected and classified into saturated (SFA, 136, 20.4%), monounsaturated (MUFA, 119, 17.6%), and polyunsaturated (PUFA, 247, 37.0%) (Figure 8A). Compared to the CON group, the 18 O-F group showed increased hepatic levels of SFA, MUFA, and PUFA (Figure 8B–D).
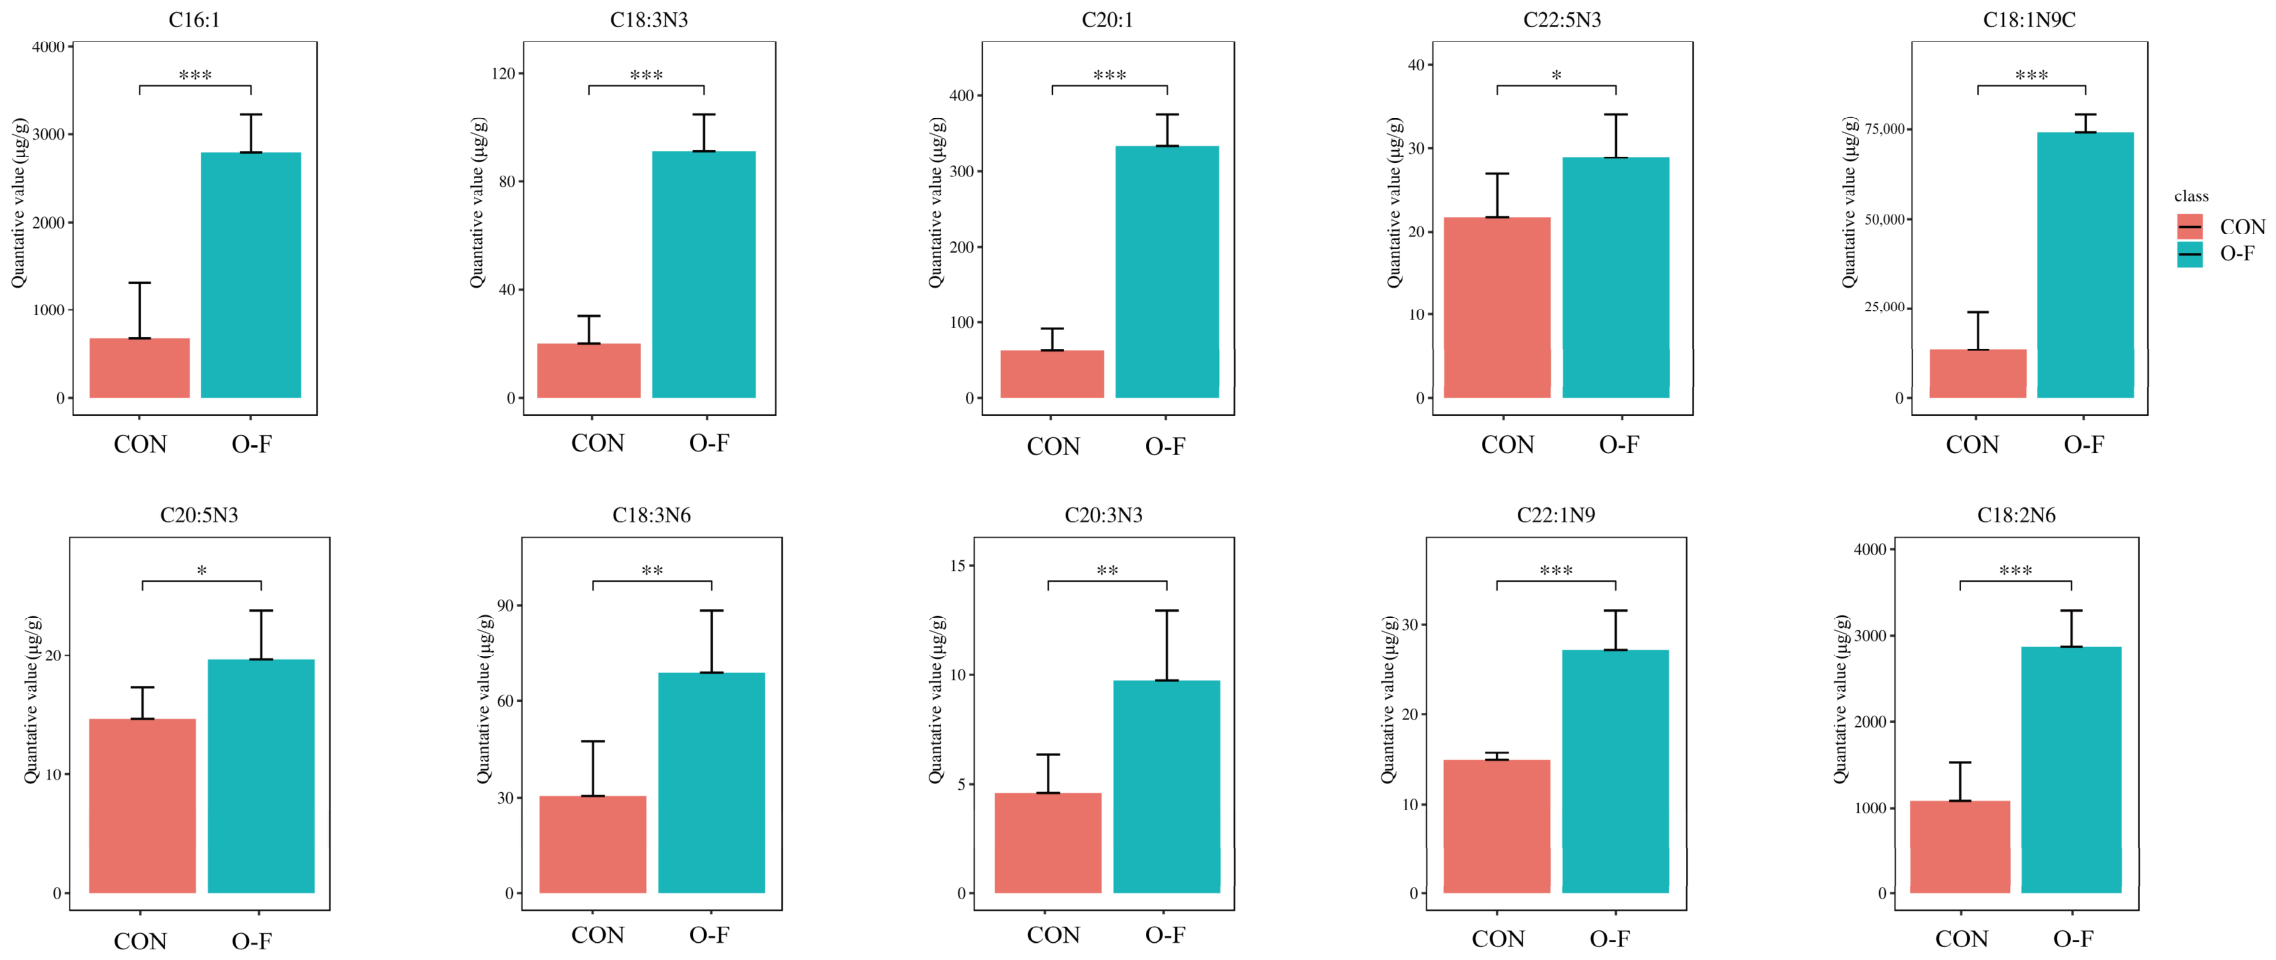
In comparison with the 18 CON group, 42 free fatty acids were markedly upregulated and 3 were significantly downregulated in liver tissues of the 18 O-F group (p < 0.05; Table S5). Relative to the 18 CON group, the 18 O-F group showed enrichment in a series of beneficial unsaturated fatty acids, including C16:1, C18:1, C18:2n6, C18:3n3/6, C20:1, C22:1N9, C20:3n3, C22:5n3 (DPA) and C20:5n3 (EPA) in mule duck liver (p < 0.05). Hepatic C16:1, C18:1, C18:2n6, C18:3n3/6, C20:1, C22:1N9, C20:3n3, C22:5n3 (DPA) and C20:5n3 (EPA) increased by approximately 300%, 400%, 150%, 300%, 120%, 400%, 80%, 100%, 33% and 35% respectively (Figure 9).

4. Discussion

Force-feeding, a common practice in waterfowl production, uses high-energy diets to induce hepatic lipid deposition and fatty liver formation [2], with force-feeding mule duck livers reaching approximately 580 g [24]. According to the production standards for foie gras, force-feeding is typically initiated once ducks reach 3.5 kg body weight and the force-feeding duration for ducks is 18 days [25,26,27,28]. In this study, significant differences in the average liver weight of each group emerged starting from the 12th day of force-feeding, with the maximum significant difference observed on the 18th day. This result demonstrates that force-feeding induced significant hepatomegaly, which is consistent with previous studies [29], indicating the successful establishment of a force-feeding model in this study.
Consumers and researchers of foie gras evaluate not only its taste and nutritional value, but also express concern regarding potential mammalian-like fatty liver pathologies. Such conditions are commonly accompanied by enhanced inflammatory responses, including elevated pro-inflammatory cytokine levels in 30-day-old Sichuan White geese [30]. Increased oxidative stress has also been reported in affected livers in 70-day-old Landes geese [31]. Meanwhile, hepatic injury is often indicated by elevated ALT, AST, and ALP activities [7,32,33]. In this study, there were no significant differences in the levels of oxidative stress indicators, inflammatory factors and liver injury-related enzymes in the force-feeding group. The aforementioned results have also been demonstrated in previous studies on force-feeding in mule ducks [6,24]. The results of this study indicate that force-feeding-induced hepatomegaly is not accompanied by detectable biochemical indicators and molecular characteristics of liver damage. However, since histopathological examinations were not performed, subtle structural abnormalities or early pathological lesions at the liver tissue level cannot be completely ruled out. Subsequent studies need to integrate histological detection methods such as hematoxylin–eosin staining, liver fibrosis assessment, and cell morphology observation to provide more comprehensive experimental evidence for the hepatic response during force-feeding.
From an animal welfare perspective, force-feeding remains a controversial practice due to concerns regarding animal discomfort and ethical acceptability [34]. Although all experimental procedures were conducted under approved ethical guidelines and institutional animal care protocols, force-feeding remains a highly intensive intervention that may impose physiological and behavioral stress on animals. The present study primarily focused on hepatic responses and did not comprehensively evaluate other welfare-related indicators, such as behavioral changes, stress responses, or overall animal well-being. Therefore, future studies incorporating multidimensional welfare assessments will be necessary to provide a more complete understanding of the biological and ethical consequences of force-feeding.
Recent studies using transcriptomic and metabolomic approaches have further revealed that force-feeding induces extensive metabolic remodeling in waterfowl liver, particularly involving enhanced lipid uptake, de novo lipogenesis, fatty acid elongation, and triglyceride synthesis pathways [35,36]. Taking Landes geese as the research object, the combined transcriptomic and lipidomic analysis revealed that force-feeding induced significant alterations in a large number of lipid metabolism-related genes and lipid molecules. Pathways including fatty acid metabolism and glycolipid metabolism were continuously activated, thereby promoting rapid lipid accumulation in the liver [8]. Similarly, in Tianfu meat geese, different force-feeding intensities can induce differential changes in the hepatic transcriptomic expression profile and metabolite composition, among which the processes related to fatty acid metabolism, energy metabolism, and triglyceride deposition are closely associated with foie gras formation [28]. In mule ducks, combined transcriptomic and metabolomic studies further confirm that a large number of differentially expressed genes and metabolites participate in the regulation of lipid metabolism during force-feeding, promoting hepatic lipid synthesis and storage [27]. In addition, studies on lion-head geese have also found that high feeding status can significantly alter the expression patterns of genes related to hepatic lipid metabolism, further enhancing its lipid storage capacity [37]. Metabolomic studies also reveal that the formation of fatty liver in Landes geese and mule ducks is accompanied by dynamic changes in fatty acids, triglyceride precursors, and energy metabolites. This indicates that force-feeding-induced fatty liver formation is not merely a result of increased fat intake, but a systematic metabolic adaptation process coordinately regulated by multiple links, including lipid uptake, fatty acid synthesis, and lipid assembly and storage [10,11,38]. The content and composition of lipids in the liver are a valuable measure of the degree of liver injury and the underlying regulatory mechanisms [39]. During the development of fatty liver in human and geese, a massive accumulation of TG occurs, accompanied by a corresponding elevation in lipid intermediates commonly associated with lip toxicity—such as inflammatory ceramides (Cer), monohexosylceramides (Hex1Cer), and DG [40,41,42]. Studies in Pemt/ mice have demonstrated that a reduced PC/PE ratio compromises membrane integrity, leading to hepatocyte ballooning and the progression to non-alcoholic steatohepatitis [43]. Elevated DG levels resulting from excessive free fatty acid oxidation disrupt the PI3K/Akt pathway, exacerbating hepatic IR in human and mouse [44,45]. Additionally, lysophosphatidylcholine (LPC) is considered a potential biomarker for assessing liver disease risk, with decreased LPC levels suggesting inflammation and oxidative stress in human [46,47,48]. In the present study, force-feeding markedly remodeled hepatic lipid composition in mule ducks, with TG identified as the most significantly affected lipid class. The pronounced accumulation of TG suggests an enhanced capacity for hepatic fatty acid esterification and neutral lipid storage, representing a central metabolic characteristic of foie gras formation [27,49]. However, force-feeding increased hepatic LPC levels and decreased DG levels, but did not alter the PC/PE ratio. KEGG enrichment analysis further showed that the differential lipids were mainly involved in lipid metabolism and insulin-related pathways, which are consistent with earlier reports in Tianfu meat geese, Poland geese and Landes geese [7,18]. These changes suggest that the absence of detectable oxidative stress, inflammation, and hepatic injury markers in mule duck liver may be related to adaptive modifications in fatty acid and lipid composition.
Studies have shown that the high content and favorable ratio of unsaturated fatty acids in Polish geese foie gras help to counteract the adverse effects of saturated fatty acids and alleviate hepatic inflammation [27]. In the present study, force-feeding markedly increased hepatic SFA, MUFA, and PUFA levels in mule ducks. Notably, several beneficial unsaturated fatty acids, including oleic acid, linoleic acid, α-linolenic acid, γ-linolenic acid, EPA, DPA, and palmitoleic acid, were significantly elevated after force-feeding. These fatty acids have been associated with lipid regulation, cardiovascular protection, anti-inflammatory effects, glucose metabolism, and long-chain fatty acid synthesis in previous studies [50,51,52,53,54,55,56]. This study only confirms that the increased content of unsaturated fatty acids is correlated with liver metabolic changes induced by force-feeding. Further experimental verification is still required to determine whether these fatty acids exert a direct protective effect on liver function. Therefore, follow-up studies need to conduct in vitro experiments for verification and expand the sample size to clarify the causal effect of specific fatty acids in regulating adaptive hepatic changes during force-feeding.

5. Conclusions

A comprehensive evaluation of oxidative stress, inflammatory and injury markers, along with the lipidomic profile in mule duck foie gras following 18 days of force-feeding, shows that force-feeding-induced hepatic lipid deposition modifies the fatty acid composition, without significantly affecting liver injury markers during short-term force-feeding.

Supplementary Materials

The following supporting information can be downloaded at: https://www.mdpi.com/article/10.3390/agriculture16151645/s1, Table S1: Feeding increment; Table S2: Composition of the basal diets for Mule ducks; Table S3: Nutrient levels of the basal diets for Mule ducks; Table S4: Detailed information about the ELISA kit; Table S5: The content of various fatty acids in the livers of mule ducks.

Author Contributions

Writing—review and editing, Writing—original draft, Formal analysis, Investigation, Data curation, H.J.; Writing—review and editing, Writing—original draft, Formal analysis, Investigation, Data curation, Z.D.; Data curation, Formal analysis, Investigation, Y.C.; Data curation, Formal analysis, Investigation, Z.Z.; Writing—review and editing, Formal analysis, Investigation, X.Y.; Methodology, Supervision, Funding acquisition, A.L.; Writing—review and editing, Supervision, Funding acquisition, Methodology, Formal analysis, Conceptualization, C.H. All authors have read and agreed to the published version of the manuscript.

Funding

This study was financially supported by the innovation Fund of Fujian Agriculture and Forestry University (KFB24012A); the Earmarked Fund for Modern Agro-Industry Technology Research System of China (cars-43).

Institutional Review Board Statement

All experimental and management procedures involving ducks were conducted in strict accordance with the animal welfare and ethical guidelines established by the Animal Care and Use Ethics Committee of Fujian Agriculture and Forestry University, China (protocol code PZCASFAFU24003; approval date: 2 August 2022).

Data Availability Statement

The lipidomic datasets generated in this study have been deposited in the OMIX Platform of the National Center for Bioinformation under accession number OMIX018754.

Conflicts of Interest

The authors declare that they have no known competing financial interests or personal relationships that could have appeared to influence the work reported in this paper.

Abbreviations

The following abbreviations are used in this manuscript:
CONControl feeding
O-FForce-feeding
LC–MSLiquid Chromatography–Mass Spectrometry
UHPLC-QHigh-Performance Liquid Chromatography-Quadrupole
KEGGKyoto Encyclopedia of Genes and Genomes
SODSuperoxide dismutase
MDAMalondialdehyde
GSH-PxGlutathione peroxidase
CATCatalase
ASTAspartate aminotransferase
ALTAlanine aminotransferase
IL-1Interleukin-1
TNF-αTumor necrosis factor-alpha
IL-17 Interleukin-17
IL-22Interleukin-22
IL-4Interleukin-4
IL-6Interleukin-6
TGF-β1Transforming growth factor-beta 1
UFAsUnsaturated fatty acids
PUFAPolyunsaturated fatty acid
MUFAMonounsaturated
SFASaturated
PCPhosphatidylcholine
PEPhosphatidylethanolamine
GPGlycerophospholipids
GLGlycerolipids
SPSphingolipids
FAFatty acyls
STSterols
TGTriglyceride
LPCLysophosphatidylcholine
DGDiacylglycerol
CerCeramides
Hex1CerMonohexosylceramides

References

  1. Wei, R.; Han, C.; Deng, D.; Ye, F.; Gan, X.; Liu, H.; Li, L.; Xu, H.; Wei, S. Research Progress into the Physiological Changes in Metabolic Pathways in Waterfowl with Hepatic Steatosis. Br. Poult. Sci. 2021, 62, 118–124. [Google Scholar] [CrossRef]
  2. Skippon, W. The Animal Health and Welfare Consequences of Foie Gras Production. Can. Vet. J. 2013, 54, 403–404. [Google Scholar] [PubMed]
  3. Chartrin, P.; Bernadet, M.-D.; Guy, G.; Mourot, J.; Hocquette, J.-F.; Rideau, N.; Duclos, M.J.; Baéza, E. Does Overfeeding Enhance Genotype Effects on Liver Ability for Lipogenesis and Lipid Secretion in Ducks? Comp. Biochem. Physiol. A Mol. Integr. Physiol. 2006, 145, 390–396. [Google Scholar] [CrossRef] [PubMed]
  4. Marie-Etancelin, C.; Chapuis, H.; Brun, J.-M.; Larzul, C.; Mialon-Richard, M.-M.; Rouvier, R. Genetics and selection of ducks in France. In Proceedings of the International Seminar on Improved Duck Production of Small-Scale Farmers in the ASPAC Region, Hanoi, Vietnam, 17–21 September 2007. [Google Scholar]
  5. Davail, S.; Rideau, N.; Guy, G.; André, J.-M.; Hermier, D.; Hoo-Paris, R. Hormonal and Metabolic Responses to Overfeeding in Three Genotypes of Ducks. Comp. Biochem. Physiol. A Mol. Integr. Physiol. 2003, 134, 707–715. [Google Scholar] [CrossRef] [PubMed]
  6. Remignon, H.; Burgues, P. Evolution of Oxidative Stress Markers in Livers of Ducks during Force-Feeding. Sci. Rep. 2023, 13, 1046. [Google Scholar] [CrossRef] [PubMed]
  7. Davail, S.; Guy, G.; André, J.; Hermier, D.; Hoo-Paris, R. Metabolism in Two Breeds of Geese with Moderate or Large Overfeeding Induced Liver-Steatosis. Comp. Biochem. Physiol. A Mol. Integr. Physiol. 2000, 126, 91–99. [Google Scholar] [CrossRef] [PubMed]
  8. Wei, R.; Teng, Y.; Han, C.; Wei, S.; Li, L.; Liu, H.; Hu, S.; Kang, B.; Xu, H. Multi-Omics Reveals Goose Fatty Liver Formation from Metabolic Reprogramming. Front. Vet. Sci. 2024, 11, 1122904. [Google Scholar] [CrossRef] [PubMed]
  9. Atallah, E.; Trehiou, S.; Alquier-Bacquie, V.; Lasserre, F.; Arroyo, J.; Molette, C.; Remignon, H. Development of Hepatic Steatosis in Male and Female Mule Ducks after Respective Force-Feeding Programs. Front. Physiol. 2024, 15, 1392968. [Google Scholar] [CrossRef] [PubMed]
  10. Mozduri, Z.; Lo, B.; Marty-Gasset, N.; Masoudi, A.A.; Arroyo, J.; Morisson, M.; Canlet, C.; Bonnet, A.; Bonnefont, C.M.D. Application of Metabolomics to Identify Hepatic Biomarkers of Foie Gras Qualities in Duck. Front. Physiol. 2021, 12, 694809. [Google Scholar] [CrossRef] [PubMed]
  11. Lo, B.; Marty-Gasset, N.; Manse, H.; Canlet, C.; Domitile, R.; Remignon, H. Slightly Different Metabolomic Profiles Are Associated with High or Low Weight Duck Foie Gras. PLoS ONE 2022, 17, e0255707. [Google Scholar] [CrossRef] [PubMed]
  12. Bernardi, O.; Reverchon, M.; Ramé, C.; Glaveli, E.Z.; Rémignon, H.; Froment, P.; Dupont, J. Dynamics and Reversibility of Hepatic Steatosis in Male Mule Duck. Front. Physiol. 2026, 17, 1804237. [Google Scholar] [CrossRef] [PubMed]
  13. Hu, Y.-X.; Zhang, D.-D.; Chen, C.; Li, A.; Bai, D.-P. Mechanism of Fibroblast Growth Factor 1 Regulating Fatty Liver Disorder in Mule Ducks. Poult. Sci. 2024, 103, 103818. [Google Scholar] [CrossRef] [PubMed]
  14. Mourot, J.; Guy, G.; Lagarrigue, S.; Peiniau, P.; Hermier, D. Role of Hepatic Lipogenesis in the Susceptibility to Fatty Liver in the Goose (Anser anser). Comp. Biochem. Physiol. B Biochem. Mol. Biol. 2000, 126, 81–87. [Google Scholar] [CrossRef] [PubMed]
  15. Yu, Y.; Lyu, W.; Fu, Z.; Fan, Q.; Xiao, Y.; Ren, Y.; Yang, H. Metabolic Profiling Analysis of Liver in Landes Geese During the Formation of Fatty Liver via GC-TOF/MS. Front. Physiol. 2021, 12, 783498. [Google Scholar] [CrossRef] [PubMed]
  16. Chen, G.H.; Zhang, K.Y.; Tian, G.; Bai, S.P.; Ding, X.M.; Wang, J.P.; Lv, L.; Xuan, Y.; Zeng, Q.F. Effects of a High-Fat Diet on the Growth Performance, Lipid Metabolism, and the Fatty Acids Composition of Liver and Skin Fat in Pekin Ducks Aged from 10 to 40 Days. Poult. Sci. 2022, 102, 102429. [Google Scholar] [CrossRef] [PubMed]
  17. Liu, L.; Zhao, X.; Wang, Q.; Sun, X.; Xia, L.; Wang, Q.; Yang, B.; Zhang, Y.; Montgomery, S.; Meng, H.; et al. Prosteatotic and Protective Components in a Unique Model of Fatty Liver: Gut Microbiota and Suppressed Complement System. Sci. Rep. 2016, 6, 31763. [Google Scholar] [CrossRef] [PubMed]
  18. Wei, R.; Ning, R.; Han, C.; Wei, S.; Teng, Y.; Li, L.; Liu, H.; Hu, S.; Kang, B.; Xu, H. Lipidomics Analysis Reveals New Insights into the Goose Fatty Liver Formation. Poult. Sci. 2023, 102, 102428. [Google Scholar] [CrossRef] [PubMed]
  19. Dale, N. National Research Council Nutrient Requirements of Poultry—Ninth Revised Edition (1994). J. Appl. Poult. Res. 1994, 3, 101. [Google Scholar] [CrossRef]
  20. Du, Z.; Zhu, Z.; Chen, Y.; Yu, X.; Jia, H.; Li, A.; Chen, X.; Huang, C. Time-Dependent Stress Response to Force-Feeding Is Associated with Dynamic Gut Microbiota Changes in Mule Ducks. Agriculture 2025, 15, 2415. [Google Scholar] [CrossRef]
  21. Ren, Y.; Yu, G.; Shi, C.; Liu, L.; Guo, Q.; Han, C.; Zhang, D.; Zhang, L.; Liu, B.; Gao, H.; et al. Majorbio Cloud: A One-Stop, Comprehensive Bioinformatic Platform for Multiomics Analyses. Imeta 2022, 1, e12. [Google Scholar] [CrossRef] [PubMed]
  22. Hoving, L.R.; Heijink, M.; van Harmelen, V.; van Dijk, K.W.; Giera, M. GC-MS Analysis of Medium- and Long-Chain Fatty Acids in Blood Samples. Methods Mol. Biol. 2018, 1730, 257–265. [Google Scholar] [CrossRef] [PubMed]
  23. Beccaria, M.; Franchina, F.A.; Nasir, M.; Mellors, T.; Hill, J.E.; Purcaro, G. Investigation of Mycobacteria Fatty Acid Profile Using Different Ionization Energies in GC-MS. Anal. Bioanal. Chem. 2018, 410, 7987–7996. [Google Scholar] [CrossRef] [PubMed]
  24. Lo, B.; Marty-Gasset, N.; Manse, H.; Bannelier, C.; Bravo, C.; Domitile, R.; Rémignon, H. Cellular Markers of Mule Duck Livers after Force-Feeding. Poult. Sci. 2020, 99, 3567–3573. [Google Scholar] [CrossRef] [PubMed]
  25. Arroyo, J.; Molette, C.; Lavigne, F.; Margetyal, C.; Amador, O.; Dubois, J.-P.; Fortun-Lamothe, L. Effects of Dietary Protein Level during Rearing Period and Age at Overfeeding on Magret and Foie Gras Quality in Male Mule Ducks. Anim. Sci. J. 2018, 89, 570–578. [Google Scholar] [CrossRef] [PubMed]
  26. Bonnefont, C.M.D.; Molette, C.; Lavigne, F.; Manse, H.; Bravo, C.; Lo, B.; Rémignon, H.; Arroyo, J.; Bouillier-Oudot, M. Evolution of Liver Fattening and Foie Gras Technological Yield during the Overfeeding Period in Mule Duck. Poult. Sci. 2019, 98, 5724–5733. [Google Scholar] [CrossRef] [PubMed]
  27. Luo, R.; Chen, C.; Shi, Y.; Tao, Q.; Bai, D.; Li, A. Effects of Overfeeding on Liver Lipid Metabolism in Mule Ducks Based on Transcriptomics and Metabolomics. Br. Poult. Sci. 2023, 64, 143–156. [Google Scholar] [CrossRef] [PubMed]
  28. Teng, Y.; Wei, R.; Peng, S.; Li, J.; Ning, R.; Luo, Z.; Wei, S.; Bai, L.; Zhou, L.; Han, C. The Integrative Analysis of Transcriptome and Metabolome Reveals Differences in Raw Foie Gras Performance Induced by Different Force-Feeding Intensities in Male Tianfu Meat Geese. Front. Vet. Sci. 2025, 12, 1653733. [Google Scholar] [CrossRef] [PubMed]
  29. Hérault, F.; Houée-Bigot, M.; Baéza, E.; Bouchez, O.; Esquerré, D.; Klopp, C.; Diot, C. RNA-Seq Analysis of Hepatic Gene Expression of Common Pekin, Muscovy, Mule and Hinny Ducks Fed Ad Libitum or Overfed. BMC Genom. 2019, 20, 13. [Google Scholar] [CrossRef] [PubMed]
  30. Han, C.; Wei, S.; He, F.; Liu, D.; Wan, H.; Liu, H.; Li, L.; Xu, H.; Du, X.; Xu, F. The Regulation of Lipid Deposition by Insulin in Goose Liver Cells Is Mediated by the PI3K-AKT-mTOR Signaling Pathway. PLoS ONE 2015, 10, e0098759. [Google Scholar] [CrossRef] [PubMed]
  31. Xia, L.; Wang, Q.; Yang, B.; Sun, X.; Zhang, Y.; Liu, L.; Geng, T.; Gong, D. Study on changes of blood chemistry indexes, hepatic routine nutritional composition and expression of lipid metabolism-associated genes during the recovery of geese with fatty livers. China Anim. Husb. Vet. Med. 2016, 43, 967–972. [Google Scholar]
  32. Chalasani, N.; Younossi, Z.; Lavine, J.E.; Charlton, M.; Cusi, K.; Rinella, M.; Harrison, S.A.; Brunt, E.M.; Sanyal, A.J. The Diagnosis and Management of Nonalcoholic Fatty Liver Disease: Practice Guidance from the American Association for the Study of Liver Diseases. Hepatology 2018, 67, 328–357. [Google Scholar] [CrossRef] [PubMed]
  33. Hermier, D.; Salichon, M.R.; Guy, G.; Peresson, R. Differential Channelling of Liver Lipids in Relation to Susceptibility to Hepatic Steatosis in the Goose. Poult. Sci. 1999, 78, 1398–1406. [Google Scholar] [CrossRef] [PubMed]
  34. Rochlitz, I.; Broom, D. The Welfare of Ducks during Foie Gras Production. Anim. welf. 2017, 26, 135–149. [Google Scholar] [CrossRef]
  35. Zhang, Q.; Bai, C.; Zhang, M.; Yue, B.; Zhang, J.; Kong, M.; Wang, B.; Wang, B.; Fan, W. Lipidomic and Transcriptomic Reveals Variations in Lipid Deposition During Goose Fatty Liver Formation. Biology 2025, 14, 1617. [Google Scholar] [CrossRef] [PubMed]
  36. Qi, J.; Li, J.; Xi, Y.; Yang, Z.; Guo, S.; Han, X.; Wang, R.; Li, L.; Bai, L.; Han, C.; et al. Multi-Omics Analysis Provides New Insights into Molecular Mechanisms for Waterfowl Fatty Liver Formation. Poult. Sci. 2025, 104, 105398. [Google Scholar] [CrossRef] [PubMed]
  37. Kong, J.; Yao, Z.; Chen, J.; Zhao, Q.; Li, T.; Dong, M.; Bai, Y.; Liu, Y.; Lin, Z.; Xie, Q.; et al. Comparative Transcriptome Analysis Unveils Regulatory Factors Influencing Fatty Liver Development in Lion-Head Geese under High-Intake Feeding Compared to Normal Feeding. Vet. Sci. 2024, 11, 366. [Google Scholar] [CrossRef] [PubMed]
  38. Zhao, M.; Xing, Y.; Liu, L.; Fan, X.; Liu, L.; Geng, T.; Gong, D. GC-TOF-MS-Based Metabolomics Analyses of Liver and Intestinal Contents in the Overfed vs. Normally-Fed Geese. Animals 2020, 10, 2375. [Google Scholar] [CrossRef] [PubMed]
  39. Puri, P.; Baillie, R.A.; Wiest, M.M.; Mirshahi, F.; Choudhury, J.; Cheung, O.; Sargeant, C.; Contos, M.J.; Sanyal, A.J. A Lipidomic Analysis of Nonalcoholic Fatty Liver Disease. Hepatology 2007, 46, 1081–1090. [Google Scholar] [CrossRef] [PubMed]
  40. Khan, R.S.; Bril, F.; Cusi, K.; Newsome, P.N. Modulation of Insulin Resistance in Nonalcoholic Fatty Liver Disease. Hepatology 2019, 70, 711–724. [Google Scholar] [CrossRef] [PubMed]
  41. Wang, X.-F.; Wu, W.-Y.; Qiu, G.-K.; Wang, H.; Li, W.-S.; Wang, Y.-L.; Jiang, Q.-Q.; Han, M.-F.; Ning, Q. Plasma Lipidomics Identifies Novel Biomarkers in Patients with Hepatitis B Virus-Related Acute-on-Chronic Liver Failure. Metabolomics 2017, 13, 76. [Google Scholar] [CrossRef]
  42. Wei, R.; Deng, D.; Teng, Y.; Lu, C.; Luo, Z.; Abdulai, M.; Liu, H.; Xu, H.; Li, L.; Hu, S.; et al. Study on the Effect of Different Types of Sugar on Lipid Deposition in Goose Fatty Liver. Poult. Sci. 2022, 101, 101729. [Google Scholar] [CrossRef] [PubMed]
  43. Li, Z.; Agellon, L.B.; Allen, T.M.; Umeda, M.; Jewell, L.; Mason, A.; Vance, D.E. The Ratio of Phosphatidylcholine to Phosphatidylethanolamine Influences Membrane Integrity and Steatohepatitis. Cell Metab. 2006, 3, 321–331. [Google Scholar] [CrossRef] [PubMed]
  44. Delarue, J.; Magnan, C. Free Fatty Acids and Insulin Resistance. Curr. Opin. Clin. Nutr. Metab. Care 2007, 10, 142–148. [Google Scholar] [CrossRef] [PubMed]
  45. Gressner, A.M.; Weiskirchen, R. Modern Pathogenetic Concepts of Liver Fibrosis Suggest Stellate Cells and TGF-Beta as Major Players and Therapeutic Targets. J. Cell. Mol. Med. 2006, 10, 76–99. [Google Scholar] [CrossRef] [PubMed]
  46. Gressner, O.A.; Weiskirchen, R.; Gressner, A.M. Evolving Concepts of Liver Fibrogenesis Provide New Diagnostic and Therapeutic Options. Comp. Hepatol. 2007, 6, 7. [Google Scholar] [CrossRef] [PubMed]
  47. Krautbauer, S.; Eisinger, K.; Wiest, R.; Liebisch, G.; Buechler, C. Systemic Saturated Lysophosphatidylcholine Is Associated with Hepatic Function in Patients with Liver Cirrhosis. Prostaglandins Other Lipid Mediat. 2016, 124, 27–33. [Google Scholar] [CrossRef] [PubMed]
  48. Puri, P.; Wiest, M.M.; Cheung, O.; Mirshahi, F.; Sargeant, C.; Min, H.-K.; Contos, M.J.; Sterling, R.K.; Fuchs, M.; Zhou, H.; et al. The Plasma Lipidomic Signature of Nonalcoholic Steatohepatitis. Hepatology 2009, 50, 1827–1838. [Google Scholar] [CrossRef] [PubMed]
  49. Pioche, T.; Skiba, F.; Bernadet, M.-D.; Seiliez, I.; Massimino, W.; Houssier, M.; Tavernier, A.; Ricaud, K.; Davail, S.; Skiba-Cassy, S.; et al. Kinetic Study of the Expression of Genes Related to Hepatic Steatosis, Glucose and Lipid Metabolism, and Cellular Stress during Overfeeding in Mule Ducks. Am. J. Physiol. Regul. Integr. Comp. Physiol. 2020, 318, R453–R467. [Google Scholar] [CrossRef] [PubMed]
  50. Dimopoulos, N.; Watson, M.; Sakamoto, K.; Hundal, H.S. Differential Effects of Palmitate and Palmitoleate on Insulin Action and Glucose Utilization in Rat L6 Skeletal Muscle Cells. Biochem. J. 2006, 399, 473–481. [Google Scholar] [CrossRef] [PubMed]
  51. Pan, A.; Chen, M.; Chowdhury, R.; Wu, J.H.Y.; Sun, Q.; Campos, H.; Mozaffarian, D.; Hu, F.B. A-Linolenic Acid and Risk of Cardiovascular Disease: A Systematic Review and Meta-Analysis. Am. J. Clin. Nutr. 2012, 96, 1262–1273. [Google Scholar] [CrossRef] [PubMed]
  52. Sauerwald, T.U.; Hachey, D.L.; Jensen, C.L.; Chen, H.; Anderson, R.E.; Heird, W.C. Intermediates in Endogenous Synthesis of C22:6 Omega 3 and C20:4 Omega 6 by Term and Preterm Infants. Pediatr. Res. 1997, 41, 183–187. [Google Scholar] [CrossRef] [PubMed]
  53. Sigaux, J.; Mathieu, S.; Nguyen, Y.; Sanchez, P.; Letarouilly, J.-G.; Soubrier, M.; Czernichow, S.; Flipo, R.-M.; Sellam, J.; Daïen, C. Impact of Type and Dose of Oral Polyunsaturated Fatty Acid Supplementation on Disease Activity in Inflammatory Rheumatic Diseases: A Systematic Literature Review and Meta-Analysis. Arthritis Res. Ther. 2022, 24, 100. [Google Scholar] [CrossRef] [PubMed]
  54. Simon, D.; Eng, P.A.; Borelli, S.; Kägi, R.; Zimmermann, C.; Zahner, C.; Drewe, J.; Hess, L.; Ferrari, G.; Lautenschlager, S.; et al. Gamma-Linolenic Acid Levels Correlate with Clinical Efficacy of Evening Primrose Oil in Patients with Atopic Dermatitis. Adv. Ther. 2014, 31, 180–188. [Google Scholar] [CrossRef] [PubMed]
  55. Taha, A.Y. Linoleic Acid-Good or Bad for the Brain? npj Sci. Food 2020, 4, 1. [Google Scholar] [CrossRef] [PubMed]
  56. Zurier, R.B.; Rossetti, R.G.; Jacobson, E.W.; DeMarco, D.M.; Liu, N.Y.; Temming, J.E.; White, B.M.; Laposata, M. Gamma-Linolenic Acid Treatment of Rheumatoid Arthritis. A Randomized, Placebo-Controlled Trial. Arthritis Rheum. 1996, 39, 1808–1817. [Google Scholar] [CrossRef] [PubMed]
Figure 1. Effects of different rearing methods and durations on the liver weight of mule ducks. Two-way analysis of variance was used to evaluate the effects of force-feeding, sampling time and their interaction effects. When a significant interaction effect was detected, Tukey’s multiple comparison test was further applied for pairwise comparison analysis between groups, and the results are expressed as mean ± standard error (n = 6 per group). CON, controlled force-feeding group adjusted based on ad libitum feeding; O-F, conventional force-feeding group. The notations 6 d, 12 d, and 18 d indicate the number of feeding days. Feeding model, feeding regimen of mule ducks; treatment duration, feeding time of mule ducks; feeding model × treatment duration, interaction between feeding regimen and feeding time. The p value indicates the significance of the feeding model on mule ducks, ** 0.001 < p ≤ 0.01.
Agriculture 16 01645 g001
Figure 2. Effects of different feeding regimens and feeding durations on hepatic oxidative-related factors in mule ducks. Two-way analysis of variance was used to evaluate the effects of force-feeding, sampling time and their interaction effects. When a significant interaction effect was detected, Tukey’s multiple comparison test was further applied for pairwise comparison analysis between groups, and the results are expressed as mean ± standard error (n = 6 per group). CON, controlled force-feeding group adjusted based on ad libitum feeding; O-F, conventional force-feeding group. The notations 6 d, 12 d, and 18 d indicate the number of feeding days. Feeding model, feeding regimen of mule ducks; treatment duration, feeding time of mule ducks; feeding model × treatment duration, interaction between feeding regimen and feeding time. The p value indicates the significance of the feeding model on mule ducks.
Agriculture 16 01645 g002
Figure 3. Effects of different feeding regimens and feeding durations on hepatic inflammation-related factors in mule ducks. Two-way analysis of variance was used to evaluate the effects of force-feeding, sampling time and their interaction effects. When a significant interaction effect was detected, Tukey’s multiple comparison test was further applied for pairwise comparison analysis between groups, and the results are expressed as mean ± standard error (n = 6 per group). CON, controlled force-feeding group adjusted based on ad libitum feeding; O-F, conventional force-feeding group. The notations 6 d, 12 d, and 18 d indicate the number of feeding days. Feeding model, feeding regimen of mule ducks; treatment duration, feeding time of mule ducks; feeding model × treatment duration, interaction between feeding regimen and feeding time. The p value indicates the significance of the feeding model on mule ducks.
Agriculture 16 01645 g003
Figure 4. The composition of different lipid metabolites in the liver of mule ducks on day 18. Blue dots represent the controlled force-feeding group; red dots represent the conventional force-feeding group. Legend: 18 CON, controlled force-feeding group adjusted based on ad libitum feeding on day 18; 18 O-F, conventional force-feeding group on day 18. (A) Principal component analysis (PCA) score of identified metabolites between different feeding model group. (B) Identification of metabolites between different feeding model groups using Partial Least Squares—Discriminant Analysis (PLS-DA) scores. (C) OPLS-DA scores for identifying metabolites between different feeding model groups. (D) OPLS-DA for corresponding validation plots. Red circular dots denote cumulative R2Y, while blue triangular markers represent cumulative Q2.
Agriculture 16 01645 g004
Figure 5. Comprehensive analysis of the differential metabolites screened in the lipid metabolism profiles of mule ducks on day 18. Legend: 18 CON, controlled force-feeding group adjusted based on ad libitum feeding on day 18; 18 O-F, conventional force-feeding group on day 18. Percentage (A) and content distribution (B) of all identified lipid species in the conventional force-feeding group (O-F) and control group (CON). An asterisk (*) indicates that the same lipid molecules show significant differences among different groups. * 0.01 < p ≤ 0.05, ** 0.001 < p ≤ 0.01, *** p ≤ 0.001.
Agriculture 16 01645 g005
Figure 6. Comprehensive analysis of the differential metabolites screened in the lipid metabolism profiles of mule ducks on day 18. Legend: 18 CON, controlled force-feeding group adjusted based on ad libitum feeding on day 18; 18 O-F, conventional force-feeding group on day 18. (A) Volcano map of differential lipids. Under the triple screening conditions of VIP + FC + p value, the abscissa represents the fold change (log2 fold change), the vertical axis indicates the significance level of the difference (log10 p value), and the size of the dot represents the VIP value. Red dots indicate significantly upregulated metabolites, gray dots represent non-significant metabolites, and blue dots denote significantly downregulated metabolites. (B) Correlation heatmap between the force-feeding group and the control group. Columns represent different samples; rows represent different lipid molecules, where red indicates positive correlation and blue indicate negative correlation. The color gradient from blue to red represents increasing correlation strength between lipid molecules. An asterisk (*) indicates that the same lipid molecules show significant differences among different groups. * 0.01 < p ≤ 0.05, ** 0.001 < p ≤ 0.01, *** p ≤ 0.001.
Agriculture 16 01645 g006
Figure 7. KEGG analysis of the livers from the mule ducks on day 18. Legend: 18 CON, controlled force-feeding group adjusted based on ad libitum feeding on day 18; 18 O-F, conventional force-feeding group on day 18. The y-axis represents pathway names and the x-axis indicates the p value of the enrichment analysis. Bubble size corresponds to the number of differential metabolites mapped to each pathway, and bubble color from red to blue represents increasing p values (from higher to lower statistical significance). The figure shows the top ten pathways ranked by statistical significance.
Agriculture 16 01645 g007
Figure 8. Comprehensive analysis of the differential metabolites screened in the lipid metabolism profiles of mule ducks on day 18. Legend: 18 CON, controlled force-feeding group adjusted based on ad libitum feeding on day 18; 18 O-F, conventional force-feeding group on day 18. Percentage content distribution (A), the relative contents of each component of SFA (B), the relative contents of each component of MUFA (C) and the relative contents of each component of PUFA (D) for all identified lipid species in the conventional force-feeding group (O-F) and control group (CON). An asterisk (*) indicates that the same lipid molecules show significant differences among different groups. * 0.01 < p ≤ 0.05, ** 0.001 < p ≤ 0.01, *** p ≤ 0.001.
Agriculture 16 01645 g008
Figure 9. Absolute quantification of fatty acids in liver of mule ducks on day 18. CON, controlled force-feeding group adjusted based on ad libitum feeding; O-F, conventional force-feeding group. C16:1, palmitoleic acid; C18:1N9C, oleic acid; C18:2N6, linoleic acid; C18:3N3, α-linolenic acid; C18:3N6, γ-linolenic acid; C20:1, gondoic acid; C20:5N3, EPA; C22:1N9, erucic acid; C20:3N3, eicosatrienoic acid (n − 3); C22:5N3, DPA. To compare the mean differences between the two independent groups on day 18, independent sample t-test was adopted for the data analysis of fatty acid content, with Welch’s correction adopted when variances were unequal, and the results are expressed as mean ± standard error. (n = 6 per group). An asterisk (*) indicates that the same lipid molecules show significant differences among different groups. * 0.01 < p ≤ 0.05, ** 0.001 < p ≤ 0.01, *** p ≤ 0.001.
Agriculture 16 01645 g009
Disclaimer/Publisher’s Note: The statements, opinions and data contained in all publications are solely those of the individual author(s) and contributor(s) and not of MDPI and/or the editor(s). MDPI and/or the editor(s) disclaim responsibility for any injury to people or property resulting from any ideas, methods, instructions or products referred to in the content.