


Abstract
Coastal saline–alkali soils are valuable yet constrained by salinity and nutrient deficiency. Organic amendments are widely used, but their combined effects and trade-offs on soil properties, microbes, and rice production remain unclear. This study applied biochar, peat, and straw, alone and in all combinations, to coastal saline–alkali soil. Straw alone significantly increased rice yield, most combined treatments containing biochar or peat increased yields, but the effect was not significant. Combined treatments elevated rice N and P contents, as well as soil available K, Na, EC, SOM, and SOC within 0.053–0.25 mm aggregates, but promoted rice Na+ accumulation while suppressing K+ uptake. Soil urease and alkaline phosphatase activities were significantly enhanced by SP2 and SB3P1. Combined treatments also improved microbial richness, increasing the relative abundances of dominant chemoheterotrophy and aerobic chemoheterotrophy. Mantel analysis indicated that soil K, P, SOM, EC, urease, and catalase activity were positively correlated with rice yield, and rice P content in roots and stems also mattered. Overall, organic amendments improve soil fertility and microbial diversity but may introduce salt-related trade-offs, highlighting the need for balanced combination strategies in saline–alkali soil management.
1. Introduction
Soil salinization poses a major challenge to global ecological sustainability. According to statistics from the Food and Agriculture Organization (FAO), the total area of saline–alkali land of varying degrees worldwide is approximately 9.5 × 10⁸ hectares [1]. In China, saline–alkali land covers about 99 million hectares, accounting for roughly one-tenth of the country’s total land area [2]. The efficient development and utilization of coastal saline–alkali land have thus become key measures to alleviate the pressure on limited arable land resources. Coastal saline–alkali land is a type of marine saline soil, primarily attributed to seawater intrusion and irrigation with saline water [3]. Saline–alkali soils are typically compacted, poorly aerated, nutrient-deficient, and biologically less active, which severely constrains grain production safety and land use efficiency [4]. Furthermore, excessive soil salinity induces ion antagonism or osmotic phenomena, impairing the normal nutrient uptake by plants and disrupting their metabolic and growth processes [5]. Therefore, there is an urgent need to comprehensively explore the coastal saline–alkali farmland resources in China and apply integrated improvement technologies for their efficient utilization, while simultaneously boosting grain yields. This approach offers a critical pathway to address the bottleneck that hinders the sustainable development of coastal saline–alkali regions. After years of exploration and practice, China has accumulated extensive experience in the improvement of saline–alkali land. Traditional physical methods, such as digging drainage ditches and replacing with extra soil, can alleviate salt stress in the short term; however, these techniques are often accompanied by drawbacks including low ecological compatibility and high costs [6]. Although biological approaches, such as microbial inoculation or the use of salt-tolerant plants, have shown promise in ameliorating saline–alkali soils, their efficacy is frequently constrained by site-specific conditions, slow establishment, and limited consistency across studies [7,8]. Furthermore, modern techniques including genetic modification and electro-remediation remain limited by high costs and low efficiency [9]. Currently, chemical amendments including desulfurized gypsum, aluminum sulfate, and furfural residue, are economical, fast-acting, and easy to apply; nevertheless, improper application may lead to secondary soil pollution [9,10]. Therefore, there is an urgent need for an efficient, low-cost, and environmentally sound improvement technology that can reduce soil salinity, enhance plant productivity and contribute to the ecological restoration of saline–alkali areas.
Biochar is an excellent soil remediation material, featuring a large specific surface area, well-developed pore structure, abundant organic functional groups and nutrients [11]. Biochar can improve soil physicochemical properties (e.g., porosity, water holding capacity, cation exchange capacity), reduce Na+ availability via adsorption or exchange, and provide slow-release nutrients, all of which are directly relevant to alleviating salt stress and improving plant K+/Na+ balance [11,12]. Moreover, the application of biochar can also improve the efficiency of nutrient recycling and utilization, enhance the plant’s ability to resist salt stress [13]. Peat was selected as a contrasting organic amendment with high labile organic matter content, strong water retention capacity, and rapid decomposition rates, which may exert different effects on soil EC, nutrient release dynamics, and ionic balance compared to the more recalcitrant biochar [14,15]. Currently, as one of the main measures for improving saline–alkali soils, the return of straw to the field can not only improve the physical properties of the soil, including increasing soil porosity, water retention rate and aeration, but also reduce the accumulation of surface salt [16]. After decomposition, straw effectively increased soil organic carbon, improved soil aggregate structure, and released nutrients [17]. Although biochar, peat, and straw have individually been demonstrated to improve saline–alkali soils, many previous studies have concentrated on the effects of single amendments. Systematic evaluations comparing various combinations and ratios of these three organic materials under uniform experimental conditions are still lacking.
Biochar provides recalcitrant carbon that enhances long-term soil carbon sequestration and cation exchange capacity, whereas peat and straw supply labile organic matter that stimulates microbial activity and rapid nutrient release [15]. Their co-application thus sustains both short-term nutrient supply and long-term soil structural improvement. The large surface area and oxygen-containing functional groups of biochar facilitate adsorption of Na+, while the decomposition of peat and straw releases organic acids and K+, which may competitively displace Na+ from the soil exchange complex [15,16]. Together, these processes may synergistically reduce the Na+/K+ ratio and alleviate osmotic stress. Peat and straw serve as readily available energy sources for soil microorganisms, while biochar provides stable microhabitats that protect microbial communities from environmental stress [15,18]. This combined effect may enhance enzyme activities and accelerate organic matter mineralization, thereby improving overall nutrient availability [15,18]. Despite these plausible synergistic mechanisms, direct evidence for their combined effects under salt stress remains scarce, particularly regarding K+/Na+ balance, enzyme activities, and microbial communities in coastal saline–alkali soils. Moreover, the relative contributions of soil physicochemical and microbial factors to rice yield under different amendment regimes are unclear. These knowledge gaps hinder the development of targeted and efficient organic amendment strategies for saline land reclamation.
Therefore, we designed the present study to evaluate the effects of individual and combined applications of biochar, peat, and straw on soil properties, rice growth, and yield in a coastal saline–alkali soil and to elucidate the underlying mechanisms linking soil environmental factors to crop productivity. Specifically, we addressed the following research objectives: (1) to quantify the effects of different organic amendment formulations on soil nutrient availability (N, P, K), salt ion dynamics (K+/Na+), organic carbon distribution in aggregates, enzyme activities, and microbial community structure; (2) to assess the responses of rice growth parameters and grain yield to these amendments; and (3) to determine the key soil variables that drive rice yield variation under different amendment treatments. The results are expected to offer mechanisms and technique basis for the rational selection and targeted application of organic amendments in saline–alkali land reclamation.
2. Materials and Methods
2.1. Experimental Design
The soil used in the rice pot experiment was collected from the coastal saline–alkali paddy fields in Zhoushan City, Zhejiang Province, China. The basic properties of the experimental soil were as follows: pH 8.35, electrical conductivity (EC) 0.9 mS cm−1, soil organic matter (SOM) 42.52 g kg−1, alkali-hydrolyzable nitrogen 28.49 mg kg−1, available phosphorus 13.40 mg kg−1, and available potassium 141.93 mg kg−1. Ten treatments were established in this experiment, involving the addition of biochar (0, 1%, and 3%, w/w), peat (0, 0.25%, and 0.50%, w/w), and straw (0 and 0.20%, w/w) to the soil, as detailed in Table 1. The application dosages were selected based on effective ranges reported in previous studies on saline–alkali soil amelioration, as well as preliminary pot trials in which these dosages demonstrated optimal performance [19,20]. The biochar used was produced from rice straw via slow pyrolysis at 500 °C and was purchased from Zhejiang Yangtze River Delta Junong Technology Co., Ltd. (Hangzhou, China). Its morphology and structure have been characterized in our previous study [21]. The peat was obtained from the local farmers’ market, and the rice straw was collected from local farmland after harvest, air-dried, and ground to pass through a 2 mm sieve prior to use. The basal properties of the three amendments, including pH, EC, organic carbon, total nitrogen (N), phosphorus (P), and potassium (K), are presented in Table S1. The rest period was two weeks after adding the organic amendments to the soil.
Table 1.
Experimental design and treatment groups.
Each treatment was repeated four times, with a total of 40 buckets. A sample size of n = 4 per treatment was selected to ensure sufficient statistical power (>0.80), as supported by prior studies and practical constraints. Each bucket was filled with 5 kg of soil. Basal fertilization was performed using a 20-15-10 NPK compound fertilizer at a rate of 0.2 g pot−1, following local recommendations for pot experiments to ensure normal seedling growth. The fertilizer purchased from Zhejiang Wanli Shennong Agricultural Technology Co., Ltd. (Jinhua, China). The rice variety used was Oryza sativa L. “Zheyou 18”, a cultivar commonly grown in Zhoushan City, Zhejiang Province. Seeds were provided by local major agricultural producers. Uniform seedlings of approximately 15 cm in height were transplanted into plastic buckets with a diameter of 24.5 cm and a height of 20 cm (approximate volume of 9.4 L), with three seedlings per bucket. The rice plants were cultivated in a greenhouse under natural sunlight, with temperature ranging from 25 °C to 38 °C, relative humidity of 60–80%, and a 12 h light/12 h dark photoperiod. During the growing period, a water layer of approximately 5 cm was maintained on the soil surface, and ultrapure water was used for replenishment. The experiment was conducted from May to December 2025.
2.2. Soil Chemical Properties
Soil samples were collected at both the tillering and maturity stages of rice growth. In the rhizosphere zone of each pot, five subsampling points were sampled and thoroughly mixed to form one composite soil sample. Each treatment included four pot replicates, yielding four soil samples per treatment, for a total of 40 soil samples across the entire experiment. After air-drying, the samples were passed through 20-mesh and 100-mesh sieves. Soil pH was measured potentiometrically in a 1:2.5 (w/v) soil–water suspension. The mixture was shaken for 30 min, left to stand for 30 min, and the pH was recorded using a calibrated FE28 pH meter (Mettler-Toledo, Shanghai, China). Soil EC was measured in the 1:5 (w/v) soil–water supernatant using a FiveEasy Plus FE38 meter (Mettler-Toledo, Shanghai, China), and results were expressed as µS m−1 at 25 °C. Available N was determined by the alkaline diffusion method using boric acid as absorbent, with NaOH digestion at 40 °C for 24 h. Available P was extracted with 0.5 mol L−1 NaHCO3 (pH 8.5, 1:20 w/v, 30 min shaking) and measured by the molybdenum–antimony–ascorbic acid colorimetric method (Olsen method) using a UV–visible spectrophotometer (T600/1650F, Beijing Pusai General Instrument Co., Ltd., Beijing, China) at 700 nm. Available K was extracted with 1.0 mol L−1 neutral ammonium acetate (1:10 w/v, 30 min shaking) and quantified by flame photometry. Soil organic matter (SOM) was determined by the potassium dichromate wet oxidation method. Briefly, 0.1 g of air-dried soil (0.15 mm) was digested with K2Cr2O7-H2SO4 at 180 °C for 30 min, followed by back-titration with FeSO4. SOM was calculated as: SOM = [(V0 − V1) × C × 0.003 × 1.724 × 1000]/W (V0 and V1 are the titration volumes for the blank and sample, respectively, C is the concentration of FeSO4, 0.003 is the milliequivalent weight of carbon, 1.724 is the conversion factor from organic carbon to organic matter, and W is the sample weight).
2.3. Analysis of Salt Ion Content
Exchangeable cations in the soil were extracted using the ammonium acetate exchange method. Briefly, soil samples were mixed with 1 mol L−1 ammonium acetate solution with a soil-to-liquid ratio of 1:10 (w/v), and the pH was adjusted to 7.0 using either ammonia or acetic acid. After shaking at 4000× g for 5 min, centrifugation, and filtration, a clear extract was collected. The supernatant was filtered through a 0.45 μm membrane filter. The concentrations of calcium (Ca), magnesium (Mg), and sodium (Na) in the extract were then determined using inductively coupled plasma optical emission spectrometry (ICP-OES, Thermo Fisher Scientific, Waltham, MA, USA).
2.4. Measurement of Organic Carbon in Soil Aggregates
Water-stable soil aggregates were separated by the wet-sieving method following the procedures described by Lu et al. [22]. Briefly, 10 g of air-dried soil was placed on a 2 mm sieve and pre-wetted by immersing in distilled water for 5 min. The sieve was then manually oscillated vertically in water with a stroke amplitude of 3 cm at a frequency of 50 cycles min−1 for 2 min. The material retained on the 2 mm sieve was collected as the >2 mm fraction. The remaining soil suspension was passed sequentially through 0.25 mm and 0.053 mm sieves using the same oscillation procedure. Aggregates retained on each sieve were gently washed into pre-weighed containers, and the <0.053 mm fraction was collected as the final suspension. All size fractions were oven-dried at 50 °C to constant weight, yielding three aggregate size classes: large macroaggregates (0.25–2 mm), small macroaggregates (0.053–0.25 mm), and microaggregates (<0.053 mm). Soil organic matter in each fraction was determined by the potassium dichromate oxidation method.
2.5. Assessment of Soil Aggregate Stability
Aggregate stability was assessed using the mean weight diameter (MWD) and geometric mean diameter (GMD) indices, calculated from the mass distribution of aggregate size fractions obtained by wet sieving. The MWD and GMD were computed according to the following equations [23]:
where: is the mean diameter of the i-th aggregate size class (mm), calculated as the arithmetic mean of the upper and lower sieve openings for each class; wi; is the proportion of the total sample weight (on a dry-weight basis) retained in the i-th size class; n is the total number of size classes. It should be noted that aggregate mass data were not corrected for sand content.
2.6. Determination of Soil Enzyme Activity
Soil urease (UE) activity was determined using the indophenol blue colorimetric method with a commercial kit (Cat. No. ADS-W-TR001, Jiangsu Addison Biotechnology Co., Ltd., Suzhou, China). Air-dried, sieved soil samples were incubated with urea substrate at 37 °C for 24 h. The ammonium nitrogen released by urease-catalyzed hydrolysis was colorimetrically quantified at 578 nm using a full-wavelength microplate reader (Spectra MAX 190, Molecular Devices, San Jose, CA, USA). Enzyme activity was expressed as µg NH4+-N per gram of dry soil per day (µg g−1 d−1).
Soil catalase (CAT) activity was determined using a visible spectrophotometric method with a commercial kit (Cat. No. ADS-W-TR005, Jiangsu Addison Biotechnology Co., Ltd., Suzhou, China). Soil samples were incubated with H2O2 substrate at 37 °C for 20 min. Catalase catalyzes the decomposition of H2O2 to H2O and O2. The residual H2O2 reacted with a chromogenic probe to produce a colored product, which was measured at 510 nm using a standard curve. Enzyme activity was expressed as µmol H2O2 consumed per gram of dry soil per minute (µmol g−1 min−1).
Soil sucrase (SC) activity was determined using the 3,5-dinitrosalicylic acid (DNS) colorimetric method with a commercial kit (Cat. No. ADS-W-TR007, Jiangsu Addison Biotechnology Co., Ltd., Suzhou, China). Soil samples were incubated with sucrose substrate at 37 °C for 24 h. Sucrase catalyzes the hydrolysis of sucrose to reducing sugars, which reacted with DNS reagent to form colored amino compounds. The absorbance was measured at 540 nm against a standard curve. Enzyme activity was expressed as mg glucose per gram of dry soil per day (mg g−1 d−1).
Soil alkaline phosphatase (AKP) activity was determined using the p-nitrophenyl phosphate (PNPP) colorimetric method with a commercial kit (Cat. No. ADS-W-TR010-48, Jiangsu Addison Biotechnology Co., Ltd., Suzhou, China). Soil samples were incubated with PNPP substrate at 37 °C. S-ALP catalyzes the hydrolysis of PNPP to yellow-colored p-nitrophenol (PNP), which was measured at 405 nm against a standard curve. Enzyme activity was expressed as µmol PNP per gram of dry soil per day (µmol g−1 d−1). All determinations were performed in triplicate.
2.7. Analysis of Microbial Diversity
Microbial community DNA was extracted from soil samples using the MagBeads FastDNA Kit (MP Biomedicals, Irvine, CA, USA) following the manufacturer’s instructions. The V3–V4 hypervariable region of the bacterial 16S rRNA gene was amplified using the primer pair 338F (5′-ACTCCTACGGGAGGCAGCAG-3′) and 806R (5′-GGACTACHVGGGTWTCTAAT-3′). PCR products were purified, quantified, and pooled in equimolar concentrations. Sequencing libraries were constructed using the Illumina MiSeq platform with MiSeq Reagent Kit v3 at Shanghai Personal Biotechnology Co., Ltd. (Shanghai, China). Microbiome bioinformatics were performed with QIIME2 2024.5 [24]. The raw data yielded 113,498 to 157,967 raw reads per sample. After quality filtering, denoising, paired-end merging, and chimera removal using the DADA2 pipeline, a total of 43,660 to 66,787 high-quality non-singleton sequences were obtained per sample (Table S2). The high-quality reads retained 39.3% of the raw sequences on average, indicating that the sequencing quality was sufficient for downstream community analysis. Sequence data were processed using QIIME (v 2) and R (v4.3.3). ASV-level alpha diversity indices (Chao1, Observed species, Shannon, Simpson) were calculated in QIIME (v 2) and visualized as box plots. Rank–abundance curves were generated to compare ASV richness and evenness among samples. Beta diversity was assessed using Jaccard, Bray–Curtis, and UniFrac distances, with community structure visualized via PCoA, NMDS, and UPGMA clustering. The network was visualized using R packages igraph and ggraph. Microbial functions were predicted by phylogenetic investigation of communities by reconstruction of unobserved states (PICRUSt2) upon MetaCyc [25] and KEGG [26] databases [27]. The soil microbial diversity sequencing experiment was conducted by Shanghai Pansenuo Biotechnology Co., Ltd., and the relevant results were analyzed on a cloud platform [28].
2.8. Measurement of Rice Indicators
Rice plants were harvested at maturity. Plant height and panicle length were measured using a ruler, and the number of productive panicles was recorded. All grains from the productive panicles were removed, and the total dry weights of grains and straw were determined separately. Plump grains were selected for calculation of the thousand seed weight. The harvested plants were oven-dried at 105 °C for 30 min and then at 65 °C for 48 h until constant weight was achieved, after which they were separated into roots, stems, and leaves. Each plant part was ground separately. A 0.15 g of each sample was digested using a sulfuric acid–hydrogen peroxide mixture to obtain a clear digest solution. Total nitrogen (N) and phosphorus (P) in the plant tissue were quantified by the indophenol blue colorimetric method and the vanadate–molybdate yellow colorimetric method, respectively. The total potassium (K) and total sodium (Na) were directly measured using flame photometry.
2.9. Data Analysis
All statistical analyses were performed using SPSS Statistics (version 21.0, IBM, USA). Prior to parametric tests, the normality of data distribution was assessed using the Shapiro–Wilk test (p > 0.05 indicating normality), and homogeneity of variances was evaluated using Levene’s test (p > 0.05 indicating equal variances). For datasets meeting both assumptions, one-way analysis of variance (ANOVA) followed by Tukey’s honestly significant difference (HSD) post hoc test was used to compare treatment means. For datasets that met normality but violated homogeneity of variance (Levene’s test p < 0.05), the Games–Howell post hoc test was applied, which does not assume equal variances across groups. All data are presented as mean ± standard deviation (SD), and statistical significance was set at p < 0.05 for all tests. The figures presented in this manuscript were created using the Kyplot 6.0 software (Japan, 2017). We performed Pearson correlation analysis and Mantel tests using the online platform to evaluate the correlations between the datasets [29]. Specifically, the environmental factor dissimilarity matrix was calculated using Euclidean distance, both based on standardized data. Significance was assessed via permutation tests with 999 permutations, which ensures stable probability estimates. Statistical significance was set at p < 0.05. Prior to Pearson correlation analysis, variables with missing values were removed, and the normality of each variable was assessed using the Shapiro–Wilk test (p > 0.05) to justify the use of Pearson correlation. Only correlations with |r| > 0.6 and a p-value < 0.05 were retained as significant edges.
3. Results
3.1. Effects of Organic Amendments on the Yield Traits of Rice
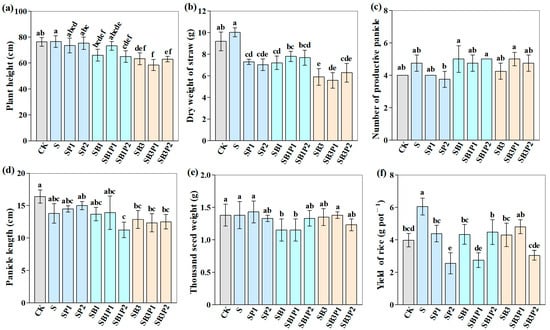
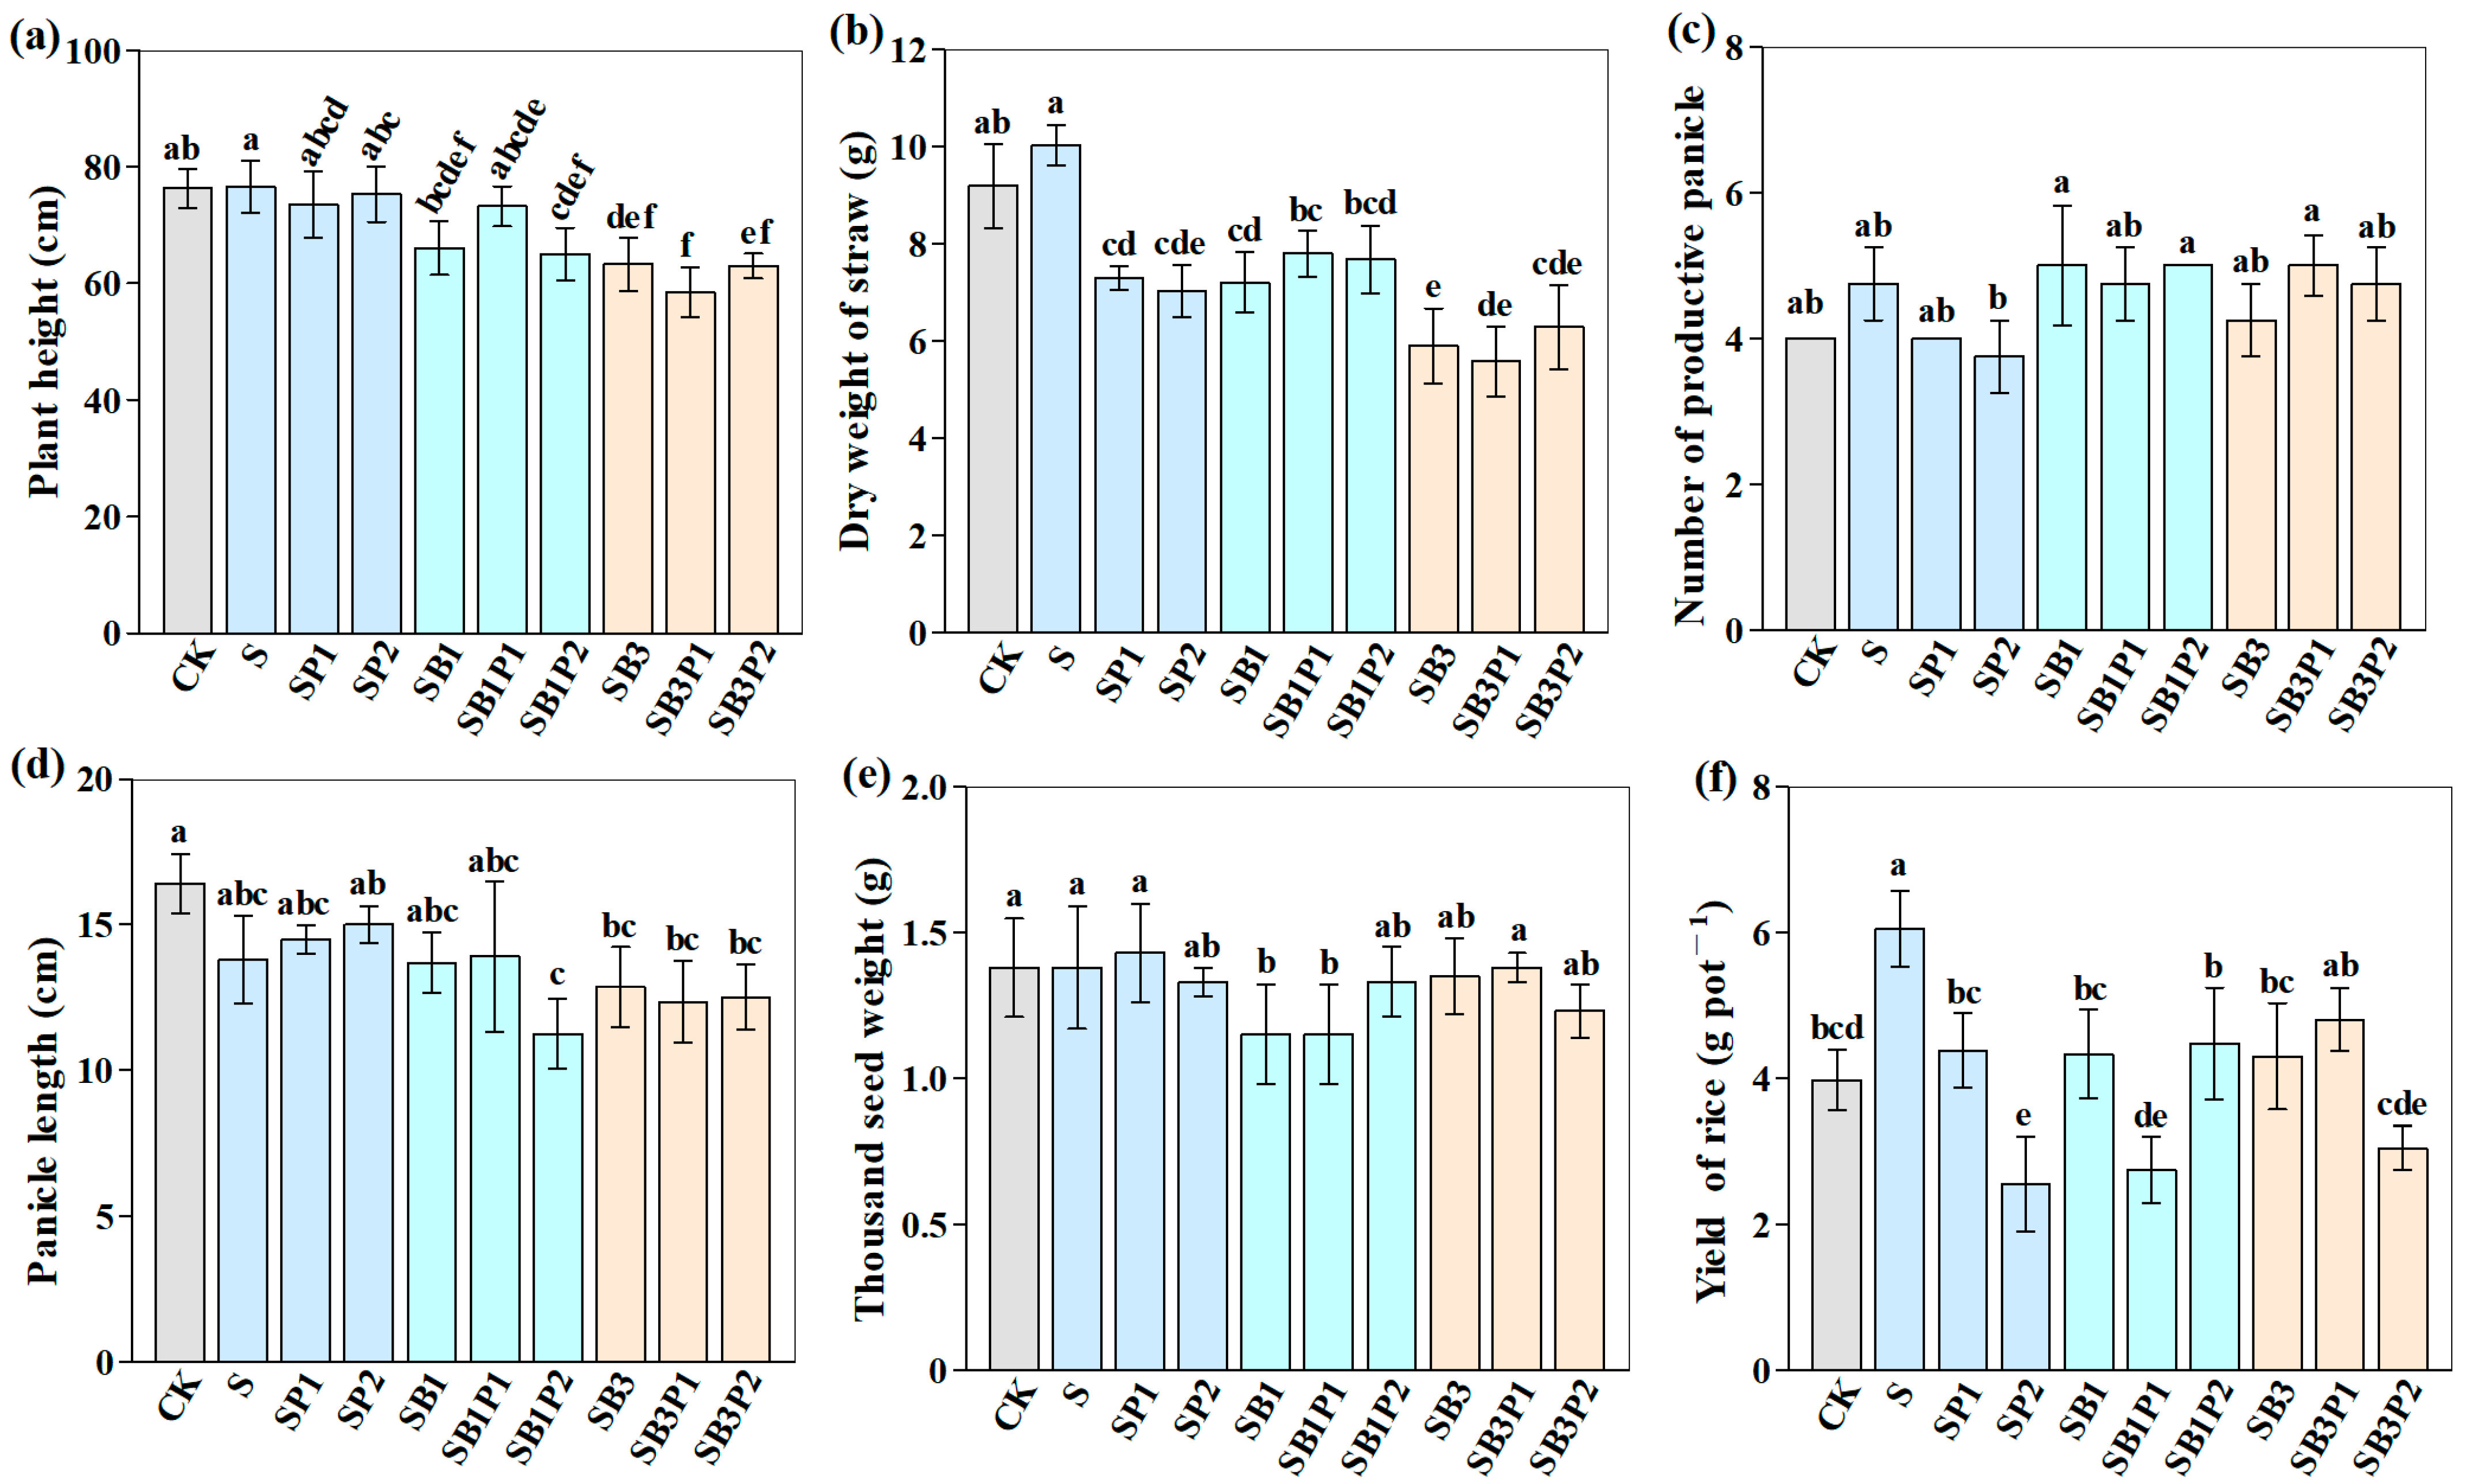
The effects of the combined organic amendments on rice yield were first assessed. As shown in Figure 1a, the highest plants (76.5 cm) were observed under the straw-only treatment, although the difference from the CK group was not statistically significant. With increasing biochar application rates, rice height showed a gradual decline, with the most pronounced drop of 23.3% occurring in SB3P1 relative to CK. Moreover, among all the treatments, the dry weight of straw was the highest under treatment S, with a no significant increase of 9.0% over CK. The mixed treatment of straw, peat and biochar all significantly reduced the dry weight of straw, among which the SB3P1 had the lowest value, which was 39.3% lower than CK (Figure 1b). According to Figure 1c, the greatest number of rice productive panicles was recorded in SB1, SB1P2, and SB3P1, whereas SP2 showed the fewest. Overall, the SB series treatments tended to have higher panicle number than either CK or the SP series. Meanwhile, Figure 1d reveals that panicle length was longest in CK (16.4 cm) and shortest in SB1P2 (11.3 cm). All biochar amended treatments led to shorter panicles; specifically, SB1P2 and SB3P1 exhibited reductions of 31.4% and 24.8%, respectively, compared to CK. In addition, the highest thousand seed weight (1.43 g) was obtained in SP1 treatment, which did not differ significantly from CK. The lowest values were observed under SB1 and SB1P1, representing a significant decrease of 19.6% relative to CK. In terms of rice yield, the S treatment had the highest (6.1 g pot−1), with an increase of 52.0% compared to CK, while SP2 gave the lowest (2.6 g pot−1), with a 57.9% reduction. Rice yields of SB1P1 and SB3P2 were both significantly lower than that of CK (Figure 1f).
Figure 1.
Influences of organic amendments on rice yield traits. (a) Rice plant height, (b) dry weight of straw, (c) number of productive panicles, (d) panicle length, (e) thousand seed weight, (f) rice yield. Values are means ± standard deviation (n = 4 biological replicates). Different lowercase letters on the bars indicate significant differences among treatment groups (p < 0.05; one-way ANOVA with Tukey HSD test).
3.2. Effects of Organic Amendments on the Element Content of Rice
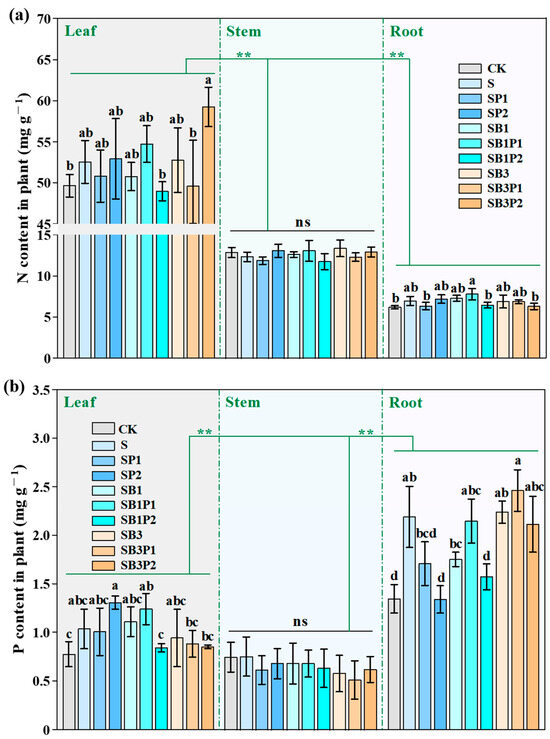
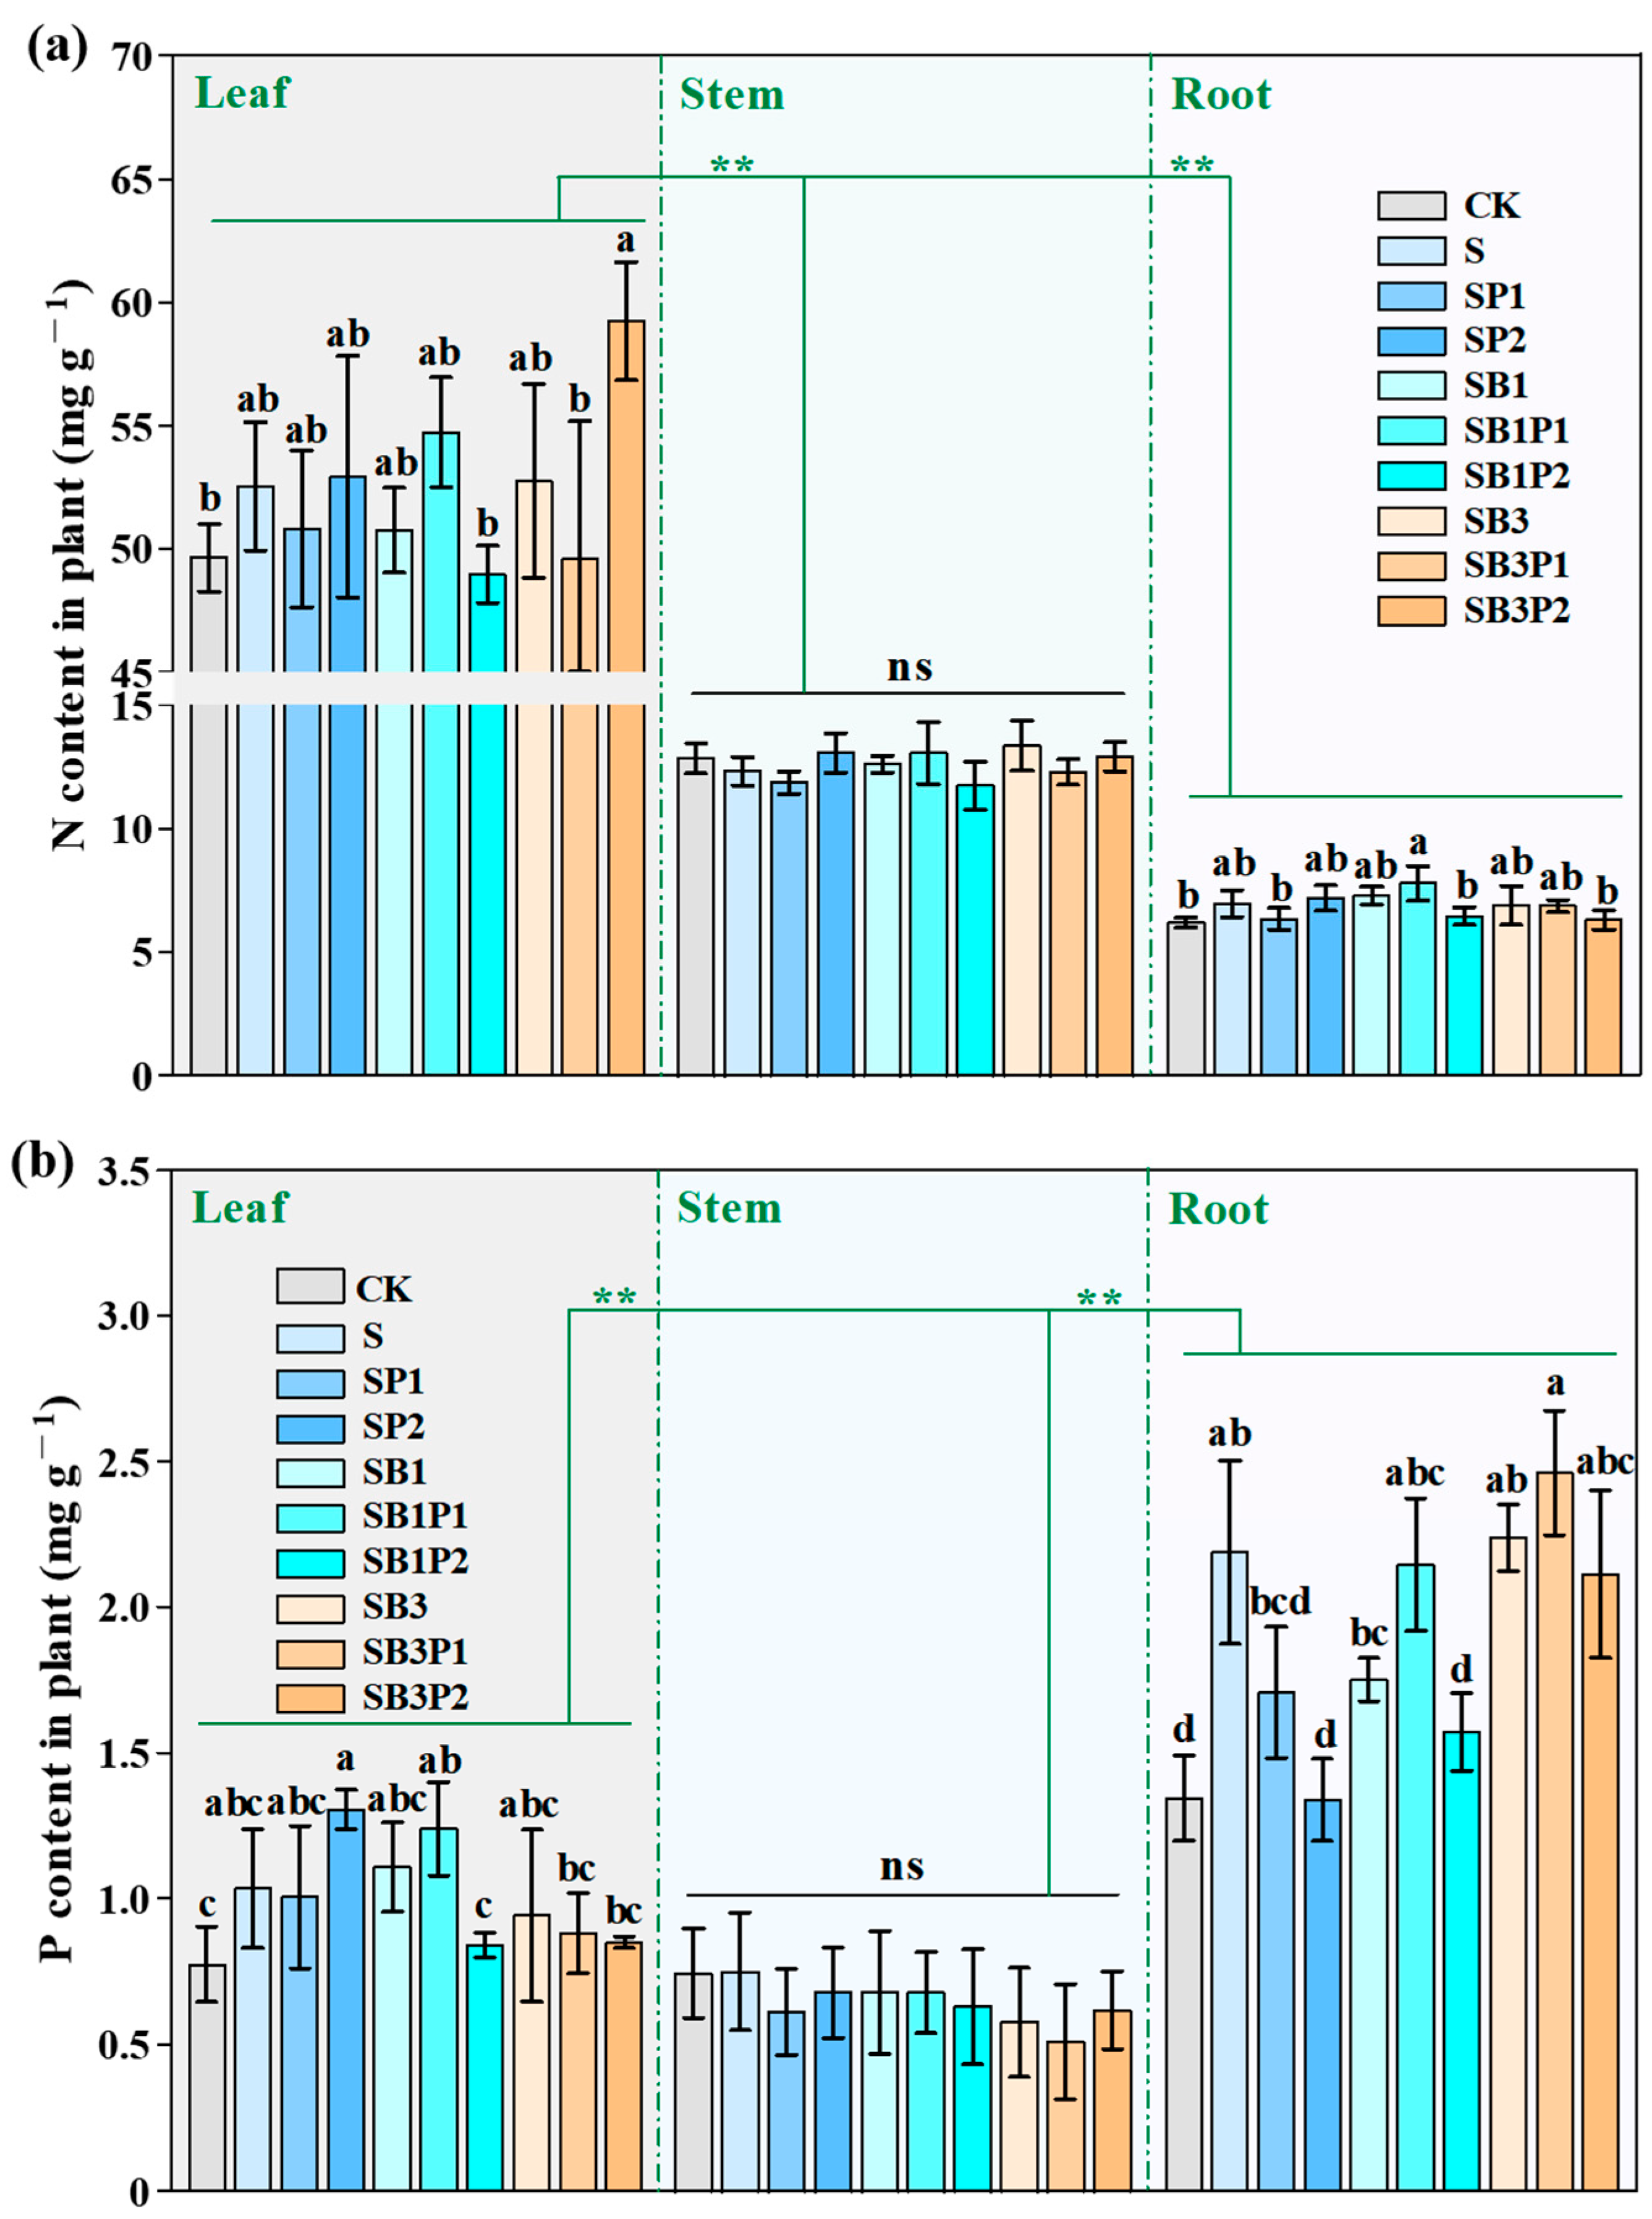
Rice productivity is closely related to the absorption of elements, which were then analyzed. Figure 2a illustrates that N levels in rice leaves were markedly higher than those in stems and roots in all treatments. The SB3P2 treatment resulted in the highest N content (59.2 mg g−1) in leaves, which was 19.3% above the CK level, whereas the lowest value (49.0 mg g−1) was observed under SB1P2, showing no significant difference from CK. However, across all treatments, N content in rice stems did not vary significantly. In rice roots, the maximum N content (11.3 mg g−1) was observed under SB1P1, representing a 25.9% increase relative to CK. However, root N content in other treatments showed no significant difference from CK. In addition, P contents of leaves in SP2 and SB1P1 were significantly higher than those under other treatments, exceeding CK by 68.8% and 60.0%, respectively. There was no significant difference in leaf P content of other treatments compared to CK (Figure 2b). For rice stems, the highest P content (0.8 mg g−1) was found under S treatment, and the lowest (0.5 mg g−1) under SB3P1 treatment; however, no significant differences were detected among treatments (Figure 2b). In rice roots, the maximum P content (2.5 mg g−1) was recorded for SB3P1, with an 82.0% increase over CK, while the minimum (1.3 mg g−1) occurred under SP2, which was not observably different from CK. Overall, P levels of roots were substantially higher than those in stems and leaves regardless of the treatments (Figure 2b).
Figure 2.
Influences of organic amendments on N and P accumulation in rice tissues. (a) N content in rice tissues, (b) P content in rice tissues. Values are means ± standard deviation (n = 4 biological replicates). Different lowercase letters on the bars indicate significant differences among treatments (p < 0.05; one-way ANOVA with Tukey HSD test). Asterisks indicate a significant interaction of rice tissue × organic amendment treatment using two-way ANOVA (** p < 0.01; ns: non-significant).
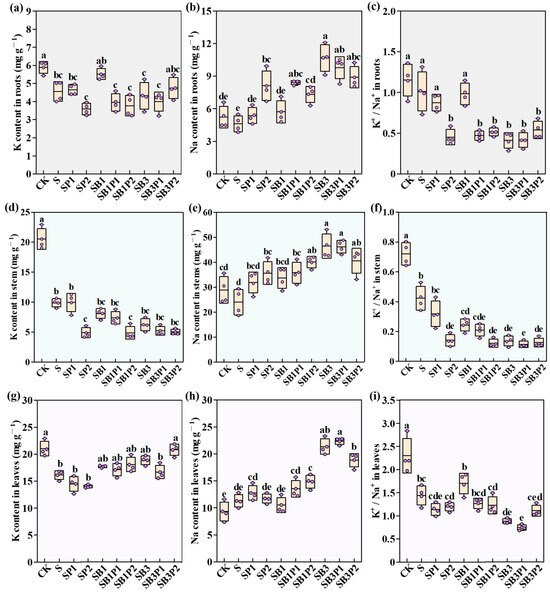
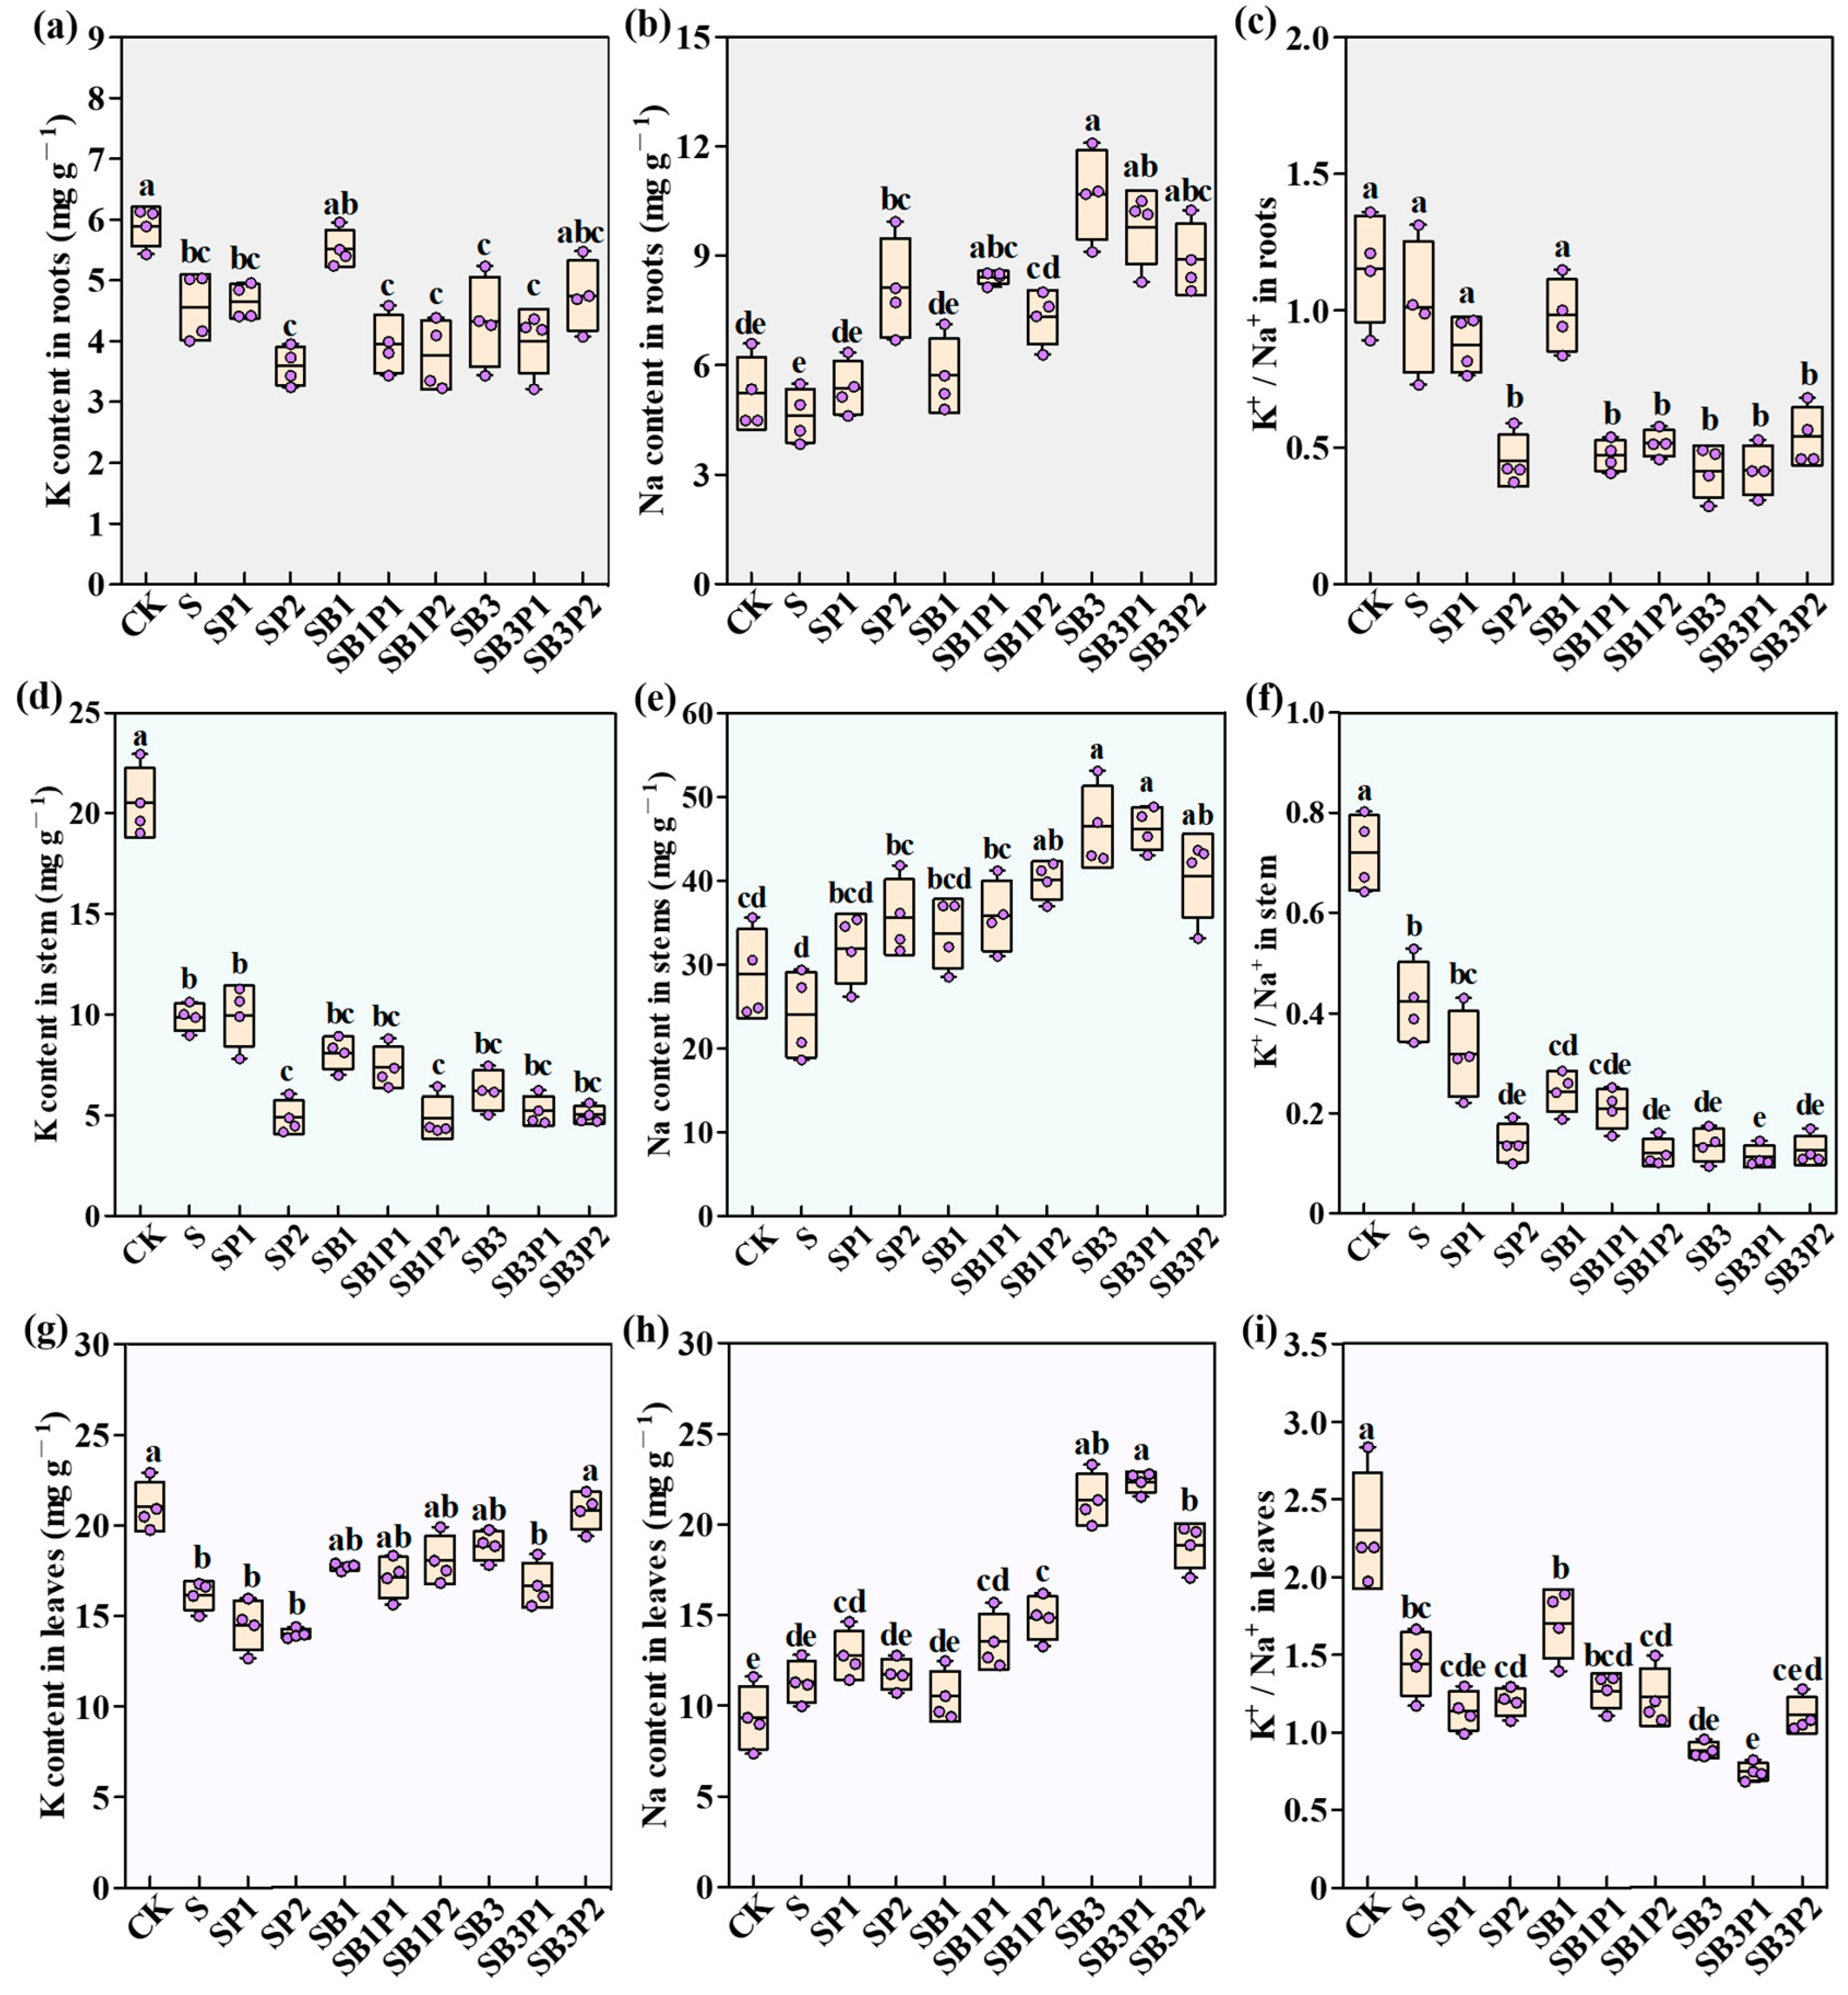
Figure 3a,d,g illustrate K contents in rice roots, stems, and leaves, respectively. For all three tissues, the highest K levels were observed in the CK group. Root K content in CK reached 5.9 mg g−1, whereas the lowest root K value occurred under SP2, representing a significant reduction of 56.6% relative to CK. The application of biochar at high dosages generally resulted in lower root K levels compared with other treatments (Figure 3a). Similarly, stem K content peaked at 20.5 mg g−1 (CK), and each organic amendment treatment led to a marked decrease in stem K content (Figure 3d). For leaves, CK also had the highest K content, with the lowest value observed in SP2 (Figure 3g). In contrast, Na contents in rice roots, stems, and leaves all tended to rise with increasing applications of biochar and peat, and the biochar treatments consistently exhibited higher Na levels than the others. In roots, the highest Na content (10.7 mg g−1) was recorded in SB3, a significant increase of 104.0% over CK, while the lowest (4.6 mg g−1) was found under S (Figure 3b). Likewise, SB3 and S treatments produced the highest (60.5% above CK) and lowest (16.8% below CK) Na levels of stems, respectively (Figure 3e). For leaves, all treatments had higher Na contents than CK, with the greatest increase (143.6%) observed under SB3P1 (Figure 3h). The K+/Na+ ratios in roots, stems, and leaves were then calculated. Overall, these ratios declined across all three tissues with increasing organic amendment additions, and all were lower than the CK values. In roots, the K+/Na+ ratio was lowest under both SB3 and SB3P1 treatments, decreasing by a significant 64.3% compared to CK (Figure 3c). Similarly, the SB3P1 treatment showed the lowest K+/Na+ ratio in stems (0.1) and leaves (0.8), with a reduction of 84.7% and 67.4% relative to CK, respectively (Figure 3f,i). Thus, the addition of organic amendments, especially biochar, suppressed K uptake while promoting Na accumulation in rice.
Figure 3.
Organic amendments reduce the K+/Na+ ratio in rice tissues. K (a), Na (b) content, and K+/Na+ ratio (c) in roots; K (d), Na (e) content, and K+/Na+ ratio (f) in stems; K (g), Na (h) content, and K+/Na+ (i) in leaves. Values are means ± standard deviation (n = 4 biological replicates). Statistical significance was assessed by one-way ANOVA with Tukey HSD test (a–c,e,f,h,i) and one-way ANOVA with Welch’s correction for unequal variances (d,g), followed by Games–Howell post hoc test. Different lowercase letters on the boxes indicate significant differences among treatments (p < 0.05).
3.3. Effects of Organic Amendments on Soil Basic Properties and Salt Ion Contents
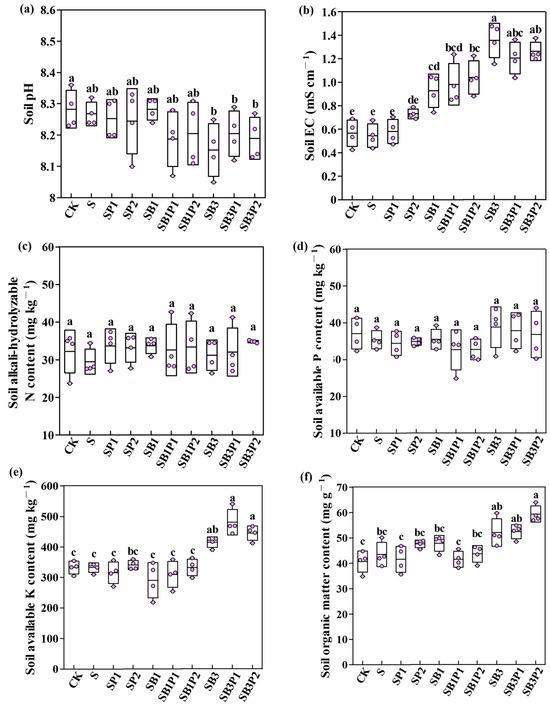
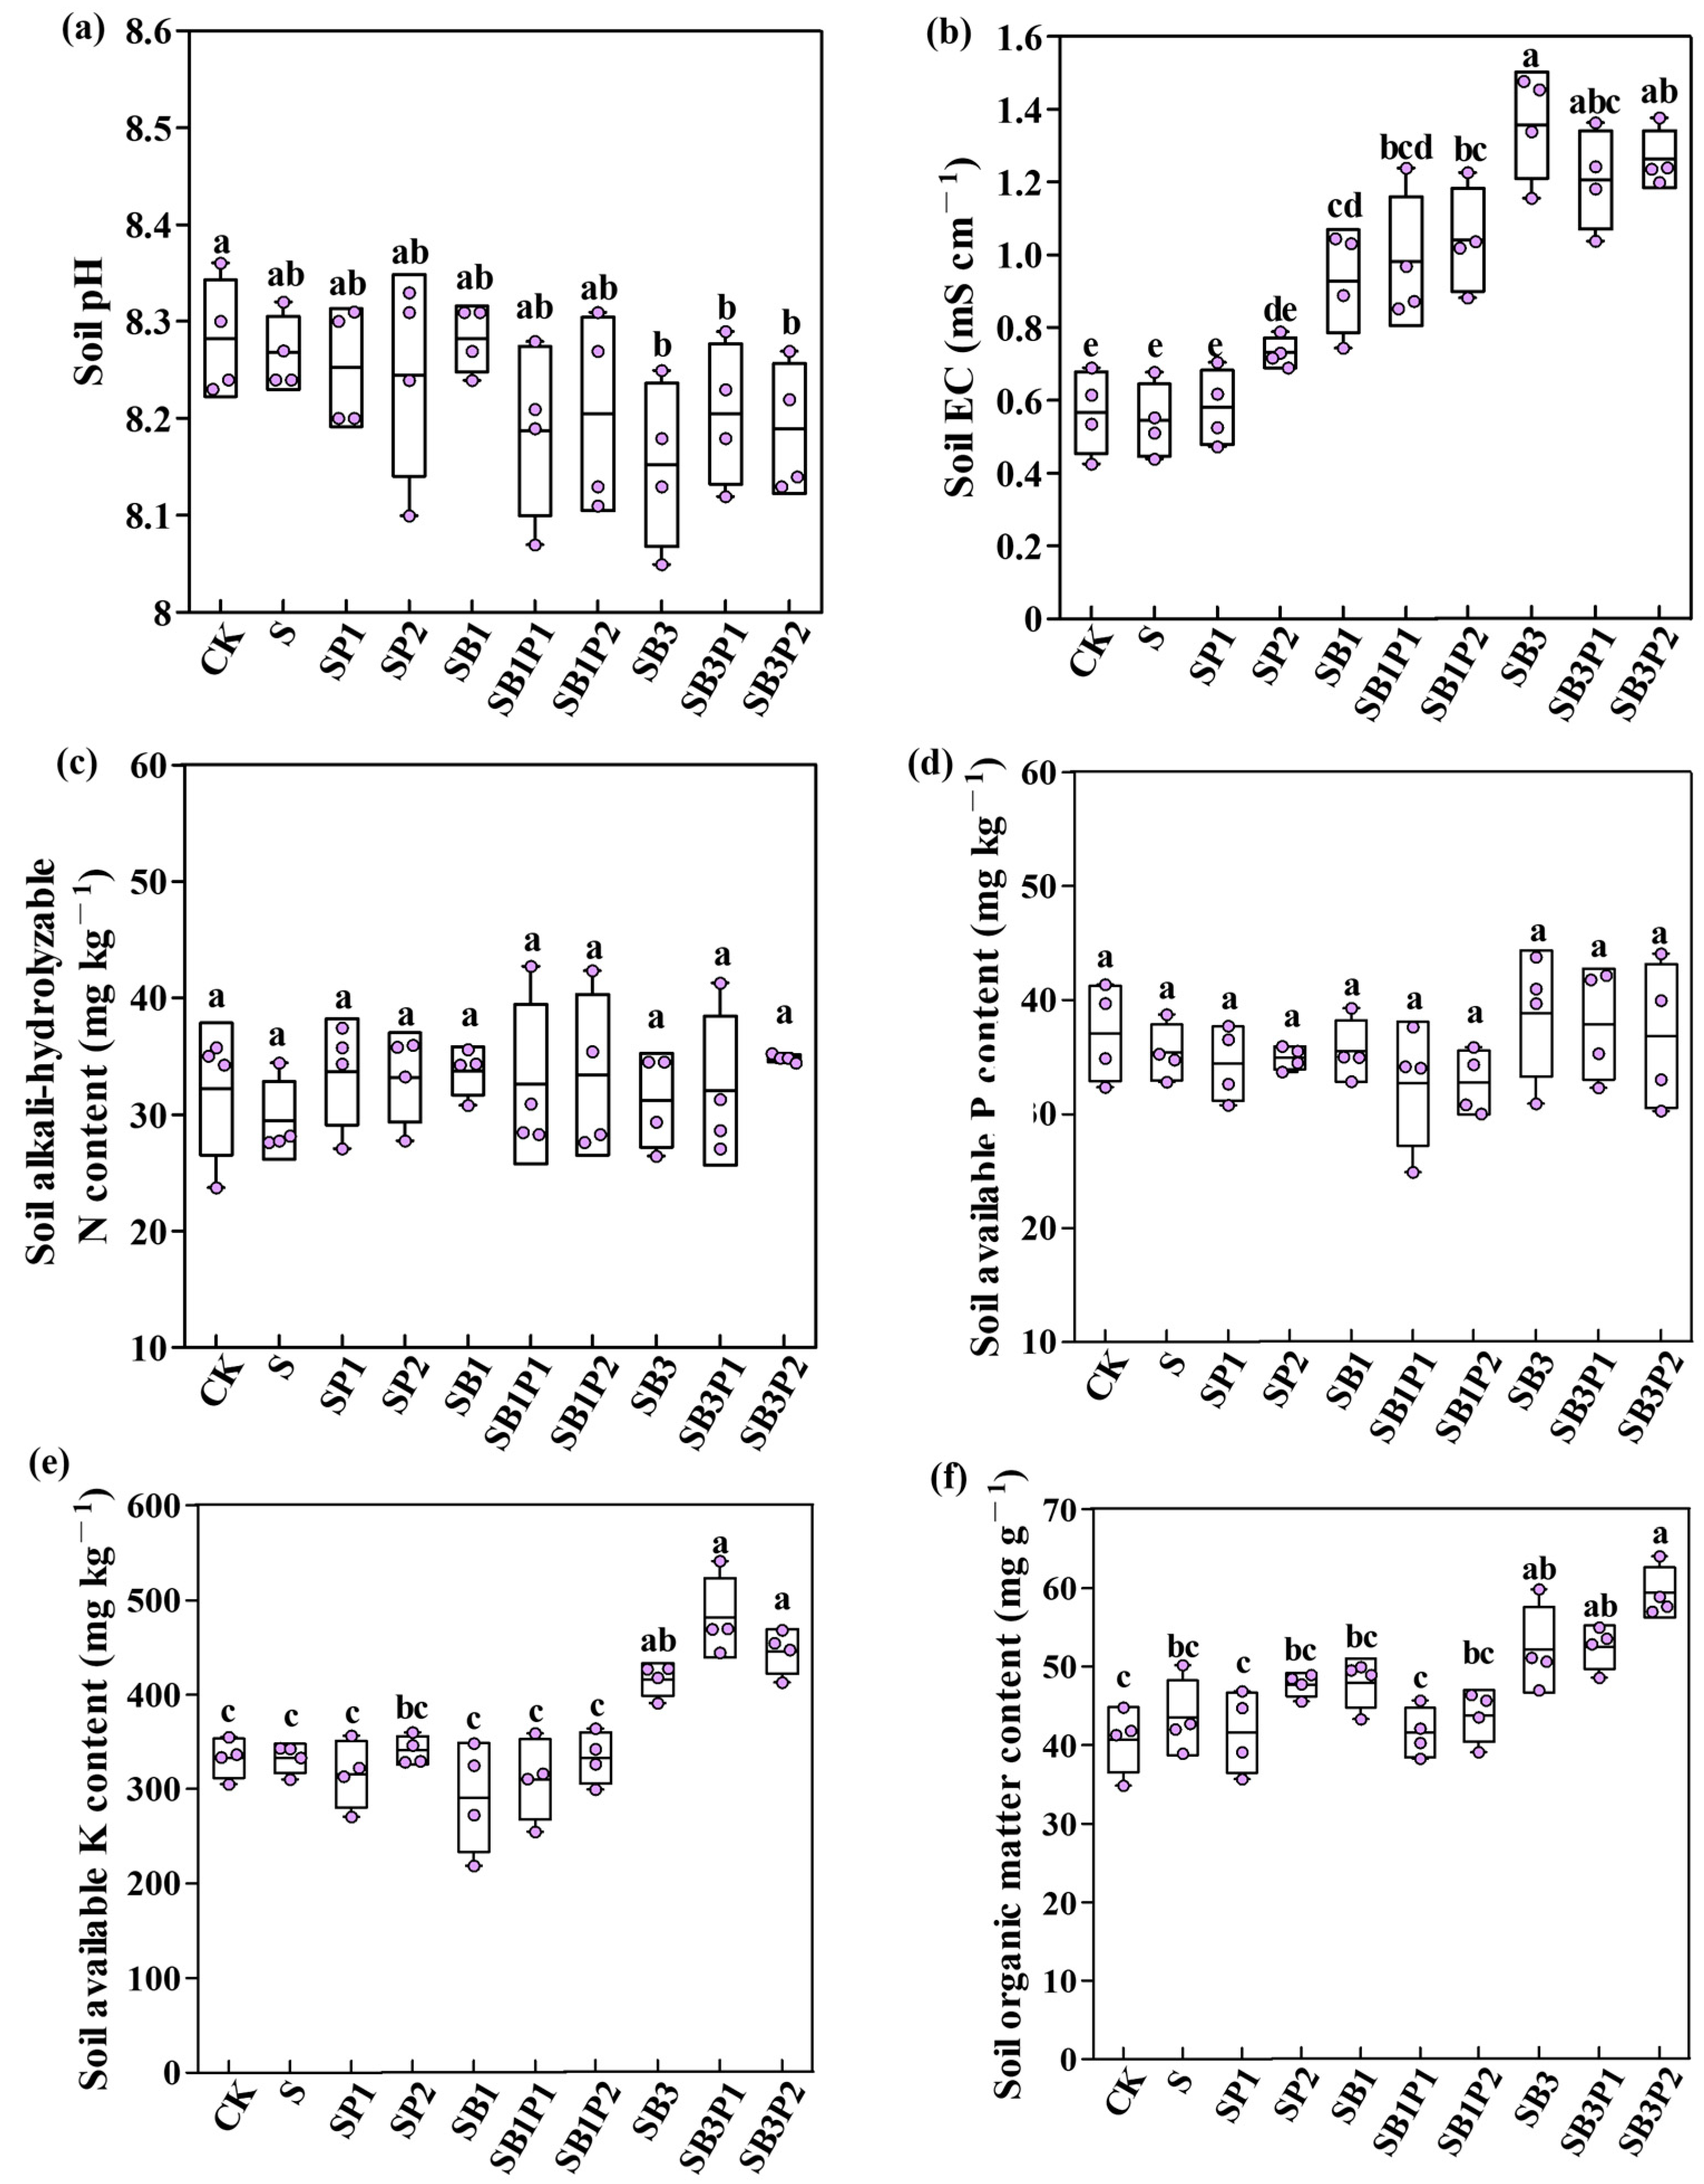
The experimental soil, collected from a coastal area, had an EC of 0.9 mS cm−1, placing it at the threshold of mild salinization. This value is consistent with the typical range for mildly salinized coastal soils in China. As the application dose of amendments increased, soil pH remained relatively stable with minor fluctuations at rice maturity. The soil pH in SB3 treatment was slightly lower than CK (Figure 4a). The combined application of biochar, peat and straw treatments (SB1, SB1P1, SB1P2, SB3, SB3P1, SB3P2) significantly increased soil electrical conductivity (EC), among which SB3 showed the greatest increase of 138.6%, compared to CK. However, straw alone (S) or in combination with peat (SP1, SP2) had only minor effects on soil EC, relative to CK (Figure 4b). Figure 4c indicates that the highest content of soil alkaline hydrolysis N at rice maturity occurred under SB3P2 (34.9 mg kg−1), and the lowest under S treatment (29.5 mg kg−1). However, none of the amendment treatments had a significant influence on alkaline hydrolysis N levels. Likewise, there were no significant differences in soil available P content among various treatments, although a high dosage of biochar (SB3) elevated soil available P (Figure 4d). Furthermore, high-dosage biochar treatments (SB3, SB3P1, SB3P2) markedly increased soil available K content, with enhancements ranging from 24.7% to 44.6%, relative to CK (Figure 4e). Similarly, the addition of organic amendments raised soil organic matter content; specifically, high-dosage biochar treatments (SB3, SB3P1, SB3P2) (52.0–59.3 mg g−1) resulted in significant increases of 30.0–47.5% compared with the CK group (Figure 4f).
Figure 4.
Effects of organic amendments on soil properties during the maturity stage of rice. Soil pH (a), soil EC (b), soil available N (c), P (d), and K (e) content, and (f) soil organic matter content. Values are means ± standard deviation (n = 4 biological replicates). Statistical significance was assessed by one-way ANOVA with Tukey HSD test (a,b,d–f) and one-way ANOVA with Welch’s correction for unequal variances, followed by Games–Howell post hoc test (c). Different lowercase letters on the boxes indicate significant differences among treatments (p < 0.05).
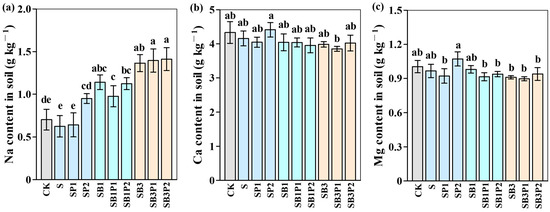
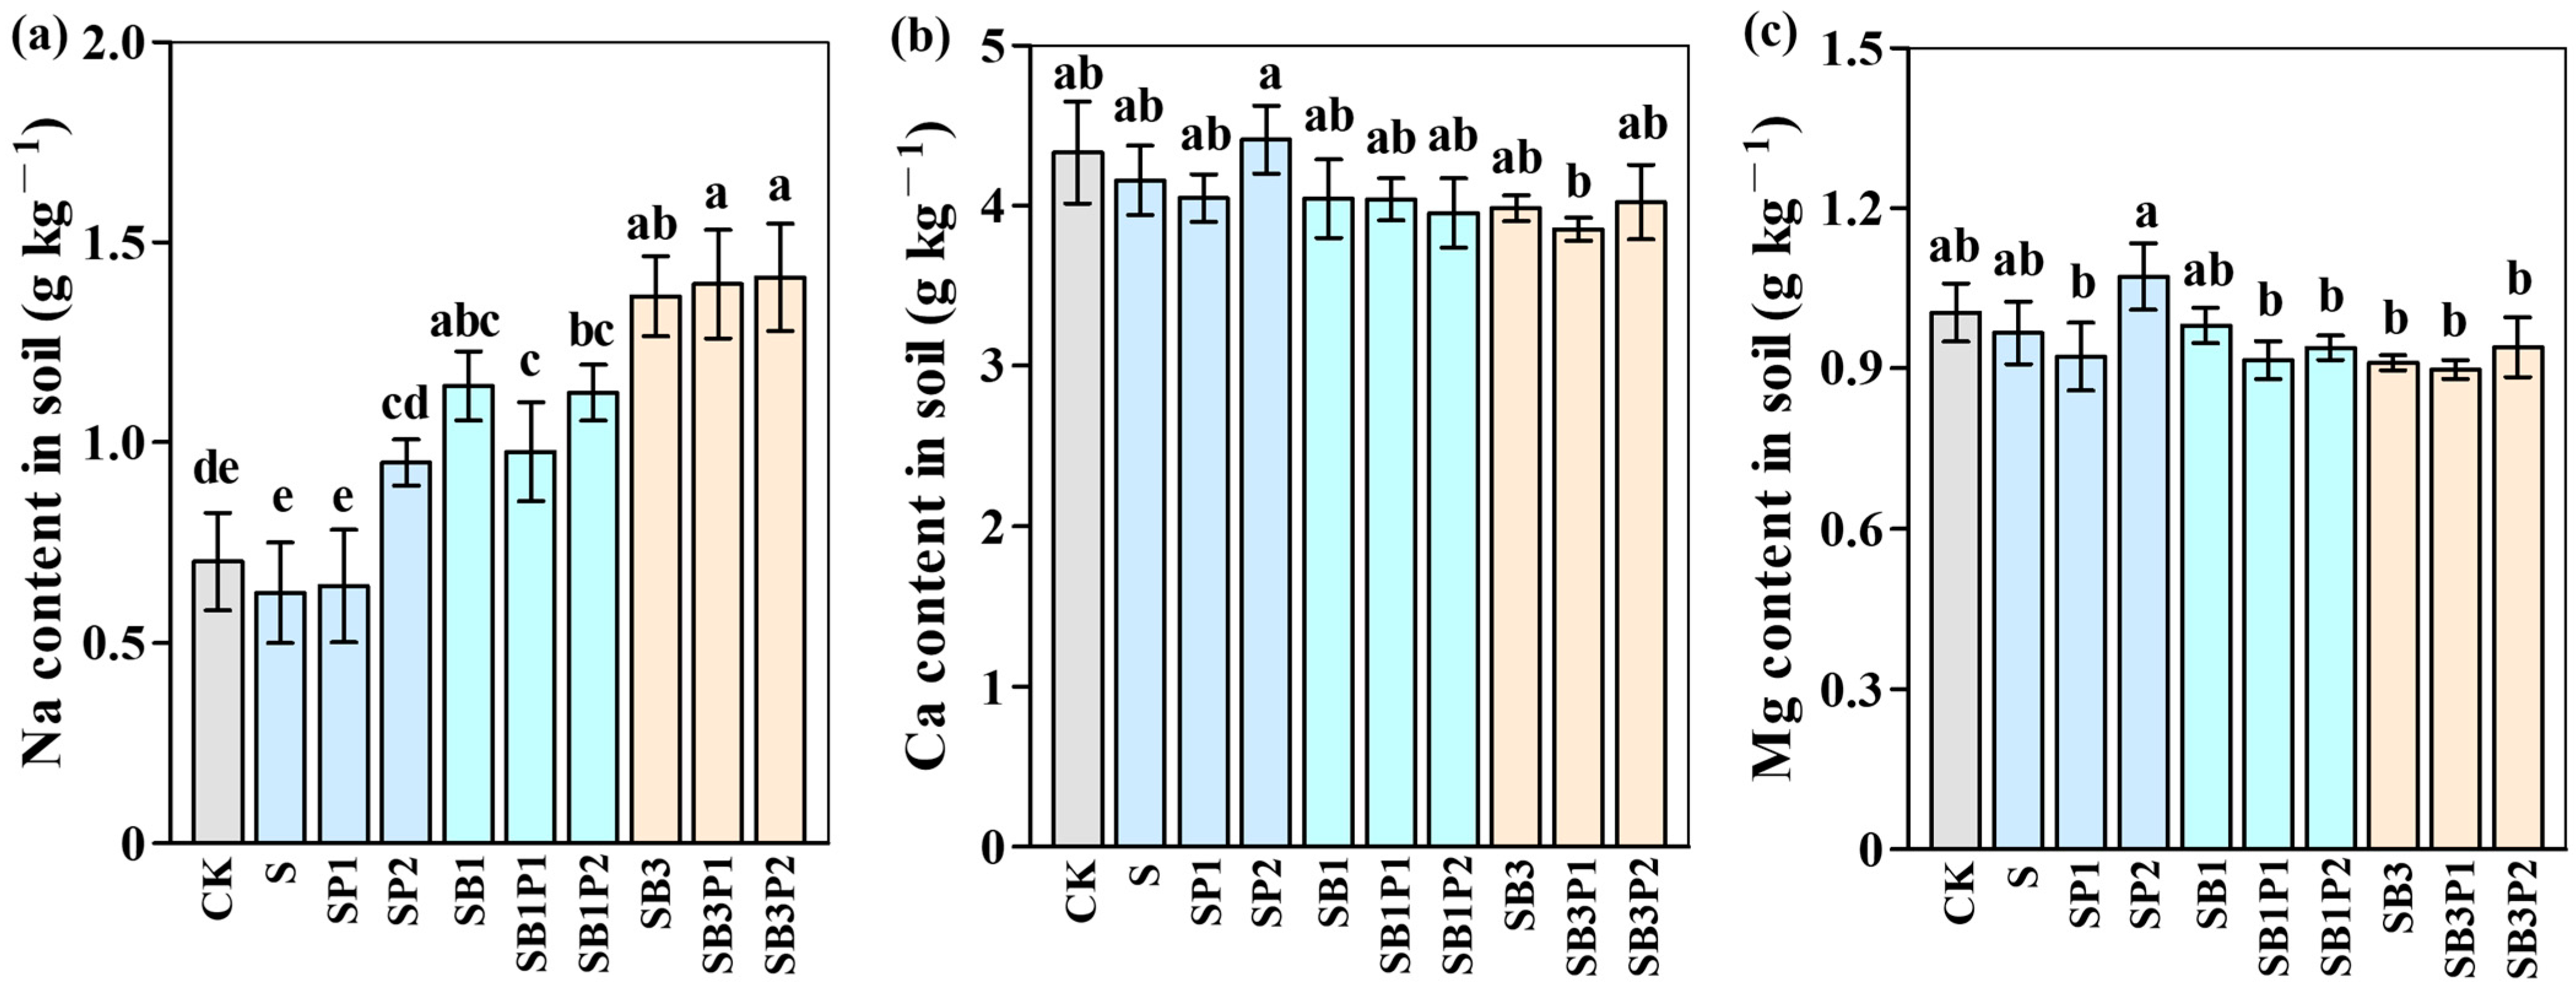
The changes of Na, Ca, and Mg contents in the soil with organic amendments were next examined. Figure 5a shows that, except for the S and SP1 treatments, all other treatments led to an increase in soil Na content. Na content in the SB3P2 treatment was the highest, with an increase of 101.4% compared with CK. In addition, the soil treated with SP2 and SB3P1 had the highest and the lowest Ca content, which was 1.9% higher and 11.1% less than that in the control group, respectively. However, there was no significant difference in soil Ca content among different groups (Figure 5b). The changing trends of Mg content in the soil among these treatments were similar to those of Ca content, with no significant difference in various treatments (Figure 5c).
Figure 5.
Effects of organic amendments on soil ion content. (a) Soil Na content, (b) soil Ca content, (c) soil Mg content. Values are means ± standard deviation (n = 4 biological replicates). Different lowercase letters on the bars indicate significant differences among treatments (p < 0.05; one-way ANOVA with Tukey HSD test).
3.4. Organic Amendments Affect the Organic Carbon Content of Soil Aggregates
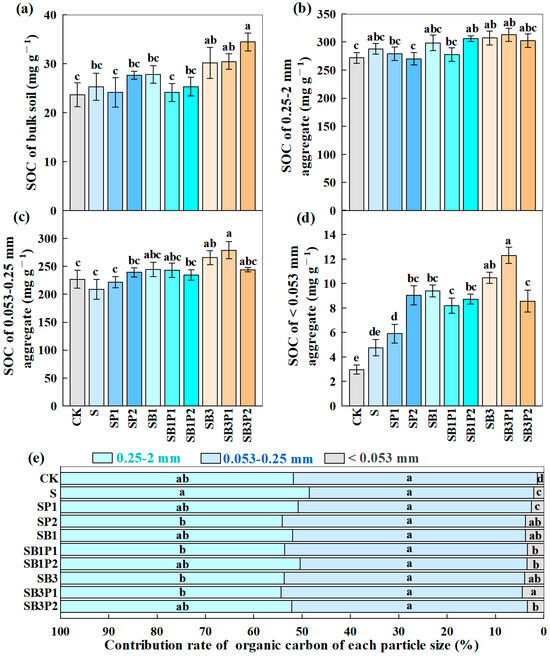
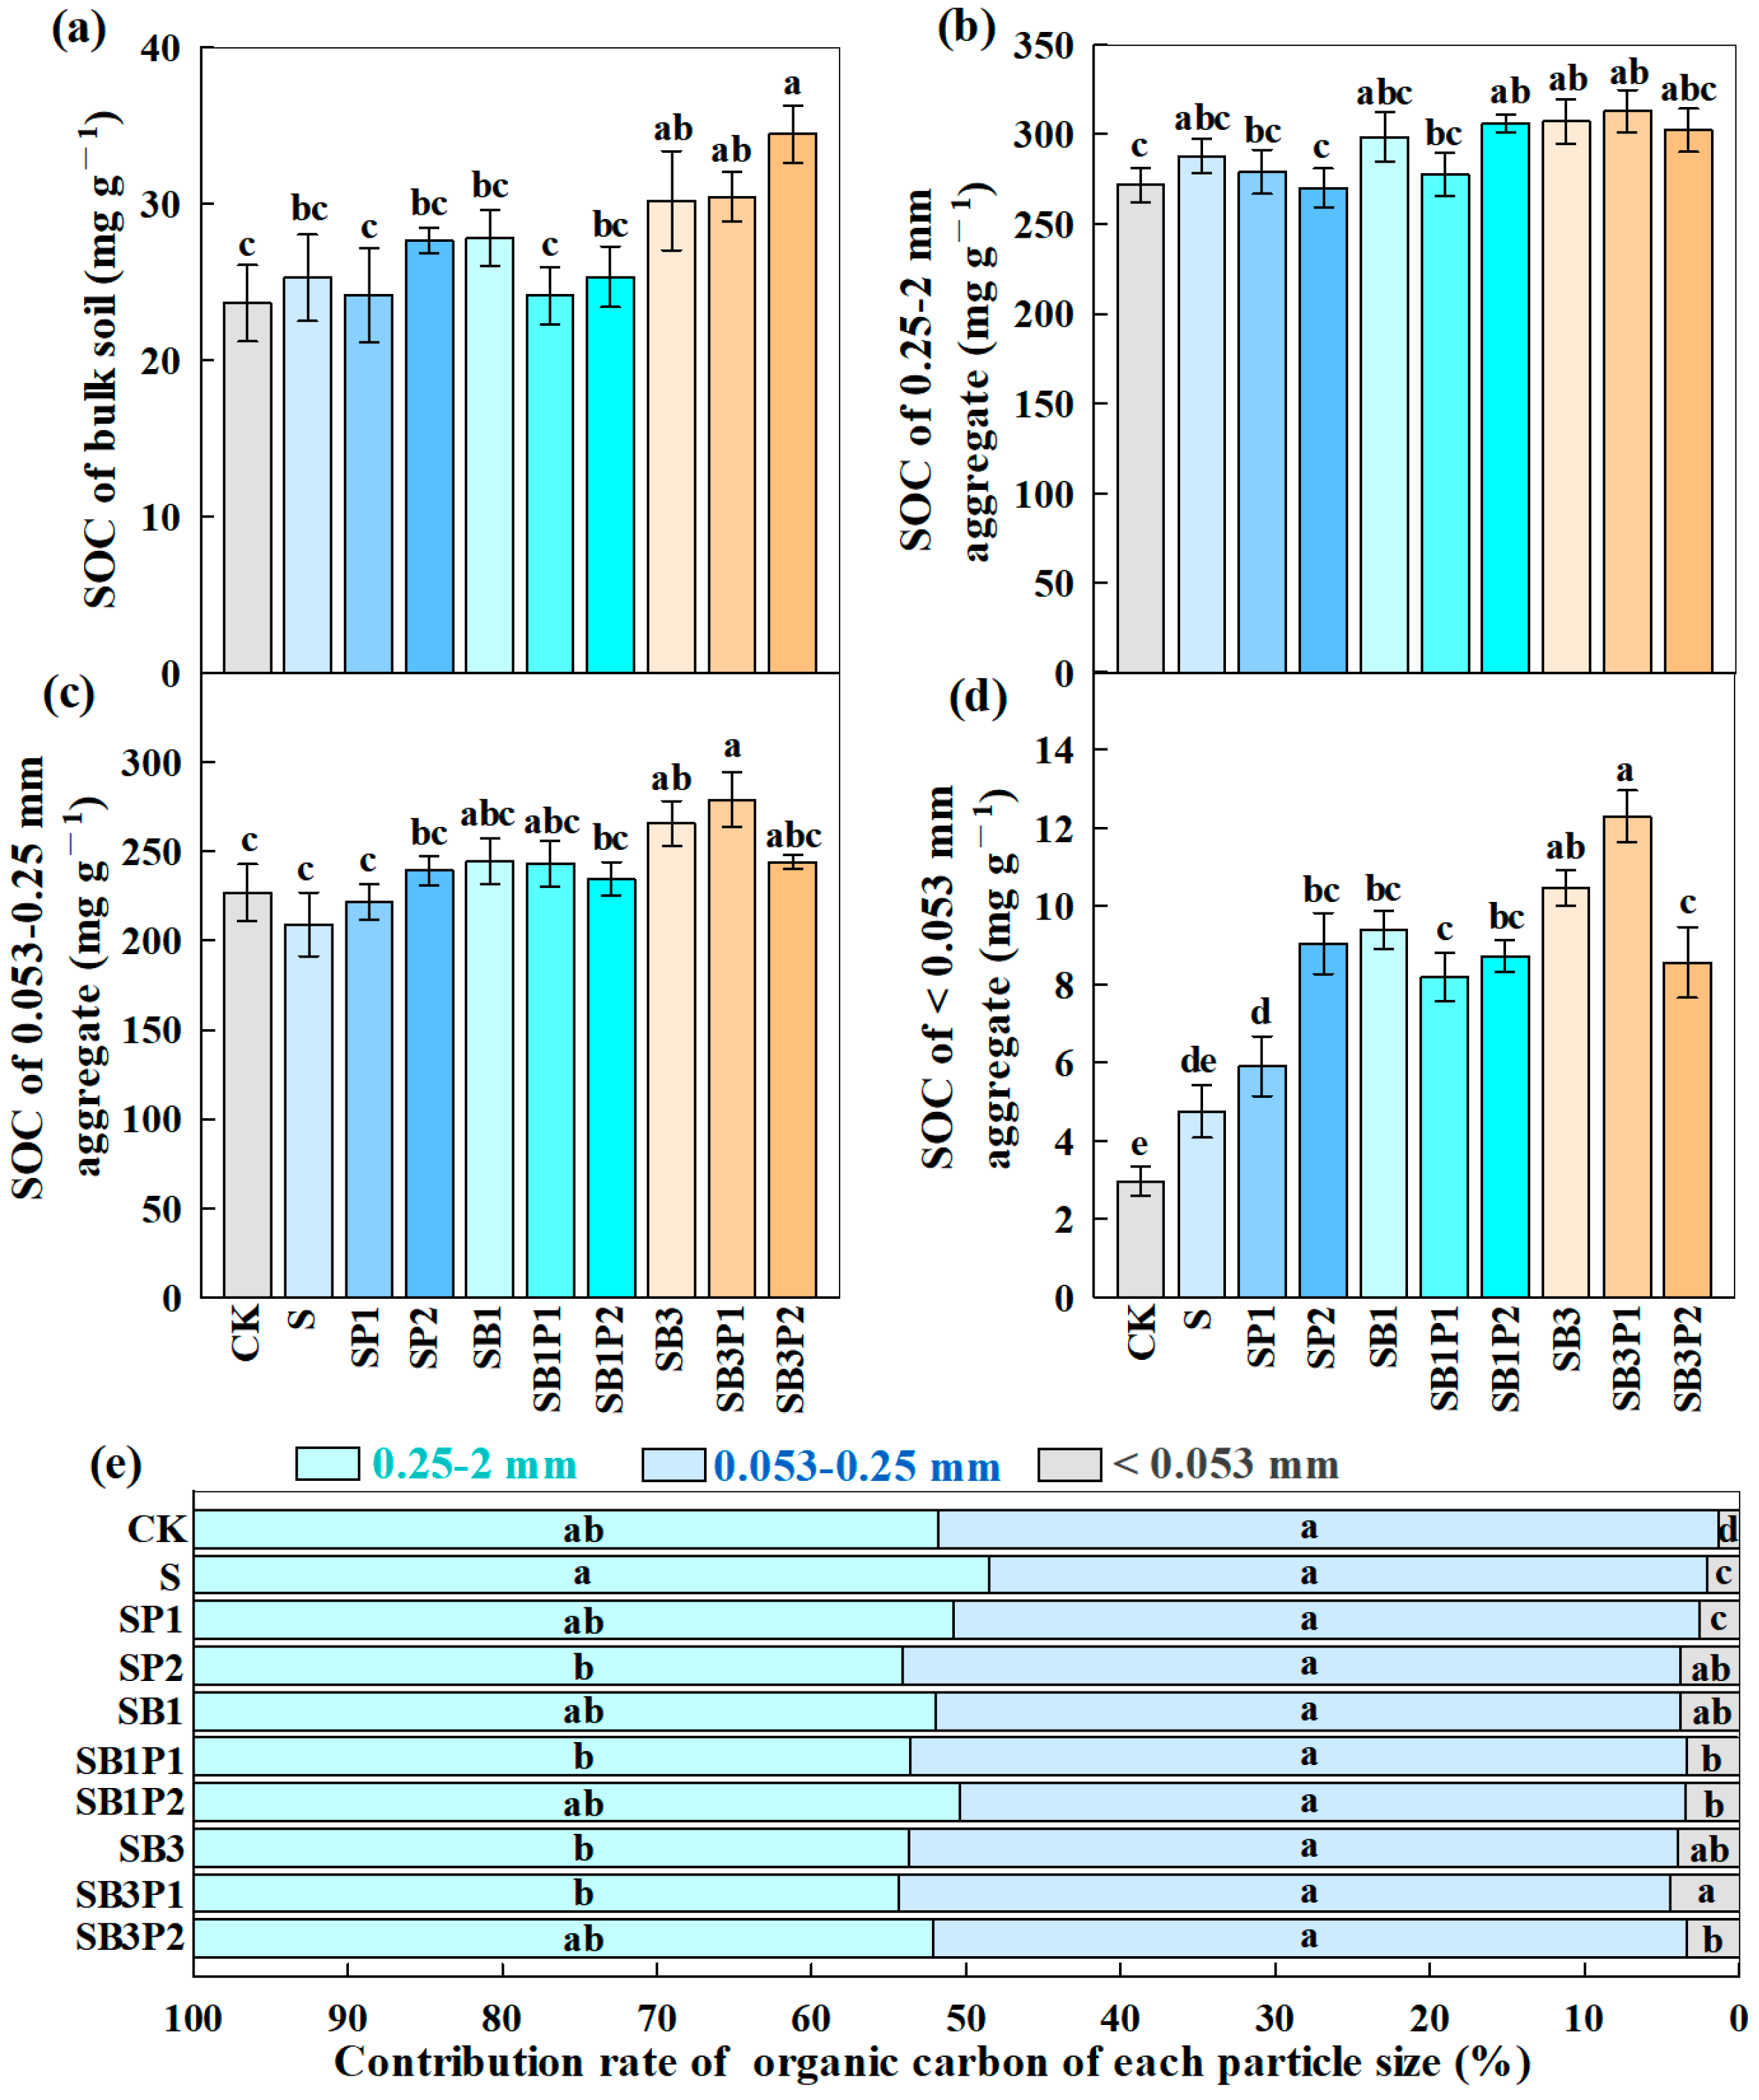
The results revealed that, across different treatments, no significant differences were observed in the mean weight diameter (MWD), geometric mean diameter (GMD) of the aggregates, and the proportion of aggregates (<2 mm) of different particle sizes (Figure S1). Subsequently, the organic carbon contents within aggregates (<2 mm) were analyzed. Compared with CK, the high biochar application dosages (SB3, SB3P1, SB3P2) increased organic carbon of the soil by 27.8%, 28.7%, and 45.7%, respectively (Figure 6a). Similarly, organic carbon levels within the 0.25–2 mm aggregate fraction under SB1P2, SB3, and SB3P1 treatments were 12.7%, 13.1%, and 15.1% higher than those of CK, respectively (Figure 6b). For the 0.053–0.25 mm particle size, the highest organic carbon content was found in SB3P1, and the lowest in S treatment; the high-biochar groups (SB3, SB3P1, SB3P2) again exhibited higher organic carbon values than the other treatments (Figure 6c). A similar pattern was seen in the <0.053 mm fraction, where the high-biochar treatments (SB3, SB3P1, SB3P2) had significantly higher organic carbon than CK, and all other organic material groups also exceeded CK (Figure 6d). As shown in Figure 6e, soil organic carbon was predominantly distributed in the 0.25–2 mm and 0.053–0.25 mm size classes across all treatments. The largest contribution of soil organic carbon came from the 0.25–2 mm particle size, followed by the 0.053–0.25 mm particle size, while the <0.053 mm particle size had the smallest contribution. Within the 0.25–2 mm fraction, the S treatment accounted for the highest proportion (51.5%), and SB3P1 the lowest (45.6%). In the 0.053–0.25 mm fraction, CK showed the highest (50.5%), and S had the lowest (46.4%). For the <0.053 mm class, SB3P1 showed the highest proportion (4.4%), while CK gave the lowest (1.3%).
Figure 6.
Organic amendments affect SOC content and distribution in soil aggregates. SOC of bulk soil (a), 0.25–2 mm aggregate (b), 0.053–0.25 mm aggregate (c), <0.053 mm aggregate (d); (e) Contribution of organic carbon of each aggregate. Values are means ± standard deviation (n = 4 biological replicates). Different lowercase letters on the bars indicate significant differences among treatments (p < 0.05; one-way ANOVA with Tukey HSD test).
3.5. Organic Amendments Alter Soil Enzyme Activities
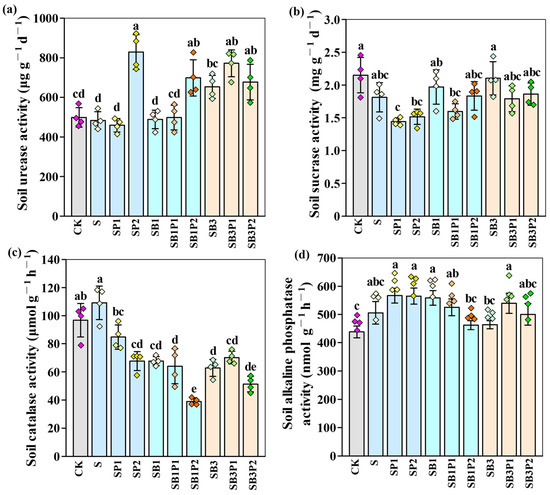
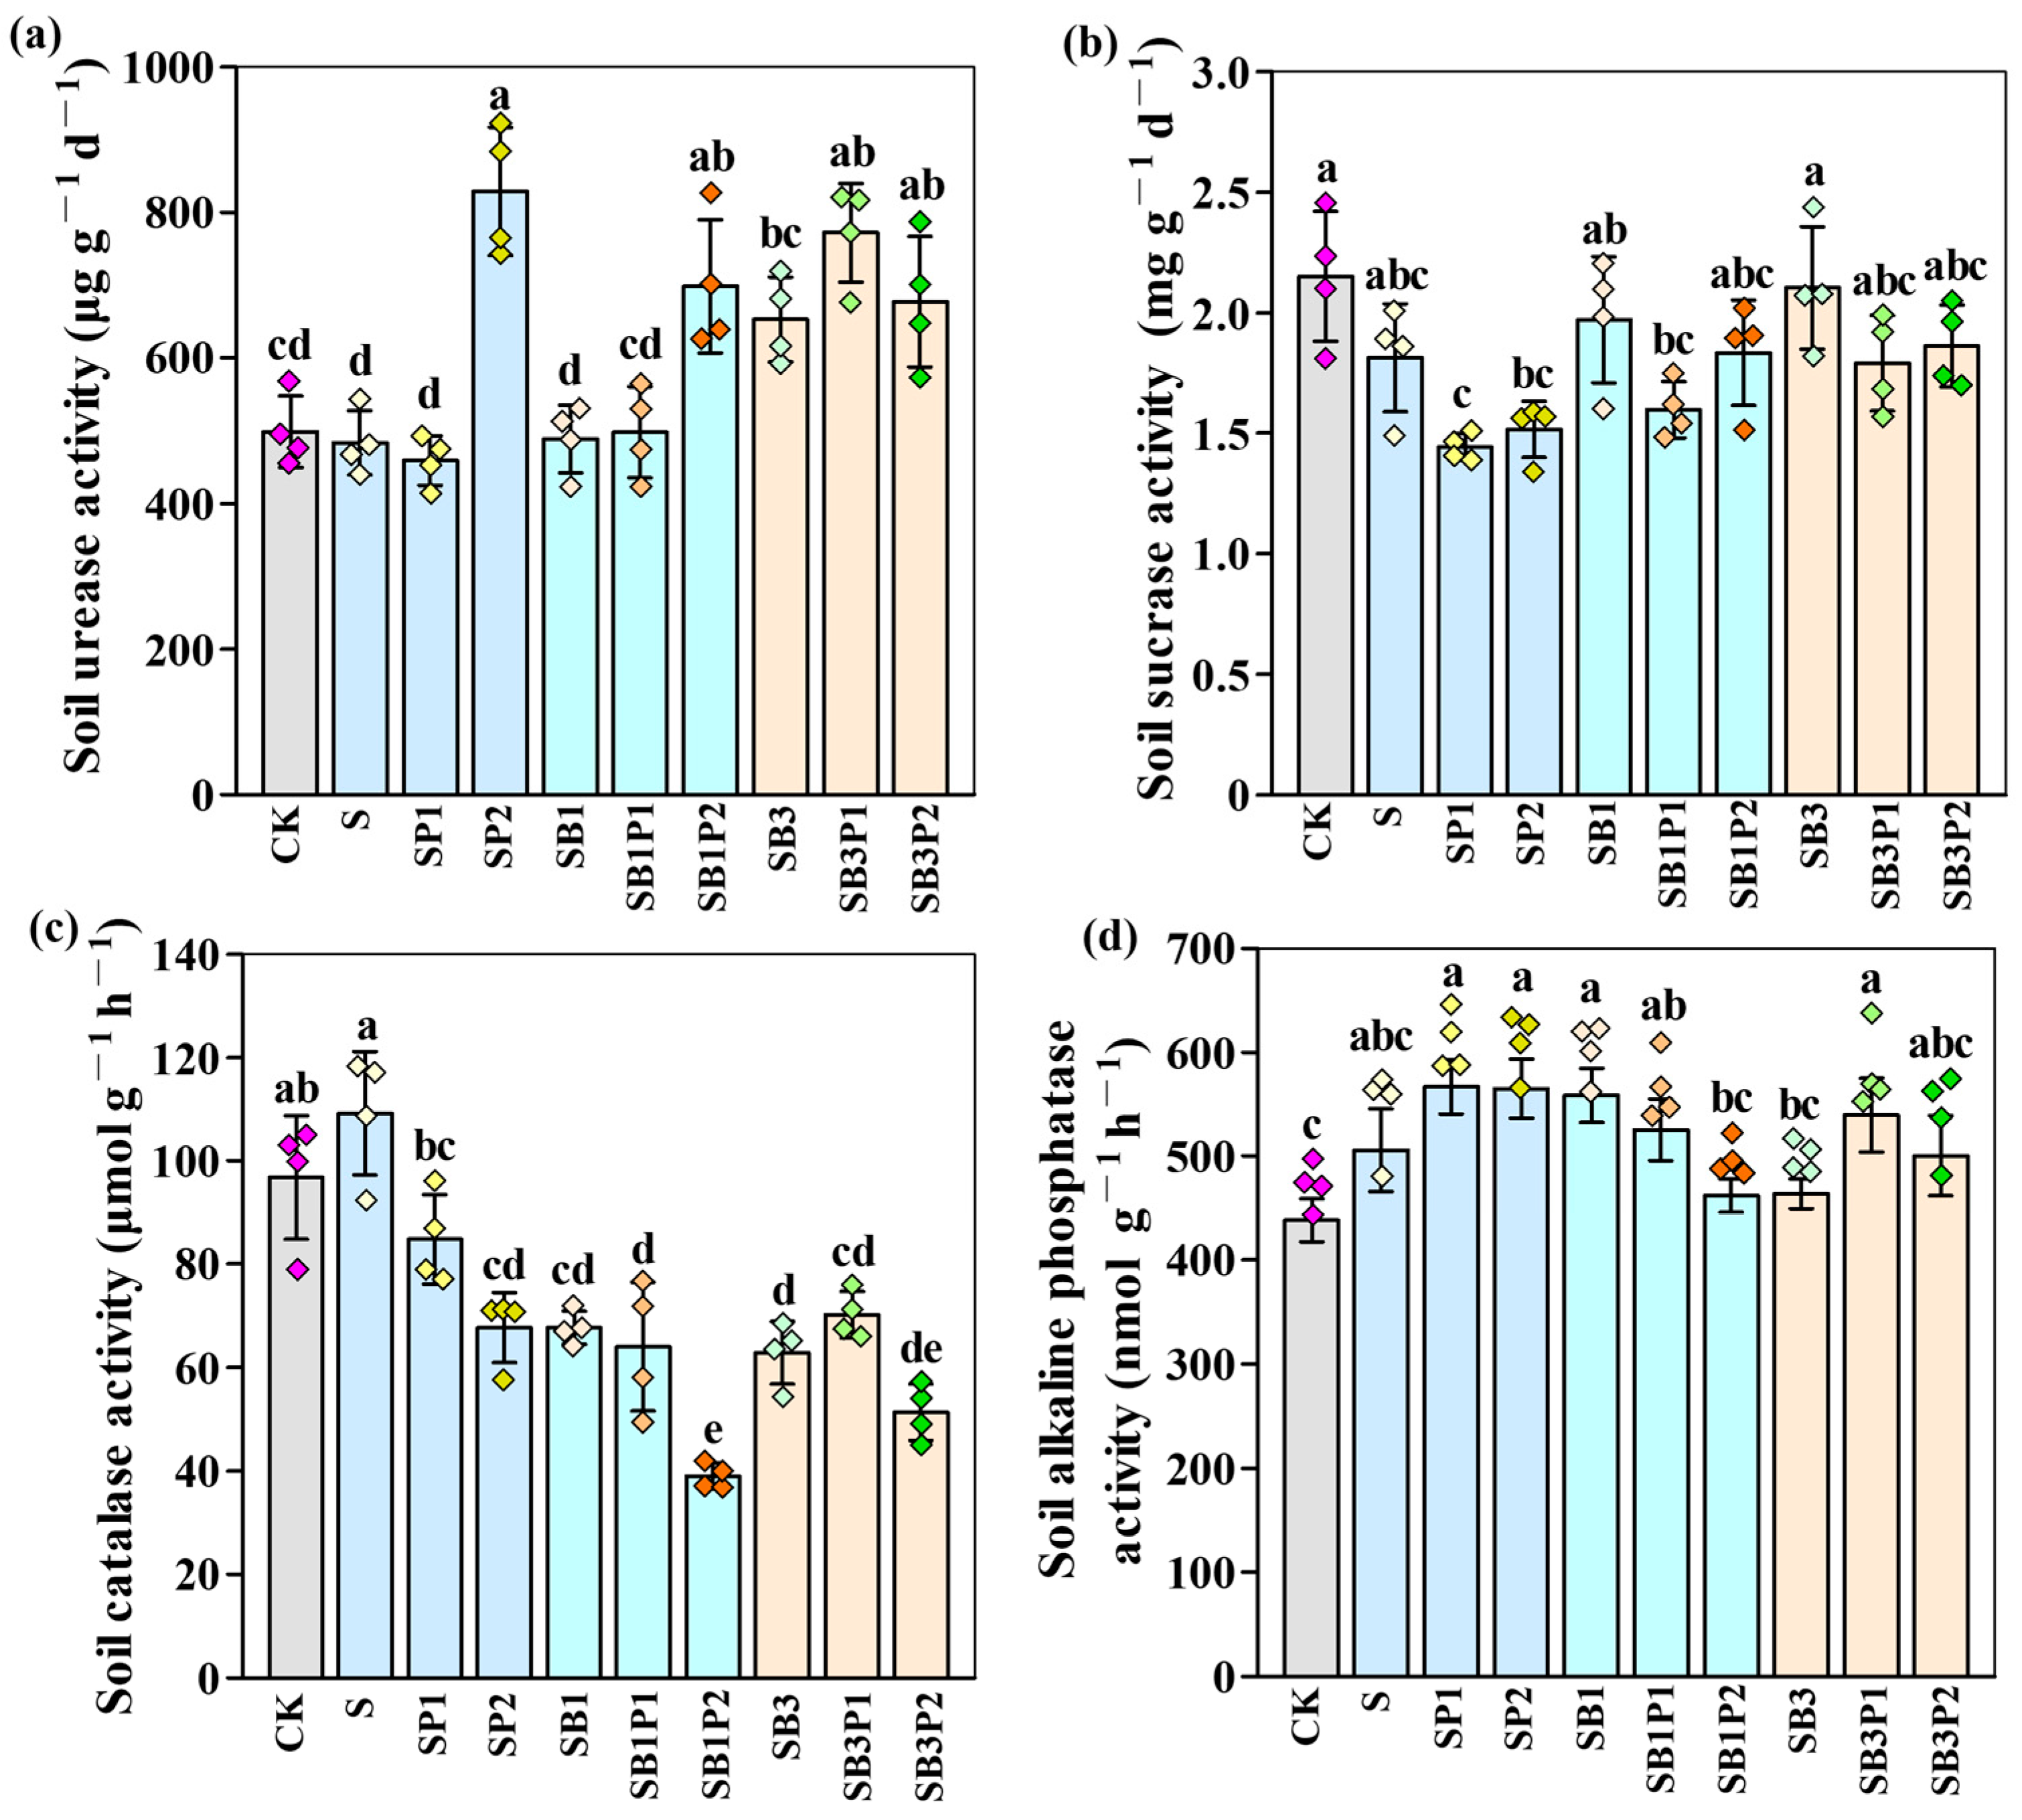
The addition of organic amendments markedly altered soil enzyme activities. Figure 7a shows that soil urease activity under treatments SP2, SB1P2, SB3, SB3P1, and SB3P2 was significantly elevated by 68.2%, 40.1%, 30.8%, 54.8%, and 35.8%, respectively, relative to the control. Several treatments with organic amendments led to a reduction in soil sucrase activity; specifically, SP1, SP2, and SB1P1 caused decreases of 32.9%, 29.5%, and 22.0%, respectively, compared with CK (Figure 7b). Similarly, except for the S treatment, all other organic amendment treatments (SP2, SB1, SB1P1, SB1P2, SB3, SB3P1, and SB3P2) lowered soil catalase activity, with reductions ranging from 12.4% to 59.7% (Figure 7c). Conversely, all organic amendment treatments increased soil alkaline phosphatase activity compared with CK; the significant enhancements observed under SP1, SP2, SB1, SB1P1, and SB3P1 were 29.3%, 29.0%, 27.5%, 19.9%, and 23.2%, respectively (Figure 7d). These results indicate that the activity of soil enzymes responds variously to different types of organic materials.
Figure 7.
Organic amendments change the soil enzyme activity. The activity of soil urease (a), sucrase (b), catalase (c), alkaline phosphatase (d). Values are means ± standard deviation (n = 4 biological replicates). The small colored squares above the bars represent the values of four replicates for each treatment. Different lowercase letters on the bars indicate significant differences among treatments (p < 0.05; one-way ANOVA with Tukey HSD test).
3.6. Response Characteristics of Microbial Diversity to Organic Amendments
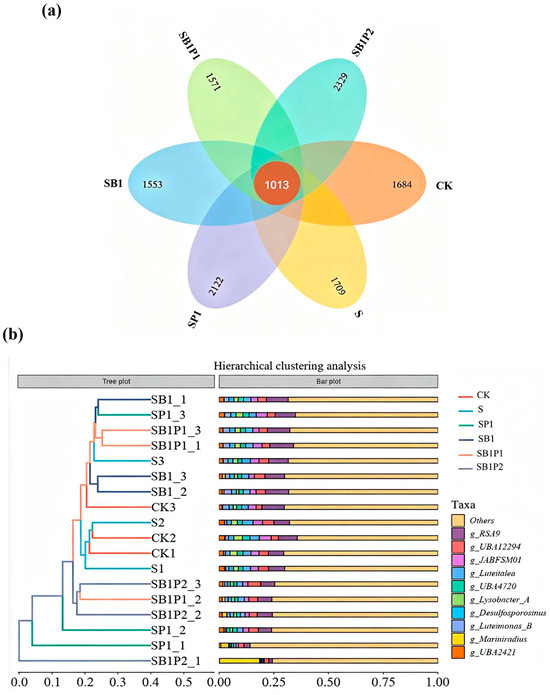
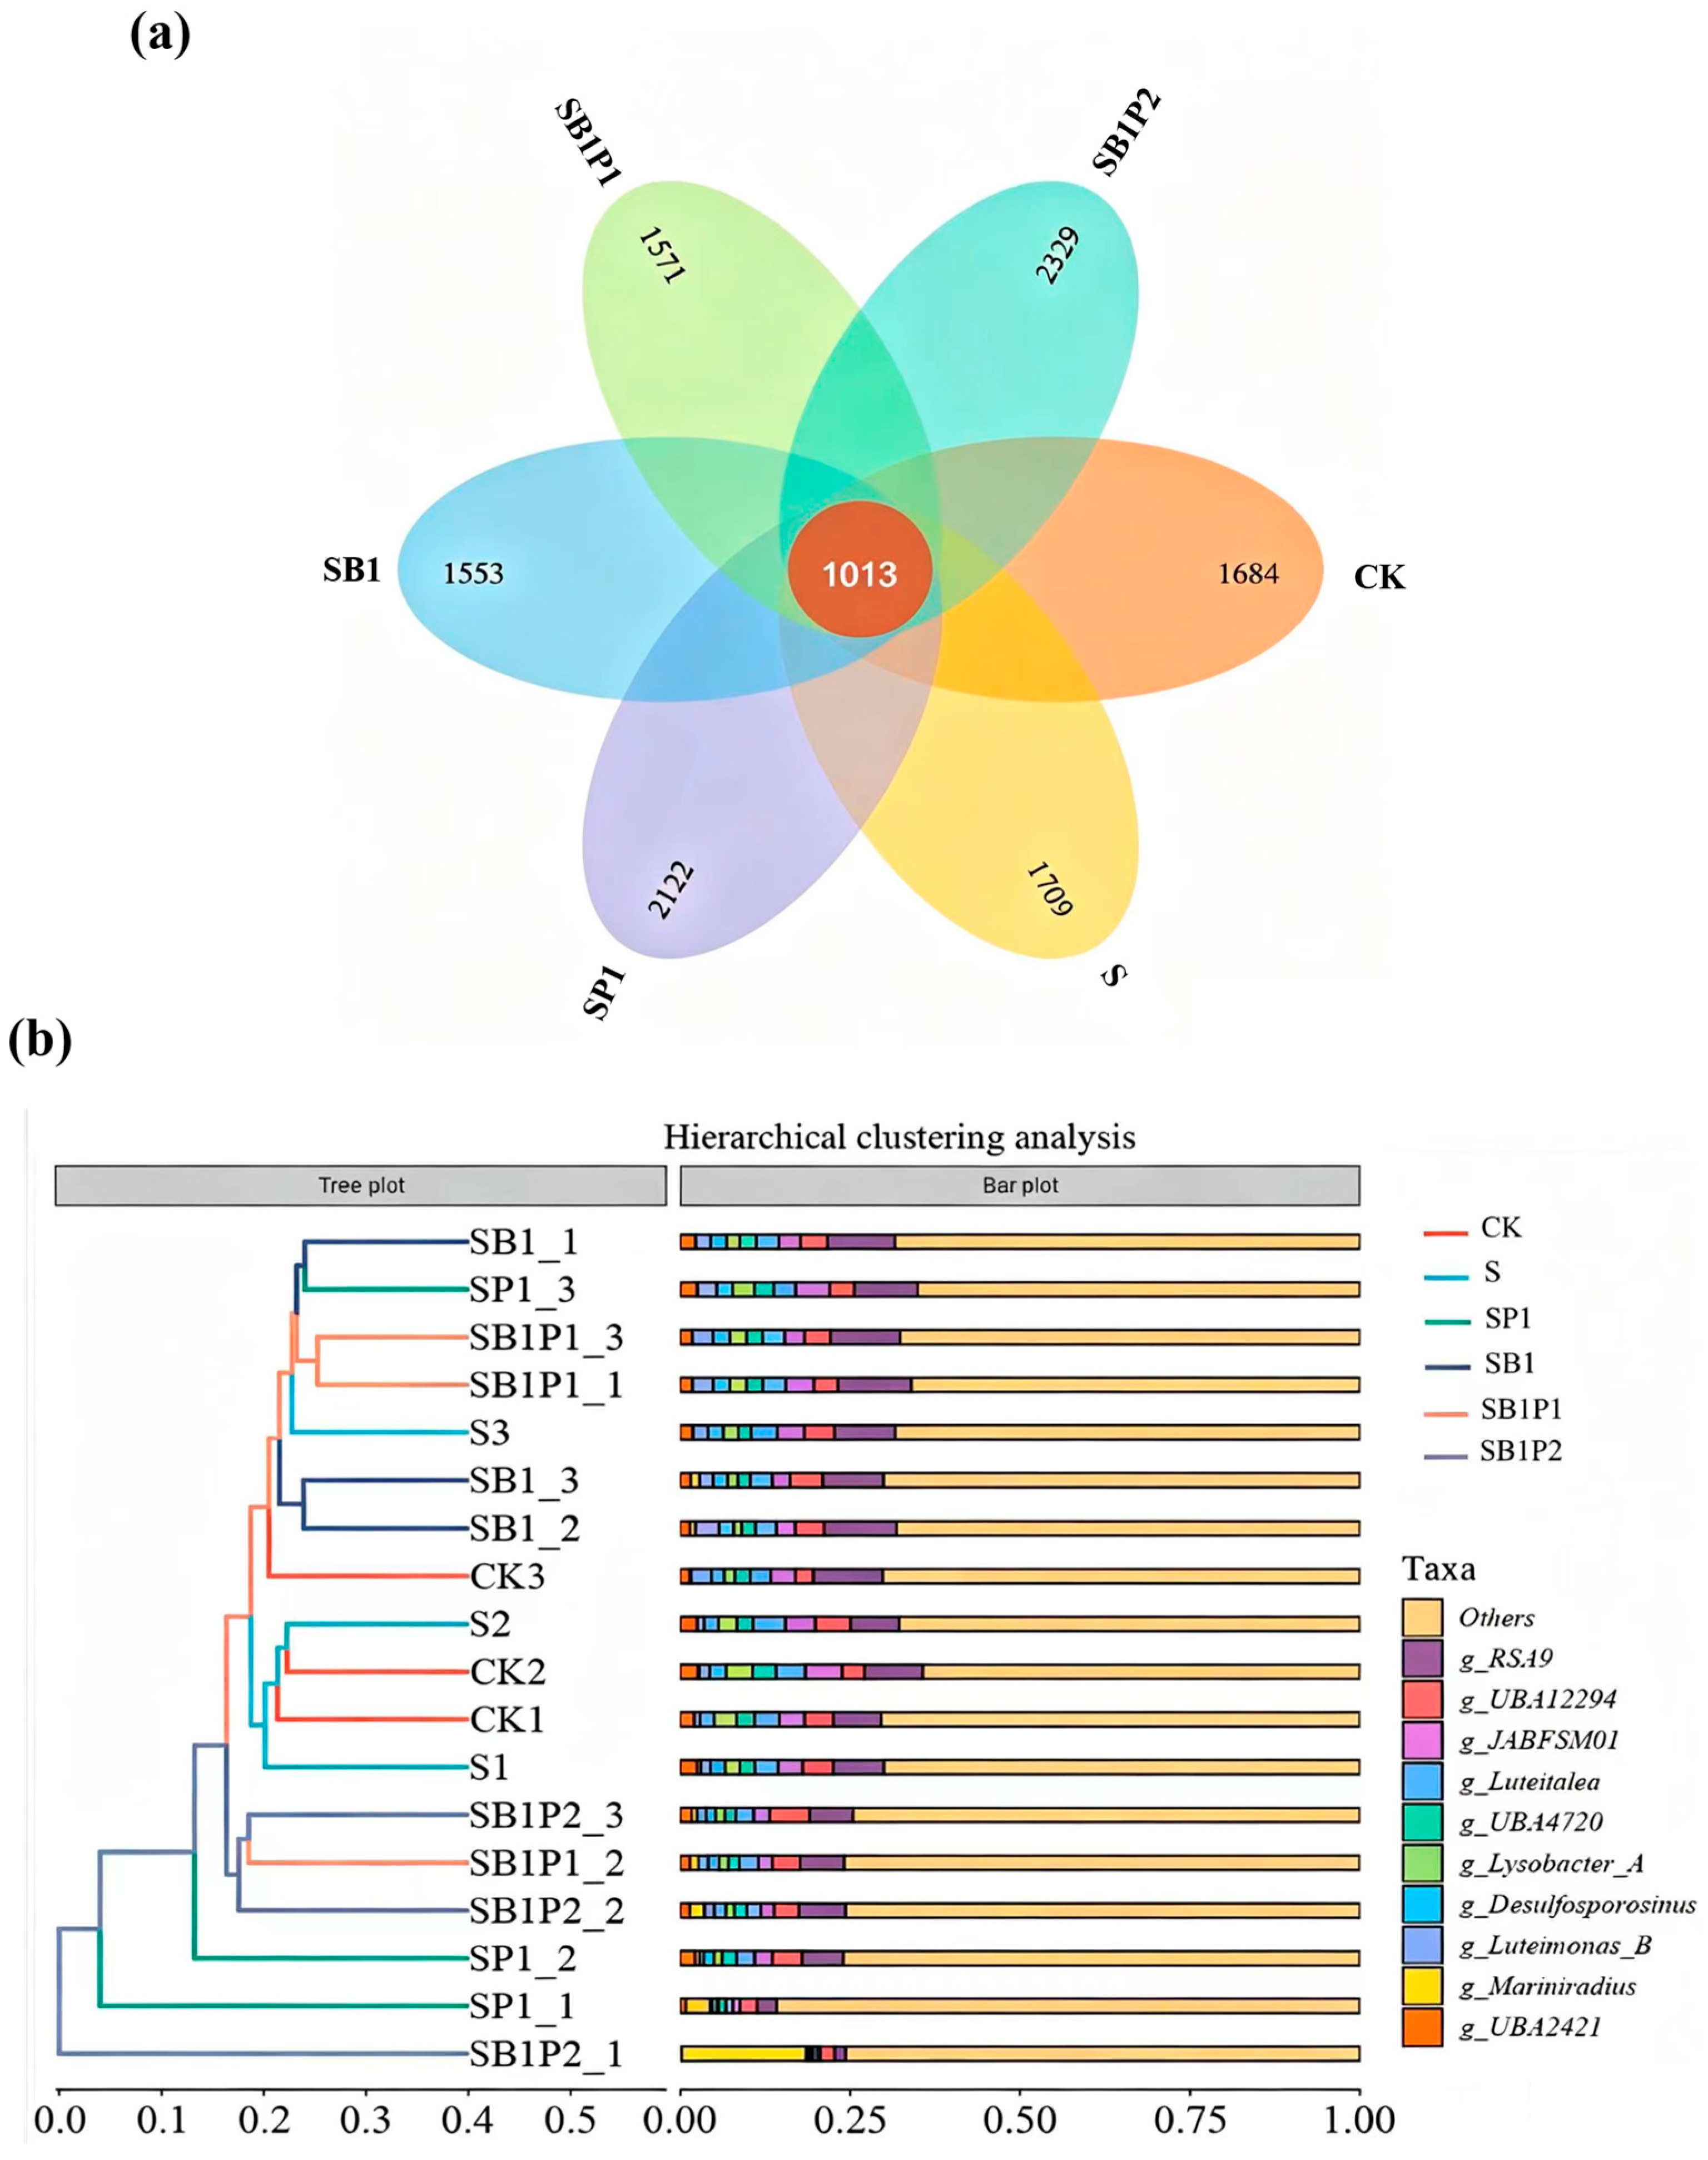
Alpha diversity indices (Chao1, Observed species, Shannon, and Faith_pd) are summarized in Table S3. Across all treatments, no significant differences were detected for any index, indicating that organic amendment applications had no notable effect on bacterial community richness or diversity in this study. The shared features of microbial taxa across six groups were further analyzed. A total of 1013 microbial taxa were found to be common to all six groups, suggesting that this core set of shared taxa forms the basic makeup of the microbial communities. The SP1 group had the highest number (3122) of unique taxa, indicating a high level of specificity in the microbial community of this group, possibly influenced by the straw and peat. The SB1P1 group had 1571 unique taxa, while the SB1 group had 1553, suggesting that, under straw and biochar conditions, these two groups may have evolved comparable sets of unique microbial taxa (Figure 8a).
Figure 8.
Effects of organic amendments on soil microbial structural characteristics. (a) Microbial communities share characteristics. Each color block represents a treatment, and the overlapping areas between the color blocks indicate the species shared by the corresponding treatments. The numbers in each block indicate the number of OTUs contained in that block. (b) The hierarchical clustering analysis of microbial community structure. In the figure, the left panel is a hierarchical clustering tree diagram, in which treatments are clustered based on their similarity to one another. The shorter the branch length between two treatments, the more similar they are. The right panel is a stacked bar chart showing the top 10 genera in terms of abundance.
The dendrogram of sample clustering showed that pairwise distances ranged from 0.0 to 0.5. SB1P1_1, SB1P1_3, and SB1P2_1 had relatively short distances between them, suggesting their microbial community compositions are fairly similar. In contrast, CK3 and S2 groups had relatively long clustering distances from others, indicating noticeably different community structures. The samples within the same group did not completely cluster together, indicating that there is also a certain degree of community heterogeneity even within groups. The bar plot displays the relative abundance of various microbial taxa at the genus level across samples. Taxa like Desulfosporinus, Lysobacter_A, and Mariniradius made up a relatively large share in certain samples, marking them as dominant groups. Other taxa, such as RSA9 and UBA12294, stayed low in abundance across most samples and qualified as rare groups (Figure 8b and Figure S4).
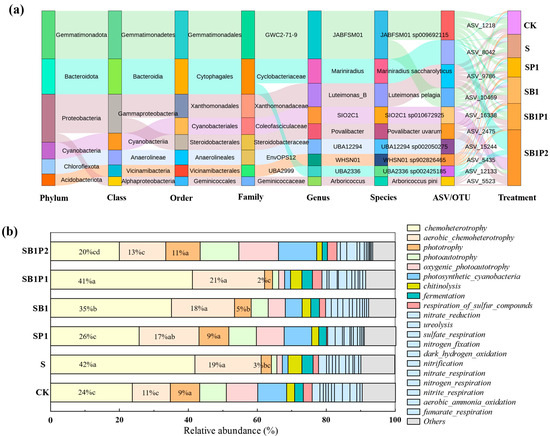
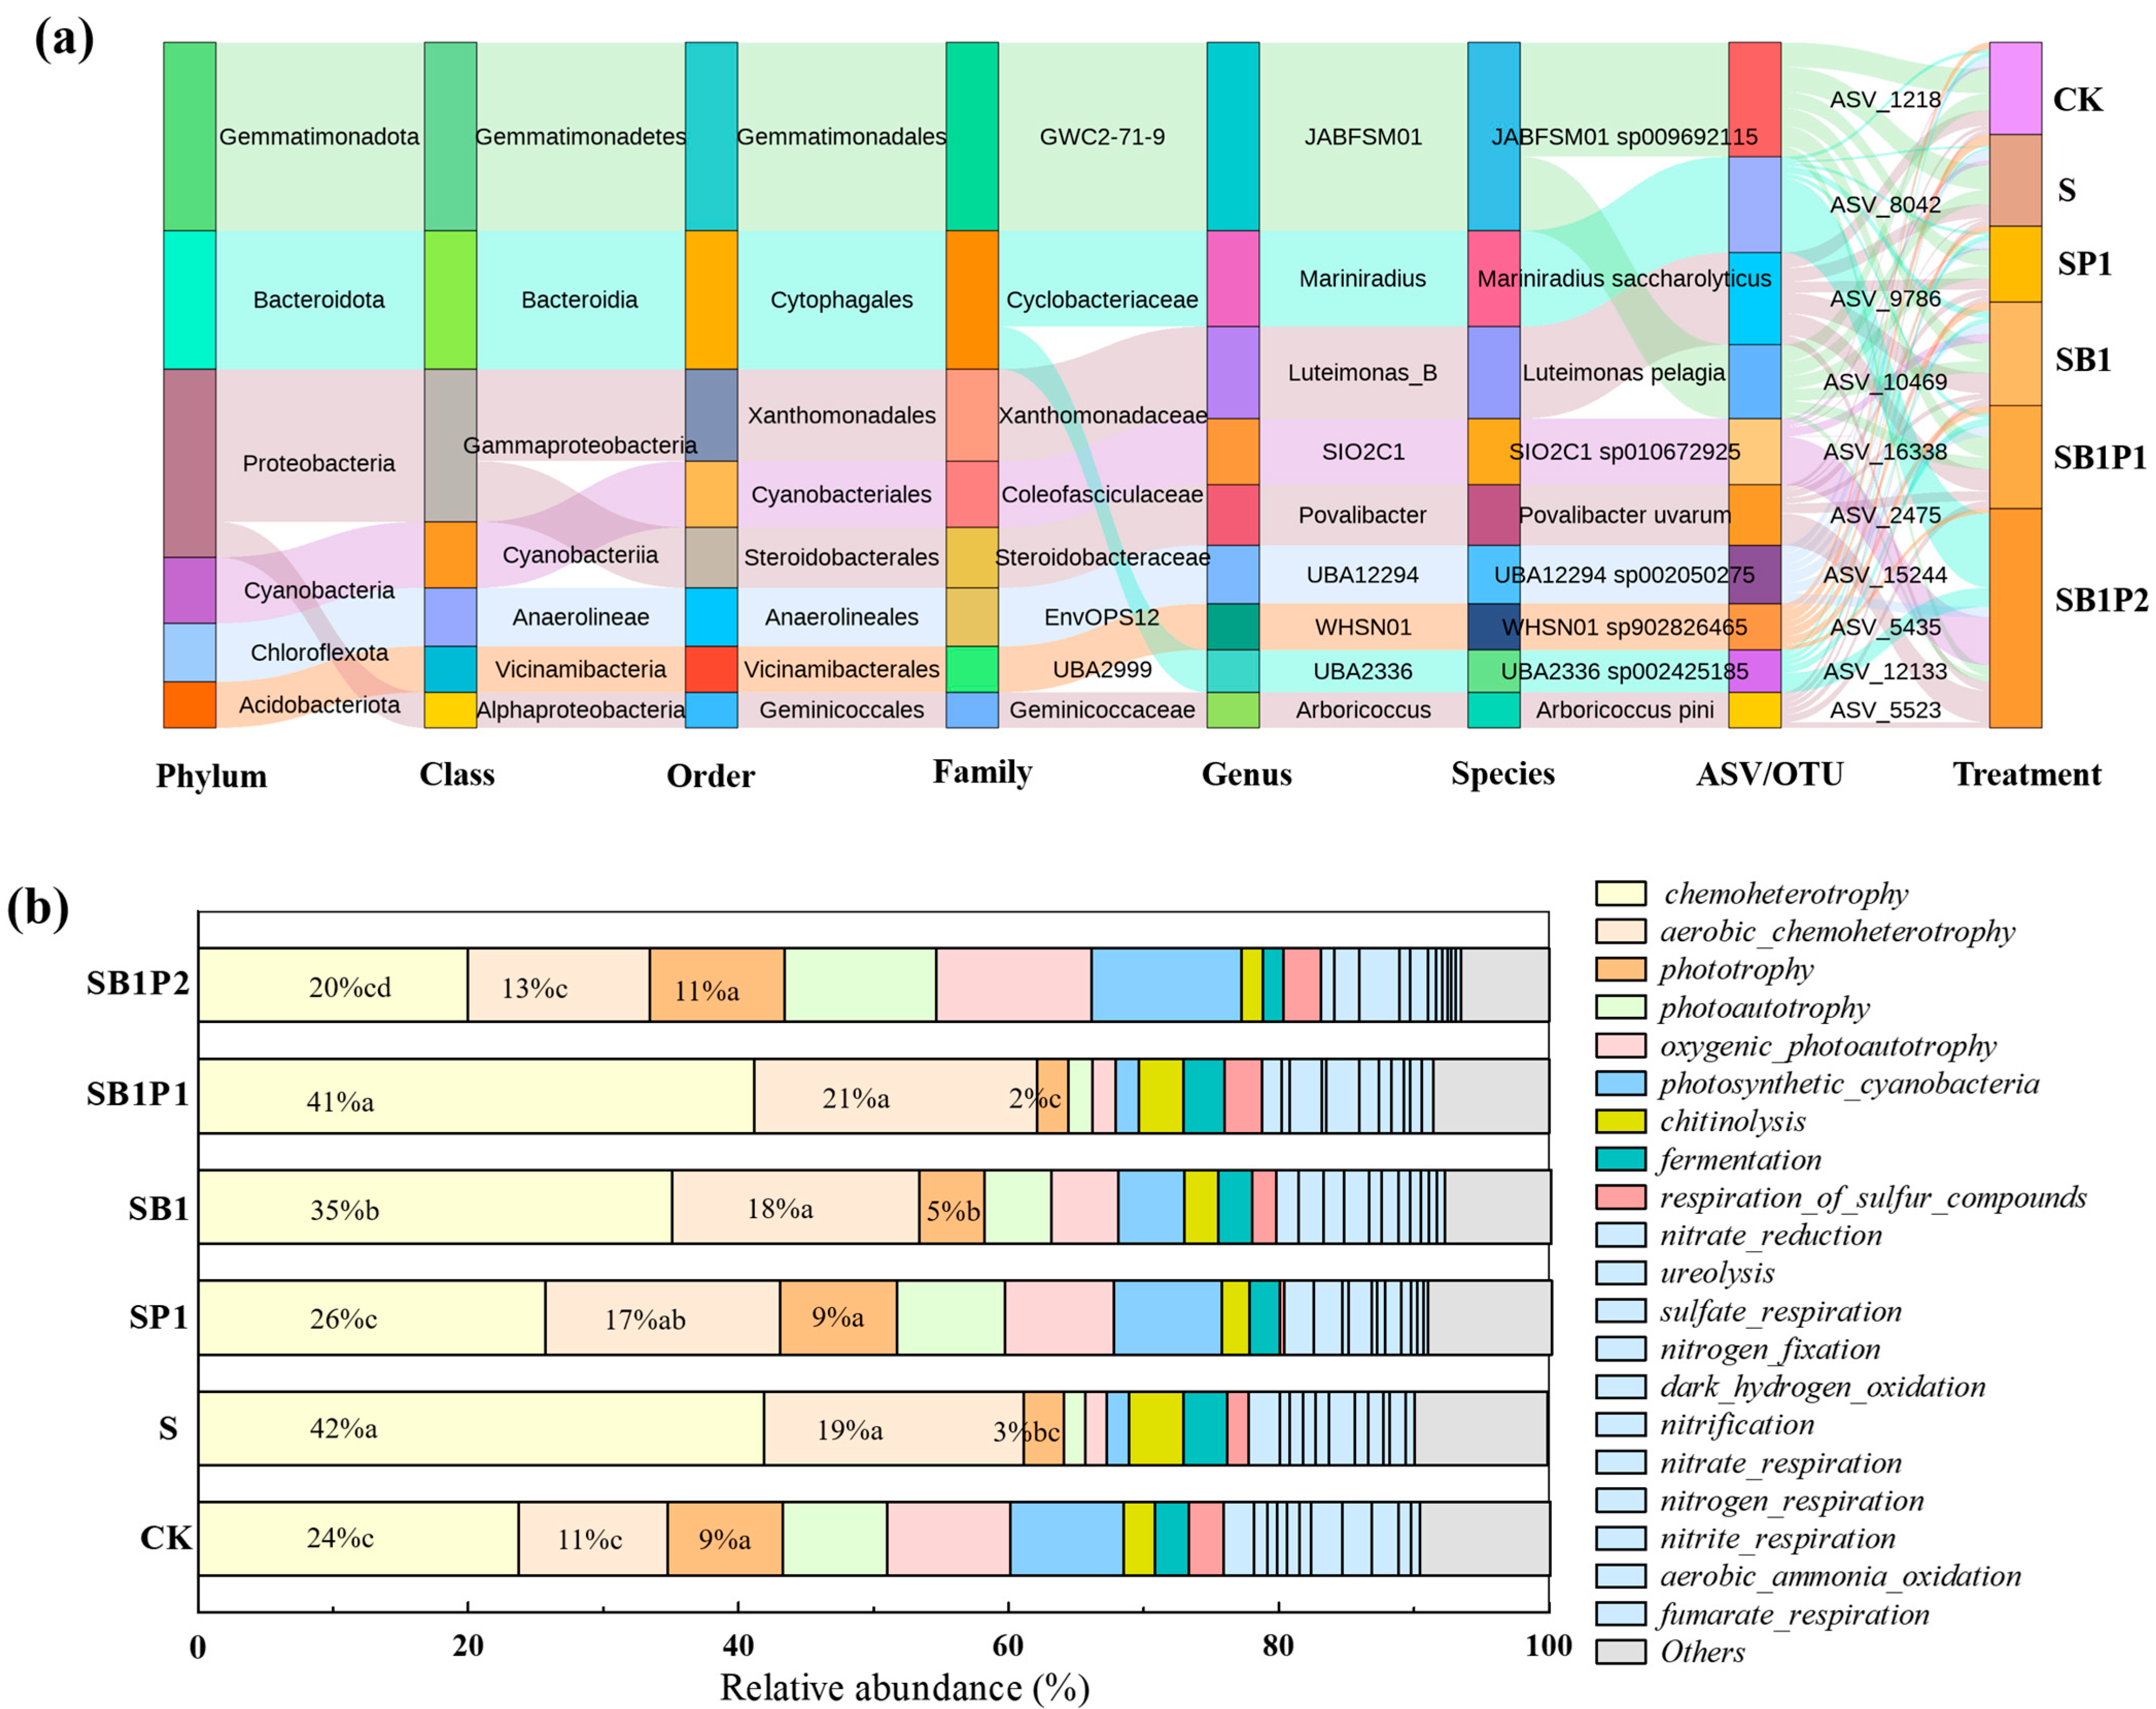
The phylogenetic distribution of dominant microbial taxa across taxonomic levels, from phylum down to species, was analyzed and showed that dominant taxa in each group spanned several phylogenetic branches. In CK, the dominant taxon was JABFSM01 sp009692115, belonging to the phylum Gemmatimonadota, class Gemmatimonadetes, order Gemmatimonadales, family GWC2-71-9, and genus JABFSM01. For the S group, it was Mariniradius saccharolyticus from the phylum Bacteroidota, class Bacteroidia, order Cytophagales, family Cyclobacteriaceae, and genus Mariniradius. In the SP1 group, the dominant taxon was Luteimonas pelagia from the phylum Proteobacteria, class Gammaproteobacteria, order Xanthomonadales, family Xanthomonadaceae, and genus Luteimonas_B. Each organic amendment treatment also had its own exclusive dominant species. For instance, SB1 carried SIO2C1 sp010672925, SB1P1 had Povalibacter uvarum, and SB1P2 hosted Arboricoccus pini. These unique dominant taxa serve as key markers for distinguishing microbial communities across groups. Meanwhile, some taxa appeared in multiple groups. For instance, the phylum Proteobacteria showed up in SP1, SB1P1, and SB1P2. However, the community makeup at the genus and species levels still varied noticeably (Figure 9a).
Figure 9.
Effects of organic amendments on soil microbial diversity. (a) The phylogenetic characteristics of the dominant groups. The rightmost column denotes groups, whereas each column to the left corresponds to a distinct taxonomic rank. In the Sankey diagram, the connecting flows represent the membership or hierarchical inclusion relationships between linked entities. The line widths are variable and scaled proportionally to abundance, with broader lines indicating higher relative abundance. (b) The relative abundance of functional microorganisms. Different lowercase letters on the bars indicate significant differences of the relative abundance of chemoheterotrophy, aerobic_chemoheterotrophy, and phototrophy among treatments (p < 0.05; one-way ANOVA with Tukey HSD test).
The functional microbial analysis revealed that chemobacterotrophy, aerobic_chemobacterotrophy, phototrophy, photoautotrophy, oxygenic_photoautotrophy, and photosynthetic_cyanobacteria were the dominant metabolic types in all treatments. Chemobacterotrophy was much more abundant in groups S (42%), SB1 (35%), and SB1P (41%) than in the CK group (24%). Similarly, aerobic_chemobacterotrophy showed higher relative abundances in groups S (19%), SP1 (17%), SB1 (18%), and SB1P (21%) compared to CK (11%). Across the different treatment groups, the relative abundances of microbial groups primarily involved in nitrogen and sulfur cycling also varied significantly (Figure 9b).
3.7. Identification of the Relationship Among Soil Properties, Rice Nutrients and Yield
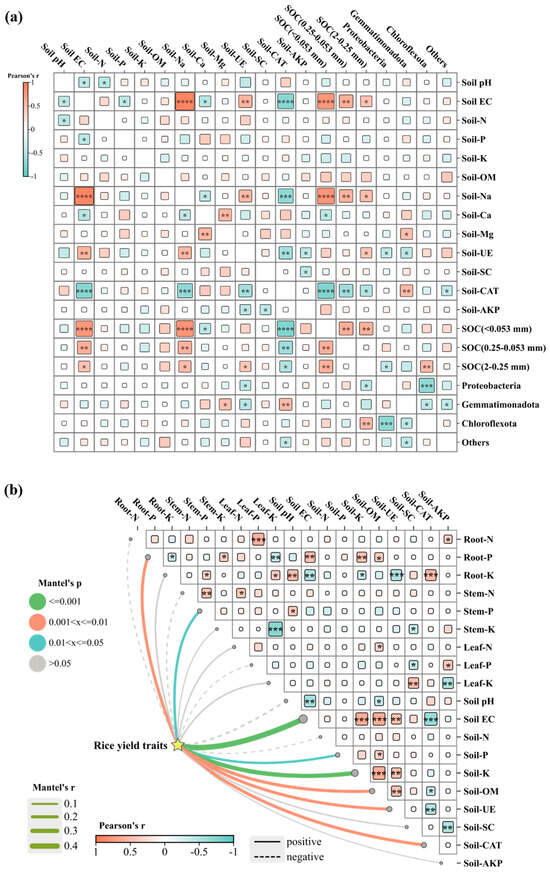
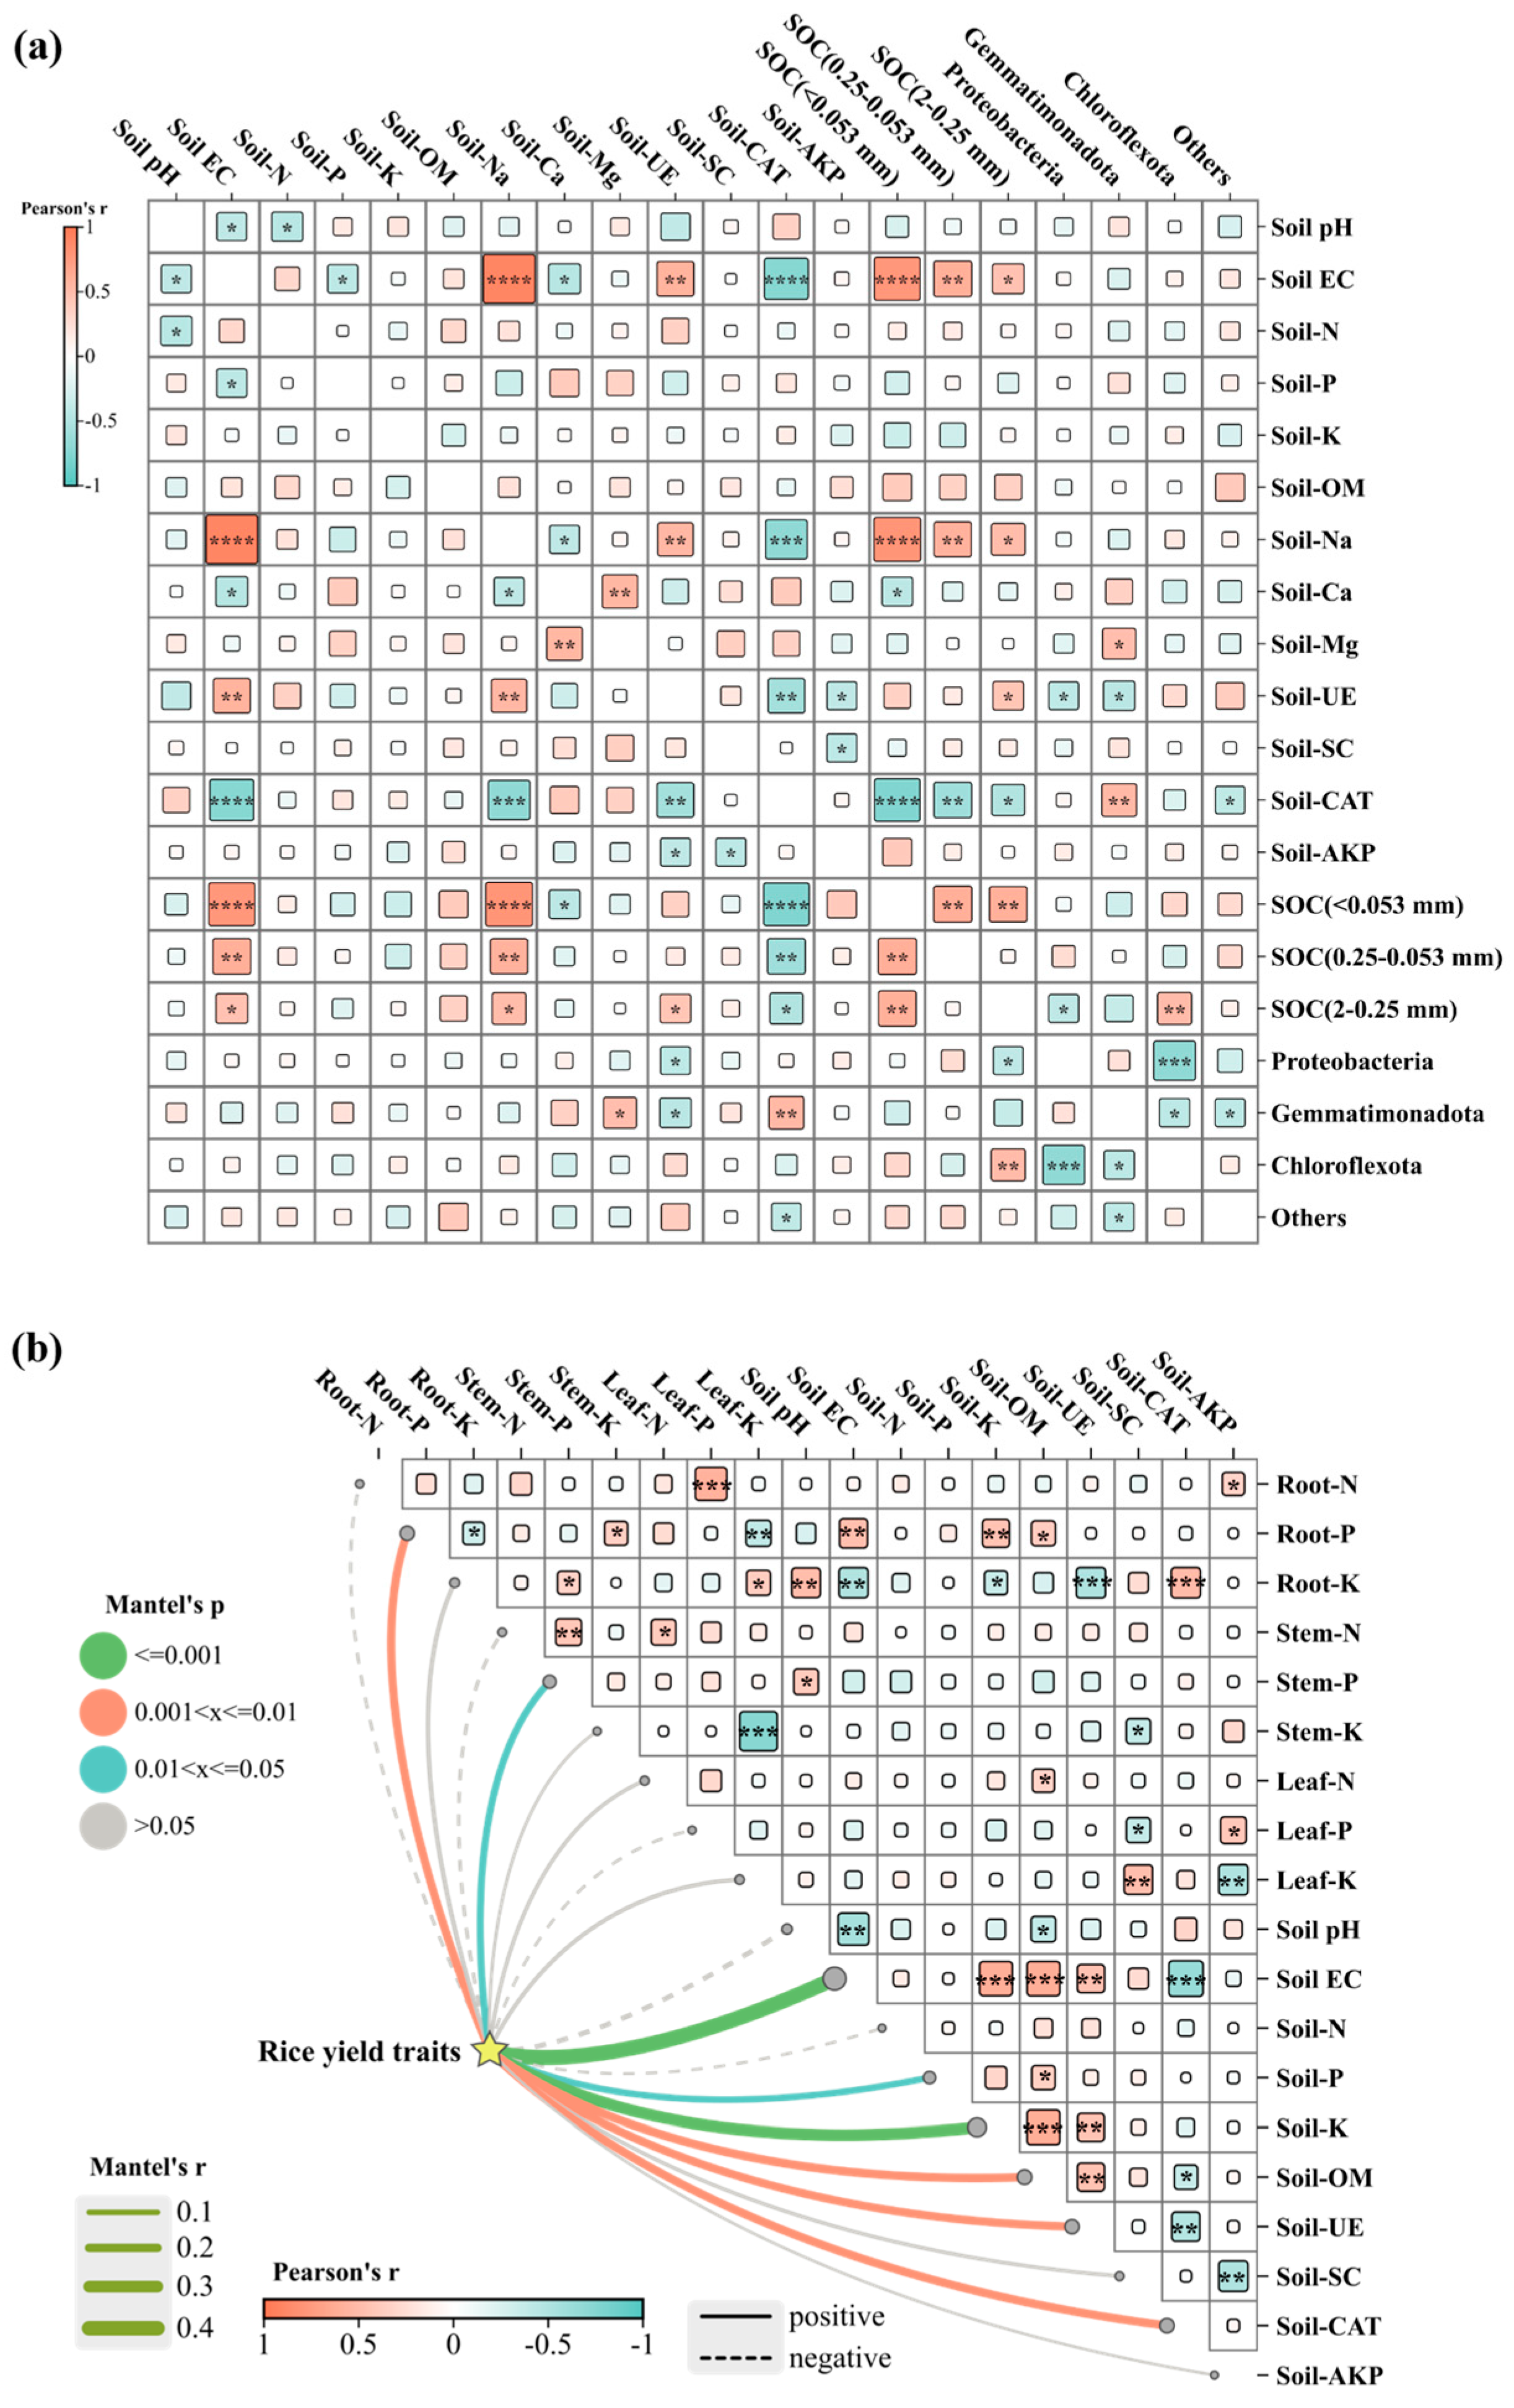
Spearman rank correlation was performed to evaluate the association between soil chemical properties and biological characteristics. As shown in Figure 10a, the soil Na content, urease enzyme activity, SOC of aggregates (0.25–2, 0.053–0.25, and <0.053 mm), and the soil EC were significantly positively correlated, while soil catalase enzyme activity is significantly negatively correlated with EC. There was also a significant positive correlation between the urease enzyme activity, SOC of aggregates (0.25–2, 0.053–0.25, and <0.053 mm), and soil Na content. However, the catalase enzyme activity was significantly negatively correlated with soil Na content. In addition, the activity of soil urease enzymes was significantly negatively correlated with catalase, alkaline phosphatase activity, and the phyla Proteobacteria and Gemmatimonadota. The activity of soil catalase had significant negative correlations with the aggregate SOC. SOC of <0.053 mm was positively correlated with SOC of 0.053–0.25 mm.
Figure 10.
Correlation analysis of soil environmental factors and rice indicators. (a) Pearson correlation analysis of soil variates. Prior to the analysis, variables with missing values were removed, and the normality of each variable was assessed using the Shapiro–Wilk test (p > 0.05) to justify the use of Pearson correlation. The resulting correlation matrix was visualized using the Chiplot online platform. Nodes represent soil variables, and edges represent significant Pearson correlations with solid red color indicating positive correlations and solid blue color indicating negative correlations. Edge thickness is proportional to the absolute correlation coefficient (|r|). Pearson’s r indicates the correlations among indicators (* p < 0.05; ** p < 0.01; *** p < 0.001; **** p < 0.0001). (b) Mantel test of the relationship between soil variates, rice growth indicators and rice yield. Mantel’s r indicates the strength of the correlation between the two matrixes. Mantel’s p < 0.05 indicates a significant correlation. Pearson’s r indicates the correlations among indicators (* p < 0.05; ** p < 0.01; *** p < 0.001).
We then performed a Mantel analysis to examine the connection between soil properties, plant nutrients, and rice yield (Figure 10b). The evaluation of rice yield traits was determined using Mantel’s r and Mantel’s p. We found that the rice yield was remarkably positively associated with soil catalase (r = 0.19, p = 0.008), urease (r = 0.18, p = 0.007), organic content (r = 0.19, p = 0.005), available K content (r = 0.30, p = 0.001), available P content (r = 0.13, p = 0.032), and soil EC (r = 0.41, p = 0.001). In addition, the P contents of rice stems (r = 0.15, p = 0.019) and roots (r = 0.18, p = 0.002) also had significant positive correlations with rice yield accumulation (Figure 10b). These results indicate that rice yield accumulation shows a relationship with soil properties and plant nutrient uptake that can be modulated by the external organic amendments.
4. Discussion
This study systematically investigated how different mixtures of straw, biochar, and peat affect the physical and chemical properties and biological characteristics of coastal saline–alkali soil, as well as rice growth, and several key observations emerged. In terms of the most important aspect of grain yield, applying straw alone significantly increased the yield by 52% over CK, whereas most composite treatments incorporating biochar or peat failed to provide additional benefits (Figure 1f). Biochar-based treatments were further accompanied by concurrent declines in plant height, panicle length, and thousand-grain weight (Figure 1a,d,e). At the plant ionic level, the combined treatments promoted Na+ accumulation while inhibiting K+ uptake. These results collectively reveal the core issue of this study: in the context of high salt content in coastal areas, the effects of organic amendments do not scale linearly with the increase in application amount or type, and the improvements in nutrient supply may be accompanied by parallel costs associated with salt input.
The reasons for the changes in rice yield and ion balance can be traced back to both the soil and plant levels. Soil EC and exchangeable Na+ content were significantly elevated by biochar and peat amendment, with maximum increases of 138.6% (SB3) and 101.4% (SB3P2), respectively, following a clear dose-dependent pattern (Figure 4b, Figure S1b and Figure 5a). This increase in soil EC was likely due in part to the direct input of water-soluble salts from the amendments, as both biochar and peat contained considerable ash with EC values of 7.73 and 1.40 mS cm−1, respectively, and K+ as the main soluble cations (Table S1). The alkaline functional groups on the biochar surface may have promoted Na+ desorption from soil colloids under high-pH conditions [30], partly accounting for the elevated soil Na+ content. Meanwhile, humic acids released from peat decomposition have been reported to possess a certain Na+-binding capacity [31]. Beyond ionic balance, the rise in soil salinity also poses potential threats to soil physical structure. Excessive Na+ is known to expand the diffuse double layers of soil colloids and increase inter-particle repulsion, thereby promoting microaggregate dispersion and reducing aggregate stability [32]. In contrast, multivalent cations such as Ca2+ and Mg2+ can act as cationic bridges that bind soil particles together and facilitate macroaggregate formation [33]. In this study, however, no significant changes in the MWD, GMD, and percentage of each aggregate were observed under the combined amendment treatments (Figure S2), suggesting that the structural buffering effect provided by Ca2+ and Mg2+ was insufficient to offset the destabilizing effect of Na+ on aggregates. Overall, the final soil particle size distribution likely reflects a net outcome of the interplay between salt-induced dispersion and cation-mediated stabilization.
The elevated soil salinity subsequently affected ion uptake in rice plants, as excess Na+ competitively occupied K+ uptake sites through non-selective cation channels or HKT transporters [34,35]. This was associated with the markedly decreased K+/Na+ ratio in rice roots, stems, and leaves with increasing amendment application (Figure 3c,f,i). Insufficient K+ supply can restrain Rubisco activation and stomatal regulation and weaken the SOS signaling pathway responsible for Na+ extrusion [34,36], ultimately posing a threat to rice productivity. Indeed, Mel et al. [37] reported that rice yield declines noticeably when the soil K+/Na+ ratio falls below 4, a threshold largely reached in our biochar-based treatments, which may help explain the synchronous reduction in rice yield. Notably, despite the yield reduction, leaf N content in SB3P2 reached 59.2 mg g−1, a 19.3% increase over CK, indicating that N acquisition was not limiting. This uncoupling between N accumulation and biomass production can be explained by our own physiological evidence. On one hand, the sharply decreased K+/Na+ ratio in plant tissues (Figure 3c,f,i) implies that ionic toxicity and K+-deficient impairments, such as reduced photosynthetic efficiency, may have constrained carbon assimilation [34,36], even when N was abundant. On the other hand, salt stress typically triggers an energy trade-off, whereby plants allocate a greater proportion of assimilated carbon and nitrogen toward osmotic adjustment rather than to structural growth [38]. Consequently, although N uptake remained adequate, a pattern consistent with “luxury uptake” under salt stress, the internal utilization efficiency of N was constrained by salinity-induced physiological bottlenecks [39].
Several previous field studies reported contrasting results, showing that biochar and peat amendments reduced soil Na+, plant Na+, and Na+/K+ ratio but significantly increased rice biomass and yield [14,40,41]. This discrepancy likely arises from the “closed system versus open system” paradigm. In our pot experiment, salt leaching was restricted, while relatively high amendment rates and short duration amplified the input of soluble salts from the amendments, causing root-zone Na+ accumulation and increased plant uptake. In contrast, under field conditions, leaching and dilution by rainfall/irrigation, combined with longer equilibration, allow biochar’s K+-promoting and Na+-adsorbing effects to fully manifest [40,41]. Thus, the opposing results are not contradictory but reflect differential expression of biochar’s mechanisms under different physical constraints. Consistent with numerous previous studies [16,42], straw return alone in this study significantly increased crop yield (Figure 1f), despite exerting only limited improvements in soil structure and nutrient content in this study (Figure 4 and Figure S2). This positive yield response may be attributed to straw’s sufficient supply of carbon and nitrogen nutrients [42], which allowed it to benefit crop growth without introducing the salt stress associated with biochar and peat. Beyond salinity, excessive amendment application may pose other environmental risks. Biochar’s effect on CH4 emissions in paddy soils is context-dependent, with most studies reporting reductions but some observing increases of up to 176% [43]. Biochar can also enhance short-term N immobilization, reducing crop N availability depending on feedstock type and rate [44]. Additionally, peat decomposition has been recognized as a previously overlooked source of long-term salinization in reclaimed agricultural soils [14]. These trade-offs should be carefully weighed when scaling up amendments to field applications.
The observed shifts in microbial communities were closely linked to amendment-induced changes in soil physicochemical properties. The enrichment of Proteobacteria under biochar-containing treatments (SB1P1, SB1) is consistent with recent findings that biochar promotes Proteobacteria and Bacteroidota by enhancing nutrient availability and reducing salt stress in the root zone [18]. The increase in heterotrophic metabolism from 24% in CK to 42% under straw treatment (S) corroborates reports that labile carbon inputs stimulate microbial activity and nutrient turnover [45]. Notably, the decline in catalase activity (12.4–59.7%), which correlated negatively with EC and Na+ (Figure 7c and Figure 10a), suggests salt-induced oxidative stress on soil microorganisms, consistent with studies showing that high salinity suppresses antioxidative enzyme systems [46]. The higher chemoheterotrophic abundance in amended groups (S, SB1, SB1P) indicates enhanced labile carbon availability from organic inputs, stimulating copiotrophic decomposers and potentially inducing positive priming effects on native SOM mineralization [45]. The increase in photoautotroph abundance by SB1P2 may be related to soil carbon sequestration and contribute minor autotrophic carbon inputs [47]. The putative functional shifts of the soil microbiome were based on 16S rRNA gene amplicon data and did not capture post-transcriptional regulation or actual enzymatic activity in situ. More importantly, the treatment-dependent shifts in N- and S-cycling guilds imply differential regulation of nutrient mobilization. These functional shifts collectively suggest that organic amendments modulate soil multifunctionality beyond simple carbon addition, with implications for both crop nutrition and greenhouse gas emissions. Mechanistically, these changes likely arise from altered substrate stoichiometry, pH modification, and rhizosphere interactions induced by the amendments, though definitive causal links require further functional validation.
Based on previous studies, it was found that soil aggregate-associated carbon stabilization is governed by three complementary mechanisms: physical protection within aggregates, chemical protection through organo-mineral associations, and inherent biochemical recalcitrance of organic materials [48]. In our study, biochar and peat addition likely contributed to carbon stabilization primarily through their intrinsic recalcitrant aromatic structures [47], rather than through promoting macroaggregate formation, consistent with our finding that aggregate stability indices (MWD, GMD) did not change significantly (Figure S2). The limited effect on physical protection may be attributed to the relatively short experimental duration and the stable nature of biochar and peat, which undergo slow decomposition and produce limited binding agents (e.g., polysaccharides) for aggregate cementation in the short term [47]. Thus, carbon stabilization in our system likely operates more through chemical and biochemical pathways than through aggregate physical protection, though long-term field validation is needed.
One more point to note is that the field application of biochar and peat requires consideration of economic and practical constraints. Qiu et al. [49] reported that diversified cropping (alfalfa–sweet potato rotation) combined with biochar application clearly increased economic benefits compared with traditional wheat–maize rotation in coastal saline–alkali soil. However, the high initial cost of biochar reduced short-term profitability, although the integrated system achieved an optimal balance among productivity, soil fertility, economic returns, and microbial diversity [49]. In assessing the economic benefits of using amendments for saline–alkali soil remediation, a comprehensive evaluation should consider the balance among transportation costs, feedstock availability, production energy consumption, application costs, and the resulting crop yield gains. Additionally, pot-scale results may not translate directly to fields due to environmental variability, underscoring the need for long-term field trials.
5. Conclusions
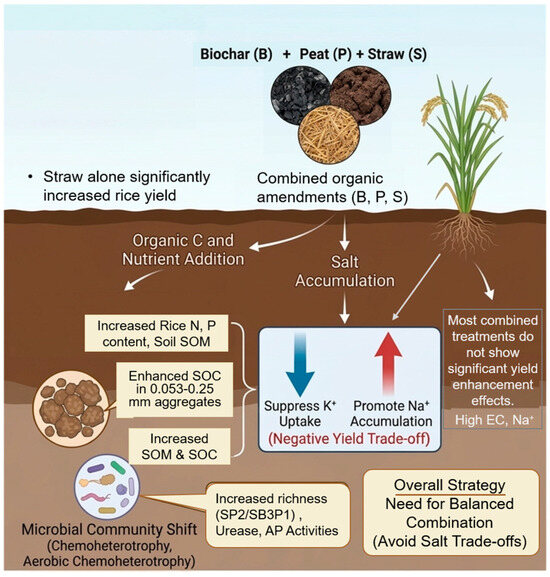
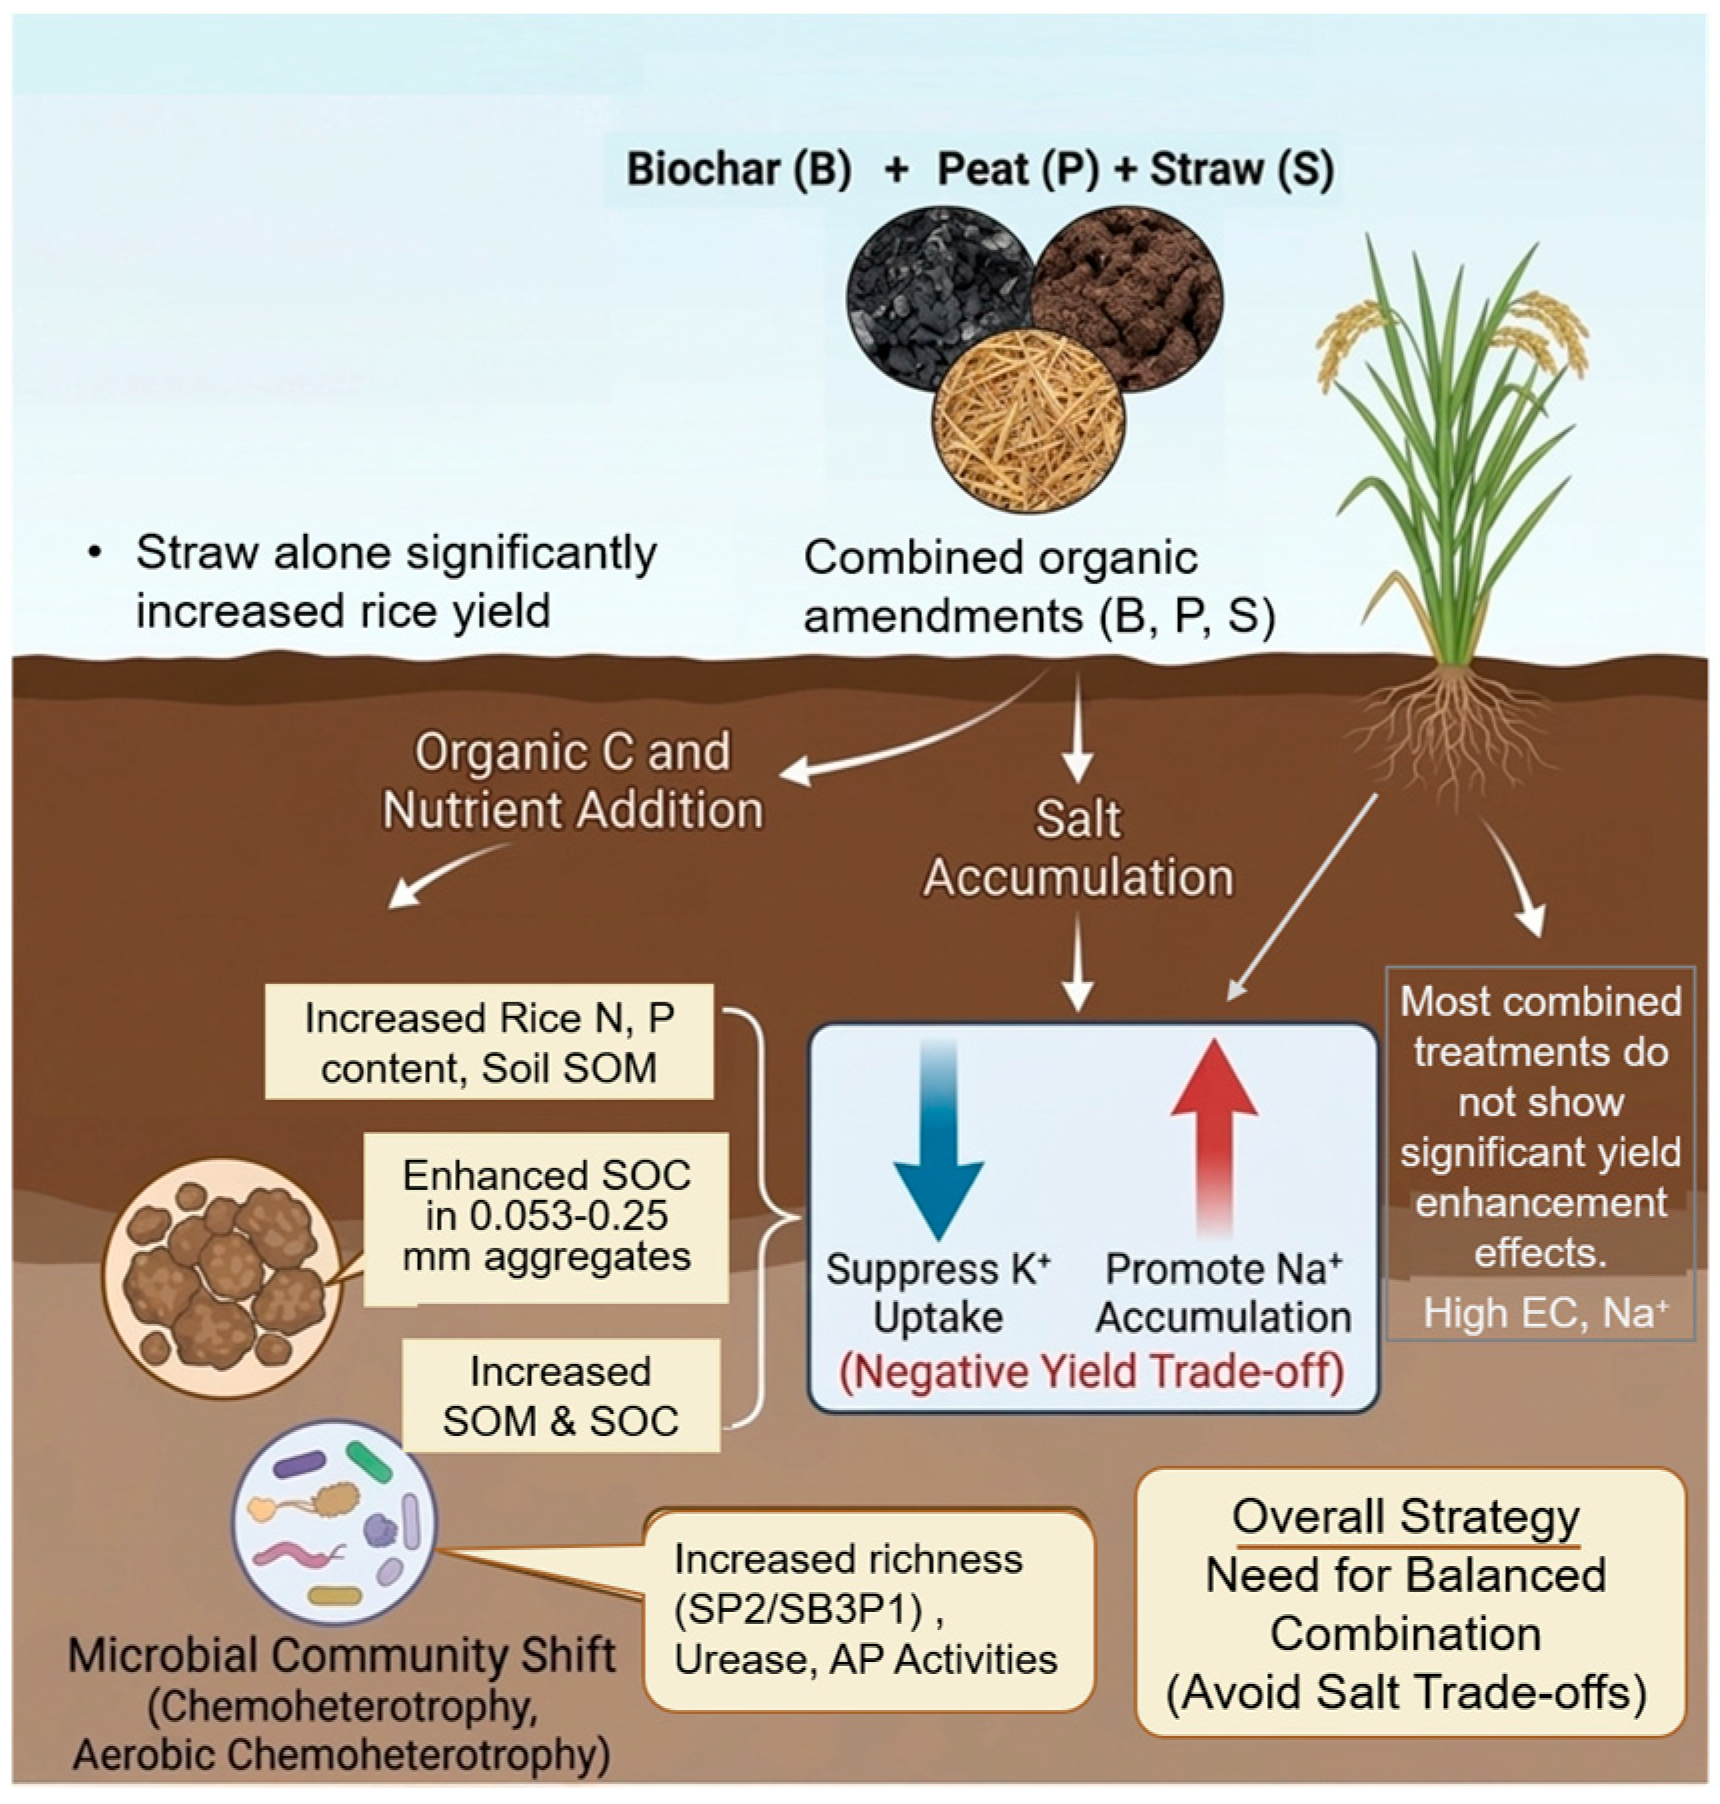
In conclusion, this study reveals a critical trade-off in the coastal saline–alkali rice system: although the combined application of biochar, peat, and straw effectively increased soil available potassium, organic matter, hydrolase activity, and plant nitrogen and phosphorus uptake, it simultaneously introduced additional salts that affected the yield improvement (Figure 11). This finding directly challenges the prevailing assumption that combined amendment application is invariably superior to single application. Our hypothesis that organic amendments can promote nutrient cycling was supported; however, the synergistic yield benefits of combined application were not statistically significant. This discrepancy underscores the necessity of re-evaluating amendment strategies in high-salt habitats, where salt stress may compromise the nutritional benefits. Our results suggest that practitioners should shift their focus from type combination to dosage precision, meaning that the background salt content and application rate of each organic material should serve as the primary screening criteria. We also acknowledge that our one-season dataset and the lack of cultivar-specific analyses limit the extrapolation of our conclusions. Nevertheless, the non-significant yield increase observed under combined treatments indicates that, in coastal saline–alkali soils, more complex amendment formulas do not guarantee better outcomes, and salt input deserves due attention.
Figure 11.
A schematic diagram illustrating the mechanisms of saline soil improvement. The red arrows in the picture indicate positive effects, while the blue arrows represent negative effects.
Supplementary Materials
The following supporting information can be downloaded at: https://www.mdpi.com/article/10.3390/agriculture16131434/s1, Figure S1: Effects of organic amendments on the basic properties of the soil during the tillering stage of rice; Figure S2: Impact of organic amendments on the soil mean weight diameter (MWD), geometric mean diameter (GMD), and the percentage of aggregates of each particle size; Figure S3: The top 10 microbial groups with the highest relative abundance in the phylum-level analysis; Figure S4: The top 10 microbial groups with the highest relative abundance in the genus-level analysis; Figure S5: The top 10 microbial groups with the highest relative abundance in the species-level analysis; Table S1: Amendments properties; Table S2: Statistical table of sequencing volume per sample; Table S3: Analysis of soil microbial alpha diversity.
Author Contributions
Conceptualization, X.F.; methodology, C.Y.; software, X.F. and C.Y.; validation, C.Y.; formal analysis, X.F.; investigation, C.Y. and Z.H.; data curation, X.F. and Z.H.; writing—original draft preparation, X.F.; writing—review and editing, Z.Y. and D.L.; visualization, X.F. and M.W.; supervision, D.L. and M.W.; project administration, D.L. and M.W.; funding acquisition, M.W. All authors have read and agreed to the published version of the manuscript.
Funding
This research was funded by the “San Nong Jiu Fang” Agricultural Science and Technology Cooperation Program Project of Zhejiang Province of China, grant number 2025SNJF100, and Natural Science Foundation of Zhejiang Province, grant number ZCLQN25C0302. The APC was funded by the “San Nong Jiu Fang” Agricultural Science and Technology Cooperation Program Project of Zhejiang Province of China, grant number 2025SNJF100.
Data Availability Statement
The authors confirm that the data supporting the findings of this study are available within the article.
Acknowledgments
During the preparation of this manuscript/study, the authors used the AI tool Deepseek (https://chat.deepseek.com/) for the purposes of revising English grammar, spelling, punctuation, and tense. The authors have reviewed and edited the output and take full responsibility for the content of this publication.
Conflicts of Interest
The authors declare no conflicts of interest.
References
- Hopmans, J.W.; Qureshi, A.S.; Kisekka, I.; Munns, R.; Grattan, S.R.; Rengasamy, P.; Ben-Gal, A.; Assouline, S.; Javaux, M.; Minhas, P.S.; et al. Critical knowledge gaps and research priorities in global soil salinity. In Advances in Agronomy; Academic Press: Cambridge, UK, 2021; Volume 169, pp. 1–191. [Google Scholar] [CrossRef] [Scilit]
- Han, Z.; Leng, Y.; Xu, Z.; Tu, L.; Wang, C.; Li, S.; Wu, S.; Huang, Y.; Liu, S.; Wang, J.; et al. Location-optimized remediation measures for soil multifunctionality and carbon sequestration of saline-alkali land in China. J. Clean. Prod. 2025, 519, 146017. [Google Scholar] [CrossRef] [Scilit]
- Sun, Q.; Chen, C.; Yao, Y.; Wu, H.; Zhang, M.; Jin, L.; Zhou, H.; Meng, T.; Peng, H. Soil properties of reclaimed coastal saline–alkali farmland in a Chinese Province: Spatial variability and soil profiles. Agriculture 2026, 16, 638. [Google Scholar] [CrossRef] [Scilit]
- Meng, Q.; Zhang, C.; Zhao, J.; Zhang, J.; Lu, Y.; Liu, F. Saline-alkali soil amelioration in China: A systematic review and evidence synthesis. Agric. Water Manag. 2026, 327, 110296. [Google Scholar] [CrossRef] [Scilit]
- Zhu, W.; Gu, S.; Jiang, R.; Zhang, X.; Hatano, R. Saline–alkali soil reclamation contributes to soil health improvement in China. Agriculture 2024, 14, 1210. [Google Scholar] [CrossRef] [Scilit]
- Arif, Y.; Singh, P.; Siddiqui, H.; Bajguz, A.; Hayat, S. Salinity induced physiological and biochemical changes in plants: An omic approach towards salt stress tolerance. Plant Physiol. Biochem. 2020, 156, 64–77. [Google Scholar] [CrossRef] [Scilit] [PubMed]
- Zhang, X.; Wang, Z.; Zhang, M.; Zhang, S.; Ma, R.; Wang, S. Mechanism and application of microbial amendments in saline–alkali soil restoration: A review. Agriculture 2026, 16, 452. [Google Scholar] [CrossRef] [Scilit]
- Ma, S.; Tang, T.; Du, C.; Yang, Z.; Gan, B. Engineering oilseed microbiome synergy for saline alkaline soil restoration. Plants 2025, 14, 2197. [Google Scholar] [CrossRef] [Scilit] [PubMed]
- Xu, X.; Guo, L.; Wang, S.; Wang, X.; Ren, M.; Zhao, P.; Huang, Z.; Jia, H.; Wang, J.; Lin, A. Effective strategies for reclamation of saline-alkali soil and response mechanisms of the soil-plant system. Sci. Total Environ. 2023, 905, 167179. [Google Scholar] [CrossRef] [Scilit] [PubMed]
- Liu, B.; Jia, P.; Zou, J.; Ren, H.; Xi, M.; Jiang, Z. Improving soil properties and Sesbania growth through combined organic amendment strategies in a coastal saline-alkali soil. J. Environ. Manag. 2025, 374, 124041. [Google Scholar] [CrossRef] [Scilit] [PubMed]
- Chen, X.; Liu, L.; Yang, Q.; Xu, H.; Shen, G.; Chen, Q. Optimizing biochar application rates to improve soil properties and crop growth in saline-alkali soil. Sustainability 2024, 16, 2523. [Google Scholar] [CrossRef] [Scilit]
- Zhao, W.; Zhou, Q.; Tian, Z.Z.; Cui, Y.T.; Liang, Y.; Wang, H.Y. Apply biochar to ameliorate soda saline-alkali land, improve soil function and increase corn nutrient availability in the Songnen Plain. Sci. Total Environ. 2020, 721, 137428. [Google Scholar] [CrossRef] [Scilit] [PubMed]
- Zhang, P.; Wang, Y.; Liu, F.D.; Jiao, L.; Xiao, H.; Dong, Y.C.; Sun, H.W. Research and application progress of biochar in amelioration of saline-alkali soil. In Biochar Today; IntechOpen: London, UK, 2025. [Google Scholar] [CrossRef] [Scilit]
- Zheng, Y.Y.; Yu, Z.H.; Zhang, J.B.; Zhang, C.Z.; Ma, D.H.; Chen, L.; Zhou, G.X. Decomposition characteristics of woody peat and its mixtures with liable organic materials in a newly reclaimed saline-alkali soil: A one-year incubation experiment. Pedosphere 2024, 34, 877–888. [Google Scholar] [CrossRef] [Scilit]
- Li, J.; Meng, X.; Chen, X. Differential pathways of distinct organic amendments in ameliorating the root zone environment of saline-alkali farmland: A case study of straw, biochar, and peat. Agriculture 2026, 16, 730. [Google Scholar] [CrossRef] [Scilit]
- Song, Y.; Gao, M.; Li, Z. Impacts of straw return methods on crop yield, soil organic matter, and salinity in saline-alkali land in North China. Field Crop. Res. 2025, 322, 109752. [Google Scholar] [CrossRef] [Scilit]
- Yang, M.; Yang, R.; Li, Y.; Pan, Y.; Sun, J.; Zhang, Z. Effects of different peat application methods on water and salt migration in a coastal saline soil. J. Soil Sci. Plant Nutr. 2022, 22, 791–800. [Google Scholar] [CrossRef] [Scilit]
- Wang, X.; Riaz, M.; Babar, S.; Eldesouki, Z.; Liu, B.; Xia, H.; Li, Y.; Wang, J.; Xia, X.; Jiang, C. Alterations in the composition and metabolite profiles of the saline-alkali soil microbial community through biochar application. J. Environ. Manag. 2024, 352, 120033. [Google Scholar] [CrossRef] [Scilit] [PubMed]
- Li, C.; Wang, Z.; Xu, Y.; Sun, J.; Ruan, X.; Mao, X.; Hu, X.; Liu, P. Analysis of the effect of modified biochar on saline–alkali soil remediation and crop growth. Sustainability 2023, 15, 5593. [Google Scholar] [CrossRef] [Scilit]
- Wang, Z.T.; Cai, C.N.; Zhou, L.; Chen, L.X.; Lv, P.P.; Li, J.M. Peat amendments mediated greenhouse gas emissions of saline-alkaline soil depends on halophytes-specific responses. Plant Soil 2025, 515, 2171–2186. [Google Scholar] [CrossRef]
- Yu, K.; Wang, Z.; Yang, W.; Li, S.; Wu, D.; Zheng, H.; Ye, Z.; Yang, S.; Liu, D. Application of biochar-immobilized Bacillus megaterium for enhancing phosphorus uptake and growth in Rice. Plants 2025, 14, 214. [Google Scholar] [CrossRef] [Scilit] [PubMed]
- Lu, G.N.; Tian, H.X.; Tan, X.P.; Megharaj, M.; He, Y.K.; He, W.X. Distribution of soil nutrients and enzyme activities in different aggregates under two sieving methods. Soil Sci. Soc. Am. J. 2020, 84, 331–344. [Google Scholar] [CrossRef] [Scilit]
- Kemper, W.D.; Chepil, W.S. Size distribution of aggregates. In Methods of Soil Analysis, Part 1; Black, C.A., Ed.; American Society of Agronomy: Madison, WI, USA, 1965; pp. 499–510. [Google Scholar] [CrossRef] [Scilit]
- Bolyen, E.; Rideout, J.R.; Dillon, M.R.; Bokulich, N.A.; Abnet, C.; Al-Ghalith, G.A.; Alexander, H.; Alm, E.J.; Arumugam, M.; Asnicar, F.; et al. QIIME 2: Reproducible, interactive, scalable, and extensible microbiome data science. PeerJ Prepr. 2018, 6, e27295v2. [Google Scholar] [CrossRef] [Scilit]
- MetaCyc. Available online: https://metacyc.org/ (accessed on 10 April 2026).
- KEGG. Available online: https://www.kegg.jp/ (accessed on 16 April 2026).
- Douglas, G.M.; Maffei, V.J.; Zaneveld, J.R.; Yurgel, S.N.; Brown, J.R.; Taylor, C.M.; Huttenhower, C.; Langille, M.G. PICRUSt2 for prediction of metagenome functions. Nat. Biotechnol. 2020, 38, 685–688. [Google Scholar] [CrossRef] [Scilit] [PubMed]
- Genes Cloud Platform. Available online: https://www.genescloud.cn/home (accessed on 6 April 2026).
- Chiplot. Available online: https://www.chiplot.online/ (accessed on 20 April 2026).
- Nurhafizah, M.D.; Akinnawo, O.O.; Abdullah, N.; Suriani, A.B. Influence of washing parameters on biomass and biochar properties of empty fruit bunches from oil palm plantation. Biomass Convers. Biorefin. 2025, 15, 6511–6524. [Google Scholar] [CrossRef] [Scilit]
- Moro, D.; Pellegrini, E.; Contin, M.; Zuccaccia, D.; Khakbaz, A.; De Nobili, M. The potential role of humic substances in the amelioration of saline soils and its affecting factors. Sustainability 2025, 17, 8621. [Google Scholar] [CrossRef] [Scilit]
- Zhang, X.; Han, Y.; Liu, Z. Progress towards the identification and improvement of dispersive soils: A review. Eur. J. Soil Sci. 2024, 75, e70002. [Google Scholar] [CrossRef] [Scilit]
- Ruiz, F.; Rumpel, C.; Silva, B.M.; de Camargo, P.B.; Ferreira, T.O. Soil organic matter stabilization during early stages of Technosol development from Ca, Mg and pyrite-rich parent material. Catena 2023, 232, 107435. [Google Scholar] [CrossRef] [Scilit]
- Fang, X.Z.; Liu, X.X.; Zhu, Y.X.; Ye, J.Y.; Jin, C.W. The K+ and NO3− interaction mediated by NITRATE TRANSPORTER1.1 ensures better plant growth under K+-limiting conditions. Plant Physiol. 2020, 184, 1900–1916. [Google Scholar] [CrossRef] [Scilit] [PubMed]
- Wang, J.; Luo, Y.; Ye, F.; Ding, Z.J.; Zheng, S.J.; Qiao, S.; Wang, Y.; Guo, J.T.; Yang, W.; Su, N.N. Structures and ion transport mechanisms of plant high-affinity potassium transporters. Mol. Plant 2024, 17, 409–422. [Google Scholar] [CrossRef] [Scilit] [PubMed]
- Chen, C.; He, G.; Li, J.; Perez-Hormaeche, J.; Becker, T.; Luo, M.; Wallrad, L.; Gao, J.P.; Li, J.; Pardo, J.M.; et al. A salt stress-activated GSO1-SOS2-SOS1 module protects the Arabidopsis root stem cell niche by enhancing sodium ion extrusion. EMBO J. 2023, 42, e2022113004. [Google Scholar] [CrossRef] [Scilit] [PubMed]
- Mel, V.C.; Bado, V.B.; Ndiaye, S.; Djaman, K.; Aissata Bama Nati, D.; Manneh, B.; Futakuchi, K. Predicting rice yield under salinity stress using K/Na ratio variable in plant tissue. Commun. Soil Sci. Plant Anal. 2019, 50, 1321–1329. [Google Scholar] [CrossRef] [Scilit]
- Munns, R.; Passioura, J.B.; Colmer, T.D.; Byrt, C.S. Osmotic adjustment and energy limitations to plant growth in saline soil. New Phytol. 2020, 225, 1091–1096. [Google Scholar] [CrossRef] [Scilit] [PubMed]
- Wang, Z.; Tian, M.; Wang, Y.; Chen, S.; Fang, H.; Hamoud, Y.A.; Hong, C.; Wang, Y.; Liu, J.; Shaghaleh, H. Vertical non-uniform distribution of soil salinity enhances nitrogen utilization efficiency and influences δ15N distribution in tomato plants. Environ. Exp. Bot. 2024, 226, 105911. [Google Scholar] [CrossRef] [Scilit]
- Li, X.; Che, W.; Piao, J.; Song, Y.; Wang, X.; Zhang, Y.; Miao, S.; Wang, H.; Xie, L.; Sun, J.; et al. Biochar increases rice yield in Soda Saline-Alkali paddy fields by improving saline-alkali stress and phosphorus use efficiency. Agronomy 2024, 14, 2159. [Google Scholar] [CrossRef] [Scilit]
- Che, W.; Li, X.; Piao, J.; Zhang, Y.; Miao, S.; Wang, H.; Xie, L.; Jin, F. Biochar improves yield by reducing saline–alkaline stress, enhancing filling rate of rice in soda saline–alkaline paddy fields. Plants 2024, 13, 2237. [Google Scholar] [CrossRef] [Scilit] [PubMed]
- Liu, R.; Tang, M.; Luo, Z.; Zhang, C.; Liao, C.; Feng, S. Straw returning proves advantageous for regulating water and salt levels, facilitating nutrient accumulation, and promoting crop growth in coastal saline soils. Agronomy 2024, 14, 1196. [Google Scholar] [CrossRef] [Scilit]
- Sun, Y.; Wang, X.; Yang, C.; Xin, X.; Zheng, J.; Zong, T.; Dou, C. Effects of biochar on gaseous carbon and nitrogen emissions in paddy fields: A review. Agronomy 2024, 14, 1461. [Google Scholar] [CrossRef] [Scilit]
- Sheikhi, J.; Hosseini, H.M.; Etesami, H.; Majidi, A. Biochar versus crop residues: Modulating net nitrogen mineralization-immobilization. J. Soil Sci. Plant Nutr. 2024, 24, 1150–1162. [Google Scholar] [CrossRef] [Scilit]
- Zhao, C.R.; Sun, N.; Chen, N.; Liu, T.; Feng, C.P. Unraveling the synergistic interplay of sulfur and wheat straw in heterotrophic-autotrophic denitrification for sustainable groundwater nitrate remediation. Environ. Res. 2024, 263, 120166. [Google Scholar] [CrossRef] [Scilit] [PubMed]
- Guo, M.F.; Gao, J.Z.; Yang, M.; Liu, Y.W.; Fu, J.H.; Ma, R.; Xiong, F.; Zhang, T.Y.; Liu, X.S.; Jin, Y.; et al. Synergistic effects of PGPR and organic fertilizer on soil fertility, enzyme activities, and microbial community composition in saline-alkali rice systems. Appl. Soil Ecol. 2025, 213, 106327. [Google Scholar] [CrossRef] [Scilit]
- Hamard, S.; Küttim, M.; Céréghino, R.; Jassey, V.E.J. Peatland microhabitat heterogeneity drives phototrophic microbe distribution and photosynthetic activity. J. Ecol. 2021, 109, 2475–2487. [Google Scholar] [CrossRef] [Scilit] [PubMed]
- Kerketta, N.; Goswami, P.; Roy, A. Understanding soil carbon durability: Influencing factors, stabilization mechanisms, and research challenges. Environ. Sustain. 2026, 9, 45–60. [Google Scholar] [CrossRef] [Scilit]
- Qiu, X.; Xu, C.; Yan, D.; Li, W.; Wang, J.; Yang, Z.; Yuan, J.; Ji, C.; Wang, J.; Zhang, Y. Diversified cropping combined with biochar application enhances soil fertility, biodiversity, and crop productivity in a coastal saline–alkali soil. Agriculture 2025, 15, 2492. [Google Scholar] [CrossRef] [Scilit]

Disclaimer/Publisher’s Note: The statements, opinions and data contained in all publications are solely those of the individual author(s) and contributor(s) and not of MDPI and/or the editor(s). MDPI and/or the editor(s) disclaim responsibility for any injury to people or property resulting from any ideas, methods, instructions or products referred to in the content. |
© 2026 by the authors. Licensee MDPI, Basel, Switzerland. This article is an open access article distributed under the terms and conditions of the Creative Commons Attribution (CC BY) license.