A Universal Maize Yield Estimation Framework: Integrating Multi-Dimensional Environmental Features to Mitigate the Impacts of Contrasting Inter-Annual Hydrothermal Variability


Abstract
1. Introduction
2. Materials and Methods
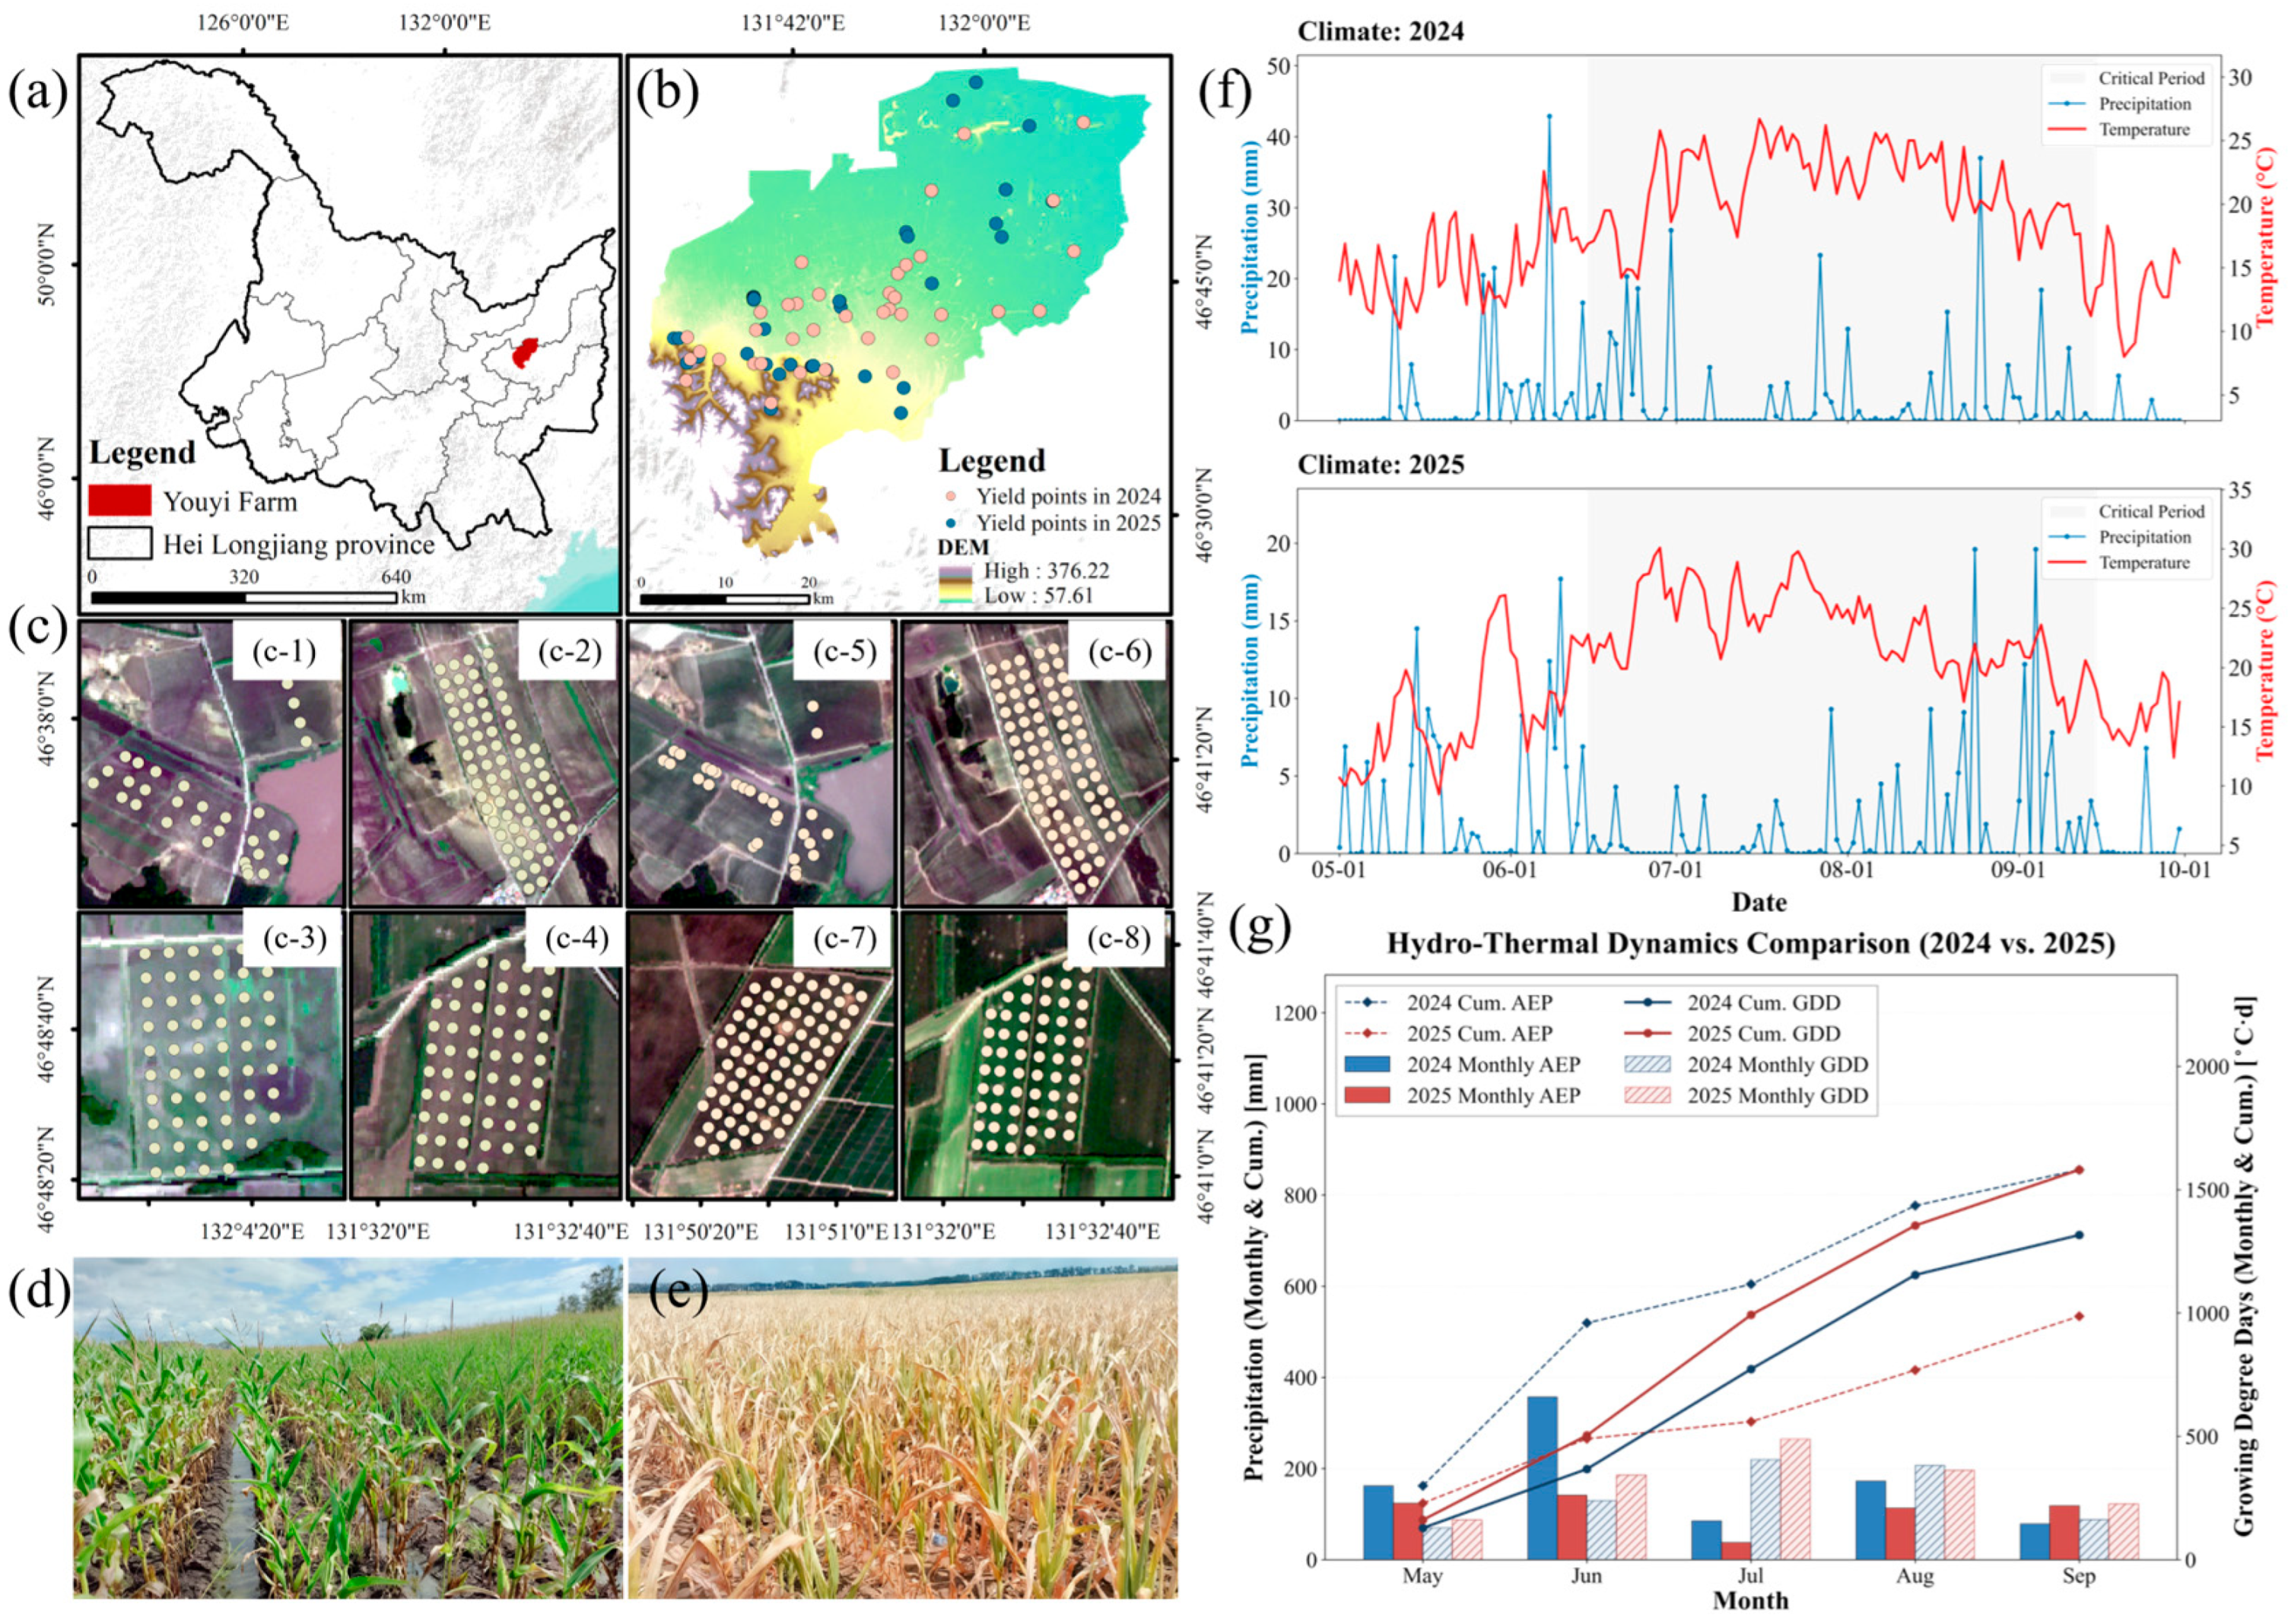
2.1. Study Area
2.2. Satellite Data Processing and Feature Engineering
2.2.1. Data Sources
2.2.2. Comprehensive Remote Sensing Indicators for Growth and Water Stress
2.2.3. Temporal Difference Feature Construction
2.2.4. Topographic and Soil Factor
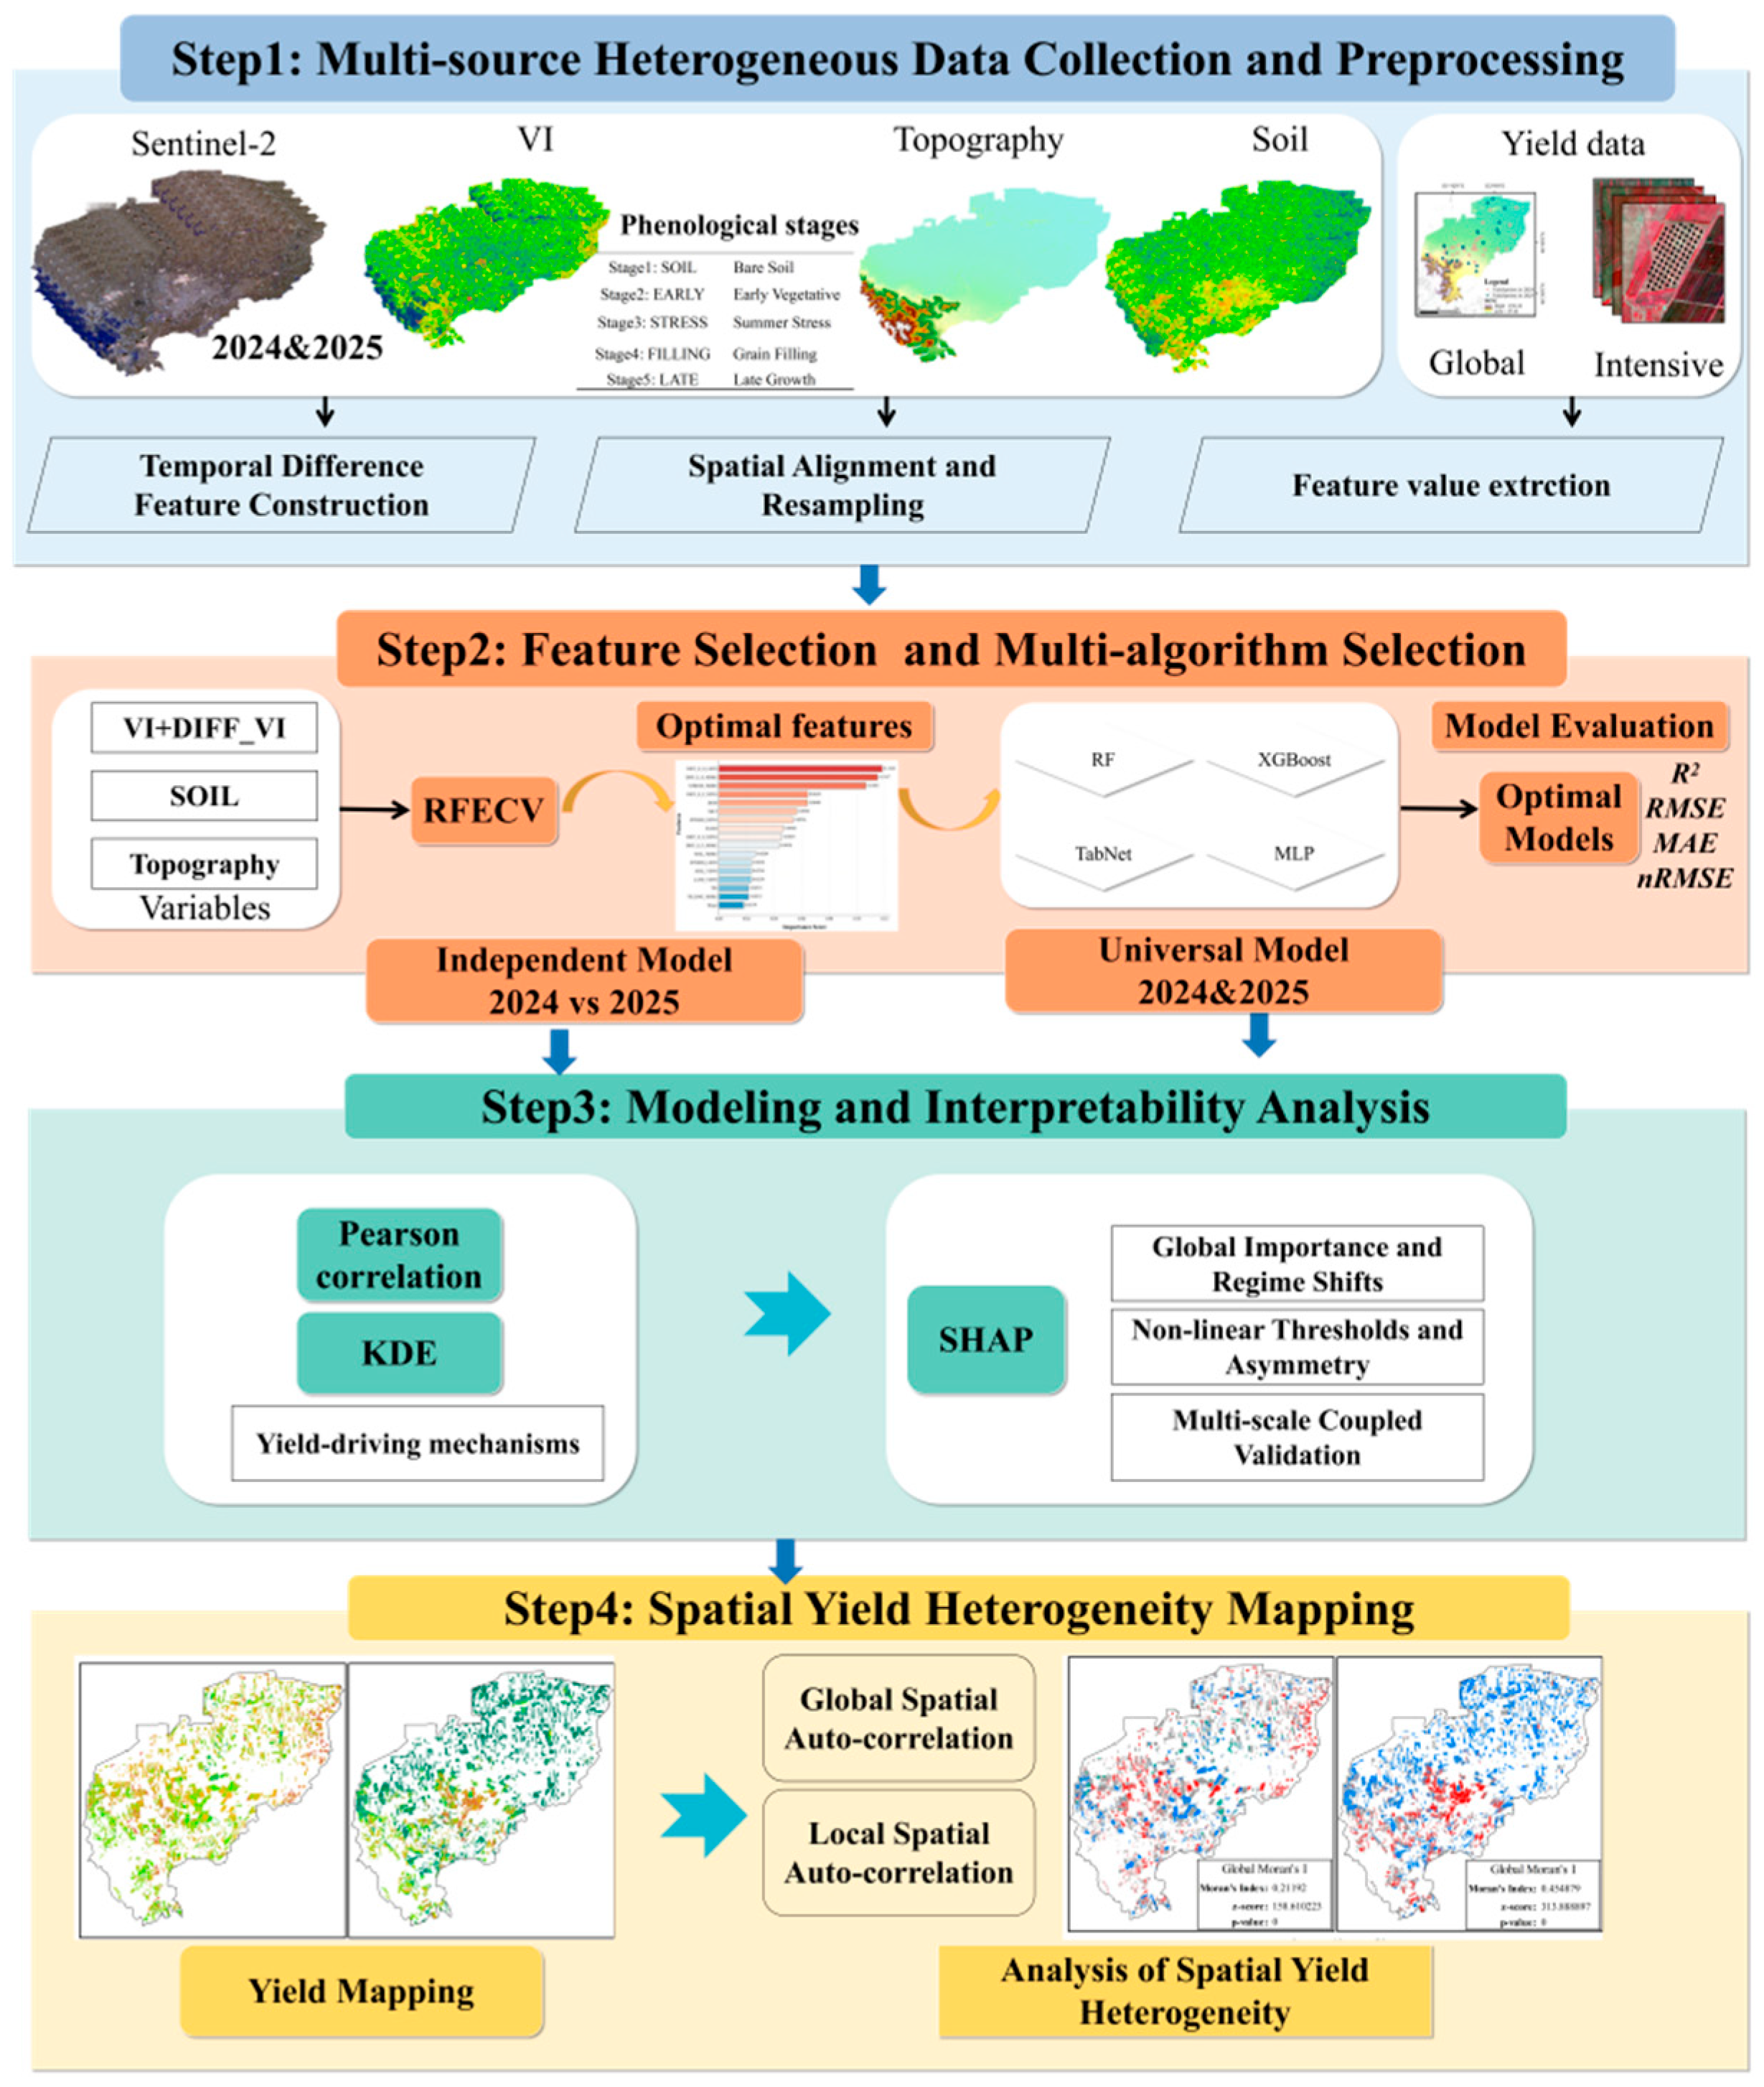
2.2.5. Overall Research Framework and Technical Workflow
2.3. Multi-Scale Data Synergy
2.3.1. Multi-Scale Sampling Design
2.3.2. Spatial Alignment and Resampling for Multi-Source Heterogeneous Data
2.3.3. Point-to-Area Scale Transformation Logic
2.4. Modeling and Interpretability Analysis
2.4.1. Feature Selection Strategy Based on Recursive Feature Elimination with Cross-Validation
2.4.2. Multi-Algorithm Selection and Cross-Annual Comparative Learning Design
- (1)
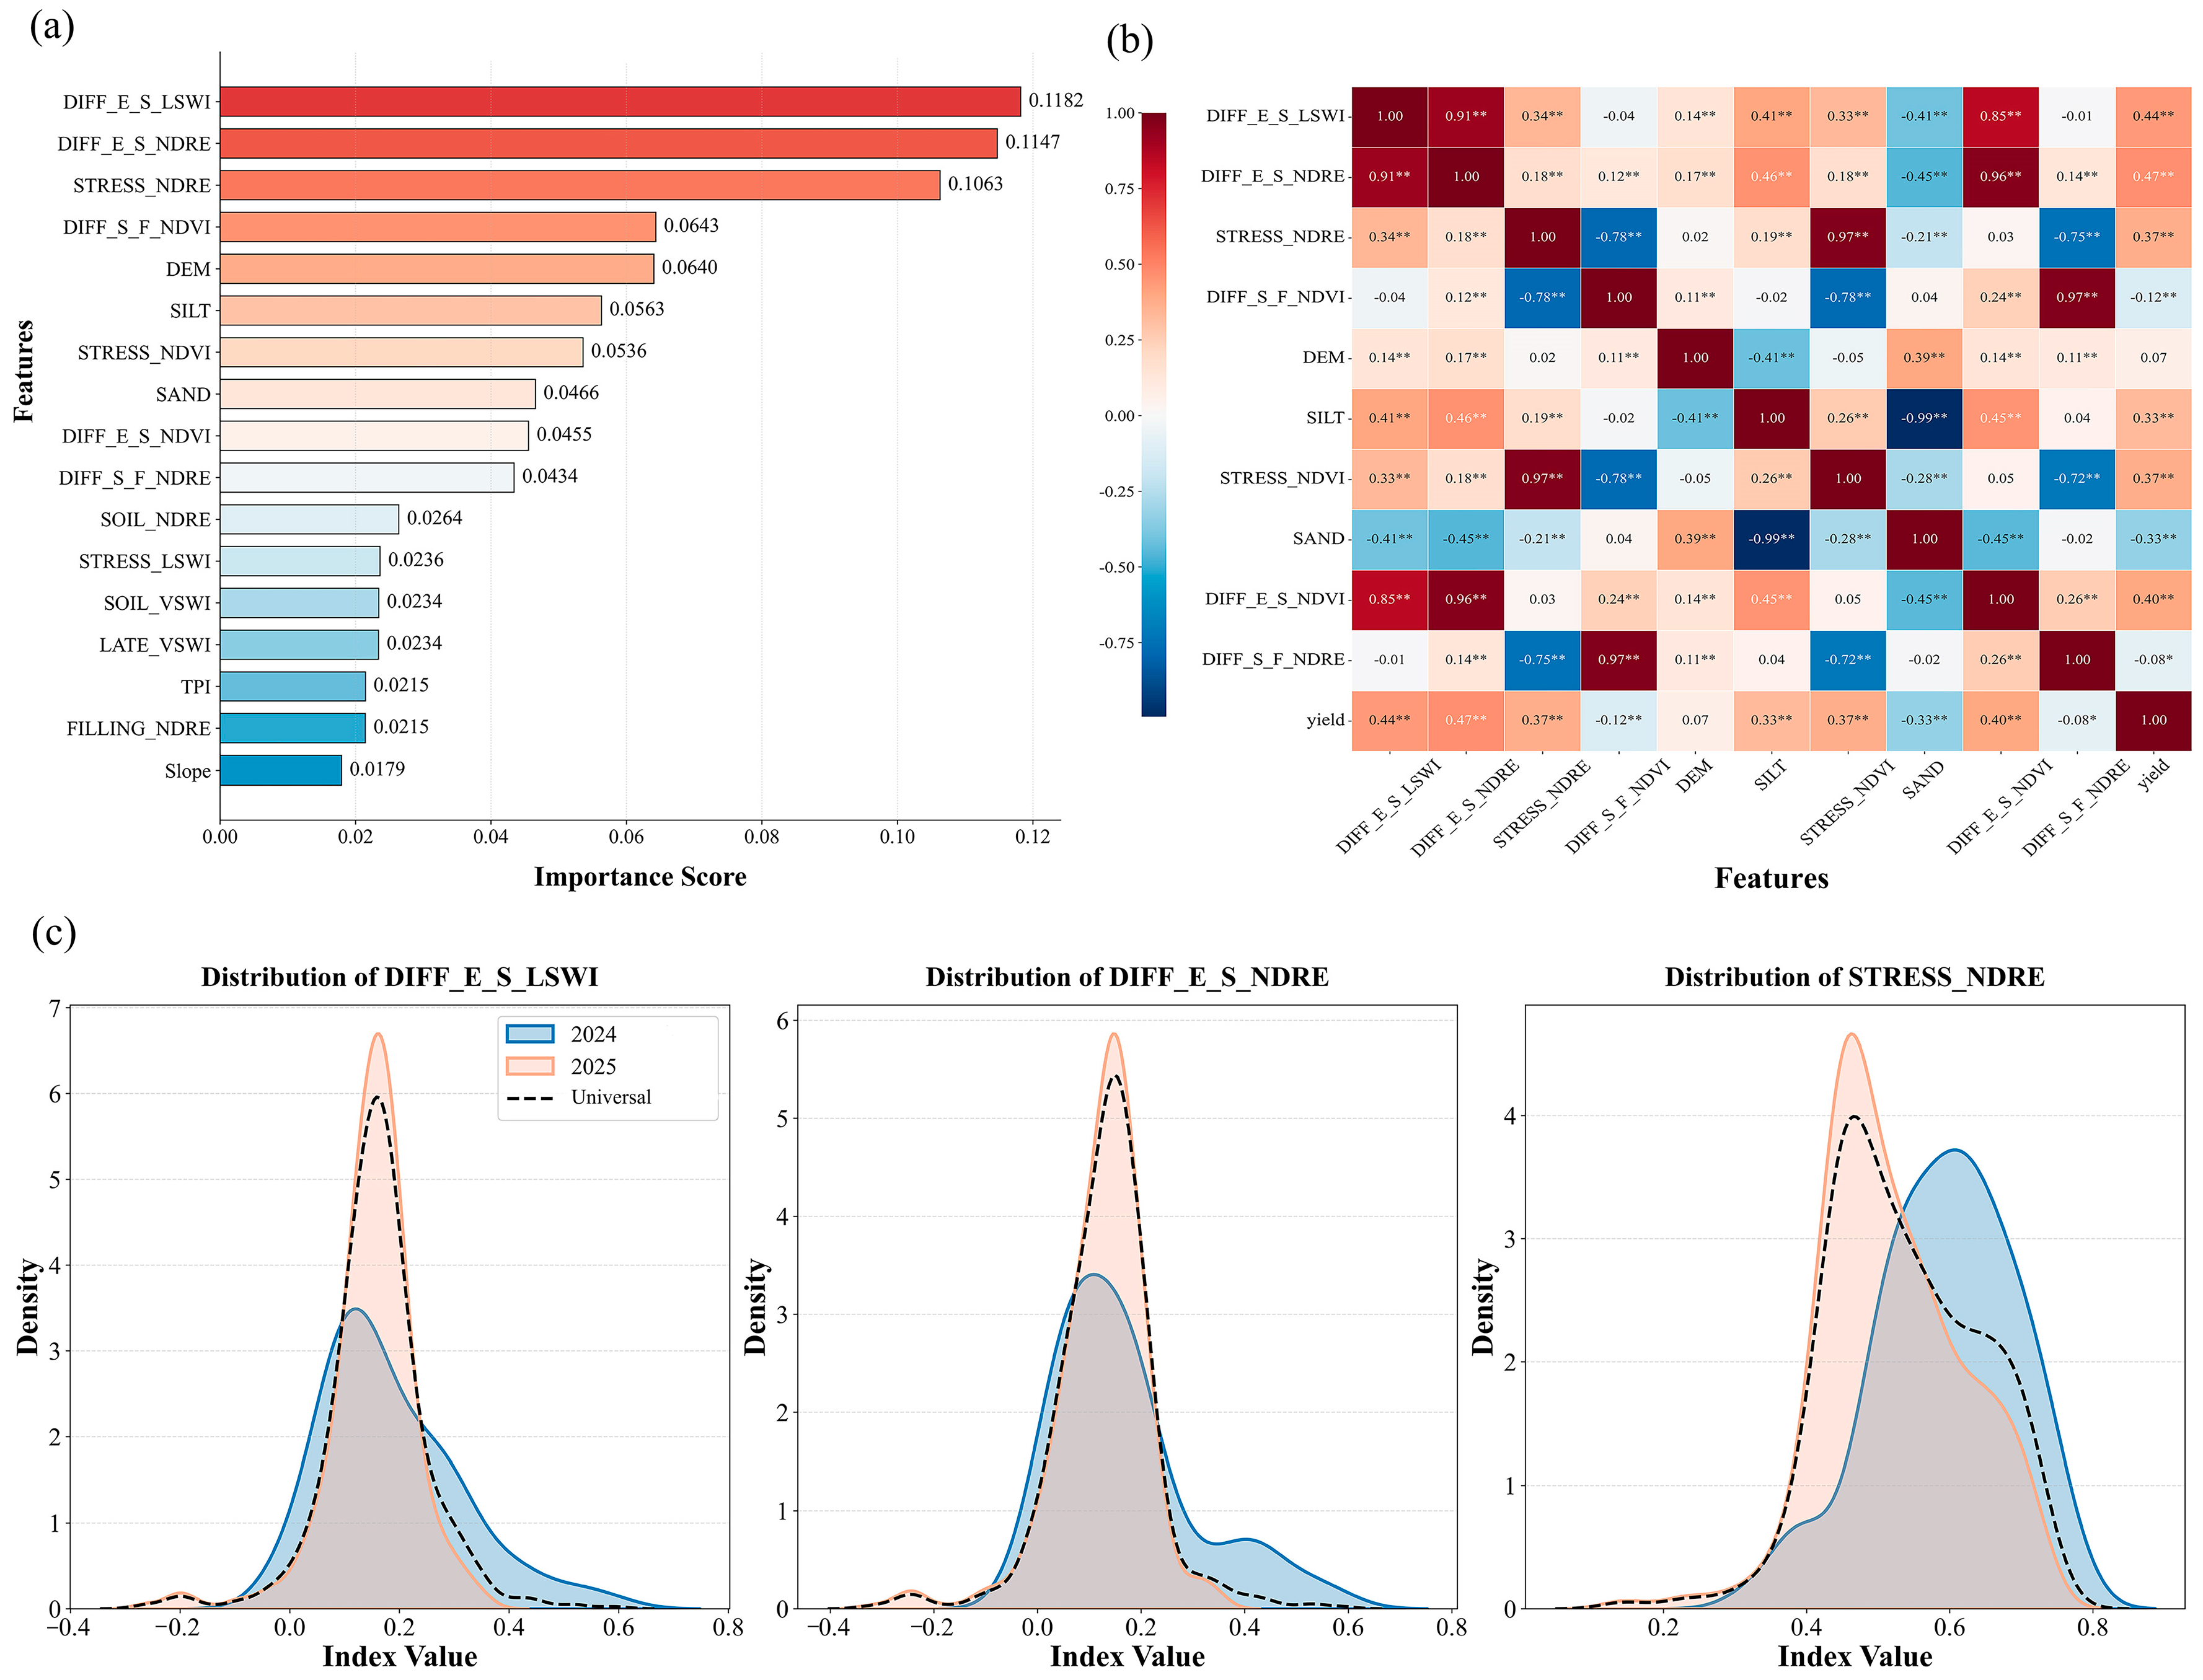
- Annual Comparative Modeling: Separate models were developed for 2024 (flooding) and 2025 (drought) to disentangle meteorological drivers and assess model response limits under distinct adversities. A Universal Model integrating all data was also built to establish a unified benchmark for varying environmental stresses.
- (2)
- Multi-scale Synergistic Training: To ensure the scientific rigor and generalization of the models, the integrated dataset (comprising both Global and Intensive samples) was randomly partitioned into a training set (80%) and a validation set (20%). This split was applied consistently across the Independent Models for 2024 and 2025, as well as the Universal Model. Regional-scale heterogeneity (Global samples) and field-scale variability (Intensive samples) were incorporated into a joint training architecture. To balance macro-trends with micro-variations, a sample weighting strategy was implemented during the training of the Universal Model. Specifically, Intensive samples were assigned a full weight of 1.0 to ensure the model accurately captures intra-plot yield fluctuations driven by micro-topography, while Global samples were assigned a weight of 0.85 to provide a stable regional meteorological baseline without diluting the fine-grained spatial signals. The sample weighting ratio (1.00 vs. 0.85) was determined through a rigorous grid-search optimization process designed to minimize cross-validation errors while preserving fine-grained localized signals (Table S1 and Figure S1). This multi-scale data fusion enables the model to bridge the gap between broad hydro-thermal gradients and localized soil-topographic modulation.
- (3)
- Robustness and Consistency Validation: The stability of environmental regulators (topography, soil) was analyzed to verify if feature gains could compensate for meteorological volatility. This supports unbiased dynamic monitoring across long-term inter-annual sequences.
2.4.3. Validation of Feature Response Direction and Distributional Robustness
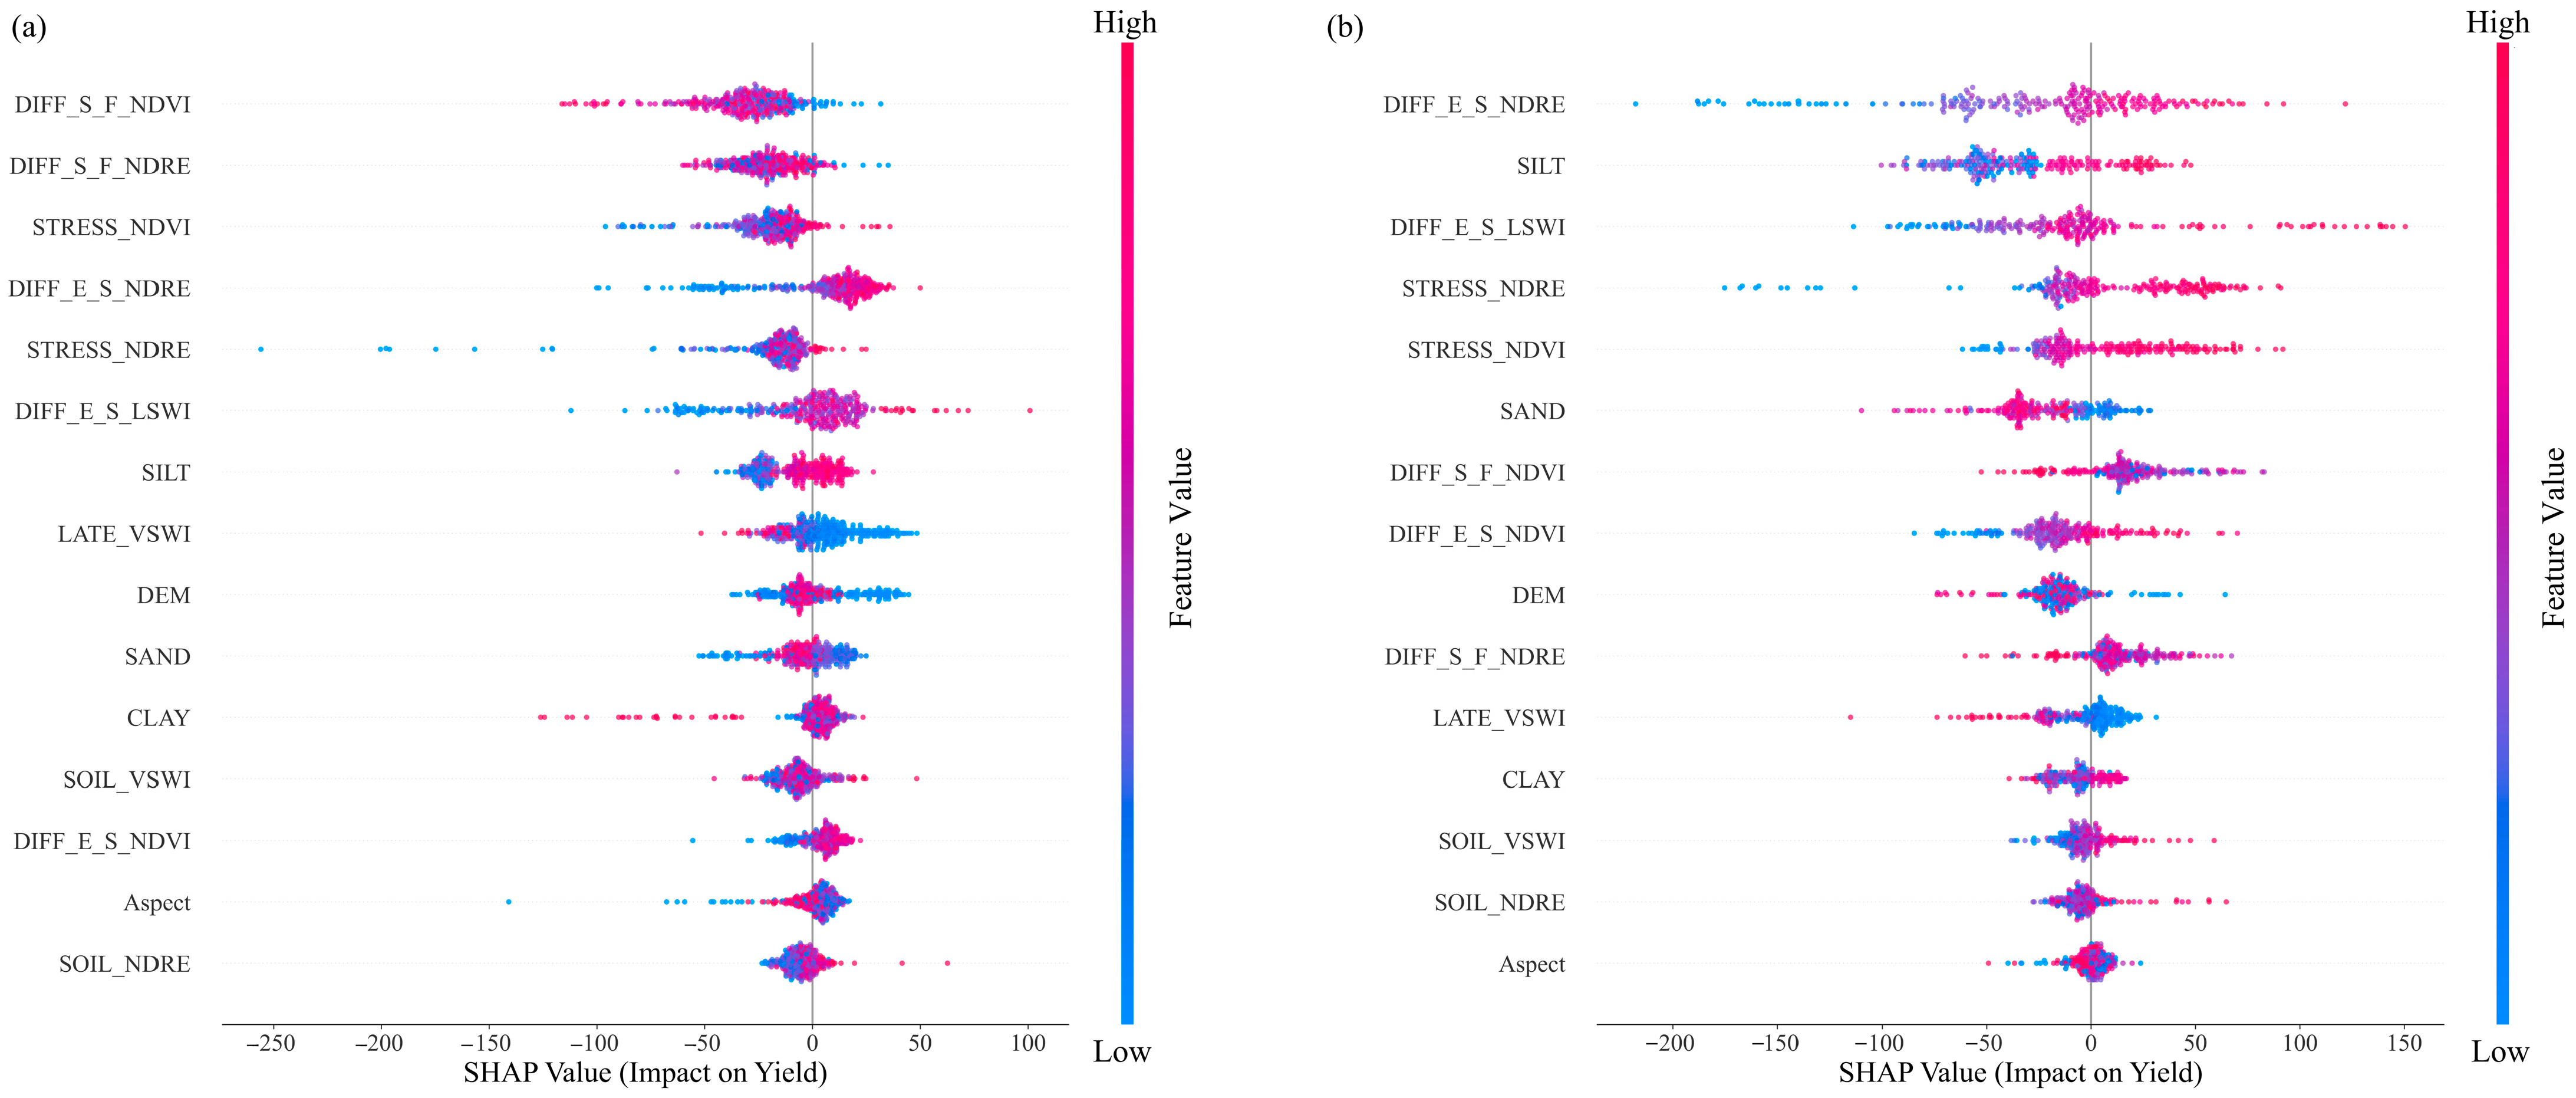
2.4.4. SHAP-Based Mechanism Analysis
2.4.5. Analysis of Spatial Yield Heterogeneity and Association Patterns
- (1)
- Global Spatial Auto-correlation (Global Moran’s I)
- (2)
- Local Spatial Auto-correlation (Local Moran’s I/LISA)
2.4.6. Model Performance Evaluation
3. Results
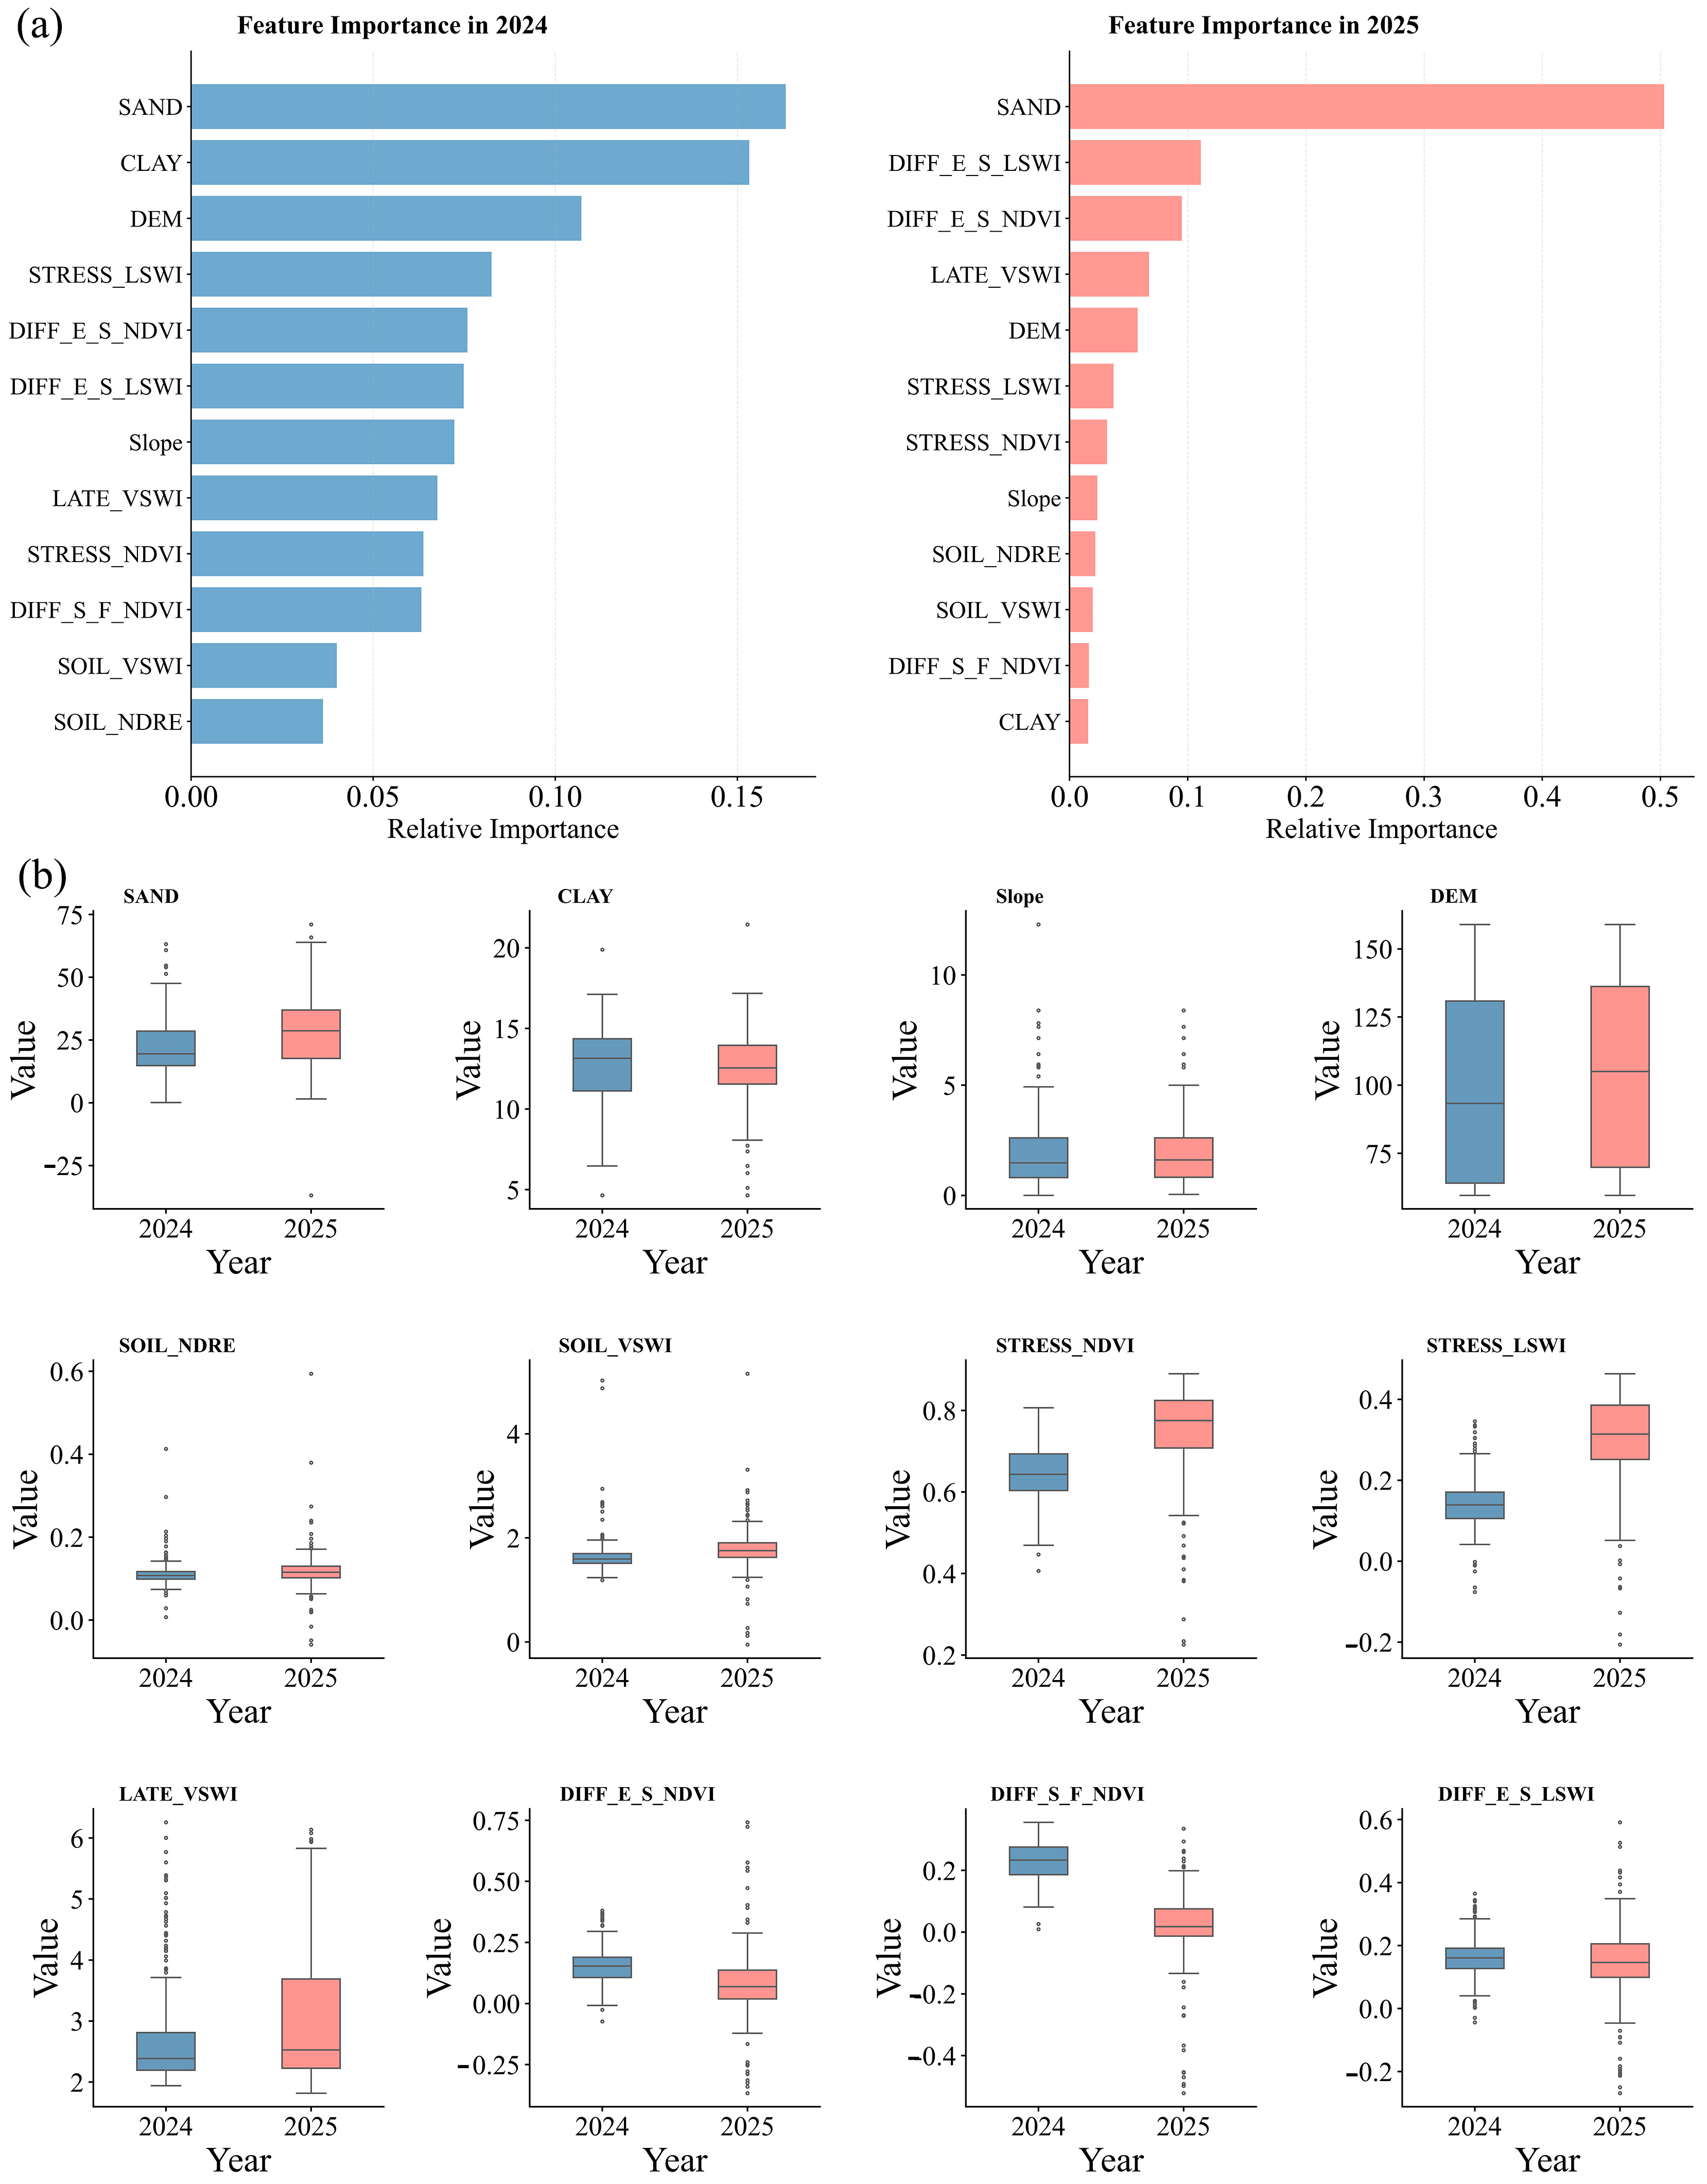
3.1. Spatio-Temporal Heterogeneity of Feature Importance and Crop Responses to Contrasting Hydrothermal Stress
3.2. Global Baseline Establishment and Cross-Scenario Universal Yield Estimation Framework
3.3. Model Estimation Performance and Multi-Scale Validation
3.4. Spatial Yield Heterogeneity Mapping
4. Discussion
4.1. Regulatory Effects of Soil-Topographic Factors Under Contrasting Hydro-Thermal Stresses
4.2. Asymmetric Mechanisms of Remote Sensing Moisture Indices and Dynamic Differences in Response to Contrasting Drought and Flood
4.3. Robustness of Universal Models
4.4. Limitations and Future Perspectives
5. Conclusions
- (1)
- The universal Random Forest model (R2 = 0.80) exhibited superior cross-scale synergy. By maintaining stable performance across contrasting hydrothermal conditions, the universal framework overcame the generalization bottleneck of year-specific models.
- (2)
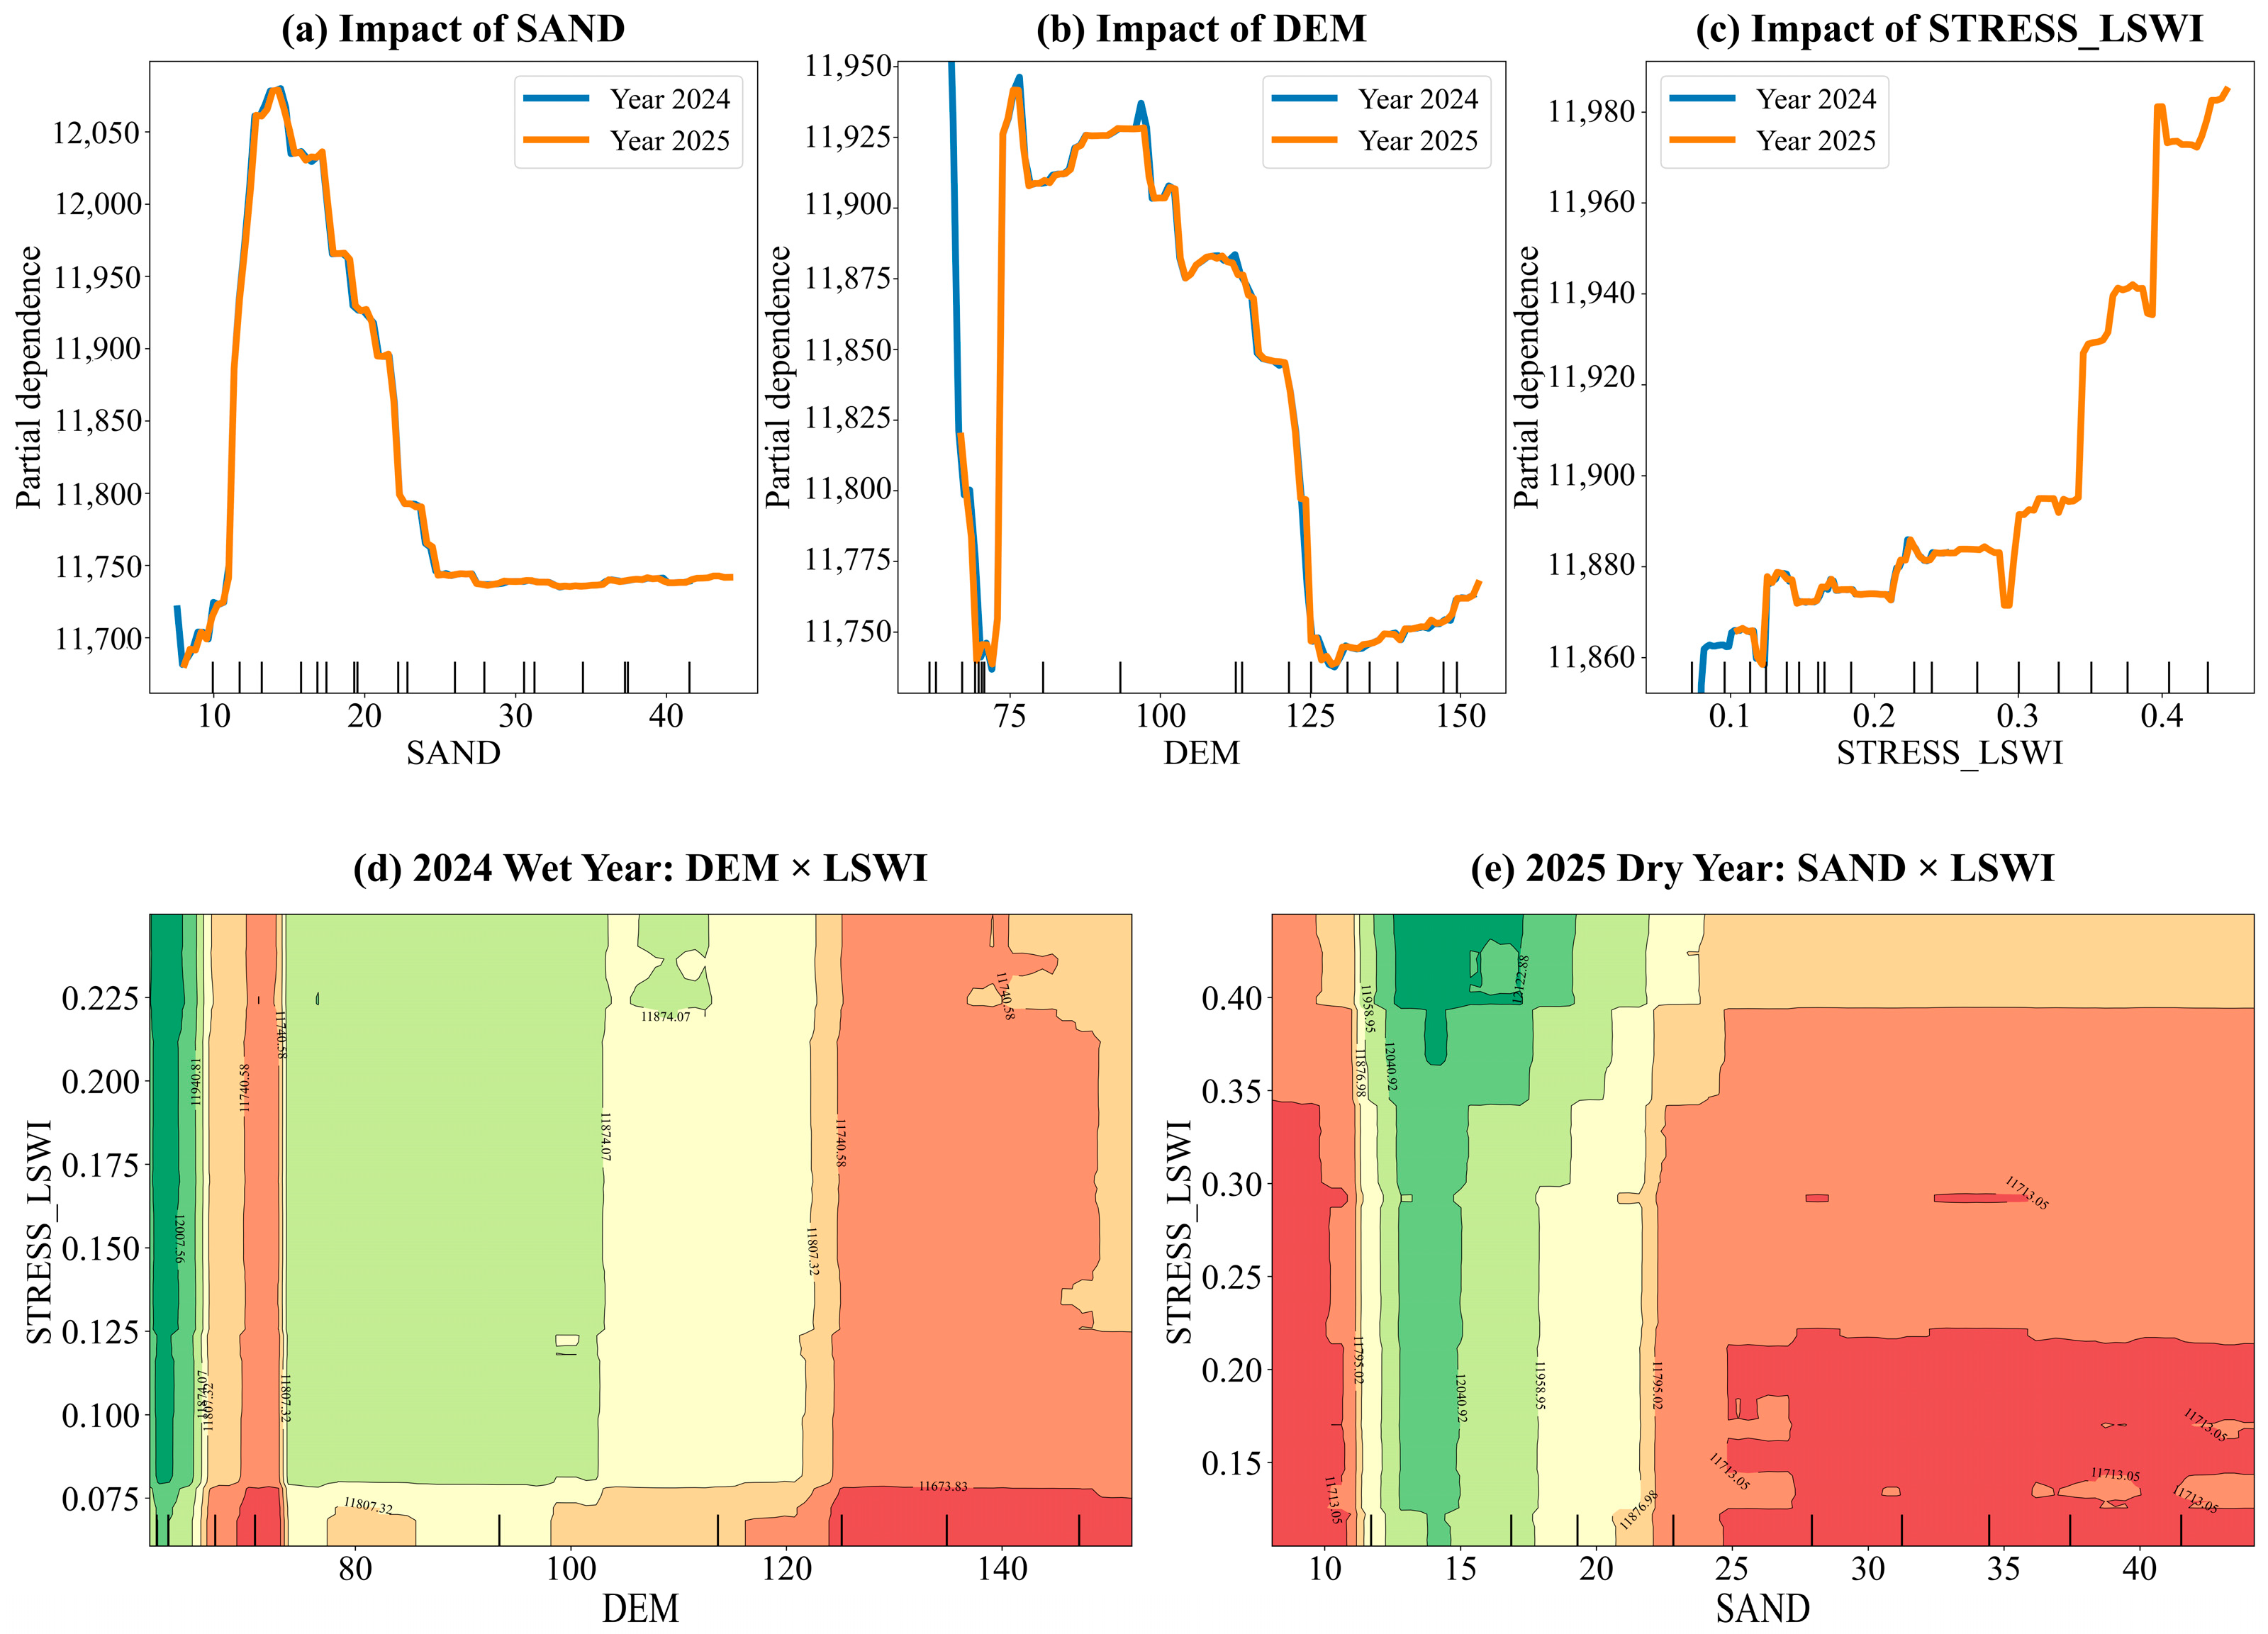
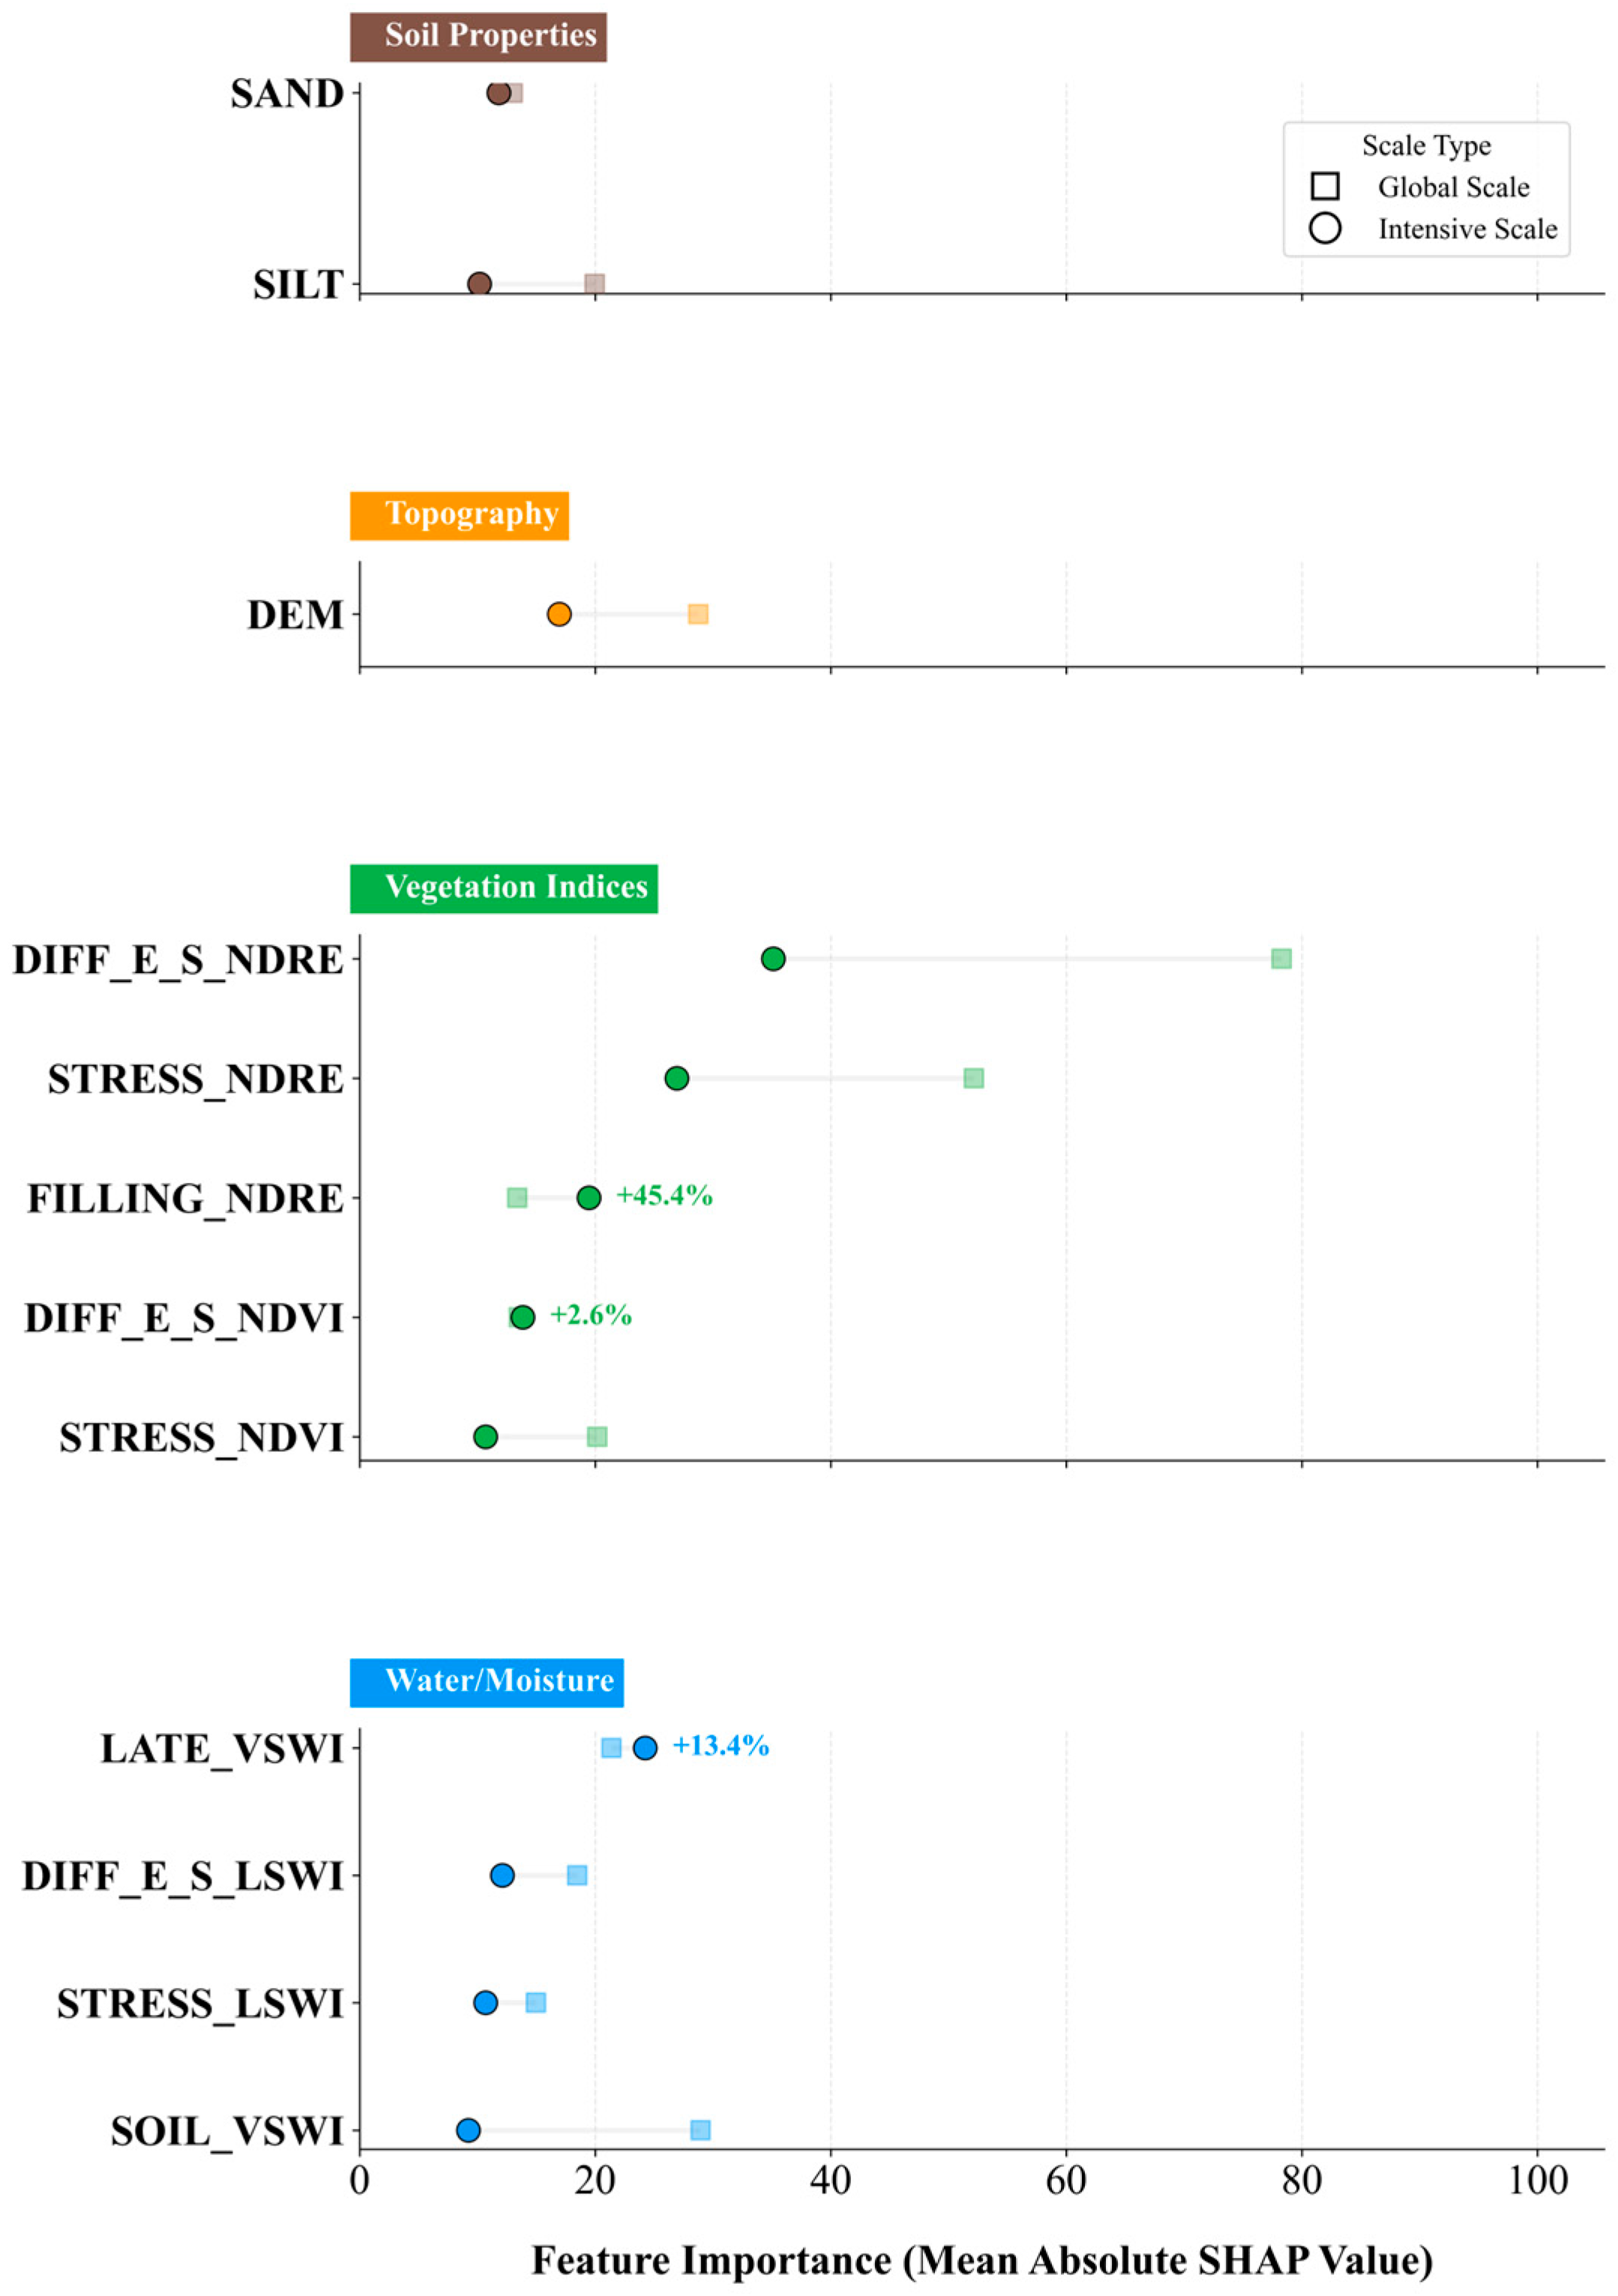
- Mechanistic analysis reveals a regime shift in yield-driving logic between contrasting years. The dominant factor shifted from topography-mediated (DEM) “drainage limitation and hypoxic stress” in the 2024 flood to SAND and moisture-deficit-led “linear limitation” during the 2025 drought. The universal model successfully captured this dynamic evolution from geospatial environmental dominance to hydraulic–physiological control.
- (3)
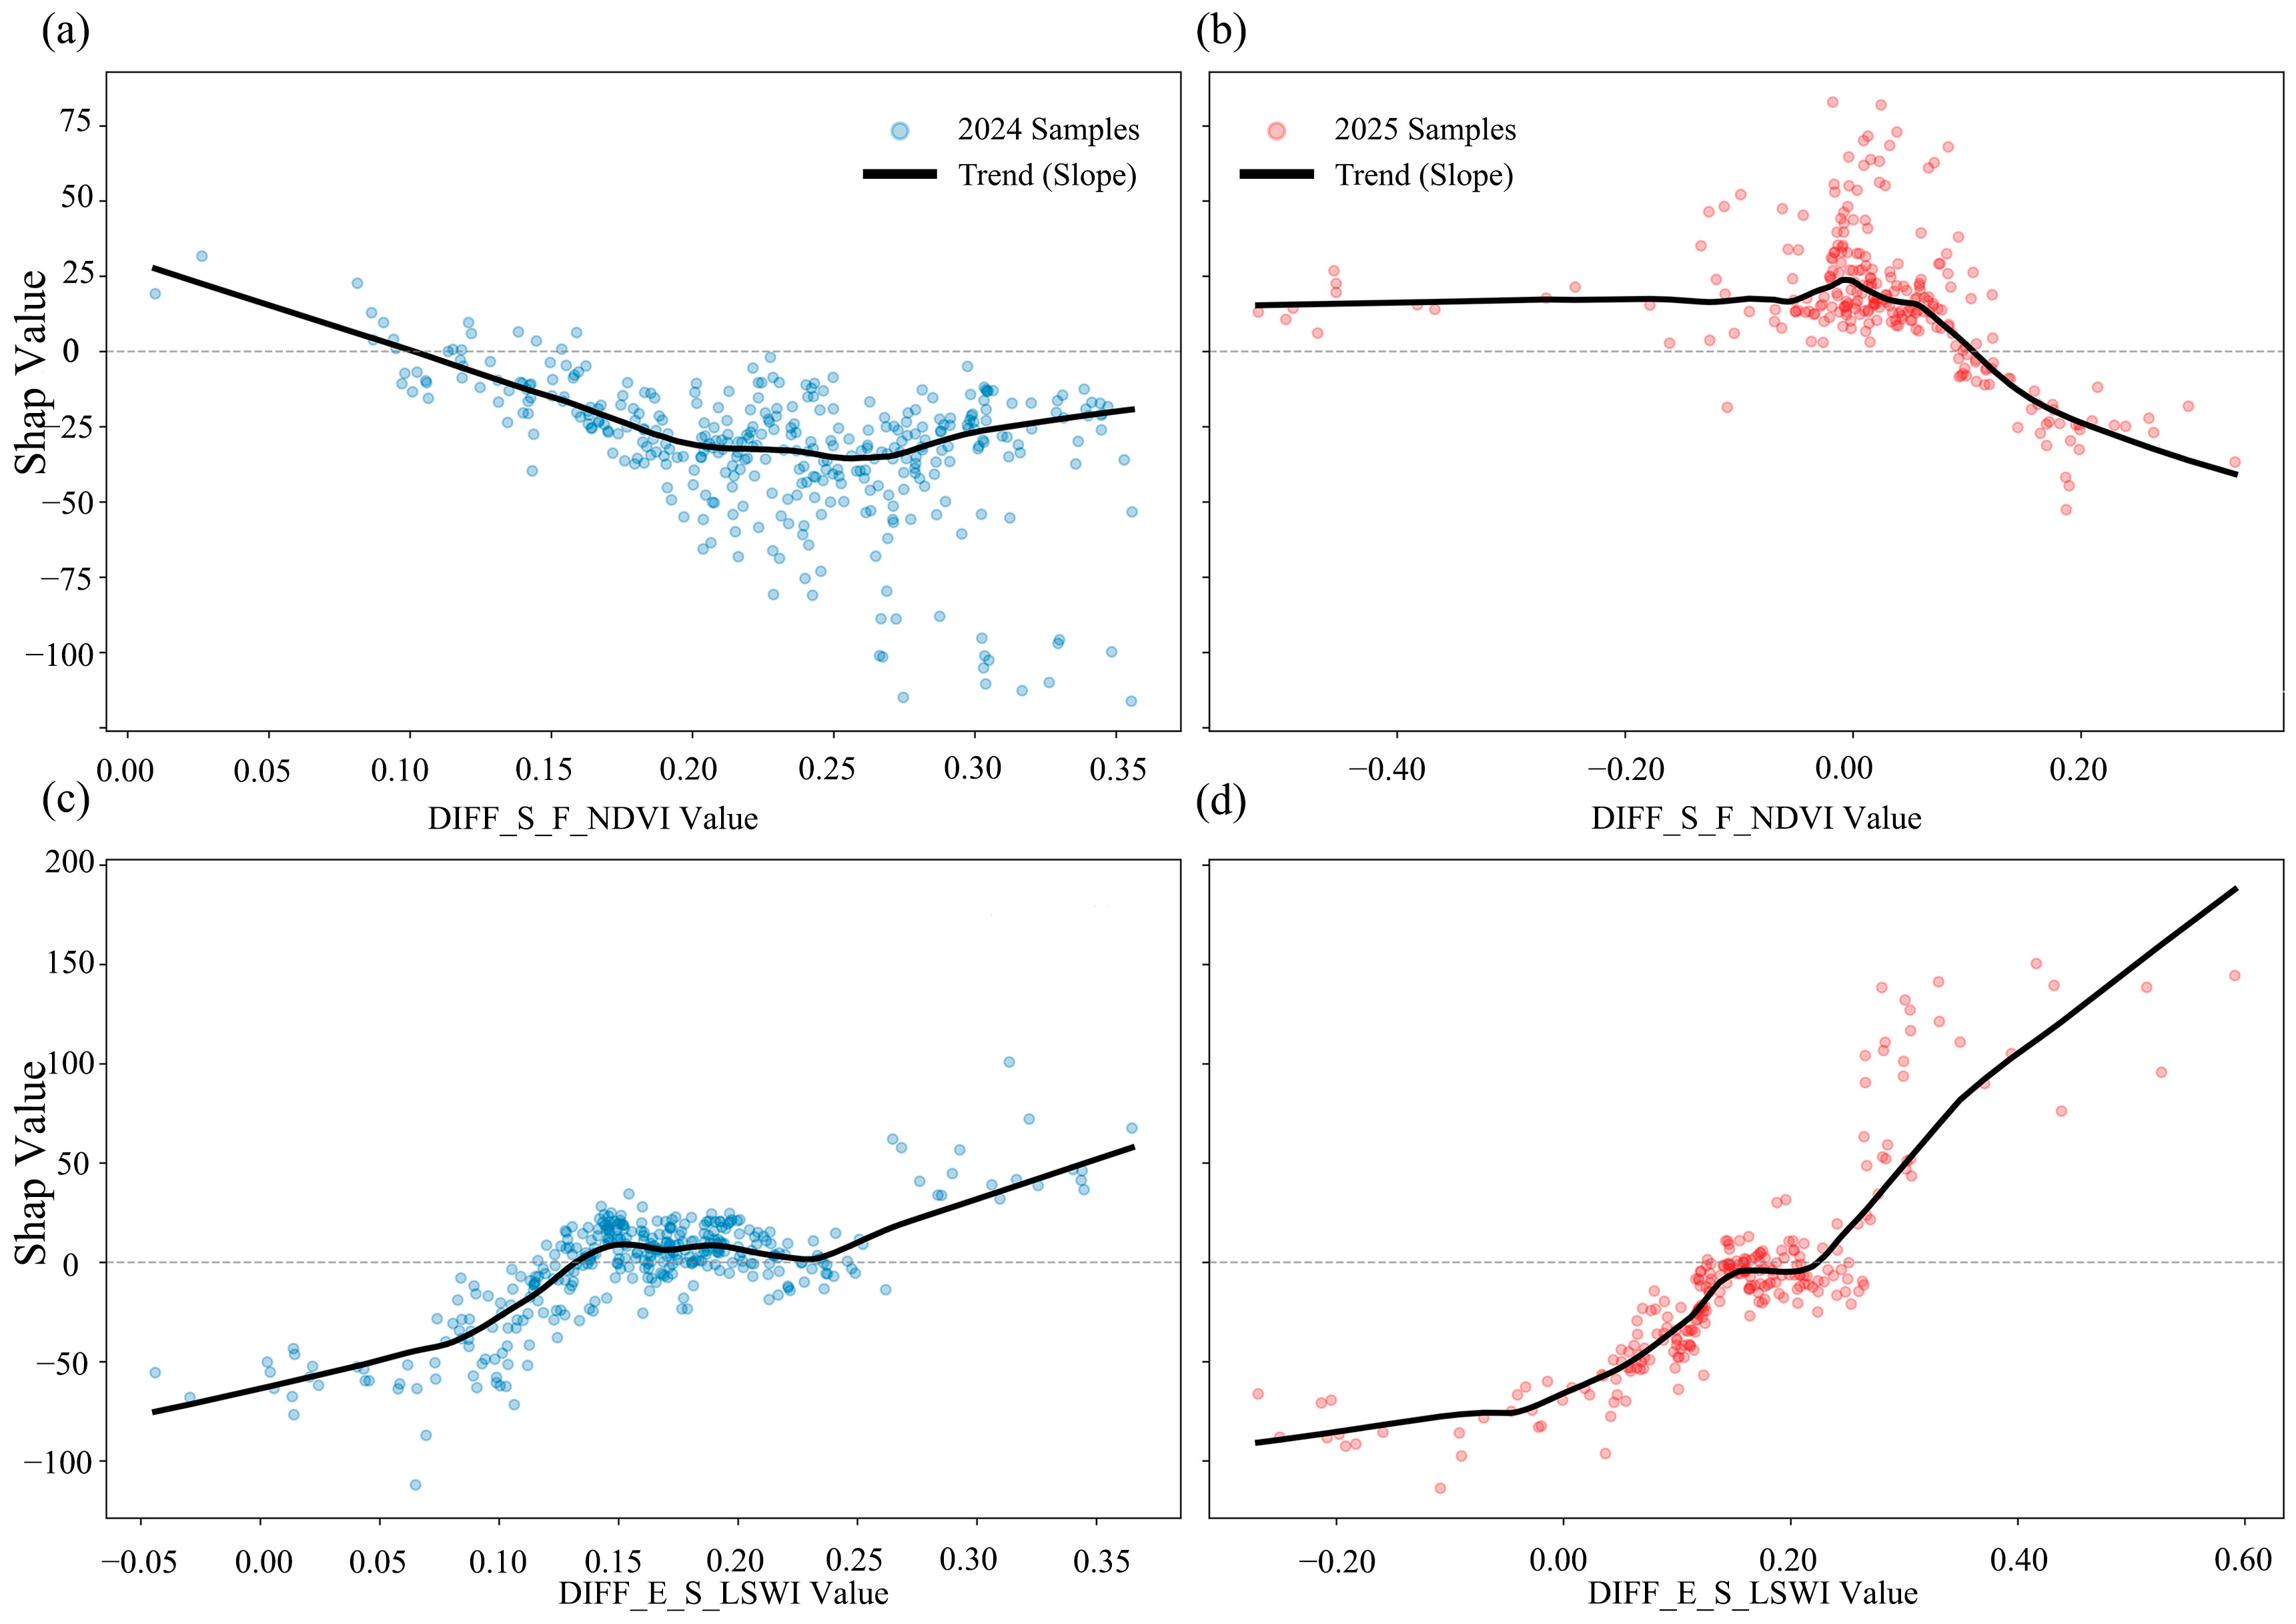
- The introduction of dynamic differential features (e.g., DIFF_E_S_NDVI) effectively resolved the challenge of asymmetric response in remote sensing signals. This strategy not only corrected the “slope inversion” and lag bias caused by “non-productive greenness” during flooding but also mitigated signal saturation in high-yield plots. Consequently, it enhanced the model’s sensitivity in capturing physiological loss and compensation effects from the peak growing season to the onset of stress.
- (4)
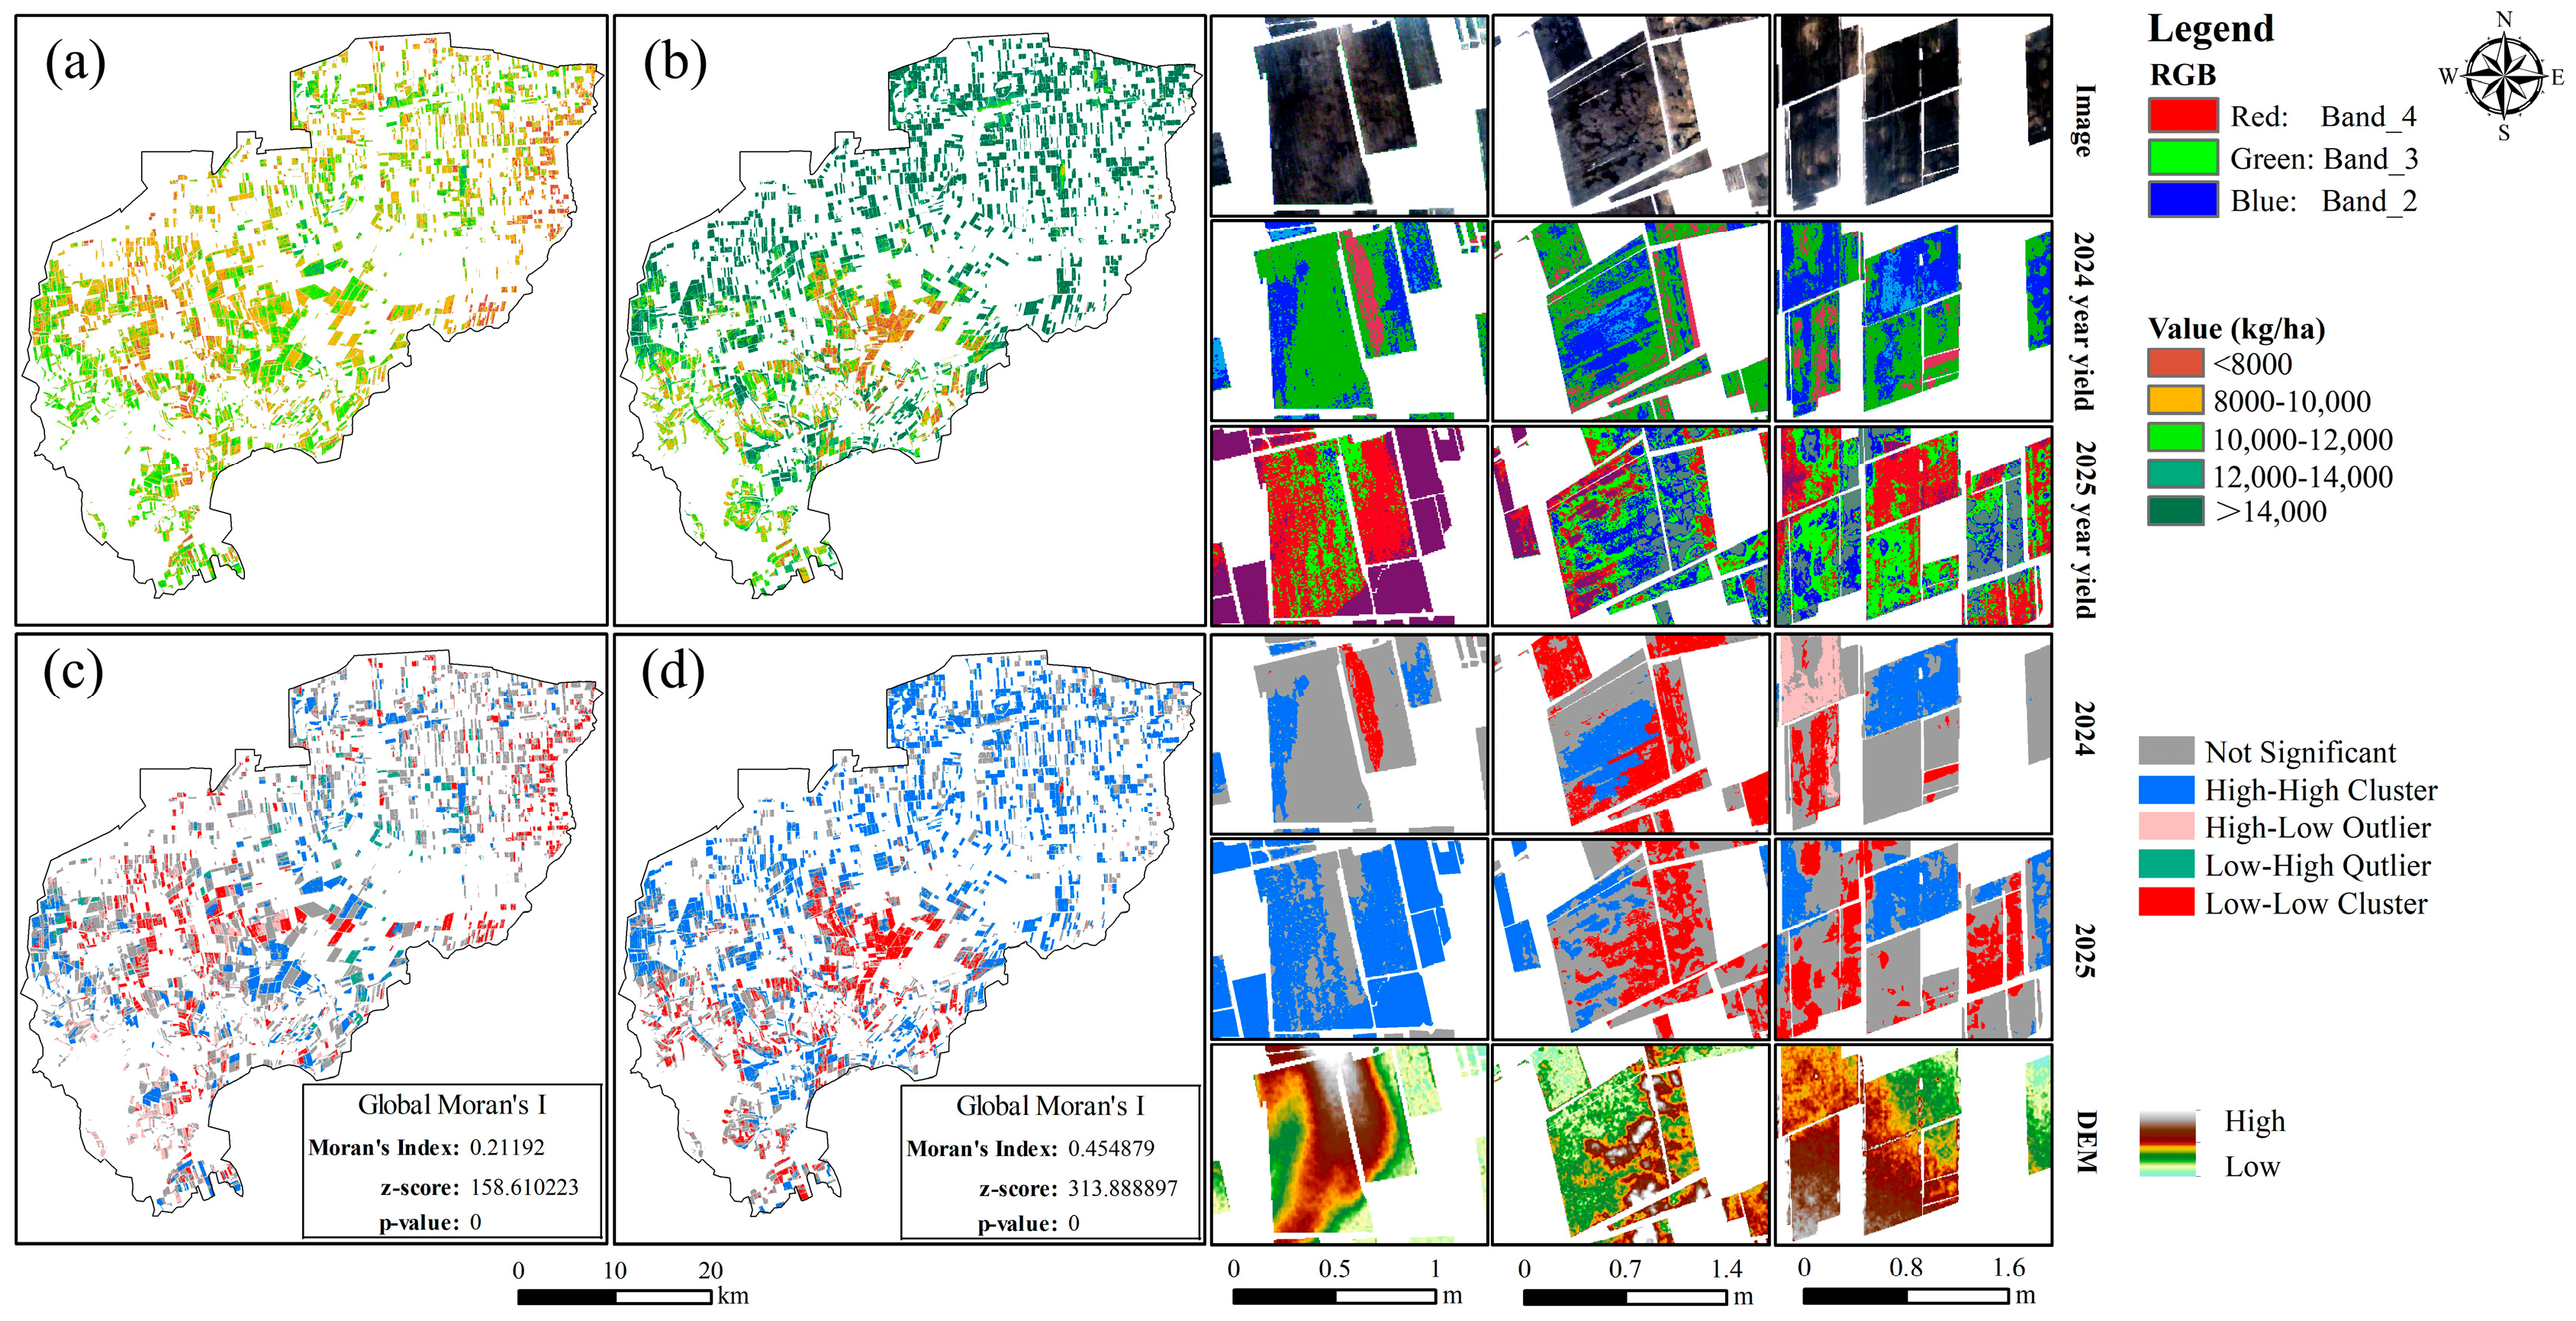
- Spatial mapping visually confirms the contrasting patterns of yield heterogeneity. The distribution transitioned from “localized linear collapse” (Moran’s I = 0.21) under topographic constraints in 2024, to “global planar polarization” (Moran’s I = 0.45) driven by variations in soil water-holding capacity in 2025, ultimately exhibiting a high-contrast patchy mosaic structure. This study establishes a synergistic mechanism driven by “Macro-Baseline, Micro-Correction.” This multi-scale coupling effectively addresses the limitations of static environmental factors in responding to dynamic stress.
Supplementary Materials
Author Contributions
Funding
Data Availability Statement
Conflicts of Interest
References
- Diffenbaugh, N.S.; Singh, D.; Mankin, J.S.; Horton, D.E.; Swain, D.L.; Touma, D.; Charland, A.; Liu, Y.; Haugen, M.; Tsiang, M.; et al. Quantifying the influence of global warming on unprecedented extreme climate events. Proc. Natl. Acad. Sci. USA 2017, 114, 4881–4886. [Google Scholar] [CrossRef] [Scilit] [PubMed]
- Lesk, C.; Anderson, W.; Rigden, A.; Coast, O.; Jägermeyr, J.; McDermid, S.; Davis, K.F.; Konar, M. Compound heat and moisture extreme impacts on global crop yields under climate change. Nat. Rev. Earth Environ. 2022, 3, 872–889. [Google Scholar] [CrossRef] [Scilit]
- Liu, Y.; Li, N.; Zhang, Z.; Huang, C.; Chen, X.; Wang, F. The central trend in crop yields under climate change in China: A systematic review. Sci. Total Environ. 2020, 704, 135355. [Google Scholar] [CrossRef] [Scilit] [PubMed]
- Gao, J.; Liu, L.; Guo, L.; Sun, D.; Liu, W.; Hou, W.; Wu, S. The effects of climate change and phenological variation on agricultural production and its risk pattern in the black soil area of northeast China. J. Geogr. Sci. 2023, 33, 37–58. [Google Scholar] [CrossRef] [Scilit]
- Lin, Y.; Feng, Z.; Wu, W.; Yang, Y.; Zhou, Y.; Xu, C. Potential impacts of climate change and adaptation on maize in northeast China. Agron. J. 2017, 109, 1476–1490. [Google Scholar] [CrossRef] [Scilit]
- De Wit, A.; Boogaard, H.; Fumagalli, D.; Janssen, S.; Knapen, R.; van Kraalingen, D.; Supit, I.; van der Wijngaart, R.; van Diepen, K. 25 years of the WOFOST cropping systems model. Agric. Syst. 2019, 168, 154–167. [Google Scholar] [CrossRef] [Scilit]
- Aggarwal, P.K. Uncertainties in crop, soil and weather inputs used in growth models: Implications for simulated outputs and their applications. Agric. Syst. 1995, 48, 361–384. [Google Scholar] [CrossRef] [Scilit]
- Huang, J.; Gómez-Dans, J.L.; Huang, H.; Ma, H.; Wu, Q.; Lewis, P.E.; Liang, S.; Chen, Z.; Xue, J.H.; Wu, Y.; et al. Assimilation of remote sensing into crop growth models: Current status and perspectives. Agric. For. Meteorol. 2019, 276, 107609. [Google Scholar] [CrossRef] [Scilit]
- Ghazaryan, G.; Skakun, S.; König, S.; Rezaei, E.E.; Siebert, S.; Dubovyk, O. Crop Yield Estimation Using Multi-Source Satellite Image Series and Deep Learning. In Proceedings of the IGARSS 2020—2020 IEEE International Geoscience and Remote Sensing Symposium, Waikoloa, HI, USA, 26 September–2 October 2020; IEEE: Piscataway, NJ, USA, 2020; pp. 5163–5166. [Google Scholar]
- Benos, L.; Tagarakis, A.C.; Dolias, G.; Berruto, R.; Kateris, D.; Bochtis, D. Machine learning in agriculture: A comprehensive updated review. Sensors 2021, 21, 3758. [Google Scholar] [CrossRef] [Scilit] [PubMed]
- Cao, J.; Zhang, Z.; Luo, Y.; Zhang, L.; Zhang, J.; Li, Z.; Tao, F. Wheat yield predictions at a county and field scale with deep learning, machine learning, and google earth engine. Eur. J. Agron. 2021, 123, 126204. [Google Scholar] [CrossRef] [Scilit]
- Ishaq, R.A.F.; Zhou, G.; Jing, G.; Shah, S.R.A.; Ali, A.; Imran, M.; Jiang, H. Geospatial Robust Wheat Yield Prediction Using Machine Learning and Integrated Crop Growth Model and Time-Series Satellite Data. Remote Sens. 2025, 17, 1140. [Google Scholar] [CrossRef] [Scilit]
- Hu, X.; Ren, H.; Tansey, K.; Zheng, Y.; Ghent, D.; Liu, X.; Yan, L. Agricultural drought monitoring using European Space Agency Sentinel 3A land surface temperature and normalized difference vegetation index imageries. Agric. For. Meteorol. 2019, 279, 107707. [Google Scholar] [CrossRef] [Scilit]
- Li, Y.; Yan, W.; An, S.; Gao, W.; Jia, J.; Tao, S.; Wang, W. A spatio-temporal fusion framework of UAV and satellite imagery for winter wheat growth monitoring. Drones 2022, 7, 23. [Google Scholar] [CrossRef] [Scilit]
- Kumhálová, J.; Kumhála, F.; Kroulík, M.; Matějková, Š. The impact of topography on soil properties and yield and the effects of weather conditions. Precis. Agric. 2011, 12, 813–830. [Google Scholar] [CrossRef] [Scilit]
- Heil, K.; Heinemann, P.; Schmidhalter, U. Modeling the effects of soil variability, topography, and management on the yield of barley. Front. Environ. Sci. 2018, 6, 146. [Google Scholar] [CrossRef] [Scilit]
- Han, H.; Liu, Z.; Li, J.; Zeng, Z. Challenges in remote sensing based climate and crop monitoring: Navigating the complexities using AI. J. Cloud Comput. 2024, 13, 34. [Google Scholar] [CrossRef] [Scilit]
- Canicattì, M.; Ferro, M.V.; Vallone, M.; Orlando, S.; Catania, P. Bayesian yield mapping and uncertainty analysis in vineyards using remote sensing data and grape harvester tracking. Precis. Agric. 2025, 26, 63. [Google Scholar] [CrossRef] [Scilit]
- Li, X.; Lyu, Y.; Zhu, B.; Liu, L.; Song, K. Maize yield estimation in Northeast China’s black soil region using a deep learning model with attention mechanism and remote sensing. Sci. Rep. 2025, 15, 12927. [Google Scholar] [CrossRef] [Scilit] [PubMed]
- David Raj, A.; Kumar, S.; Sooryamol, K.R.; Sankar, M.; George K, J. Quantifying soil redistribution across Himalayan hillslope under the influence of topography and terrace abandonment using fallout-137Cs. Discov. Geosci. 2025, 3, 233. [Google Scholar] [CrossRef] [Scilit]
- Dou, W.; Zhang, W.; He, S.; Li, X.; Luo, C. Research on Spatiotemporal Combination Optimization of Remote Sensing Mapping of Farmland Soil Organic Matter Considering Annual Variability. Agronomy 2025, 15, 2714. [Google Scholar] [CrossRef] [Scilit]
- Yu, J.; Li, J.; Lo, K.; Huang, S.; Li, Y.; Zhao, Z. Farmers’ adoption of smart agricultural technologies for black soil conservation and utilization in China: The driving factors and its mechanism. Front. Sustain. Food Syst. 2025, 9, 1561633. [Google Scholar] [CrossRef] [Scilit]
- Zhang, G.; Yang, Y.; Liu, Y.; Wang, Z.Q. Advances and prospects of soil erosion research in the black soil region of Northeast China. J. Soil Water Conserv. 2022, 36, 1–12. [Google Scholar]
- Ali, M.H.; Mubarak, S. Effective rainfall calculation methods for field crops: An overview, analysis and new formulation. Asian Res. J. Agric. 2017, 7, 1–12. [Google Scholar] [CrossRef] [Scilit]
- Tucker, C.J. Red and photographic infrared linear combinations for monitoring vegetation. Remote Sens. Environ. 1979, 8, 127–150. [Google Scholar] [CrossRef] [Scilit]
- Wang, Q.; Moreno-Martínez, Á.; Muñoz-Marí, J.; Campos-Taberner, M.; Camps-Valls, G. Estimation of vegetation traits with kernel NDVI. ISPRS J. Photogramm. Remote Sens. 2023, 195, 408–417. [Google Scholar]
- Babashli, B.; Badalova, A.; Shukurov, R.; Ahmadov, A. Cotton yield estimation using several vegetation indices. Turk. J. Eng. 2024, 8, 139–151. [Google Scholar] [CrossRef] [Scilit]
- Miller, J.J.; Schepers, J.S.; Shapiro, C.A.; Arneson, N.J.; Eskridge, K.M.; Oliveira, M.C.; Giesler, L.J. Characterizing soybean vigor and productivity using multiple crop canopy sensor readings. Field Crops Res. 2018, 216, 22–31. [Google Scholar] [CrossRef] [Scilit]
- Baumann, E.; Beierkuhnlein, C.; Preitauer, A.; Schmid, K.; Rudner, M. Evaluating remote sensing data as a tool to minimize spatial autocorrelation in in-situ vegetation sampling. Erdkunde 2025, 79, 25–40. [Google Scholar] [CrossRef] [Scilit]
- Chandrasekar, K.; Sesha Sai, M.V.R.; Roy, P.S.; Dwevedi, R.S. Land Surface Water Index (LSWI) response to rainfall and NDVI using the MODIS Vegetation Index product. Int. J. Remote Sens. 2010, 31, 3987–4005. [Google Scholar] [CrossRef] [Scilit]
- Chandrasekar, K.; Srikanth, P.; Chakraborty, A.; Choudhary, K.; Ramana, K.V. Response of crop water indices to soil wetness and vegetation water content. Adv. Space Res. 2024, 73, 1316–1330. [Google Scholar]
- Zhang, Y.; Xie, Y. Vegetation water content estimation using NDVI and LSWI from MODIS images. Sci. Geogr. Sin. 2008, 28, 76. [Google Scholar]
- Luo, C.; Zhang, W.; Zhang, X.; Liu, H. Mapping the soil organic matter content in a typical black-soil area using optical data, radar data and environmental covariates. Soil Tillage Res. 2024, 235, 105912. [Google Scholar]
- Gao, L.; Zhang, Y.; Zang, D.; Yang, Q.; Liu, H.; Luo, C. Using Satellites to Monitor Soil Texture in Typical Black Soil Areas and Assess Its Impact on Crop Growth. Agriculture 2025, 15, 912. [Google Scholar] [CrossRef] [Scilit]
- Asseng, S.; Ewert, F.; Rosenzweig, C.; Jones, J.W.; Hatfield, J.L.; Ruane, A.C.; Boote, K.J.; Thorburn, P.J.; Rötter, R.P.; Cammarano, D.; et al. Uncertainty in simulating wheat yields under climate change. Nat. Clim. Change 2013, 3, 827–832. [Google Scholar] [CrossRef] [Scilit]
- Chaney, N.W.; Van Huijgevoort, M.H.; Shevliakova, E.; Malyshev, S.; Milly, P.C.; Gauthier, P.P.; Sulman, B.N. Harnessing big data to rethink land heterogeneity in Earth system models. Hydrol. Earth Syst. Sci. 2018, 22, 3311–3330. [Google Scholar] [CrossRef] [Scilit]
- Xia, C.; Ren, C.; Wang, Y.; Wang, Z.; Jia, M.; Xi, Y.; Liu, P.; Ren, H.; Hou, Q.; Ruan, X. Decoding soil-topography buffering of maize yield spatial heterogeneity in extreme precipitation year using Sentinel-2 data and SHAP interpretability. Field Crops Res. 2026, 337, 110263. [Google Scholar]
- Ibrahimi, K.; Alghamdi, A.G. Available water capacity of sandy soils as affected by biochar application: A meta-analysis. Catena 2022, 214, 106281. [Google Scholar] [CrossRef] [Scilit]
- Yang, Y.; Zhong, M.; Bian, X.; You, Y.; Li, F. Preparation of carbon-based material with high water absorption capacity and its effect on the water retention characteristics of sandy soil. Biochar 2023, 5, 61. [Google Scholar] [CrossRef] [Scilit]
- Orth, R.; Destouni, G.; Jung, M.; Reichstein, M. Large-scale biospheric drought response intensifies linearly with drought duration in arid regions. Biogeosciences 2020, 17, 2647–2656. [Google Scholar] [CrossRef] [Scilit]
- Fensholt, R.; Sandholt, I. Derivation of a shortwave infrared water stress index from MODIS near-and shortwave infrared data in a semiarid environment. Remote Sens. Environ. 2003, 87, 111–121. [Google Scholar] [CrossRef] [Scilit]
- Swathandran, S.; Aslam, M.A.M. Assessing the role of SWIR band in detecting agricultural crop stress: A case study of Raichur district, Karnataka, India. Environ. Monit. Assess. 2019, 191, 442. [Google Scholar] [CrossRef] [Scilit] [PubMed]
- Poornima, S.; Edward, A.S. MLVI-CNN: A hyperspectral stress detection framework using machine learning-optimized indices and deep learning for precision agriculture. Front. Plant Sci. 2025, 16, 1631928. [Google Scholar] [CrossRef] [Scilit]
- Wu, X.; Tang, Y.; Li, C.; Wu, C.; Huang, G. Chlorophyll fluorescence and yield responses of winter wheat to waterlogging at different growth stages. Plant Prod. Sci. 2015, 18, 284–294. [Google Scholar] [CrossRef] [Scilit]
- Kravchenko, A.N.; Bullock, D.G. Correlation of corn and soybean grain yield with topography and soil properties. Agron. J. 2000, 92, 75–83. [Google Scholar] [CrossRef] [Scilit]
- Ray, D.K.; Gerber, J.S.; MacDonald, G.K.; West, P.C. Climate variation explains a third of global crop yield variability. Nat. Commun. 2015, 6, 5989. [Google Scholar] [CrossRef] [Scilit] [PubMed]



| Stage | Stage Name | Representative Phenological Stages | Satellite Imagery Date (2024) | Satellite Imagery Date (2025) |
|---|---|---|---|---|
| 1 | SOIL | Bare Soil Period | 8-May | 23-May |
| 2 | EARLY | Early Vegetative Stage (V3 to V6) | 27-June | 27-June |
| 3 | STRESS | Summer Stress Period (VT to R1) | 22-July | 22-July |
| 4 | FILLING | Grain Filling Stage (R2 to R4) | 3-September | 7-September |
| 5 | LATE | Late Growth Stage (R5 to R6) | 28-September | 20-September |
| Model | Year | R2 | RMSE (kg ha−1) | MAE (kg ha−1) | nRMSE (%) | |
|---|---|---|---|---|---|---|
| RF | Independent | 2024 | 0.72 | 1450.20 | 1120.35 | 14.5 |
| XGBoost | 0.70 | 1510.45 | 1180.20 | 15.1 | ||
| TabNet | 0.62 | 1720.80 | 1350.40 | 17.2 | ||
| MLP | 0.58 | 1850.15 | 1420.60 | 18.5 | ||
| RF | Independent | 2025 | 0.84 | 1120.55 | 890.45 | 10.2 |
| XGBoost | 0.82 | 1180.30 | 920.10 | 11.5 | ||
| TabNet | 0.75 | 1340.65 | 1050.30 | 13.4 | ||
| MLP | 0.73 | 1410.90 | 1100.25 | 14.1 | ||
| RF | Universal | 2024 & 2025 | 0.80 | 1250.40 | 980.15 | 12.1 |
| XGBoost | 0.79 | 1280.60 | 1010.50 | 12.8 | ||
| TabNet | 0.71 | 1490.25 | 1190.70 | 14.9 | ||
| MLP | 0.68 | 1550.80 | 1250.40 | 15.5 | ||
Disclaimer/Publisher’s Note: The statements, opinions and data contained in all publications are solely those of the individual author(s) and contributor(s) and not of MDPI and/or the editor(s). MDPI and/or the editor(s) disclaim responsibility for any injury to people or property resulting from any ideas, methods, instructions or products referred to in the content. |
© 2026 by the authors. Licensee MDPI, Basel, Switzerland. This article is an open access article distributed under the terms and conditions of the Creative Commons Attribution (CC BY) license.
Share and Cite
Meng, L.; Wang, Y.; Ma, S.; Liu, H. A Universal Maize Yield Estimation Framework: Integrating Multi-Dimensional Environmental Features to Mitigate the Impacts of Contrasting Inter-Annual Hydrothermal Variability. Agriculture 2026, 16, 1412. https://doi.org/10.3390/agriculture16131412
Meng L, Wang Y, Ma S, Liu H. A Universal Maize Yield Estimation Framework: Integrating Multi-Dimensional Environmental Features to Mitigate the Impacts of Contrasting Inter-Annual Hydrothermal Variability. Agriculture. 2026; 16(13):1412. https://doi.org/10.3390/agriculture16131412
Chicago/Turabian StyleMeng, Linghua, Yihao Wang, Shinai Ma, and Huanjun Liu. 2026. "A Universal Maize Yield Estimation Framework: Integrating Multi-Dimensional Environmental Features to Mitigate the Impacts of Contrasting Inter-Annual Hydrothermal Variability" Agriculture 16, no. 13: 1412. https://doi.org/10.3390/agriculture16131412
APA StyleMeng, L., Wang, Y., Ma, S., & Liu, H. (2026). A Universal Maize Yield Estimation Framework: Integrating Multi-Dimensional Environmental Features to Mitigate the Impacts of Contrasting Inter-Annual Hydrothermal Variability. Agriculture, 16(13), 1412. https://doi.org/10.3390/agriculture16131412