Article

Identification of QTLs and Candidate Genes for Cadmium Tolerance at the Seedling Stage in Rice
1
College of Agronomy, Qingdao Agricultural University, Qingdao 266109, China
2
Shenzhen Branch, Guangdong Laboratory for Lingnan Modern Agriculture, Genome Analysis Laboratory of the Ministry of Agriculture and Rural Affairs, Agricultural Genomics Institute at Shenzhen, Chinese Academy of Agricultural Sciences, Shenzhen 518120, China
3
State Key Laboratory of Crop Gene Resources and Breeding, Institute of Crop Sciences, Chinese Academy of Agricultural Sciences, Beijing 100081, China
4
National Nanfan Research Institute (Sanya), Chinese Academy of Agricultural Sciences, Sanya 572024, China
*
Authors to whom correspondence should be addressed.
These authors contributed equally to this work.
Agriculture 2026, 16(12), 1325; https://doi.org/10.3390/agriculture16121325
Submission received: 28 April 2026 / Revised: 31 May 2026 / Accepted: 14 June 2026 / Published: 16 June 2026
(This article belongs to the Special Issue Mapping and Functional Analysis of QTLs in Rice Breeding)

Abstract

Cadmium (Cd) contamination in agricultural soil poses a severe threat to rice growth and food safety worldwide. Seedling-stage Cd tolerance directly determines rice establishment and subsequent yield under Cd stress, but its genetic basis remains largely unclear. In this study, a genome-wide association study (GWAS) was conducted using 490 diverse accessions from the 3000 Rice Genome Project (3K RGP). Three biomass-related traits, shoot height (SH), shoot dry weight (SDW), and root dry weight (RDW), were measured under control and Cd stress conditions, along with their relative values. A total of 3,196,134 high-quality SNPs were used for genetic analysis, and population structure was corrected by principal component analysis (PCA) and kinship matrix. In total, 39 stable QTLs were detected, including 19 for RDW, 18 for SDW, and 2 for SH, most of which were specifically identified under Cd stress. Three major QTLs (qSDW1.1, qRDW3.2, qRDW5.2) were prioritized for candidate gene mining. Combining LD block analysis, gene annotation, Cd-responsive transcriptome data, and haplotype analysis, OsAKR2 (LOC_Os01g62870), OsAS1 (LOC_Os03g18130), and LOC_Os05g11320 were identified as key candidate genes regulating seedling Cd tolerance, and superior haplotypes of these genes were identified. This study reveals the genetic architecture of rice seedling Cd tolerance and provides elite QTLs, genes, and haplotypes for molecular breeding of Cd-resilient rice varieties.

1. Introduction

Cadmium (Cd) contamination of agricultural soils has become a widespread environmental concern, driven by industrialization, improper waste disposal, and excessive use of Cd-containing fertilizers [1,2]. Recent studies estimated that approximately 14–17% of global croplands are contaminated by toxic heavy metals, with Cd being one of the most widespread pollutants, particularly in major rice-producing regions of Asia [3]. As a non-essential and highly toxic heavy metal with strong persistence, Cd readily accumulates in agricultural soils and is easily absorbed by plants, severely inhibiting plant growth and development. Rice (Oryza sativa L.), a staple food for more than half of the global population, is particularly sensitive to Cd stress due to its cultivation under flooded conditions and efficient metal uptake systems [2]. Cd in rice is mainly taken up by roots and can be translocated to aboveground tissues, where it ultimately accumulates in grains [4]. Excessive Cd accumulation in rice plants disrupts nutrient homeostasis, induces oxidative damage, and suppresses root and shoot growth [4]. Among different developmental stages, the seedling stage is especially critical for rice establishment, as Cd stress at this phase inhibits root elongation, restricts shoot growth, disrupts nutrient uptake, and induces oxidative damage, ultimately reducing yield potential and stress resilience in mature plants [5,6]. Therefore, dissecting the genetic basis of Cd tolerance at the seedling stage is essential for breeding low-Cd-accumulating and stress-resilient rice varieties.
During the last two decades, considerable advances have been achieved in understanding the molecular mechanisms involved in Cd uptake and transport in rice. In addition, to cope with Cd stress, rice has evolved multiple tolerance mechanisms, including restricted uptake, vacuolar sequestration, and antioxidant defense systems [4]. Cd uptake in roots is primarily mediated by transporters such as OsNRAMP5 and OsNRAMP1, which originally evolved for essential micronutrient acquisition [7,8]. After root uptake, Cd is translocated to shoots through xylem loading mediated by transporters such as OsHMA2 and other metal transporters, and is subsequently redistributed to grains via phloem transport [9]. To alleviate Cd toxicity, rice has evolved sophisticated detoxification mechanisms, including vacuolar sequestration mediated by OsHMA3 and OsABCC transporters, chelation by phytochelatins and defensin-like proteins, and reactive oxygen species (ROS) scavenging through antioxidant systems [10,11]. These processes are tightly coordinated and often influenced by interactions with essential micronutrients such as Fe, Zn, and Mn. However, most previous studies have primarily focused on Cd uptake, transport, and accumulation, whereas the natural genetic variation underlying Cd tolerance, particularly growth maintenance under Cd stress at the seedling stage, remains insufficiently understood. In addition, biomass-related traits associated with seedling Cd tolerance have rarely been systematically dissected at the population level.
Genome-wide association study (GWAS) has become a powerful approach for dissecting complex agronomic traits by leveraging natural variation in diverse populations, generally providing higher mapping resolution than traditional bi-parental mapping [12]. QTLs identified through GWAS represent key genomic regions underlying complex traits and provide valuable resources for molecular breeding [13]. The 3000 Rice Genome Project (3K RGP), which includes 3010 genetically diverse accessions, provides millions of high-quality single-nucleotide polymorphisms (SNPs) capturing extensive genetic diversity [14]. This resource has been extensively utilized for the identification of QTLs and candidate genes associated with various abiotic stresses, and has facilitated the utilization of favorable alleles in marker-assisted selection and rice breeding programs, including salinity, drought, and heavy metal tolerance [15,16,17,18]. However, its application in dissecting Cd tolerance at the seedling stage remains limited, particularly for biomass-related traits such as shoot height (SH), root dry weight (RDW), and shoot dry weight (SDW) [19].
In this study, we performed a high-resolution GWAS using the 3K RGP panel to identify QTLs associated with SH, RDW, and SDW at the seedling stage under Cd stress. This study aimed to uncover new candidate genes and superior haplotypes regulating seedling Cd tolerance. These findings will advance our understanding of the molecular basis of Cd stress adaptation at the early growth stage and provide valuable genetic resources for breeding low-Cd-accumulating and stress-resilient rice varieties.

2. Materials and Methods

2.1. Plant Materials

A total of 490 rice accessions, originating from 48 countries worldwide, were selected from the 3000 Rice Genomes Project (3K RGP) [14] to evaluate cadmium (Cd) tolerance-related traits at the seedling stage (Table S1). These accessions were classified into five major subgroups, including indica/xian (n = 301), japonica/geng (n = 131), admix (n = 19), Aus (n = 29), and Basmati (n = 10) (Table S1).

2.2. Evaluation of Cd Tolerance Related Traits at the Seedling Stage in Hydroponic Systems

A total of 100 seeds from each accession were incubated in an oven at 50 °C for 3 days to break dormancy, and then surface-sterilized with 3% NaClO (Beijing Chemical Plant Co., Ltd., Beijing, China) for 30 min and rinsed three times with sterile water. Subsequently, the seeds were immersed in water for 36 h and allowed to germinate for 12 h. For each accession, 8 uniformly germinated seeds were transferred into a 96-well plate with holes perforated at the bottom for both the control and treatment groups per replicate, with three biological replications established. The plates were then floated in plastic containers filled with tap water and maintained under growth conditions of 70% relative humidity, with a photoperiod consisting of 13 h of light at 28 °C and 11 h of darkness at 25 °C. Following 7 days of cultivation in distilled water, the medium was replaced with Yoshida nutrient solution (pH 5.8–6.0) [20], which was refreshed at 3-day intervals. At the three-leaf stage, the plants were treated with 2 mg L−1 (8.76μM) CdCl2·2.5H2O (Sinopharm Chemical Reagent Co., Ltd., Shanghai, China) solution [21]. After 21 days of treatment, the shoot height (SH), shoot dry weight (SDW), and root dry weight (RDW) were measured under both control (grown under normal conditions without Cd treatment) and Cd treatment conditions [22]. The relative values of each trait were calculated as the ratios of the measurements under Cd treatment to those under control conditions, including RSH, RSDW, and RRDW.

2.3. Genotyping Data Analysis

The 4.8 M SNP genotype dataset of the 490 rice accessions was obtained from the 3000 Genomes Rice Project [23] and processed using PLINK 1.9 software [24]. To reduce the likelihood of false-positive associations, SNPs exhibiting a missing rate ≥ 10% and minor allele frequency ≤ 5% were excluded from further analysis. Following quality filtering, a total of 3,196,134 high-quality SNPs were retained and used for population structure assessment and genome-wide association study (GWAS). Principal component analysis (PCA) and kinship matrix (K) estimation were conducted using PLINK 1.9 software to evaluate population structure, and these parameters were incorporated into the subsequent association analysis.

2.4. Identification of QTLs for Cd Tolerance at the Seedling Stage by GWAS

Genome-wide association analysis was conducted using EMMAX [25] based on a mixed linear model (MLM), integrating PCA and kinship matrix information (PCA + K), to identify associations between SNP markers and Cd tolerance-related traits. The effective number of SNPs (N) was calculated using GEC software [26], and the Bonferroni correction method (1/N) was applied to establish the suggestive significance threshold (p = 1.93 × 10⁻⁶). Manhattan plots representing GWAS results were generated using R (v4.3.2) package “qqman” [27]. Based on the previously reported linkage disequilibrium (LD) decay pattern in the 3K Rice Genome Project (3K RGP) [14], significant SNPs located within a 300 kb interval were considered to represent a QTL region. The SNP exhibiting the minimum p-value within each locus was designated as the lead SNP. Linkage disequilibrium block analysis was performed using LDBlockShow 1.4.0 [28]. Important QTLs were selected according to the following criteria: (1) QTLs simultaneously associated with at least two traits and containing more than two significant SNPs, and (2) QTLs strongly associated with a single trait and containing more than two significant SNPs.

2.5. Candidate Gene Identification for the Important QTL

Linkage disequilibrium (LD) blocks containing trait-associated significant SNPs were defined as candidate regions. LD between SNPs was estimated using the squared Pearson’s correlation coefficient (r2) implemented in the R (v4.3.2) package “genetics”. LD heatmaps around the peak regions were generated using the R (v4.3.2) package “LDheatmap” [27]. Candidate genomic intervals were further refined based on an LD threshold of r2 ≥ 0.6 [29].
Significant SNPs located within QTL intervals were annotated according to their genomic positions, and genes containing SNPs within promoter regions or missense variants in coding sequences were identified as candidate genes. Cd-responsive expression patterns were then examined using publicly available transcriptome data from the PlantRNA Database (https://plantrnadb.com/ricerna/, accessed on 15 December 2025), with a fold-change threshold > 2.0, to provide additional supportive evidence for candidate gene evaluation. Haplotype analysis was subsequently performed using the selected 490 accessions from the 3K for each candidate gene. In addition, functional annotations related to Cd tolerance were considered as complementary information for gene prioritization. Ultimately, candidate genes were identified based on the combined evidence of haplotype effects, functional annotation, and supportive expression data.

2.6. Data Analysis

Statistical analyses were conducted using R software (v4.3.2) and Microsoft 365 Excel (v16.0.17328.20000; https://www.microsoft.com/excel, accessed on 23 March 2025). Phenotypic differences between the Xian and Geng subpopulations were assessed using Student’s t-test. Pearson’s correlation coefficients among traits were calculated using the R package “corrplot”. One-way analysis of variance (ANOVA) followed by Duncan’s multiple range test (p < 0.05) was used to evaluate phenotypic differences among gene haplotypes when more than two groups were compared. Two-tailed t-tests were applied for pairwise comparisons.

3. Results

3.1. Phenotypic Variations

Three traits were measured under control and Cd tolerance conditions, including shoot height (SH), shoot dry weight (SDW), and root dry weight (RDW). The relative values of each trait were calculated as the ratios of the measurements under Cd treatment to those under control conditions, including RSH, RSDW, and RRDW.
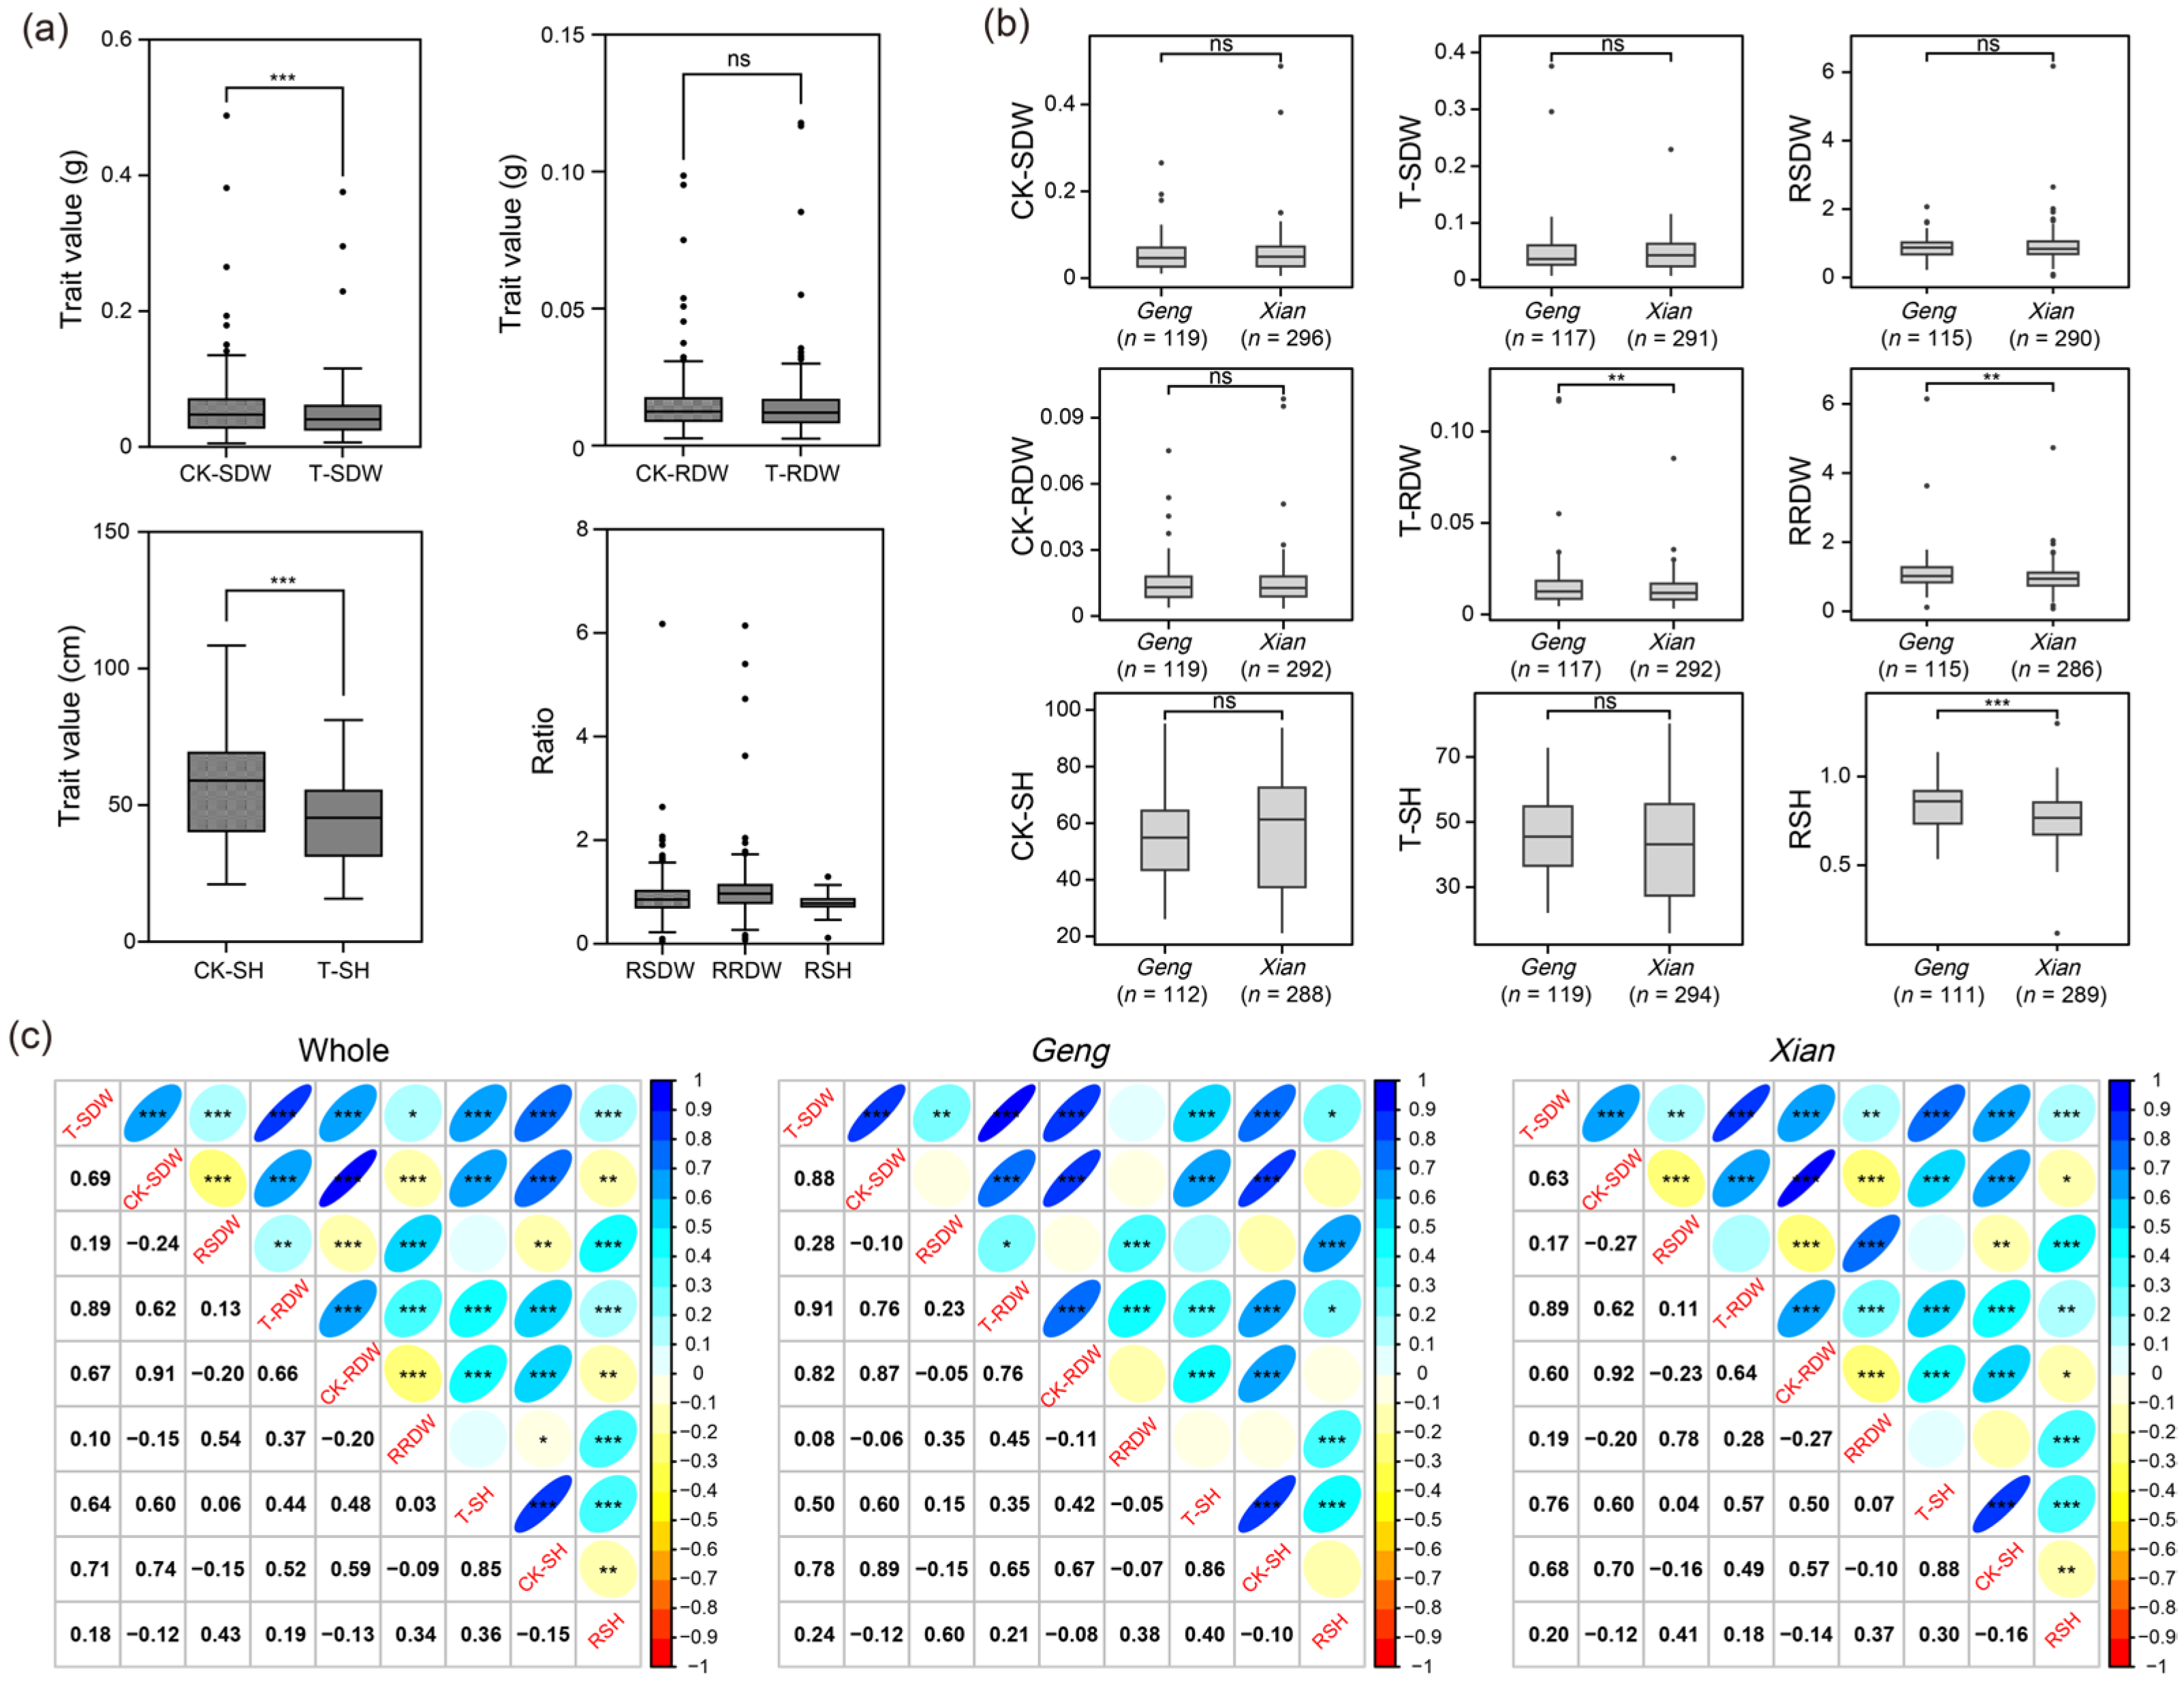
The rice panels used in this study showed wide variations for all the measured traits (Figure 1a), indicating their suitability for genome-wide association analysis. Under Cd treatment, SDW and SH were significantly reduced by 16.2% and 20.8%, respectively, compared with the control, whereas RDW remained unchanged (Figure 1a). To further investigate whether Cd tolerance differs between the xian/indica and geng/japonica subpopulations, a comparative analysis was conducted. Under normal conditions, no significant differences were observed in shoot SH, RDW, and SDW between the two subpopulations. Under Cd stress, a significant difference was detected only for RDW, with the RDW of the geng subpopulation being significantly higher than that of the xian subpopulation by 22.9%. In contrast, SDW and SH showed no significant differences. For the ratios of Cd-treated to control condition, RSDW showed no significant difference between xian and geng, whereas RRWD and RSH differed significantly between the two subpopulations (Figure 1b). Specifically, the geng subpopulation exhibited significantly higher RSH and RRDW values than the xian subpopulation by 9.93% and 22.58%, respectively.
Across the whole population as well as the xian and geng subpopulations, each trait showed a significant positive correlation between normal and Cd-treated conditions. In addition, SH, SDW, and RDW were significantly positively correlated with each other under both conditions. In the whole population and the xian subpopulation, the ratios of Cd-treated to control conditions were negatively correlated with trait values under normal conditions but positively correlated with those under Cd treatment. In contrast, in the geng subpopulation, these ratios were positively correlated with trait values under Cd treatment but showed no correlation with those under normal conditions (Figure 1c). Traits with stronger correlations were more likely to co-localize with QTLs.

3.2. Genotype Analysis

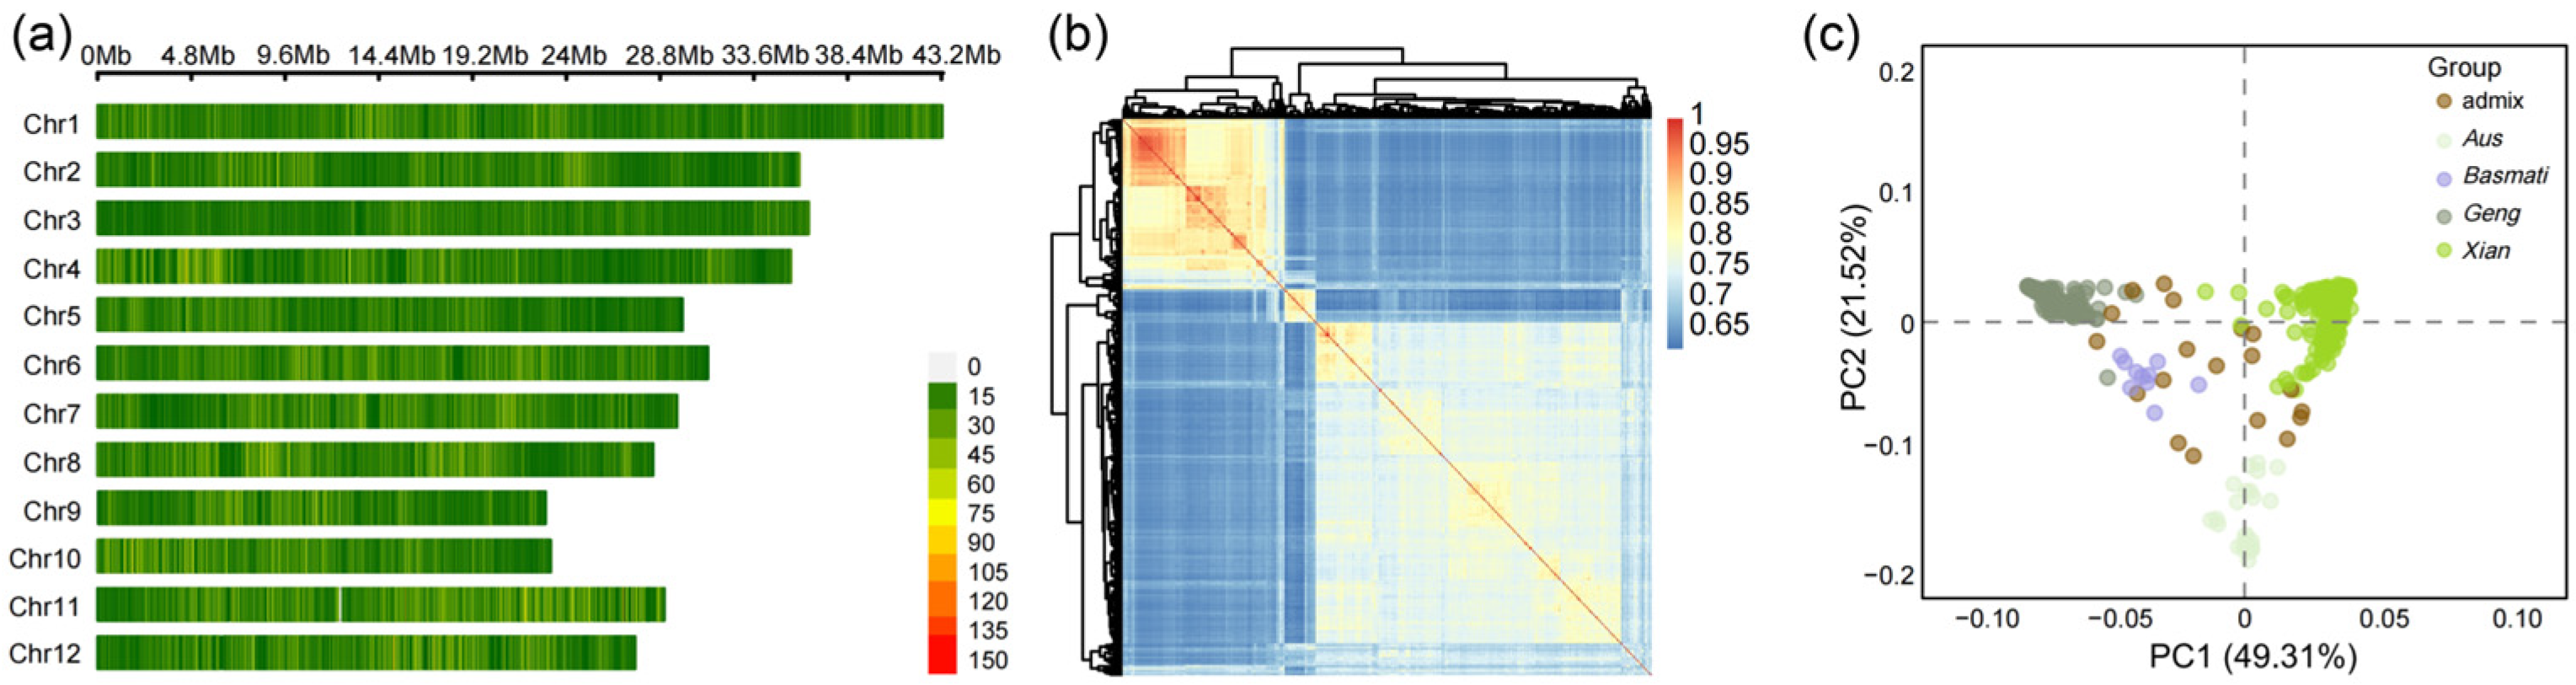
After excluding SNPs with missing rates over 10% and minor allele frequency (MAF) less than 5% were removed, a total of 3,196,134 high-quality SNPs remained for genotypic analyses. The number of SNPs distributed across chromosome varied from 187,247 on chromosome 9 to 402,810 on chromosome 1. The genomic span covered by mapped SNPs on each chromosome ranged from 22.90 Mb (chromosome 9) to 43.25 Mb (chromosome 1), resulting in total genome coverage of 372.98 Mb. The average marker spacing was 116.70 bp, ranging from 104.35 bp (chromosome 10) to 137.48 bp (chromosome 4) (Figure 2a). These results indicate a high-density SNP dataset suitable for genome-wide association analysis.
Principal component analysis (PCA) together with kinship matrix (K) analysis was carried out to evaluate the population structure among the 490 rice accessions (Figure 2b,c). The PCA results showed that accessions clustered together in subpopulations (Figure 2c), which was consistent with the kinship heatmap (Figure 2b), indicating a clear population structure.

3.3. Identification of QTLs for Cd Tolerance at the Seedling Stage by GWAS

We conducted GWAS based on the mixed linear model for the phenotypes of SH, RDW, and SDW under control, Cd stress conditions, and the ratio of Cd-treated to control. A total of 39 QTLs were identified for these traits, including 19 QTLs influencing RDW, 18 QTLs for SDW, and two QTLs for SH (Figure S1; Table 1). The number of significant SNPs within individual QTLs varied widely, ranging from 5 to 751, with most QTLs containing 10–100 significant SNPs, while a few major loci, such as qRDW5.3 and qSDW5.3, harbored hundreds of significant SNPs, indicating strong genetic effects. The distribution of QTLs was environment-dependent. Under Cd stress conditions, the majority of QTLs were detected (14 for RDW, 11 for SDW, and all 2 for SH), with each QTL supported by 5 to 751 significant SNPs. In contrast, fewer QTLs were identified under normal conditions (3 for RDW and 2 for SDW) and ratio conditions (2 for RDW and 5 for SDW), generally with moderate numbers of significant SNPs (Table 1).
Notably, multiple QTLs co-localized within the same genomic regions. For example, QTLs on chromosome 3 (qRDW3.2 and qSDW3.3, and qRDW3.5 and qSDW3.6) and chromosome 5 (qRDW5.1 and qSDW5.2, and qRDW5.3 and qSDW5.3) were repeatedly identified for both SDW and RDW across different environments, suggesting shared genetic control of these traits. In addition, some regions harbored multiple QTLs for the same trait, further supporting the stability of these loci (Table 1). Several QTLs overlapped with previously reported Cd-related genes. For instance, qRDW3.5 and qSDW3.6 overlapped with OsERS1 and OsGAI, and qRDW9 and qSDW9 were located near OsCOPT7. These co-localizations further support the reliability and biological relevance of the identified loci (Table 1). Based on multiple criteria, including association significance, trait co-localization, and biological relevance, three QTLs (qRDW3.2/qSDW3.3, qSDW1.1, and qRDW5.2) were selected for downstream analyses. Among them, qRDW3.2/qSDW3.3 was identified as a consistently detected locus across environments, and qSDW1.1 and qRDW5.2 showed relatively strong association signals and were also selected for subsequent candidate gene analysis.

3.4. Candidate Gene and Haplotype Analysis

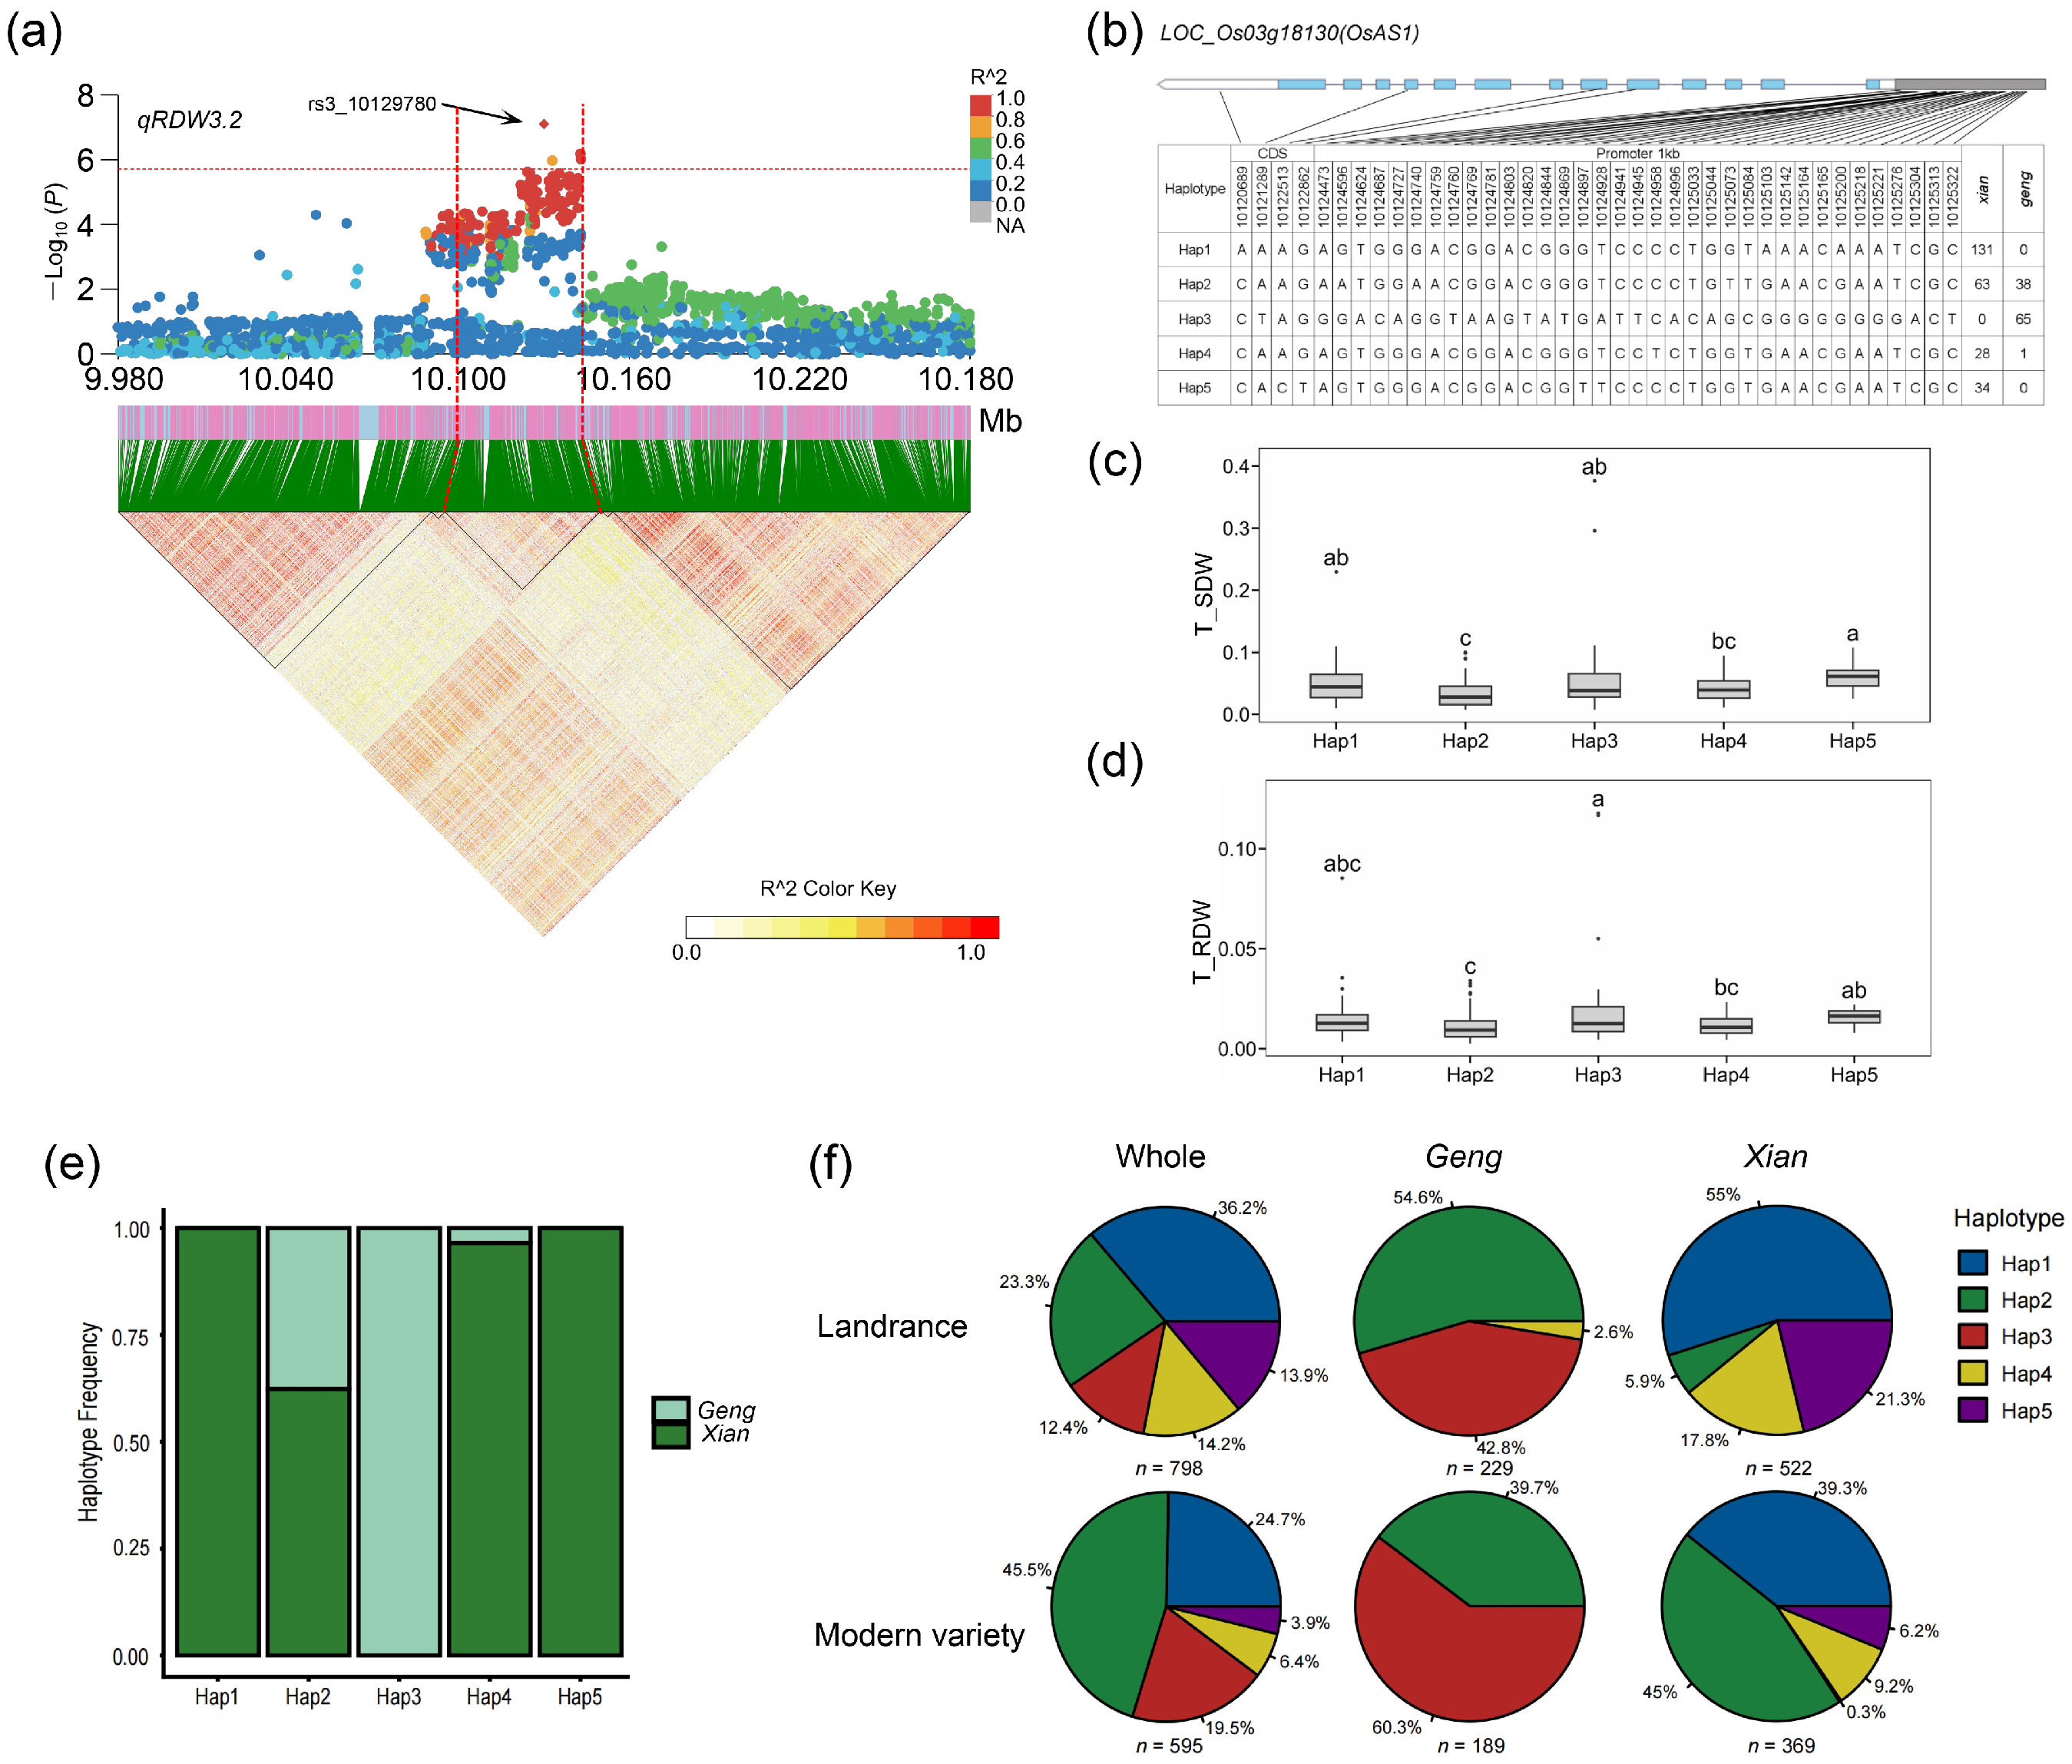
Through LD block analysis, the candidate interval of qRDW3.2 was fine-mapped to a 51 kb region spanning 10.09–10.14 Mb on chromosome 3 (Figure 3a). According to the China Rice Data Center (https://www.ricedata.cn/gene/, accessed on 23 March 2025), this interval harbors a total of six genes. Of the four trait-associated significant SNPs identified within this region, only one was located in the promoter regions of LOC_Os03g18130 (Table S2). Using publicly available plant transcriptome datasets, we found that LOC_Os03g18130 was significantly responsive to Cd stress (Table S2).
Haplotype analysis was subsequently conducted for LOC_Os03g18130 using the phenotypic data of target traits, and it displayed highly significant phenotypic differences across haplotypes (Figure 3b–d). For OsAS1, accessions carrying Hap3 and Hap5 exhibited substantially higher average T_SDW and T_RDW values compared to those harboring Hap2 at the 0.05 significance level, confirming Hap3 and Hap5 as the elite haplotype for biomass accumulation under Cd stress (Figure 3b–d). LOC_Os03g18130 is annotated as OsAS1, a well-documented growth-regulatory gene [40], though its functional role in Cd stress tolerance has not yet been characterized.
Notably, OsAS1 exhibited striking haplotype frequency divergence between Geng and Xian accessions (Figure 3e). Further analysis in landrace and modern variety panels revealed that the haplotype distribution pattern remained highly consistent across both germplasm groups (Figure 3f). In landraces, Hap3 represented 12.4% of the whole population, with 42.8% frequency in Geng. In modern varieties, Hap3 accounted for 19.5% of the entire population, reaching 60.4% in Geng (Figure 3f). For Hap5, 13.9% (19.5%) and 21.3% (6.2%) of the whole and Xian group, respectively, were in landraces (modern varieties). Collectively, these findings demonstrate that OsAS1 has been subjected to strong directional selection during rice domestication and genetic improvement, leading to subspecies-specific haplotype fixation that underpins the divergent biomass accumulation strategies of Geng and Xian rice under Cd stress.
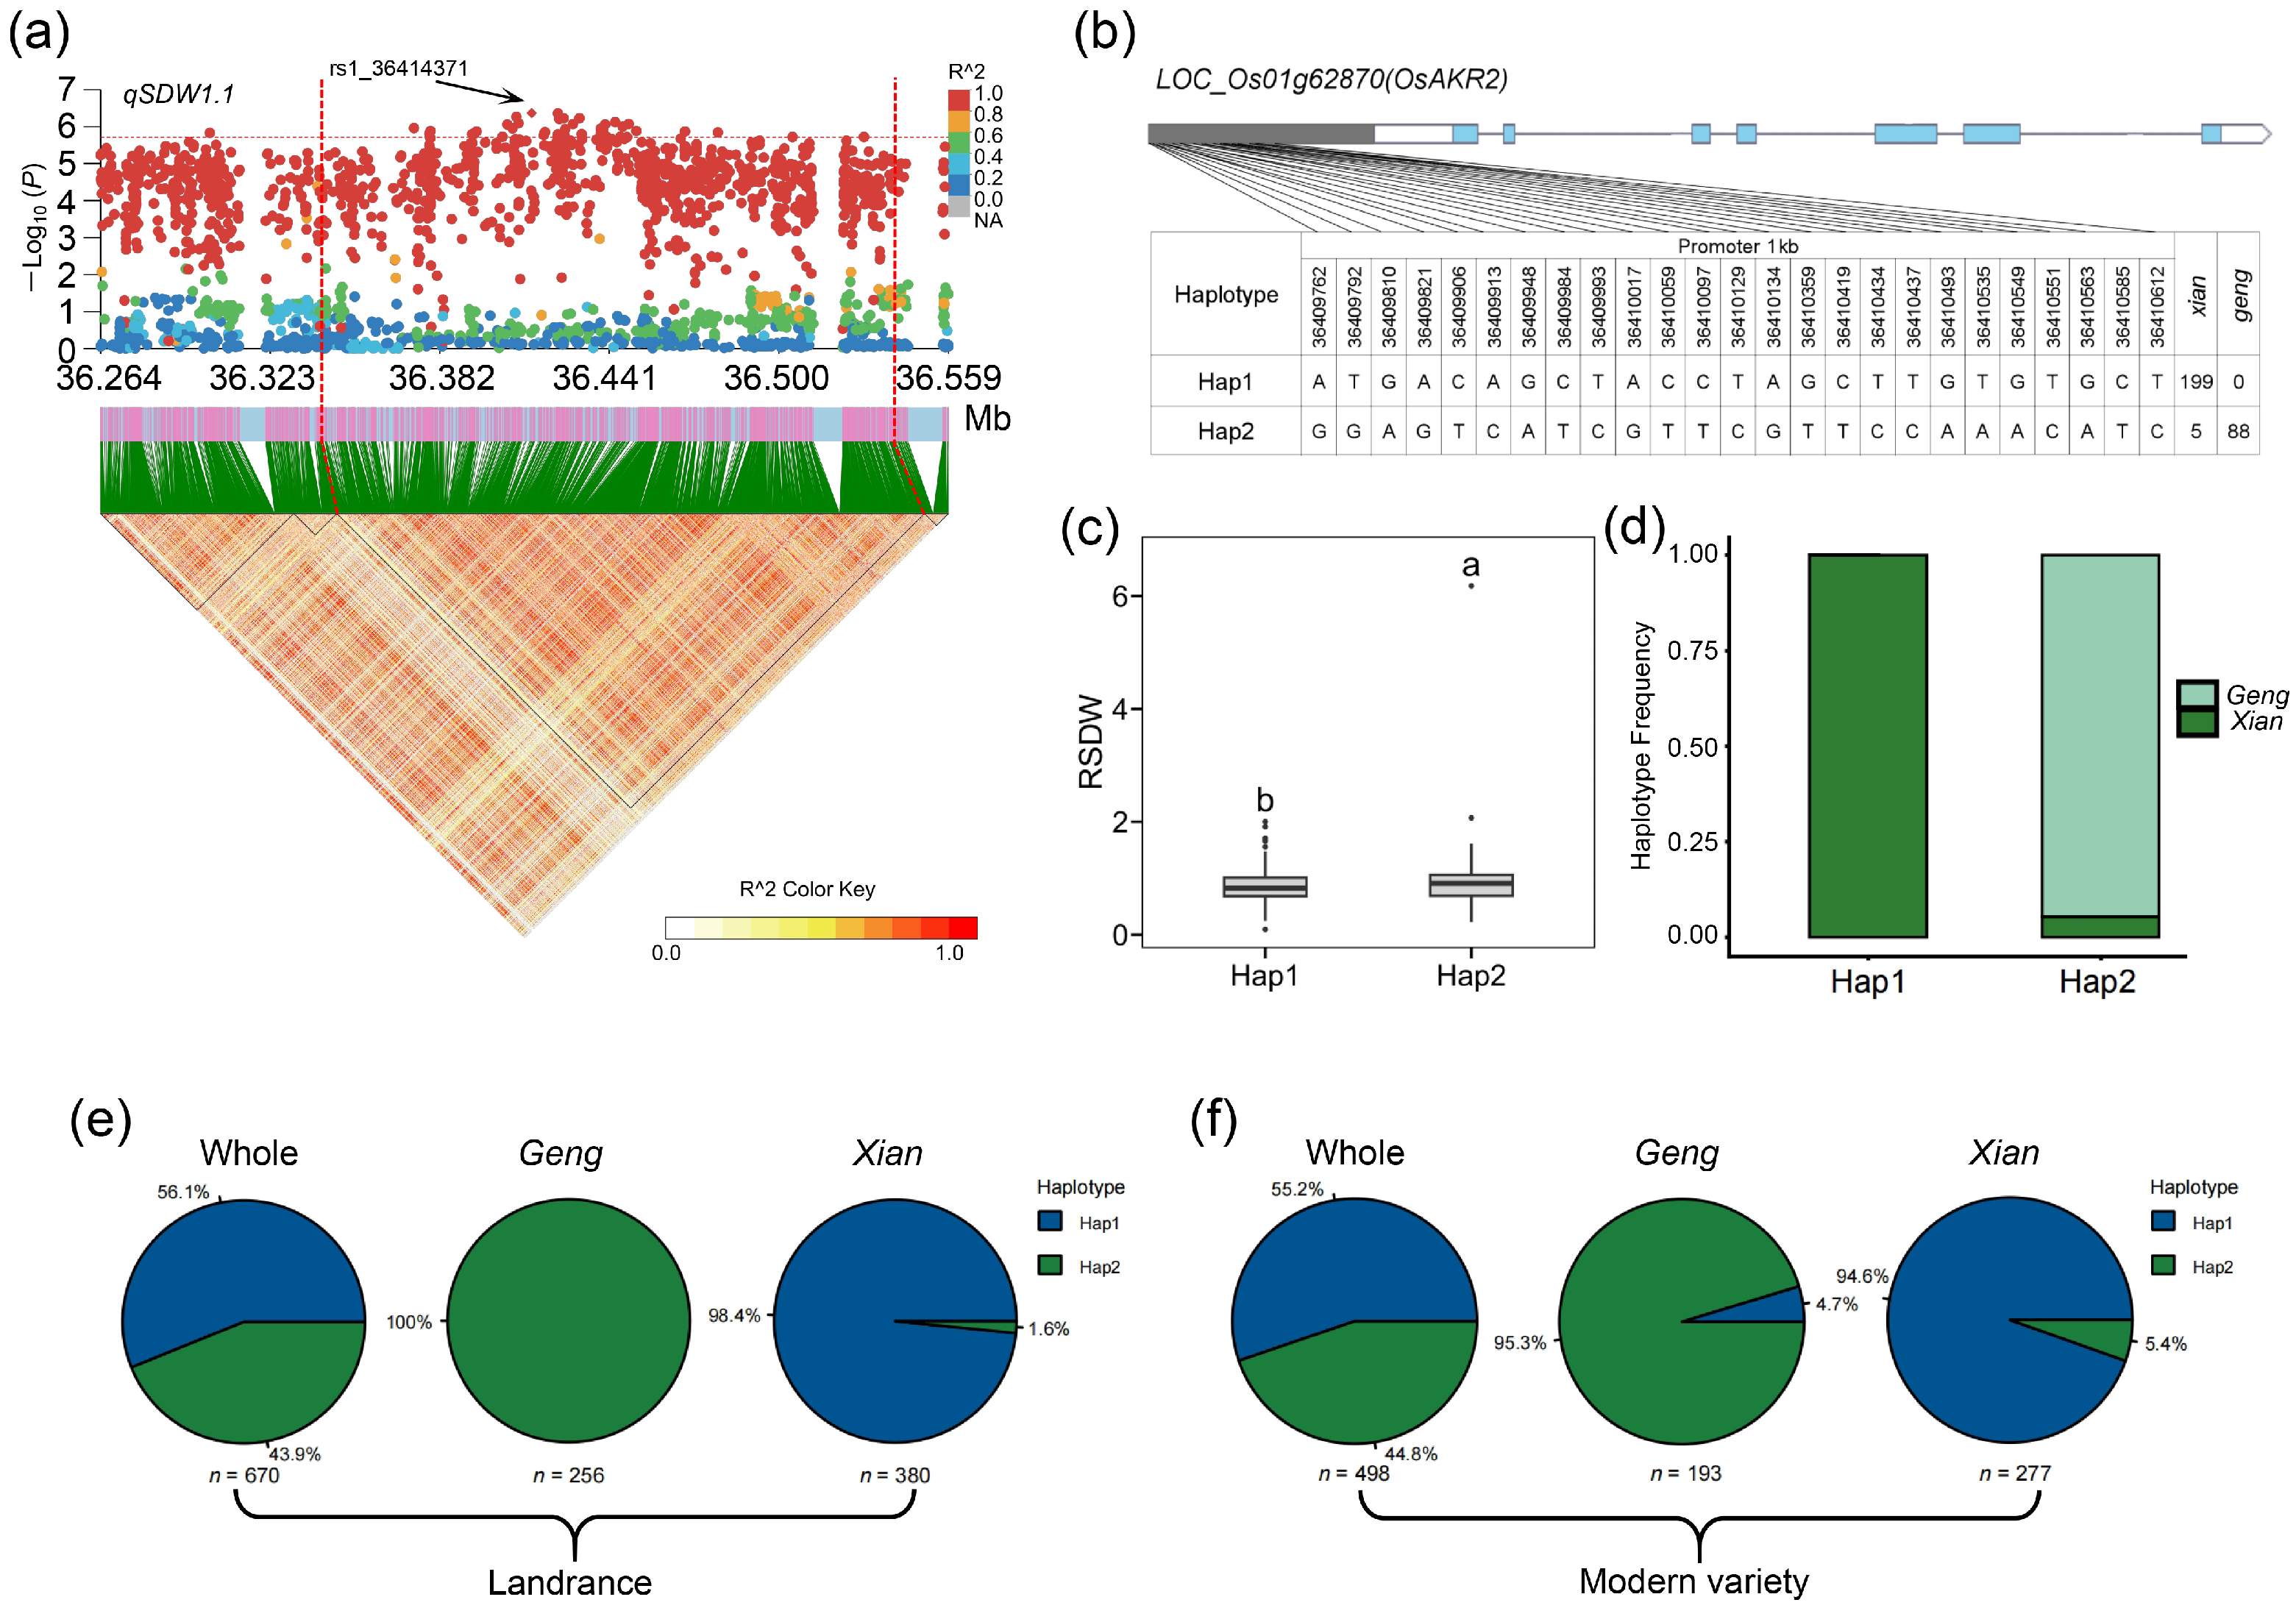
The candidate region of qSDW1.1 was identified to span from 36.34 Mb to 36.54 Mb (200 kb) on chromosome 1, based on the LD block analysis (Figure 4a). There were 28 genes in this region according to the China Rice Data Center (https://www.ricedata.cn/gene/, accessed on 23 March 2025). Among the 41 SNPs significantly associated with the trait within the region, 12 and 2 SNPs were located in the promoter of 8 genes and CDS (missense variant) of 2 genes, respectively (Table S3). Based on publicly available plant transcriptome datasets (https://plantrnadb.com/ricerna/, accessed on 23 March 2025), LOC_Os01g62800, LOC_Os01g62810, LOC_Os01g62830, LOC_Os01g62870, LOC_Os01g62880, LOC_Os01g62890, LOC_Os01g62900, LOC_Os01g62910, LOC_Os01g62920, LOC_Os01g62970, and LOC_Os01g63050 were identified as significantly Cd-responsive genes, exhibiting a fold change greater than 2.00 (Table S3). We performed haplotype analysis for the 11 candidate genes using the phenotype of target traits (Figure S2). Among the 11 candidate genes, only 2 genes (LOC_Os01g62800, LOC_Os01g62870) exhibited significant differences among different haplotypes (Figure S2 and Figure 4b,c). LOC_Os01g62870 was annotated as OsAKR2, a previously reported stress-responsive aldo-keto reductase gene [41], which may be the candidate gene affecting Cd tolerance. For LOC_Os01g62870, the transition from Hap1 to Hap2 resulted in significantly higher average RSDW values in Hap2 compared with Hap1 at the 0.05 significance level, indicating that Hap2 represents the favorable haplotype for RSDW. Similarly, for LOC_Os01g62800, Hap4 exhibited significantly greater average RSDW values than the remaining haplotypes at the 0.05 significance level.
For OsAKR2, Hap1 was almost fixed in Xian accessions, while Hap2 was dominant in Geng accessions (Figure 4d). Further investigation in landraces and modern variety groups demonstrated that the haplotype distribution pattern was consistent across both groups (Figure 4e,f). In landraces, Hap1 accounted for 56.1% of the whole population, with 98.4% in Xian and 100% Hap2 in Geng. In modern varieties, Hap1 frequency reached 55.2% in the whole population, with 94.6% in Xian and 95.3% Hap2 in Geng (Figure 4e,f). These results indicated that the OsAKR2 has undergone strong directional selection during rice domestication and improvement, with distinct haplotypes fixed in the two major subspecies, contributing to their divergent biomass allocation strategies.
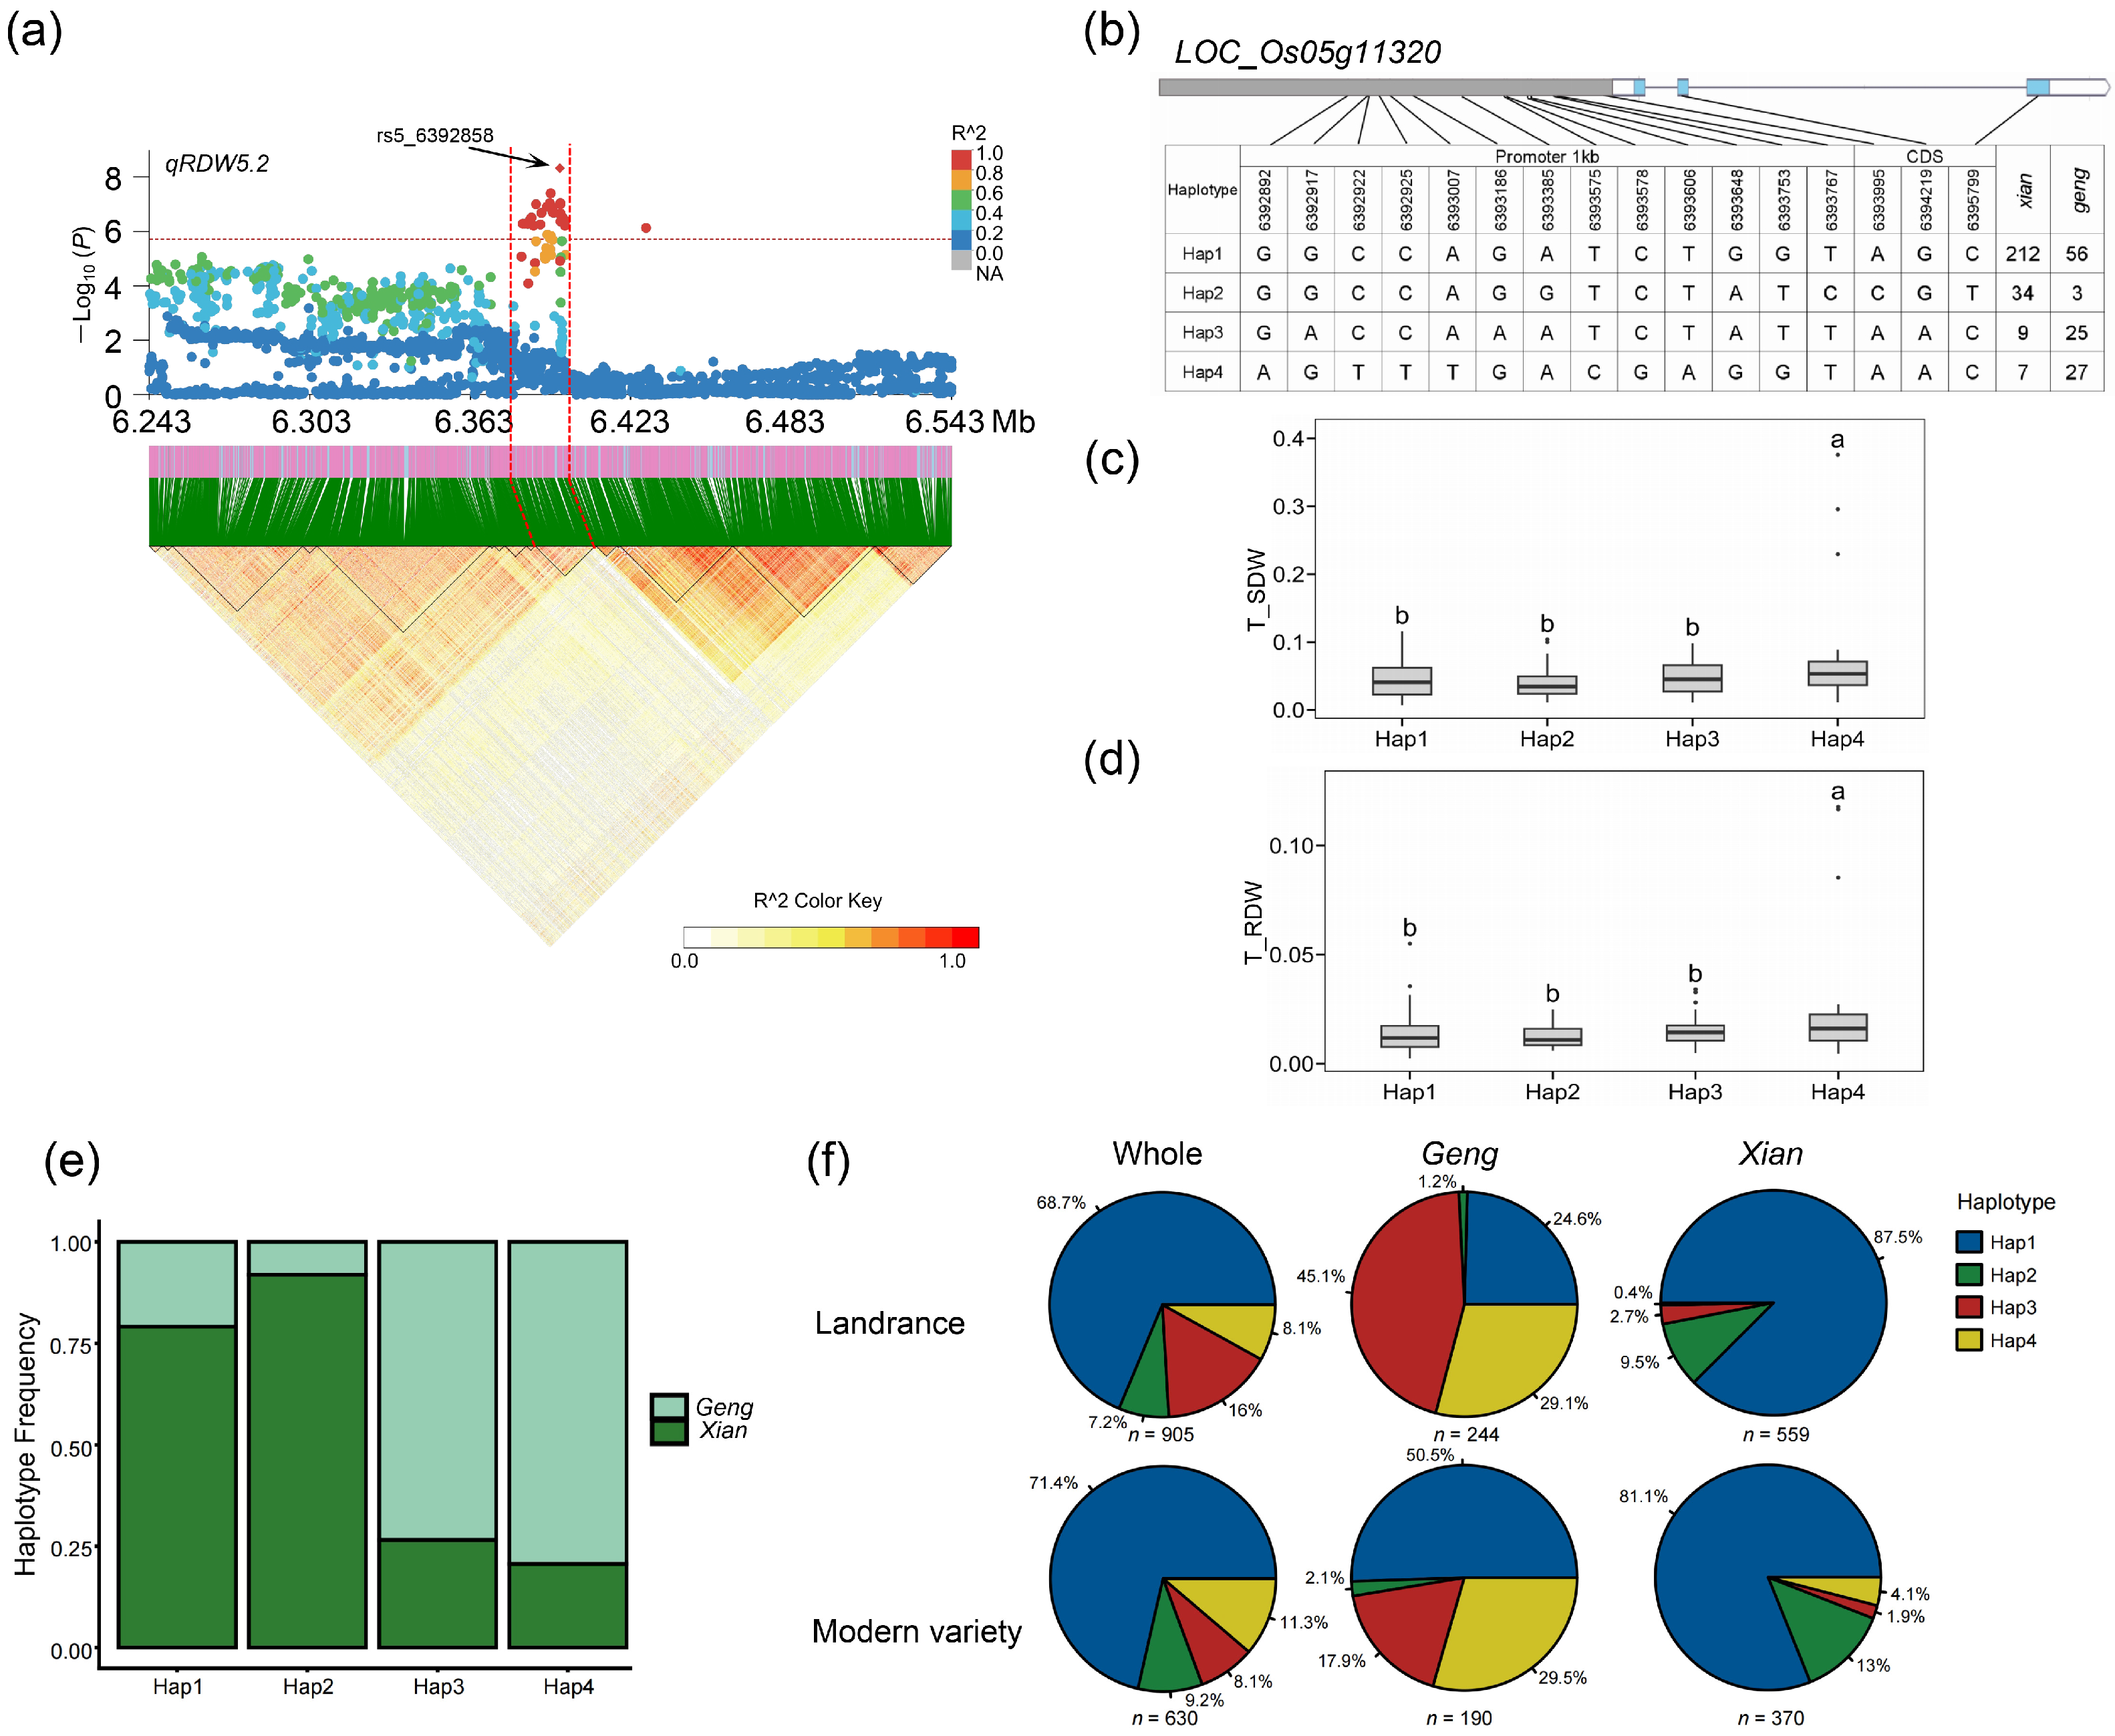
To fine-map the genetic locus underlying root dry weight under Cd stress, we performed linkage disequilibrium block analysis, which delimited the candidate interval of qRDW5.2 to a 21 kb region spanning 6.38–6.40 Mb on chromosome 5 (Figure 5a). Annotation from the China Rice Data Center revealed a total of three annotated genes within this interval. Among the 29 significant SNPs associated with the target trait in this region, 4 were located in the promoter regions of LOC_Os05g11320 (Table S4). By mining publicly available plant transcriptome datasets, we identified LOC_Os05g11320 as a significantly Cd-responsive gene, with expression fold changes greater than 2.00 (Table S4).
We then conducted haplotype analysis for LOC_Os05g11320, using the SDW and RDW under Cd stress, and it showed highly significant phenotypic differences across its haplotypes (Figure 5b–d). For this gene, accessions carrying Hap4 exhibited significantly higher average SDW and RDW values compared to accessions with other haplotypes, confirming Hap4 as the superior haplotype for biomass accumulation under Cd stress. A consistent pattern was observed for RDW, where Hap4 consistently conferred significantly higher phenotypic values than the other haplotypes.
A striking divergence in haplotype frequency was observed between Geng and Xian subpopulations, with Hap1 and Hap2 being nearly fixed in Xian accessions while Geng accessions were dominated by Hap3 and Hap4 (Figure 5e). Further analysis in landrace and modern variety groups demonstrated that this haplotype distribution pattern was highly conserved across both germplasm panels (Figure 5f). In landraces, Hap4 accounted for 8.1% of the whole population, with 0.4% in Xian and 29.1% in Geng. In modern varieties, Hap4 frequency reached 11.3% in the whole population, with 4.1% in Xian and 29.5% in Geng (Figure 5f). These findings collectively indicate that the LOC_Os05g11320 has experienced strong directional selection during rice domestication and genetic improvement, resulting in subspecies-specific haplotype fixation that contributes to the divergent biomass accumulation strategies of Geng and Xian rice under cadmium stress.

4. Discussion

This study reveals the genetic architecture of cadmium (Cd) tolerance at the rice seedling stage. Using a diverse subset of the 3K RGP panel, we identified 39 QTLs and three key candidate genes associated with seedling growth under Cd stress, highlighting the complex and polygenic nature of this trait.
Phenotypic analysis revealed substantial natural variation in seedling growth under Cd stress. While shoot height (SH) and shoot dry weight (SDW) were significantly reduced, root dry weight (RDW) remained relatively stable, suggesting differential sensitivity of above- and below-ground tissues. Similar differential responses between above- and below-ground biomass traits under Cd stress have also been reported in previous studies in rice [41]. This pattern may reflect differential allocation of biomass under heavy metal stress, where shoot growth is more sensitive to Cd-induced inhibition of photosynthesis and nutrient transport than root development. Significant differences between Xian and Geng subgroups in relative traits further indicate subspecies divergence in Cd tolerance, consistent with previous reports [2,19,42]. Strong positive correlations among SH, SDW, and RDW, together with the co-localization of QTLs on chromosomes 3 and 5, suggest shared genetic regulation or pleiotropic effects. Such loci are particularly valuable for breeding programs aiming to simultaneously improve multiple Cd tolerance-related traits.
Most QTLs were specifically detected under Cd stress, supporting their environment-dependent effects. This is consistent with previous studies showing that abiotic stress-related loci are often condition-specific [43,44]. The co-localization of identified QTLs with known genes involved in growth and stress responses, such as OsERS1 [45], OsGAI [32], and OsCOPT7 [34], further validates the reliability of our GWAS results and suggests partial overlap between growth regulation and Cd stress adaptation pathways. Together, these findings highlight the highly polygenic and environment-dependent nature of Cd tolerance at the seedling stage and further support that multiple biological processes related to growth regulation and stress responses may contribute to variation in Cd tolerance.
Among the candidate genes, OsAKR2 likely contributes to Cd tolerance by mitigating oxidative damage through detoxification of reactive carbonyl compounds generated under Cd-induced oxidative stress [40]. OsAS1, encoding asparagine synthetase, may enhance Cd tolerance by maintaining nitrogen assimilation, thereby sustaining cellular metabolism and growth under stress [41]. LOC_Os05g11320 represents a novel candidate gene; although its molecular function remains unknown, its strong phenotypic effect suggests a potential role in growth regulation or stress adaptation pathways, warranting further functional validation. These results highlight that Cd tolerance in rice is closely associated with both stress defense and growth regulation pathways.
Haplotype analysis revealed clear subspecies differentiation for all three candidate genes, with superior haplotypes predominantly enriched in Geng. This pattern likely reflects adaptive divergence to distinct agro-ecological environments with varying soil metal availability. The consistent enrichment of elite haplotypes across landraces and modern varieties suggests that these loci may have undergone selection during rice domestication and improvement. This pattern implies that allelic variation at these loci may have been shaped by both natural selection and artificial selection during rice domestication and breeding. Pyramiding these superior alleles across subspecies could provide an effective strategy for enhancing Cd tolerance in rice breeding programs.
Despite these findings, several limitations remain. The molecular functions of candidate genes in Cd uptake, transport, and detoxification require validation through functional genomics approaches. In addition, epistatic interactions among QTLs and the interplay between Cd and essential micronutrients (Fe, Zn, Mn) need further investigation [2]. Future studies integrating multi-omics approaches and field-based validation will be essential to fully elucidate the regulatory networks underlying Cd tolerance.
In conclusion, this study reveals the complex genetic architecture of rice seedling Cd tolerance, identifies stable QTLs and elite haplotypes, and provides three key candidate genes. These findings not only enhance our understanding of Cd stress adaptation mechanisms but also offer valuable genetic resources for molecular breeding of low-Cd-accumulating, stress-resilient rice varieties, supporting sustainable agriculture and food safety in Cd-contaminated regions.

5. Conclusions

This study evaluated Cd tolerance-related traits in rice under both normal and Cd stress conditions and revealed substantial phenotypic variation among accessions. Comparative analyses between subpopulations showed that geng/japonica accessions generally exhibited stronger Cd tolerance than xian/indica accessions.
Based on these phenotypic variations, 39 stable QTLs associated with Cd tolerance were identified at the seedling stage through GWAS. Three key candidate genes—OsAKR2, OsAS1, and LOC_Os05g11320—along with their superior haplotypes, were further characterized. These findings elucidate the genetic basis of cadmium tolerance at the seedling stage and provide valuable genetic resources for the molecular breeding of low-cadmium-accumulating rice varieties. Future studies will focus on functional validation of these candidate genes and their application in rice breeding to improve Cd tolerance and food safety.

Supplementary Materials

The following supporting information can be downloaded at: https://www.mdpi.com/article/10.3390/agriculture16121325/s1, Figure S1: Manhattan plot and Q–Q plot of the genome-wide association study; Figure S2: Haplotype analysis of candidate genes underlying qSDW1.1 on chromosome 1; Table S1: Information of the materials used in this study; Table S2: Candidate gene analysis of qRDW3.2 on chromosome 3; Table S3: Candidate gene analysis of qSDW1.1 on chromosome 1; Table S4: Candidate gene analysis of qRDW5.2 on chromosome 5.

Author Contributions

Conceptualization, J.X. and P.M.; methodology, R.S. and G.Z.; software, R.S. and G.Z.; validation, R.S., G.Z., and L.Z.; formal analysis, R.S. and G.Z.; investigation, R.S. and J.F.; resources, J.X.; data curation, R.S., J.F., and G.Z.; writing—original draft preparation, L.Z. and R.S.; writing—review and editing, L.Z., P.M., and J.X.; visualization, R.S. and G.Z.; supervision, P.M. and L.Z.; project administration, J.X. and P.M.; funding acquisition, J.X. All authors have read and agreed to the published version of the manuscript.

Funding

This research was funded by the Nanfan Special Project, Chinese Academy of Agricultural Sciences, China (Grant No. YBXM2533).

Data Availability Statement

The original contributions presented in the study are included in the article/Supplementary Material. Further inquiries can be directed to the corresponding authors.

Conflicts of Interest

The authors declare no conflicts of interest.

References

  1. Haider, F.U.; Liqun, C.; Coulter, J.A.; Cheema, S.A.; Wu, J.; Zhang, R.; Wenjun, M.; Farooq, M. Cadmium toxicity in plants: Impacts and remediation strategies. Ecotoxicol. Environ. Saf. 2021, 211, 111887. [Google Scholar] [CrossRef] [Scilit] [PubMed]
  2. Yue, J.; Zhang, N.; Wu, D.; Gao, F. Molecular insights into cadmium transport and micronutrient crosstalk in rice: Towards minimizing grain Cd. J. Integr. Plant Biol. 2025, 1–18. [Google Scholar] [CrossRef] [Scilit] [PubMed]
  3. Hou, D.; Jia, X.; Wang, L.; McGrath, S.P.; Zhu, Y.G.; Hu, Q.; Zhao, F.J.; Bank, M.S.; O’Connor, D.; Nriagu, J. Global soil pollution by toxic metals threatens agriculture and human health. Science 2025, 388, 316–321. [Google Scholar] [CrossRef] [Scilit] [PubMed]
  4. Uraguchi, S.; Fujiwara, T. Cadmium transport and tolerance in rice: Perspectives for reducing grain cadmium accumulation. Rice 2012, 5, 5. [Google Scholar] [CrossRef] [Scilit] [PubMed]
  5. Di Toppi, L.S.; Gabbrielli, R. Response to cadmium in higher plants. Environ. Exp. Bot. 1999, 41, 105–130. [Google Scholar] [CrossRef] [Scilit]
  6. Fu, Y.; Yang, X.; Shen, H. Root iron plaque alleviates cadmium toxicity to rice (Oryza sativa) seedlings. Ecotoxicol. Environ. Saf. 2018, 161, 534–541. [Google Scholar] [CrossRef] [Scilit] [PubMed]
  7. Chang, J.D.; Huang, S.; Yamaji, N.; Zhang, W.; Ma, J.F.; Zhao, F.J. OsNRAMP1 transporter contributes to cadmium and manganese uptake in rice. Plant Cell Environ. 2020, 43, 2476–2491. [Google Scholar] [CrossRef] [Scilit] [PubMed]
  8. Cai, H.; Huang, S.; Che, J.; Yamaji, N.; Ma, J.F. The tonoplast-localized transporter OsHMA3 plays an important role in maintaining Zn homeostasis in rice. J. Exp. Bot. 2019, 70, 2717–2725. [Google Scholar] [CrossRef] [Scilit] [PubMed]
  9. Gindri, R.G.; Navarro, B.B.; da Cruz Dias, P.V.; Tarouco, C.P.; Nicoloso, F.T.; Brunetto, G.; Berghetti, Á.L.P.; da Silva, L.O.S.; Fett, J.P.; Menguer, P.K.; et al. Physiological responses of rice (Oryza sativa L.) oszip7 loss-of-function plants exposed to varying Zn concentrations. Physiol. Mol. Biol. Plants 2020, 26, 1349–1359. [Google Scholar] [CrossRef] [Scilit] [PubMed]
  10. Gu, T.; Qi, Z.; Wang, Y.; Chen, S.; Yan, J.; Qiu, H.; Yu, Y.; Fang, Z.; Wang, J.; Gong, J. An endophytic fungus interacts with the defensin-like protein OsCAL1 to regulate cadmium allocation in rice. Mol. Plant. 2023, 17, 312–324. [Google Scholar] [CrossRef] [Scilit] [PubMed]
  11. Ai, H.; Wu, D.; Li, C.; Hou, M. Advances in molecular mechanisms underlying cadmium uptake and translocation in rice. Front. Plant Sci. 2022, 13, 1003953. [Google Scholar] [CrossRef] [Scilit] [PubMed]
  12. Wang, Q.; Tang, J.; Han, B.; Huang, X. Advances in genome-wide association studies of complex traits in rice. Theor. Appl. Genet. 2020, 133, 1415–1425. [Google Scholar] [CrossRef] [Scilit] [PubMed]
  13. Tibbs Cortes, L.; Zhang, Z.; Yu, J. Status and prospects of genome-wide association studies in plants. Plant Genome 2021, 14, e20077. [Google Scholar] [CrossRef] [Scilit] [PubMed]
  14. Wang, W.; Mauleon, R.; Hu, Z.; Chebotarov, D.; Tai, S.; Wu, Z.; Li, M.; Zheng, T.; Fuentes, R.R.; Zhang, F.; et al. Genomic variation in 3010 diverse accessions of Asian cultivated rice. Nature 2018, 557, 43–49. [Google Scholar] [CrossRef] [Scilit] [PubMed]
  15. Zhao, K.; Tung, C.W.; Eizenga, G.C.; Wright, M.H.; Ali, M.L.; Price, A.H.; Norton, G.J.; Islam, M.R.; Reynolds, A.; Mezey, J.; et al. Genome-wide association mapping reveals a rich genetic architecture of complex traits in Oryza sativa. Nat. Genet. 2011, 43, 961–967. [Google Scholar] [CrossRef] [Scilit]
  16. Huang, X.; Zhao, Y.; Wei, X.; Li, C.; Wang, A.; Zhao, Q.; Li, W.; Guo, Y.; Deng, L.; Zhu, C.; et al. Genome-wide association study of flowering time and grain yield traits in a worldwide collection of rice germplasm. Nat. Genet. 2012, 44, 32–39. [Google Scholar] [CrossRef] [Scilit]
  17. Visscher, P.M.; Wray, N.R.; Zhang, Q.; Sklar, P.; McCarthy, M.I.; Brown, M.A.; Yang, J. 10 years of GWAS discovery: Biology, function, and translation. Am. J. Hum. Genet. 2017, 101, 5–22. [Google Scholar] [CrossRef] [Scilit] [PubMed]
  18. Mickelbart, M.V.; Hasegawa, P.M.; Bailey-Serres, J. Genetic mechanisms of abiotic stress tolerance that translate to crop yield stability. Nat. Rev. Genet. 2015, 16, 237–251. [Google Scholar] [CrossRef] [Scilit] [PubMed]
  19. Shao, D.; Yin, L.; Zhao, J.; Luo, Z.; Li, W.; Wang, Y.; Liu, X.; Tian, B.; Long, X.; Yin, H.; et al. Navigating the genetic basis of cadmium accumulation: A comprehensive analysis of low-cadmium accumulation rice. Mol. Breed. 2025, 45, 66. [Google Scholar] [CrossRef] [Scilit] [PubMed]
  20. Yoshida, S.; Forno, D.A.; Cock, J.H.; Gomez, K.A. Laboratory Manual for Physiological Studies of Rice; IRRI: Los Baños, Philippines, 1976. [Google Scholar]
  21. Chiao, W.T.; Yu, C.H.; Juang, K.W. The variation of rice cultivars in Cd toxicity and distribution of the seedlings and their root histochemical examination. Paddy Water Environ. 2019, 17, 605–618. [Google Scholar] [CrossRef] [Scilit]
  22. Zhang, W.Q.; Han, Z.J.; Miao, Y.Q.; Yue, N.Y.; Zhang, Z.H.; Chen, H.F. The mechanism by which nitrate nitrogen inhibits the upward transport of iron in rice and exacerbates low cadmium stress. J. Plant Nutr. Fertil. 2025, 31, 697–708. [Google Scholar] [CrossRef]
  23. Alexandrov, N.; Tai, S.; Wang, W.; Mansueto, L.; Palis, K.; Fuentes, R.R.; Ulat, V.J.; Chebotarov, D.; Zhang, G.; Li, Z.; et al. SNP-Seek database of SNPs derived from 3000 rice genomes. Nucleic Acids Res. 2015, 43, D1023–D1027. [Google Scholar] [CrossRef] [Scilit] [PubMed]
  24. Purcell, S.; Neale, B.; Todd-Brown, K.; Thomas, L.; Ferreira, M.A.; Bender, D.; Maller, J.; Sklar, P.; de Bakker, P.I.; Daly, M.J.; et al. PLINK: A tool set for whole-genome association and population-based linkage analyses. Am. J. Hum. Genet. 2007, 81, 559–575. [Google Scholar] [CrossRef] [Scilit] [PubMed]
  25. Kang, H.M.; Sul, J.H.; Service, S.K.; Zaitlen, N.A.; Kong, S.Y.; Freimer, N.B.; Sabatti, C.; Eskin, E. Variance component model to account for sample structure in genome-wide association studies. Nat. Genet. 2010, 42, 348–354. [Google Scholar] [CrossRef] [Scilit] [PubMed]
  26. Li, M.X.; Yeung, J.M.; Cherny, S.S.; Sham, P.C. Evaluating the effective numbers of independent tests and significant p-value thresholds in commercial genotyping arrays and public imputation reference datasets. Hum. Genet. 2012, 131, 747–756. [Google Scholar] [CrossRef] [Scilit] [PubMed]
  27. R Core Team. R: A Language and Environment for Statistical Computing; R Foundation for Statistical Computing: Vienna, Austria, 2015. [Google Scholar] [CrossRef] [Scilit]
  28. Dong, S.S.; He, W.M.; Ji, J.J.; Zhang, C.; Guo, Y.; Yang, T.L. LDBlockShow: A fast and convenient tool for visualizing linkage disequilibrium and haplotype blocks based on variant call format files. Brief. Bioinform. 2021, 22, bbaa227. [Google Scholar] [CrossRef] [Scilit] [PubMed]
  29. Yano, K.; Yamamoto, E.; Aya, K.; Takeuchi, H.; Lo, P.C.; Hu, L.; Yamasaki, M.; Yoshida, S.; Kitano, H.; Hirano, K.; et al. Genome-wide association study using whole-genome sequencing rapidly identifies new genes influencing agronomic traits in rice. Nat. Genet. 2016, 48, 927–934. [Google Scholar] [CrossRef] [Scilit] [PubMed]
  30. Liu, C.; Tatsuya, F.; Tadashi, M.; Patrizia, G.; Daniele, F.; Tomoyuki, K.; Maki, K.; Shihua, Z.; Sun, X.; Zhu, Y.; et al. Aquaporin OsPIP1;1 promotes rice salt resistance and seed germination. Plant Physiol. Biochem. 2013, 63, 151–158. [Google Scholar] [CrossRef] [Scilit] [PubMed]
  31. Yau, C.P.; Wang, L.; Yu, M.; Sze, Y.Z.; Wing, K.Y. Differential expression of three genes encoding an ethylene receptor in rice during development, and in response to indole-3-acetic acid and silver ions. J. Exp. Bot. 2004, 55, 547–556. [Google Scholar] [CrossRef] [Scilit] [PubMed]
  32. Ogawa, M.; Kusano, T.; Katsumi, M.; Sano, H. Rice gibberellin-insensitive gene homolog, OsGAI, encodes a nuclear-localized protein capable of gene activation at transcriptional level. Gene 2000, 245, 21–29. [Google Scholar] [CrossRef] [Scilit] [PubMed]
  33. Shin, J.H.; Kim, S.R.; An, G. Rice Aldehyde Dehydrogenase7 Is Needed for Seed Maturation and Viability. Plant Physiol. 2009, 149, 905–915. [Google Scholar] [CrossRef] [Scilit] [PubMed]
  34. Tang, Z.; Li, Y.F.; Zhang, Z.H.; Huang, X.Y.; Zhao, F.J. OsCOPT7 is a copper exporter at the tonoplast and endoplasmic re-ticulum and controls Cu translocation to the shoots and grain of rice. Plant Cell Environ. 2024, 47, 2163–2177. [Google Scholar] [CrossRef] [Scilit] [PubMed]
  35. Qiu, J.H.; Xie, J.H.; Chen, Y.; Shen, Z.N.; Shi, H.B.; Naqvi, N.I.; Qian, Q.; Liang, Y.; Kou, Y.J. Warm temperature compromises JA-regulated basal resistance to enhance Magnaporthe oryzae infection in rice. Mol. Plant. 2022, 15, 723–739. [Google Scholar] [CrossRef] [Scilit] [PubMed]
  36. Xu, Z.; Zhang, J.X.; Wang, X.; Essemine, J.; Jin, J.; Qu, M.N.; Xiang, Y.; Chen, W.X. Cold-induced inhibition of photosynthesis-related genes integrated by a TOP6 complex in rice mesophyll cells. Nucleic Acids Res. 2023, 51, 1823–1842. [Google Scholar] [CrossRef] [Scilit] [PubMed]
  37. Chou, T.S.; Chao, Y.Y.; Kao, C.H. Involvement of hydrogen peroxide in heat shock and cadmium-induced expression of ascorbate peroxidase and glutathione reductase in leaves of rice seedlings. J. Plant Physiol. 2012, 169, 478–486. [Google Scholar] [CrossRef] [Scilit] [PubMed]
  38. Kim, S.K.; You, Y.M.; Park, J.C.; Joung, Y.; Kim, B.G.; Ahn, J.C.; Cho, H.S. The rice thylakoid lumenal cyclophilin OsCYP20-2 confers enhanced environmental stress tolerance in tobacco and Arabidopsis. Plant Cell Rep. 2012, 31, 417–426. [Google Scholar] [CrossRef] [Scilit] [PubMed]
  39. Yamaki, T.; Otani, M.; Ono, K.; Mimura, T.; Oda, K.; Minamii, T.; Matsumoto, S.; Matsuo, Y.; Kawamukai, M.; Akihiro, T. Isolation and characterization of rice cesium transporter genes from a rice-transporter-enriched yeast expression library. Physiol. Plant. 2017, 160, 425–436. [Google Scholar] [CrossRef] [Scilit] [PubMed]
  40. Ohashi, M.; Ishiyama, K.; Kojima, S.; Konishi, N.; Nakano, K.; Kanno, K.; Hayakawa, T.; Yamaya, T. Asparagine Synthetase1, but not Asparagine Synthetase2, is Responsible for the Biosynthesis of Asparagine Following the Supply of Ammonium to Rice Roots. Plant Cell Physiol. 2015, 56, 769. [Google Scholar] [CrossRef] [Scilit] [PubMed]
  41. Narawongsanont, R.; Kabinpong, S.; Auiyawong, B.; Tantitadapitak, C. Cloning and characterization of AKR4C14, a rice al-do-keto reductase, from Thai Jasmine rice. Protein J. 2012, 31, 35–42. [Google Scholar] [CrossRef] [Scilit] [PubMed]
  42. He, L.; Li, J.K. Integrated transcriptome and physiological analysis of rice seedlings reveals different cadmium response mechanisms between indica and japonica varieties. Environ. Exp. Bot. 2022, 204, 105097. [Google Scholar] [CrossRef] [Scilit]
  43. Fu, C.; Zhou, Y.; Liu, A.; Chen, R.; Yin, L.; Li, C.; Mao, H. Genome-wide association study for seedling heat tolerance under two temperature conditions in bread wheat (Triticum aestivum L.). BMC Plant Biol. 2024, 24, 430. [Google Scholar] [CrossRef] [Scilit] [PubMed]
  44. Yu, K.; Miao, H.; Liu, H.; Zhou, J.; Sui, M.; Zhan, Y.; Xia, N.; Zhao, X.; Han, Y. Genome-wide association studies reveal novel QTLs, QTL-by-environment interactions and their candidate genes in soybean seed. Front. Plant Sci. 2022, 13, 1026581. [Google Scholar] [CrossRef] [Scilit] [PubMed]
  45. Morita, S.; Tanaka, S.; Tani, Y.; Nakamura, J.; Sato, M.H.; Satoh, S.; Masumura, T. The rice ethylene receptor OsERS1 negatively regulates shoot growth and salt tolerance in rice etiolated seedlings. Biosci. Biotechnol. Biochem. 2025, 89, 855–861. [Google Scholar] [CrossRef] [Scilit] [PubMed]
Figure 1. Phenotype analysis of cadmium tolerance-related traits. (a) Box plots showing the phenotypic distribution of SDW, RDW, and SH under control and Cd treatment conditions, as well as their relative values (RSDW, RRDW, and RSH). *** indicates a significant difference between control and Cd treatment conditions (p ≤ 0.001), and ns indicates no significant difference (p > 0.05); (b) Box plots comparing phenotypic distributions of the Geng and Xian subgroups. ** and *** indicate significant differences under the level of p ≤ 0.01 and 0.001, respectively, while ns indicates no significant difference (p > 0.05). The sample size (n) for each trait is shown in parentheses; (c) Correlation heatmaps of nine traits in the whole population and in Geng and Xian subpopulation. Values represent Pearson correlation coefficients. The areas and colors of ellipses correspond to absolute values of the corresponding r. Right and left oblique ellipses indicate positive and negative correlations, respectively, and ellipse shape and color reflect correlation strength. Correlations without symbols are not significant at p < 0.05. *, **, and *** represent significant correlations at p < 0.05, 0.01, and 0.001, respectively.
Agriculture 16 01325 g001
Figure 2. Genotypic analysis of the rice diversity panel. (a) The density distribution of SNPs on 12 chromosomes; (b) Heat map of kinship with hierarchical clustering dendrograms shown on the top and left sides; (c) Principal component analysis (PCA) of the rice accessions based on genome-wide SNP data.
Agriculture 16 01325 g002
Figure 3. Identification and haplotype analysis of the candidate gene OsAS1 underlying qRDW3.2 on chromosome 3. (a) Local Manhattan plot (upper panel) and linkage disequilibrium (LD) block structure (lower panel) surrounding the lead SNP within qRDW3.2. (b) Gene structure of OsAS1 and sequence polymorphisms identified within the gene. (c,d) Comparison of shoot dry weight (SDW) (c) and root dry weight (RDW) (d) among different OsAS1 haplotypes (Hap). Different lowercase letters indicate significant differences among haplotypes at p < 0.05. (e,f) Haplotype frequencies of OsAS1 in Xian and Geng accessions (e), and in landraces and modern cultivars (f).
Agriculture 16 01325 g003
Figure 4. Identification and haplotype analysis of the candidate gene OsAKR2 underlying qSDW1.1 on chromosome 1. (a) Local Manhattan plot (upper panel) and linkage disequilibrium (LD) block structure (lower panel) surrounding the lead SNP within qSDW1.1. (b) Gene structure of OsAKR2 and sequence polymorphisms detected within the gene. (c) Comparison of relative shoot dry weight (RSDW) among different OsAKR2 haplotypes (Hap). Different lowercase letters indicate significant differences among haplotypes at p < 0.05. (df) Frequencies of different OsAKR2 haplotypes in Xian and Geng accessions (d), landraces (e), and modern cultivars (f).
Agriculture 16 01325 g004
Figure 5. Identification and haplotype analysis of the candidate gene LOC_Os05g11320 underlying qRDW5.2 on chromosome 5. (a) Local Manhattan plot (upper panel) and linkage disequilibrium (LD) block structure (lower panel) surrounding the lead SNP within qRDW5.2. (b) Gene structure of LOC_Os05g11320 and sequence polymorphisms identified within the gene. (c,d) Comparison of shoot dry weight (SDW) (c) and root dry weight (RDW) (d) among different LOC_Os05g11320 haplotypes (Hap). Different lowercase letters indicate significant differences among haplotypes at p < 0.05. (e,f) Haplotype frequencies of LOC_Os05g11320 in Xian and Geng accessions (e), and in landraces and modern cultivars (f).
Agriculture 16 01325 g005
Table 1. QTLs identified for Cd-tolerance-related traits by GWAS.
TraitsQTLCategoryChrLead SNPAllelep-ValueQTL Region (Mb)Reported Stress-Related Genes
RDWqRDW1Ratio1rs1_2951127G/T2.00 × 10−82.92–3.02
qRDW2.1Cd stress 2rs2_4937311A/G5.38 × 10−84.90–5.03
qRDW2.2Cd stress 2rs2_27036070A/C6.14 × 10−926.8–27.1OsPIP1a [30]
qRDW3.2Cd stress 3rs3_10129780T/G7.90 × 10−810.12–10.14
qRDW3.3Cd stress 3rs3_14908655A/G6.10 × 10−714.78–14.96
qRDW3.4Cd stress 3rs3_24318760G/A1.86 × 10−924.24–24.32
qRDW3.5Cd stress 3rs3_28199491A/G5.70 × 10−928.07–28.29Os-ERS1 [31]
OsGAI [32]
qRDW4Cd stress 4rs4_31347210A/T1.10 × 10−631.16–31.35
qRDW5.1Cd stress 5rs5_5918056T/G1.79 × 10−75.86–6.06
qRDW5.2Cd stress 5rs5_6392858T/A3.97 × 10−86.26–6.43
qRDW5.3Cd stress 5rs5_19020921A/G2.03 × 10−818.90–19.09
qRDW6Control 6rs6_21299644T/C4.63 × 10−721.29–21.30
qRDW7.1Control 7rs7_15822864C/T3.27 × 10−715.68–15.91
qRDW7.2Ratio7rs7_28441812A/T2.89 × 10−728.43–28.45
qRDW8.1Cd stress 8rs8_16560141C/G4.35 × 10−1116.44–17.10
qRDW8.2Cd stress 8rs8_17262519T/A9.80 × 10−817.11–17.42
qRDW9Control 9rs9_16313538C/T3.09 × 10−816.30–16.46OsALDH7 [33]
OsCOPT7 [34]
qRDW11Cd stress 11rs11_25548072T/C8.74 × 10−925.51–25.58
qRDW12.1Cd stress 12rs12_7995462G/A2.38 × 10−87.99–8.00
SDWqSDW1.1Ratio1rs1_36414371A/G4.31 × 10−736.39–36.53
qSDW1.2Control 1rs1_36786564T/C1.50 × 10−636.69–36.80OsCOI1a [35]
qSDW1.3Ratio1rs1_37150228A/G1.79 × 10−737.01–37.18
qSDW2Cd stress 2rs2_27036070A/C1.02 × 10−926.85–27.08OsPIP1a [30]
qSDW3.2Ratio3rs3_9926380A/G1.08 × 10−109.79–10.01OsTOP6A3 [36]
OsAPX1 [37]
qSDW3.3Cd stress 3rs3_10132653T/C1.31 × 10−710.12–10.14
qSDW3.4Ratio3rs3_14838537A/G2.25 × 10−714.84–14.85
Cd stress 3rs3_14908655G/A1.52 × 10−714.62–14.96
qSDW3.5Cd stress 3rs3_24250291C/G3.56 × 10−723.99–24.49
qSDW3.6Cd stress 3rs3_28017836C/T6.51 × 10−827.80–28.09Os-ERS1 [31]
OsGAI [32]
qSDW4Cd stress 4rs4_31354213G/T1.47 × 10−731.16–31.39
qSDW5.1Ratio5rs5_115608A/G2.32 × 10−90.025–0.19OsCYP20−2 [38]
qSDW5.2Cd stress 5rs5_5918056T/G1.20 × 10−65.90–6.05
qSDW5.3Cd stress 5rs5_19008784T/C1.60 × 10−818.90–19.31
qSDW8.1Cd stress 8rs8_16446824T/A1.10 × 10−916.44–16.63
qSDW8.2Cd stress 8rs8_17179625T/C7.91 × 10−717.10–17.42
qSDW9Control 9rs9_16502901T/C2.45 × 10−716.35–16.56OsCOPT7 [34]
FCO3 [39]
qSDW11Cd stress 11rs11_25562624G/T1.81 × 10−625.51–25.58
SHqSH3Cd stress 3rs3_25008356G/T1.23 × 10−625.01–25.14
qSH4.1Cd stress 4rs4_4404473A/G6.15 × 10−74.40–4.49
Disclaimer/Publisher’s Note: The statements, opinions and data contained in all publications are solely those of the individual author(s) and contributor(s) and not of MDPI and/or the editor(s). MDPI and/or the editor(s) disclaim responsibility for any injury to people or property resulting from any ideas, methods, instructions or products referred to in the content.