Article

Carpel-Specific Suppression of GhCKX3b Enhances Cotton Yield Without Compromising Fiber Quality in the Elite Cultivar ‘Yuanmian 8’

College of Life Sciences, Shihezi University, Shihezi 832000, China
*
Author to whom correspondence should be addressed.
These authors contributed equally to this work.
Agriculture 2026, 16(11), 1134; https://doi.org/10.3390/agriculture16111134
Submission received: 15 April 2026 / Revised: 9 May 2026 / Accepted: 11 May 2026 / Published: 22 May 2026
(This article belongs to the Section Crop Genetics, Genomics and Breeding)

Abstract

Improving cotton yield without sacrificing fiber quality remains a major breeding challenge. In this study, a carpel-specific RNA interference construct targeting GhCKX3b was introduced into the elite upland cotton cultivar ‘Yuanmian 8’, which has high fiber quality but relatively low lint percentage. We evaluated the effects of this construct on cytokinin accumulation, yield-related traits, and fiber quality across T0, T1, and T2 generations. Carpel-specific suppression of GhCKX3b increased cytokinin content in T2 positive lines by 50.3% to 102.0% relative to wild-type. Transgenic lines consistently showed increased lint percentage, boll weight, and seeds per boll, while seed index decreased moderately. In the best-performing line, lint percentage increased from 36.4% to 45.8%, and boll weight from 6.30 g to 7.31 g. Multi-year field evaluations confirmed stable inheritance of these improvements across generations. Importantly, major fiber quality parameters—including length, strength, and micronaire—remained within high-quality cotton standards. These results indicate that carpel-specific GhCKX3b suppression effectively improves key yield components in a high-quality cotton background without compromising fiber quality. This study provides breeding-oriented evidence supporting the application of tissue-specific cytokinin regulation in cotton improvement.

1. Introduction

Cotton (Gossypium hirsutum L.) is an important fiber crop worldwide and also provides seed oil and protein [1,2]. However, further improvement of cotton productivity remains difficult because several key traits are often negatively associated (Karademir et al., 2010; Foulk and McAlister, 2002) [3,4,5,6,7,8]. For example, higher lint percentage is frequently accompanied by reduced seed size, and increases in lint yield may be associated with declines in fiber quality [6,7]. These trade-offs limit the efficiency of conventional breeding for simultaneous improvement of yield and quality [8].
Cotton (Gossypium spp.) is primarily a self-pollinated crop, although natural outcrossing can occur, and reproductive development is a key determinant of yield formation. Cytokinins (CKs) are essential regulators of reproductive development, as they control cell division and sink establishment [9,10]. In cotton, cytokinin homeostasis in carpel tissues is closely associated with ovule initiation and early fiber development [10,11,12]. Cytokinin oxidase/dehydrogenase (CKX) enzymes irreversibly degrade active cytokinins, and suppression of CKX genes has therefore been used as a strategy to increase local cytokinin levels [13,14]. Previous studies have shown that carpel-specific downregulation of GhCKX genes, key members of the CKX gene family in cotton, can promote seed and fiber production, suggesting that tissue-specific cytokinin regulation may be useful for improving cotton yield [10,15].
However, the effectiveness of this strategy—carpel-specific downregulation of GhCKX genes—remains uncertain in elite cotton cultivars with desirable agronomic and fiber-quality traits. While precise gene expression modulation has been demonstrated in other crop species using advanced genome editing approaches such as promoter engineering [16], its application in cotton, particularly in elite genetic backgrounds, is still limited and faces significant challenges highlighted in recent genomic breeding studies [17]. For breeding purposes, it is particularly important to determine whether tissue-specific cytokinin regulation can improve yield-related traits without impairing fiber quality [18,19,20]. The upland cotton cultivar ‘Yuanmian 8’ is widely cultivated in northwestern China due to its stable performance and superior fiber quality; however, its relatively low lint percentage limits its yield potential. Therefore, this cultivar represents a valuable breeding target for improving yield-related traits. It also provides an appropriate genetic background for testing whether carpel-specific suppression of GhCKX3b can enhance yield components while maintaining desirable fiber characteristics.
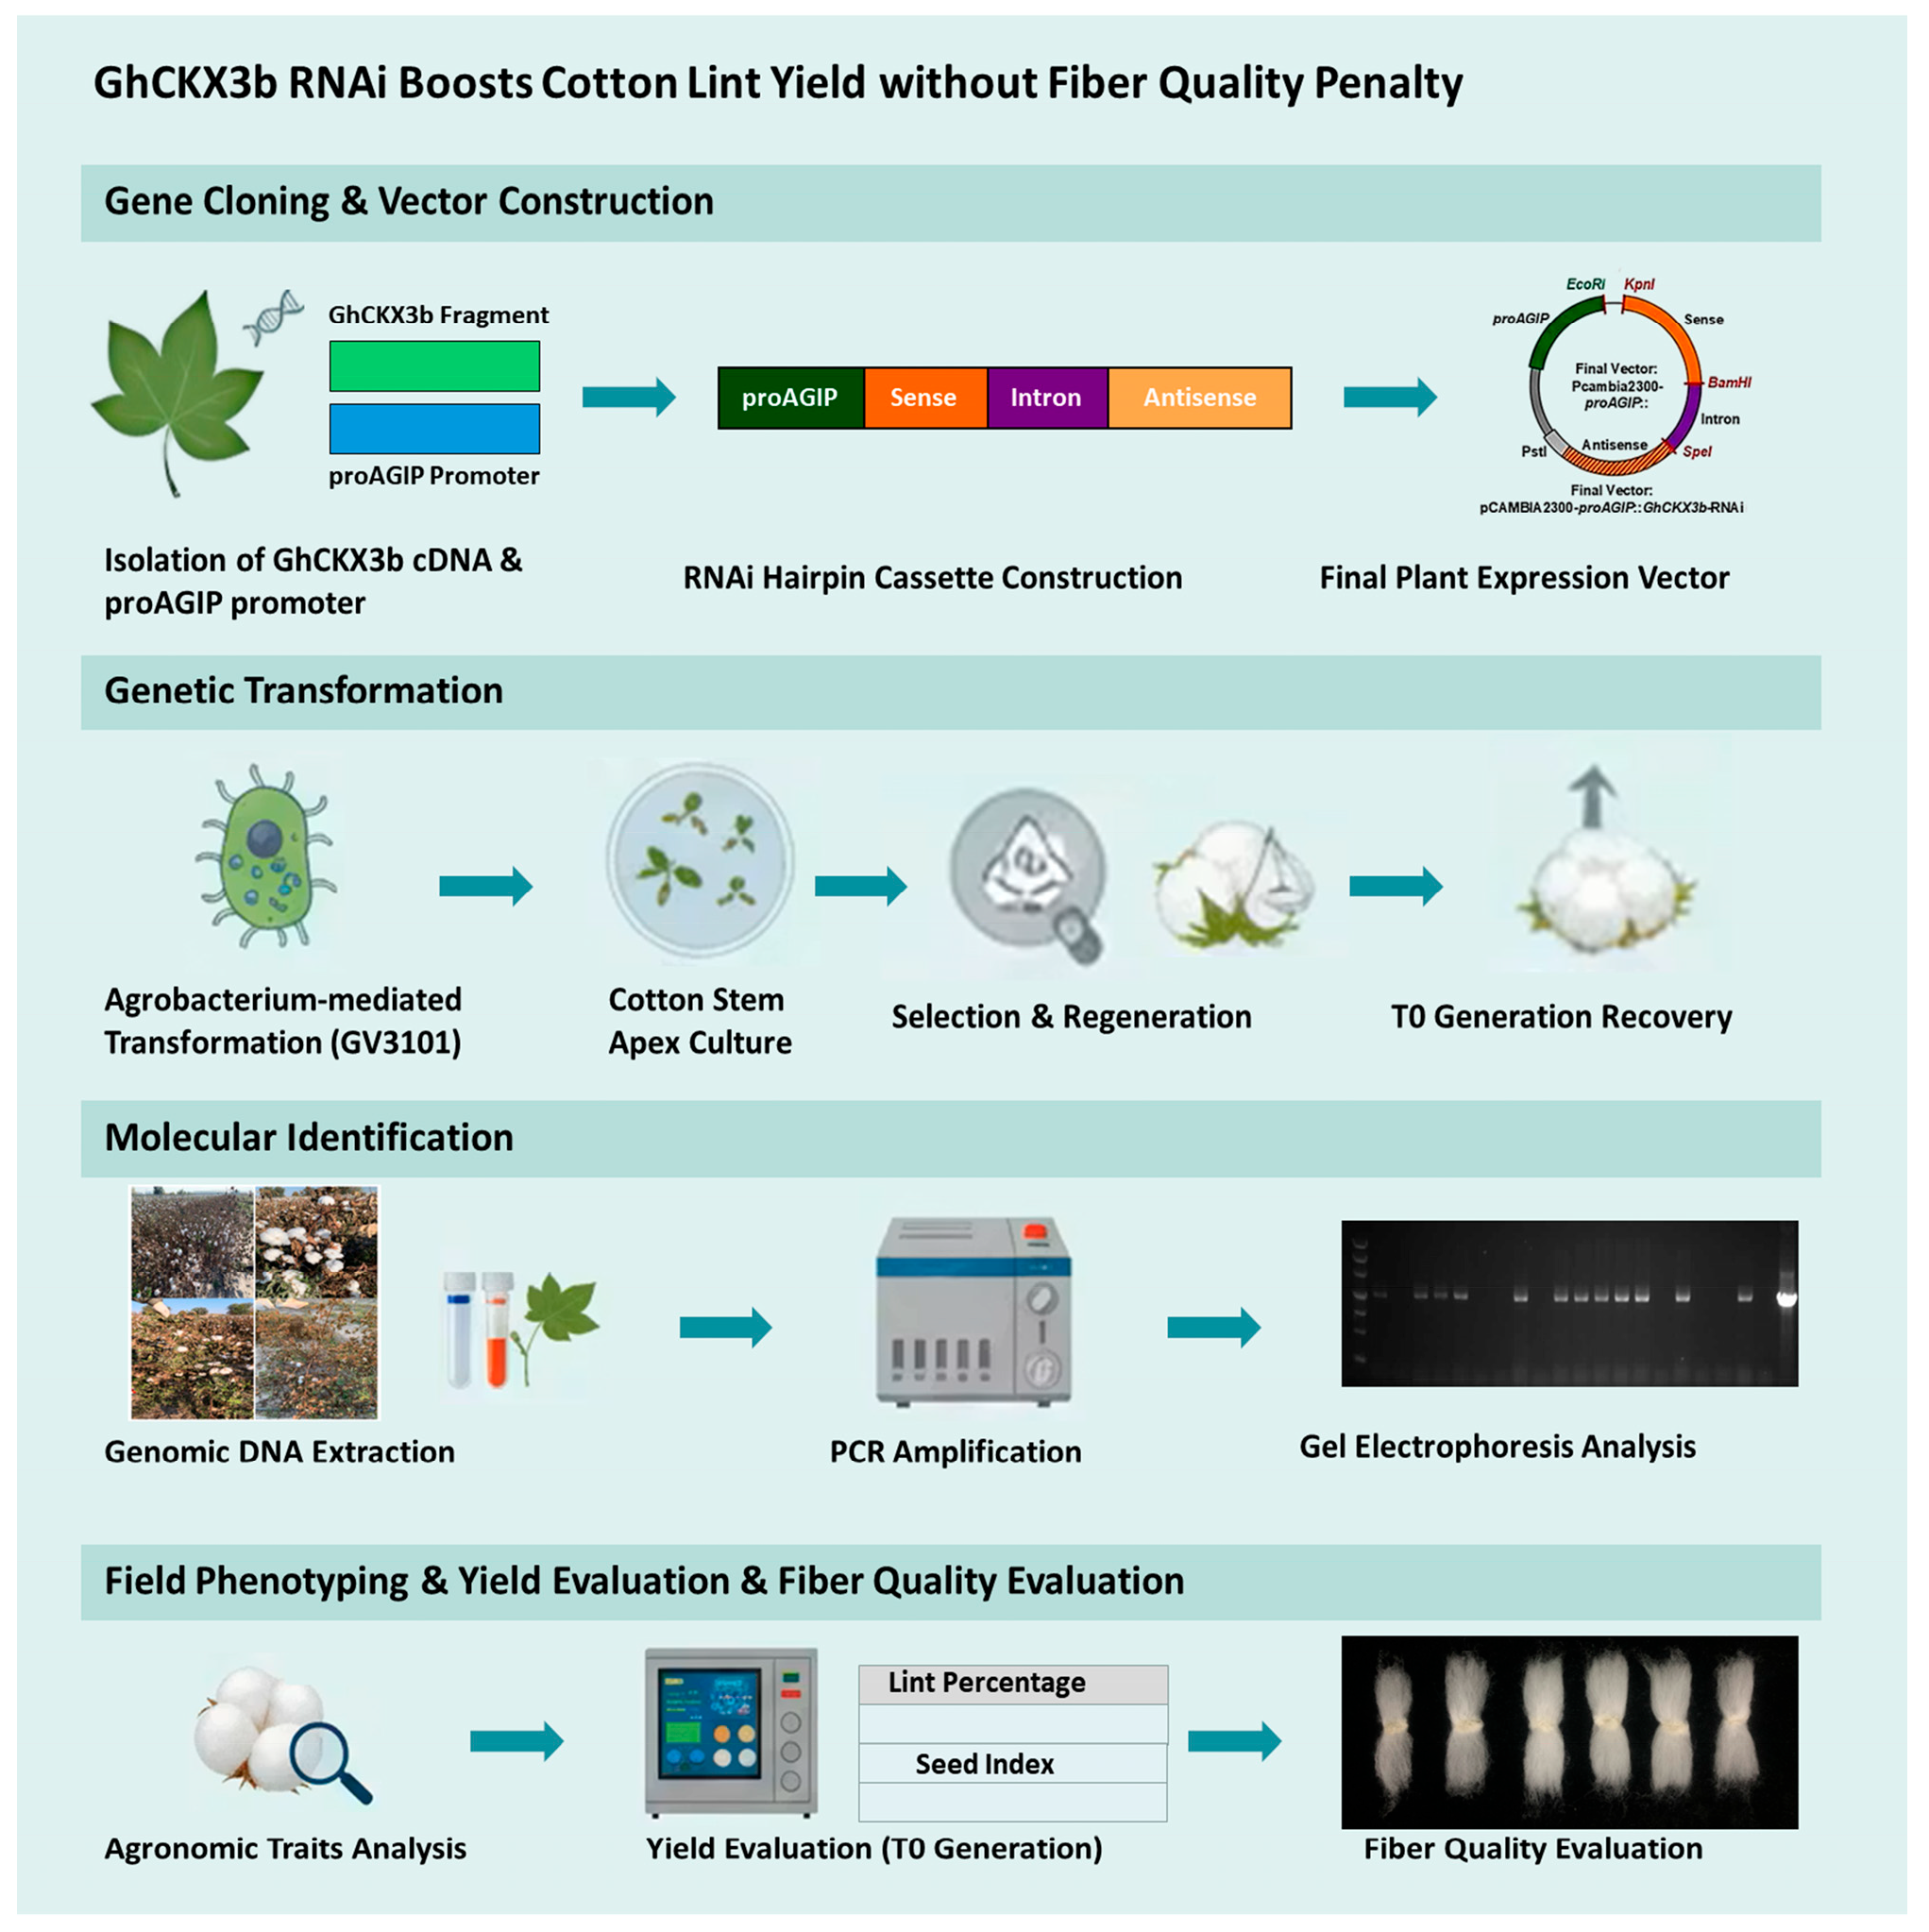
In this study, we introduced a carpel-specific GhCKX3b-RNAi construct into ‘Yuanmian 8’ and evaluated its effects across multiple generations. This study aimed to determine whether local cytokinin accumulation could be achieved in carpels, whether major yield component traits could be improved in a coordinated manner, and whether fiber quality could be maintained in the transgenic background [20]. An overview of the research design is shown in Figure 1.

2. Materials and Methods

2.1. Experimental Materials

2.1.1. Plant Material

The upland cotton cultivar ‘Yuanmian 8’ was used as both the donor for gene cloning and the recipient for genetic transformation. Young leaves from sterile seedlings were collected for DNA and RNA extraction. Seeds for transformation were delinted with concentrated sulfuric acid before sterilization.

2.1.2. Bacterial Strains and Vectors

The pMD19-T Simple vector was used for fragment cloning, and pCAMBIA2300-35S served as the backbone for plant expression vector construction. Escherichia coli DH5α was used for plasmid propagation, and Agrobacterium tumefaciens GV3101 was used for cotton transformation.

2.1.3. Major Reagents and Media

Routine molecular biology reagents were used for nucleic acid extraction, PCR amplification, cloning, and reverse transcription. Restriction enzymes, T4 DNA ligase, and high-fidelity DNA polymerase were purchased from TaKaRa (Dalian, China) and TransGen Biotech (Beijing, China) and used according to the manufacturers’ instructions. Tissue culture media were prepared using MS basal salts (Beijing Solarbio Science & Technology Co., Ltd., Beijing, China) and supplemented with appropriate plant growth regulators and antibiotics (TIANGEN Biotech Co., Ltd., Beijing, China) for infection, co-cultivation, selection, shoot induction, and rooting. Detailed medium compositions are provided in the Supplementary Materials.

2.2. Experimental Methods

2.2.1. Genomic DNA Extraction

Genomic DNA was extracted from young leaves of ‘Yuanmian 8’ using a cetyltrimethylammonium bromide (CTAB)-based method following previously reported procedures. DNA quality and concentration were assessed by agarose gel electrophoresis and spectrophotometry.

2.2.2. Total RNA Extraction and cDNA Synthesis

Total RNA was isolated from cotton carpels at the pinhead square stage using a rapid extraction method as previously described [21]. RNA integrity was verified by agarose gel electrophoresis, and first-strand cDNA was synthesized using the PrimeScript™ RT reagent kit (TaKaRa Biomedical Technology (Beijing) Co., Ltd., Beijing, China) according to the manufacturer’s instructions.

2.2.3. Cloning of the GhCKX3b Target Fragment and proAGIP Promoter

A 273 bp conserved fragment of GhCKX3b was selected as the RNAi target, and the sequence of the carpel-specific promoter proAGIP (AGAMOUS INTRON PROMOTER) was obtained based on previously published reports [19]. Primers containing the corresponding restriction enzyme sites were designed for amplification of the target fragment and promoter sequence. Genomic DNA and cDNA from ‘Yuanmian 8’ were used as polymerase chain reaction (PCR) templates for proAGIP and GhCKX3b, respectively [22]. PCR amplification was performed using an iCycler Thermal Cycler (Bio-Rad Laboratories, Hercules, CA, USA). Amplified products were separated by electrophoresis on a 1.5% agarose gel and purified for subsequent cloning.

2.2.4. Construction of Intermediate Cloning Vectors

Purified PCR products were ligated into the pMD19-T vector (maintained in our laboratory) and transformed into Escherichia coli DH5α. Positive clones were identified by colony PCR and confirmed by sequencing, yielding pMD19-T-GhCKX3b and pMD19-T-proAGIP.

2.2.5. Construction of the Plant Expression Vector pCAMBIA2300-proAGIP::GhCKX3b-RNAi

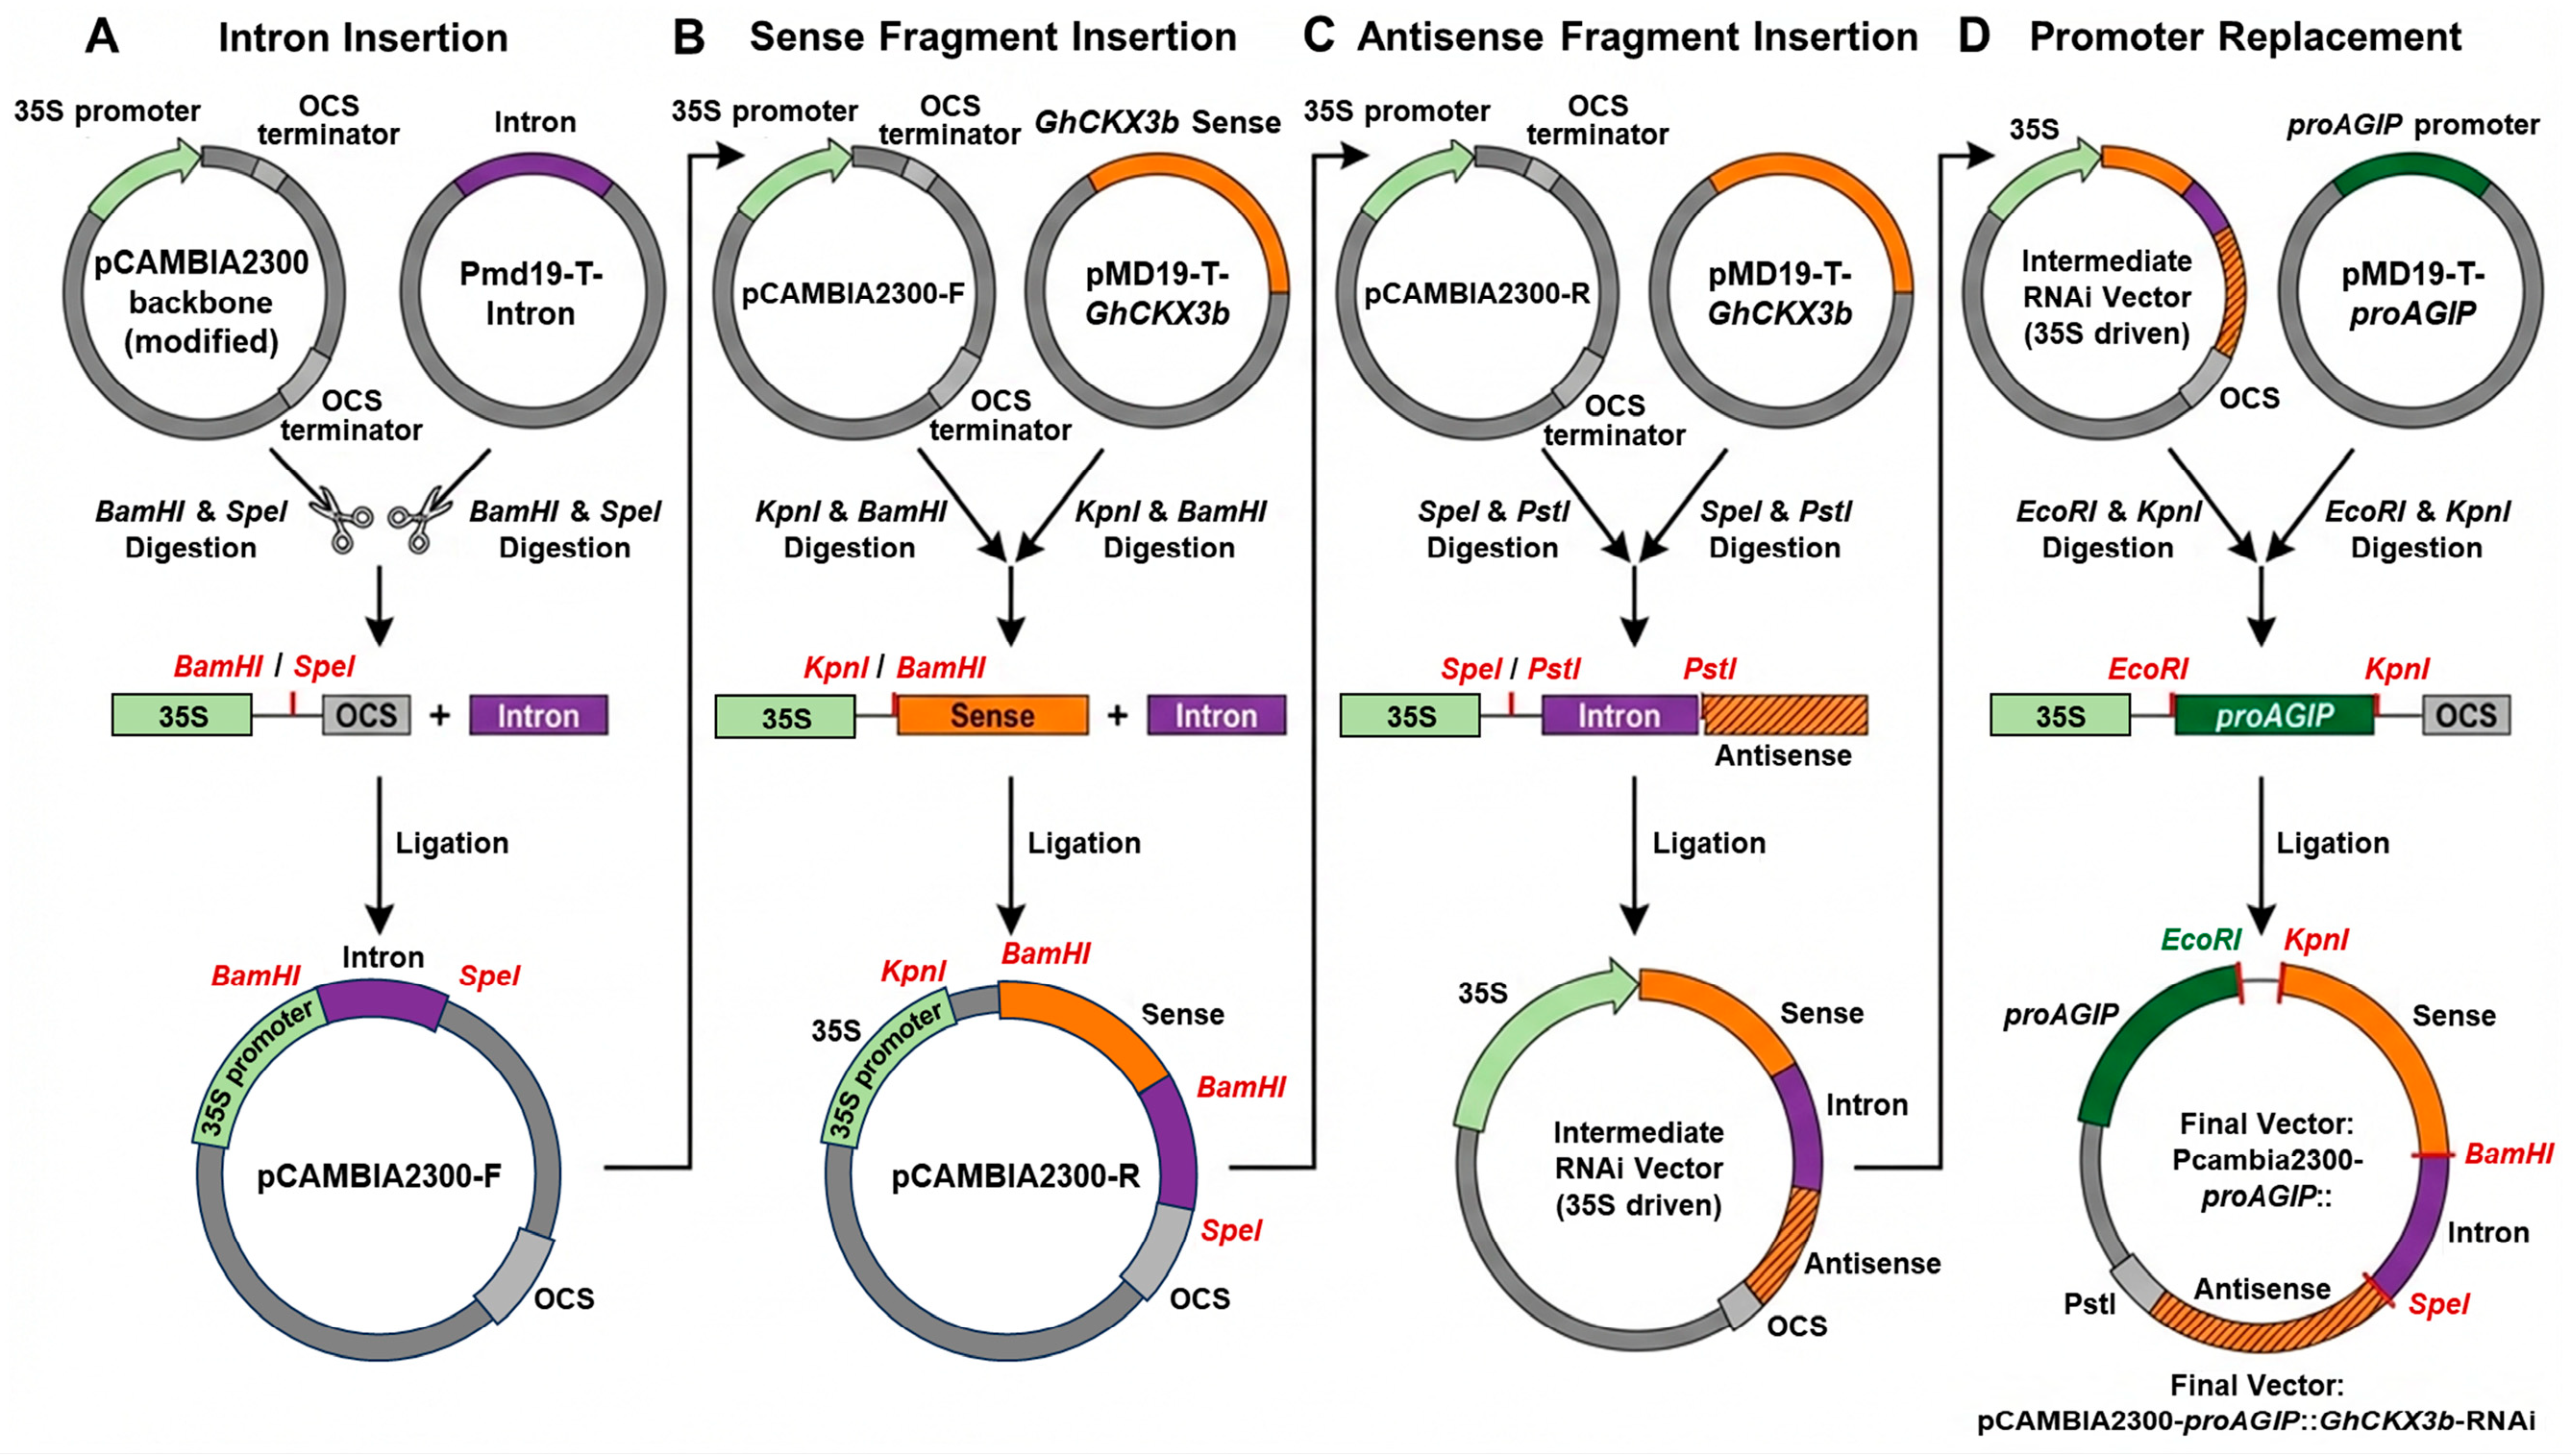
For construction of the plant expression vector, the GhCKX3b fragment was first cloned into the pCAMBIA2300 backbone in both sense and antisense orientations to generate a hairpin RNAi cassette separated by an intron sequence. Subsequently, the carpel-specific promoter proAGIP was inserted upstream of the RNAi cassette to drive tissue-specific expression [23,24].
Recombinant plasmids were verified by colony PCR, restriction enzyme digestion, and sequencing. The final construct was designated pCAMBIA2300-proAGIP::GhCKX3b-RNAi.

2.2.6. Preparation of Agrobacterium Competent Cells and Transformation

The confirmed recombinant plasmid was introduced into A. tumefaciens GV3101 by the freeze–thaw method [25]. Transformed colonies were selected on LB medium containing the appropriate antibiotics (rifampicin, gentamicin, kanamycin) and further verified by colony PCR before use in cotton transformation [26].

2.2.7. Cotton Genetic Transformation and Regeneration

Shoot apex transformation was performed using sterile seedlings of ‘Yuanmian 8’. Embryonic axis tips were infected with an Agrobacterium suspension and subjected to co-cultivation. After recovery, explants were transferred to selection medium containing kanamycin for shoot induction [27]. Regenerated shoots were elongated, rooted, acclimated, and finally transplanted to soil [28,29]. Transgenic plants were first grown in a greenhouse and then transferred to the field for trait evaluation [30,31]. Field experiments were conducted under local agronomic management using a randomized complete block design [32,33]. A total of 35 explants were used for transformation, of which 13 plants were confirmed to be PCR-positive. The transformation efficiency, calculated as the percentage of PCR-positive plants relative to the total number of explants, was 37.14%.

2.2.8. RNA Extraction and Real-Time Quantitative PCR (RT-qPCR)

Total RNA was extracted from carpels at the pinhead square stage and reverse-transcribed into cDNA using the PrimeScript™ RT reagent kit (TaKaRa Biomedical Technology, Beijing, China) according to the manufacturer’s instructions. Quantitative real-time PCR was performed using a LightCycler® 480 Real-Time PCR System (Roche Diagnostics GmbH, Mannheim, Germany) with gene-specific primers and SYBR Green chemistry to determine the relative expression level of GhCKX3b. Primer specificity was confirmed by melting-curve analysis.

2.2.9. Acquisition of T1 Generation and Molecular Identification

Five representative T0 lines (Ri-1 to Ri-5) were self-pollinated to generate T1 progeny. T1 seedlings were screened by PCR using NPTII-specific primers. Plants carrying the transgene were designated as positive lines (Ri-1(T1) to Ri-5(T1)), whereas those without the expected band were designated as negative segregants (Ri-1(T1)-N to Ri-5(T1)-N). Positive T1 plants were self-pollinated to obtain T2 seeds, which were similarly screened, yielding positive lines, Ri-1(T2) to Ri-5(T2), and negative segregants, Ri-1(T2)-N to Ri-5(T2)-N. This design allowed comparison between positive and negative segregants within the same genetic background.

2.2.10. Cytokinin Content Determination

Cytokinin contents in carpel tissues were determined by liquid chromatography tandem mass spectrometry (LC-MS/MS) following a previously reported method with stable isotope-labeled internal standards [10].

2.2.11. Field Trial Design and Trait Investigation

Field experiments were conducted from 2023 to 2025 at the experimental station of Shihezi University using a randomized complete block design with three biological replicates. Guard rows were established around the field and between plots to minimize border effects. Wild-type ‘Yuanmian 8’ (WT) and negative segregants of each transgenic line were included as controls, and all plots were randomly arranged within each replicate. Field management practices, including plot size, planting density, and agronomic practices, were kept consistent across all three years.
In the T0 generation, a total of 35 explants were transformed, resulting in 13 PCR-positive plants. Five representative transgenic lines (Ri-1 to Ri-5) with vigorous and uniform growth were selected, and one core plant per line was maintained for subsequent self-pollination and seed production.
The T1 generation was derived from self-pollinated seeds of the five T0 core plants. For each line, 30 plants were grown in the field, with 10 plants per replicate. WT controls and negative segregants were planted with the same design and population size. PCR identification using NPTII-specific primers was performed at the seedling stage to distinguish positive and negative plants. Positive plants were self-pollinated to produce T2 seeds.
The T2 generation was obtained from self-pollinated T1 positive plants. For each line, 24 plants were grown, with 8 plants per replicate under the same field layout and management conditions. WT and negative segregants were included with identical planting arrangements.
Trait investigation was conducted at the peak boll-opening stage. In each replicate, five representative plants with uniform growth and free of pests and diseases were randomly selected. From each plant, five normally opened bolls located in the middle canopy were sampled for measurement of boll weight, seeds per boll, lint percentage, and seed index.

2.2.12. Fiber Quality Testing

Lint samples from fully opened bolls were subjected to High Volume Instrument (HVI) analysis to determine major fiber quality parameters, including upper half mean length, breaking tenacity, micronaire, and spinning consistency index (SCI) [34,35].

2.2.13. Statistical Analysis

All data were analyzed using R software (version 4.3.1; R Core Team, Vienna, Austria) [36]. Means and standard deviations were calculated for each trait. Differences between transgenic lines and the wild type were evaluated using one-way analysis of variance (ANOVA) [37]. Statistical significance was determined at p < 0.05, p < 0.01, p < 0.001, and p < 0.0001.

2.2.14. Phylogenetic Analysis

Protein sequences of CKX family members from Gossypium hirsutum, G. raimondii, G. arboreum, Arabidopsis thaliana, and Theobroma cacao were retrieved from public databases (NCBI and Phytozome).
Multiple sequence alignment was performed using ClustalW implemented in MEGA software (version 11.0). A phylogenetic tree was constructed using the Neighbor-Joining (NJ) method with 1000 bootstrap replicates to assess branch support. Evolutionary distances were calculated using the Poisson correction model, and all positions with gaps and missing data were eliminated. The resulting tree was visualized using MEGA software.

3. Results and Discussion

3.1. Phylogenetic Analysis of the CKX Gene Family and Evolutionary Origin of GhCKX3b

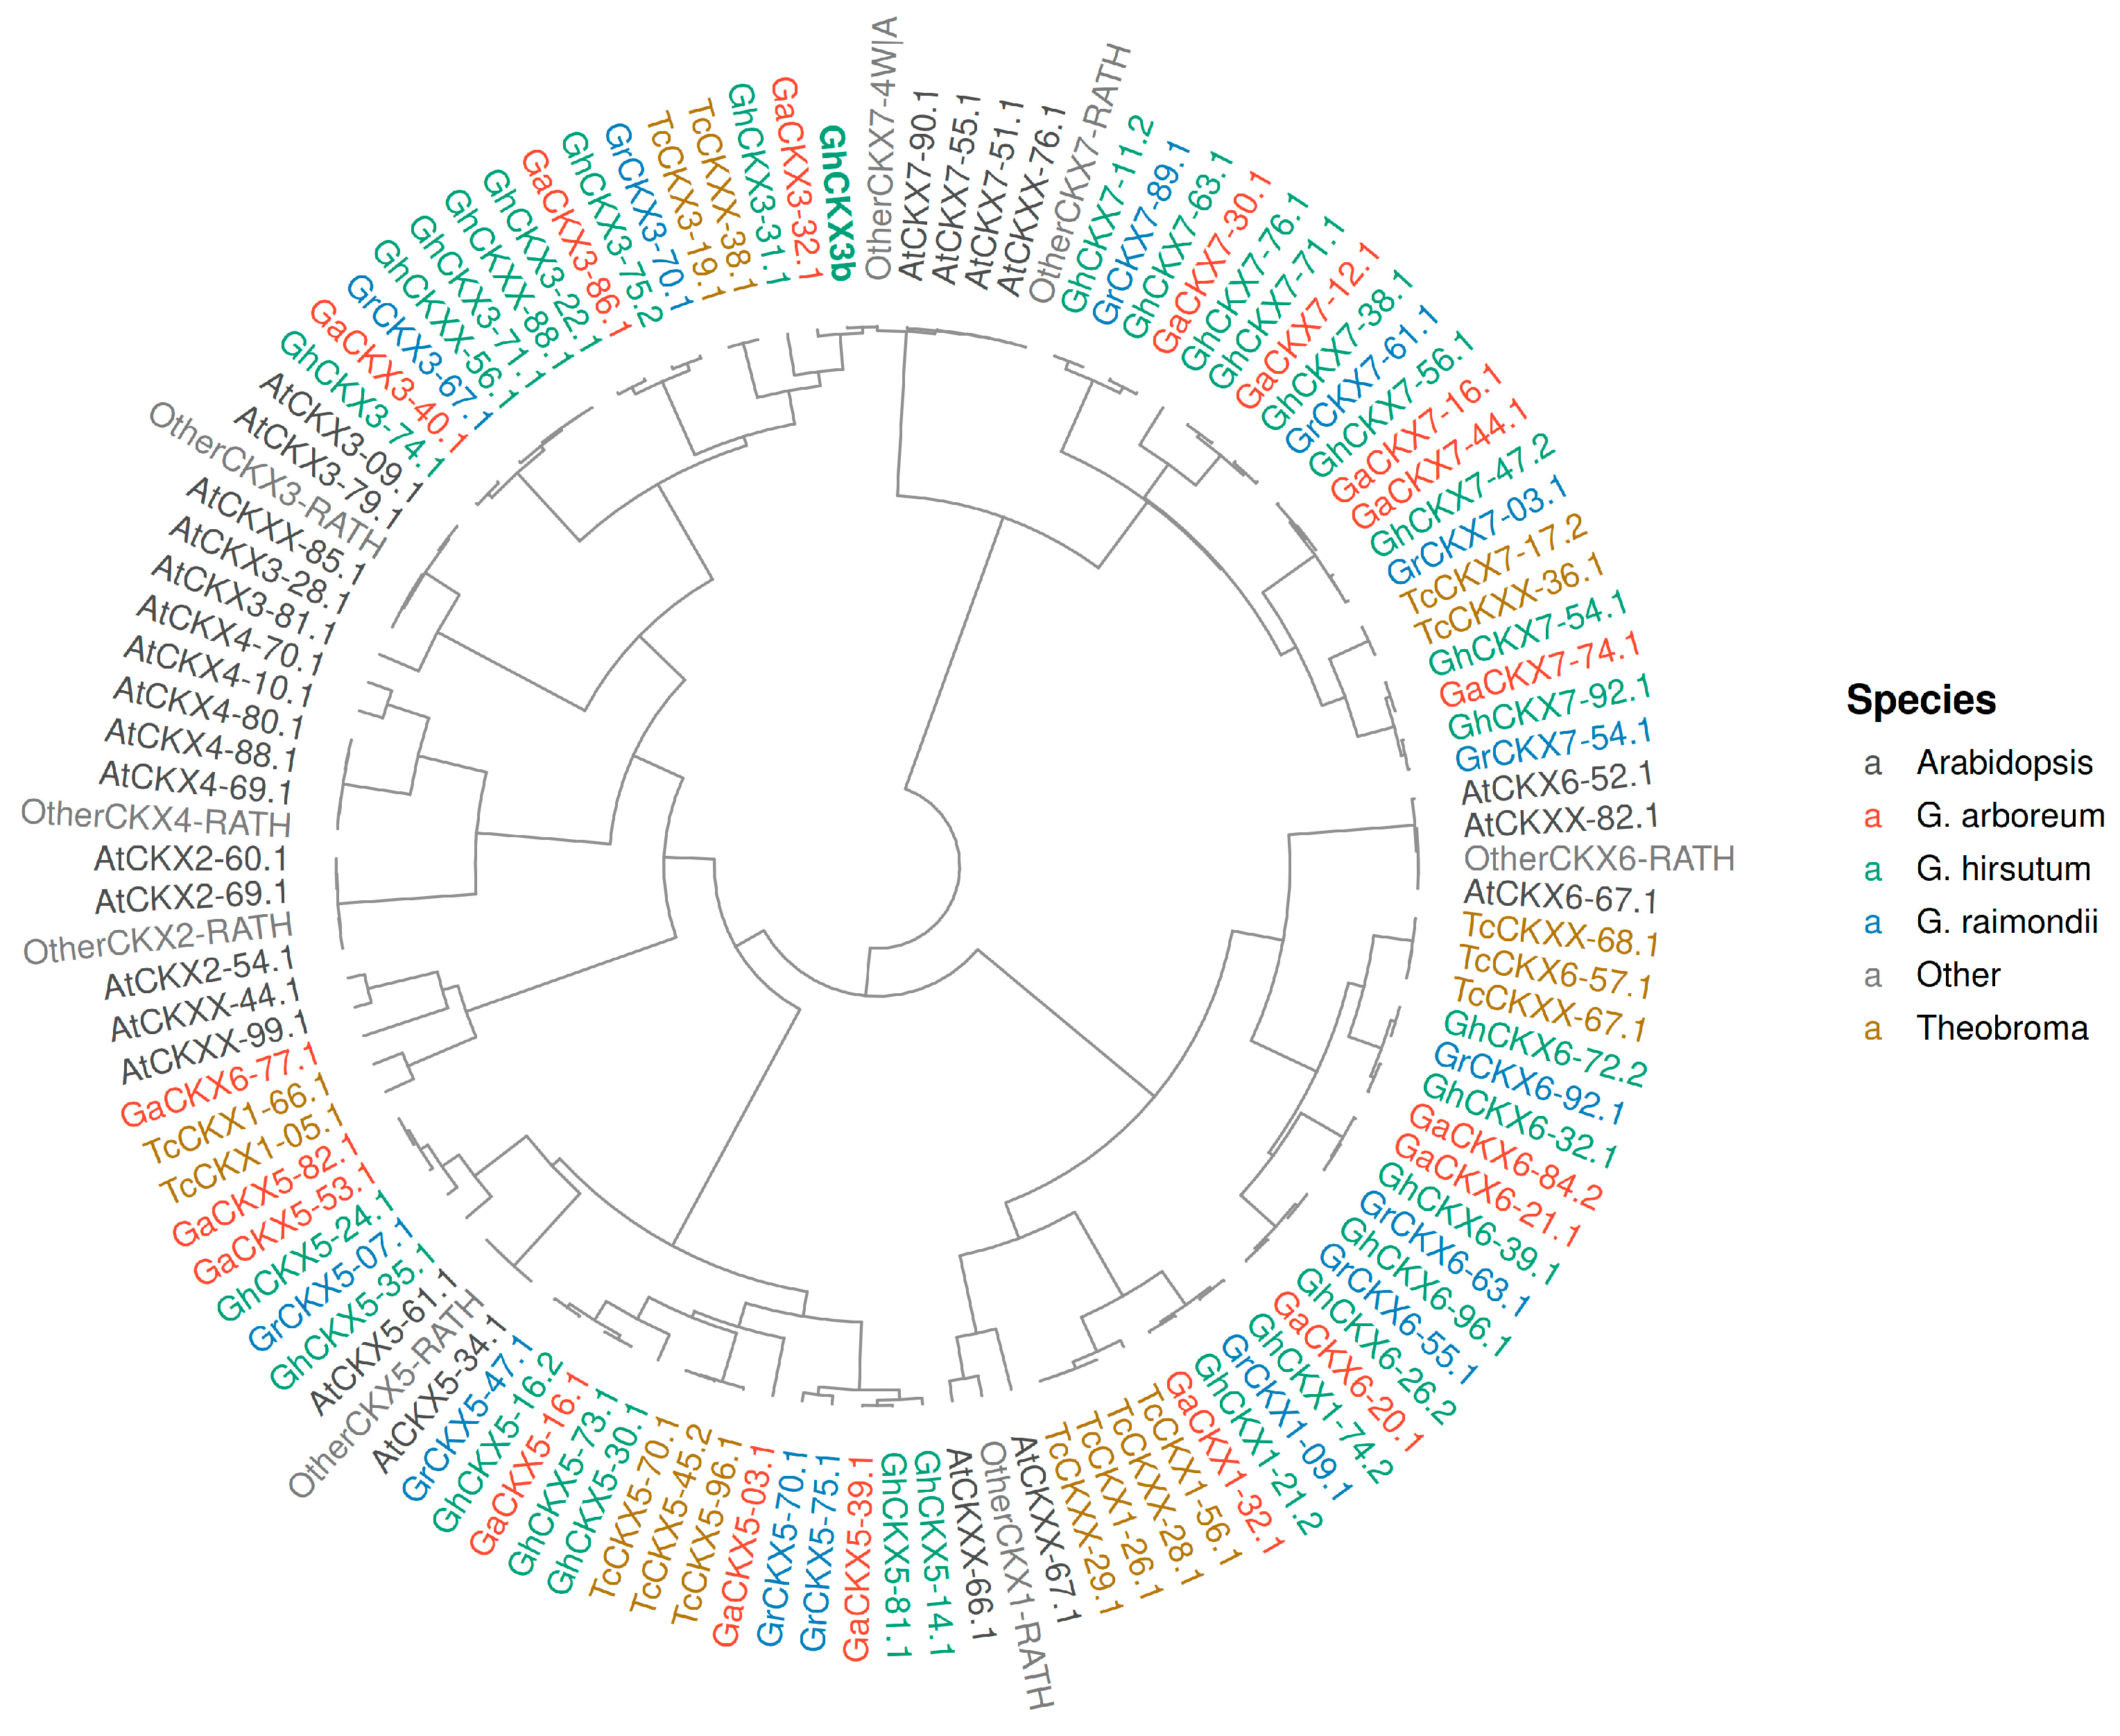
To place GhCKX3b within the CKX gene family, we performed a phylogenetic analysis using CKX protein sequences from Gossypium hirsutum, its diploid progenitors (G. raimondii and G. arboreum), and representative outgroup species. As shown in Figure 2, CKX proteins from upland cotton generally formed paired clusters, consistent with the polyploid origin of this species. GhCKX3b (XP_016719655) clustered within the CKX3-related clade together with closely related cotton homologs, suggesting its conservation within the cotton CKX family. However, a clear one-to-one correspondence with parental copies from the A- and D-genome species was not resolved in this analysis.
Among the CKX gene family members, GhCKX3b was selected for further functional analysis because CKX3 homologs have been reported to play important roles in cytokinin metabolism and reproductive development in cotton [10]. In addition, its conserved position within the CKX3 clade suggests potential functional stability, making it a suitable candidate for targeted manipulation.

3.2. Generation of Transgenic Plants with Carpel-Specific GhCKX3b Downregulation

A carpel-specific RNAi vector targeting GhCKX3b was constructed using the proAGIP promoter and introduced into ‘Yuanmian 8’ by Agrobacterium-mediated transformation. The proAGIP promoter was selected because AGAMOUS regulatory elements have been reported to drive whorl-specific expression in reproductive floral organs, including carpels [19].
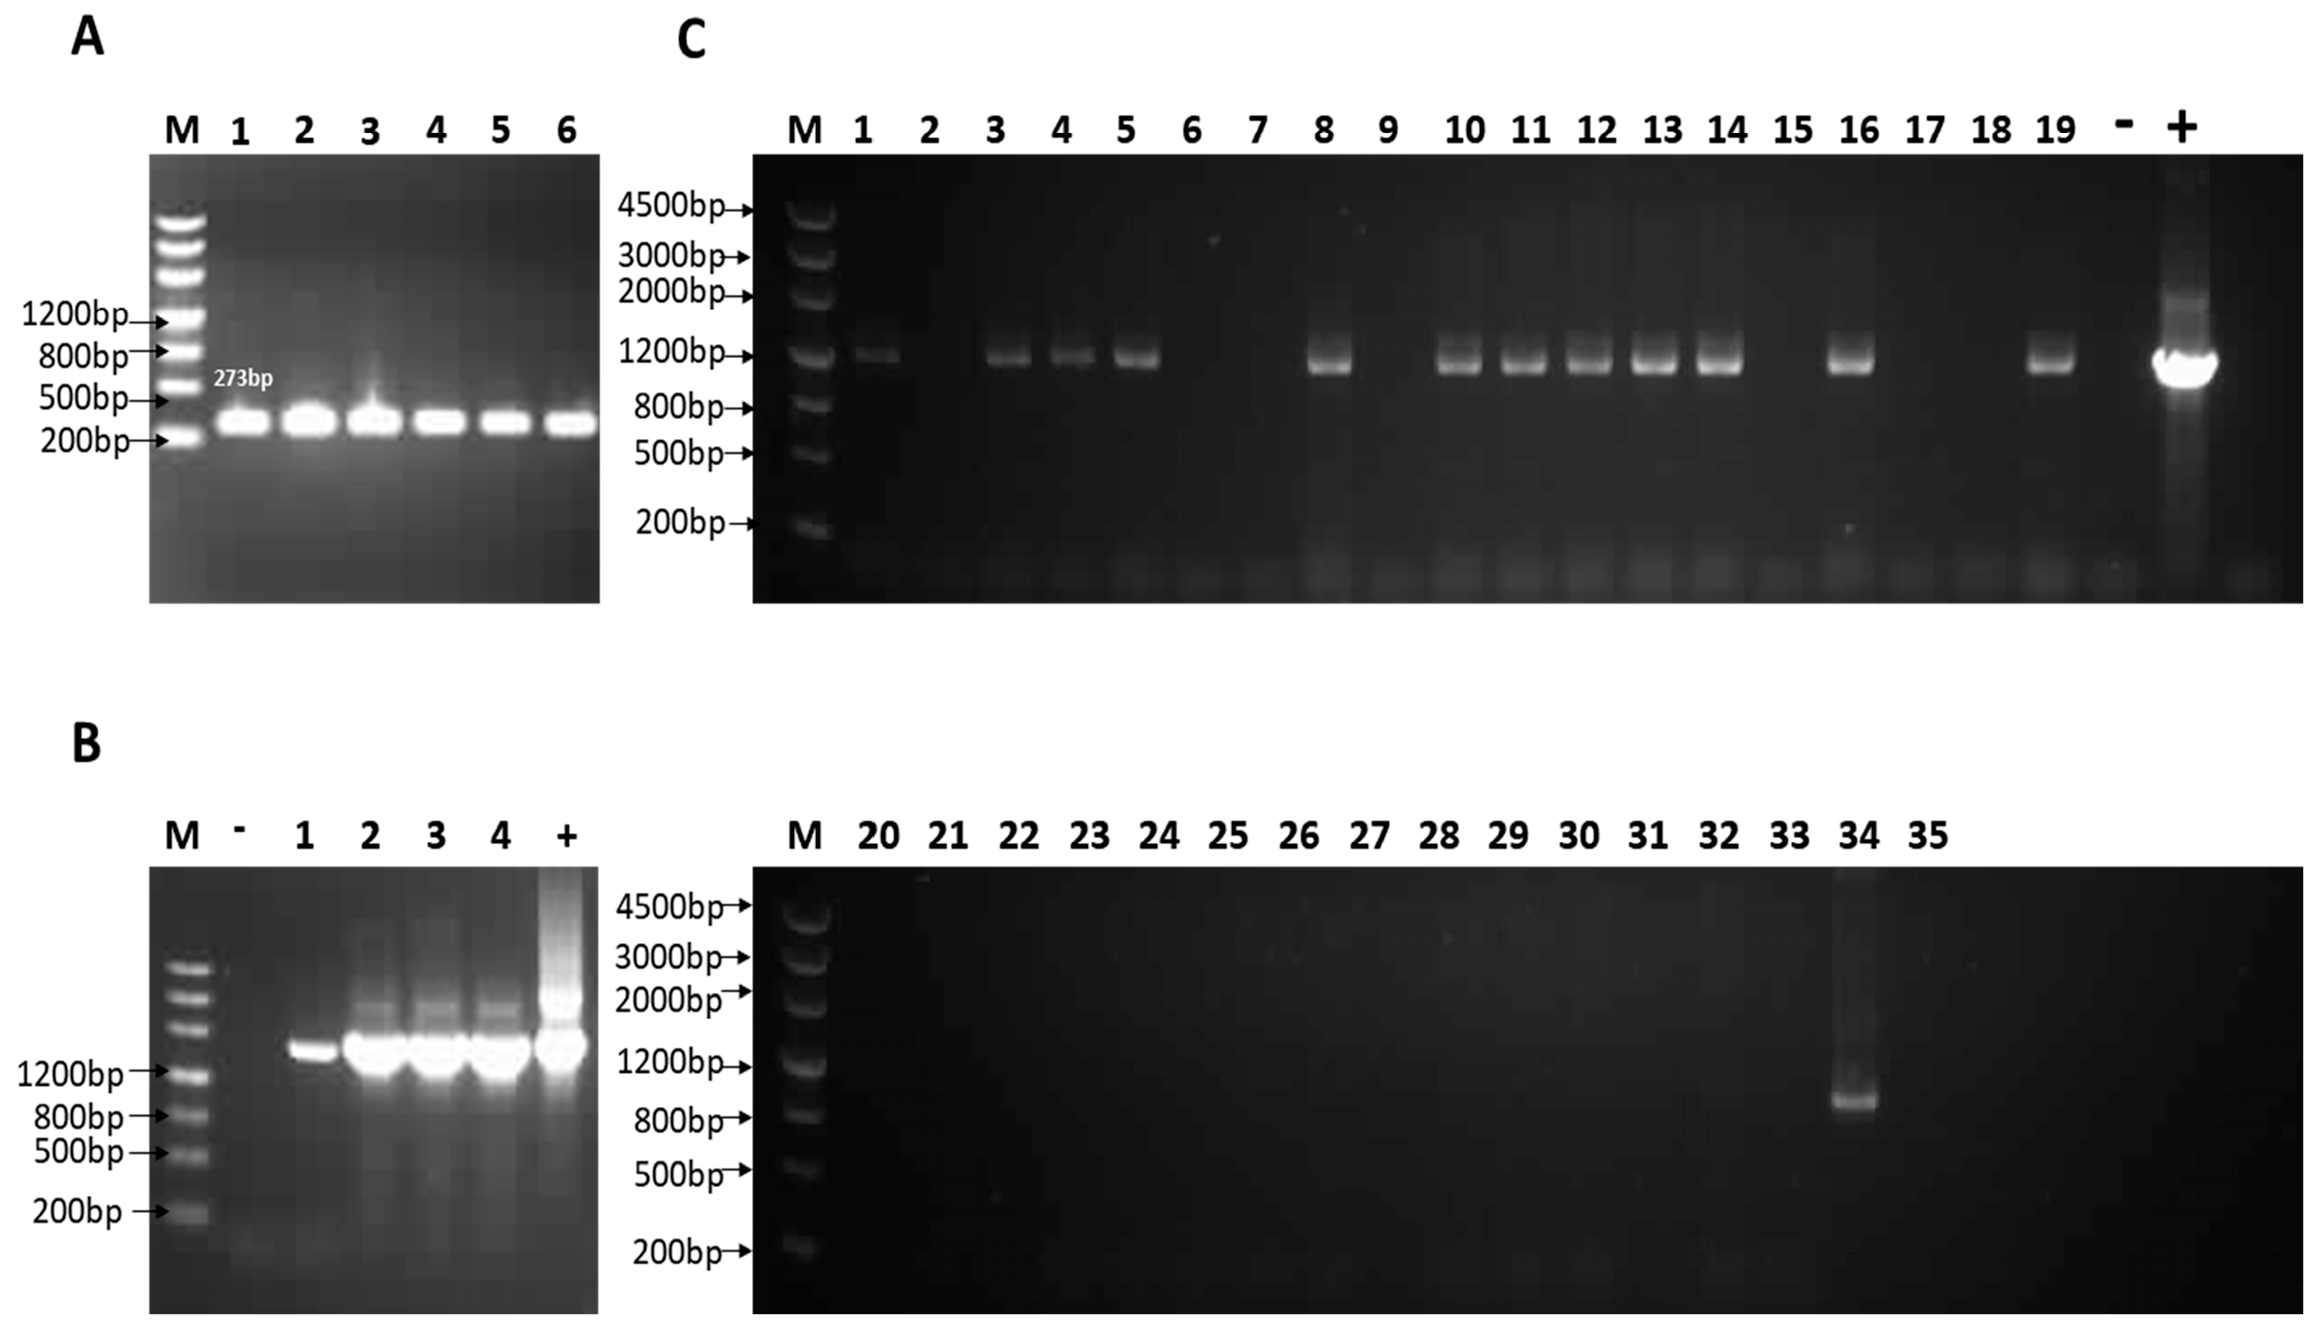
A conserved 273 bp fragment of GhCKX3b was selected as the RNAi target to ensure efficient gene silencing while minimizing potential off-target effects on other CKX family members. PCR amplification confirmed the successful cloning of the GhCKX3b target fragment (Figure 4A) and the correct construction of recombinant plasmid colonies (Figure 4B). The final plant expression vector, pCAMBIA2300-proAGIP::GhCKX3b-RNAi, was further verified by PCR analysis (Figure 4C), and its overall structure is shown in Figure 3.
A total of 35 regenerated T0 plants were obtained, among which 13 were identified as PCR-positive using NPTII-specific primers (Figure 4C). These positive lines were advanced for further analysis.
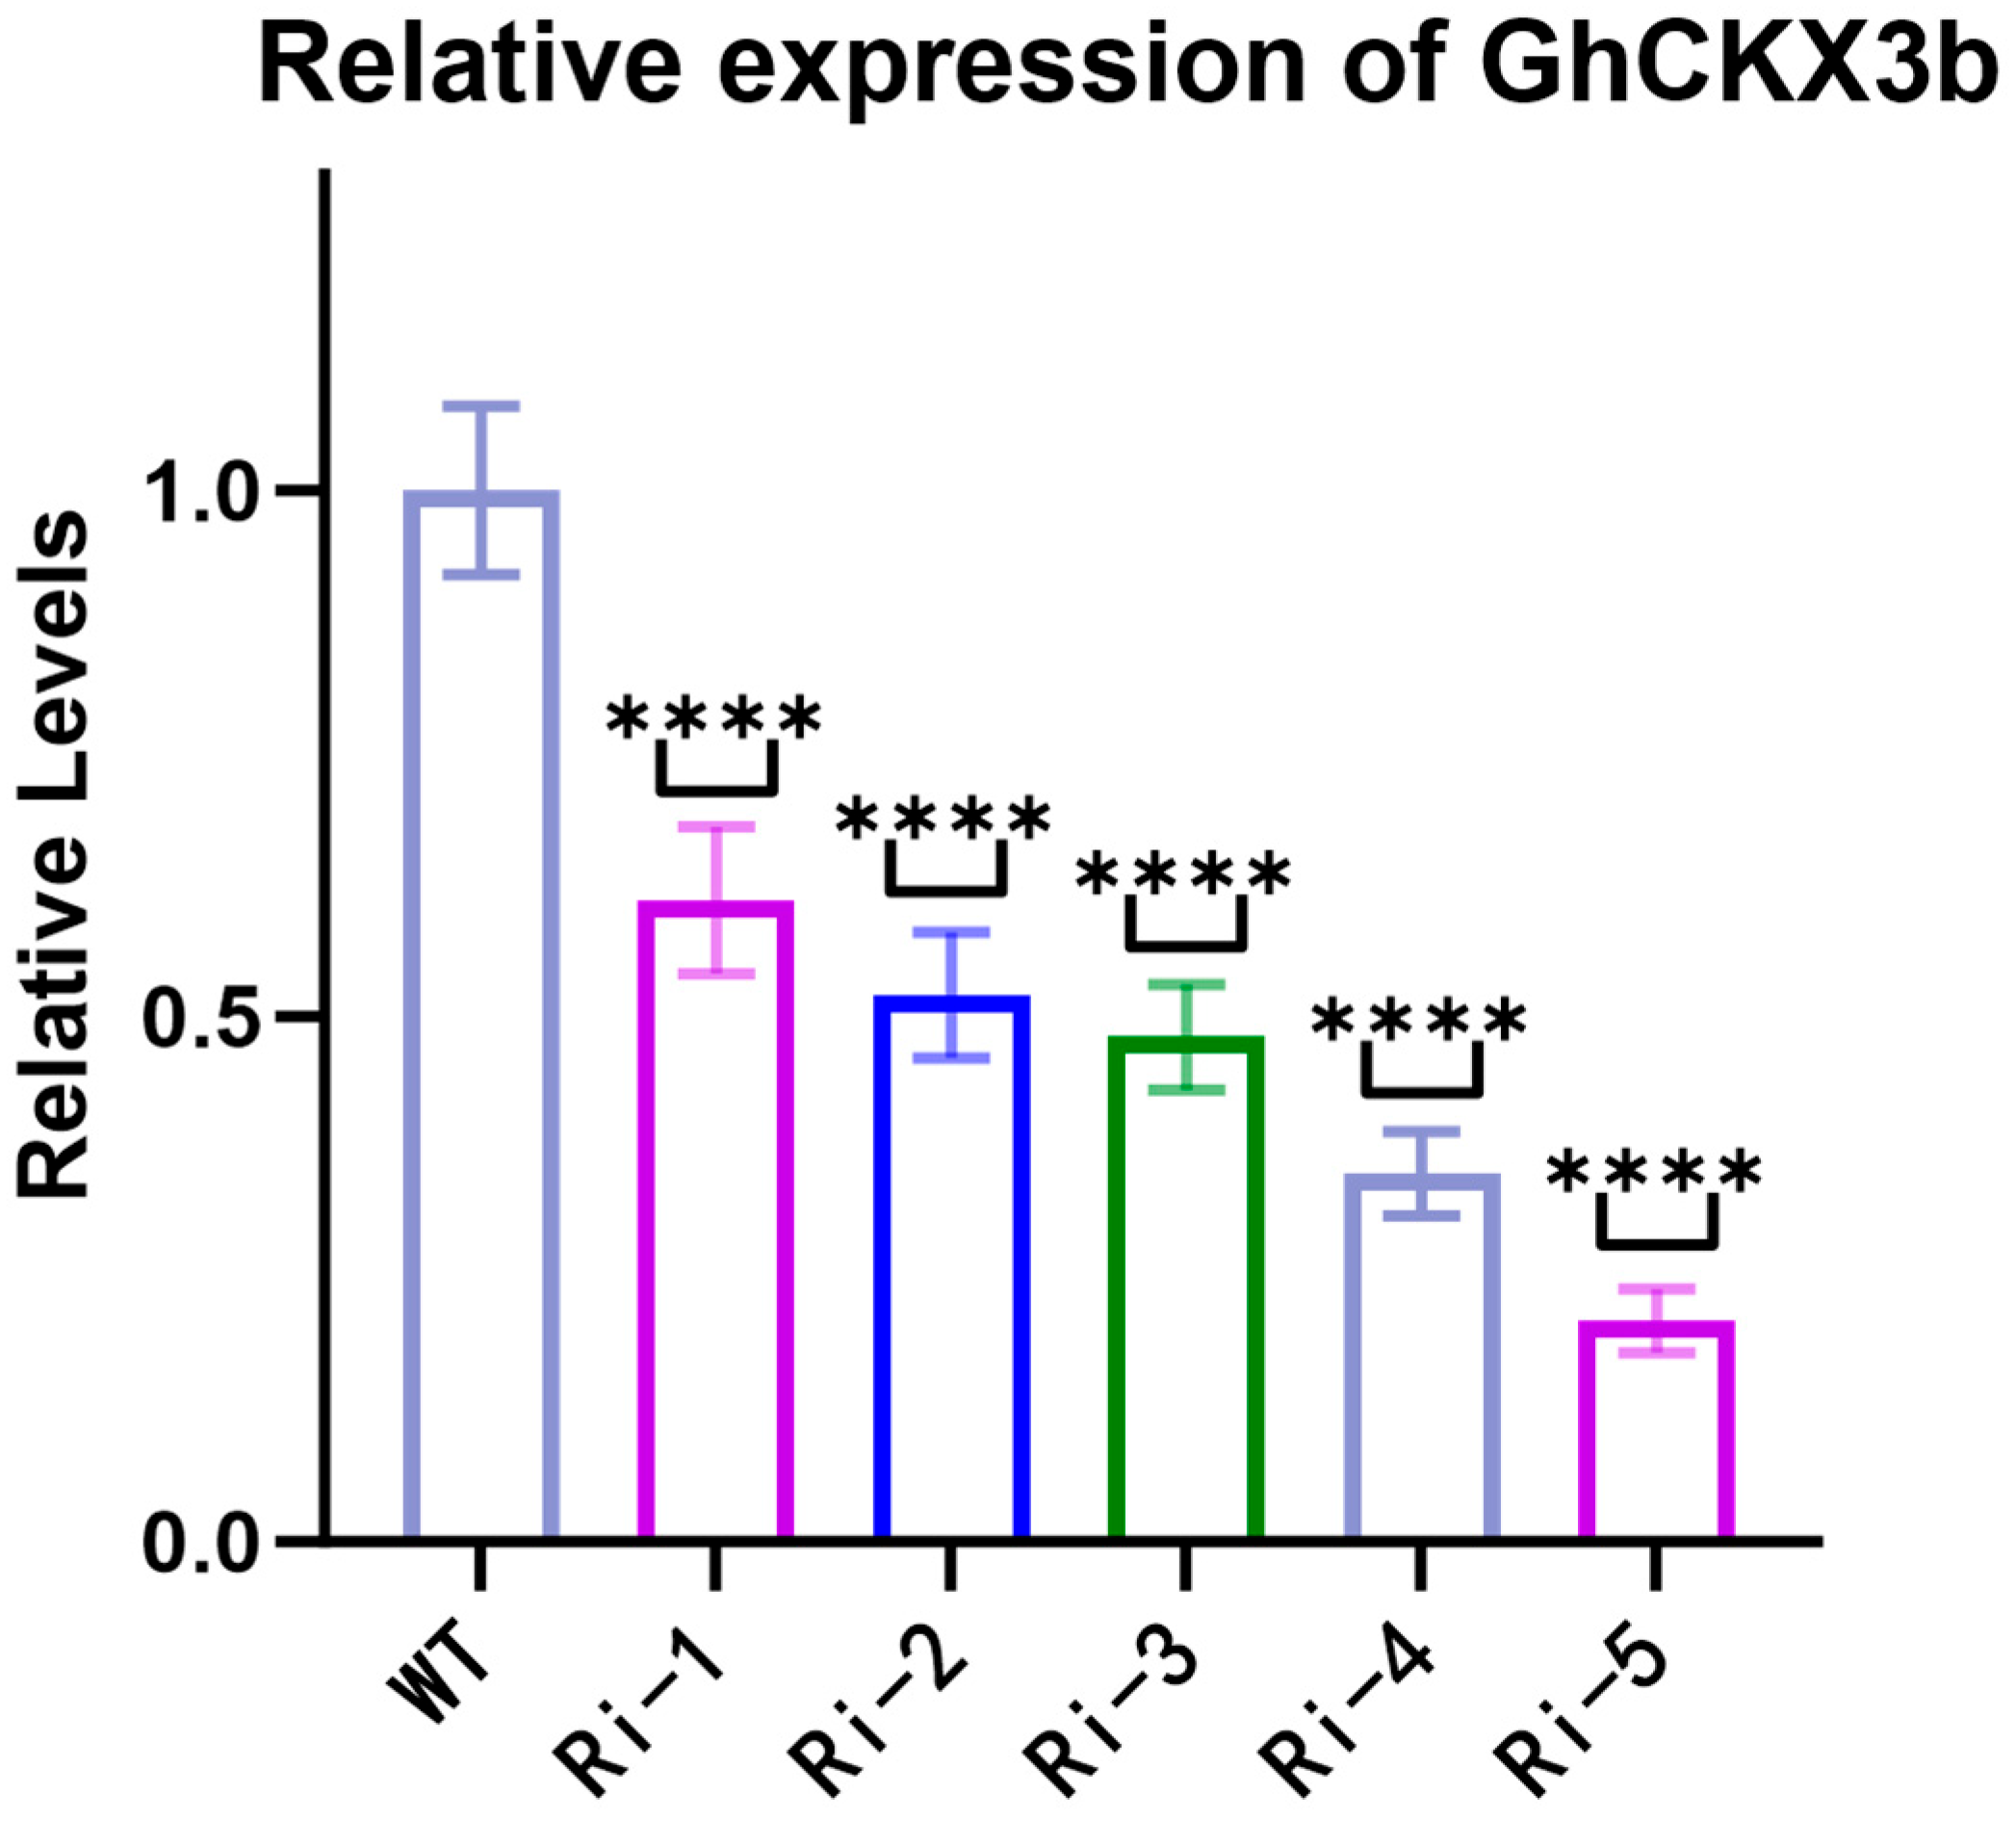
RT-qPCR analysis of carpel tissues from five representative T0 lines (Ri-1 to Ri-5) showed that the expression level of GhCKX3b was reduced in all transgenic lines relative to the wild type (Figure 5). The strongest reduction was observed in Ri-4 and Ri-5 (35% and 21% of wild-type levels, respectively), whereas Ri-1, Ri-2, and Ri-3 showed moderate suppression (61%, 52%, and 48% of wild-type levels, respectively). These results indicate that the RNAi construct was effective in carpel tissues, with Ri-4 and Ri-5 exhibiting substantial knockdown suitable for subsequent functional analysis.

3.3. Significant Increase in Cytokinin Content

To determine whether carpel-specific suppression of GhCKX3b altered cytokinin accumulation, we quantified six major cytokinin components in carpels of T2 positive lines (Ri-1(T2) to Ri-5(T2)) and the wild type using LC-MS/MS.
Total cytokinin content was significantly higher in all positive lines than in the wild type (Table 1). Wild-type plants contained 15.1 pmol/g FW total cytokinins, whereas the transgenic lines ranged from 22.7 to 30.5 pmol/g FW, representing increases of 50.3% to 102.0%. Ri-5 (T2) showed the highest total cytokinin content (30.5 pmol/g FW), followed by Ri-4 (T2) (29.6 pmol/g FW). Importantly, this elevation in cytokinin levels was accompanied by consistent improvements in yield-related traits in the T2 generation, including higher lint percentage, increased boll weight, and greater seed number per boll compared with both negative segregants and the wild type, suggesting a positive association between cytokinin accumulation and enhanced yield performance.
Among the measured components, trans-zeatin (tZ) and trans-zeatin riboside (tZR) were the predominant forms in both wild-type and transgenic plants, together accounting for over 80% of total cytokinins. In Ri-5(T2), tZ and tZR reached 10.5 and 16.0 pmol/g FW, respectively, compared with 5.2 and 7.6 pmol/g FW in the wild type. These results indicate that carpel-specific suppression of GhCKX3b increased local cytokinin levels in the target tissue.

3.4. Remodeling of Yield Component Traits

Field evaluation of T0 and T1 plants showed consistent differences in major yield-related traits between transgenic lines and the wild type (Table 2). In the wild type, lint percentage was approximately 36.4–36.5%, whereas all transgenic lines exhibited higher values. Among T0 lines, Ri-5 reached 45.7%, and in the T1 generation, Ri-5(T1) reached 45.8%. Lint index followed a similar trend, with the highest values also observed in Ri-5 and Ri-5(T1) (9.24 g).
In contrast, seed index showed a moderate decrease in transgenic lines relative to the wild type. Meanwhile, boll weight and seeds per boll increased. In T0 plants, boll weight increased from 6.30 g in the wild type to 7.31 g in Ri-5, and seeds per boll increased from 27 to 34. Similar trends were maintained in the T1 generation, where positive lines (Ri-1(T1) to Ri-5(T1)) retained the improved performance of their T0 parents, while negative segregants resembled the wild type across all traits.
To determine whether these improvements in yield components translated into increased productivity, seed cotton yield was also evaluated in the T1 generation (Supplementary File S1). The results showed that seed cotton yield per plot was comparable between transgenic lines and the wild type. Specifically, the wild type produced 6.06 ± 0.10 kg/plot, while transgenic lines ranged from 6.05 ± 0.12 to 6.54 ± 0.13 kg/plot. Although improvements in yield components were consistent, increases in total yield varied among lines and environments.
These results indicate that while transgenic lines showed clear improvements in several yield-component traits, such changes did not uniformly translate into increased overall yield under the tested field conditions.

3.5. Stable Inheritance of Traits in T2 Generation

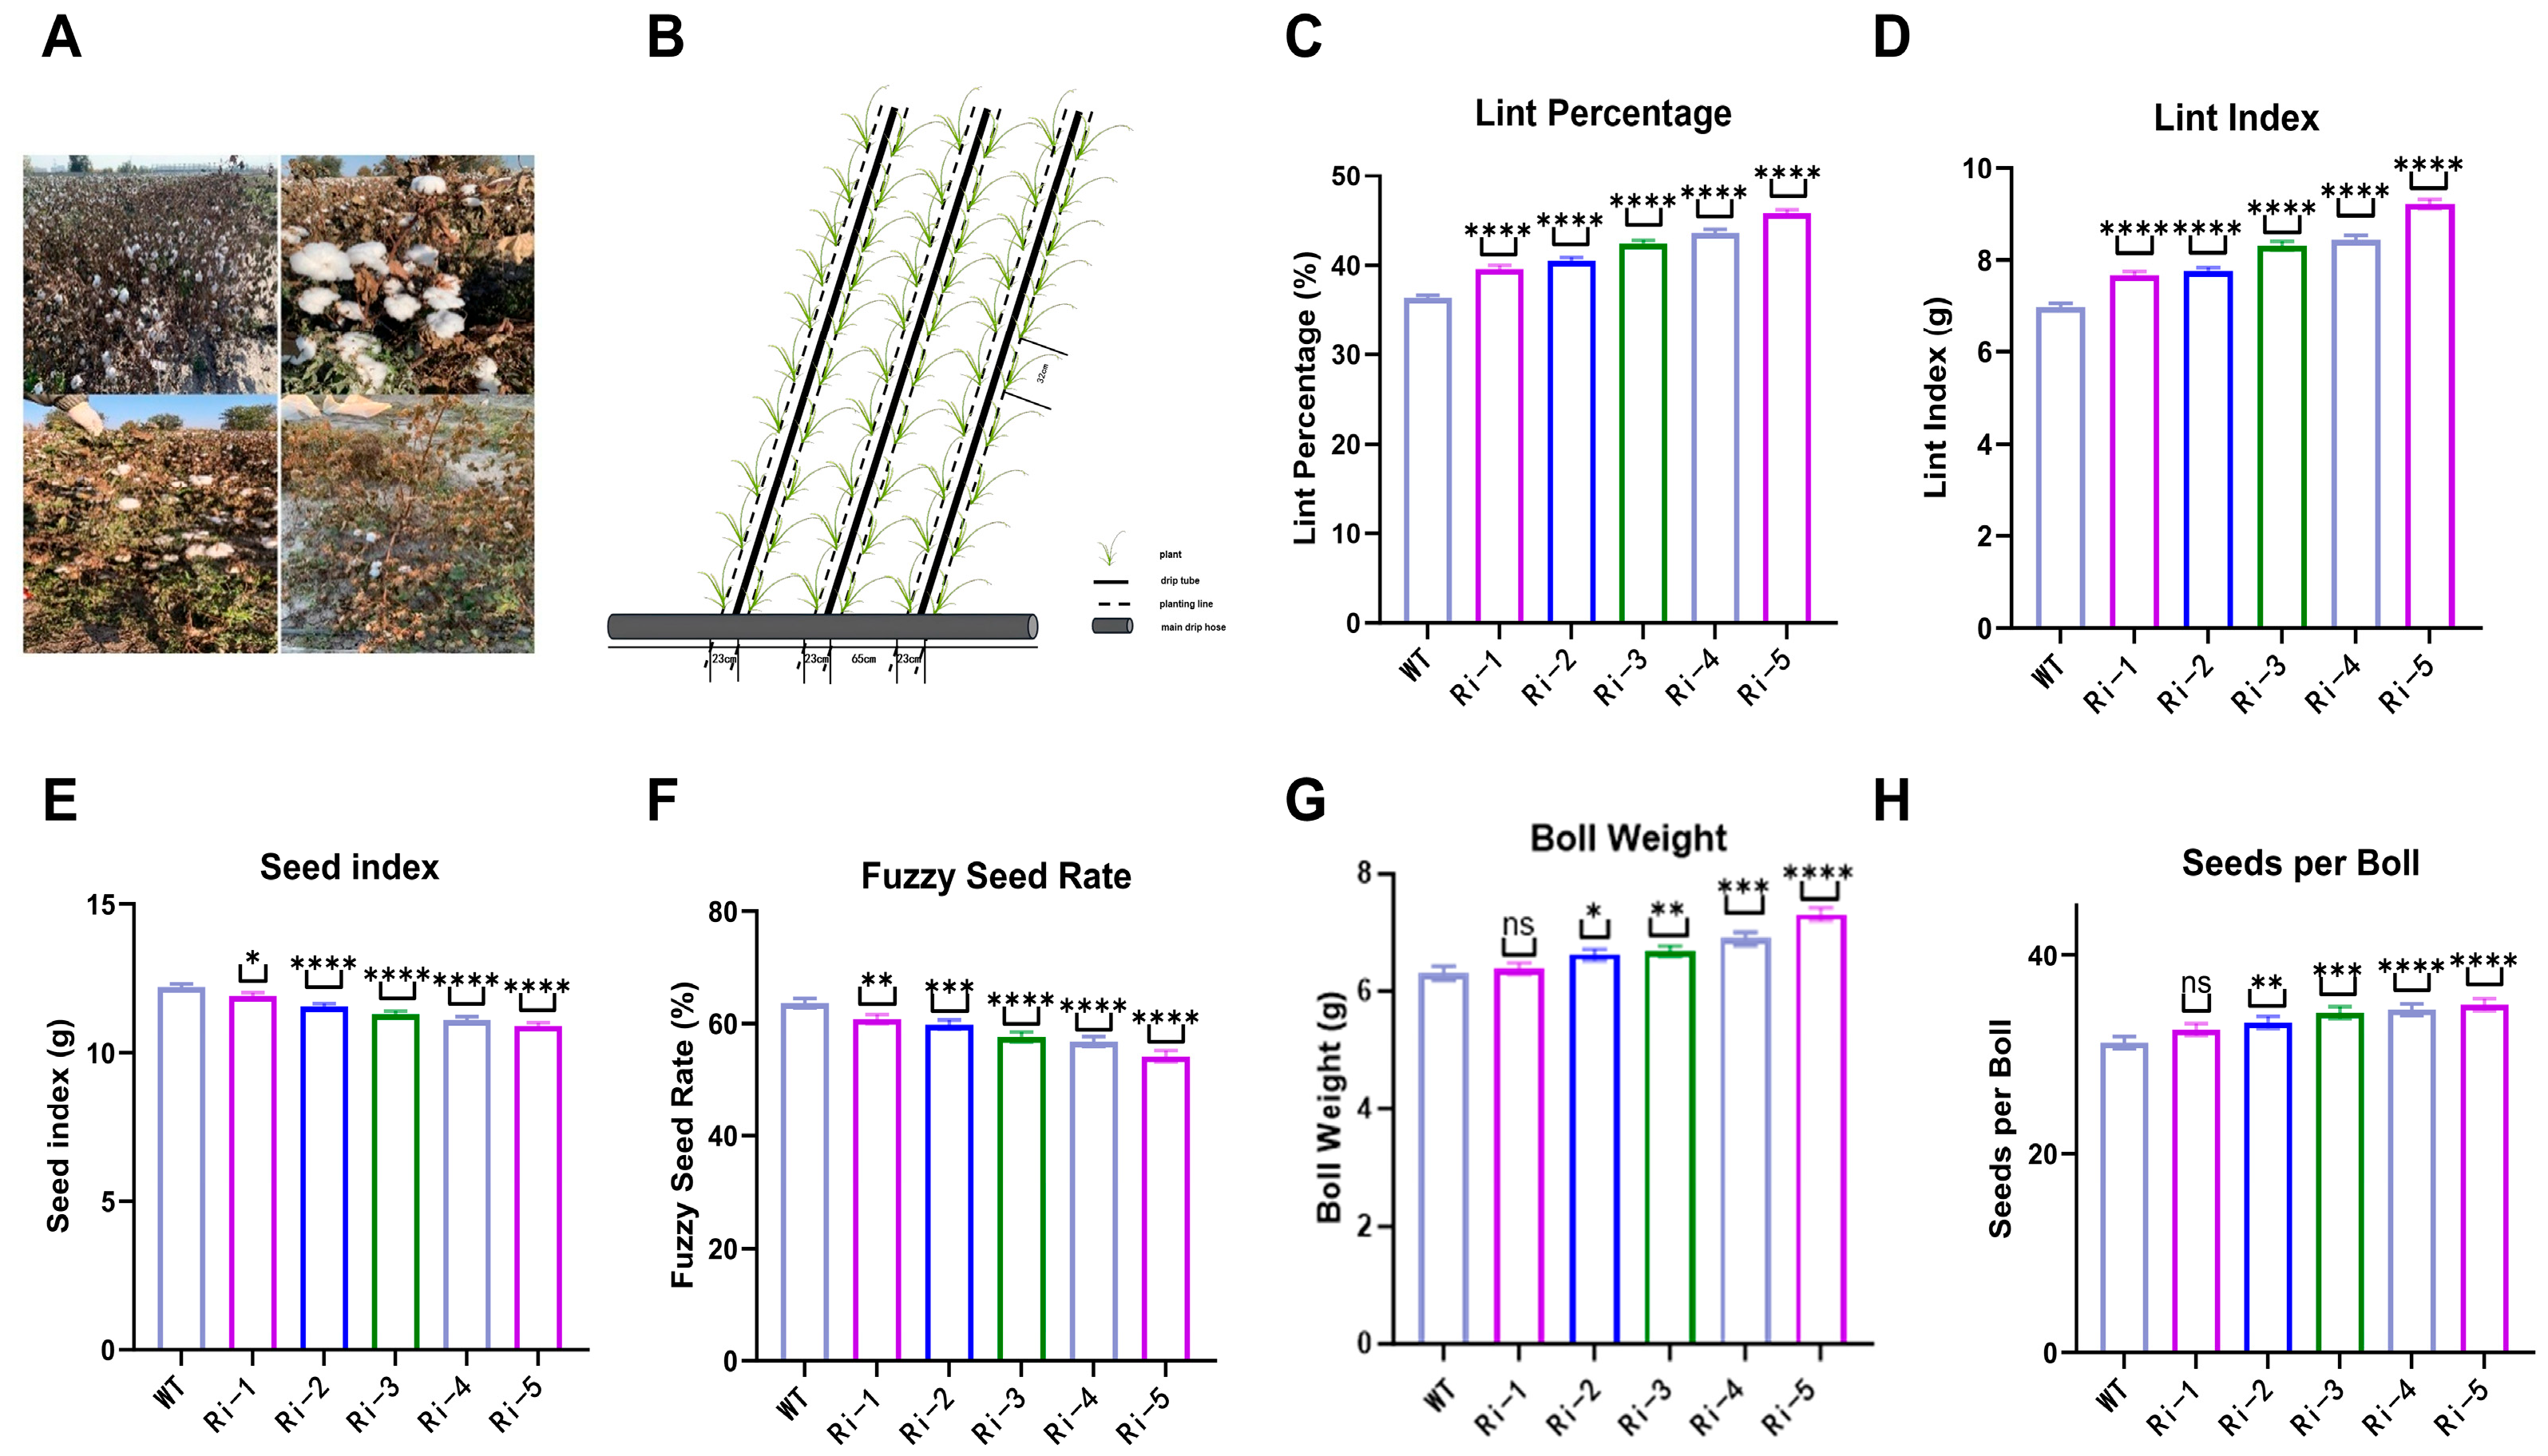
To evaluate the stability of the transgenic effects, T2 progeny derived from five elite T0 lines were analyzed. These T2 populations originated from self-pollinated T1 transgene-positive plants without further distinction between homozygous and heterozygous individuals, which may result in residual segregation within the population. Based on PCR identification, T2 plants were classified as positive (Ri-1(T2) to Ri-5(T2)) or negative (Ri-1(T2)-N to Ri-5(T2)-N), and compared with the wild type (Supplementary File S1; Figure 6).
Positive T2 plants consistently showed higher lint percentage, higher lint index, greater boll weight, and more seeds per boll than both negative segregants and the wild type. In contrast, negative plants were similar to the wild type for all major agronomic traits.
Among the positive T2 lines, Ri-5(T2) showed the highest lint percentage (45.8%) and lint index (9.24 g), whereas Ri-4(T2) and Ri-3(T2) also displayed clear improvement over the wild type. Seed index remained lower in positive lines (10.9–11.9 g) compared with the wild type (12.2 g), while boll weight (6.38–7.31 g) and seeds per boll (32.5–35.0) were increased.
Despite potential segregation in the T2 population, the consistent differences between positive and negative plants indicate that the observed phenotypic effects are associated with the transgene, supporting its stable inheritance.

3.6. Fiber Quality Remains Stable

Fiber quality was evaluated over three consecutive years (2023–2025) using HVI analysis (Table 3). Across T0, T1, and T2 generations, the main fiber quality parameters of the transgenic lines remained close to those of the wild type. Fiber length generally ranged from 29.9 to 30.8 mm, breaking tenacity from 30.2 to 33.6 cN/tex, and micronaire from 4.6 to 5.1. Spinning consistency index values were comparable between transgenic lines and the wild type.
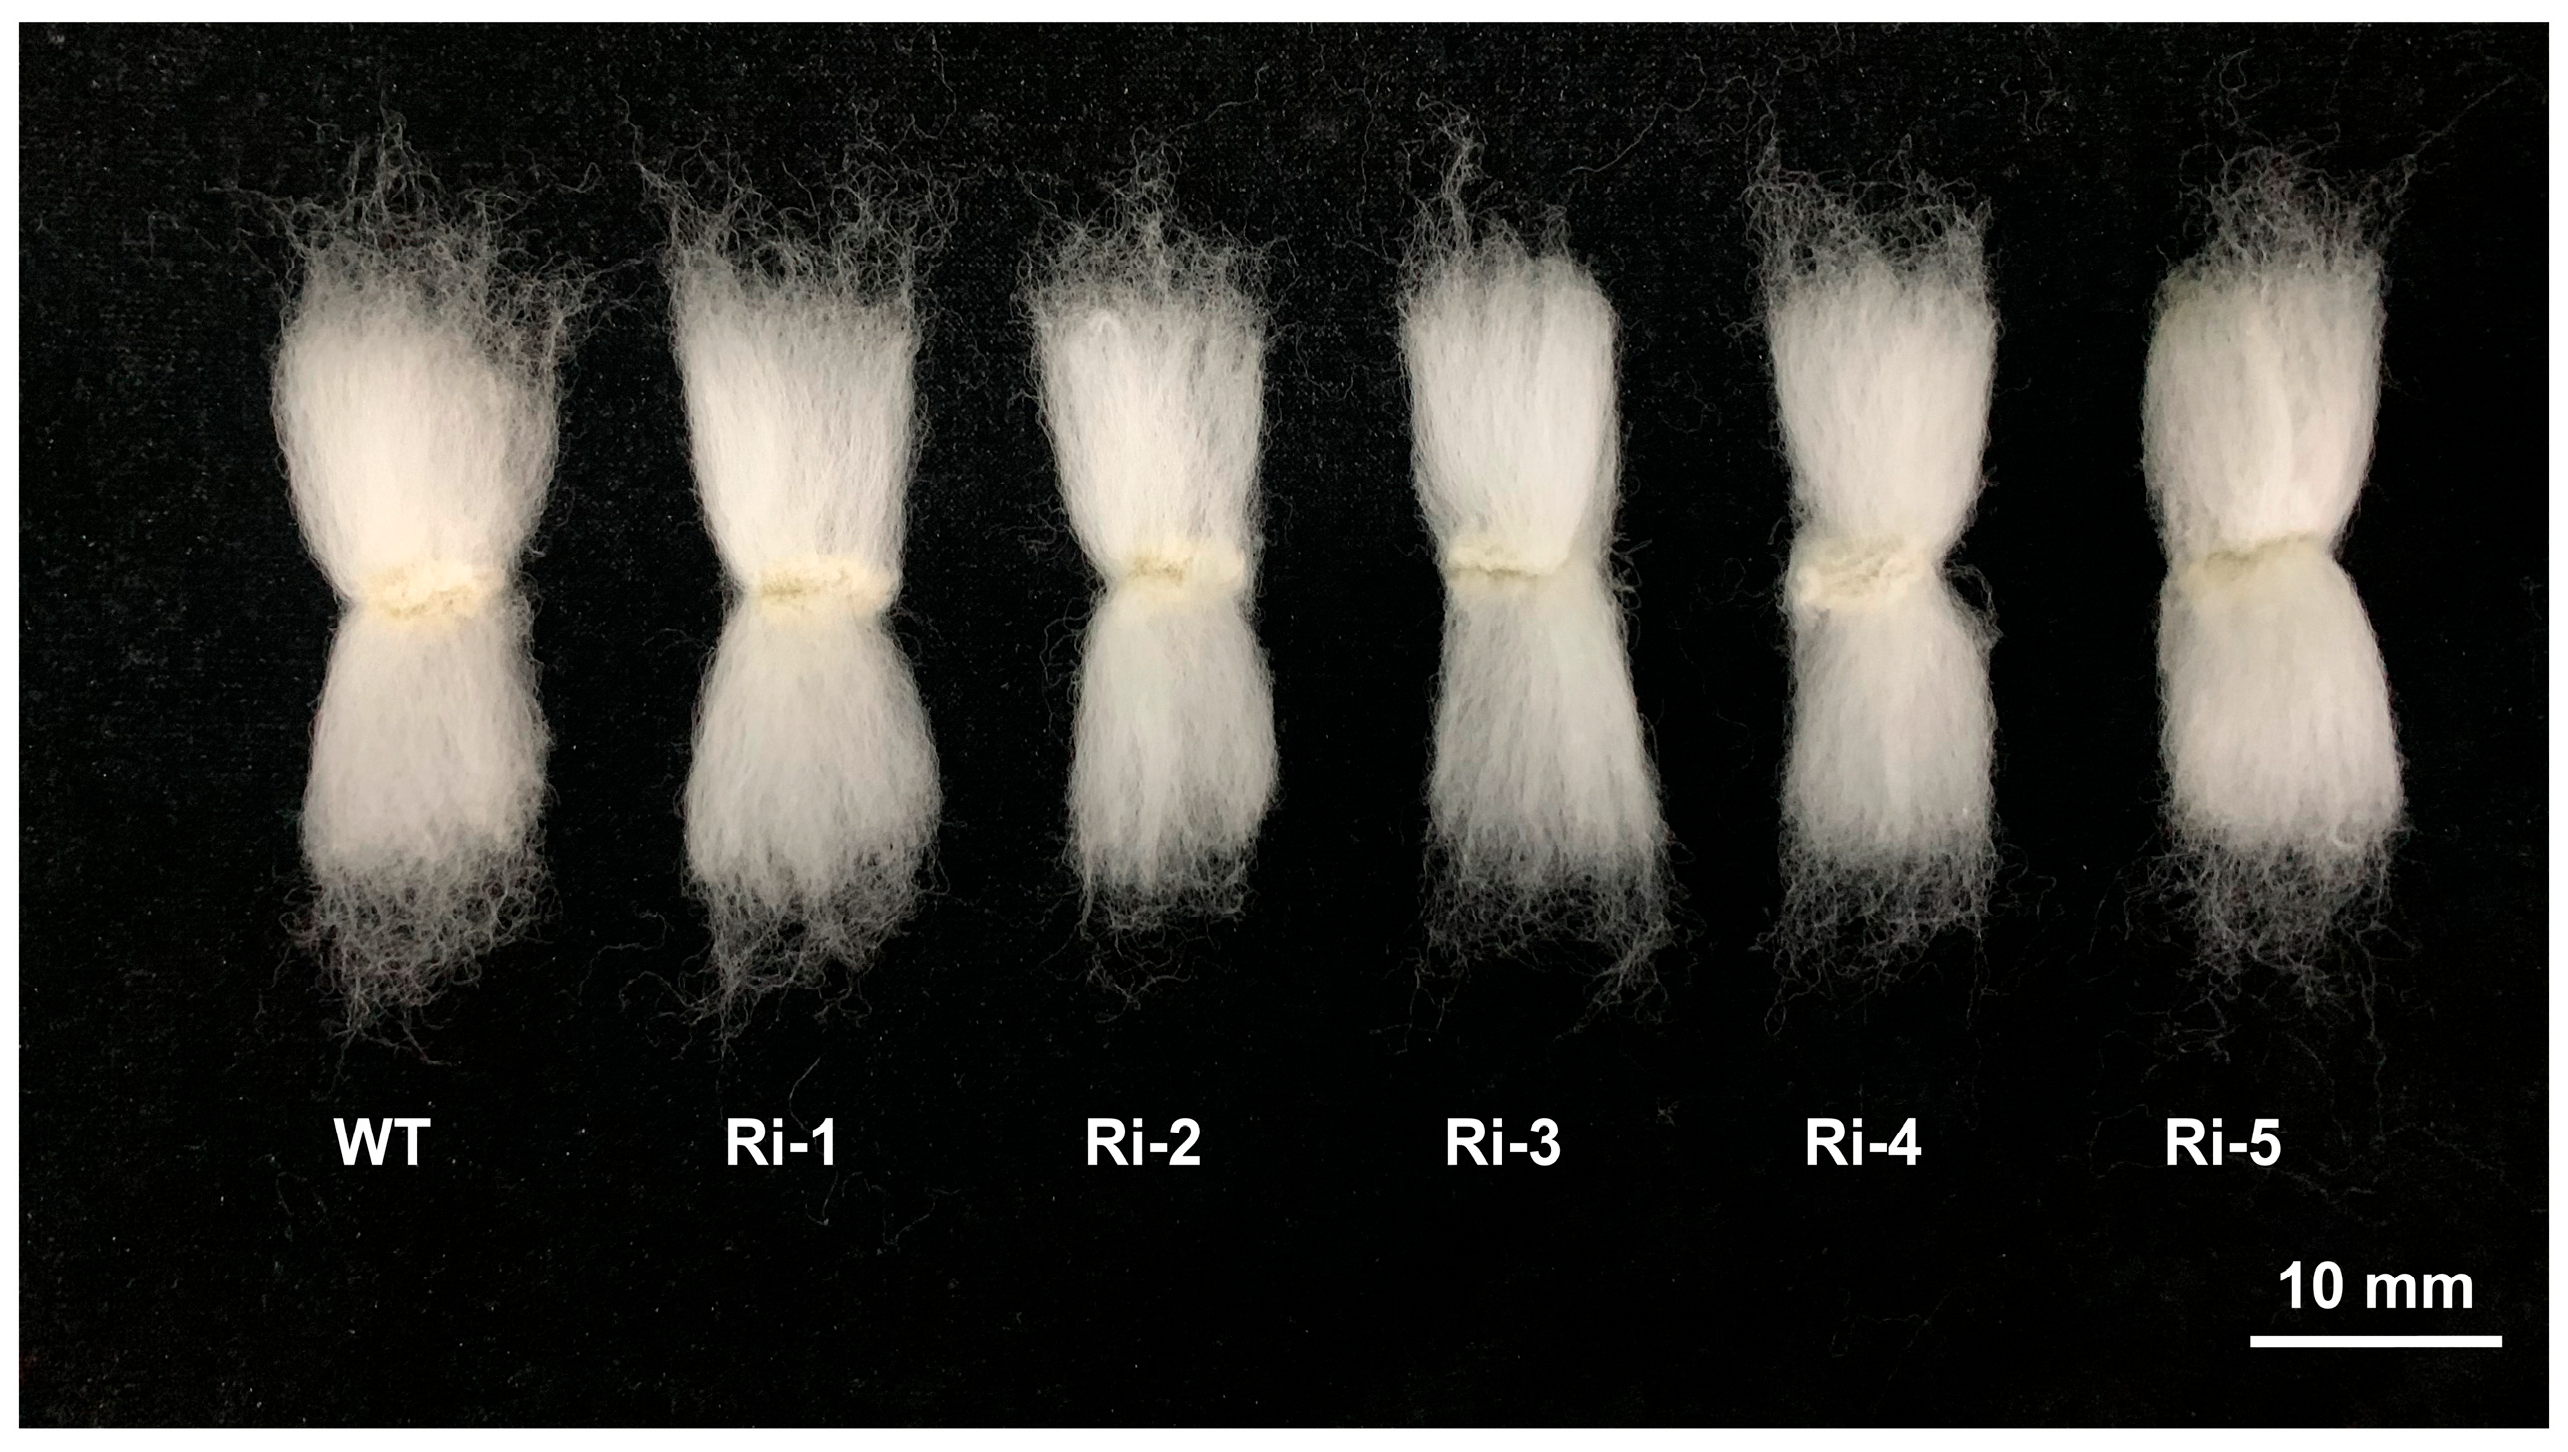
Although some individual lines showed slight reductions in fiber length or strength relative to the wild type, all major parameters remained within an acceptable range for high-quality cotton. These data indicate that the yield-related improvements in the transgenic lines were not accompanied by an obvious deterioration in fiber quality. The comparison of fiber length between the transgenic lines and the wild type is shown in Figure 7.

4. Discussion

4.1. Carpel-Specific GhCKX3b Downregulation Increases Local Cytokinin Levels

Our results demonstrate that carpel-specific suppression of GhCKX3b leads to a significant increase in local cytokinin accumulation in transgenic cotton lines. The observed elevation of cytokinin content in T2 positive lines (50.3% to 102.0% relative to wild type) is consistent with reduced GhCKX3b expression and aligns with previous studies showing that suppression of cytokinin oxidase/dehydrogenase (CKX) genes enhances cytokinin levels in plants [38,39].
In crop species, CKX genes have been widely reported as negative regulators of cytokinin homeostasis, and their downregulation has been associated with increased reproductive development and yield potential [40]. In cotton, cytokinin metabolism has also been implicated in carpel and ovule development, suggesting that localized regulation of CKX activity can directly influence reproductive organ formation [20].
Cytokinins play a critical role in promoting cell division and early reproductive development, particularly during ovule initiation and seed formation [41]. Therefore, the localized increase in cytokinin levels observed in this study is likely to contribute directly to the improved boll-related traits in the transgenic lines.
Furthermore, the best agronomic performance was associated with the highest cytokinin accumulation, suggesting a positive relationship between cytokinin levels and yield improvement. However, previous studies indicate that cytokinin effects are highly context-dependent and influenced by genetic background and downstream signaling pathways [42], which may explain the variation observed among different transgenic lines.
Notably, a recent study by Zeng et al. 2022 [10] reported that downregulation of GhCKX genes in cotton leads to increased cytokinin accumulation and enhanced reproductive development, supporting the conserved role of CKX genes in regulating cytokinin homeostasis and yield-related traits.
Our findings are generally consistent with this study in demonstrating that suppression of GhCKX activity can elevate cytokinin levels and improve yield components. However, an important distinction in our study is the use of a carpel-specific promoter (proAGIP), which enables localized cytokinin accumulation in reproductive tissues. This spatially restricted regulation may help to minimize undesirable pleiotropic effects and contributes to the maintenance of fiber quality in an elite cotton background.
Therefore, compared with previous studies, our results provide additional evidence that tissue-specific modulation of cytokinin metabolism represents a promising strategy for improving cotton productivity while preserving key agronomic traits.

4.2. Coordinated Changes in Yield Component Traits

A notable feature of this study is that multiple yield component traits were simultaneously affected in the transgenic lines, including increased lint percentage, boll weight, and seeds per boll, accompanied by a moderate decrease in seed index.
Such coordinated responses have also been reported in studies involving cytokinin regulation, where manipulation of cytokinin metabolism alters source–sink relationships and biomass allocation [41,42]. Cytokinins are known to enhance sink strength by promoting cell division and increasing the competitiveness of developing reproductive tissues, which can lead to increased seed number and overall reproductive output.
The reduction in seed index observed in this study is consistent with a trade-off mechanism, in which assimilates are redistributed toward a larger number of developing seeds rather than individual seed mass. Similar patterns have been reported in barley and rice following CKX suppression [39,40].
From a breeding perspective, such coordinated trait changes are particularly important, as improvement in one yield component is often offset by deterioration in others. In the ‘Yuanmian 8’ background, however, the transgenic lines exhibited a favorable combination of increased lint percentage, greater boll weight, and higher seed number. Although the present study does not directly dissect the underlying physiological mechanisms, the observed trait patterns are consistent with previous reports suggesting that targeted cytokinin regulation can optimize yield component balance.

4.3. Maintenance of Fiber Quality in a High-Quality Background

A key challenge in cotton breeding is to enhance yield without compromising fiber quality. In this study, multi-year HVI data showed that fiber length, strength, and micronaire remained within acceptable ranges in the transgenic lines, despite significant improvements in yield-related traits.
Previous studies have suggested that genetic modifications aimed at increasing yield may negatively impact fiber quality, particularly when they alter carbon allocation or developmental timing [43]. However, tissue-specific regulatory strategies have been proposed as an effective way to minimize such trade-offs.
The results of this study support this concept. By restricting GhCKX3b suppression to the carpel, cytokinin levels were increased primarily in reproductive tissues, while fiber development processes were largely unaffected. This spatial specificity likely contributes to the maintenance of fiber quality traits.
These findings have important implications for practical breeding. While earlier studies have demonstrated that cytokinin regulation can enhance reproductive development, our results extend these observations by showing that this approach can be successfully applied in an elite, high-quality cotton cultivar without compromising fiber performance across multiple generations.

5. Conclusions

In summary, carpel-specific suppression of GhCKX3b in the elite cotton cultivar ‘Yuanmian 8’ increased local cytokinin levels and improved several key yield-related traits, including lint percentage, boll weight, and seeds per boll. These effects were stably observed across T0, T1, and T2 generations. Importantly, the transgenic lines did not show an obvious reduction in major fiber quality parameters under the conditions tested. This study provides breeding-oriented evidence that tissue-specific regulation of cytokinin metabolism may be useful for improving cotton productivity in high-quality genetic backgrounds.

Supplementary Materials

The following supporting information can be downloaded at: https://www.mdpi.com/article/10.3390/agriculture16111134/s1.

Author Contributions

Conceptualization, J.Z. and R.L.; methodology, W.Y., X.W., H.X., Q.L., S.W., M.H., X.C. and M.T.; formal analysis, W.Y.; investigation, W.Y., X.W., M.H., X.C. and M.T.; data curation, W.Y. and H.X.; writing—original draft preparation, J.Z., W.Y. and X.W.; writing—review and editing, H.X., Q.L. and S.W.; supervision, J.Z. and R.L.; project administration, J.Z.; funding acquisition, J.Z. All authors have read and agreed to the published version of the manuscript.

Funding

This work was supported by the Key Science and Technology Program of Xinjiang Province [grant number 2023AB006-02].

Institutional Review Board Statement

Not applicable.

Informed Consent Statement

Not applicable.

Data Availability Statement

The data supporting the findings of this study are available within the article and its Supplementary Materials. Raw data are available from the corresponding author upon reasonable request.

Conflicts of Interest

The authors declare that the research was conducted in the absence of any commercial or financial relationships that could be construed as a potential conflict of interest.

References

  1. Chen, Z.J.; Scheffler, B.E.; Dennis, E.; Triplett, B.A.; Zhang, T.; Guo, W.; Chen, X.; Stelly, D.M.; Rabinowicz, P.D.; Town, C.D.; et al. Toward sequencing cotton (Gossypium) genomes. Plant Physiol. 2007, 145, 1303–1310. [Google Scholar] [CrossRef]
  2. Zhang, M.; Zheng, X.; Song, S.; Zeng, Q.; Hou, L.; Li, D.; Zhao, J.; Wei, Y.; Li, X.; Luo, M.; et al. Spatiotemporal manipulation of auxin biosynthesis in cotton ovule epidermal cells enhances fiber yield and quality. Nat. Biotechnol. 2011, 29, 453–458. [Google Scholar] [CrossRef]
  3. Gong, Z.; Wang, J.; Li, X.; Zheng, J.; Liang, Y.; Yang, N.; Sun, F.; Geng, S.; Qian, S. Breeding and cultivation techniques of a machine-harvest suited cotton variety, Yuanmian 8. China Cotton 2025, 52, 29–30. [Google Scholar] [CrossRef]
  4. Karademir, E.; Karademir, C.; Ekinci, R.; Gencer, O. Relationship between yield, fiber length and other fiber-related traits in advanced cotton strains. Not. Bot. Horti Agrobot. 2010, 38, 111–116. [Google Scholar] [CrossRef]
  5. Foulk, J.A.; McAlister, D.D. Single cotton fiber properties of low, ideal, and high micronaire values. Text. Res. J. 2002, 72, 885–891. [Google Scholar] [CrossRef]
  6. Meredith, W.R., Jr.; Bridge, R.R. Breakup of Linkage Blocks in Cotton, Gossypium hirsutum L.1. Crop Sci. 1971, 11, 695–698. [Google Scholar] [CrossRef]
  7. Ashokkumar, K.; Ravikesavan, R. Genetic studies of correlation and path coefficient analysis for seed oil, yield and fibre quality traits in cotton (G. hirsutum L.). Aust. J. Basic Appl. Sci. 2010, 4, 5496–5499. [Google Scholar]
  8. Ulloa, M.; Meredith, W.R., Jr. Genetic linkage map and QTL analysis of agronomic and fiber quality traits in an intraspecific population. J. Cotton Sci. 2000, 4, 161–170. [Google Scholar]
  9. Reyes-Olalde, J.I.; Zuñiga-Mayo, V.M.; Chávez Montes, R.A.; Marsch-Martínez, N.; de Folter, S. Inside the gynoecium: At the carpel margin. Trends Plant Sci. 2013, 18, 644–655. [Google Scholar] [CrossRef] [PubMed]
  10. Zeng, J.; Yan, X.; Bai, W.; Zhang, M.; Chen, Y.; Li, X.; Hou, L.; Zhao, J.; Ding, X.; Liu, R.; et al. Carpel-specific down-regulation of GhCKXs in cotton significantly enhances seed and fiber yield. J. Exp. Bot. 2022, 73, 6758–6772. [Google Scholar] [CrossRef] [PubMed]
  11. Dello Ioio, R.; Nakamura, K.; Moubayidin, L.; Perilli, S.; Taniguchi, M.; Morita, M.T.; Aoyama, T.; Costantino, P.; Sabatini, S. Control of cell division and differentiation in root meristem. Science 2008, 322, 1380–1384. [Google Scholar] [CrossRef] [PubMed]
  12. Argyros, R.D.; Mathews, D.E.; Chiang, Y.H.; Palmer, C.M.; Thibault, D.M.; Etheridge, N.; Argyros, D.A.; Mason, M.G.; Kieber, J.J.; Schaller, G.E. Type B response regulators in cytokinin signaling. Plant Cell 2008, 20, 2102–2116. [Google Scholar] [CrossRef]
  13. Werner, T.; Motyka, V.; Strnad, M.; Schmülling, T. Regulation of plant growth by cytokinin. Proc. Natl. Acad. Sci. USA 2001, 98, 10487–10492. [Google Scholar] [CrossRef] [PubMed]
  14. Mok, D.W.S.; Mok, M.C. Cytokinin metabolism and action. Annu. Rev. Plant Physiol. Plant Mol. Biol. 2001, 52, 89–118. [Google Scholar] [CrossRef]
  15. Wang, J.; Liang, Y.; Gong, Z.; Liu, H.; Yan, W.; Zheng, J.; Geng, S.; Diao, Y.; Li, X. Effect of three microbial agents on dry matter accumulation, canopy structure and fibre quality of Yuanmian 8. China Cotton 2024, 51, 27–31. [Google Scholar] [CrossRef]
  16. Li, Y.; Xu, B.; Gao, X.; Wang, Y.; Liu, X.; Xu, R.; Li, J.; Wei, P.; Qin, R. Tuning Rice Gene Expression via In Situ Promoter Truncations Using a Prime Editing Library. Plant Biotechnol. J. 2026, 24, 3528–3530. [Google Scholar] [CrossRef]
  17. Yang, Z.; Gao, C.; Zhang, Y.; Yan, Q.; Hu, W.; Yang, L.; Wang, Z.; Li, F. Recent progression and future perspectives in cotton genomic breeding. J. Integr. Plant Biol. 2023, 65, 548–569. [Google Scholar] [CrossRef]
  18. Wendel, J.F.; Brubaker, C.L.; Alvarez, I.; Cronn, R.C.; Stewart, J.M. Evolution and natural history of the cotton genus. In Genetics and Genomics of Cotton; Paterson, A.H., Ed.; Springer: New York, NY, USA, 2009; pp. 3–22. [Google Scholar]
  19. Deyholos, M.K.; Sieburth, L.E. Separable whorl-specific expression and negative regulation by enhancer elements within the AGAMOUS second intron. Plant Cell 2000, 12, 1799–1810. [Google Scholar] [CrossRef] [PubMed]
  20. Zeng, J.; Zhang, M.; Hou, L.; Bai, W.; Yan, X.; Hou, N.; Wang, H.; Huang, J.; Zhao, J.; Pei, Y. Cytokinin inhibits cotton fiber initiation by disrupting PIN3a-mediated asymmetric accumulation of auxin in the ovule epidermis. J. Exp. Bot. 2019, 70, 3139–3151. [Google Scholar] [CrossRef]
  21. Verwoerd, T.C.; Dekker, B.M.; Hoekema, A. Rapid RNA isolation. Nucleic Acids Res. 1989, 17, 2362. [Google Scholar] [CrossRef]
  22. Saiki, R.K.; Gelfand, D.H.; Stoffel, S.; Scharf, S.J.; Higuchi, R.; Horn, G.T.; Mullis, K.B.; Erlich, H.A. Primer-directed enzymatic amplification of DNA with a thermostable DNA polymerase. Science 1988, 239, 487–491. [Google Scholar] [CrossRef]
  23. Wesley, S.V.; Helliwell, C.A.; Smith, N.A.; Wang, M.B.; Rouse, D.T.; Liu, Q.; Gooding, P.S.; Singh, S.P.; Abbott, D.; Stoutjesdijk, P.A.; et al. Construct design for efficient, effective and high-throughput gene silencing in plants. Plant J. 2001, 27, 581–590. [Google Scholar] [CrossRef]
  24. Helliwell, C.A.; Waterhouse, P.M. Constructs and methods for high-throughput gene silencing in plants. Methods 2003, 30, 289–295. [Google Scholar] [CrossRef] [PubMed]
  25. Hofgen, R.; Willmitzer, L. Storage of competent cells for Agrobacterium transformation. Nucleic Acids Res. 1988, 16, 9877. [Google Scholar] [CrossRef] [PubMed]
  26. Sambrook, J.; Russell, D.W. Molecular Cloning: A Laboratory Manual, 3rd ed.; Cold Spring Harbor Laboratory Press: Woodbury, NY, USA, 2001. [Google Scholar]
  27. Zhang, B. Agrobacterium-mediated genetic transformation of cotton. Methods Mol. Biol. 2019, 1902, 19–33. [Google Scholar] [CrossRef] [PubMed]
  28. Loyola-Vargas, V.M.; Ochoa-Alejo, N. An introduction to plant tissue culture: Advances and perspectives. Methods Mol. Biol. 2018, 1815, 3–13. [Google Scholar] [CrossRef]
  29. Kärkönen, A.; Santanen, A.; Iwamoto, K.; Fukuda, H. Plant tissue cultures. Methods Mol. Biol. 2020, 2149, 89–109. [Google Scholar] [CrossRef]
  30. Gould, J.H.; Magallanes-Cedeno, M. Adaptation of cotton shoot apex culture to Agrobacterium-mediated transformation. Plant Mol. Biol. Rep. 1998, 16, 283–291. [Google Scholar] [CrossRef]
  31. Kumria, R.; Sunnichan, V.G.; Das, D.K.; Gupta, S.K.; Reddy, V.S.; Bhatnagar, R.K.; Leelavathi, S. High-frequency somatic embryo production and maturation into normal plants in cotton (Gossypium hirsutum) through metabolic stress. Plant Cell Rep. 2003, 21, 635–639. [Google Scholar] [CrossRef]
  32. Steel, R.G.D.; Torrie, J.H.; Dickey, D.A. Principles and Procedures of Statistics: A Biometrical Approach, 3rd ed.; McGraw-Hill: New York, NY, USA, 1997. [Google Scholar]
  33. Zeng, Q.; Qin, S.; Song, S.; Zhang, M.; Xiao, Y.-H.; Luo, M.; Hou, L.; Pei, Y. Cytokinin dehydrogenase gene in cotton. Plant Mol. Biol. Rep. 2012, 30, 1–9. [Google Scholar] [CrossRef]
  34. ASTM D5867-12; Standard Test Methods for Measurement of Physical Properties of Cotton Fibers by High Volume Instruments. ASTM International: West Conshohocken, PA, USA, 2012.
  35. USTER Technologies AG. Application Handbook of USTER HVI 1000; USTER Technologies AG: Uster, Switzerland, 2018. [Google Scholar]
  36. R Core Team. R: A language and Environment for Statistical Computing; R Foundation: Vienna, Austria, 2024. [Google Scholar]
  37. Gomez, K.A.; Gomez, A.A. Statistical Procedures for Agricultural Research, 2nd ed.; Wiley: New York, NY, USA, 1984. [Google Scholar]
  38. Werner, T.; Motyka, V.; Laucou, V.; Smets, R.; Van Onckelen, H.; Schmülling, T. Cytokinin-deficient Arabidopsis. Plant Cell 2003, 15, 2532–2550. [Google Scholar] [CrossRef] [PubMed]
  39. Zalewski, W.; Galuszka, P.; Gasparis, S.; Orczyk, W.; Nadolska-Orczyk, A. Silencing of the HvCKX1 gene decreases the cytokinin oxidase/dehydrogenase level in barley and leads to higher plant productivity. J. Exp. Bot. 2010, 61, 1839–1851. [Google Scholar] [CrossRef] [PubMed]
  40. Ashikari, M.; Sakakibara, H.; Lin, S.; Yamamoto, T.; Takashi, T.; Nishimura, A.; Angeles, E.R.; Qian, Q.; Kitano, H.; Matsuoka, M. Cytokinin oxidase regulates rice yield. Science 2005, 309, 741–745. [Google Scholar] [CrossRef] [PubMed]
  41. Sakakibara, H. Cytokinins review. Annu. Rev. Plant Biol. 2006, 57, 431–449. [Google Scholar] [CrossRef]
  42. Jameson, P.E.; Song, J. Cytokinin and seed yield. J. Exp. Bot. 2016, 67, 593–606. [Google Scholar] [CrossRef]
  43. Kim, H.J.; Triplett, B.A. Cotton fiber growth in planta and in vitro. Models for plant cell elongation and cell wall biogenesis. Plant Physiol. 2001, 127, 1361–1366. [Google Scholar] [CrossRef]
Figure 1. An overview of this research. Arrows indicate the workflow or regulatory direction, colors are used to distinguish different components or steps.
Agriculture 16 01134 g001
Figure 2. Phylogenetic analysis of CKX proteins from cotton and related species. Phylogenetic tree of CKX proteins from Gossypium hirsutum (AD1), G. raimondii (D5), G. arboreum (A2), as well as Arabidopsis thaliana and Theobroma cacao. Multiple sequence alignment was performed using ClustalW, and the phylogenetic tree was constructed using the Neighbor-Joining method in MEGA software (version 11.0) with 1000 bootstrap replicates. Bootstrap values are indicated at each node. Scale bar represents the number of substitutions per site.
Agriculture 16 01134 g002
Figure 3. Schematic Diagram of the T-DNA Region in the pCAMBIA2300-proAGIP::GhCKX3b-RNAi Plant Expression Vector. Arrows and symbols indicate the corresponding cloning steps and restriction enzyme sites as annotated in the figure. Different colors are used only to distinguish vector components and improve visual clarity.
Agriculture 16 01134 g003
Figure 4. PCR verification of the construction of the pCAMBIA2300-proAGIP::GhCKX3b-RNAi vector. (A) PCR amplification of the GhCKX3b target fragment. (B) PCR identification of recombinant plasmid colonies. (C) PCR verification of the plant expression vector pCAMBIA2300-proAGIP::GhCKX3b-RNAi and identification of transgenic plants. M: DNA marker; +: Positive control; −: Negative control; 1–35: independent transformants.
Agriculture 16 01134 g004
Figure 5. Relative expression levels of GhCKX3b in carpels of transgenic cotton. Two reference genes, GhHis3 (Gh_D03G0370) and GhUbiquitin (Gh_A13G1194/Gh_D13G1489), were used as internal controls to normalize the expression data. Gene-specific primers for GhCKX3b, GhHis3, and GhUbiquitin are listed in Supplementary File S2. Relative expression levels were calculated using the 2−ΔΔCt method. Three biological replicates with two technical replicates each were analyzed for each sample. **** indicates a significant difference compared with WT at p < 0.0001.
Agriculture 16 01134 g005
Figure 6. Analysis of Agronomic and Yield Traits in T2 Transgenic Lines under Field Conditions. (A,B) Representative images of the T2 transgenic plants in the field. Comparison of lint percentage (C), Lint Index (D), seed index (E), fuzzy seed rate (F), boll weight (G), seeds per boll (H) between transgenic lines and wild-type ‘Yuanmian 8’ (WT). Data are presented as mean ± SD. Asterisks indicate significant differences compared to WT according to one-way ANOVA (* p < 0.05, ** p < 0.01, *** p < 0.001, **** p < 0.0001); ns indicates no significant difference.
Agriculture 16 01134 g006
Figure 7. Comparison of fiber length between transgenic lines and wild-type.
Agriculture 16 01134 g007
Table 1. Comparison of total cytokinin content in carpels of T2 positive lines and wild-type.
LinestZtZRiPiPRDZDZRTotal CKs
WT5.2 ± 0.517.6 ± 0.630.5 ± 0.181.5 ± 0.210.20 ± 0.050.10 ± 0.0215.1 ± 1.71
Ri-1(T2)7.8 ± 0.3112.1 ± 0.500.6 ± 0.131.8 ± 0.210.22 ± 0.020.14 ± 0.0122.7 ± 1.12
Ri-2(T2)8.9 ± 0.4213.8 ± 0.710.8 ± 0.152.2 ± 0.230.25 ± 0.030.17 ± 0.0226.1 ± 1.53
Ri-3(T2)8.5 ± 0.2813.2 ± 0.160.7 ± 0.112.0 ± 0.120.24 ± 0.020.16 ± 0.0124.8 ± 1.24
Ri-4(T2)10.1 ± 0.2915.6 ± 0.810.9 ± 0.122.5 ± 0.180.30 ± 0.030.20 ± 0.0129.6 ± 1.42
Ri-5(T2)10.5 ± 0.4316.0 ± 0.900.9 ± 0.212.6 ± 0.320.31 ± 0.040.21 ± 0.0230.5 ± 1.81
Table 2. Analysis of Agronomic and Yield Traits in T0 and T1 Transgenic Lines under Field Conditions.
YearLinesLint Percentage (%)Lint Index (g)Seed Index (g)Boll Weight (g)Seeds per Boll
2023WT36.5257.01812.1976.295427
Ri-139.5577.72311.9546.351529
Ri-240.9618.12711.7146.654031
Ri-342.1978.28511.3496.658230
Ri-443.5128.61611.1856.954532
Ri-545.7119.29211.0367.314034
2024WT36.4 ± 0.37.02 ± 0.0812.20 ± 0.086.30 ± 0.1032.0 ± 0.9
Ri-1(T1)39.6 ± 0.47.75 ± 0.0811.85 ± 0.086.40 ± 0.0832.5 ± 0.8
Ri-2(T1)40.5 ± 0.48.13 ± 0.0811.52 ± 0.086.65 ± 0.0833.0 ± 0.8
Ri-3(T1)42.4 ± 0.48.28 ± 0.0811.29 ± 0.086.68 ± 0.0833.4 ± 0.8
Ri-4(T1)43.6 ± 0.48.62 ± 0.0811.08 ± 0.076.95 ± 0.0933.6 ± 0.8
Ri-5(T1)45.8 ± 0.49.24 ± 0.0810.90 ± 0.087.31 ± 0.0934.0 ± 0.8
Table 3. Comparison of fiber quality between transgenic plants and wild-type.
YearLinesUpper Half
Mean
Length
(mm)
Uniformity (%)Breaking
Tenacity
(cN/tex)
Elongation (%)MicronaireMaturity Ratio SCI
2023WT31.485.234.512.44.70.82162
Ri-129.984.732.511.64.90.84165
Ri-230.384.833.111.84.70.85159
Ri-330.285.733.612.15.00.83167
Ri-430.385.332.710.94.80.86163
Ri-530.883.932.311.94.60.85164
2024WT31.2 ± 0.386.1 ± 0.533.8 ± 0.711.9 ± 0.34.8 ± 0.10.83 ± 0.02169 ± 4
Ri-1(T1)29.9 ± 0.485.7 ± 0.630.8 ± 0.310.9 ± 0.45.1 ± 0.20.85 ± 0.03162 ± 5
Ri-2(T1)30.5 ± 0.383.6 ± 0.731.3 ± 0.611.7 ± 0.44.7 ± 0.10.87 ± 0.02167 ± 4
Ri-3(T1)30.6 ± 0.684.4 ± 0.632.5 ± 0.212.1 ± 0.45.0 ± 0.20.84 ± 0.02163 ± 5
Ri-4(T1)30.2 ± 0.184.4 ± 0.630.2 ± 0.111.1 ± 0.34.9 ± 0.10.84 ± 0.02171 ± 6
Ri-5(T1)30.4 ± 0.383.5 ± 0.732.6 ± 0.612.3 ± 0.44.7 ± 0.10.83 ± 0.02168 ± 5
2025WT31.0 ± 0.485.8 ± 0.533.5 ± 0.811.9 ± 0.34.8 ± 0.10.83 ± 0.02167 ± 4
Ri-1(T2)30.0 ± 0.585.3 ± 0.631.0 ± 0.710.8 ± 0.45.0 ± 0.20.85 ± 0.03163 ± 5
Ri-2(T2)30.5 ± 0.484.2 ± 0.731.5 ± 0.711.7 ± 0.44.8 ± 0.20.86 ± 0.02162 ± 5
Ri-3(T2)30.5 ± 0.684.7 ± 0.632.5 ± 0.612.0 ± 0.44.9 ± 0.20.84 ± 0.02167 ± 5
Ri-4(T2)30.3 ± 0.584.5 ± 0.730.5 ± 0.711.0 ± 0.44.9 ± 0.20.84 ± 0.02163 ± 6
Ri-5(T2)30.3 ± 0.583.7 ± 0.732.5 ± 0.812.2 ± 0.44.7 ± 0.20.83 ± 0.02171 ± 5
Disclaimer/Publisher’s Note: The statements, opinions and data contained in all publications are solely those of the individual author(s) and contributor(s) and not of MDPI and/or the editor(s). MDPI and/or the editor(s) disclaim responsibility for any injury to people or property resulting from any ideas, methods, instructions or products referred to in the content.