Article

Research on a Portable Multispectral Imaging System for Starch Content Detection in Watermelon–Pumpkin Grafted Seedling Leaves

1
Key Laboratory of Agricultural Machinery for the Middle and Lower Reaches of the Yangtze River, College of Engineering, Huazhong Agricultural University, Ministry of Agriculture, Wuhan 430070, China
2
Xianning Agriculture Academy of Sciences, Xianning 437000, China
3
State Key Laboratory of Crop Genetic Improvement, College of Horticulture and Forestry Sciences, Huazhong Agricultural University, Wuhan 430070, China
*
Author to whom correspondence should be addressed.
†
Deceased author.
Agriculture 2026, 16(10), 1127; https://doi.org/10.3390/agriculture16101127
Submission received: 4 April 2026 / Revised: 9 May 2026 / Accepted: 12 May 2026 / Published: 21 May 2026
(This article belongs to the Section Artificial Intelligence and Digital Agriculture)

Abstract

Plant leaf starch content is a critical indicator of metabolic status, yet traditional enzymatic methods are destructive, labor-intensive, and costly. This study proposes a novel non-destructive detection method using watermelon–pumpkin grafted seedlings. To optimize hardware design, 12 characteristic wavelengths were identified via competitive adaptive reweighted sampling (CARS). A portable multispectral imaging system was developed, featuring narrowband LEDs and integrated human–computer interaction software for real-time visualization. We constructed a multimodal deep learning architecture that integrates a convolutional neural network (CNN) for spatial feature extraction from RGB images, a fully connected neural network (FCNN) for spectral data, and a Transformer network for high-level feature fusion. Experimental results showed that the ShuffleNet v2-Transformer model achieved an R2 of 0.956 (RMSE = 0.036) for watermelon leaves, while the EfficientNet b1-Transformer model reached an R2 of 0.967 (RMSE = 0.052) for pumpkin leaves. This multimodal approach significantly outperformed conventional PLSR and single-modal CNN models, demonstrating superior ability in processing long-range dependencies within spectral–spatial data. The system enables accurate detection with a throughput of 120 samples per hour at a hardware cost approximately 90% lower than commercial multispectral cameras. This provides an efficient, low-cost solution for large-scale monitoring of plant physiological indicators in precision breeding.

1. Introduction

Leaf starch content serves as a critical storage reserve for carbohydrates, sustaining plant metabolism and driving growth during non-photosynthetic periods [1]. In early seedling development, leaves function as primary storage organs where photosynthetic products accumulate as starch before being hydrolyzed into monosaccharides to fuel vascular reconnection and tissue expansion [2]. Normal starch metabolism is essential for maintaining photosynthetic efficiency, delaying senescence, and ensuring high crop yields [3]. Particularly in grafting research, starch accumulation and mobilization are closely associated with graft union formation and vascular bridge reconnection, serving as early physiological markers for graft compatibility [4]. Despite its significance, traditional starch determination primarily relies on chemical methods such as spectrophotometry, chromatography, or thermogravimetric analysis. While accurate, these approaches are inherently destructive, labor-intensive, and costly, rendering them unsuitable for large-scale, real-time monitoring in modern breeding programs. Meanwhile, the rapid advancement of computer vision and machine learning has introduced innovative strategies for the intelligent detection of substance content [5].
Hyperspectral imaging (HSI) has been widely employed for physiological assessment by integrating spatial and spectral information [6,7]. Several studies have demonstrated its efficacy in starch quantification across diverse crops. For instance, Zhang et al. [8] established a rice starch regression model with an R2 of 0.8029, enabling spatial starch visualization. Frey et al. [9] utilized HSI to predict leaf starch in red clover with an R2 of 0.36 to support the breeding of high-starch varieties. Similarly, Bu et al. [10] achieved R2 values exceeding 0.99 for both amylose and amylopectin in mixed sorghum samples using data fusion techniques. Furthermore, Polder et al. [11] confirmed strong correlations between starch levels and near-infrared spectral responses in tomato leaves and fruits. Despite these advancements, the widespread field adoption of HSI remains limited by high equipment costs, complex data processing, and poor portability [12].
Multispectral imaging (MSI) offers a more practical alternative by capturing data at specific, optimized wavelengths. Conventional MSI systems (e.g., RedEdge-P) typically utilize narrowband filters; however, their fixed spectral bands limit customization for specific target substances, often resulting in lower regression accuracy compared to HSI [13,14,15]. In contrast, multispectral imaging systems based on narrowband light-emitting diodes (LEDs) offer superior flexibility, rapid switching, and high spectral control (within ±5 nm). For example, Wang et al. [16] developed a 13-channel LED-based multispectral microscopic imaging system. Similarly, Wang et al. [17] designed a portable high-resolution device equipped with an LED array for capturing dicotyledonous leaf images. Despite these hardware advancements, research specifically targeting non-destructive leaf starch quantification remains sparse, and few studies have explored multimodal deep learning architectures to fuse spatial and spectral features in this context.
In this study, we developed a portable, low-cost multispectral imaging and analysis system based on 12-channel narrowband LEDs. Using watermelon–pumpkin grafted seedlings as experimental subjects, we proposed a hybrid CNN-FCNN-Transformer architecture to collaboratively extract multimodal features. Specifically, a CNN was employed for spatial texture analysis from RGB images, an FCNN for spectral reflectance processing, and a Transformer network for high-dimensional feature fusion and regression. This approach aims to provide a real-time, high-accuracy solution for non-destructive starch detection, offering a theoretical foundation for field-scale plant physiological monitoring. The modular design of our system further allows for rapid adaptation to other target substances, demonstrating significant potential for precision agricultural management.

2. Materials and Methods

2.1. Experimental Materials and Data Collection

2.1.1. Experimental Materials

The experiment was conducted at the College of Horticulture and Forestry Sciences, Huazhong Agricultural University in 2024. Watermelon cultivar ‘Zaojia’ and pumpkin cultivar ‘Qingyou’ were used in the study. For the first experimental cycle, pumpkin seeds were sown on 26 February and watermelon seeds on 28 February, with three seedbed trays for each. Grafting was performed on 9 March, and the grafted seedlings were cultivated in an artificial climate chamber using 50-cell plug trays. Hyperspectral data collection commenced 5 h after grafting, with 10 seedlings sampled daily over a 10-day period. In the second experimental cycle, pumpkin seeds were sown on 1 July and watermelon seeds on 3 July, using eight seedbed trays each. Grafting was carried out on 9 July, and image-spectral data acquisition was initiated 5 h later, with daily sampling of 30 seedlings for 10 consecutive days.

2.1.2. Hyperspectral Data Acquisition

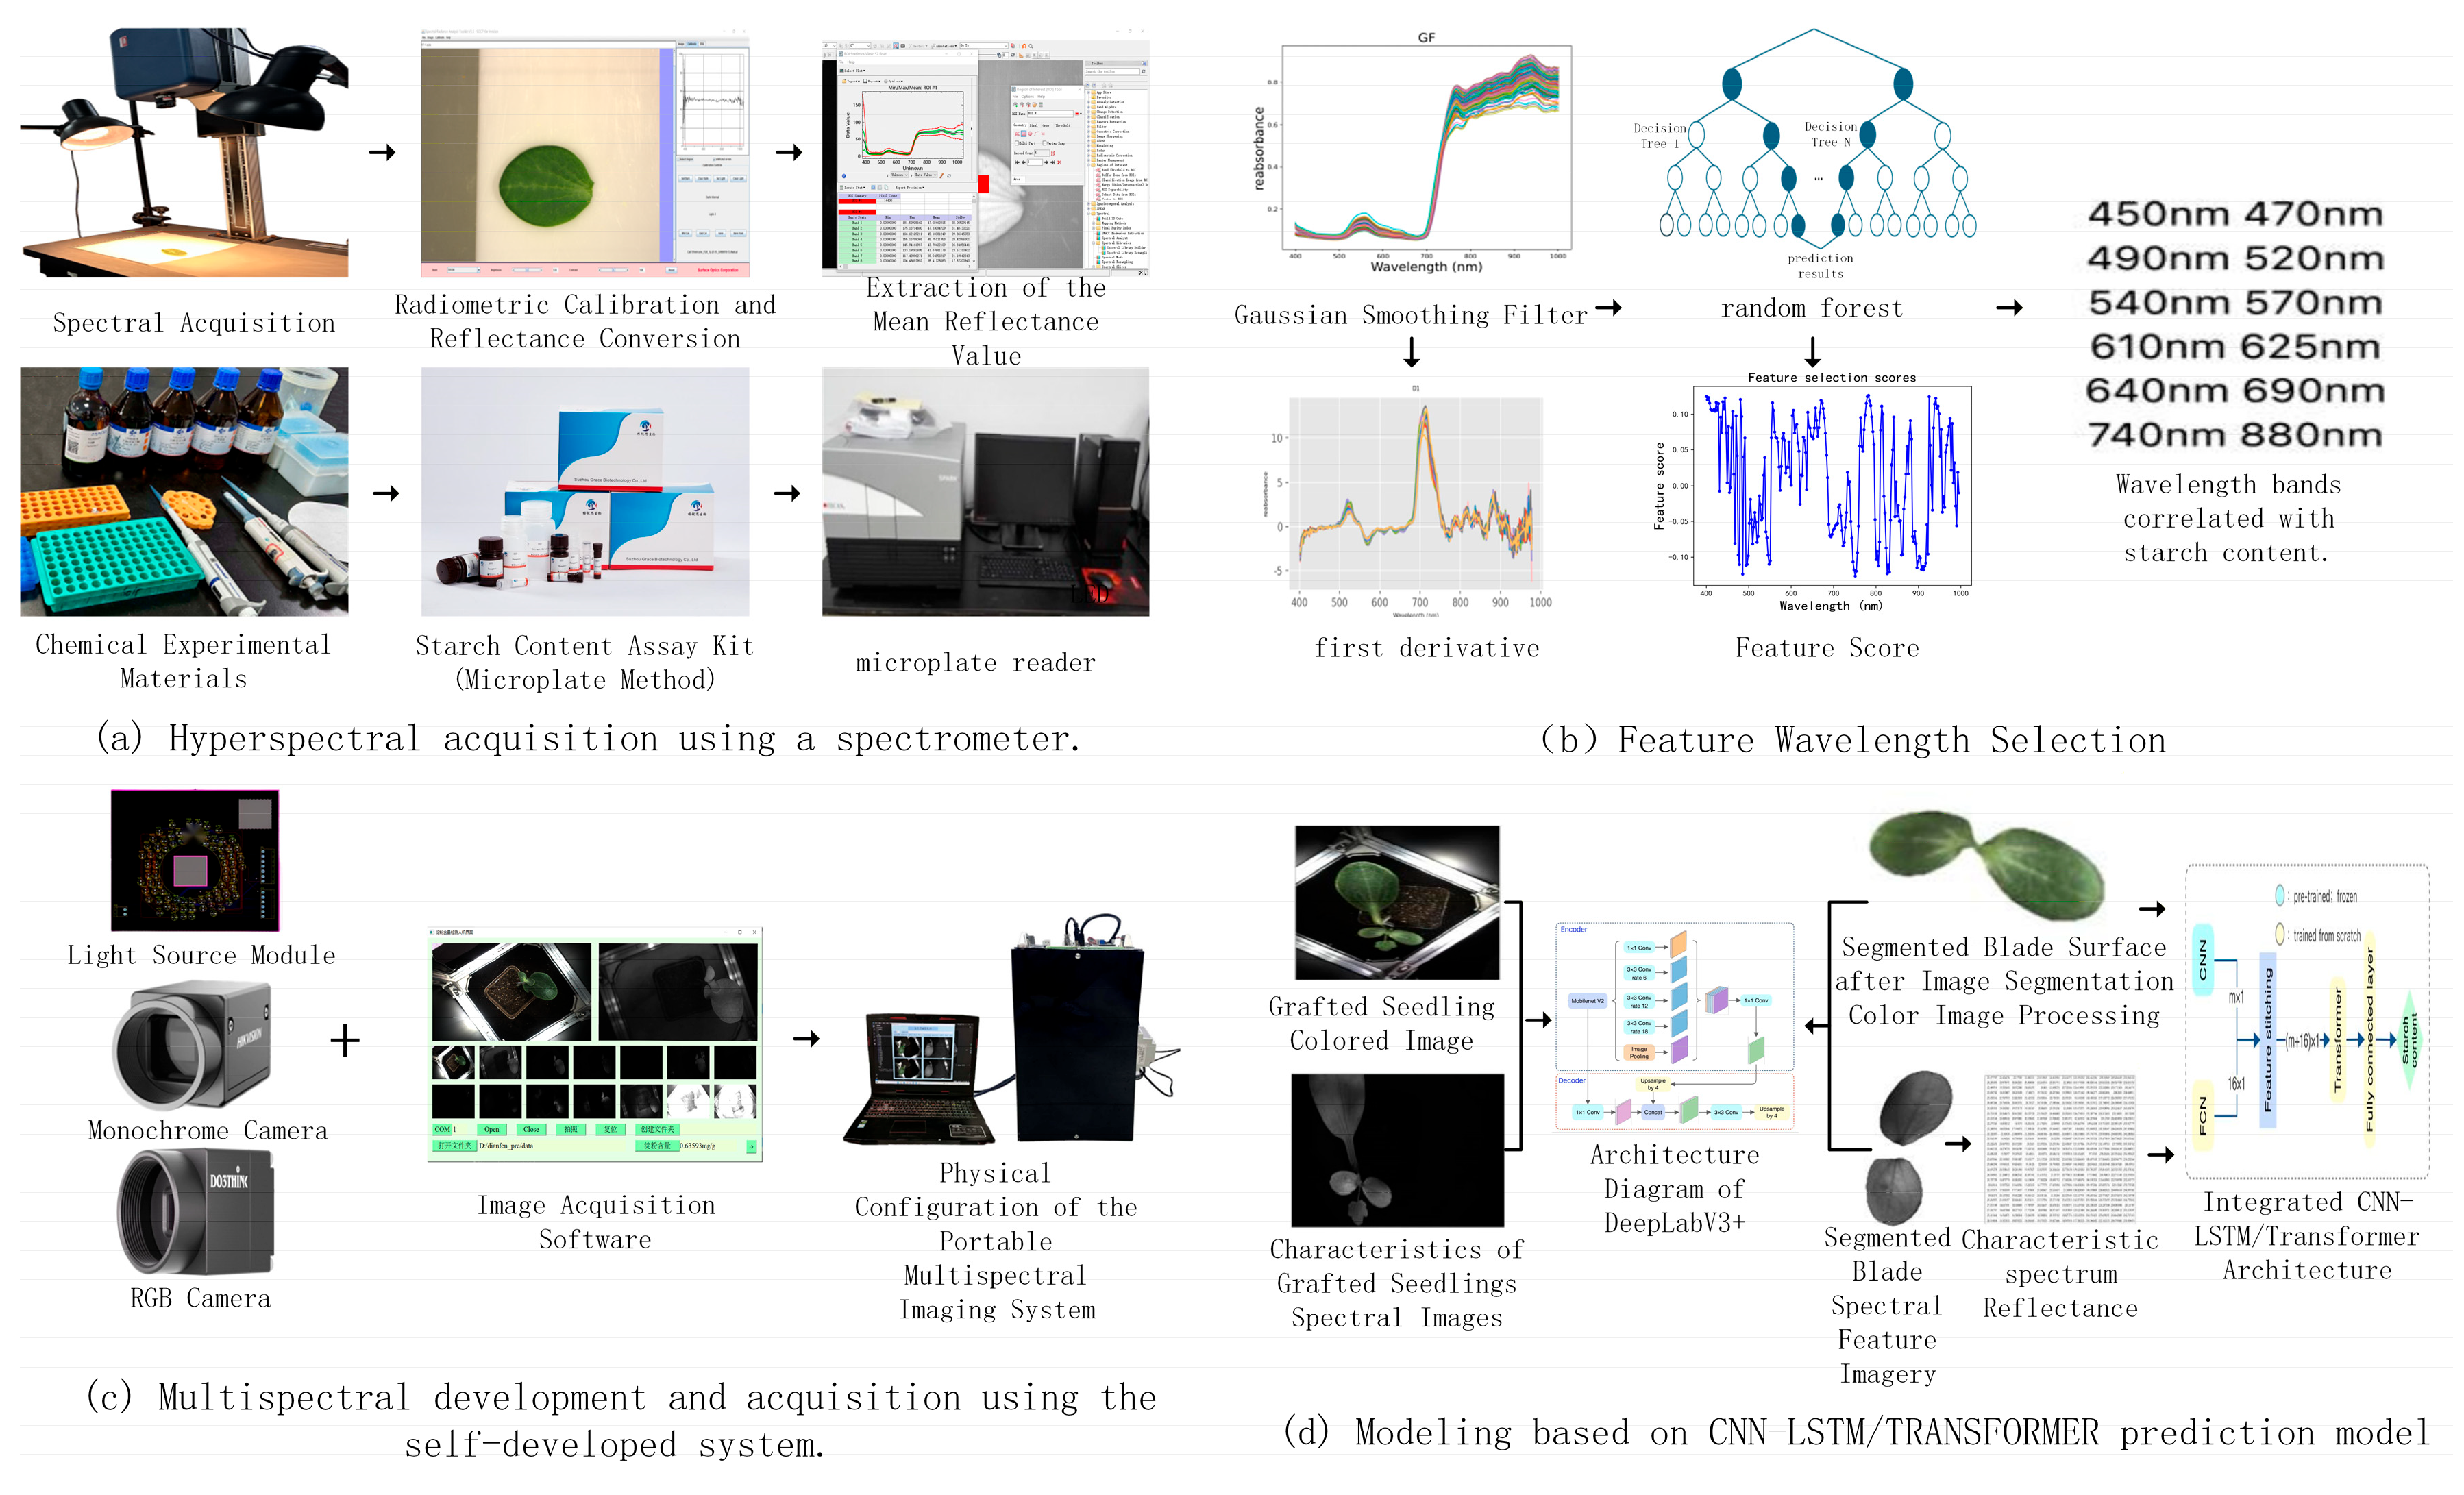
During the post-grafting period from Day 0 to Day 10, hyperspectral imaging of watermelon and pumpkin leaves was conducted daily between 5:00 p.m. and 7:00 p.m. using the SOC710 hyperspectral imaging system(Surface Optics Corporation, San Diego, CA, USA). A total of 110 watermelon leaf samples and 110 pumpkin leaf samples were scanned to collect hyperspectral data to identify feature bands correlated with starch content. The procedure and outcome of data acquisition via the hyperspectral instrument are illustrated in Figure 1a.

2.1.3. Manual Determination of Leaf Starch Content

The leaf starch content was determined using a Starch Content Assay Kit (Enzymatic Method) manufactured by Suzhou Geruisi Biotechnology Co., Ltd. (Suzhou, China). This kit operates on the principle of enzymatic detection and is furnished with a complete set of five specialized reagents (Reagent 1 to Reagent 5) for starch extraction and chromogenic reaction, along with a glucose standard solution.
The specific assay procedure was as follows: A 0.1 g leaf tissue sample was weighed and placed into a 2 mL EP tube, followed by sequential homogenization and sugar removal. After desugaring, DMSO was added, and the mixture was incubated in a boiling water bath to dissolve the gel. Following cooling to room temperature, anhydrous ethanol was added, and the mixture was thoroughly mixed by high-speed vortexing. The mixture was then centrifuged, and the supernatant was discarded. The resulting pellet was dissolved by adding DMSO, and the supernatant was collected and combined with Reagent 1 to prepare the test solution. Subsequently, Reagent 2 and Reagent 3 were added sequentially. The mixture was aliquoted into a 96-well plate, with three replicate wells allocated per sample. Next, Reagent 4 and Reagent 5, provided in the kit, were added sequentially into each well. After thorough mixing, the plate was transferred into a pre-warmed microplate reader (stabilized for 30 min), and the absorbance was measured at a wavelength of 510 nm. The starch content of each sample was calculated according to Equation (1), and the average of three replicate wells was used as the final result for each sample.
C s t a r c h = 9.75 × ( A t o t a l − A b l a n k ) ( A s t a n d a r d − A b l a n k ) × W × 0.9
where Cstarch is the total starch content (mg/g); Atotal is the absorbance of the sample, Ablank is the absorbance of the blank well, Astandard is the absorbance of the standard well, and W is the mass of the sample.

2.1.4. Image-Spectral Data Acquisition

A portable narrowband LED-based multispectral imaging device was designed and fabricated for acquiring both color and monochromatic spectral images of grafted seedlings. A total of 330 RGB images and 7920 spectral images were obtained to construct a starch content regression model.

2.2. Methods

2.2.1. Overall Technical Framework

The overall research methodology of the instrument is illustrated in Figure 1. Following the procedure depicted in Figure 1a, hyperspectral data of grafted seedlings, laboratory-measured starch content values, and image-spectral data were collected, after which the subsequent steps were implemented as follows.
(1)
Selection of characteristic wavebands
The feature band selection procedure is illustrated in Figure 1b. The acquired hyperspectral reflectance data sequentially underwent Gaussian smoothing filtering and first-order derivative (D1) processing, after which they were input into a random forest model for starch content regression. The CARS-RF model was utilized to extract feature scores across different spectral bands, thereby identifying starch content-related characteristic bands. The spectral curves exhibit distinct features, including a visible reflection peak near 550 nm and a high-reflectance near-infrared (NIR) plateau. The 12 identified wavelengths align precisely with these regions. Specifically, selected NIR bands like 880 nm and 900 nm represent the third overtones of C–H and O–H stretching vibrations in starch molecules, while visible bands such as 540 nm reflect the status of photosynthetic pigments. This physical correspondence provides a robust basis for starch content prediction. These selected bands were subsequently used to determine the corresponding narrowband LEDs.
(2)
Fabrication of the Portable Multispectral Device
The construction of the portable spectral device is depicted in Figure 1c. Based on the results of characteristic wavelength screening, corresponding narrowband LEDs were selected to form the illumination array. This LED array was integrated with a Dothink monochrome camera (Dothink, Shenzhen, China) for acquiring multispectral and grayscale images, as well as a Hikvision color camera (Hikvision, Hangzhou, China) for capturing color images, thereby forming the image acquisition module. Under the control of self-developed image acquisition software, the LED array was driven to illuminate in a time-multiplexed and sequential manner, while synchronously triggering both cameras for image capture. Ultimately, by integrating the image acquisition module with the image acquisition software, a portable spectral device capable of automated capture and storage of multi-source images was fabricated.
(3)
Transformer-Based Regression Modeling
The development process of the regression model is depicted in Figure 1d. A portable multispectral imaging system captured both color images and characteristic spectral images. These images were subsequently annotated and utilized to train a DeepLabV3+ model. The trained model was applied to segment color and spectral images of grafted seedlings, resulting in isolated leaf images in both color and spectral domains. Average grayscale values were extracted from the segmented spectral leaf images and converted into reflectance values. Both the color leaf images and the spectral reflectance values were jointly fed into a CNN-LSTM/Transformer network to ultimately predict the starch content of the leaves.

2.2.2. Feature Band Selection

In a portable multispectral imaging system, the quantity of LEDs is correlated with the band selection results of hyperspectral features. An increase in the number of LEDs leads to elevated system costs, greater complexity in manufacturing, and prolonged acquisition times for multispectral images. In this study, the hyperspectral data were first preprocessed, followed by the application of competitive adaptive reweighted sampling (CARS) for optimal band selection.
(1)
Hyperspectral Preprocessing Methods
Spectral data preprocessing comprised three sequential steps: smoothing, correction, and normalization. These included: (1) Smoothing: Reduced interference from instrumental noise and sample heterogeneity through localized averaging. Methods included Gaussian filtering (GF), moving average filtering (MA), Savitzky–Golay smoothing (SG), and discrete wavelet transform (DWT). (2) Correction: Utilized standard reference samples to calibrate the instrument and eliminate systematic errors. Techniques involved baseline offset correction (BOC), multiplicative scatter correction (MSC), and first-derivative transformation. (3) Normalization: Mapped data to a specified interval via scaling and translation to mitigate scale-related artifacts, thereby improving comparability and processing efficacy. Common normalization approaches included mean centering, vector normalization (VN), min-max normalization (MMN), and standard normal variate (SNV) transformation [18,19,20]. By evaluating the modeling performance of various preprocessing combinations based on the coefficient of determination (R2) and root mean square error (RMSE), the optimal preprocessing strategy was determined. Partial least squares (PLS) regression was employed as the modeling method.
(2)
Optimal Band Selection Based on CARS Feature Scores
To eliminate redundant information from hyperspectral data, competitive adaptive reweighted sampling (CARS) was employed for optimal band selection. To determine the most suitable baseline evaluation model, preprocessed spectral data were input into PLS, RR, RF, SVR, and GBT models for comparative analysis [21,22,23,24]. Based on the coefficient of determination (R2) and root mean square error (RMSE) calculated from the validation set, the random forest (RF) model, which demonstrated the highest accuracy, was selected as the core evaluation framework for constructing the screening architecture.
During the feature wavelength selection process, the Competitive Adaptive Reweighted Sampling (CARS) algorithm identified the optimal subset through multiple iterations. In each iteration, Monte Carlo sampling was first employed to construct a regression model and compute the importance scores of wavelength variables. Subsequently, an exponential decay function was applied to rapidly eliminate low-score wavelengths, achieving efficient dimensionality reduction. Adaptive reweighted sampling (ARS) was then introduced to assign survival probabilities based on the scores, facilitating competitive selection to generate a new wavelength subset. Upon completion of all iterations, cross-validation was performed to compare the root mean squared error of cross-validation (RMSECV) across the subsets. The wavelength combination corresponding to the global minimum RMSECV was selected as the final feature set [25].

2.2.3. Design and Integration of Portable Spectral Acquisition System

(1)
Design and Implementation of a Multispectral Acquisition Device Based on Narrowband LEDs
The physical configuration of the portable multispectral imaging system, as illustrated in Figure 1c, adopts a fully enclosed design to effectively shield against ambient light interference. It is composed of four core components: the illumination module, the image acquisition module, the central control unit, and the PC terminal. The image acquisition module and the central control unit are integrated at the top of the enclosure. The illumination module incorporates a panel combining narrow-band LEDs and white-light LEDs. The image acquisition module is equipped with a Dothink MGS231M-H2 monochrome camera (Dothink, Shenzhen, China) with 2.3-megapixel resolution and a Hikvision MV-CS060-10GM color camera (Hikvision, Hangzhou, China) with 6-megapixel resolution. The spectral response range of the monochrome camera spans from 400 to 1000 nm, and—after removal of the built-in anti-reflective coating—it is fitted with a 12 mm focal length infrared lens for multispectral imaging. The color camera operates within the 400–700 nm range and employs an 8 mm wide-angle lens for RGB image capture, serving to enrich the input dataset for regression modeling while compensating for insufficient spectral bands. The central control unit, based on an STM32 microcontroller (STMicroelectronics, Geneva, Switzerland), works in coordination with a DC switching power supply (externally mounted on the side of the enclosure) and relays (integrated at the top) to regulate LED operation and synchronize image acquisition with the PC terminal. The PC terminal is responsible for image processing and starch content regression computation. Characterized by high automation and rapid response, this portable multispectral imaging system can acquire 12 multispectral images and 1 RGB image within 15 s. Featuring a one-button operation design without the need for parameter adjustment, it substantially lowers the operational barrier. The system supports both multispectral and RGB image acquisition and adopts a modular architecture that facilitates band configuration replacement, thereby broadening its application scope.
Upon power activation of the equipment, the camera’s initiation, shutdown, and image capture are controlled via the computer terminal. During image acquisition, the computer transmits commands to the STM32 microcontroller, which then drives a relay by generating high/low-level signals through its I/O pins. This relay subsequently controls the LED lighting system, which utilizes 12 V plug-in LEDs (with a relay coil voltage of 12 V and a control signal voltage of 3.3 V). Simultaneously with LED illumination, the STM32 sends a feedback signal to the computer to confirm the capture command, enabling automated image acquisition under varying spectral conditions. Users simply place the plant specimen into the device and click the “Capture” button on the computer interface to complete one-click data collection. The resulting RGB and multispectral images are automatically saved to the computer for subsequent analysis.
(2)
Development of Visual Human–Computer Interaction Software
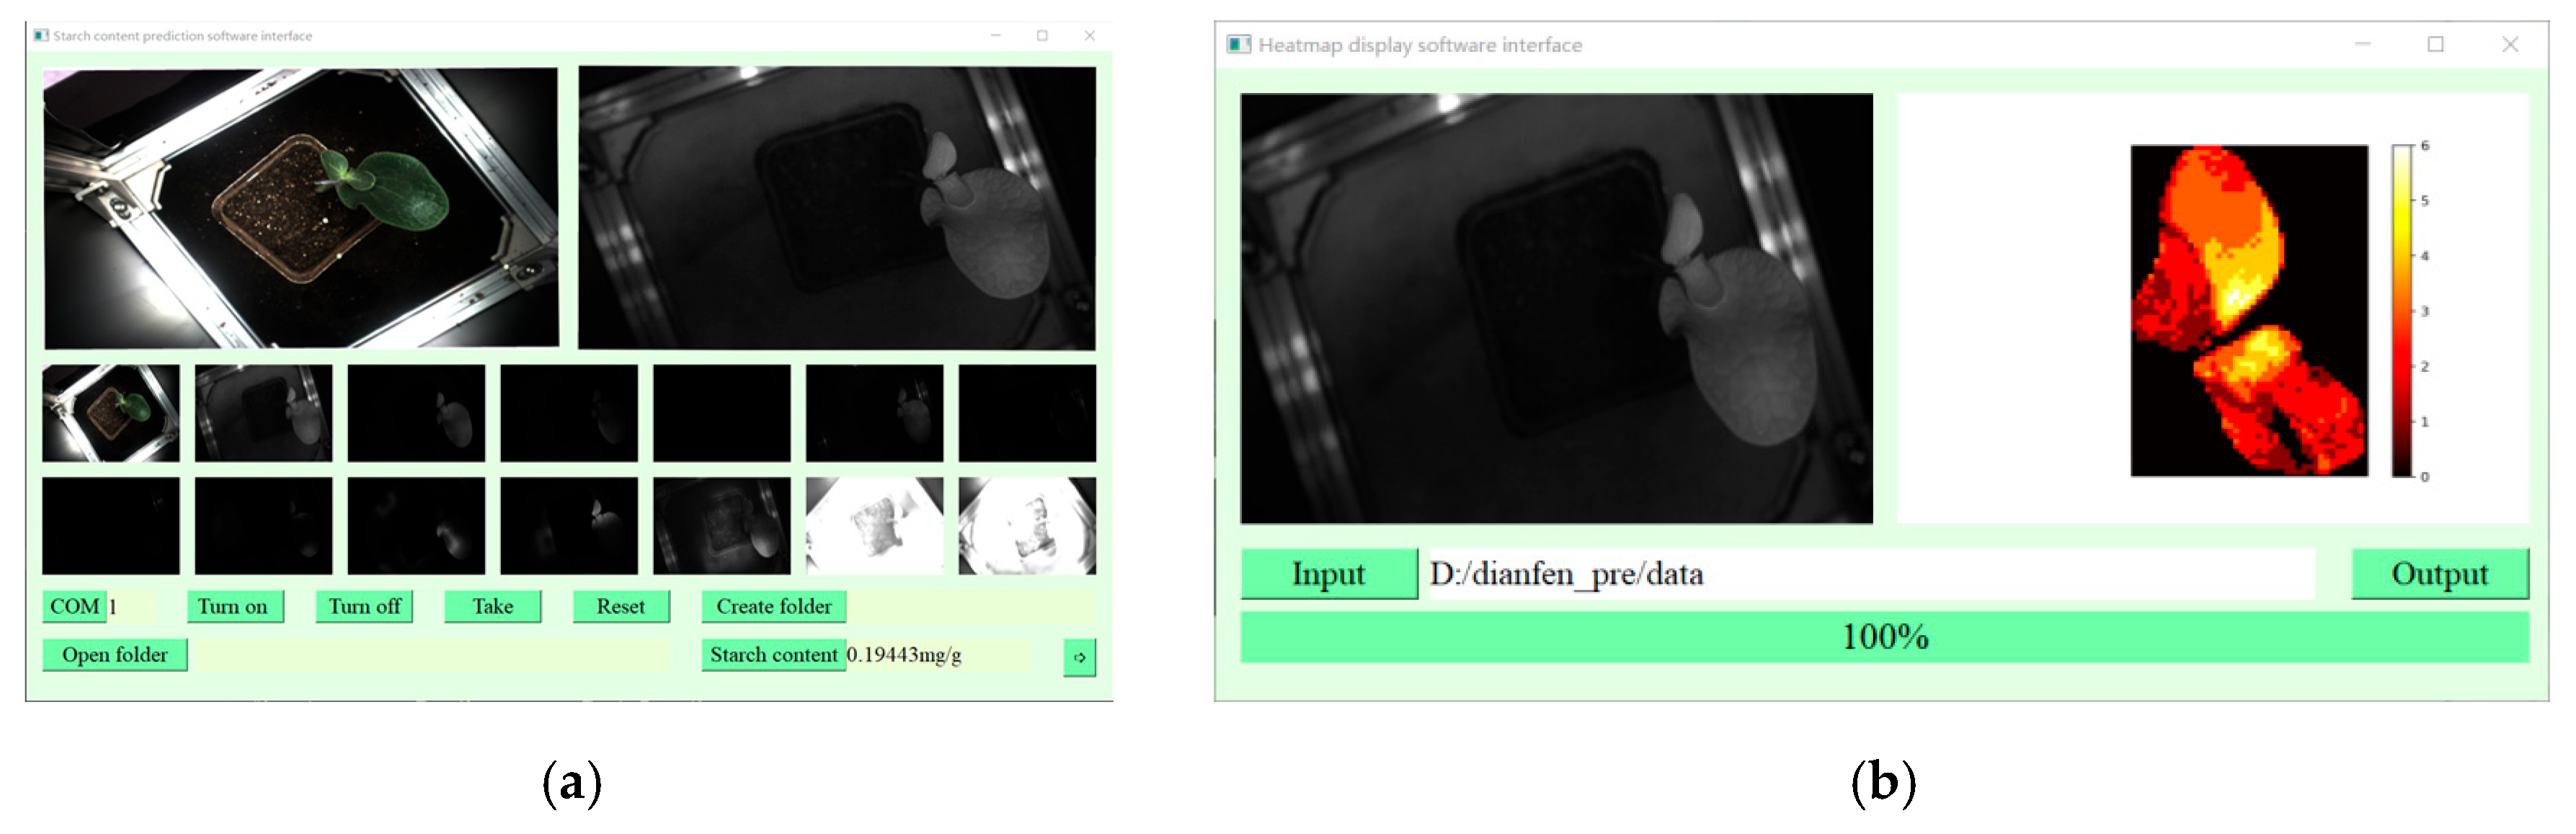
The developed EXE software (version 1.0) primarily features two core interfaces supporting intensive interaction: a Starch Content regression Interface (Figure 2a) and a Heatmap Display Interface (Figure 2b). To invoke corresponding regression models, the interface incorporates a leaf-type selection function. The current system preconfigures two options—watermelon leaves and pumpkin leaves—based on predetermined model parameters, while allowing users to customize configurations according to actual detection scenarios.
Regarding the functional architecture, the EXE software integrates four core modules: hardware communication, multi-source image acquisition, real-time regression, and data visualization. Specifically, the starch content regression interface is primarily responsible for hardware control and real-time monitoring. Leveraging underlying interfaces, it enables real-time display of dual-camera video streams, precise adjustment of capture parameters, and simultaneous localized storage of both multispectral and RGB images, as well as automated Excel archiving of regression outcomes. The heatmap visualization interface is focused on the visual analysis of starch content. Equipped with built-in image segmentation and feature extraction algorithms, it transforms multispectral data into intuitive starch distribution heatmaps, clearly illustrating the spatial variability of starch content within leaf tissues.
In the practical workflow, after establishing a system connection and selecting the leaf category, users can initiate a one-click operation to automatically trigger the hardware for sequential acquisition of multispectral images. The regression interface subsequently outputs real-time regressions of starch content. For further visualization of the spatial distribution of starch, users may navigate to the heatmap interface and generate a starch distribution heatmap instantly upon importing designated image data. Test results indicate stable software performance and rapid responsiveness, with the system maintaining high detection accuracy—demonstrated by a consistent R2 value above 0.928. This integrated approach successfully achieves seamless integration of image acquisition, quantitative regression, and result visualization, thereby fulfilling the practical requirements for rapid, non-destructive detection of starch content in cucurbit grafted seedling leaves.

2.2.4. Regression Model Based on CNN–FCNN–Transformer

(1)
Leaf Image Segmentation Algorithm Based on the DeepLab v3+ Model
For the segmentation of watermelon leaves from pumpkin leaf backgrounds in watermelon–pumpkin graft seedling images, this study employed the Deeplab v3+ network for image segmentation. This network is a fully convolutional architecture based on dilated convolutions [26]. The image segmentation dataset of watermelon–pumpkin graft seedlings was constructed using the Labelme open-source toolkit (version 4.6.0), where watermelon leaves, pumpkin leaves, and backgrounds were annotated, resulting in a total of 660 images. The dataset was enriched through data augmentation techniques, including image rotation (45°, 60°, 90°), brightness adjustment (0.8× and 1.3×), contrast enhancement (0.8× and 1.2×), horizontal flipping, translation, and noise addition, thereby expanding the dataset to ten times its original size. A total of 6600 training images were generated. The dataset was partitioned into training, validation, and test sets at ratios of 70%, 15%, and 15%, respectively, to facilitate the development of the semantic segmentation model. Intersection over Union (IoU) and Pixel Accuracy (PA) were utilized as evaluation metrics to assess the segmentation performance.
(2)
Multispectral Image Reflectance Conversion
Evaluation of sample images captured under single wavelength represents a common analytical approach in reflectance spectral imaging [27,28]. The reflected light intensity at each wavelength was utilized as a feature, which was defined as the sum of reflected light intensities for all pixels within the image. The calculation formula for spectral reflectance is expressed in Equation (2) as follows:
I ref = I sample − I dark I white - I dark
where Iref is the calibrated reflectance intensity; Isample is the raw reflectance intensity; Idark is the dark reference intensity; and Iwhite is the white reference intensity.
(3)
Architecture of the CNN–FCNN–Transformer Regression Network
Given the diurnal variation pattern of starch content in plant leaves, a Transformer network was employed to construct a starch content regression model for exploring the correlations among multi-source image features. The Transformer, a sequence model based on the self-attention mechanism, differs from traditional RNNs and CNNs by relying entirely on self-attention for sequence processing and supporting parallel computation, thereby achieving higher efficiency. In the analysis of starch content in grafted seedling leaves, the Transformer effectively captured dependencies between different positions, enhancing model accuracy and robustness. The network architecture is depicted in Figure 1d. RGB images were input into a CNN with the final fully connected layer removed to extract an m × 1 one-dimensional vector as RGB image features. Simultaneously, spectral reflectance data were fed into a fully connected neural network (FCNN) for synchronous training, outputting a 16 × 1 one-dimensional vector as spectral features. These two vectors were then concatenated to form a (m + 16) × 1 one-dimensional vector, where m + 16 represents the number of multimodal image features input into the LSTM/Transformer network. The structural parameters of the entire regression model are listed in Table 1. Hyperparameter selection was based on the data collected in this experiment. Utilizing the experimental data and the Optuna framework (version 2.10.1), the Transformer parameters were determined as follows: Hidden size = 32, Num layers = 4, Num heads = 8.
No artificial intelligence tools (such as language models or image-generation tools) were used during data collection, analysis, or the generation of figures in this study.

3. Results and Analysis

All experimental datasets were randomly divided into training and test sets in an 8:2 ratio. The enzymatically assayed starch content was adopted as the reference standard and compared against the detection values. Model performance was evaluated utilizing R2 (coefficient of determination) and RMSE (root mean square error). The development environment was established on a dedicated deep-learning server equipped with an Intel(R) Core(TM) i9-12900K processor, 128 GB DDR4 memory, a 4 TB SSD, and an NVIDIA RTX 3090 graphics card (24 GB VRAM). Validation testing was conducted on a laptop configured with an Intel(R) Core(TM) i5-12400F processor, 16 GB DDR4 memory, a 1 TB SSD, and an NVIDIA GTX 1060 graphics card (6 GB VRAM). Both platforms operated under Python 3.6 and PyTorch 1.13.1.

3.1. Evaluation of Leaf Segmentation Performance Using the DeepLab v3+ Model

Twelve grafted seedling images were randomly selected. Following manual annotation of watermelon and pumpkin leaves, the annotated images were compared with segmentation results generated by the Deeplab v3+ model. The comparison outcomes are summarized in Table 2. As presented in the table, all randomly selected images from the test set achieved a PA (Pixel Accuracy) exceeding 0.99 and an IoU (Intersection over Union) above 0.88, with average values of 0.9991 and 0.9475, respectively. These results robustly demonstrate that employing the Deeplab v3+ network for leaf segmentation yields a high-performance outcome.
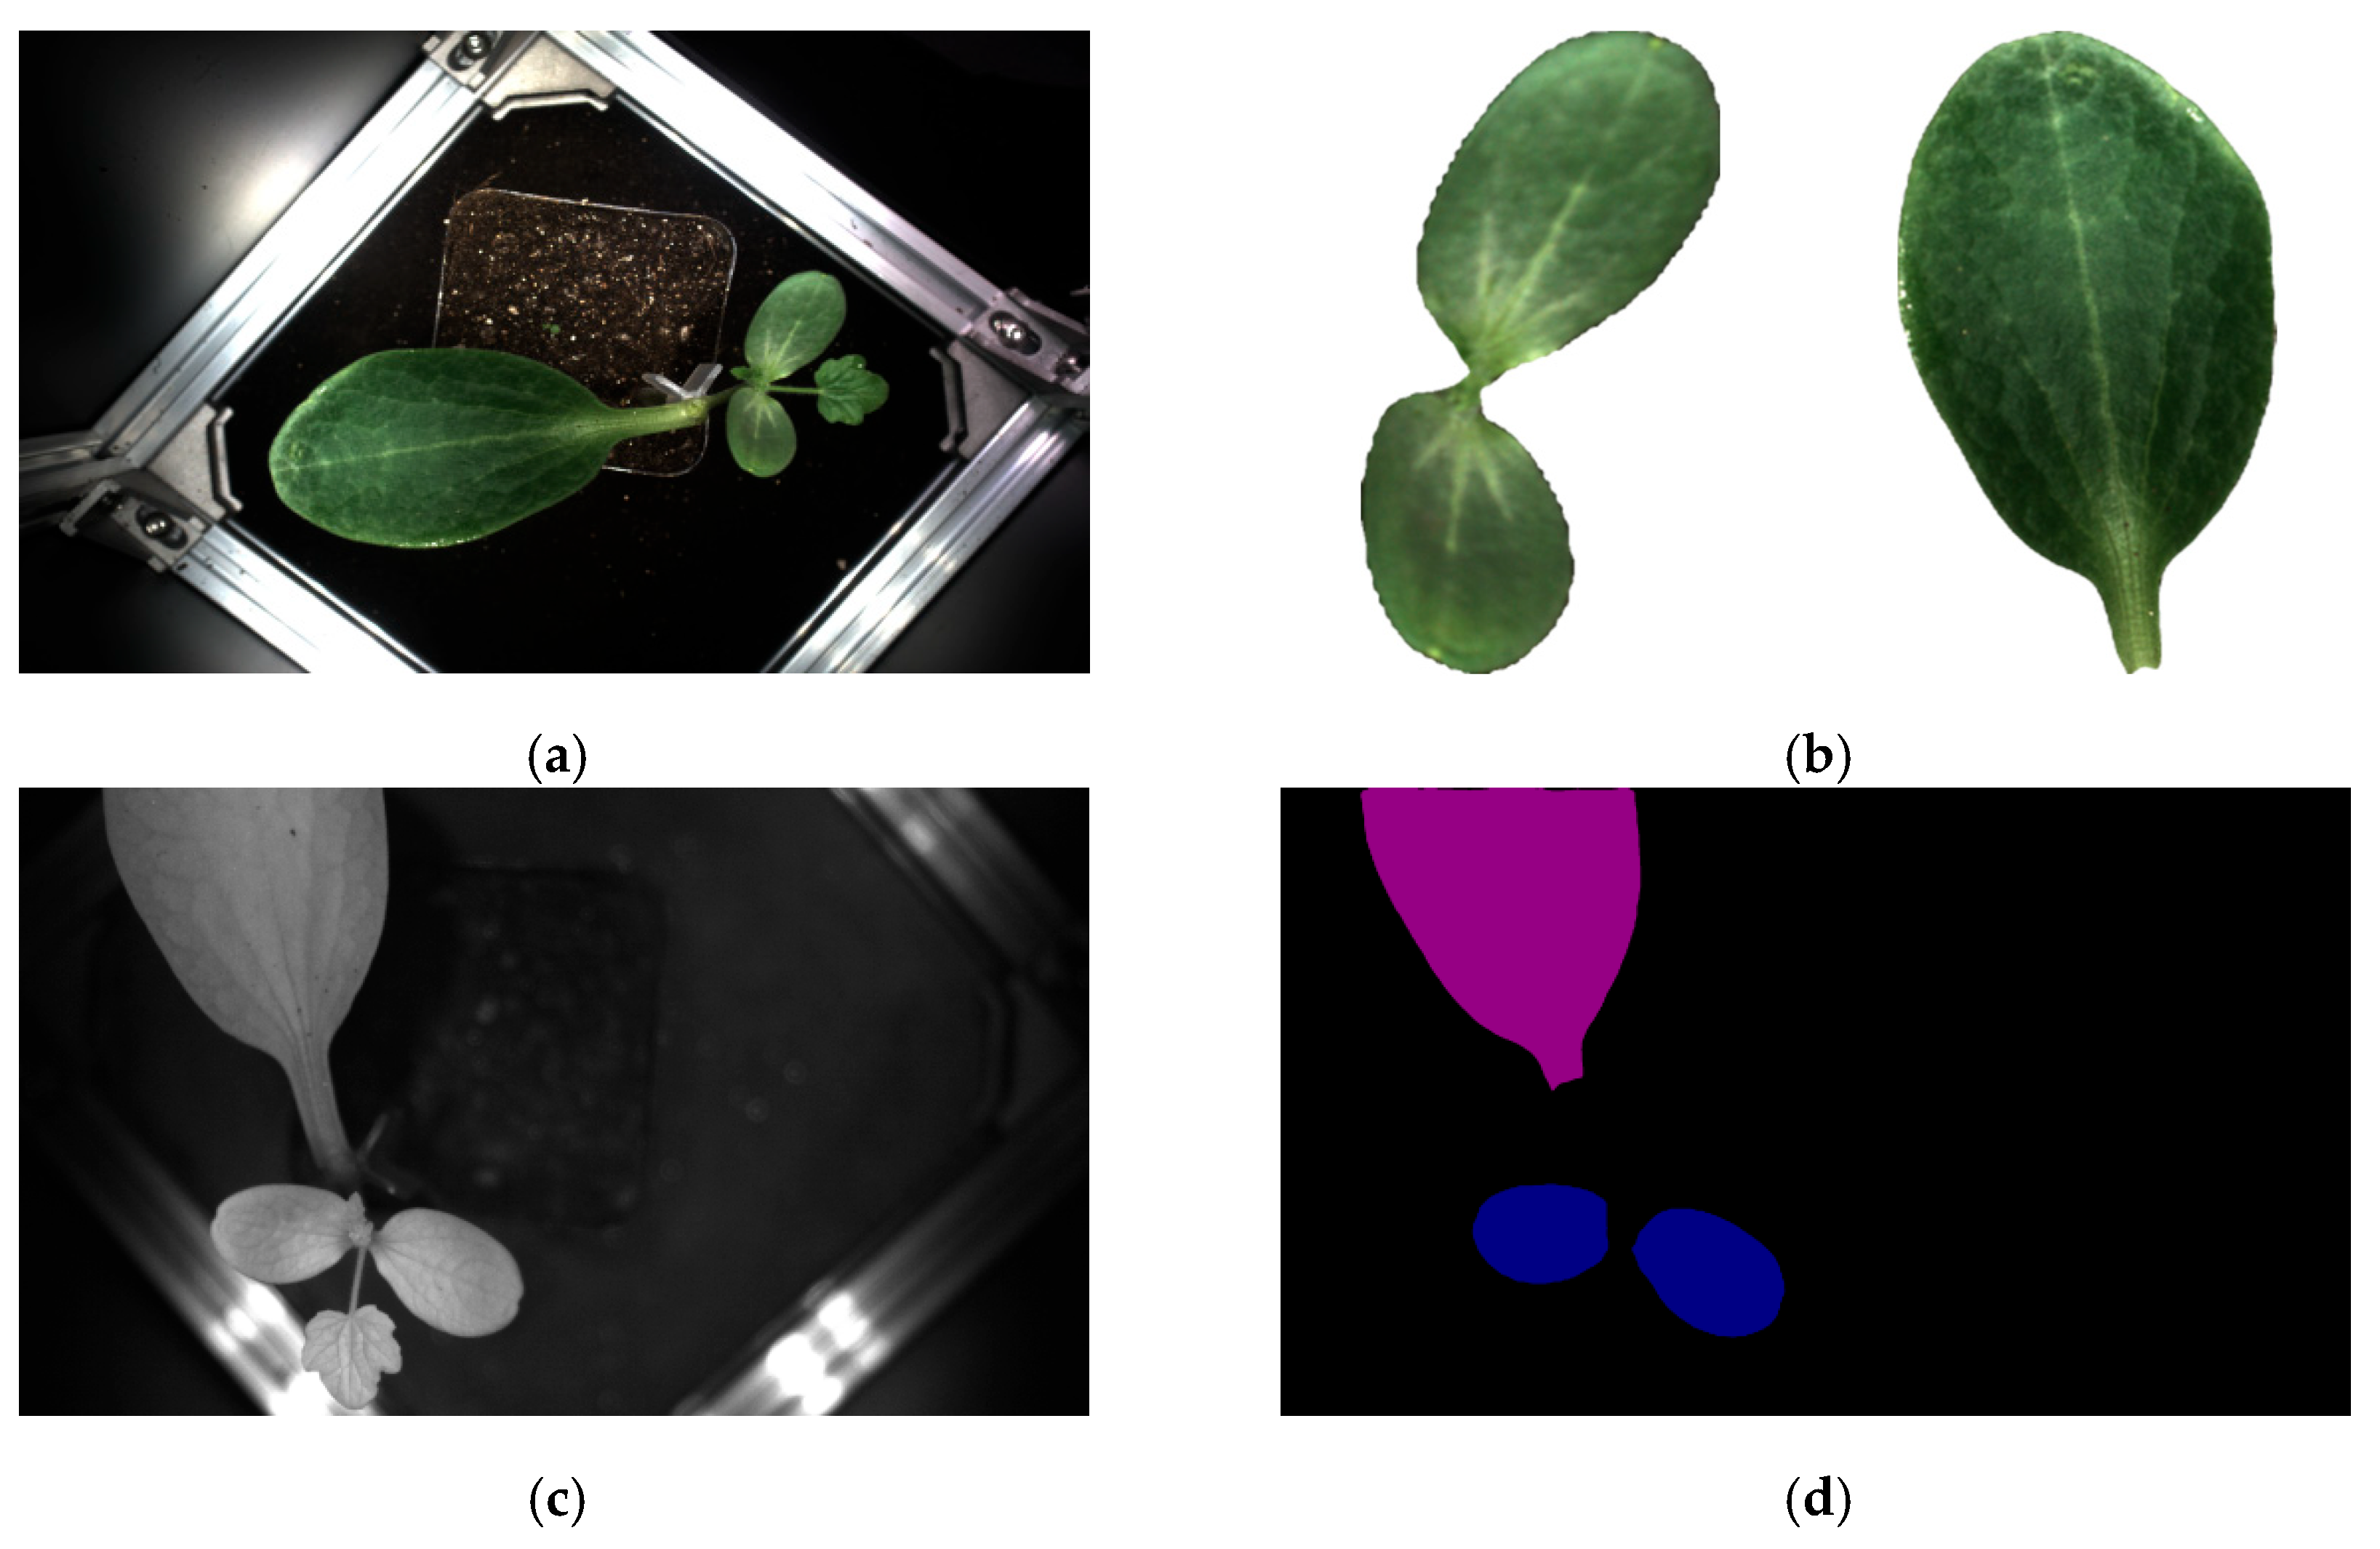
Figure 3 illustrates the segmentation results obtained using the DeepLab v3+ network. In the figure, the dicotyledonous structures correspond to the cotyledons of watermelon seedlings, while the monocotyledonous structures represent the cotyledons of pumpkin seedlings. As shown in Figure 3, the DeepLab v3+ semantic segmentation network demonstrates robust segmentation performance on both RGB and binary images of watermelon and pumpkin grafted seedlings, effectively distinguishing between the leaf tissues of watermelon and pumpkin.

3.2. Results of Optimal Feature Wavelength Selection

3.2.1. Test Results of Pretreatment Methods

Modeling results employing various preprocessing combinations based on Partial Least Squares regression (PLSR) were evaluated, as presented in Table 3. The optimal preprocessing method for both watermelon and pumpkin leaves was identified as Gaussian smoothing filtering combined with first-order derivation.

3.2.2. Test Results of Optimal Band Selection Based on CARS Feature Scores

(1)
Results of Optimal Machine Learning Modeling Method Selection
To identify the optimal machine learning modeling approach, five machine learning models were employed to establish regression models for leaf starch content. The results, as shown in Table 4, indicate that the RF model consistently achieved the highest R2 values and the smallest RMSE values. Consequently, random forest was determined to be the most effective modeling method for the preprocessed hyperspectral data of both watermelon and pumpkin leaves.
(2)
Test Results of CARS Feature Scores
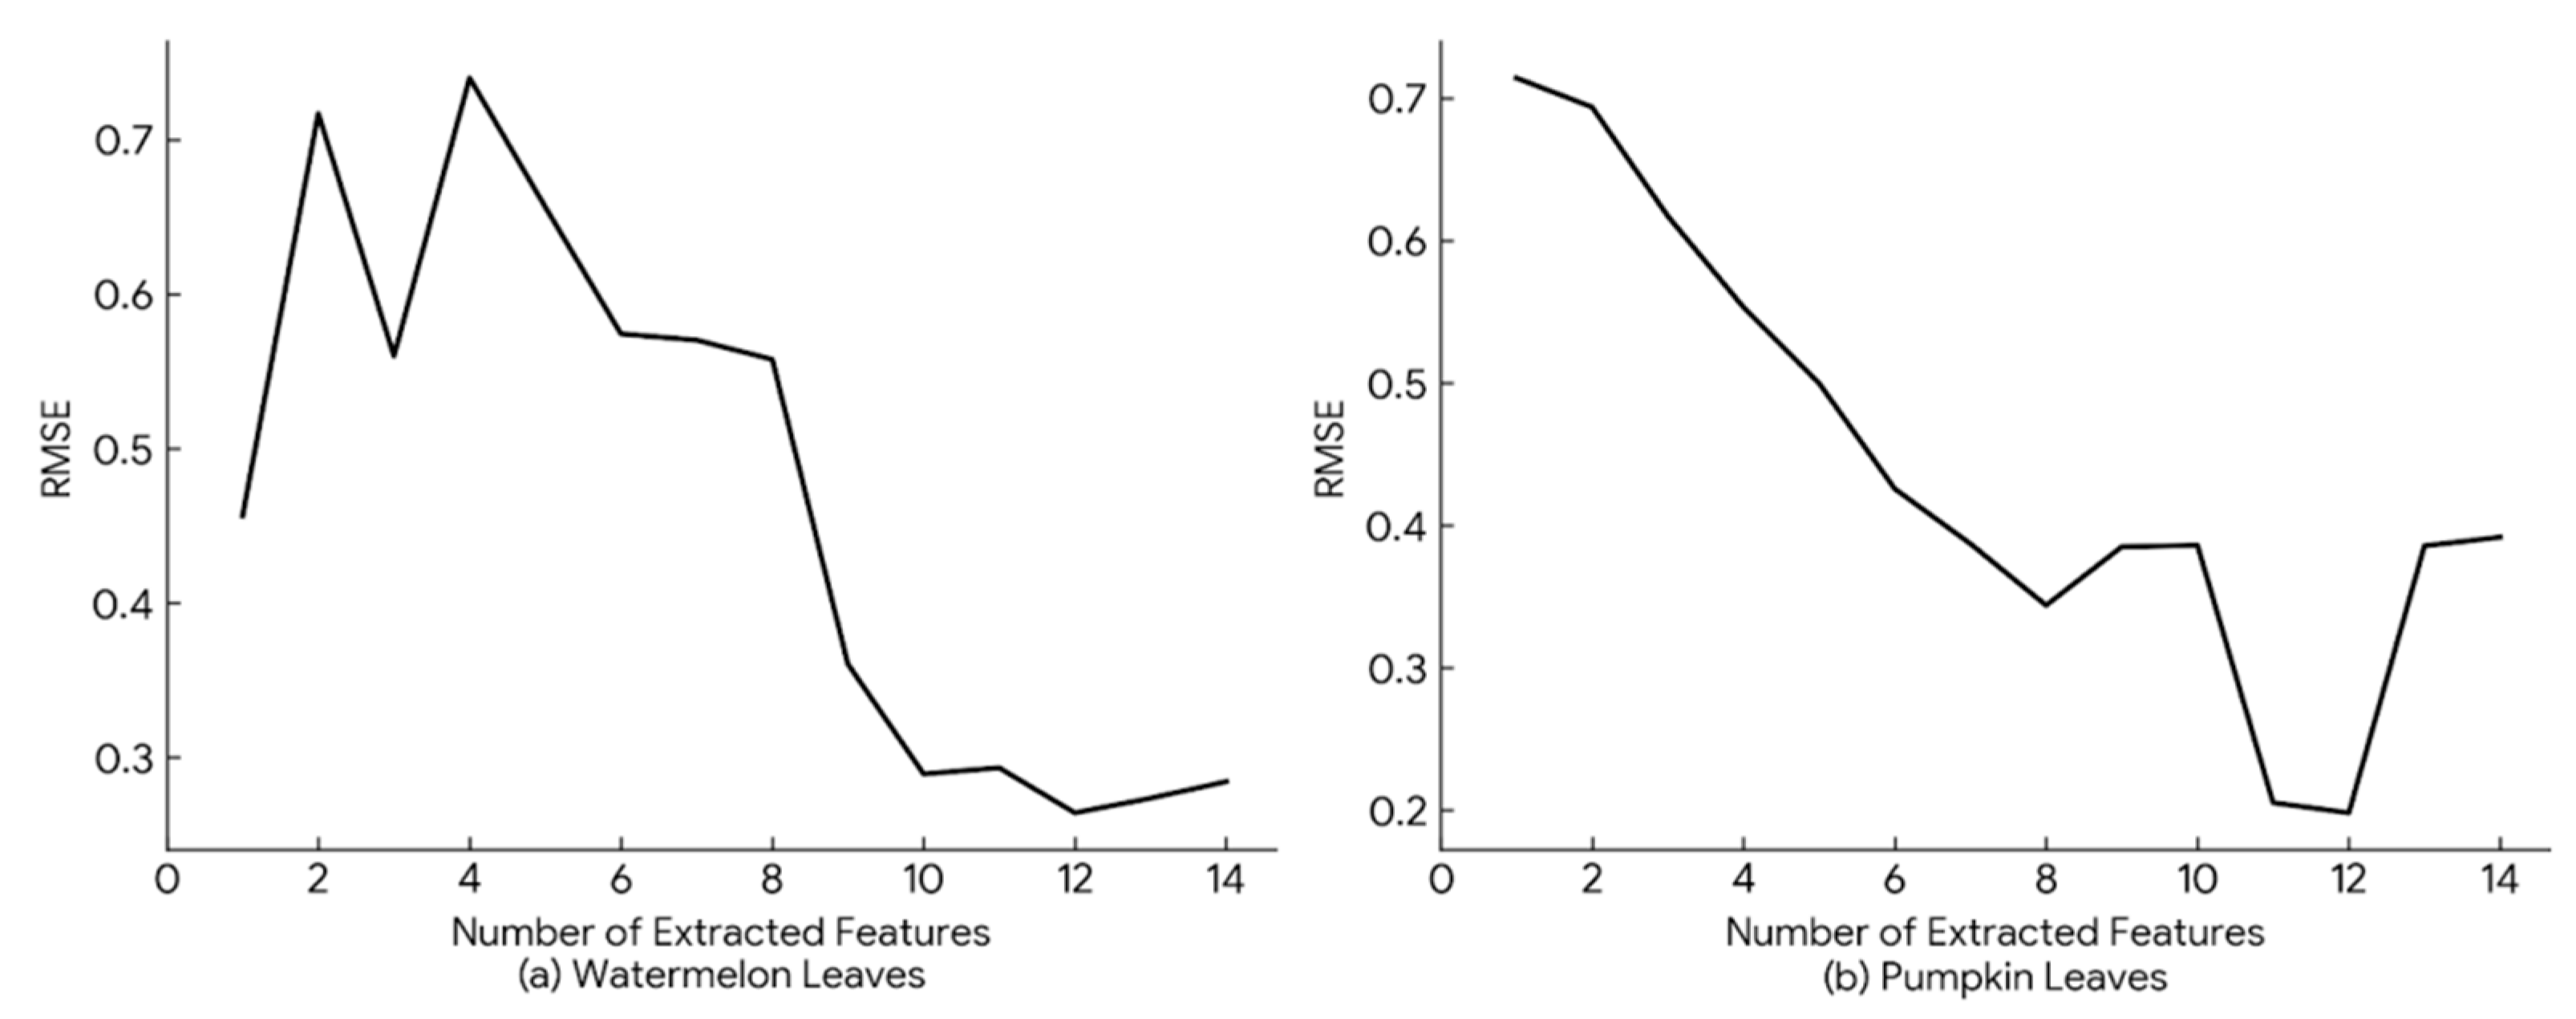
Following the designation of the random forest (RF) algorithm as the core evaluation model, the Competitive Adaptive Reweighted Sampling (CARS) algorithm was employed to perform feature band selection on the preprocessed hyperspectral data. In this procedure, the sampling iteration was set to 50 cycles, and a 5-fold cross-validation method was implemented to pinpoint the optimal feature wavelength combination based on the global minimum value of the Root Mean Square Error (RMSE) from the cross-validation. Figure 4 illustrates the trend of model RMSE variation with the number of feature wavelengths extracted. As can be observed from the figure, when the count of extracted feature bands was low, the model suffered from inadequate fitting capability due to insufficient spectral information characterizing starch content, resulting in elevated RMSE values accompanied by significant oscillations. As the number of extracted feature wavelengths progressively increased and reached 12, the spectral information most pertinent to starch content was effectively integrated, leading to a substantial reduction in regression error, with the RMSE descending to its global minimum. Further addition of feature bands would introduce redundant bands and noise signals, potentially inducing overfitting of the model, which consequently resulted in a rebound of the RMSE.
Based on the identification of the global minimum RMSE, this study successfully identified precisely 12 optimal feature bands for both watermelon leaf and pumpkin leaf samples. These 12 bands represent the core spectral information that consistently exhibited the highest predictive contribution across successive feature score comparisons. Specifically, the 12 feature bands associated with watermelon leaf starch content were ultimately determined as: 450 nm, 470 nm, 490 nm, 520 nm, 540 nm, 570 nm, 610 nm, 625 nm, 640 nm, 690 nm, 740 nm, and 880 nm. The 12 feature bands relevant to pumpkin leaf starch content were ultimately determined as: 410 nm, 450 nm, 480 nm, 490 nm, 510 nm, 520 nm, 540 nm, 570 nm, 780 nm, 830 nm, 850 nm, and 900 nm.

3.3. Performance Evaluation of the CNN–FCNN–Transformer Regression Model

3.3.1. Performance Evaluation of Image–Spectral Modeling Approaches

We examined the impact of seven Convolutional Neural Network (CNN) architectures on modeling outcomes, comparing two input modalities: image-spectral multimodal inputs versus spectral-only data inputs. Training was conducted using 5-fold cross-validation. The results are presented in Table 5. Experimental findings demonstrate that ShuffleNet v2 achieved the highest R2 in starch content regression for watermelon leaves, whereas EfficientNet b1 yielded the highest R2 in starch content regression for pumpkin leaves. In comparison to models trained solely on spectral data, those utilizing image-spectral multimodal data exhibited significant performance improvements, validating the importance of multi-modal data fusion.

3.3.2. Comparative Evaluation of Deep Learning Regression Networks

To demonstrate the advancement of the Transformer network, a comparative experiment was conducted using a Long Short-Term Memory (LSTM) network. The LSTM parameters were set as follows: hidden size = 1024, number of layers = 1. The results are presented in Table 6. On the watermelon leaf dataset, the R2 value for ShuffleNet v2 combined with Transformer was 0.9566, representing an increase of approximately 3.34% compared to the R2 of LSTM (0.9257) under the same backbone network. On the pumpkin leaf dataset, the R2 value for EfficientNet b1 combined with Transformer was 0.9670, reflecting an improvement of about 0.91% relative to the R2 of LSTM (0.9583) under the same backbone network. Compared to the LSTM network, the Transformer network exhibited stronger non-linear fitting capabilities, enabling more effective capture of global information within the data, thereby enhancing the model’s expressive and generalization abilities.

3.4. Performance Test of the Portable Starch Detection Device

The system demonstrated stable operation during continuous testing, facilitating one-click acquisition of 12-band multispectral and RGB images without communication failures. Compared to the benchmark chemical method (average 135 min/sample), the proposed system achieved a total test time of 28.2 s. Specifically, 21.1 s was dedicated to image capture, while the remaining 7.1 s was utilized for automated processing, including DeepLabV3+ leaf segmentation, feature extraction, and Transformer-based regression. Results summarized in Table 7 indicate that while the actual accuracy (R2 = 0.928–0.952) slightly deviates from the theoretical model (R2 = 0.956–0.967) due to hardware-related factors like LED wavelength process deviation, it remains sufficient for rapid field screening.
Furthermore, the system offers significant economic and practical advantages for large-scale agricultural applications. From a cost–benefit perspective, it reduces hardware costs to approximately 10% of commercial multispectral cameras (e.g., RedEdge-P) and eliminates recurring expenses for specialized enzymatic reagent kits. By providing a non-destructive detection method with a high throughput of 120 samples per hour, this portable device enables efficient, large-scale starch monitoring in breeding programs without sacrificing plant integrity.

4. Discussion

A portable method and a corresponding device were proposed for determining the starch content in plant leaves. Currently, content prediction primarily relies on conventional neural network architectures. For instance, Wang et al. (2023) [12] constructed a multi-source image fusion model based on CNN, fully connected neural networks (FCNN), and recurrent neural networks (RNN). However, the application of Transformer networks in this field remains relatively limited. While machine learning has been widely explored for the multiscale characterization of starch properties and material design in laboratory settings [29], its application for in situ, non-destructive monitoring in living plants remains less common. By bridging the gap between laboratory-grade starch analysis and field-scale physiological sensing, this study demonstrates a significant shift toward practical, real-time agricultural monitoring. In this study, a Transformer network was introduced to predict starch content by extracting RGB image features via CNN and spectral features via FCNN. This integration enables the model to better handle sequential data and long-range dependencies, thereby further improving the accuracy of content regression. Compared to architectures that focus solely on extracting local spatial features (CNN) or independent spectral features (FCNN), the Transformer, through its self-attention mechanism, is capable of capturing global correlations and long-range dependencies among the fused multimodal features. This deep modeling capability for complex non-linear relationships between features enhances the model’s generalization performance under multi-source heterogeneous data, thereby significantly improving the regression accuracy of starch content prediction. Simultaneously, CNN, FCNN, and Transformer networks were organically combined to construct an end-to-end regression model based on multi-source image fusion.
Current multispectral cameras on the market primarily utilize narrowband filters to acquire spectral images. For example, the RedEdge-P camera provides only six spectral bands: blue (center wavelength 475 nm, bandwidth 32 nm), green (560 nm, 27 nm), red (668 nm, 14 nm), red edge (717 nm, 12 nm), and near-infrared (842 nm, 57 nm). These preset bands cannot be freely selected according to user requirements, and their bandwidths are significantly larger than the ±5 nm range of narrowband LEDs. In contrast, the proposed portable multispectral imaging system is designed based on characteristic spectral bands associated with leaf starch content, which not only improves the accuracy of spectral measurement but also allows for flexible band selection, offering higher flexibility and adaptability. It is worth noting that the selection of CARS parameters, specifically the 50 Monte Carlo sampling iterations and 5-fold cross-validation, was empirically optimized to maximize the accuracy of the multispectral forecasting model. Altering these parameters would disrupt the balance of the exponential decay function, leading to either the retention of noisy bands or the loss of critical spectral information. As demonstrated by the global minimum of RMSE achieved at exactly 12 characteristic bands (Figure 4), the current parameter configuration represents the optimal setting, ensuring the highest and most stable regression accuracy. Furthermore, while the RedEdge-P camera is priced at approximately 50,000 RMB, the proposed portable multispectral imaging system costs only 5000 RMB. The system adopts a modular architecture, facilitating the free selection of characteristic bands by simply replacing the light source module, thereby significantly reducing equipment costs. Given the relatively limited research on the non-destructive detection of leaf starch, the successful applications of multispectral imaging and deep learning in assessing other physiological indicators, such as chlorophyll [12] and nitrogen content [30], provide crucial cross-disciplinary validation. Consequently, the portable system proposed in this study, with its customizable LED modules and robust Transformer architecture, demonstrates high versatility and holds significant potential to serve as a highly efficient, low-cost alternative method for monitoring various other plant biochemical components in precision agriculture.
Although the proposed method and device have been effectively validated for predicting starch content in watermelon–pumpkin grafted seedling leaves, further research is required to extend these predictions to a wider variety of plant species. When addressing starch content prediction for more diverse plant leaves, the selection strategy for characteristic bands may require fine-tuning. Future research will focus on exploring the variation patterns of starch content across more plant species and deeply analyzing the correlation between starch levels and environmental factors—such as temperature, humidity, and light intensity—to enhance the understanding of plant physiological status and nutrient uptake mechanisms under varying environmental conditions.

5. Conclusions

A portable detection method and instrument have been proposed for determining the starch content in plant leaves. The Transformer network was introduced, and an end-to-end content regression model based on multi-source image fusion was constructed by extracting RGB image features through CNN and spectral features through FCNN. This integration enables the model to better handle sequence data and long-range dependencies, thereby further improving the accuracy of content regression. The multispectral acquisition device scheme based on narrowband LEDs can flexibly select bands according to specific needs and is cost-effective. It can replace multispectral cameras in situations where real-time requirements are not high. Compared with traditional destructive enzymatic methods, this system significantly reduces the comprehensive detection cost. Specifically, it eliminates the need for expensive chemical reagents and complex sample pretreatment, and its hardware cost is only about 10% of that of commercial multispectral cameras. In a viable plant breeding situation, the high efficiency and low-cost characteristics of this method make it a more economical choice for the large-scale screening of breeding populations. Despite these advantages, the current system is highly sensitive to ambient light conditions, which restricts its application to controlled laboratory environments. Due to potential interference from solar radiation and complex environmental lighting, the device is not yet suitable for direct use in open agricultural fields. Overall, the proposed portable spectral detection method achieves dynamic non-destructive detection of starch content at low cost and high precision within controlled settings, laying a theoretical foundation for future field-based spectral imaging applications.


Author Contributions

Conceptualization, S.X., Y.H. and Z.B.; methodology, S.X. and H.Y.; software, H.Y. and S.X.; validation, S.X., H.Y., Y.Z. and S.W.; formal analysis, H.Y. and S.X.; investigation, S.X., H.Y., Y.Z. and S.W.; resources, Y.H., Z.B. and S.Y.; data curation, S.X. and H.Y.; writing—original draft preparation, S.X. and H.Y.; writing—review and editing, Y.H. and Z.B.; visualization, H.Y. and S.X.; supervision, Y.H., Z.B. and S.X.; project administration, Y.H.; funding acquisition, Y.H. and Z.B. Author Yuan Huang passed away prior to the publication of this manuscript. All other authors have read and agreed to the published version of this manuscript.

Funding

This research was supported by the National Xitiangua Industry Technology System Project (CARS-26).

Institutional Review Board Statement

Not applicable.

Data Availability Statement

The data presented in this study are available on request from the corresponding author.

Acknowledgments

During the preparation of this work, the authors used Gemini (version 2.5) in order to polish the grammar and improve the English language readability. After using this tool, the authors reviewed and edited the content as needed and take full responsibility for the content of the publication.

Conflicts of Interest

The authors declare no conflicts of interest.

Abbreviations

The following abbreviations are used in this manuscript:
LEDLight-Emitting Diode
DMSODimethyl Sulfoxide
R2Coefficient of Determination
RMSERoot Mean Squared Error
IoUIntersection over Union
PAPixel Accuracy
GFGaussian Filter
MAMoving Average Filter
SGSavitzky–Golay Filter
MSCMultiplicative Scatter Correction
D1First-Order Derivative
MCMean Centering
VNVector Normalization
MMNMin-Max Normalization
PLSPartial Least Squares
RFRandom Forest
RRRidge Regression
SVRSupport Vector Regression
CNNConvolutional Neural Networks
FCNNFully Connected Neural Network
LSTMLong Short-Term Memory

References

  1. Zeeman, S.C.; Smith, S.M.; Smith, A.M. The breakdown of starch in leaves. New Phytol. 2004, 163, 247–261. [Google Scholar] [CrossRef] [Scilit] [PubMed]
  2. Buckeridge, M.S. Chapter 3—The diversity of plant carbohydrate hydrolysis in nature and technology. In Polysaccharide-Degrading Biocatalysts; Goldbeck, R., Poletto, P., Eds.; Academic Press: Cambridge, MA, USA, 2023; pp. 55–74. [Google Scholar]
  3. Chen, Z.; Wang, Y.; Huang, R.; Zhang, Z.; Huang, J.; Yu, F.; Lin, Y.; Guo, Y.; Liang, K.; Zhou, Y.; et al. Integration of transcriptomic and proteomic analyses reveals several levels of metabolic regulation in the excess starch and early senescent leaf mutant lses1 in rice. BMC Plant Biol. 2022, 22, 137. [Google Scholar] [CrossRef] [Scilit]
  4. Xiong, M.; Liu, C.; Guo, L.; Wang, J.; Wu, X.; Li, L.; Bie, Z.; Huang, Y. Compatibility evaluation and anatomical observation of melon grafted onto eight Cucurbitaceae species. Front. Plant Sci. 2021, 12, 762889. [Google Scholar] [CrossRef] [Scilit]
  5. Wang, F.; Wang, C.; Song, S.; Xie, S.; Kang, F. Study on starch content detection and visualization of potato based on hyperspectral imaging. Food Sci. Nutr. 2021, 9, 4420–4430. [Google Scholar] [CrossRef] [Scilit] [PubMed]
  6. Lu, B.; Dao, P.D.; Liu, J.; He, Y.; Shang, J. Recent advances of hyperspectral imaging technology and applications in agriculture. Remote Sens. 2020, 12, 2659. [Google Scholar]
  7. Song, A.; Guo, X.; Gu, S.; Chen, X.; Wang, B. Evaluation of Peanut Kernel Oil Content Based on 3D-WPCA-CNN Model Using Hyperspectral Imaging. Trans. Chin. Soc. Agric. Eng. 2025, 41, 322–331. (In Chinese) [Google Scholar]
  8. Zhang, Z.; Yin, X.; Ma, C. Development of simplified models for the nondestructive testing of rice with husk starch content using hyperspectral imaging technology. Anal. Methods 2019, 11, 5910–5918. [Google Scholar] [CrossRef] [Scilit]
  9. Frey, L.A.; Baumann, P.; Aasen, H.; Studer, B.; Kölliker, R. A non-destructive method to quantify leaf starch content in red clover. Front. Plant Sci. 2020, 11, 569948. [Google Scholar] [CrossRef] [Scilit]
  10. Bu, Y.; Jiang, X.; Tian, J.; Hu, X.; Fei, X.; Huang, D.; Luo, H. Rapid and accurate detection of starch content in mixed sorghum by hyperspectral imaging combined with data fusion technology. J. Food Process Eng. 2022, 45, e14129. [Google Scholar]
  11. Polder, G.; Dieleman, J.A.; Hageraats, S.; Meinen, E. Imaging spectroscopy for monitoring the crop status of tomato plants. Comput. Electron. Agric. 2024, 216, 108504. [Google Scholar]
  12. Wang, N.; Li, Z.; Li, J.M.; Zhang, Y.; Sun, H.; Li, M.Z. Study on chlorophyll detection system for crop plants fusion with multispectral imaging and deep learning. Trans. Chin. Soc. Agric. Mach. 2023, 54, 260–269. (In Chinese) [Google Scholar]
  13. Wang, H.Y.; Ming, J.Q.; Jia, X.R.; Fu, Y.P.; Liu, Y.J.; Wang, G.Q.; Yang, J. Design of medium-wave infrared wide-band multispectral imaging optical system. Infrared Technol. 2022, 44, 1059–1065. (In Chinese) [Google Scholar]
  14. Ye, S.; Yu, X.Y.; Gan, G.; Li, Y.; Zou, Z.Y.; Lu, M.N.; Luo, D.G.; Qiu, Z.W. Design and implementation of spaceborne multispectral camera imaging system. Acta Opt. Sin. 2023, 43, 200–211. (In Chinese) [Google Scholar]
  15. Rossi, C.; Zoleo, A.; Bertoncello, R.; Meneghetti, M.; Deiana, R. Application of multispectral imaging and portable spectroscopic instruments to the analysis of an ancient Persian illuminated manuscript. Sensors 2021, 21, 4998. [Google Scholar] [CrossRef] [Scilit]
  16. Wang, C.; Liu, B.; Zhou, C.; Li, N.N.; Zhang, H.N.; Xiang, H.Z.; Zheng, G.; Wang, X.L.; Zhang, D.W. Research on Multispectral Microscopic Imaging System Using Narrow-Band LED Illumination. Chin. J. Lasers 2020, 47, 325–332. (In Chinese) [Google Scholar]
  17. Wang, L.; Duan, Y.; Zhang, L.; Wang, J.; Li, Y.; Jin, J. LeafScope: A portable high-resolution multispectral imager for in vivo imaging soybean leaf. Sensors 2020, 20, 2194. [Google Scholar] [CrossRef] [Scilit] [PubMed]
  18. Ju, L.; Yu, J.; Wu, Y.M.; Li, L.; Lu, T.; Ding, Y.P.; Shu, R.X. Comparative study on hyperspectral preprocessing methods and multi-models in classification. Spectrosc. Spectr. Anal. 2025, 45, 125–132. (In Chinese) [Google Scholar]
  19. Xie, B.H.; Ren, L.; Zhang, R.; Zhang, Y.J. Multispectral target detection method fusing semantic correction and background suppression. Comput. Eng. Appl. 2026, 1–13. (In Chinese) [Google Scholar]
  20. Zhang, X.; Xie, Z.J.; Qin, Z.Q.; Zhao, R.J.; Liu, W.Z.; Bai, X.B.; Xiong, X.L.; Liu, X. Research progress in nondestructive detection of leaf and fruit by miniaturized Vis/NIR spectrometer. Spectrosc. Spectr. Anal. 2025, 45, 2720–2729. (In Chinese) [Google Scholar]
  21. Chen, R.; Wang, X.; Wang, Z.W.; Qu, H.; Ma, T.M.; Chen, Z.G.; Gao, R. Wavelength selection method of NIR spectroscopy based on random forest feature importance and iPLS. Spectrosc. Spectr. Anal. 2023, 43, 1043–1050. (In Chinese) [Google Scholar]
  22. Li, Z.H.; Liu, Y.T.; Wang, S.T.; Li, B. Nondestructive detection of abnormal pesticide residues on apple surface based on explainable machine learning and hyperspectral imaging technology. Food Sci. 2026, 1–17. (In Chinese) [Google Scholar]
  23. Xia, Q.H.; Ma, Z.H.; Luo, L.Q.; Chen, T.C.; Jin, Q.; Wang, H.X.; Zhang, R.; Guo, Z.Z. Research on hyperspectral-based estimation model for canopy leaf water content of walnut. Acta Hortic. Sin. 2026, 1–20. (In Chinese) [Google Scholar] [CrossRef]
  24. Zhi, J.J.; Zhu, H.; Xue, C.; Zhang, S.P.; Sun, F.J. Identification of alpine meadow mat in Qinghai-Tibet Plateau based on smartphone images and hyperspectral data. Chin. J. Soil. Sci. 2025, 56, 368–380. (In Chinese) [Google Scholar] [CrossRef]
  25. Li, J.J.; Wang, X.F.; Huang, F.L.; Liu, Y.; Yao, X.; Yang, H.; Cheng, H.B. Comparison of characteristic wavelength selection methods for hyperspectral detection of insulator contamination. Spectrosc. Spectr. Anal. 2025, 45, 1992–1998. (In Chinese) [Google Scholar]
  26. Chang, H.; Guo, Q.; Zhang, H.Y.; Wang, H. Extraction of apple planting area based on improved CBAM-DeepLab V3+. Trans. Chin. Soc. Agric. Mach. 2023, 54, 206–213. (In Chinese) [Google Scholar]
  27. Li, B.; Lu, Y.J.; Liu, Y.D.; Wan, X. Adulteration detection of minced beef based on fusion of hyperspectral reflection and transmission technology. Trans. Chin. Soc. Agric. Eng. 2024, 40, 251–260. (In Chinese) [Google Scholar]
  28. Liang, X.Y.; Zhang, Z.T.; Yang, S.; Chen, X.; Yao, Z.F.; Song, H.B. Lightweight detection method for wheat scab severity based on hyperspectral imaging. Trans. Chin. Soc. Agric. Mach. 2025, 56, 218–227. (In Chinese) [Google Scholar]
  29. Zhu, X.L.; Wang, Y.T.; Li, J.Y.; Xue, R.N.; Zhang, J.; Jin, Z.Y.; Wei, Z.J.; Han, L.H. Progress in the Application of Machine Learning in the Basic Characterization of Starch and the Design of Its Functional Materials. Food Sci. 2026, 1–14. (In Chinese) [Google Scholar]
  30. Yang, D.; Wen, T.Y.; Wang, J.; Yang, Z.; Wang, H.Y.; Yang, H.J. Construction and Validation of a Nitrogen Content Estimation Model for Tobacco Leaves Based on Multispectral Vegetation Indices. J. Nucl. Agric. Sci. 2026, 40, 1055–1064. (In Chinese) [Google Scholar]
Figure 1. Flowchart of the overall technical framework.
Agriculture 16 01127 g001
Figure 2. EXE software interface. (a) Starch Content regression Interface; (b) Heatmap display interface.
Agriculture 16 01127 g002
Figure 3. Image segmentation effect of the grafting seedlings of watermelon and pumpkin leaves. (a) Original color image; (b) segmented color leaf image; (c) original monochrome image; (d) segmented leaf mask, where blue represents watermelon leaves and purple represents pumpkin leaves.
Agriculture 16 01127 g003
Figure 4. Results of CARS feature extraction.
Agriculture 16 01127 g004
Table 1. Network structure parameters.
ParameterSpecification
Training (%)80
Testing (%)20
Loss functionMean Squared Error
OptimizerAdam
Learning rate0.0001→0.00001
Epoch200
Batch size16
dropout0.2
Table 2. Evaluation Form for Leaf Segmentation Results of Grafted Seedlings Images.
No.PAIoUNo.PAIoU
10.99860.929070.99950.9395
20.99880.963680.99930.9678
30.99880.886790.99930.9606
40.99900.9622100.99940.9651
50.99870.9518110.99920.9797
60.99970.9652120.99870.8991
AveragePA = 0.9991AverageIoU = 0.9475
Table 3. Modeling Results of Different Preprocessing Combinations.
ModelWatermelon LeavesPumpkin Leaves
R2RMSER2RMSE
None0.40010.73780.59770.568
GF0.76010.43770.77810.3681
MA0.42510.72230.36380.5868
SG0.39710.74010.58020.5807
WAVE0.39490.74140.58120.5799
GF + BOC0.69670.48520.76710.3773
GF + MSC0.77920.41930.79730.4155
GF + D10.93470.31680.90930.2376
GF + D1 + MC0.91900.35340.86650.3460
GF + D1 + VN0.85030.48290.88430.3134
GF + D1 + MMN0.91180.35470.84270.2459
GF + D1 + SN0.90620.36520.85780.3572
A total of 110 leaf samples were used for each species. The metrics were calculated based on the independent test set (n = 22), with the remaining samples (n = 88) used for model training (8:2 ratio).
Table 4. The modeling results of five machine learning methods are utilized.
ModelWatermelon LeavesPumpkin Leaves
R2RMSER2RMSE
PLS0.93470.31680.90930.2376
RR0.92990.32810.87120.2821
RF0.95130.27370.91480.2295
SVR0.91640.35840.88970.2611
GBT0.88770.41540.80100.3506
A total of 110 leaf samples were used for each species. The metrics were calculated based on the independent test set (n = 22), with the remaining samples (n = 88) used for model training (8:2 ratio).
Table 5. Results and Comparisons of Spectral Modeling and Spectral-Image Modeling.
Input DataCNNWatermelon LeavesPumpkin Leaves
R2RMSER2RMSE
Multispectral imagesNone0.86230.064020.85490.1099
Multispectral-RGB imagesDensenet1210.92170.048290.94740.06619
Efficientnet b10.94460.040600.96700.05239
Inception v30.93580.043720.91570.08379
Mobilenet v20.94550.040290.93660.07267
ResNet180.93020.045590.95230.06301
Shufflenet v20.95660.035950.90160.09050
VGG160.93310.044610.92490.07906
A total of 330 image samples were used. The metrics were calculated based on the independent test set (n = 66), with the remaining samples (n = 264) used for model training (8:2 ratio).
Table 6. Test results of starch content regression using Long Short-Term Memory (LSTM) networks.
CNNModelWatermelon LeavesPumpkin Leaves
R2RMSER2RMSE
Densenet121LSTM0.91450.050470.93980.07077
Efficientnet b10.89340.056360.95830.05895
Inception v30.90530.053090.89740.09241
Mobilenet v20.90260.053860.93120.07568
ResNet180.89810.055070.93070.07595
Shufflenet v20.92570.047030.88450.09808
VGG160.89120.056890.90310.08984
A total of 330 image samples were used. The metrics were calculated based on the independent test set (n = 66), with the remaining samples (n = 264) used for model training (8:2 ratio).
Table 7. Performance and cost comparison of different detection methods.
Evaluation DimensionMetricsBenchmark (Chemical Method)Theoretical Model (Offline)Proposed Portable System
Assessment MetricsR2 (Watermelon)Reference Standard0.9560.928–0.945
R2 (Pumpkin)Reference Standard0.9670.938–0.952
RMSE (Watermelon)Reference Standard0.0360.040–0.055
RMSE (Pumpkin)Reference Standard0.0520.055–0.070
EfficiencySample preparationAverage 90 minN/ANo preparation
Data measurementAverage 45 minN/A21.1 s
Data processingIncluded aboveN/A7.1 s
Total time per testAverage 135 minN/A28.2 s
Throughput<1 sample/hN/A~120 samples/h
Cost–BenefitEquipment costHigh (Specialized instruments)~50,000 RMB~5000 RMB
ConsumablesHigh (Recurring reagent kits)NoneNone
Sample handlingDestructiveNon-destructiveNon-destructive
Disclaimer/Publisher’s Note: The statements, opinions and data contained in all publications are solely those of the individual author(s) and contributor(s) and not of MDPI and/or the editor(s). MDPI and/or the editor(s) disclaim responsibility for any injury to people or property resulting from any ideas, methods, instructions or products referred to in the content.