1. Introduction
Durum wheat (
Triticum turgidum subsp.
durum) is a strategic crop for Mediterranean agriculture and represents a key raw material for pasta production and other durum-based foods. Grain quality and safety are strongly influenced by fungal contamination occurring both in the field and during post-harvest handling and storage. Among the fungal genera affecting wheat,
Alternaria spp. are ubiquitous saprophytes and opportunistic pathogens that readily colonize cereal kernels under a wide range of environmental conditions, including moderate water activity, low temperatures, and prolonged storage periods [
1,
2,
3,
4].
Beyond their impact on grain appearance and technological quality—most notably through the black point defect—
Alternaria species are of increasing concern due to their ability to produce more than 70 secondary metabolites, several of which are toxic to humans and animals [
1,
2]. In cereals,
Alternaria contamination has been frequently reported along the supply chain, from field production to storage and processing, highlighting its agronomic and food safety relevance [
5,
6]. Among
Alternaria toxins, alternariol (AOH) is one of the most commonly detected in wheat and wheat-derived products [
1,
5,
6,
7]. Toxicological studies have demonstrated its mutagenic and genotoxic effects in vitro, as well as carcinogenic, hepatotoxic, and nephrotoxic effects in animal models [
8,
9,
10]. On this basis, the European Food Safety Authority (EFSA) has highlighted the potential health risks associated with dietary exposure to
Alternaria toxins and stressed the need for improved monitoring and mitigation strategies across cereal production chains [
1].
Early identification of
Alternaria contamination therefore represents a critical challenge for wheat supply chains. Conventional analytical methods for fungal and mycotoxin determination, including ELISA and chromatographic techniques, provide accurate and sensitive measurements but require destructive sampling, skilled personnel, and laboratory infrastructure [
7,
11]. ELISA-based approaches are commonly adopted for routine mycotoxin screening in food and agricultural matrices, although their performance is strictly dependent on careful optimization with respect to the specific matrix under investigation [
12]. These constraints limit their practical application for large-scale screening and time-sensitive decision-making in post-harvest management, where rapid segregation of suspect lots is essential to reduce economic losses and prevent the entry of contaminated grain into food and feed chains.
In this context, non-destructive spectroscopic techniques have gained increasing attention as rapid screening tools for cereal quality and safety assessment. Near-infrared (NIR) spectroscopy, based on the interaction of radiation with overtone and combination bands of molecular vibrations, has been extensively applied in agricultural and food systems for compositional analysis, quality control, and contamination detection [
7,
13]. In recent years, NIR spectroscopy and hyperspectral imaging have shown promising results for identifying fungal infection and mycotoxin contamination in cereals. Successful applications include the discrimination of kernels contaminated by
Aspergillus spp. or
Fusarium spp. [
14,
15,
16], the detection of ochratoxin A in barley using hyperspectral imaging [
17], and the rapid screening of deoxynivalenol (DON) in durum wheat using FT-NIR spectroscopy [
18]. These studies confirm that NIR spectral features are sensitive to biochemical and structural changes associated with fungal colonization and secondary metabolite production [
19,
20].
However, despite these advances, the potential of near-infrared transmittance (NIT) spectroscopy, which allows radiation to pass through the entire kernel mass, remains largely unexplored for the detection of
Alternaria contamination in durum wheat. NIT spectroscopy is widely implemented in industrial grain analyzers and routine post-harvest operations, offering practical advantages such as minimal sample preparation, high throughput, and robustness for inline or at-line applications [
13,
21]. Compared with reflectance-based approaches, transmittance measurements may provide enhanced sensitivity to internal kernel alterations induced by fungal growth, making NIT particularly suitable for early-stage screening in grain handling facilities [
21,
22].
The present study investigates the capability of NIT spectroscopy to serve as a rapid, non-destructive pre-screening tool for early detection of Alternaria contamination and associated increases in alternariol (AOH) in durum wheat kernels. By combining controlled artificial inoculation, time-resolved spectral acquisition, chemometric modelling, and mycotoxin quantification by ELISA, the study aims to (i) identify diagnostic spectral features associated with Alternaria colonization, (ii) evaluate the discrimination and classification performance between inoculated and control samples, and (iii) assess the coherence between NIT spectral changes and AOH accumulation. The ultimate objective is to support decision-making in post-harvest wheat management by enabling the rapid identification of suspect lots to be prioritized for confirmatory analytical testing.
2. Materials and Methods
2.1. Wheat Samples
Three batches of durum wheat (Triticum turgidum subsp. durum) kernels belonging to the cultivars Simeto, Rusticano, and Quadrato were collected from the Sant’Angelo Lodigiano area (Northern Italy). Prior to experimental treatments, all samples were preliminarily screened for the absence of alternariol (AOH) using a commercial ELISA kit (Beacon Analytical Systems, Saco, ME, USA), with a limit of quantification (LOQ) of 22.5 µg·kg−1. Only samples showing AOH concentrations below the LOQ were used for further experimentation. The experimental activities and data collection were conducted during 2019 and 2020, while data processing, chemometric analysis, and final interpretation of the results were performed in 2025.
To eliminate background microbial flora and ensure controlled fungal development, wheat kernels were autoclaved at 121 °C for 20 min. After cooling under sterile conditions, each batch was divided into control (non-inoculated) and treated (inoculated) subsamples.
2.2. Fungal Isolate and Inoculation Procedure
Alternaria spp. conidia were isolated from naturally infected durum wheat kernels and cultured on Potato Dextrose Agar (PDA; Sigma-Aldrich, St. Louis, MO, USA) under controlled laboratory conditions. Sporulating cultures were maintained at 20 °C with a 12 h light/12 h dark photoperiod until conidial maturity.
Conidia were harvested by gently flooding the PDA surface with sterile distilled water and filtering the suspension to remove mycelial fragments. Conidial concentration was adjusted to 5 × 10⁶ spores·mL−1 using a Bürker counting chamber (Marienfeld-Superior, Lauda-Königshofen, Germany).
Treated subsamples were artificially inoculated by uniformly spraying the conidial suspension onto wheat kernels under aseptic conditions, while control subsamples were treated with sterile distilled water only. After inoculation, all samples were incubated at 20 °C with a 12 h photoperiod to promote fungal growth, under conditions representative of post-harvest storage.
2.3. Experimental Design and Sampling Times
Spectral and analytical measurements were performed at three time points:
T0: immediately after inoculation.
T14: 14 days post-inoculation.
T24: 24 days post-inoculation.
This time-resolved design allowed monitoring of the progressive effects of fungal colonization and secondary metabolite accumulation on wheat kernels. At each sampling time (T0, T14, T24), inoculated and corresponding control samples were analyzed in parallel for each cultivar under identical analytical and instrumental conditions.
2.4. Near-Infrared Transmittance Spectral Acquisition
Near-infrared transmittance (NIT) spectra were acquired using an Inframatic™ 9500 Grain Analyzer (PerkinElmer Inc., Waltham, MA, USA), a standard industrial analyzer widely used for cereal quality assessment and featuring a fixed, factory-defined optical configuration. This choice reflects the objective of evaluating the method under real-world operating conditions, where access to detailed internal optical parameters is inherently limited. Measurements were performed in transmittance mode over the wavelength range 570–1100 nm, with a spectral resolution of 0.5 nm.
For each sample, kernels were loaded directly into the instrument without grinding or any additional preparation in order to preserve grain integrity and replicate industrial screening conditions. Based on signal-to-noise considerations and preliminary exploratory analyses, only the 870–1100 nm spectral region was retained for chemometric modelling. Potential contributions of moisture-related effects on NIT spectral features were considered during data interpretation and are addressed in the
Section 4.
2.5. Spectral Pre-Processing and Chemometric Analysis
Spectral data were exported and analyzed using The Unscrambler® software, version 10.5 (Camo Analytics, Oslo, Norway). Prior to modelling, spectra were pre-processed using Savitzky–Golay derivatives to reduce baseline effects and enhance subtle spectral differences associated with fungal growth.
Partial Least Squares (PLS)-based models were developed to evaluate the discrimination and classification performance between inoculated and control samples. Outliers were identified and removed based on Hotelling’s T2, leverage (H), and X-residuals criteria to ensure robust model calibration.
Model performance was evaluated using the coefficient of determination (R
2) and root mean square error (RMSE) for both calibration and cross-validation. These metrics were used to monitor internal model consistency, while classification performance was primarily assessed using ROC analysis. Accordingly, R
2 values are reported to describe model fitting behaviour rather than as standalone classification metrics. Predictive performance was classified following the criteria proposed by Shenk and Westerhaus [
23], considering R
2 ≥ 0.90 as indicative of excellent model quality. The optimal number of latent variables was 4 for the Simeto dataset, 3 for Rusticano, and 5 for Quadrato, as determined by cross-validation to minimize prediction error and avoid model overfitting. Cross-validation was performed using a full cross-validation (leave-one-out) approach.
Differences in latent variable selection reflect dataset-specific spectral variability and sample structure, ensuring optimal model complexity while preventing overfitting. The chemometric approach was intended to support qualitative discrimination between inoculated and control samples in a pre-screening context, rather than to develop a fully predictive or quantitative model.
2.6. Alternariol (AOH) Quantification
Alternariol concentrations were determined using a commercial ELISA kit (Beacon Analytical Systems, Saco, ME, USA) following the manufacturer’s instructions. Analyses were performed on both inoculated and control samples at all sampling times.
Quantitative results were expressed as µg·kg−1 (ppb). The analytical method exhibited a limit of quantification (LOQ) of 22.5 µg·kg−1. ELISA data were used to validate the biological relevance of the spectral differences observed by NIT spectroscopy and to assess the coherence between fungal colonization, toxin accumulation, and spectral response.
2.7. Control Experiments
To exclude potential confounding effects unrelated to fungal growth, additional control experiments were conducted to evaluate the influence of autoclaving and visual grain damage on the NIT spectral signature. Spectra obtained from these controls were compared with those of inoculated samples to verify that observed discriminative features were primarily associated with Alternaria colonization and mycotoxin production rather than physical or thermal alterations of the kernels.
3. Results
3.1. Alternariol Accumulation in Inoculated and Control Samples
ELISA analysis confirmed a clear and progressive accumulation of alternariol (AOH) in Alternaria-inoculated wheat samples over the incubation period, while control samples consistently showed low or non-detectable levels.
In the Simeto cultivar (NIT3), inoculated kernels showed a marked increase in AOH concentration from 107 µg·kg−1 at T0 to 592 µg·kg−1 at T24, whereas corresponding control samples remained below the limit of quantification throughout the experiment. In Rusticano (NIT4), inoculated samples exhibited AOH concentrations of 171.5 µg·kg−1 (T0), 203.3 µg·kg−1 (T14), and 198.0 µg·kg−1 (T24), compared with consistently lower values in control subsets (46, 36, and 27 µg·kg−1, respectively). Comparable trends were observed in Quadrato (NIT5).
These results demonstrate that the artificial inoculation protocol successfully induced Alternaria growth and secondary metabolite production under controlled post-harvest conditions, providing a reliable biological basis for interpreting the spectroscopic data. Low and variable AOH levels occasionally detected in control samples likely reflect background contamination below the quantification threshold and inherent biological variability, rather than active Alternaria growth.
3.2. Near-Infrared Transmittance Spectral Evolution over Time
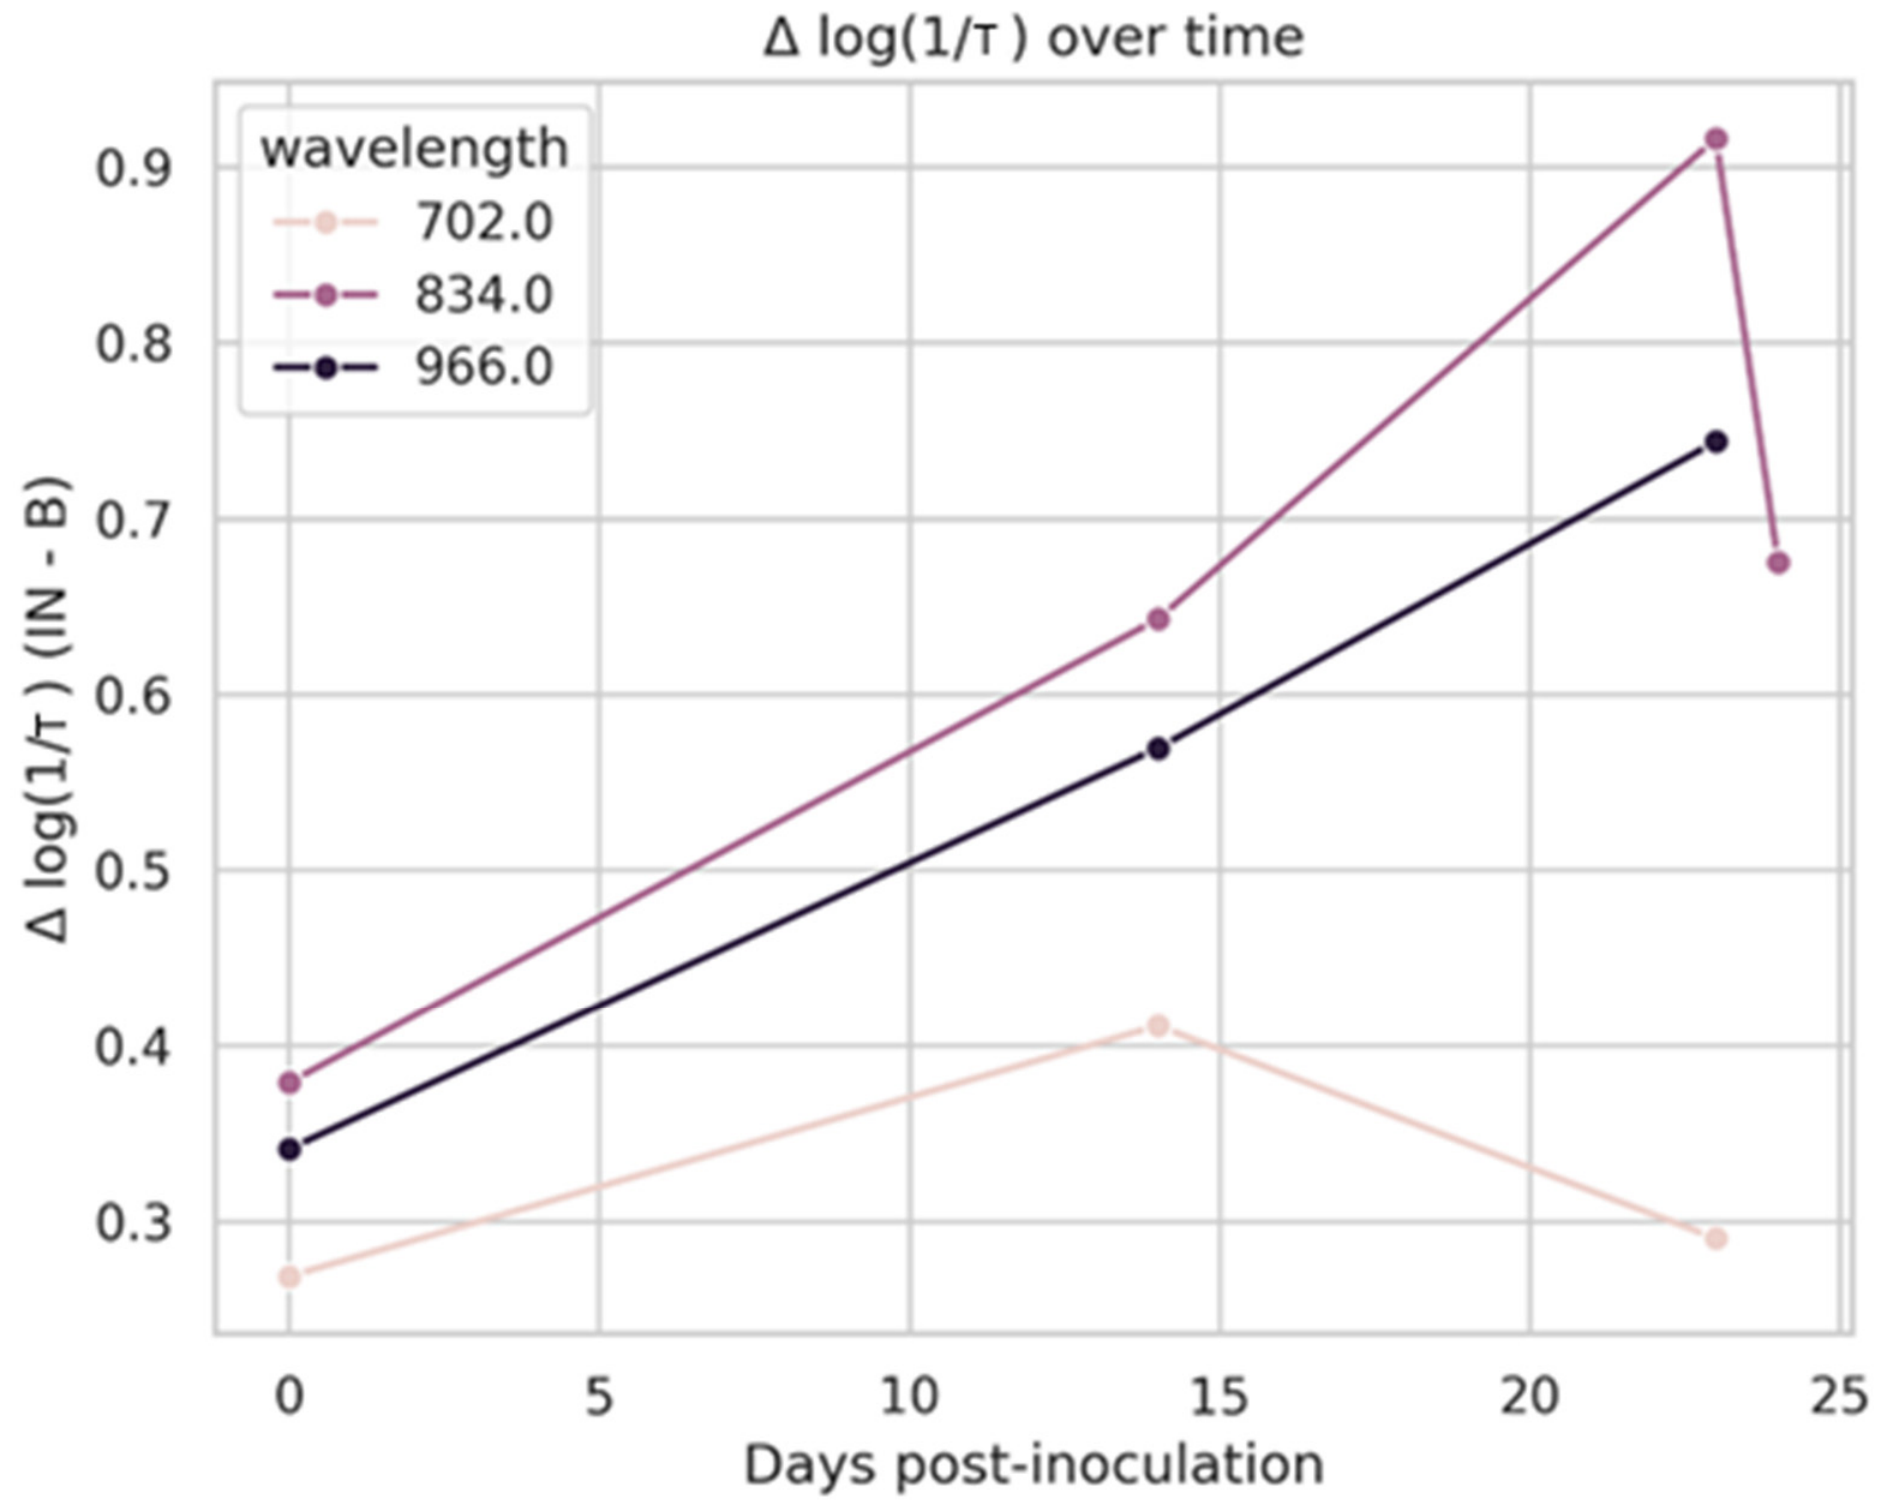
Near-infrared transmittance (NIT) spectroscopy revealed clear and time-dependent spectral differences between inoculated (IN) and control (B) wheat kernels. The contrast spectra, expressed as Δlog(1/T) = IN − B, increased progressively with incubation time, indicating systematic modifications of kernel optical properties associated with fungal development.
As shown in
Figure 1, the strongest spectral divergences were observed at 834 nm and 966 nm, while differences at 702 nm remained limited. In the Simeto cultivar (NIT3), Δlog(1/T) at 834 nm increased from 0.31 at T0 to 0.92 at T24, while at 966 nm it rose from 0.27 to 0.86 over the same period. Similar spectral evolution patterns were observed for Rusticano and Quadrato cultivars, confirming the reproducibility of the NIT response across genotypes.
The consistent temporal increase in absorbance differences highlights the sensitivity of NIT spectroscopy to progressive fungal development within the kernel matrix. Representative full near-infrared transmittance spectra are provided in the
Supplementary Materials (Figure S1) to allow direct evaluation of signal quality and variability.
3.3. Distribution of Absorbance Values and Sample Discrimination
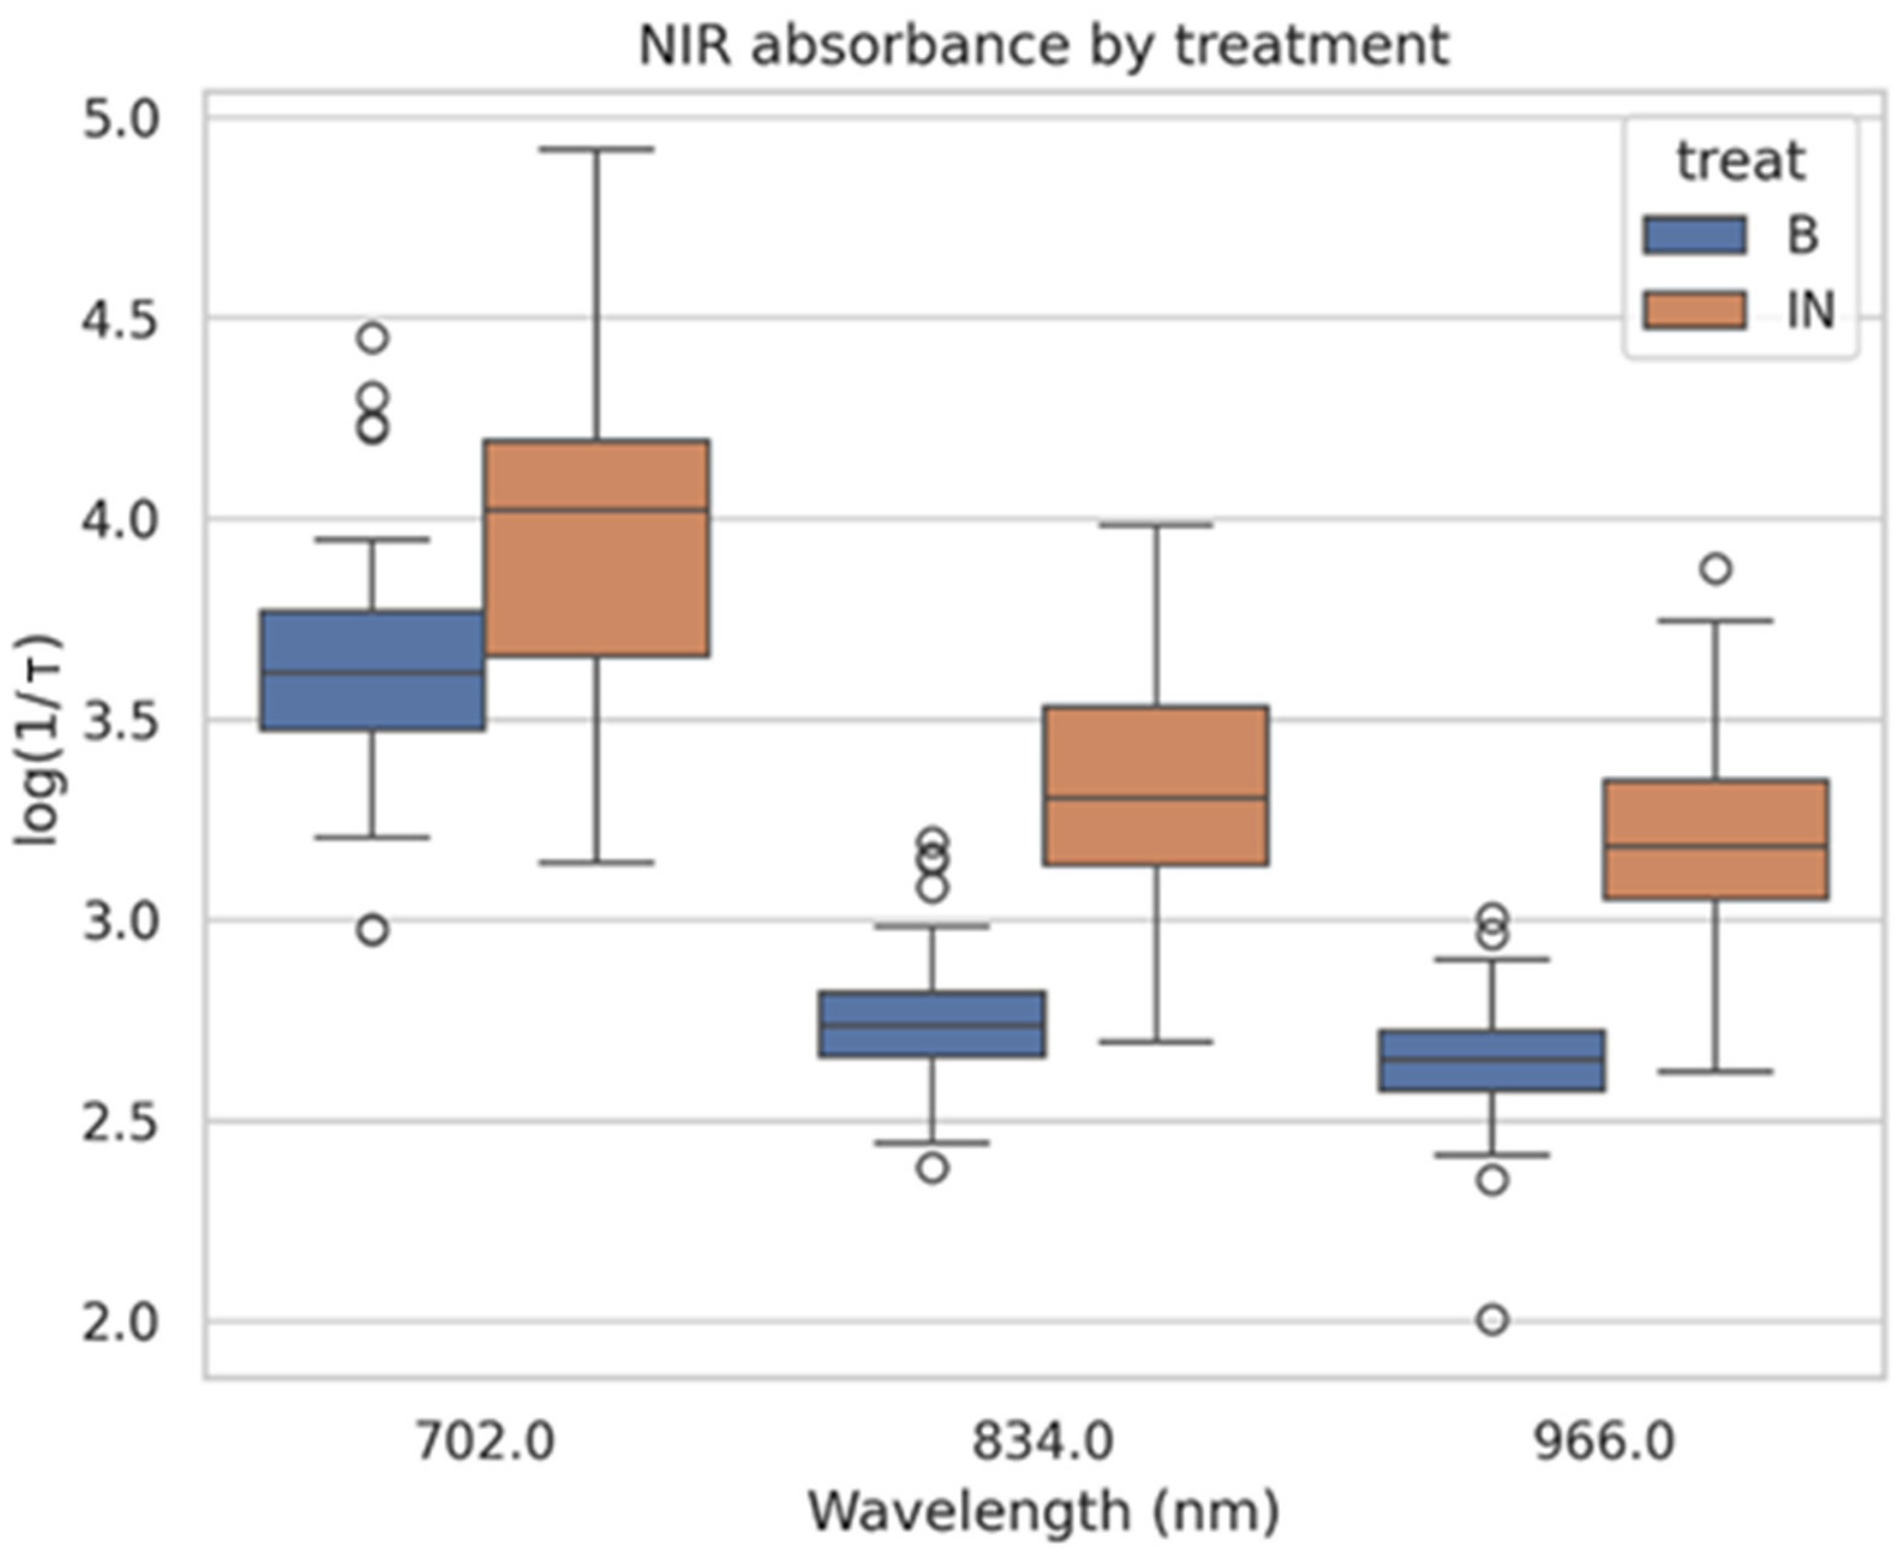
The separation between inoculated and control samples was further examined by analyzing the distribution of absorbance values at diagnostic wavelengths. As illustrated in
Figure 2, the distributions of log(1/T) values at 834 nm and 966 nm showed minimal overlap between treatments when data from all sampling times were pooled.
Boxplot analysis revealed that inoculated samples consistently exhibited higher absorbance and greater dispersion compared with controls, reflecting biological variability associated with different stages of fungal growth. In contrast, control samples showed narrow distributions and stable median values across time, indicating spectral stability in the absence of fungal contamination.
This observed separation supports the suitability of these wavelengths as robust markers for the discrimination of Alternaria-contaminated wheat kernels in a screening context.
3.4. Multivariate Analysis by PCA
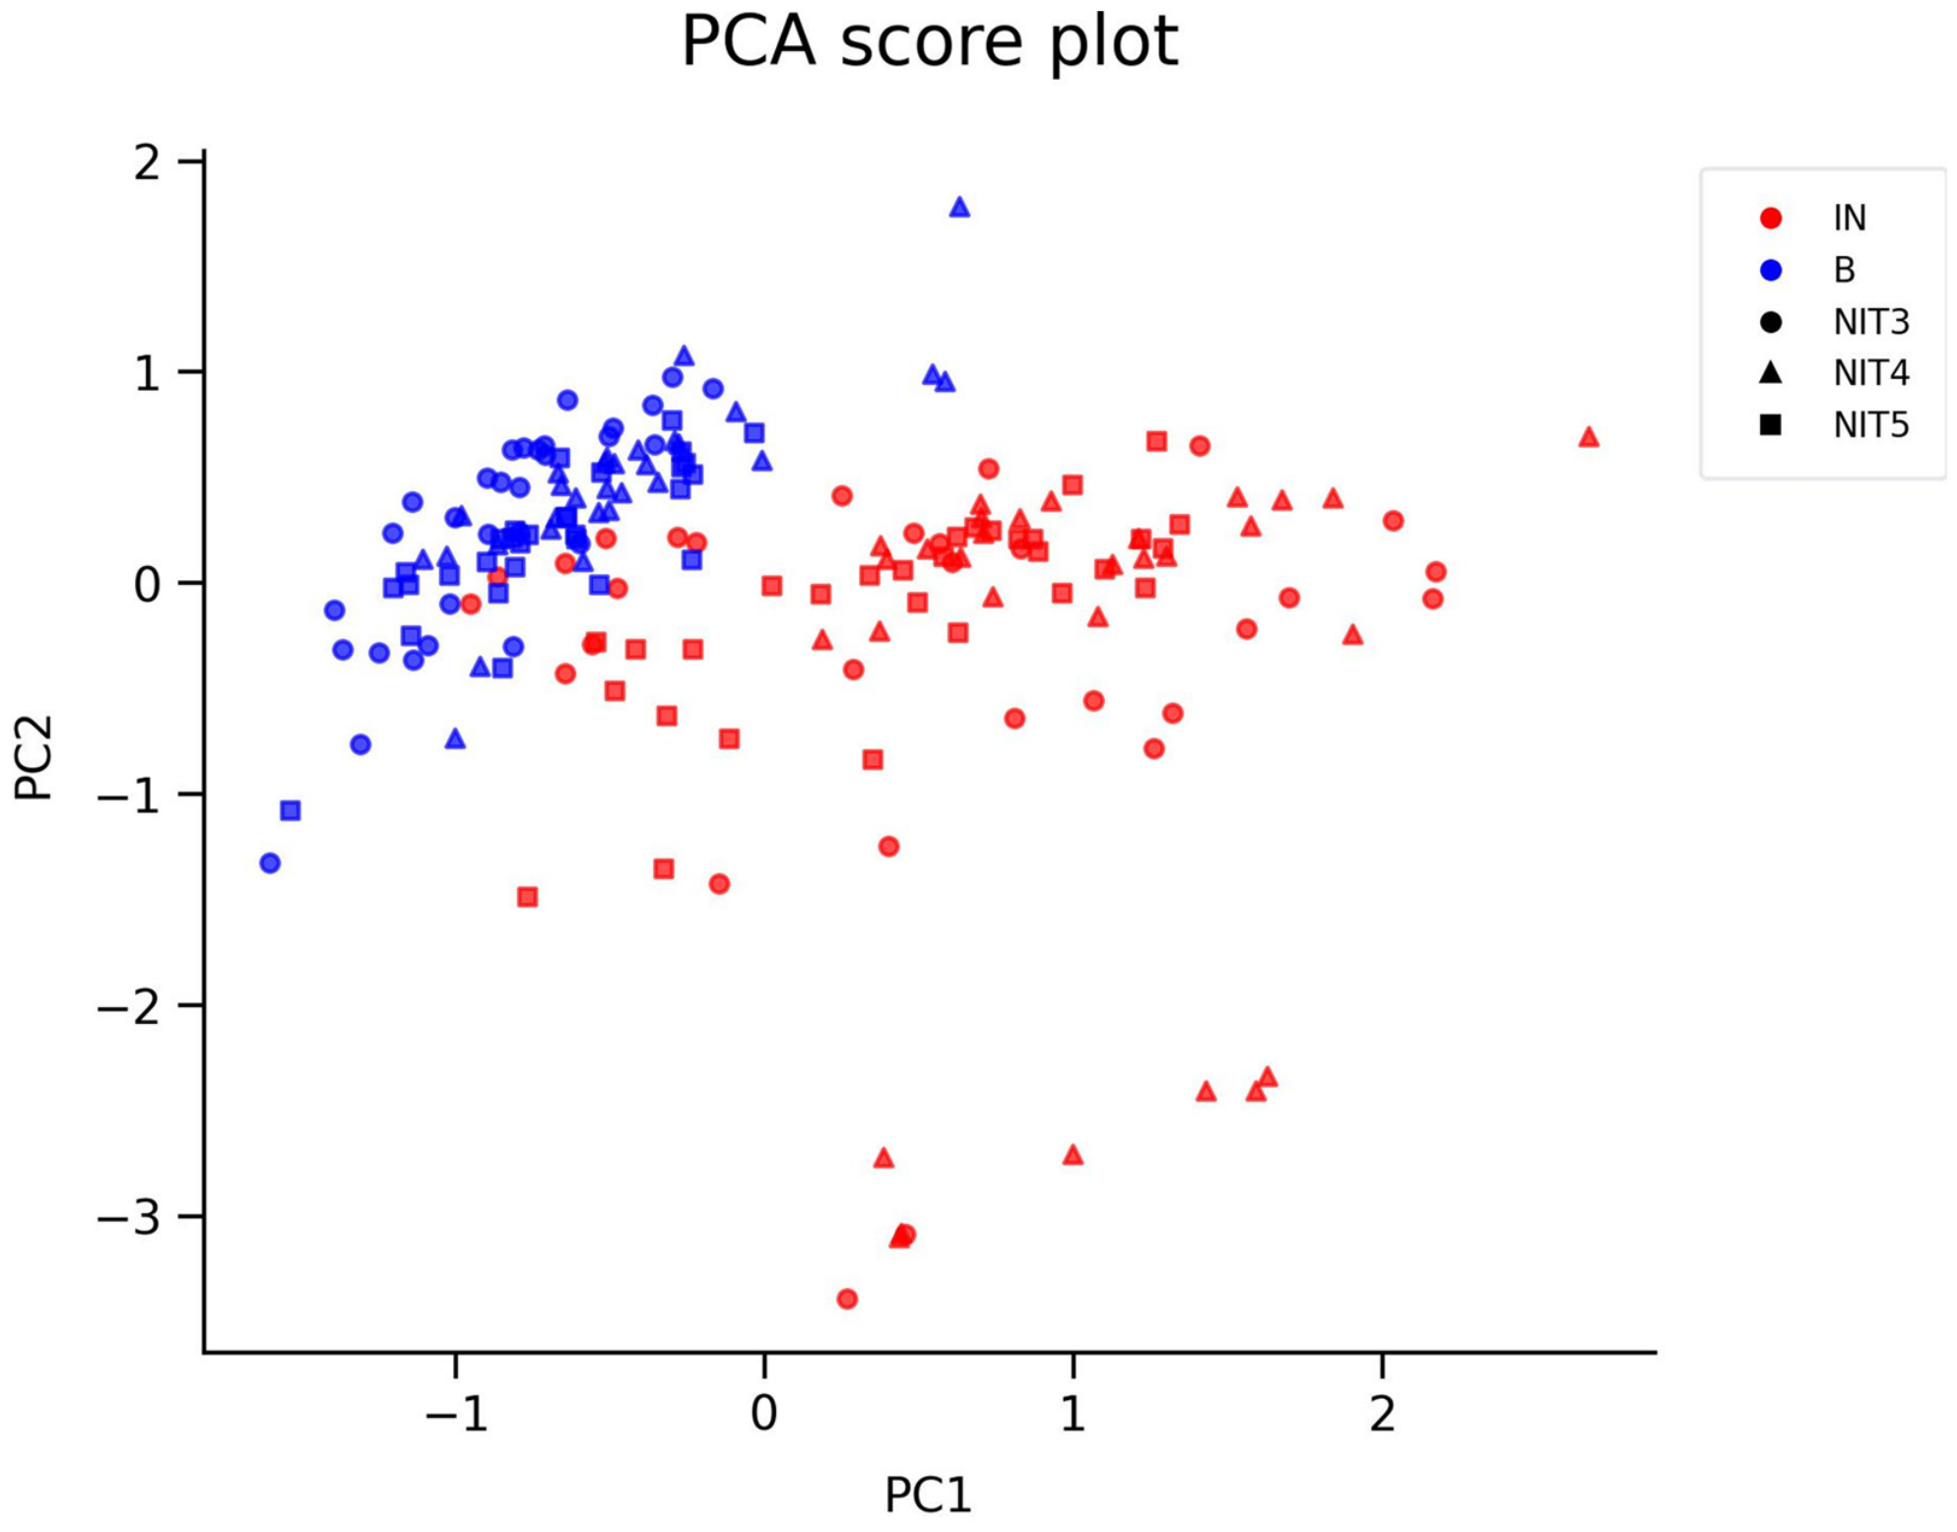
To further investigate the overall structure of the spectral data and to confirm the observed differences between inoculated (IN) and control (B) samples, a principal component analysis (PCA) was performed using the selected wavelengths (702, 834, and 966 nm).
As shown in
Figure 3, the first principal component (PC1) captured the majority of the variance and clearly separated inoculated from control samples. Inoculated samples were associated with higher PC1 values, while control samples clustered at lower values, indicating a strong and consistent treatment-related effect across all datasets.
The second principal component (PC2) accounted for a smaller proportion of the variance and reflected residual variability, likely associated with differences among cultivars (NIT3, NIT4, and NIT5) and experimental conditions.
The PCA score plot showed a clear clustering pattern with limited overlap between groups, confirming that the observed spectral differences are systematic and reproducible, rather than attributable to random noise.
3.5. Effect Size, Statistical Significance, and Classification Performance
Effect-size analysis and classification metrics confirmed the strong discriminative power of selected NIT spectral features. In the Simeto batch (NIT3), Cohen’s d values exceeded 3.0 at 834 nm and 2.8 at 966 nm for the T14–T24 time window, corresponding to very large effect sizes and indicating substantial spectral differences between inoculated and control samples. Welch’s t-tests confirmed that these differences were highly significant (p < 0.001).
Receiver Operating Characteristic (ROC) analysis yielded AUC values of 0.961 at 834 nm and 0.972 at 966 nm, indicating excellent classification performance. Comparable statistical significance and discrimination trends were observed in the Rusticano (NIT4) and Quadrato (NIT5) batches, as summarized in
Table 1.
Together, these metrics demonstrate that the observed spectral differences are not only statistically significant but also highly effective for classification, satisfying key requirements for reliable screening methods.
3.6. Control Experiments and Specificity of the NIT Response
Control experiments demonstrated that neither autoclaving alone nor visually damaged kernels reproduced the spectral signatures observed in inoculated samples. NIT spectra from these controls showed no systematic increase in absorbance at diagnostic wavelengths and clustered with non-inoculated samples.
These findings confirm that the NIT discrimination observed in this study is specifically associated with Alternaria colonization and/or secondary metabolite accumulation, rather than generic physical or thermal alterations of the grain matrix.
4. Discussion
The results of this study demonstrate that Near-Infrared Transmittance (NIT) spectroscopy can effectively detect Alternaria contamination in durum wheat kernels and provide a reliable early indication of alternariol (AOH) accumulation under controlled post-harvest conditions. The coherence observed between spectroscopic, statistical, and biochemical data supports the validity of the proposed approach as a rapid, non-destructive screening tool.
4.1. Biological Significance of the NIT Spectral Response
The progressive increase in AOH concentration in inoculated samples confirms that the experimental design successfully reproduced biologically relevant Alternaria colonization and secondary metabolite production. Importantly, the temporal evolution of AOH closely mirrored the increase in NIT absorbance differences at diagnostic wavelengths, particularly at 834 and 966 nm. This parallel trend suggests that fungal growth and associated metabolic activity may induce biochemical and structural alterations within the wheat kernel matrix that are detectable by NIT spectroscopy. This confirms that the observed spectral response reflects underlying biological processes rather than analytical variability.
The sensitivity of the 834–966 nm region is consistent with previous reports linking NIR spectral changes to variations in protein structure, lipid oxidation, and moisture redistribution associated with fungal activity. Although NIT does not directly detect mycotoxins, the observed spectral shifts likely reflect cumulative physiological effects of fungal metabolism, including tissue degradation and accumulation of secondary metabolites. This reinforces the suitability of NIT as an indirect but biologically meaningful indicator of contamination risk.
4.2. Discriminative Power and Robustness of the Method
The strong discriminative performance achieved in this study is evidenced by multiple independent metrics. Very large effect sizes (Cohen’s d > 3) demonstrate that differences between inoculated and control samples are not marginal but substantial. The consistently high AUC values (>0.96) further confirm the excellent classification capability of the method, indicating a high probability of correct discrimination across cultivars and sampling times.
Crucially, the observed discrimination was reproducible across three genetically distinct durum wheat cultivars, suggesting that the NIT response is not cultivar-specific but rather reflects general features of Alternaria colonization. This robustness is a key requirement for any screening approach intended for operational use across heterogeneous grain lots.
The clear separation observed in absorbance distributions, with minimal overlap between inoculated and control samples, underlines the reliability of selected wavelengths as screening markers and supports their practical use without the need for complex multivariate classification schemes in early decision-making stages. This robustness is particularly relevant in the context of screening applications, where consistent discrimination between suspect and non-suspect samples is more critical than precise quantitative prediction. The PCA results further support these findings by confirming that spectral differences are consistent across datasets and not driven by random variability.
4.3. Specificity of the Spectral Signature
One of the most critical aspects addressed in this study is the specificity of the NIT response. Control experiments demonstrated that neither autoclaving nor visually induced grain damage reproduced the spectral features associated with inoculated samples. This finding is particularly relevant, as it rules out confounding effects related to thermal treatment or physical kernel alterations.
The specificity of the NIT signal strengthens the conclusion that the observed spectral patterns are primarily driven by fungal colonization and associated biochemical changes, rather than generic stress or processing artefacts. This aspect is essential for the credibility of NIT-based screening in real post-harvest scenarios, where grains may experience a range of non-biological stresses.
4.4. Comparison with Previous Spectroscopic Approaches
Previous studies based on NIR reflectance spectroscopy and hyperspectral imaging have explored the use of these techniques for detecting fungal contamination and major mycotoxins in cereals. However, these approaches often rely on laboratory-based setups, extensive data processing, or imaging systems that are not readily compatible with routine industrial workflows.
In contrast, the present study specifically explores NIT spectroscopy, a modality already widely implemented in industrial grain analyzers. By operating in transmittance mode, NIT probes the entire kernel mass, potentially enhancing sensitivity to internal contamination processes that may not be detectable at the surface level. This distinction represents a relevant methodological advancement and fills a gap in the existing literature on Alternaria detection in durum wheat.
4.5. Practical Implications for Post-Harvest Management
From an applied perspective, the results clearly support the use of NIT spectroscopy as a pre-screening tool rather than a replacement for confirmatory analytical methods. In the proposed analytical workflow, NIT spectroscopy is intended as a first-level, non-destructive pre-screening tool, ELISA as a rapid laboratory-based screening method for toxin presence, and chromatographic techniques as confirmatory reference methods. In this context, NIT spectroscopy may be effectively integrated upstream of ELISA-based methods to prioritize suspect samples requiring confirmatory analysis [
12]. The high classification performance demonstrated here suggests that NIT can efficiently identify suspect wheat lots that warrant further investigation by ELISA or chromatographic techniques.
Such a tiered analytical strategy offers tangible benefits for post-harvest management, including reduced analytical costs, faster decision-making, and improved allocation of laboratory resources. In the context of Alternaria toxins, which are still under regulatory evaluation, early risk-based screening approaches are particularly valuable to support preventive control along the cereal supply chain.
4.6. Limitations and Future Perspectives
While the results of this study are promising, some limitations should be acknowledged. The experimental design was based on artificial inoculation under controlled conditions, which may not fully capture the complexity of natural field contamination. Further validation using naturally contaminated samples, larger datasets, and a broader range of storage conditions will be essential to assess model robustness and transferability.
In addition, it is important to consider the potential influence of grain moisture on the NIT spectral response. Due to the strong absorption of water in the near-infrared region, future studies should include rigorous model validation across varying moisture conditions to ensure robustness under real storage and processing scenarios. Furthermore, the heterogeneous (patchy) distribution of fungal contamination within grain lots represents a known limitation of point-based analytical methods such as ELISA. In this context, the NIT approach, by probing a larger volume of grain, may reduce sampling bias and improve the reliability of contamination detection at the batch level.
Future work should also explore the integration of NIT screening into inline or at-line monitoring systems and evaluate the feasibility of updating chemometric models to accommodate seasonal and geographical variability. Expanding calibration sets to include additional fungal species and mycotoxins could further enhance the utility of the approach within comprehensive grain safety programmes.
5. Conclusions
This study indicates that Near-Infrared Transmittance (NIT) spectroscopy can be used as a rapid and non-destructive pre-screening approach for assessing the presence of Alternaria contamination and associated alternariol risk in durum wheat kernels. Clear and reproducible spectral differences between inoculated and control samples were consistently observed in the 834–966 nm region, with very large effect sizes and excellent classification performance (AUC > 0.96), supporting the robustness of the method across different cultivars and incubation times. The multivariate consistency observed in PCA further reinforces the robustness of the proposed screening approach.
NIT spectral changes showed strong coherence with alternariol (AOH) accumulation measured by ELISA, indicating that the method is sensitive to biologically relevant alterations associated with fungal colonization and secondary metabolite production. Control experiments further demonstrated that the observed spectral signatures were not attributable to autoclaving or physical grain damage, supporting the specificity of the NIT response.
From a practical perspective, the results support the use of NIT spectroscopy as a pre-screening, decision-support tool in post-harvest wheat handling and storage, allowing rapid identification of suspect lots to be prioritized for confirmatory mycotoxin analysis. The use of transmittance mode, already implemented in industrial grain analyzers, enhances the feasibility of integrating this approach into routine quality control workflows without additional sample preparation or analytical burden.
Although further validation under field and industrial conditions is warranted, the findings of this study highlight the significant potential of NIT spectroscopy to contribute to improved mycotoxin risk management and safer, more sustainable cereal production systems.