
A Comparative Transcriptomic Analysis of miRNAs and Their Target Genes During the Formation of Melanin in Apis mellifera

 ,
,
Abstract
1. Introduction
2. Materials and Methods
2.1. Samples
2.2. Quality Control and Assessment of Sequencing Data
2.3. Screening of DEmiRNAs and Prediction of Target Genes
2.4. Differentially Expressed Target mRNAs and Their Functional Analysis
2.5. Stem-Loop RT-qPCR Validation of DEmiRNAs
3. Results
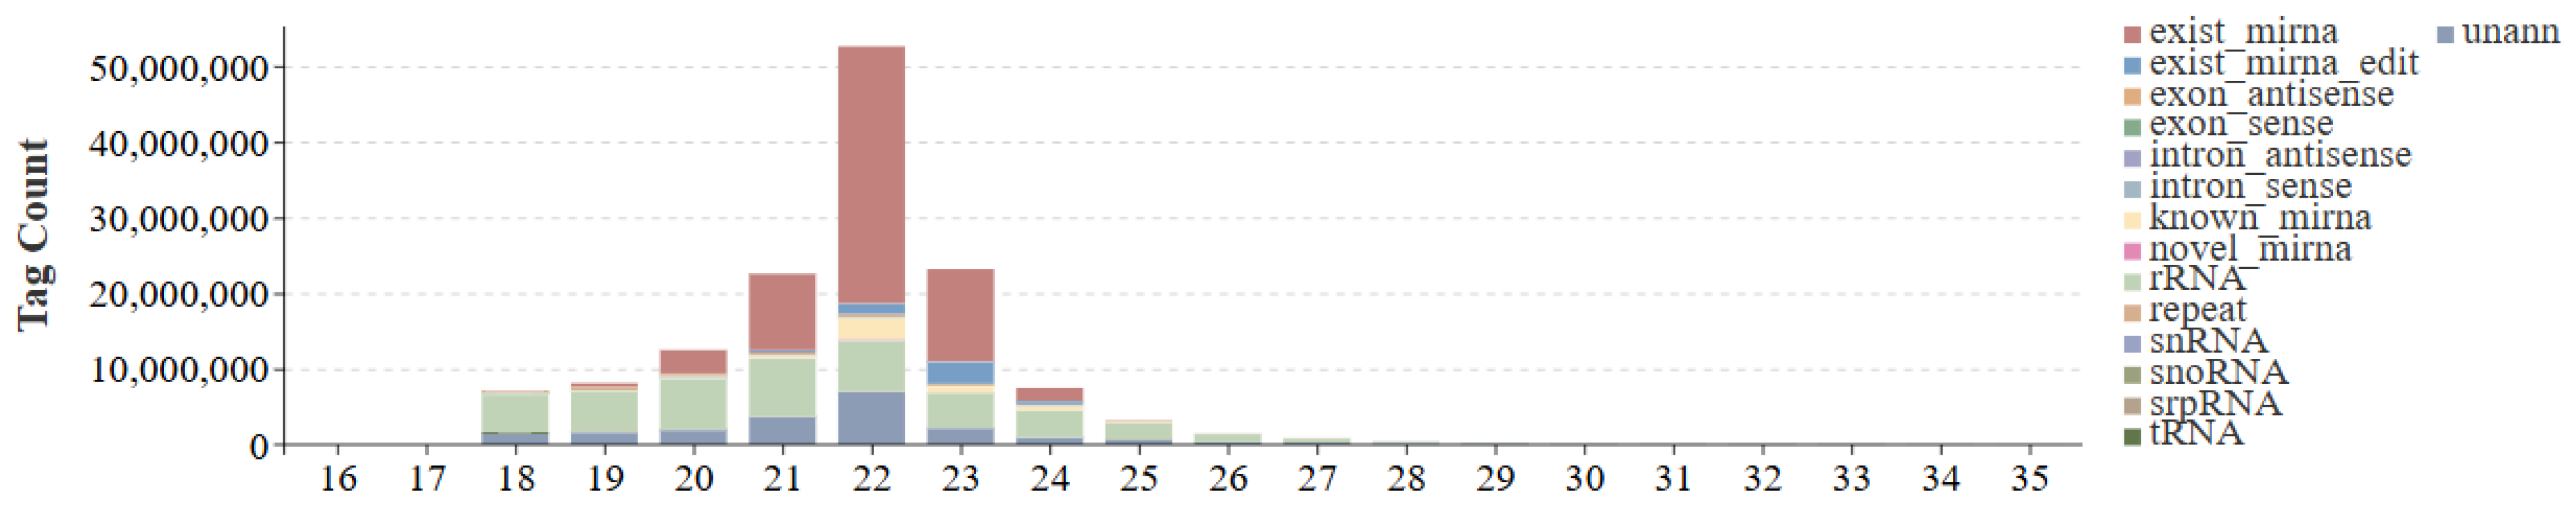
3.1. Small RNA Library Sequencing and Sequence Analysis
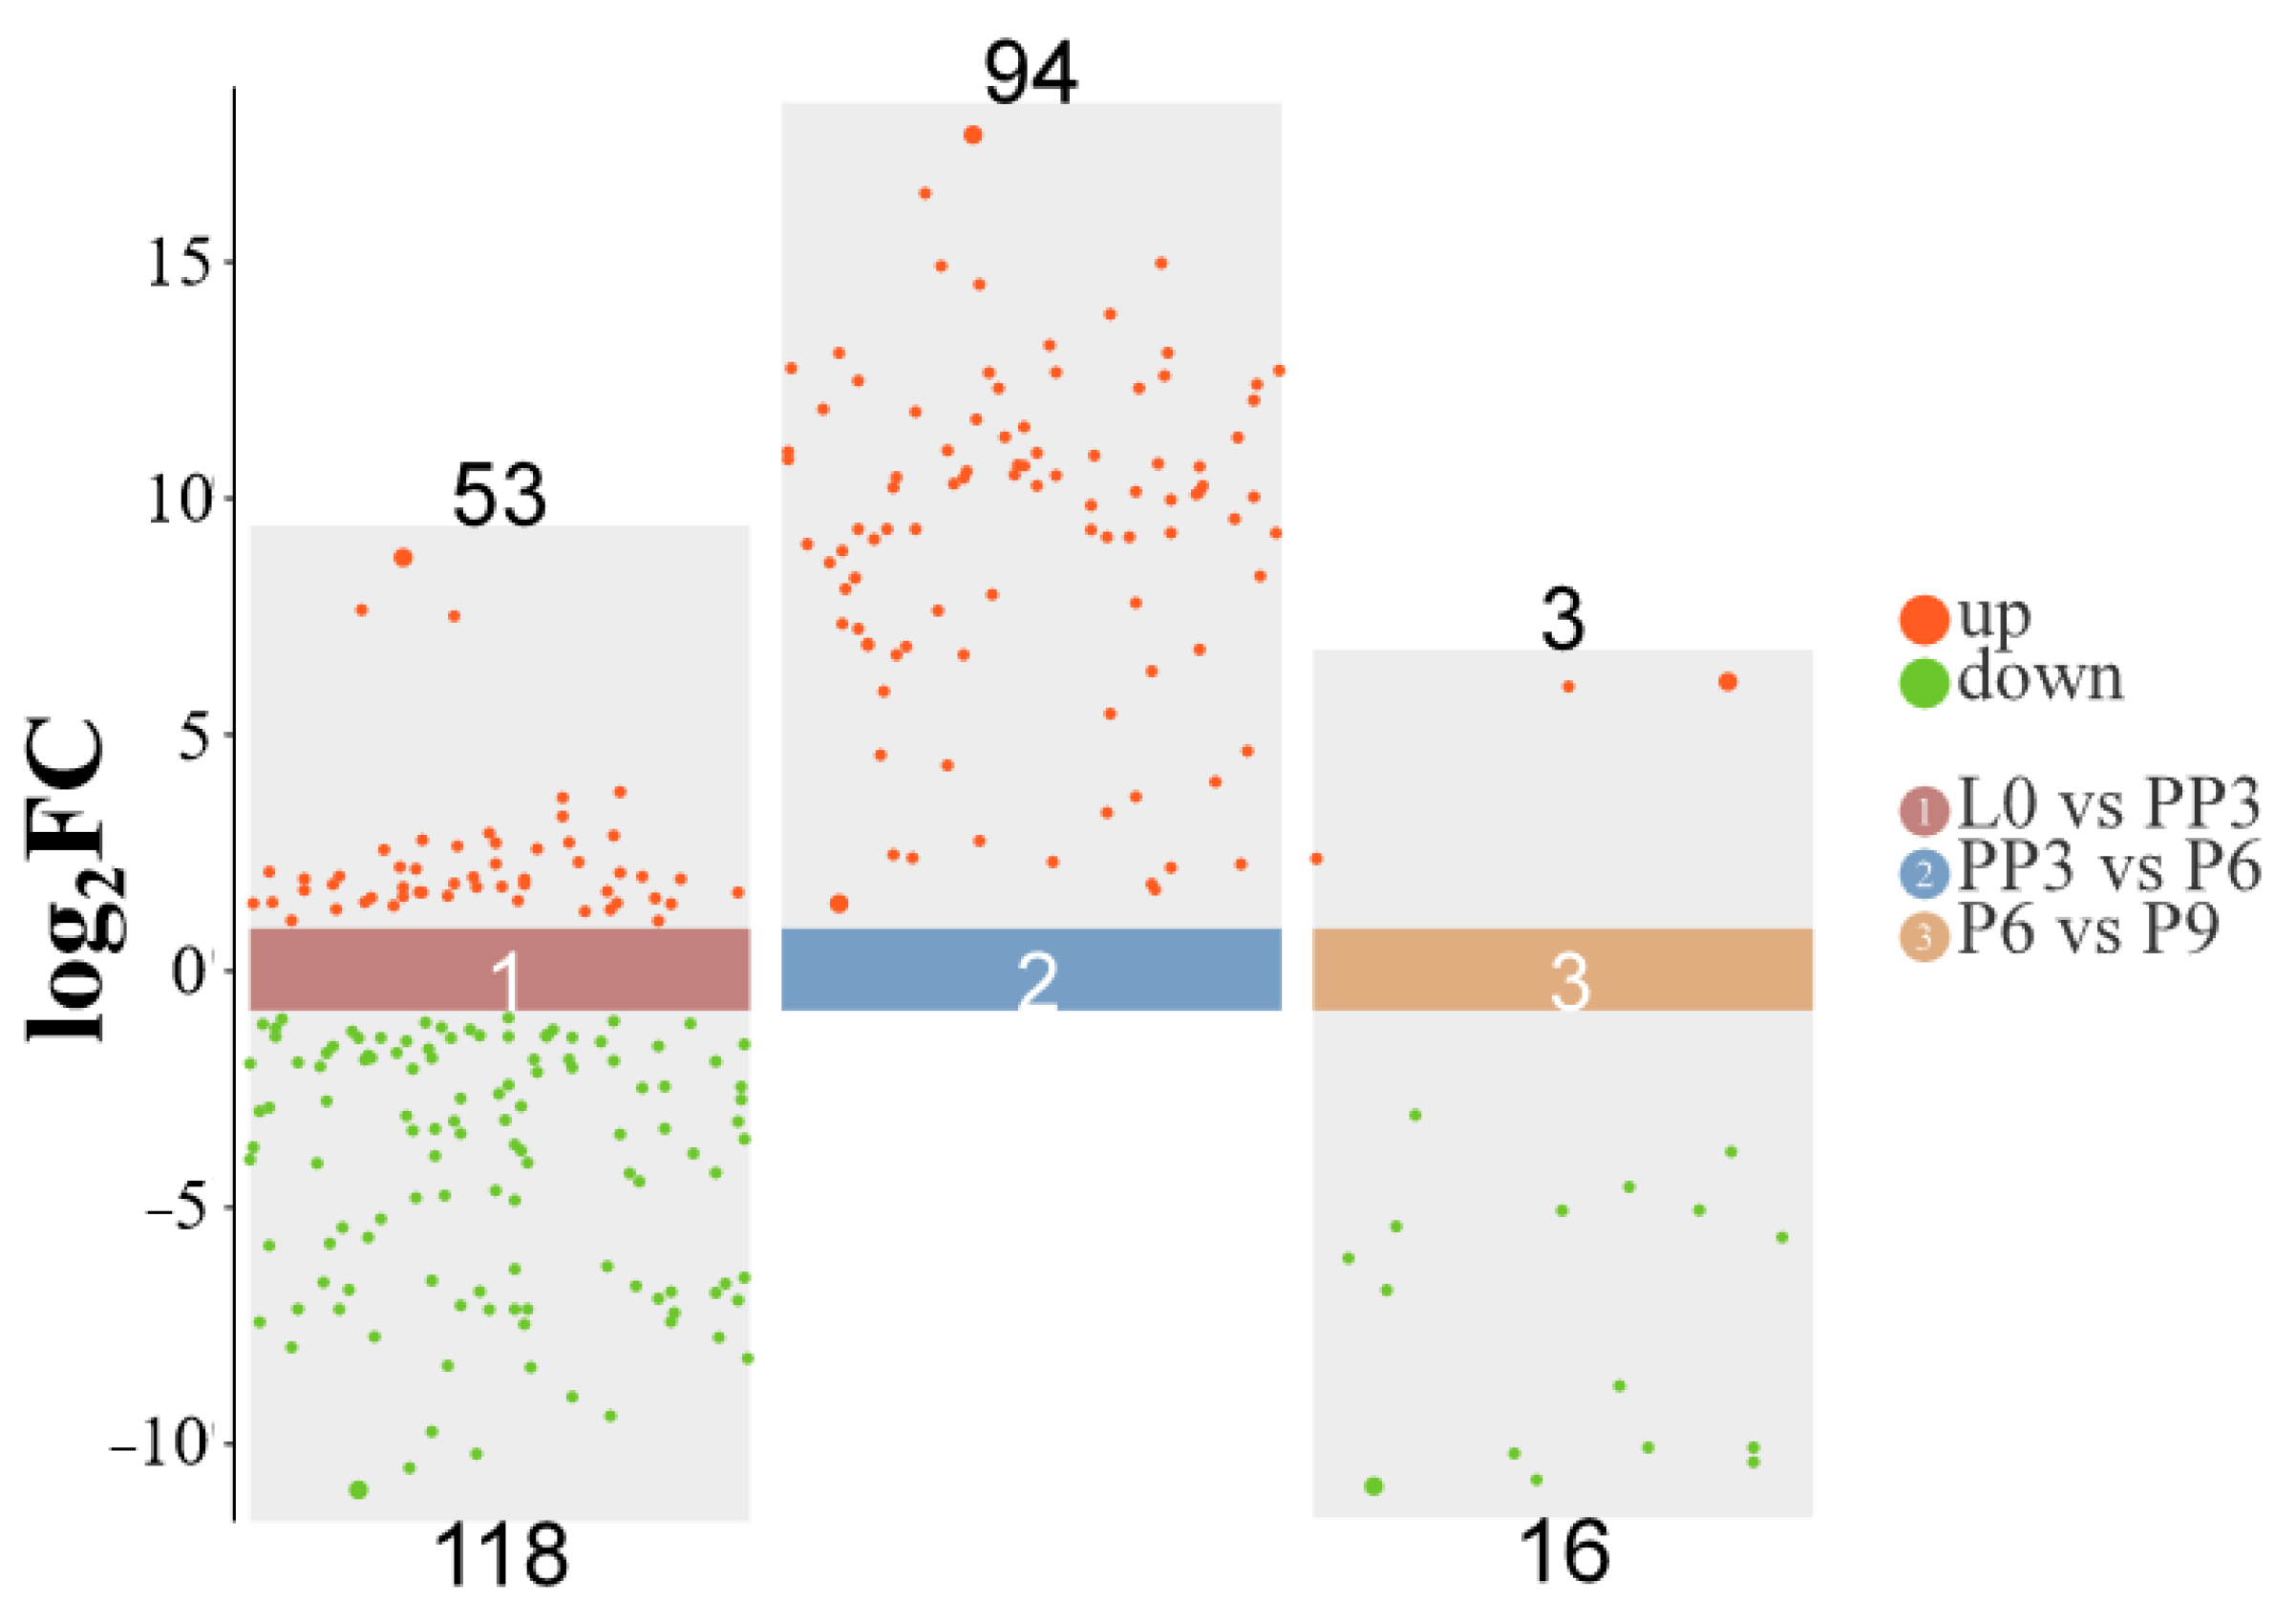
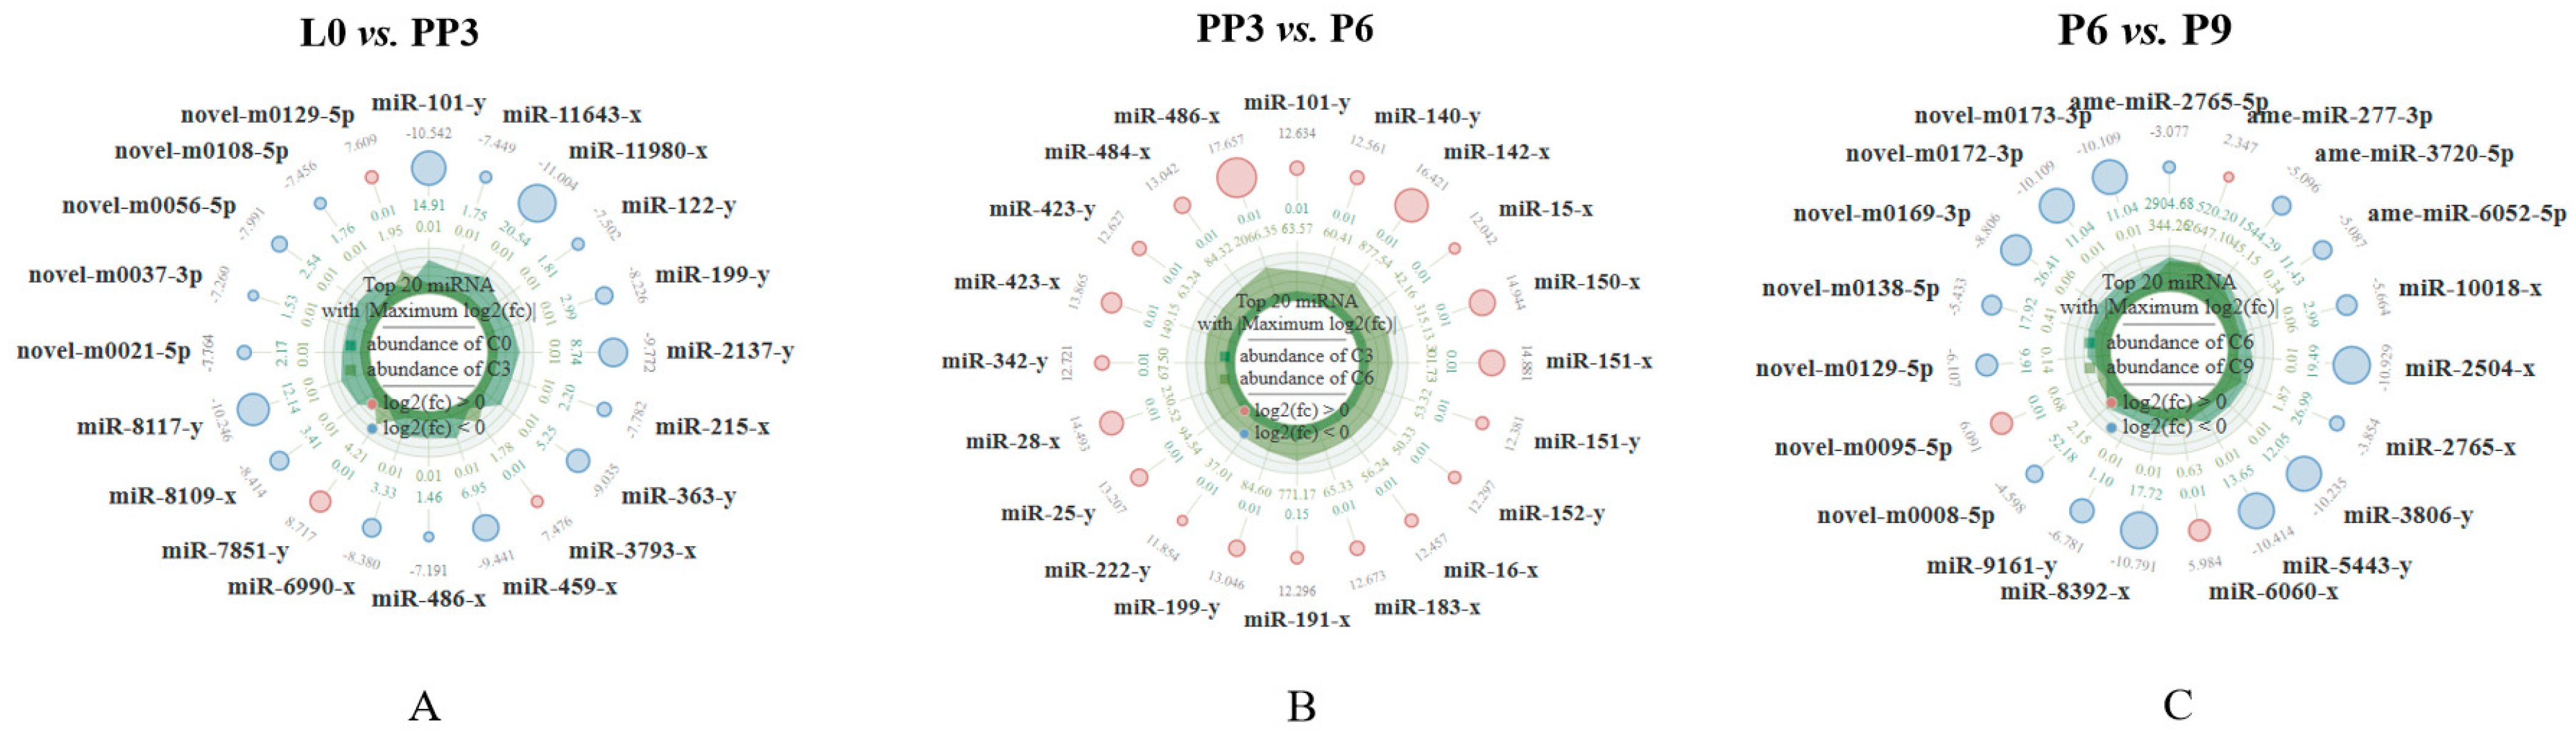
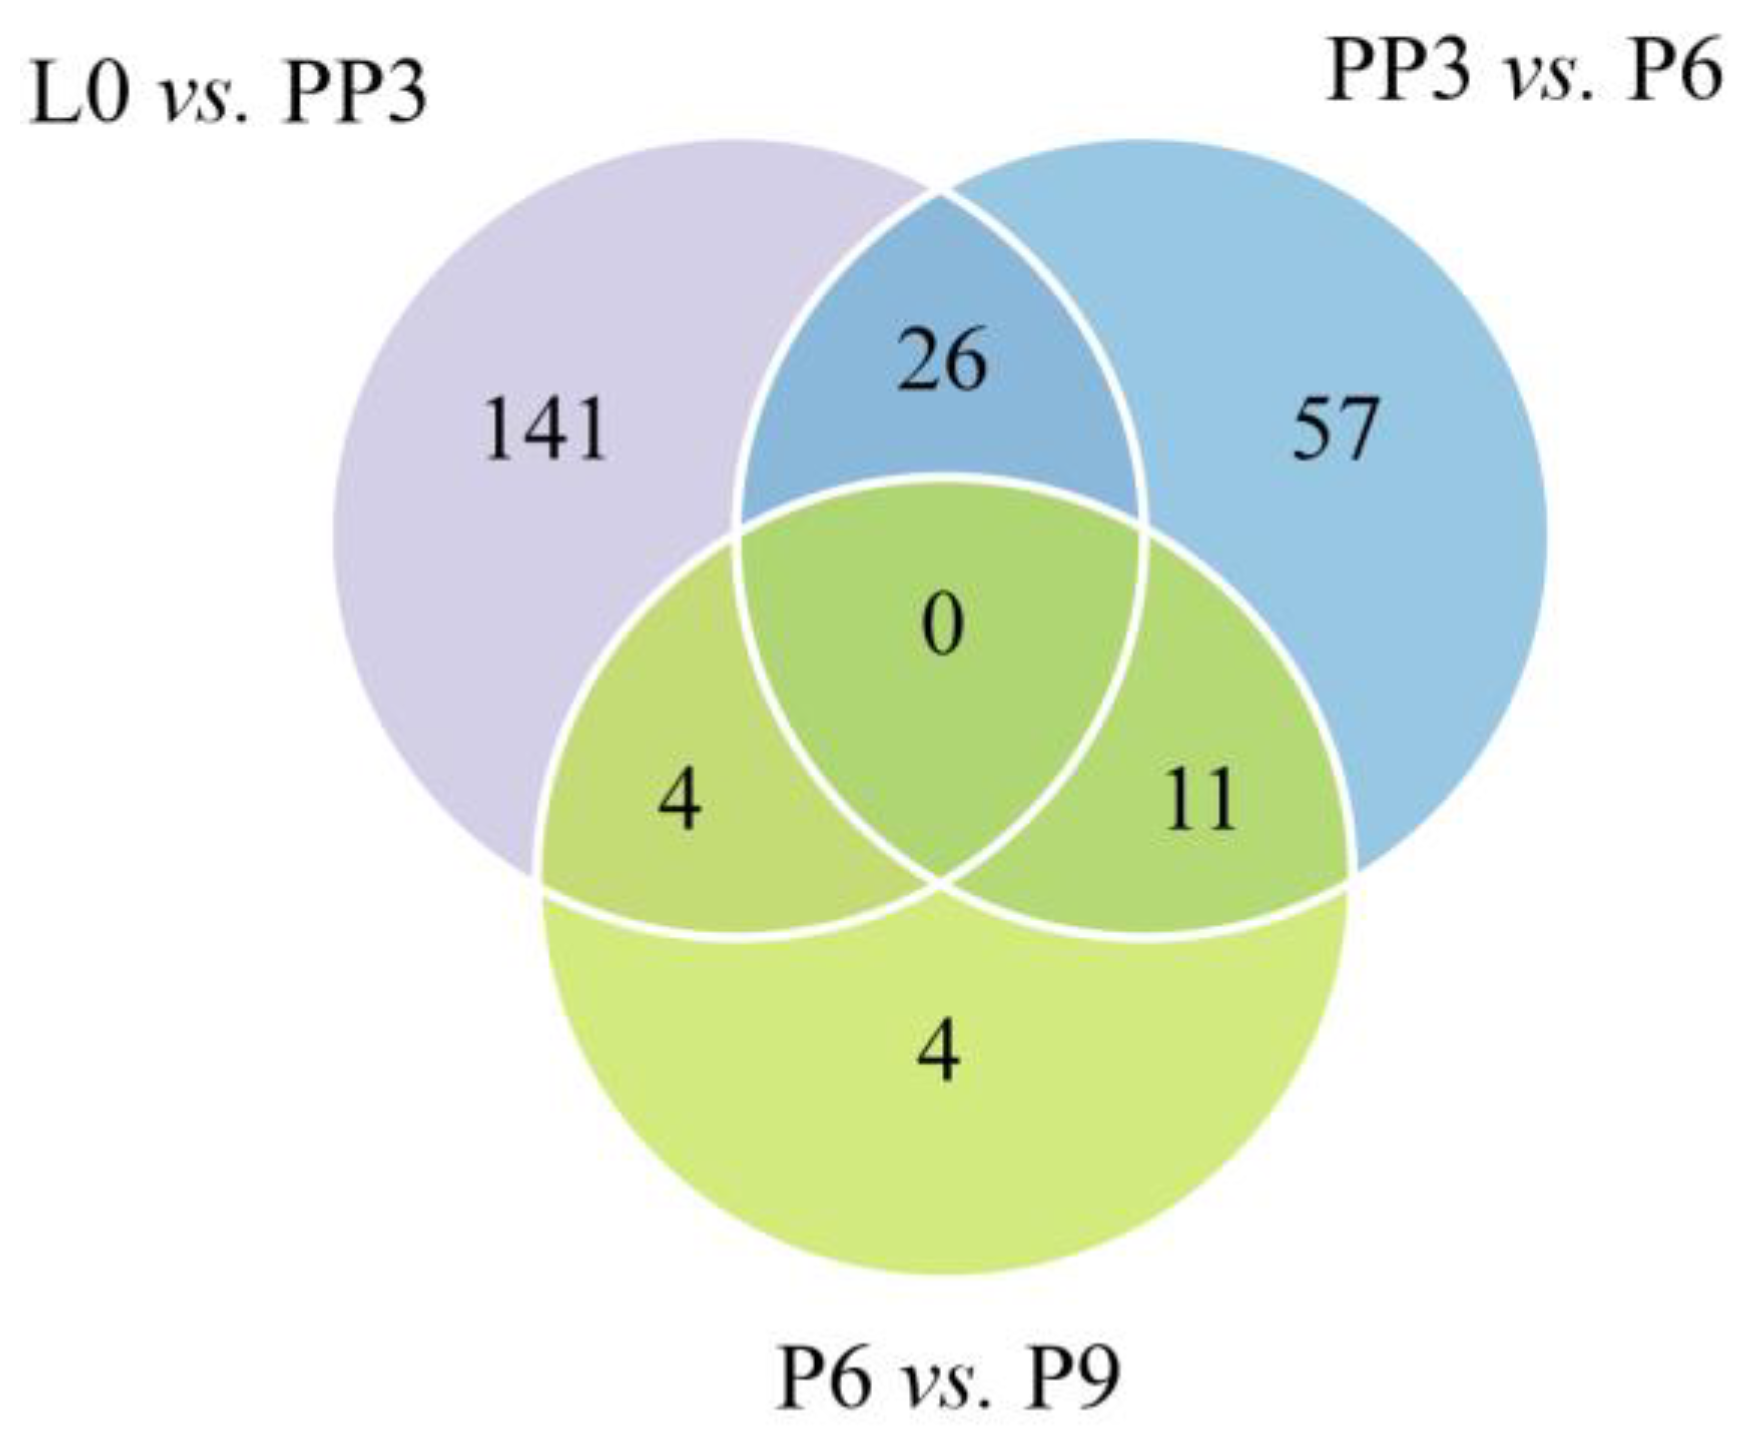
3.2. Analysis of Differentially Expressed miRNAs
3.3. Acquisition of Differentially Expressed Target mRNAs
3.4. Functional Analysis of Target DEmRNAs in Different Comparison Groups
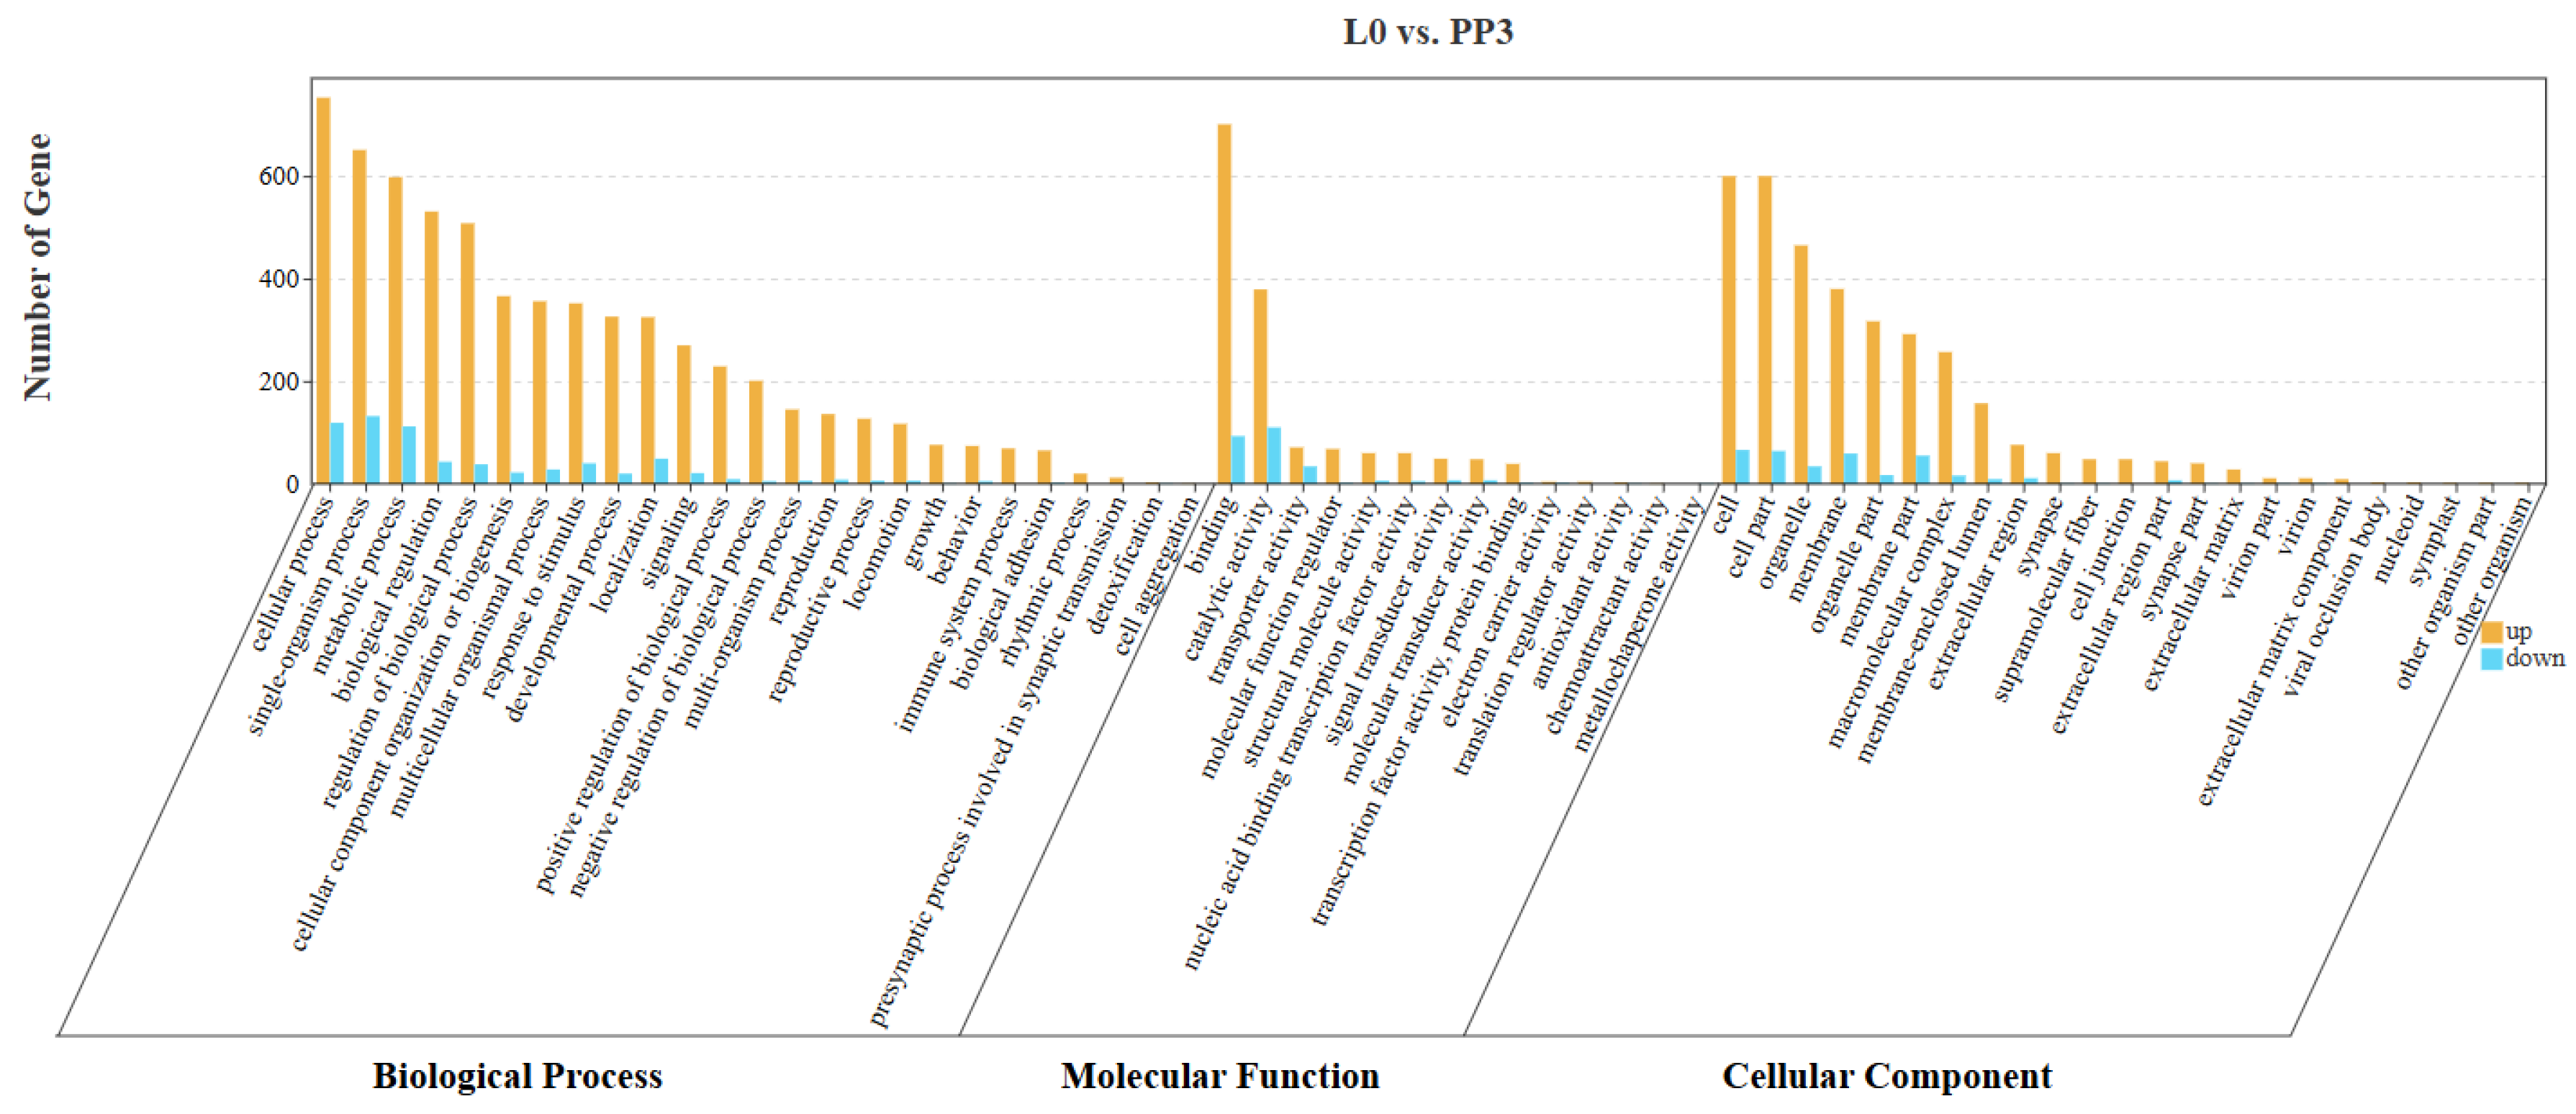
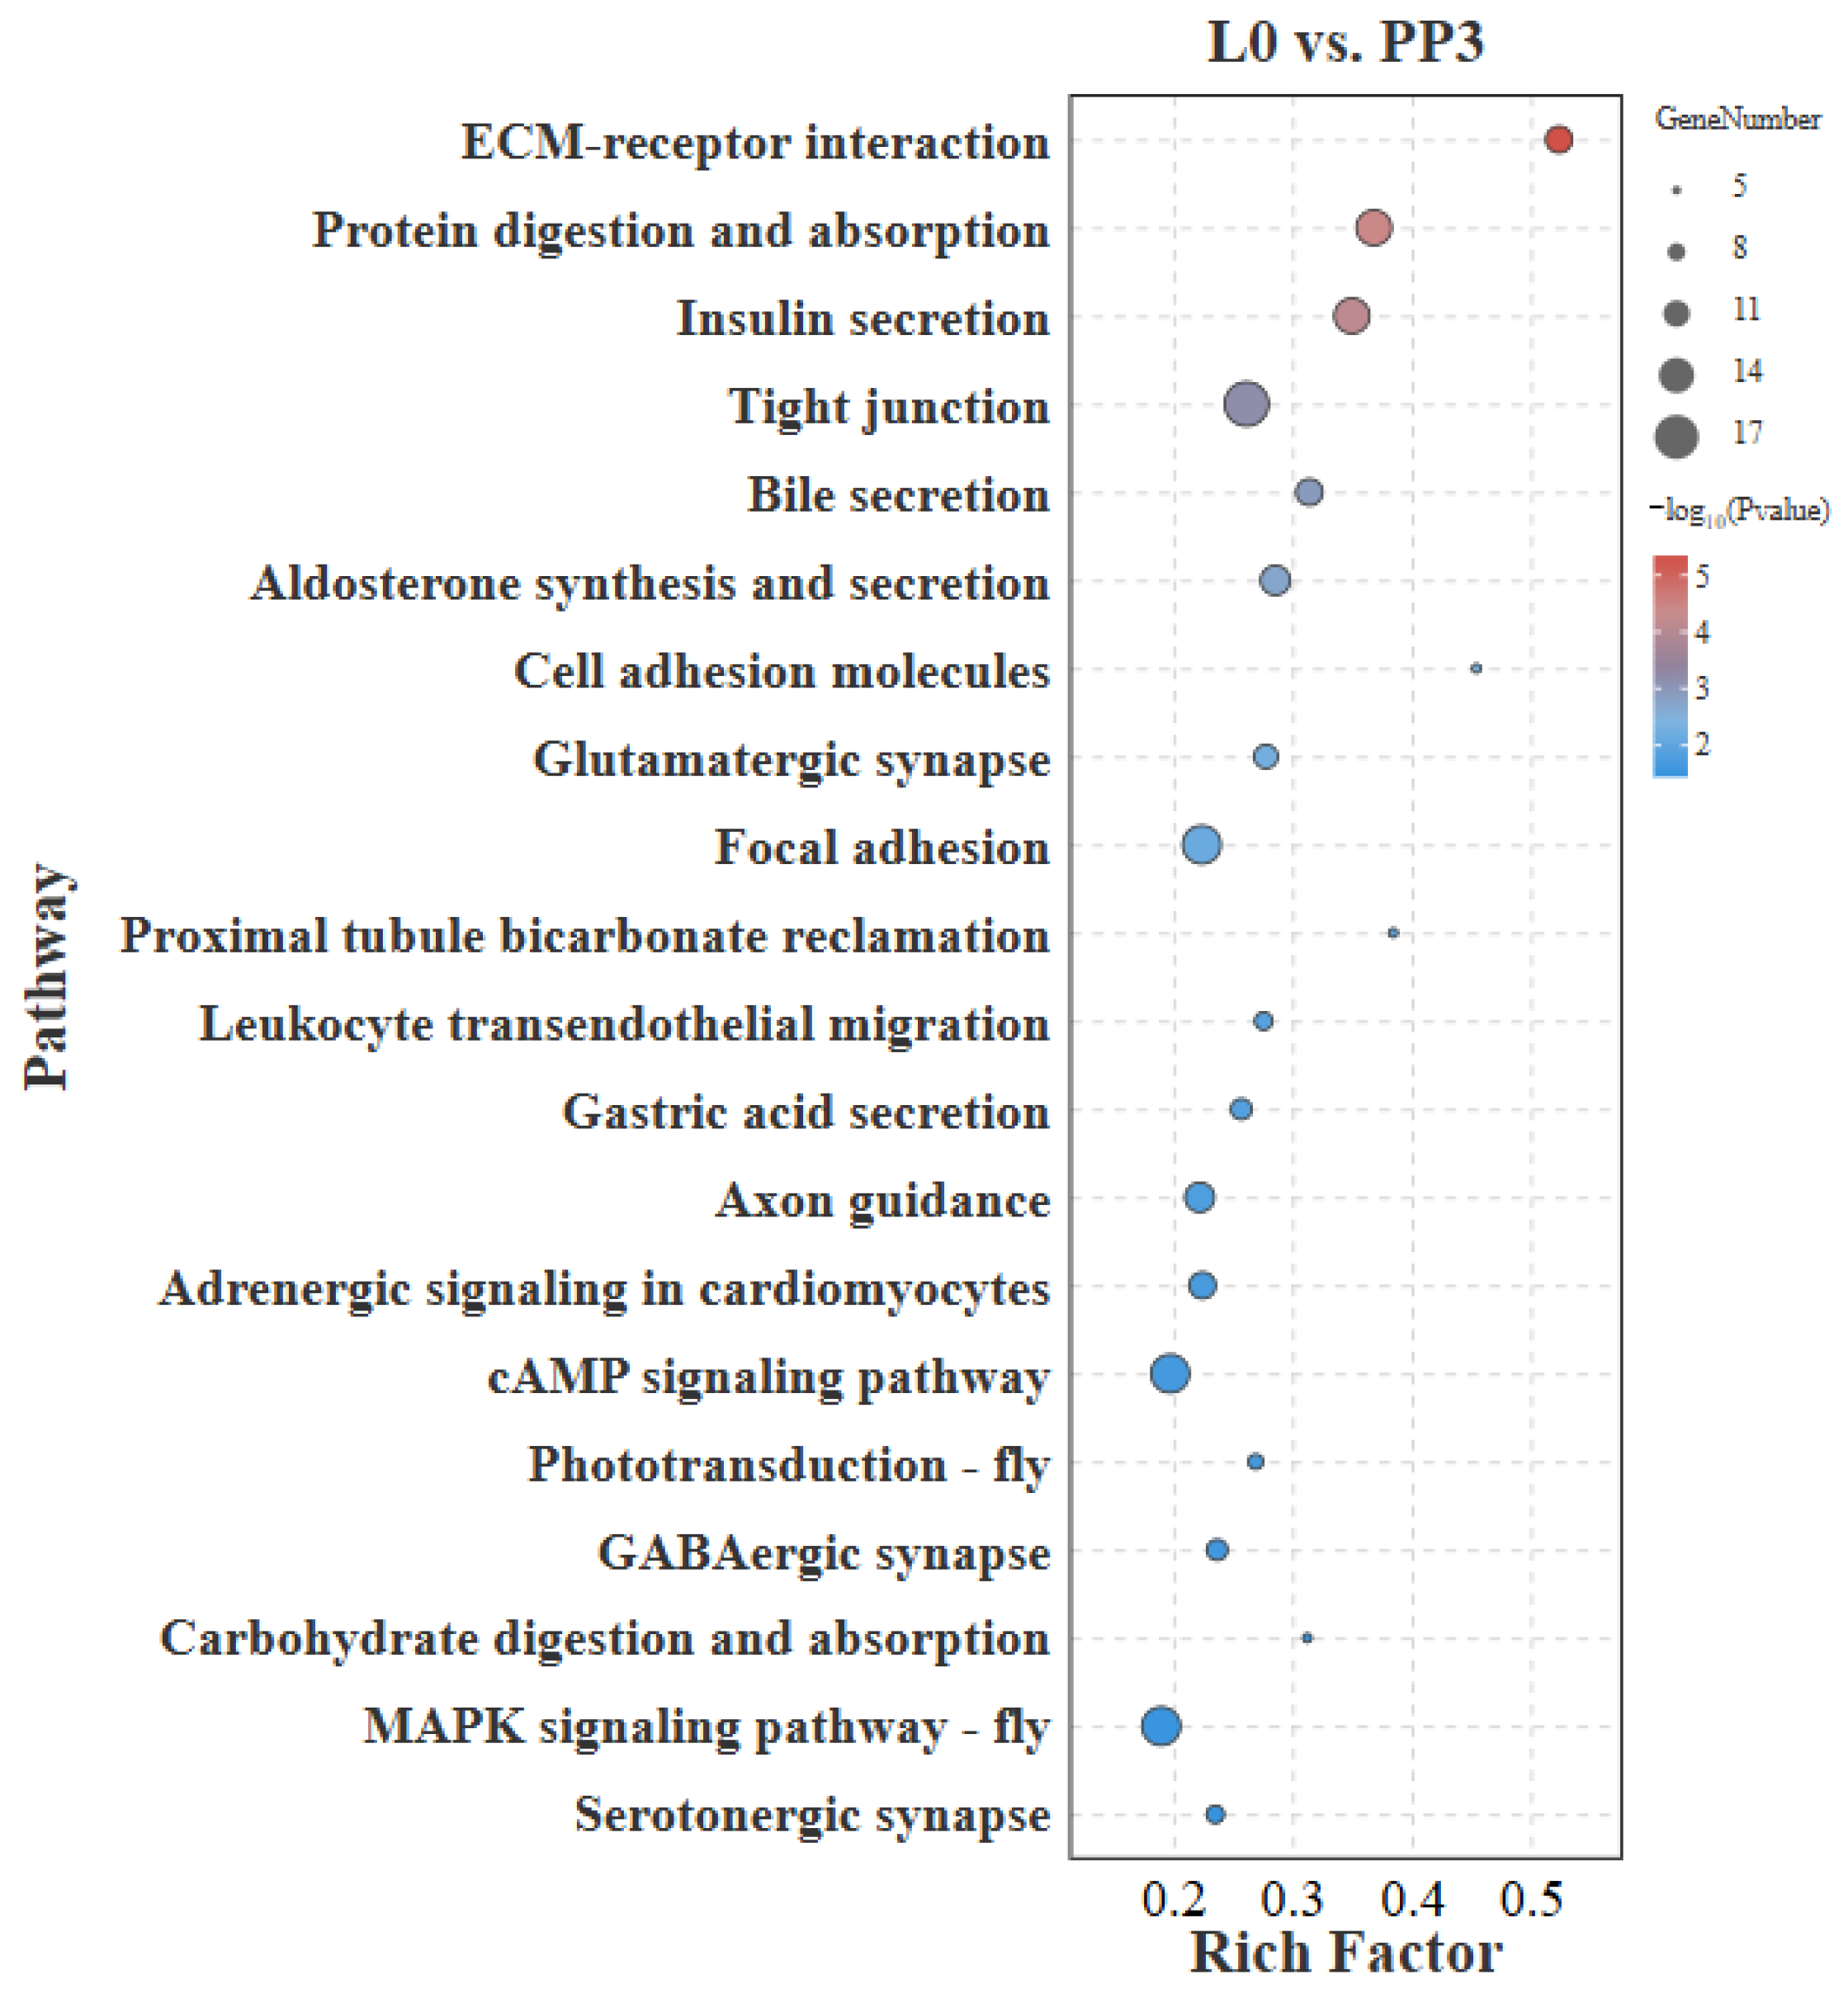
3.4.1. L0 vs. PP3
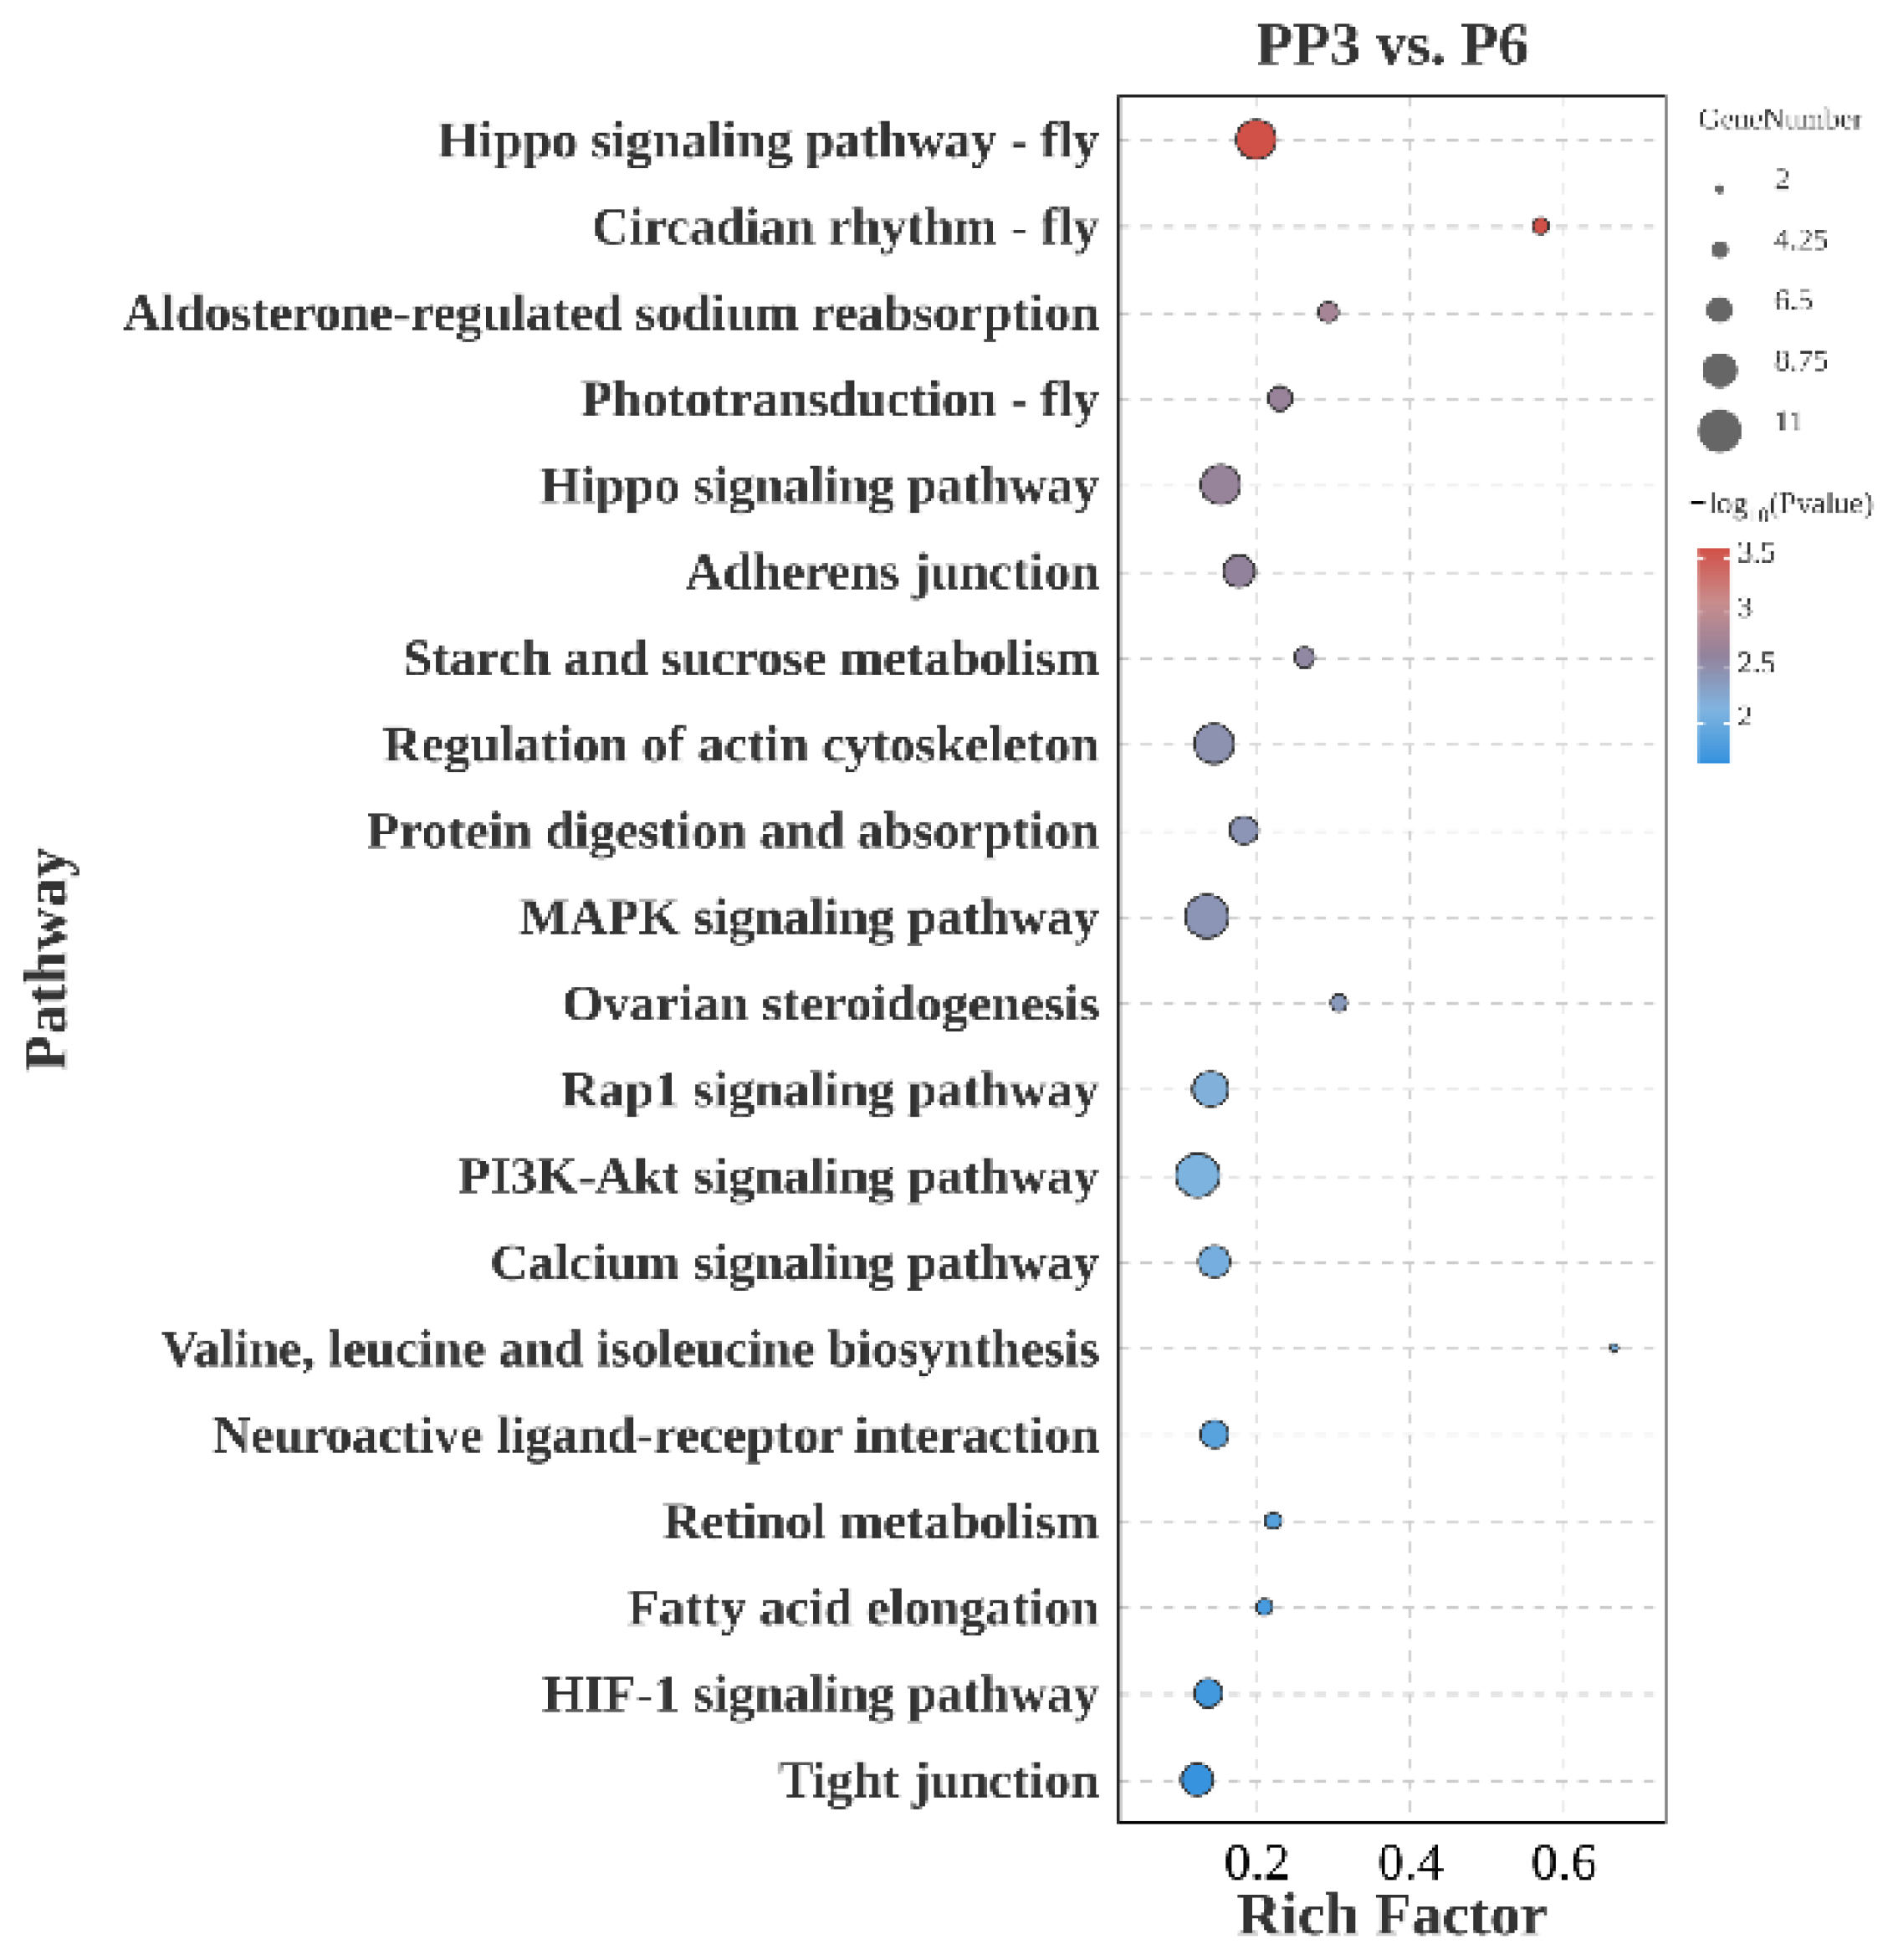
3.4.2. PP3 vs. P6
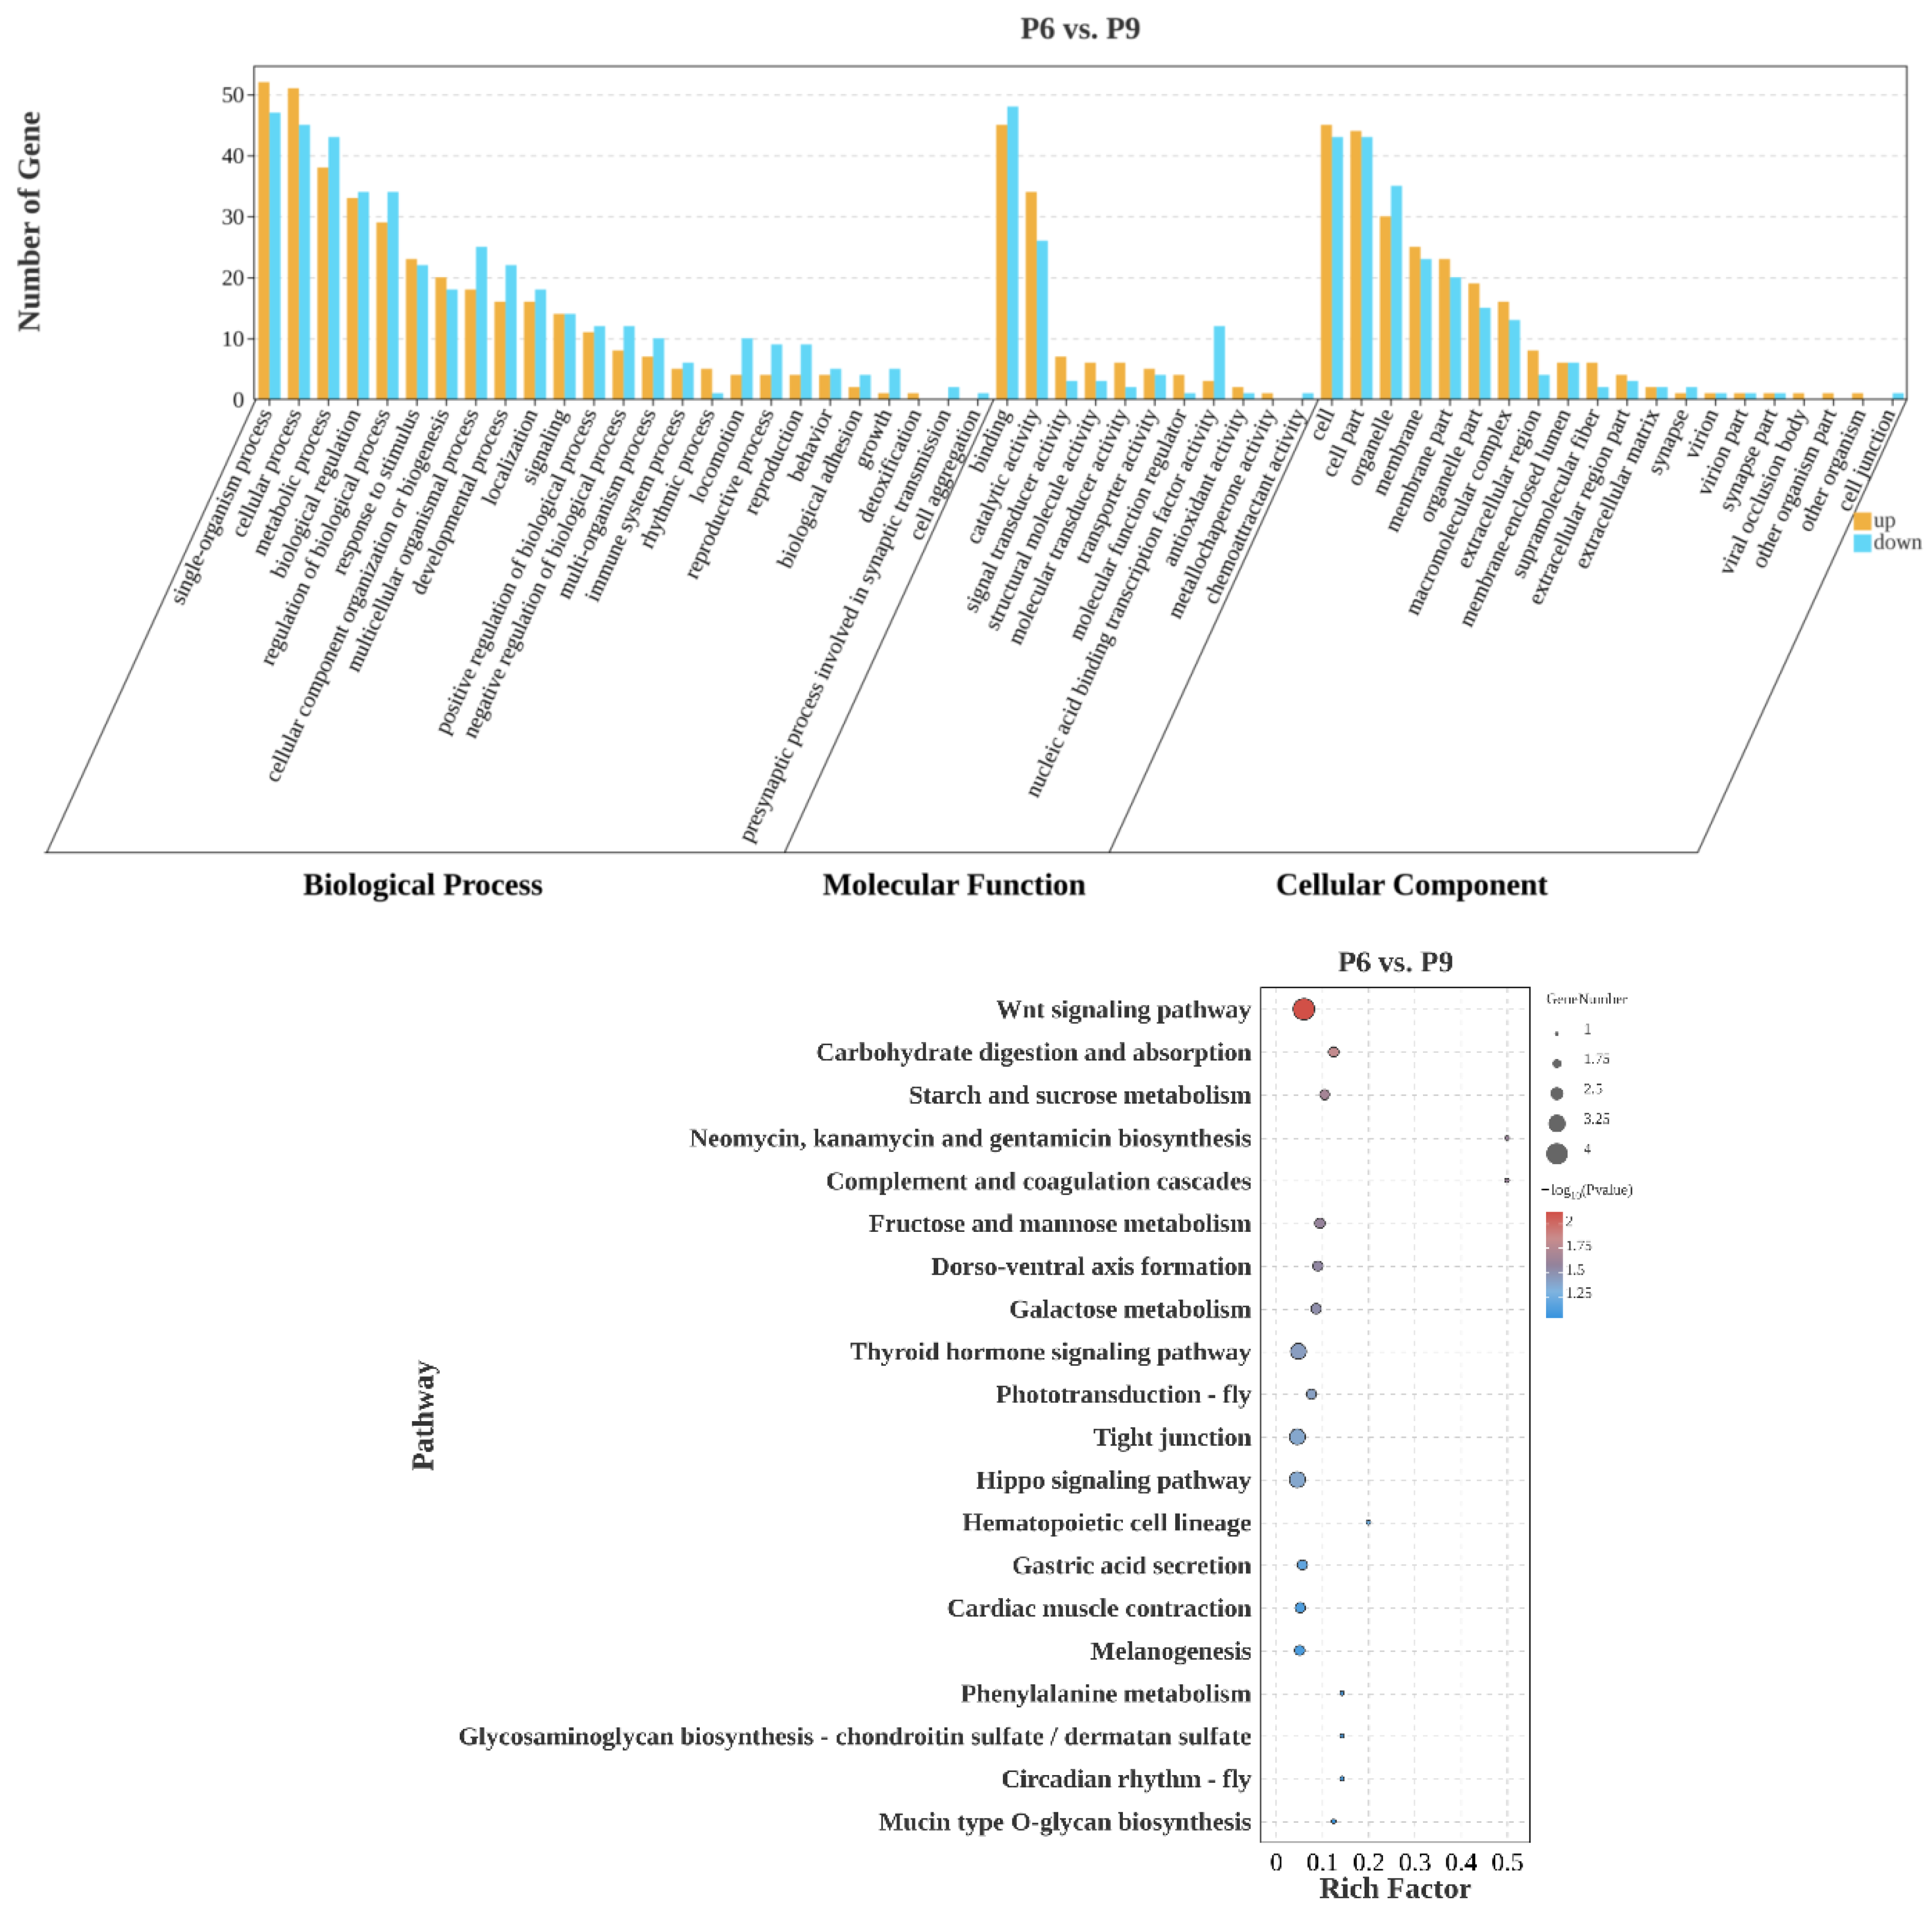
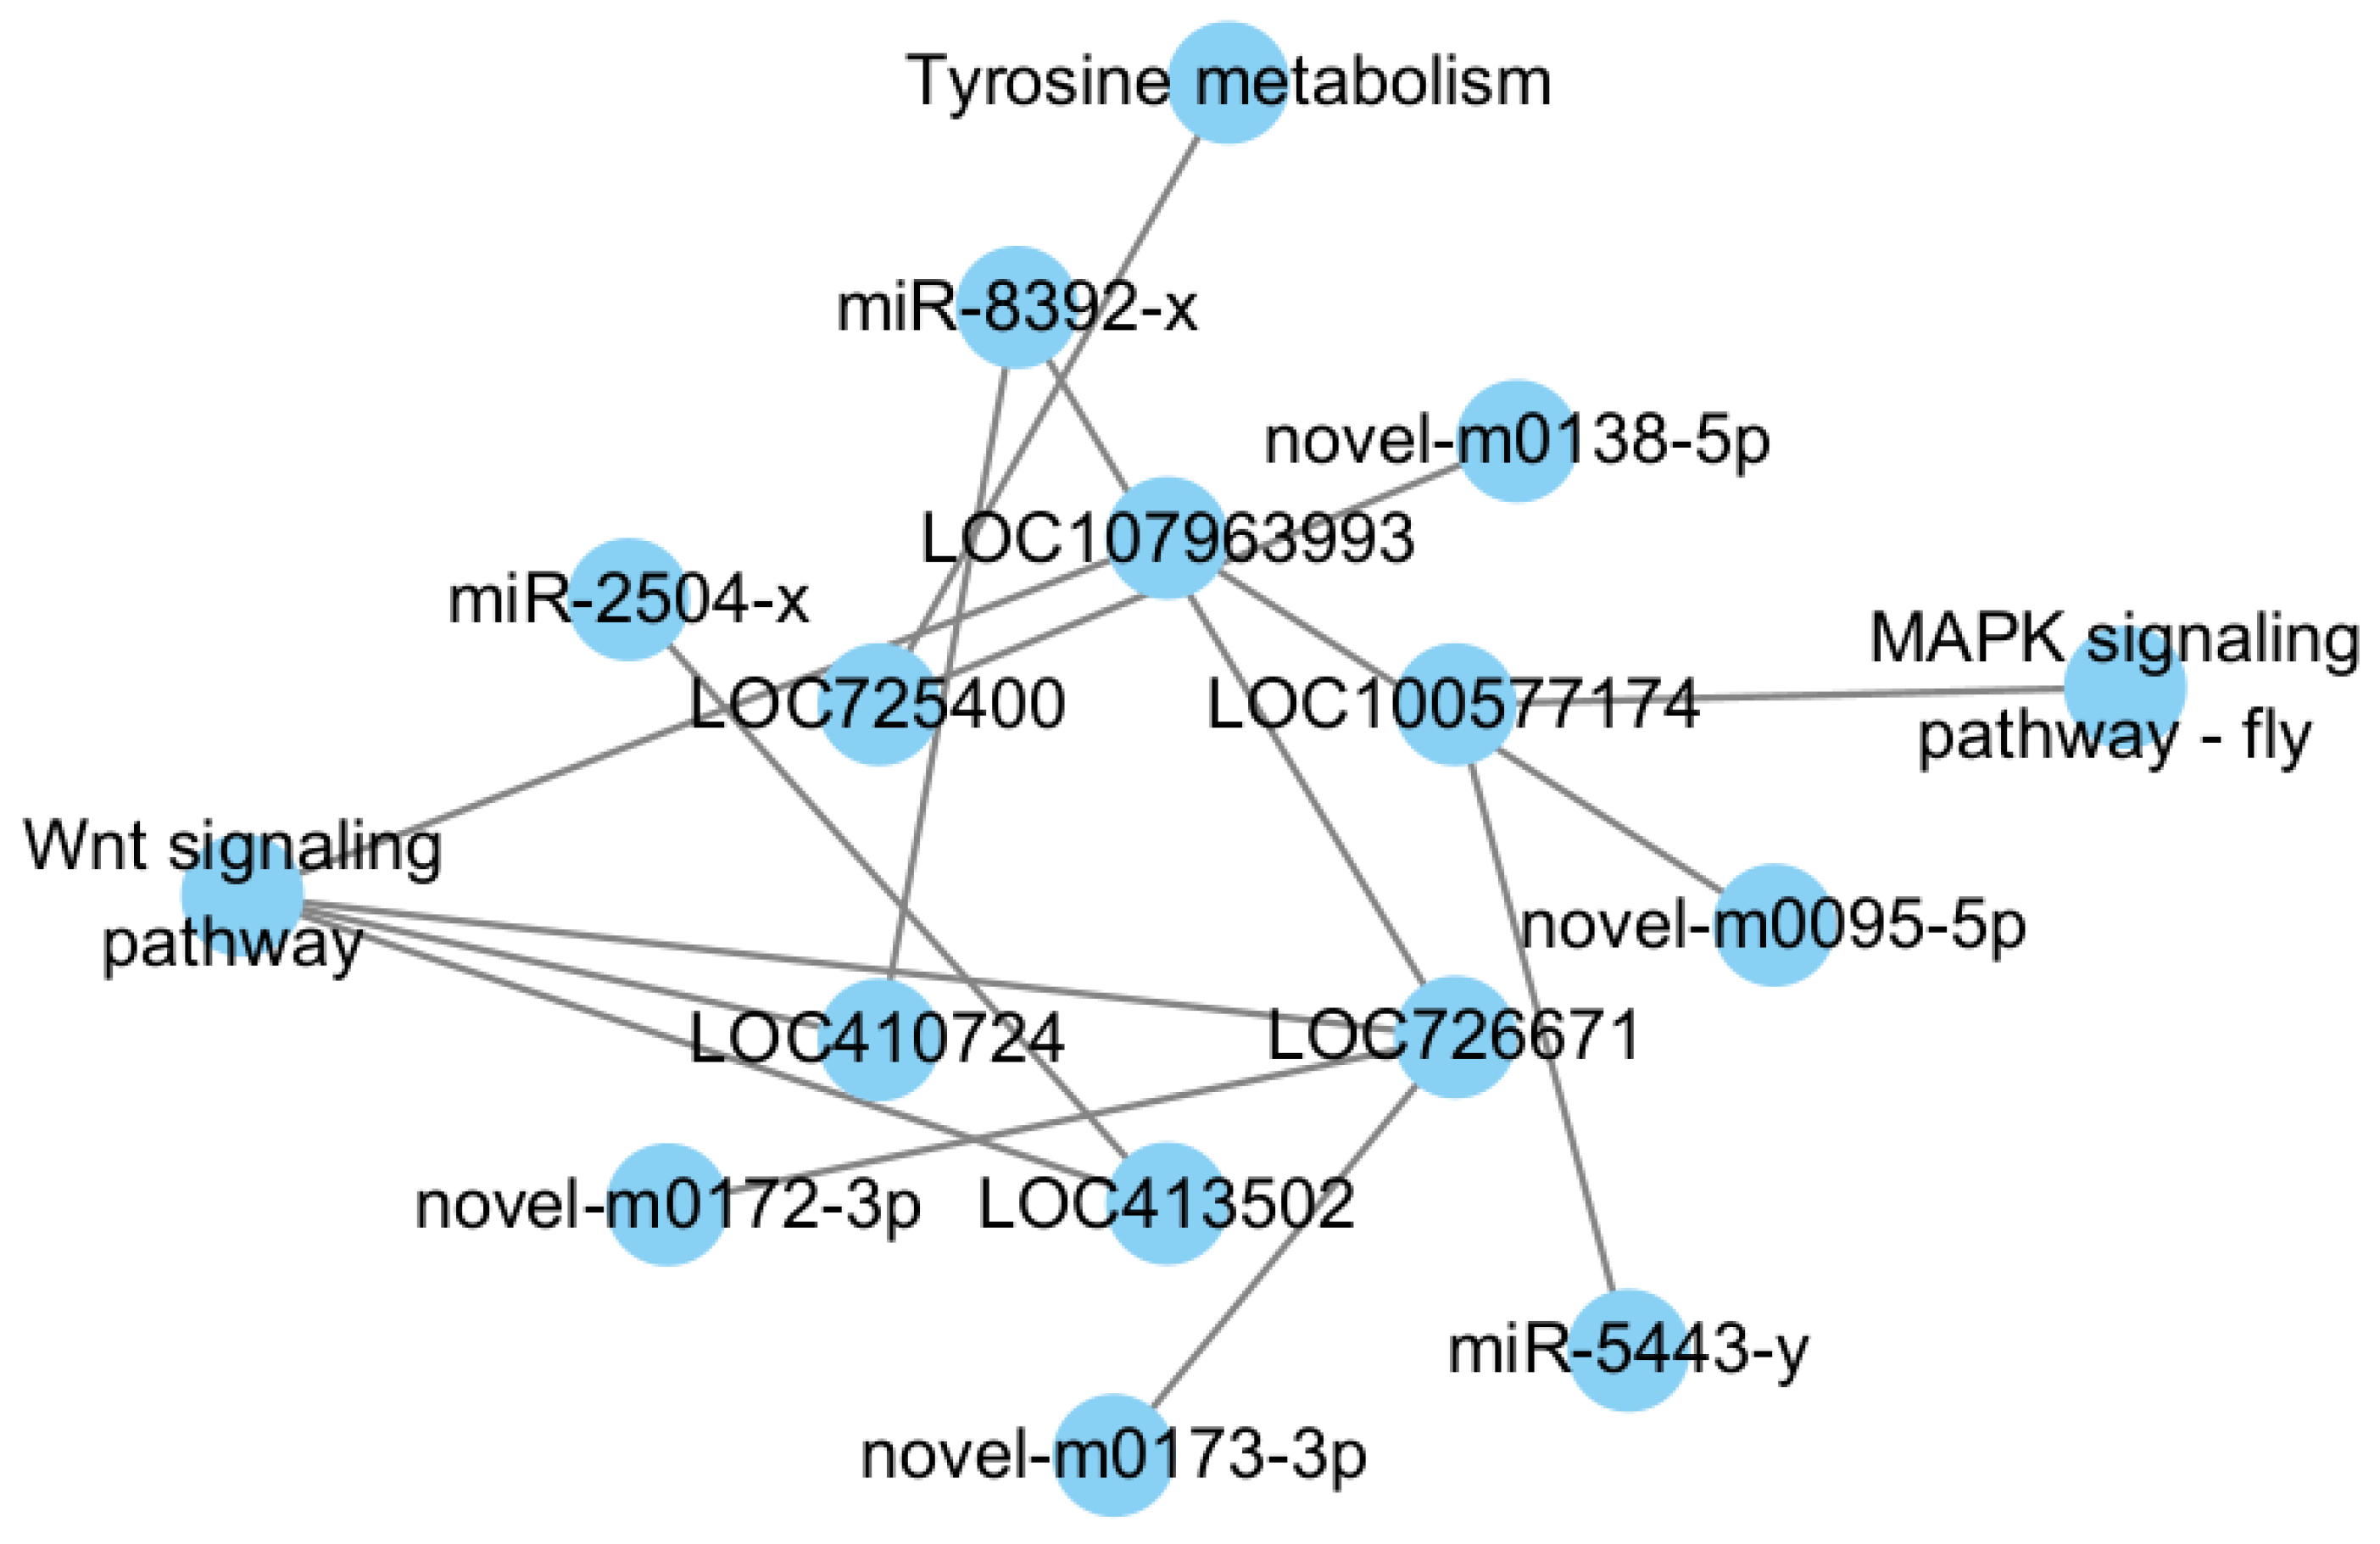
3.4.3. P6 vs. P9
3.5. RT-qPCR Analysis
4. Discussion
4.1. L0 vs. PP3
4.2. PP3 vs. P6
4.3. P6 vs. P9
5. Conclusions
Supplementary Materials
Author Contributions
Funding
Institutional Review Board Statement
Data Availability Statement
Acknowledgments
Conflicts of Interest
References
- Michie, L.J.; Mallard, F.; Majerus, M.E.; Jiggins, F.M. Melanic through nature or nurture: Genetic polymorphism and phenotypic plasticity in Harmonia axyridis. J. Evol. Biol. 2010, 23, 1699–1707. [Google Scholar] [CrossRef] [PubMed]
- Hegna, R.H.; Nokelainen, O.; Hegna, J.R.; Mappes, J. To quiver or to shiver: Increased melanization benefits thermoregulation, but reduces warning signal efficacy in the wood tiger moth. Proc. Biol. Sci. 2013, 280, 20122812. [Google Scholar] [CrossRef] [PubMed]
- Dubovskiy, I.M.; Whitten, M.M.; Kryukov, V.Y.; Yaroslavtseva, O.N.; Grizanova, E.V.; Greig, C.; Mukherjee, K.; Vilcinskas, A.; Mitkovets, P.V.; Glupov, V.V.; et al. More than a colour change: Insect melanism, disease resistance and fecundity. Proc. Biol. Sci. 2013, 280, 20130584. [Google Scholar] [CrossRef]
- Mazzei, M.; Fronte, B.; Sagona, S.; Carrozza, M.L.; Forzan, M.; Pizzurro, F.; Bibbiani, C.; Miragliotta, V.; Abramo, F.; Millanta, F.; et al. Effect of 1,3-1,6 β-Glucan on Natural and Experimental Deformed Wing Virus Infection in Newly Emerged Honeybees (Apis mellifera ligustica). PLoS ONE 2016, 11, e0166297. [Google Scholar] [CrossRef] [PubMed]
- Tsuchida, T.; Koga, R.; Horikawa, M.; Tsunoda, T.; Maoka, T.; Matsumoto, S.; Simon, J.C.; Fukatsu, T. Symbiotic Bacterium Modifies Aphid Body Color. Science 2010, 330, 1102–1104. [Google Scholar] [CrossRef]
- Berry, R.J. Industrial melanism and peppered moth (Biston betularia L). Biol. J. Linn. Soc. 1990, 39, 301–322. [Google Scholar] [CrossRef]
- Hu, Y.G.; Shen, Y.H.; Zhang, Z.; Shi, G.Q. Melanin and urate act to prevent ultraviolet damage in the integument of the silkworm, Bombyx mori. Arch. Insect. Biochem. Physiol. 2013, 83, 41–55. [Google Scholar] [CrossRef]
- Loayza-Muro, R.A.; Marticorena-Ruíz, J.K.; Palomino, E.J.; Merritt, C.; Breeuwer, J.A.J.; Kuperus, P.; Kraak, M.H.S.; Admiraal, W. Ultraviolet-B-driven pigmentation and genetic diversity of benthic macroinvertebrates from high-altitude Andean streams. Freshw. Biol. 2013, 58, 1710–1719. [Google Scholar] [CrossRef]
- Ramniwas, S.; Kajla, B.; Dev, K.; Parkash, R. Direct and correlated responses to laboratory selection for body melanisation in Drosophila melanogaster: Support for the melanisation-desiccation resistance hypothesis. J. Exp. Biol. 2013, 216, 1244–1254. [Google Scholar]
- Whitten, M.M.A.; Coates, C.J. Re-evaluation of insect melanogenesis research: Views from the dark side. Pigment Cell Melanoma Res. 2017, 30, 386–401. [Google Scholar] [CrossRef]
- Luz, G.F.D.; Santana, W.C.; Santos, C.G.; Medeiros Santana, L.; Serrão, J.E. Cuticle melanization and the expression of immune-related genes in the honeybee Apis mellifera (Hymenoptera: Apidae) adult workers. Comp. Biochem. Physiol. B Biochem. Mol. Biol. 2022, 257, 110679. [Google Scholar] [CrossRef]
- Dubovskiy, I.M.; Kryukova, N.A.; Glupov, V.V.; Ratcliffe, N.A. Encapsulation and nodulation in insects. Invertebr. Surviv. J. 2016, 13, 229–246. [Google Scholar]
- Wightman, B.; Ha, I.; Ruvkun, G. Posttranscriptional regulation of the heterochronic gene lin-14 by lin-4 mediates temporal pattern formation in C. elegans. Cell 1993, 75, 855–862. [Google Scholar] [CrossRef] [PubMed]
- Reinhart, B.J.; Slack, F.J.; Basson, M.; Pasquinelli, A.E.; Bettinger, J.C.; Rougvie, A.E.; Horvitz, H.R.; Ruvkun, G. The 21-nucleotide let-7 RNA regulates developmental timing in Caenorhabditis elegans. Nature 2000, 403, 901–906. [Google Scholar] [CrossRef] [PubMed]
- Bartel, D.P. MicroRNAs: Target recognition and regulatory functions. Cell 2009, 136, 215–233. [Google Scholar] [CrossRef]
- Smibert, P.; Lai, E.C. A view from Drosophila: Multiple biological functions for individual microRNAs. Semin. Cell Dev. Biol. 2010, 21, 745–753. [Google Scholar] [CrossRef]
- Chen, X.; Xiao, D.; Du, X.; Guo, X.; Zhang, F.; Desneux, N.; Zang, L.; Wang, S. The Role of the Dopamine Melanin Pathway in the Ontogeny of Elytral Melanization in Harmonia axyridis. Front. Physiol. 2019, 10, 1066. [Google Scholar] [CrossRef]
- Wang, Q.; Zhong, L.; Wang, Y.; Zheng, S.; Bian, Y.; Du, J.; Yang, R.; Liu, W.; Qin, L. Tyrosine Hydroxylase and DOPA Decarboxylase Are Associated With Pupal Melanization During Larval-Pupal Transformation in Antheraea pernyi. Front. Physiol. 2022, 13, 832730. [Google Scholar] [CrossRef]
- True, J.R.; Edwards, K.A.; Yamamoto, D.; Carroll, S.B. Drosophila wing melanin patterns form by vein-dependent elaboration of enzymatic prepatterns. Curr. Biol. 1999, 9, 1382–1391. [Google Scholar] [CrossRef]
- Elias-Neto, M.; Soares, M.P.M.; Simoes, Z.L.P.; Hartfelder, K.; Bitondi, M.M. Developmental characterization, function and regulation of a Laccase2 encoding gene in the honey bee, Apis mellifera (Hymenoptera, Apinae). Insect. Biochem. Mol. Biol. 2010, 40, 241–251. [Google Scholar] [CrossRef]
- Arakane, Y.; Noh, M.Y.; Asano, T.; Kramer, K.J. Tyrosine Metabolism for Insect Cuticle Pigmentation and Sclerotization; Springer International Publishing: Cham, Switzerland, 2016; pp. 165–220. [Google Scholar]
- Barek, H.; Sugumaran, M.; Ito, S.; Wakamatsu, K. Insect cuticular melanins are distinctly different from those of mammalian epidermal melanins. Pigment. Cell Melanoma Res. 2018, 31, 384–392. [Google Scholar] [CrossRef] [PubMed]
- Kennell, J.A.; Cadigan, K.M.; Shakhmantsir, I.; Waldron, E.J. The microRNA miR-8 is a positive regulator of pigmentation and eclosion in Drosophila. Dev. Dyn. 2012, 241, 161–168. [Google Scholar] [CrossRef]
- Tian, S.; Asano, Y.; Das Banerjee, T.; Komata, S.; Wee, J.L.Q.; Lamb, A.; Wang, Y.; Murugesan, S.N.; Fujiwara, H.; Ui-Tei, K.; et al. A microRNA is the effector gene of a classic evolutionary hotspot locus. Science 2024, 386, 1135–1141. [Google Scholar] [CrossRef]
- Guo, X.; Kang, L. Phenotypic Plasticity in Locusts: Trade-Off Between Migration and Reproduction. Annu. Rev. Entomol. 2025, 70, 23–44. [Google Scholar] [CrossRef] [PubMed]
- Abdelmawla, A.; Yang, C.; Li, X.; Li, M.; Li, C.L.; Liu, Y.B.; He, X.J.; Zeng, Z.J. Feeding Asian honeybee queens with European honeybee royal jelly alters body color and expression of related coding and non-coding RNAs. Front. Physiol. 2023, 14, 1073625. [Google Scholar] [CrossRef] [PubMed]
- Yang, M.; Wei, Y.; Jiang, F.; Wang, Y.; Guo, X.; He, J.; Kang, L. MicroRNA-133 inhibits behavioral aggregation by controlling dopamine synthesis in locusts. PLoS Genet. 2014, 10, e1004206. [Google Scholar] [CrossRef]
- Wang, Q. Effect of Low-Temperature Stress on Worker Capped Brood Development and Its Mechanism in Honey Bees (Apis mellifera ligustica). Ph.D. Dissertation, Fujian Agriculture and Forestry University, Fuzhou, China, 2016. (In Chinese). [Google Scholar]
- Wang, Q.; Xu, X.; Zhu, X.; Chen, L.; Zhou, S.; Huang, Z.Y.; Zhou, B. Low-Temperature Stress during Capped Brood Stage Increases Pupal Mortality, Misorientation and Adult Mortality in Honey Bees. PLoS ONE 2016, 11, e0154547. [Google Scholar] [CrossRef]
- Shi, T.; Zhu, Y.; Liu, P.; Ye, L.; Jiang, X.; Cao, H.; Yu, L. Age and Behavior-Dependent Differential miRNAs Expression in the Hypopharyngeal Glands of Honeybees (Apis mellifera L.). Insects 2021, 12, 764. [Google Scholar] [CrossRef]
- Yi, R.; Pasolli, H.A.; Landthaler, M.; Hafner, M.; Ojo, T.; Sheridan, R.; Sander, C.; O’Carroll, D.; Stoffel, M.; Tuschl, T.; et al. DGCR8-dependent microRNA biogenesis is essential for skin development. Proc. Natl. Acad. Sci. USA 2009, 106, 498–502. [Google Scholar] [CrossRef]
- Sun, W. Screening and Identification of microRNAs Related to Fetal Skin Melanogenesis in Goat. Master’s Thesis, Southwest university, Chongqing, China, 2015. (In Chinese). [Google Scholar]
- Sempere, L.F.; Sokol, N.S.; Dubrovsky, E.B.; Berger, E.M.; Ambros, V. Temporal regulation of microRNA expression in Drosophila melanogaster mediated by hormonal signals and broad-Complex gene activity. Dev. Biol. 2003, 259, 9–18. [Google Scholar] [CrossRef]
- Jagadeeswaran, G.; Zheng, Y.; Sumathipala, N.; Jiang, H.; Arrese, E.L.; Soulages, J.L.; Zhang, W.; Sunkar, R. Deep sequencing of small RNA libraries reveals dynamic regulation of conserved and novel microRNAs and microRNA-stars during silkworm development. BMC Genom. 2010, 11, 52. [Google Scholar] [CrossRef] [PubMed]
- Zhang, X.; Zheng, Y.; Jagadeeswaran, G.; Ren, R.; Sunkar, R.; Jiang, H. Identification and developmental profiling of conserved and novel microRNAs in Manduca sexta. Insect. Biochem. Mol. Biol. 2012, 42, 381–395. [Google Scholar] [CrossRef]
- Wang, H.C. Function of MiRNAs in the Regulation of Growth and Development in Galeruca daur. Ph.D. Thesis, Inner Mongolia Agricultural University, Inner Mongolia, 2024. (In Chinese). [Google Scholar]
- Jiang, J.; Ge, X.; Li, Z.; Wang, Y.; Song, Q.; Stanley, D.W.; Tan, A.; Huang, Y. MicroRNA-281 regulates the expression of ecdysone receptor (EcR) isoform B in the silkworm, Bombyx mori. Insect. Biochem. Mol. Biol. 2013, 43, 692–700. [Google Scholar] [CrossRef]
- Gompel, N.; Prud’homme, B.; Wittkopp, P.J.; Kassner, V.A.; Carroll, S.B. Chance caught on the wing: Cis-regulatory evolution and the origin of pigment patterns in Drosophila. Nature 2005, 433, 481–487. [Google Scholar] [CrossRef]
- Gong, L.L.; Zhang, M.Q.; Ma, Y.F.; Feng, H.Y.; Zhao, Y.Q.; Zhou, Y.Y.; He, M.; Smagghe, G.; He, P. RNAi of yellow-y, required for normal cuticle pigmentation, impairs courtship behavior and oviposition in the German cockroach (Blattella germanica). Arch. Insect. Biochem. Physiol. 2024, 115, e22114. [Google Scholar] [CrossRef]
- Nie, H.Y.; Liang, L.Q.; Li, Q.F.; Li, Z.H.; Zhu, Y.N.; Guo, Y.K.; Zheng, Q.L.; Lin, Y.; Yang, D.L.; Li, Z.G.; et al. CRISPR/Cas9 mediated knockout of Amyellow-y gene results in melanization defect of the cuticle in adult Apis mellifera. J. Insect. Physiol. 2021, 132, 104264. [Google Scholar] [CrossRef] [PubMed]
- Yuan, L.; Ren, X.; Zheng, Y.; Qian, J.; Xu, L.; Sun, M. MiR-315 is required for neural development and represses the expression of dFMR1 in Drosophila melanogaster. Biochem. Biophys. Res. Commun. 2020, 525, 469–476. [Google Scholar] [CrossRef] [PubMed]
- Hyun, S.; Lee, J.H.; Jin, H.; Nam, J.; Namkoong, B.; Lee, G.; Chung, J.; Kim, V.N. Conserved MicroRNA miR-8/miR-200 and its target USH/FOG2 control growth by regulating PI3K. Cell 2009, 139, 1096–1108. [Google Scholar] [CrossRef]
- Jin, H.; Kim, V.N.; Hyun, S. Conserved microRNA miR-8 controls body size in response to steroid signaling in Drosophila. Genes Dev. 2012, 26, 1427–1432. [Google Scholar] [CrossRef]
- Kennell, J.A.; Gerin, I.; MacDougald, O.A.; Cadigan, K.M. The microRNA miR-8 is a conserved negative regulator of Wnt signaling. Proc. Natl. Acad. Sci. USA 2008, 105, 15417–15422. [Google Scholar] [CrossRef]
- Vallejo, D.M.; Caparros, E.; Dominguez, M. Targeting Notch signalling by the conserved miR-8/200 microRNA family in development and cancer cells. EMBO J. 2011, 30, 756–769. [Google Scholar] [CrossRef] [PubMed]
- Lemaitre, B.; Nicolas, E.; Michaut, L.; Reichhart, J.M.; Hoffmann, J.A. The dorsoventral regulatory gene cassette spätzle/Toll/cactus controls the potent antifungal response in Drosophila adults. Cell 1996, 86, 973–983. [Google Scholar] [CrossRef] [PubMed]
- Evans, J.D.; Aronstein, K.; Chen, Y.P.; Hetru, C.; Imler, J.L.; Jiang, H.; Kanost, M.; Thompson, G.J.; Zou, Z.; Hultmark, D. Immune pathways and defence mechanisms in honey bees Apis mellifera. Insect. Mol. Biol. 2006, 15, 645–656. [Google Scholar] [CrossRef] [PubMed]
- Zhu, C.; Li, H.; Xu, X.; Zhou, S.; Zhou, B.; Li, X.; Xu, H.; Tian, Y.; Wang, Y.; Chu, Y.; et al. The mushroom body development and learning ability of adult honeybees are influenced by cold exposure during their early pupal stage. Front. Physiol. 2023, 20, 14–1173808. [Google Scholar] [CrossRef]
- Zhu, C.; Xu, X.; Zhou, S.; Zhou, B.; Liu, Y.; Xu, H.; Tian, Y.; Zhu, X. WGCNA based identification of hub genes associated with cold response and development in Apis mellifera metamorphic pupae. Front. Physiol. 2023, 4, 1169301. [Google Scholar] [CrossRef]
- Xu, X.; Cao, M.; Zhu, C.; Mo, L.; Huang, H.; Xie, J.; Zhou, B.; Zhou, S.; Zhu, X. Fat Body Metabolome Revealed Glutamine Metabolism Pathway Involved in Prepupal Apis mellifera Responding to Cold Stress. Insects 2025, 16, 37. [Google Scholar] [CrossRef]
- Ma, Z.; Sun, X.; Xu, D.; Xiong, Y.; Zuo, B. MicroRNA, miR-374b, directly targets Myf6 and negatively regulates C2C12 myoblasts differentiation. Biochem. Biophys. Res. Commun. 2015, 467, 670–675. [Google Scholar] [CrossRef]
- Gong, Y.; Renigunta, V.; Himmerkus, N.; Zhang, J.; Renigunta, A.; Bleich, M.; Hou, J. Claudin-14 regulates renal Ca⁺⁺ transport in response to CaSR signalling via a novel microRNA pathway. EMBO J. 2012, 31, 1999–2012. [Google Scholar] [CrossRef]
- Qu, R.; Hao, S.; Jin, X.; Shi, G.; Yu, Q.; Tong, X.; Guo, D. MicroRNA-374b reduces the proliferation and invasion of colon cancer cells by regulation of LRH-1/Wnt signaling. Gene 2018, 642, 354–361. [Google Scholar] [CrossRef]
- Moon, J.; Lee, S.T.; Choi, J.; Jung, K.H.; Yang, H.; Khalid, A.; Kim, J.M.; Park, K.I.; Shin, J.W.; Ban, J.J.; et al. Unique behavioral characteristics and microRNA signatures in a drug resistant epilepsy model. PLoS ONE 2014, 9, e85617. [Google Scholar] [CrossRef]
- Lee, K.S.; Kim, B.Y.; Jin, B.R. Differential regulation of tyrosine hydroxylase in cuticular melanization and innate immunity in the silkworm Bombyx mori. J. Asia-Pac. Entomol. 2015, 18, 765–770. [Google Scholar] [CrossRef]
- Liu, X.; Wang, X.; Zhang, Q.; Ze, L.; Zhang, H.; Lu, M. Knockdown of tyrosine hydroxylase gene affects larval survival, pupation and adult eclosion in Plagiodera versicolora. Insect. Mol. Biol. 2025, 34, 239–248. [Google Scholar] [CrossRef] [PubMed]
- Bai, Y.; He, Y.; Shen, C.Z.; Li, K.; Li, D.L.; He, Z.Q. CRISPR/Cas9-Mediated genomic knock out of tyrosine hydroxylase and yellow genes in cricket Gryllus bimaculatus. PLoS ONE 2023, 18, e0284124. [Google Scholar] [CrossRef]
- Li, W.M.; Yue, J.N.; Guo, D.Q.; Fu, W.G. MiR-126 promotes endothelial cell apoptosis by targeting PI3K/Akt in rats with lower limb arteriosclerosis obliterans. Eur. Rev. Med. Pharmacol. Sci. 2019, 23 (Suppl. S3), 327–333. [Google Scholar]
- Fukutomi, Y.; Kondo, S.; Toyoda, A.; Shigenobu, S.; Koshikawa, S. Transcriptome analysis reveals wingless regulates neural development and signaling genes in the region of wing pigmentation of a polka-dotted fruit fly. FEBS J. 2021, 288, 99–110. [Google Scholar] [CrossRef] [PubMed]
- Fu, Q.J. Research on the Regulation of Epidermal Markings Formation by Wnt1 in Bombyx mori. Master’s Thesis, Southwest university, Chongqing, China, 2022. (In Chinese). [Google Scholar]
- Kosakamoto, H.; Miura, M.; Obata, F. Epidermal tyrosine catabolism is crucial for metabolic homeostasis and survival against high-protein diets in Drosophila. Development 2024, 151, dev202372. [Google Scholar] [CrossRef] [PubMed]
- Rabatel, A.; Febvay, G.; Gaget, K.; Duport, G.; Baa-Puyoulet, P.; Sapountzis, P.; Bendridi, N.; Rey, M.; Rahbé, Y.; Charles, H.; et al. Tyrosine pathway regulation is host-mediated in the pea aphid symbiosis during late embryonic and early larval development. BMC Genom. 2013, 14, 235. [Google Scholar] [CrossRef]
- Videira, I.F.; Moura, D.F.; Magina, S. Mechanisms regulating melanogenesis. An. Bras. Dermatol. 2013, 88, 76–83. [Google Scholar] [CrossRef]


| miRNA-Name | Primer Sequences (5′ to 3′) |
|---|---|
| U6 [30] | F: GTTAGGCTTTGACGATTTCG R: GGCATTTCTCCACCAGGTA |
| let-7-x | loop: CTCAACTGGTGTCGTGGAGTCGGCAATTCAGTTGAGCACATATCA |
| let-7-x | F: GCCGAGCTGAGGTAGTAGGT |
| novel-m0169-3p | loop: CTCAACTGGTGTCGTGGAGTCGGCAATTCAGTTGAGCCGTGTTTT |
| novel-m0169-3p | F: GCCGAGGATCCATGTTCTCAGAC |
| miR-2504-x | loop: CTCAACTGGTGTCGTGGAGTCGGCAATTCAGTTGAGCATCTACAA |
| miR-2504-x | F: GCCGAGGACTCACGTCGACTG |
| ame-miR-210-3P | loop: CTCAACTGGTGTCGTGGAGTCGGCAATTCAGTTGAGCTCGCCGAT |
| ame-miR-210-3P | F: GCCGAGTTGTGCGTGTGAC |
| miR-1-3P | loop: CTCAACTGGTGTCGTGGAGTCGGCAATTCAGTTGAGCCATACCTC |
| miR-1-3P | F: GCCGAGTGGAATGTAAAGAA |
| R | CTCAACTGGTGTCGTGGA |
| Sample | Average Clean_Reads | Average High_Quality | Average 3′ Adapter_Null | Average Insert_Null | Average 5′ Adapter_Contaminants | Average polyA | Average Clean_Tags |
|---|---|---|---|---|---|---|---|
| L0 | 13,328,832 | 13,191,028 (98.9737%) | 52,011 (0.3910%) | 63,994 (0.4911%) | 14,667 (0.1776%) | 181 (0.0014%) | 11,510,675 (86.9480%) |
| PP3 | 12,384,157 | 12,261,662 (99.0195%) | 57,079 (0.4641%) | 53,185 (0.5405%) | 41,691 (0.341%) | 73 (0.0006%) | 9,449,732 (76.9709%) |
| P6 | 15,314,052 | 15,136,387 (98.84%) | 75,408 (0.4991%) | 53,553 (0.3537%) | 46,680 (0.3078%) | 90.3 (0.0006%) | 12,359,786 (81.6854%) |
| P9 | 14,716,274 | 14,593,037 (99.1875%) | 35,494 (0.2404%) | 46,142 (0.3197%) | 9757 (0.0670%) | 167 (0.0011%) | 13,370,042 (91.5706%) |
| Sample | Average Total_Abundance | Average Match_Abundance |
|---|---|---|
| L0 | 11,510,675 | 8,772,800 (76.21%) |
| PP3 | 9,449,732 | 8,511,842 (90.07%) |
| P6 | 12,359,786 | 11,071,779 (89.58%) |
| P9 | 13,370,042 | 11,532,683 (86.26%) |
Disclaimer/Publisher’s Note: The statements, opinions and data contained in all publications are solely those of the individual author(s) and contributor(s) and not of MDPI and/or the editor(s). MDPI and/or the editor(s) disclaim responsibility for any injury to people or property resulting from any ideas, methods, instructions or products referred to in the content. |
© 2025 by the authors. Licensee MDPI, Basel, Switzerland. This article is an open access article distributed under the terms and conditions of the Creative Commons Attribution (CC BY) license (https://creativecommons.org/licenses/by/4.0/).
Share and Cite
Zhu, X.; Tian, Y.; Cao, M.; Zhu, C.; Shang, J.; Sun, J.; Liu, Y.; Zhou, B.; Zhou, S.; Xu, X. A Comparative Transcriptomic Analysis of miRNAs and Their Target Genes During the Formation of Melanin in Apis mellifera. Agriculture 2025, 15, 992. https://doi.org/10.3390/agriculture15090992
Zhu X, Tian Y, Cao M, Zhu C, Shang J, Sun J, Liu Y, Zhou B, Zhou S, Xu X. A Comparative Transcriptomic Analysis of miRNAs and Their Target Genes During the Formation of Melanin in Apis mellifera. Agriculture. 2025; 15(9):992. https://doi.org/10.3390/agriculture15090992
Chicago/Turabian StyleZhu, Xiangjie, Yuanmingyue Tian, Mingjie Cao, Chenyu Zhu, Jiaqi Shang, Jiaqi Sun, Yiming Liu, Bingfeng Zhou, Shujing Zhou, and Xinjian Xu. 2025. "A Comparative Transcriptomic Analysis of miRNAs and Their Target Genes During the Formation of Melanin in Apis mellifera" Agriculture 15, no. 9: 992. https://doi.org/10.3390/agriculture15090992
APA StyleZhu, X., Tian, Y., Cao, M., Zhu, C., Shang, J., Sun, J., Liu, Y., Zhou, B., Zhou, S., & Xu, X. (2025). A Comparative Transcriptomic Analysis of miRNAs and Their Target Genes During the Formation of Melanin in Apis mellifera. Agriculture, 15(9), 992. https://doi.org/10.3390/agriculture15090992