
Proposal for a Green Business Model for Biofortified Foods in the Municipality of Chocontá, Cundinamarca


Abstract
1. Introduction
2. Materials and Methods
2.1. Agricultural Production Model Assessment in Chocontá
2.2. Methodology for Physicochemical Properties of Biofortified Foods in Chocontá
2.3. Methodology for Theoretical Design of an Agricultural Production Model for Biofortified Foods
- Demand: Determined by customer requirements, which can be further subdivided into forecasts based on real orders, historical data, and relevant studies.
- Inventory: The amount of raw material and/or product available to meet customer demand.
- Quantity of seedlings to harvest (MPS).
3. Results
3.1. Diagnosis of Agricultural Production Model in Chocontá
3.2. Physicochemical Properties of Biofortified Foods in Chocontá
3.3. Theoretical Design of an Agricultural Production Model for Biofortified Foods
4. Discussion
4.1. Analysis for Diagnosis of Agricultural Production Model in Chocontá
4.2. Physicochemical Properties of Biofortified Foods in Chocontá
4.3. Theoretical Design of Agricultural Production Model for Biofortified Foods
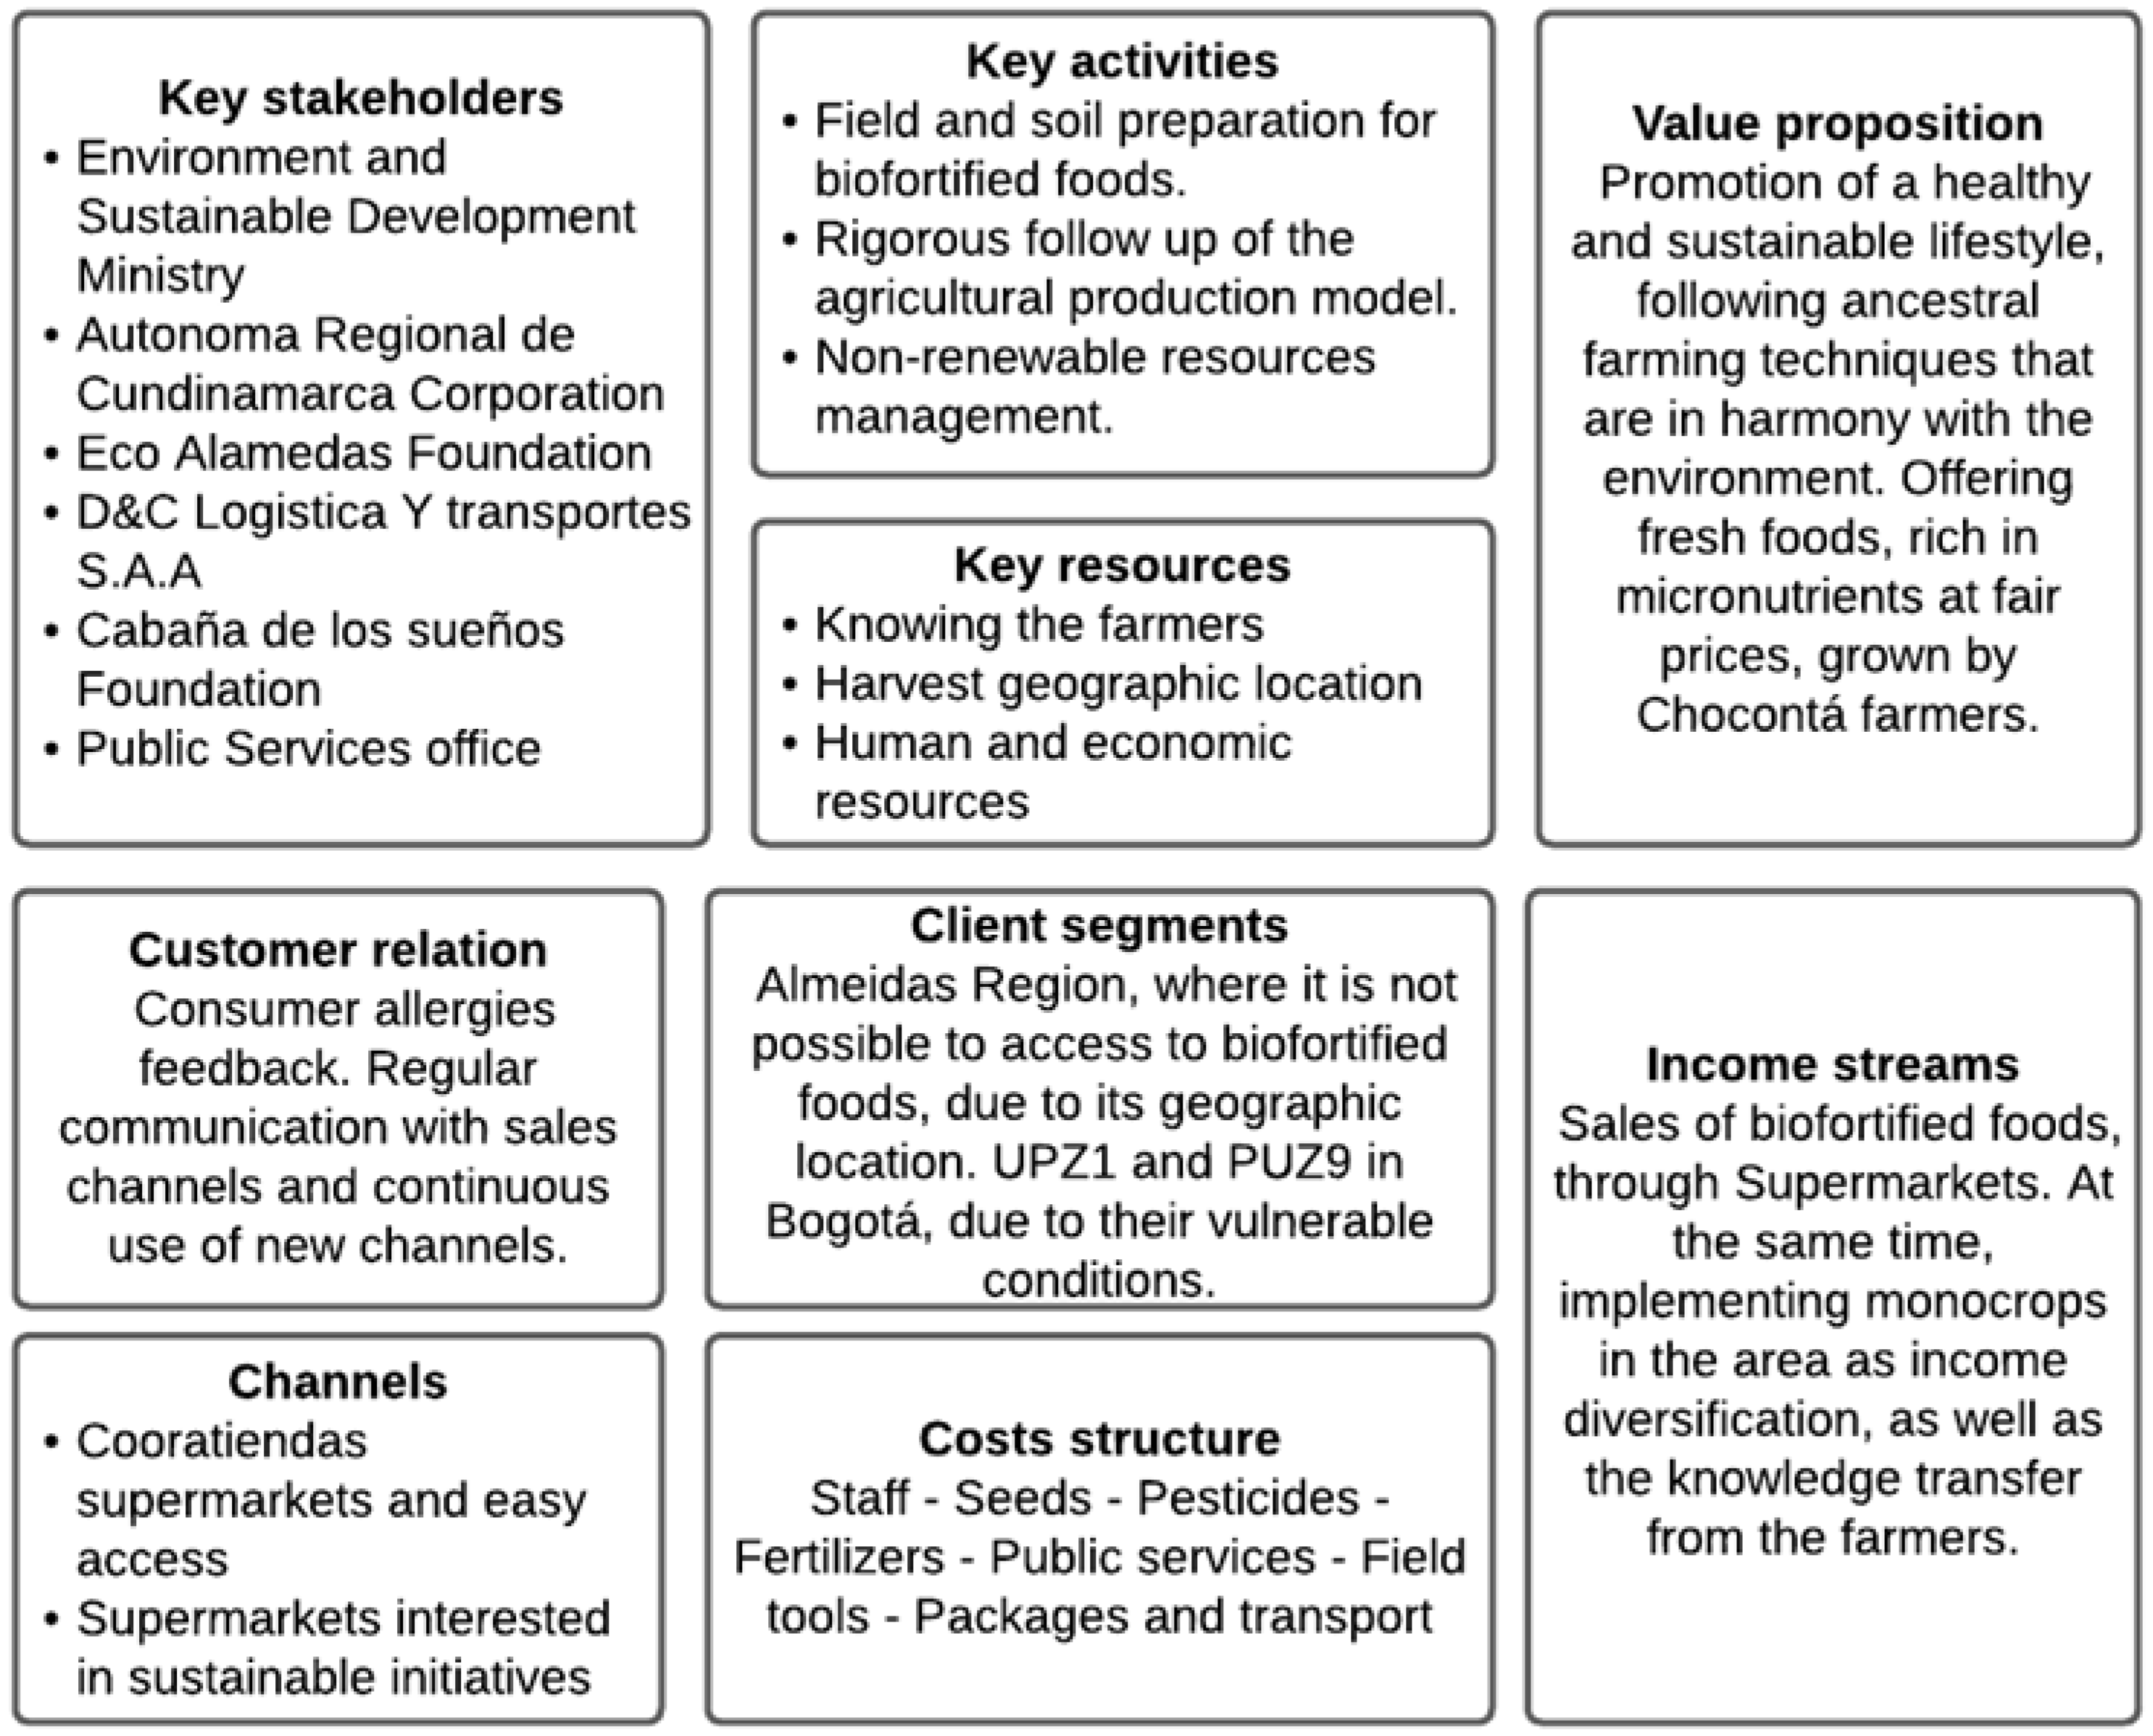
4.3.1. Business Model
- The economic viability of the business.
- Positive environmental impact of the product or service.
- Life cycle approach to the product or service.
- Useful life.
- Non-use of hazardous substances or materials.
- Recyclability of materials and use of recycled materials.
- Efficient and sustainable use of resources to produce the product or service.
- Social responsibility within the company.
- Social and environmental responsibility in the company’s value chain.
- Social and environmental responsibility outside the company.
- Communication of social or environmental attributes associated with the product or service.
- Schemes, programs, or environmental or social recognitions projected for implementation.
4.3.2. Product Life Cycle Approach
4.3.3. Economic Viability
4.3.4. Market Research
5. Conclusions
Author Contributions
Funding
Data Availability Statement
Acknowledgments
Conflicts of Interest
References
- Gligo, N.; Alonso, G.; Barkin, D.; Brailovsky, A.; Brzovic, F.; Carrizosa, J.; Durán, H.; Fernández, P.; Gallopín, G.; Leal, J.; et al. La Tragedia Ambiental de América Latina y el Caribe; Libros de la CEPAL, N° 161 (LC/PUB.2020/11-P); Comisión Económica para América Latina y el Caribe (CEPAL): Santiago, Chile, 2020; Available online: https://repositorio.cepal.org/bitstream/handle/11362/46101/1/S2000555_es.pdf (accessed on 21 February 2025).
- DANE. Boletín Técnico Indicador de Seguimiento a la Economía, Marzo, pp. 9–18. 2022. Available online: https://www.dane.gov.co/files/investigaciones/boletines/pib/bol_ISE_mar2022.pdf (accessed on 21 February 2025).
- Gobernación de Cundinamarca. Plan Departamental de Extensión Agropecuaria. Gobernación de Cundinamarca. 2020. Available online: https://www.adr.gov.co/wp-content/uploads/2021/07/PDEA-Cundinamarca.pdf (accessed on 21 February 2025).
- García Romero, L.M.; Gómez Rey, L.M.; Universidad Piloto de Colombia. Propuesta Ambiental para el Plan de Desarrollo del Municipio de Chocontá Cundinamarca para el Periodo 2020–2024. Universidad Piloto de Colombia. 2019. Available online: http://repository.unipiloto.edu.co/bitstream/handle/20.500.12277/6861/PROPUESTA%20AMBIENTAL%20PARA%20EL%20PLAN%20DE%20DESARROLLO%20DEL%20MUNICIPIO%20DE%20CHOCONTÁ%20CUNDINAMARCA%20PARA%20EL%20PERÍODO%202020-2024..pdf?sequence=1 (accessed on 21 February 2025).
- Instituto Colombiano de Bienestar Familiar (ICBF), Ministerio de Salud y Protección Social, & Departamento Administrativo Nacional de Estadística (DANE). Encuesta Nacional de la Situación Nutricional en Colombia—ENSIN 2015. Available online: https://www.icbf.gov.co/sites/default/files/ensin_2015_final.pdf (accessed on 21 February 2025).
- Gobernación de Cundinamarca (s.f.). Política de Seguridad Alimentaria y Nutricional de Cundinamarca (PSANCUN). Available online: https://www.cundinamarca.gov.co/wcm/connect/2f245090-0abc-416b-b31b-405422d73975/Pol%C3%ADtica%2Bde%2Bseguridad%2Balimentaria%2By%2Bnutricional%2Bde%2BCundinamarca%2BPSANCUN.pdf?CACHEID=ROOTWORKSPACE-2f245090-0abc-416b-b31b-405422d73975-nPxIM7d&CONVERT_TO=url&MOD=AJPERES (accessed on 10 December 2024).
- Duarte Ramírez, H. Negocios Verdes, una Oportunidad para Consolidar los Bienes y Servicios Sostenibles en la Jurisdicción de Corpoguavio. Universidad Militar Nueva Granada. 2019. Available online: https://core.ac.uk/download/pdf/286063219.pdf (accessed on 21 February 2025).
- Rodríguez Franky, F.E.; Catumba Arias, J.C.; Arias Jiménez, L.P. Negocios Verdes una Oportunidad de Desarrollo Sostenible para las Empresas del Futuro “Una Mirada Desde la Investigación”. Fundación Universidad Compensar. 2020. Available online: https://repositoriocrai.ucompensar.edu.co/bitstream/handle/compensar/2943/Negocios%20verdes%20ebook.pdf?sequence=1&isAllowed=y (accessed on 10 December 2024).
- MinAmbiente. Plan de Negocios Verdes 2022–2030. 2022. Available online: https://www.minambiente.gov.co/wp-content/uploads/2022/11/Actualizacion-Plan-Nacional-Negocios-verdes-2022-2030.pdf (accessed on 10 December 2024).
- DANE. Proyecciones Población Cundinamarca y Bogotá. 2024. Available online: https://www.dane.gov.co/index.php/estadisticas-por-tema/demografia-y-poblacion/proyecciones-de-poblacion/proyecciones-de-poblacion-bogota (accessed on 10 December 2024).
- ONU. Colombia Registra una Modesta Mejora de la Seguridad Alimentaria. 2024. Available online: https://news.un.org/es/story/2024/02/1528022 (accessed on 21 February 2025).
- INS. Boletín Epidemiológico Semanal. Dirección de Vigilancia y Análisis del Riesgo en Salud Pública. 2021. Available online: https://www.ins.gov.co/buscador-eventos/BoletinEpidemiologico/2022_Boletin_epidemiologico_semana_10.pdf (accessed on 21 February 2025).
- Cuellar Higuera, L.; Avellaneda Torres, L.M. Estrategias para el Fortalecimiento de la Sostenibilidad Ambiental (Con Enfoque Agropecuario) y la Seguridad Alimentaria de la Vereda Huerta Grande del Municipio de Boyacá; Universidad de Caldas: Caldas, Colombia, 2020; ISSN 1909-2474. [Google Scholar]
- MinAmbiente. Diagnóstico de los Negocios Verdes. BID. 2022. Available online: https://www.minambiente.gov.co/wp-content/uploads/2022/11/Anexo1-Diagnostico-NV-del-PNNV-2022-2030.pdf (accessed on 21 February 2025).
- Ortega Ramírez, A.T.; Escobar Toro, L.F.; Reyes Tovar, M. Propuesta de Un Modelo de Negocio Verde Para Alimentos Biofortificados en El Municipio de Chocontá, Cundinamarca; Fundación Universidad de América: Bogota, Colombia, 2025; Volume 15. [Google Scholar]
- Gutiérrez Sabando, D. Análisis de la Pérdida y Desperdicio de Lechuga Durante la Cadena de Producción en la Escuela Agrícola Panamericana, Zamorano. Escuela Agrícola Panamericana, Zamorano Honduras. 2019. Available online: https://bdigital.zamorano.edu/server/api/core/bitstreams/37811733-be01-4958-8efe-7a81de0d51ad/content (accessed on 21 February 2025).
- Ortega Ibarra, E.; Ortega Ibarra, I.H.; Rodríguez-López, E.; Luis Pineda, C. Breve análisis crítico de la sobreoferta y consumo de alimentos industrializados en México, antes y durante el COVID-19. Educ. Salud Bol. Cient. Inst. Cienc. Salud Univ. Autón. Estado Hidalgo 2021, 10, 54–59. [Google Scholar] [CrossRef]
- CAR Cundinamarca. Análisis Ambiental Jurisdicción CAR. 2024. Available online: https://www.car.gov.co/uploads/files/5acb6b513ad7d.pdf (accessed on 21 February 2025).
- CAR Cundinamarca. Municipio de Chocontá, Cundinamarca Colombia. Ficha para la Inclusión de la Gestión del Cambio Climático y la Variabilidad Climática en el Ordenamiento Territorial. 2020. Available online: https://www.conservation.org.co/media/Chocontá.pdf (accessed on 21 February 2025).
- Triana Gasca, I.A.; Díaz Ramírez, D.R.; Vallejo Quintero, V. Evaluación del impacto del monocultivo de papa sobre la calidad edáfica en el Páramo de Guerrero (Cundinamarca, Colombia). Acta Agron. 2024, 71, 280–286. [Google Scholar] [CrossRef]
- MinAmbiente. Oficina de Negocios Verdes y Sostenibles. 2023. Available online: https://www.minambiente.gov.co/wp-content/uploads/2022/10/Infografía-NV.pdf (accessed on 21 February 2025).
- Alcaldía Municipal de Chocontá en Cundinamarca. Mapa de Ubicación geo Figura del Municipio de Chocontá. Chocontá un Proyecto de Veeduría Ciudadana. 2023. Available online: https://choconta.wordpress.com/mapas/ (accessed on 21 February 2025).
- Alcaldía Municipal en Chocontá. Plan de Desarrollo Municipal de Chocontá ‘Unidos y Comprometidos por Chocontá-Cundinamarca’. Alcaldía Municipal de Chocontá. 2024. Available online: https://chocontacundinamarca.micolombiadigital.gov.co/sites/chocontacundinamarca/content/files/001528/76391_7492_plandeaccionprogramado2024copilado-1.pdf (accessed on 21 February 2025).
- NIH. Datos Sobre la Vitamina C. National Institues of Health. Office of Dietary Supplements. 2019. Available online: https://ods.od.nih.gov/pdf/factsheets/VitaminC-DatosEnEspanol.pdf (accessed on 21 February 2025).
- Meneses Marentes, N.A.; Herrera Ramirez, E.J.; Tarazona Diaz, M.P. Caracterización y Estabilidad de un Extracto Rico en Antocianinas a Partir de Corteza de Gulupa, Revista Colombiana de Química, Print Version 2019; ISSN 0120-2804. 2019. Available online: http://www.scielo.org.co/scielo.php?script=sci_arttext&pid=S0120-28042019000200027 (accessed on 21 February 2025).
- Ministerio de Ambiente y Desarrollo Sostenible. Guía de Verificación y Evaluación de Criterios de Negocios Verdes. 2016. Available online: https://archivo.minambiente.gov.co/images/NegociosVerdesysostenible/pdf/criterios_negocios_verdes/criterios_actualizado_2016/Guia_Verificaci%C3%B3n_Criterios_NV_V12__26_01_2016.pdf (accessed on 21 February 2025).
- Castro Granados, J.R.; Brenes Peralta, L.; Jiménez Morales, M.F.; Campos Rodriguez, R. Análisis de Ciclo de Vida de Lechuga (Lactuca sativa) Cultivada Bajo un Sistema Orgánico y Convencional, como Insumo para Toma de Decisiones en dos Fincas Agrícolas Costarricenses. Tecnología en Marcha. 2021. Available online: https://revistas.tec.ac.cr/index.php/tec_marcha/article/view/5108/5542 (accessed on 21 February 2025).
- Gobierno de México. Sabes Cuánta Agua Consumes. Available online: https://www.gob.mx/conanp/articulos/sabes-cuanta-agua-consumes#:~:text=De%20acuerdo%20a%20la%20Organizaci%C3%B3n,de%20consumo%20como%20de%20higiene (accessed on 21 February 2025).
- Superintendencia de Servicio Públicos. Informe Ejecutivo de Gestión Junta de Servicios Públicos del Municipio de Choconta—ID 1228. Superintendencia Delegada para Acueducto, Alcantarillado y Aseo Grupo de Pequeños Prestadores Bogotá, Junio de 2013. 2013. Available online: https://www.superservicios.gov.co/sites/default/files/inline-files/2013municipiodechocontaesp.pdf (accessed on 21 February 2025).
- Moreno Esparza, D.S.; Escarraga González, A.J. Análisis de la Factibilidad de la Implementación de Sistemas de Energía Fotovoltaica en Residencias Rurales de Chocontá-Cundinamarca. EAN Universidad. 2023. Available online: https://repository.universidadean.edu.co/bitstream/handle/10882/13208/MorenoDiana2023.pdf?sequence=1&isAllowed=y (accessed on 21 February 2025).


| Factors | Description | Level | Total Factor | % Factor |
|---|---|---|---|---|
| Political | Alignment between the strategic lines established by regulatory entities | 2 | 5 | 9.60% |
| Implementation of strategic lines for agricultural production | 1 | |||
| Change of government | 1 | |||
| Sudden decisions in market dynamics | 1 | |||
| Economic | High participation of agricultural production in GDP | 2 | 17 | 32.70% |
| Displacement to achieve food commercialization | 3 | |||
| High food production in the department | 2 | |||
| Susceptibility to market disruptions | 1 | |||
| High fluctuations in the dollar affecting input prices | 3 | |||
| Inflation in the family shopping basket | 2 | |||
| High percentage of the population engaged in agricultural activities | 2 | |||
| Social | Equitable presence of men and women | 1 | 5 | 9.60% |
| High percentage of rural population | 2 | |||
| Access to primary education predominates | 2 | |||
| Technological | Production of heavy machinery | 1 | 7 | 13.46% |
| Conventional production system | 2 | |||
| Tools with limited technological advancement | 2 | |||
| Absence of systematized processes | 1 | |||
| Criteria for food selection based on experience | 1 | |||
| Environmental | Presence of natural reserves | 2 | 13 | 25.00% |
| Water bodies affected by agriculture | 3 | |||
| Poor water quality | 3 | |||
| Soil degradation | 3 | |||
| Discharges and waste into the Bogotá River | 2 | |||
| Legal | Robust regulations | 2 | 5 | 9.60% |
| Environmental authorities monitoring | 2 | |||
| Community resistance to legal compliance | 1 |
| Component | Romaine Lettuce (Parris Island) | Iceberg Lettuce (Lactuca sativa Variedad Capitata) | Strawberries (Fragari) | Frijol Bola Roja (Phaseolus vulgaris L.) |
|---|---|---|---|---|
| Antioxidants (mg EAA g−1 PF)% | 1.895 | 0.02 ± 0.01 | 73.33 ± 8.88 | 12.10 |
| Anthocyanins (mg EA mL) | N/A | 0.11 ± 0.06 | 8.47 ± 0.07 | 9.27 ± 0.07 |
| Total Zinc (mg/L) | 2.52 ± 0.400 | 1.43 ± 0.400 | 0.27 ± 0.03 | 11 ± 3 |
| Total Iron (mg/L) | 1.320 ± 0.200 | 0.36 ± 0.10 | N/A | 171 ± 3 |
| Calculation 1. Initial Inventory |
|---|
| Initial Inventory = Final Inventory (n-1) |
| n-1 = Inventory from the previous week |
| Calculation 2. Units to Produce (MPS) |
| MPS = If (II ≥ MAX (P1 P2)) |
| II = Initial Inventory |
| P1 = Forecast |
| P2 = Orders |
| Calculation 3. Final Inventory |
| IF = II + MPS – MAX (P1 P2) |
| IF = Final Inventory |
| Calculation 4. Available Quantity |
| CD = II + MPS − MAS (P2) |
| CD = Available Quantity |
| Component | Romaine Lettuce (Parris Island) | Iceberg Lettuce (Lactuca sativa Variedad Capitata) | Strawberries (Fragari) | Frijol Bola Roja (Phaseolus vulgaris L.) | |
|---|---|---|---|---|---|
| Crop | Antioxidants (mg EAA g−1 PF)% | 2277 | 0.024 ± 0.01 | 87.96 ± 8.88 | 14.52 |
| Anthocyanins (mg EA mL) | N/A | 0.13 ± 0.06 | 10.16 ± 0.07 | 11.12 ± 0.07 | |
| Total Zinc (mg/L) | 3.024 ± 0.400 | 1.73 ± 0.400 | 0.32 ± 0.03 | 13.2 ± 3 | |
| Total Iron (mg/L) | 1.584 ± 0.200 | 0.43 ± 0.10 | N/A | 205.2 ± 3 | |
| Regulations | Resolution 810 of 2021 and Resolution 2492 of 2022 (20% to 100% of the Reference Nutrient Value) mg | 0.3 ER | 0.3 ER | 20 | 11 |
| Resolution 3803 of 2016 mg/L (Tolerable Upper Intake Level—UL) | 0.63 ER | 0.63 ER | 35 | 45 | |
| Demand (kg/year) | 185,784 |
| Demand (kg/month) | 13,469 |
| Demand (kg/cycle) for 3 intervals every 10 days | 44,469 |
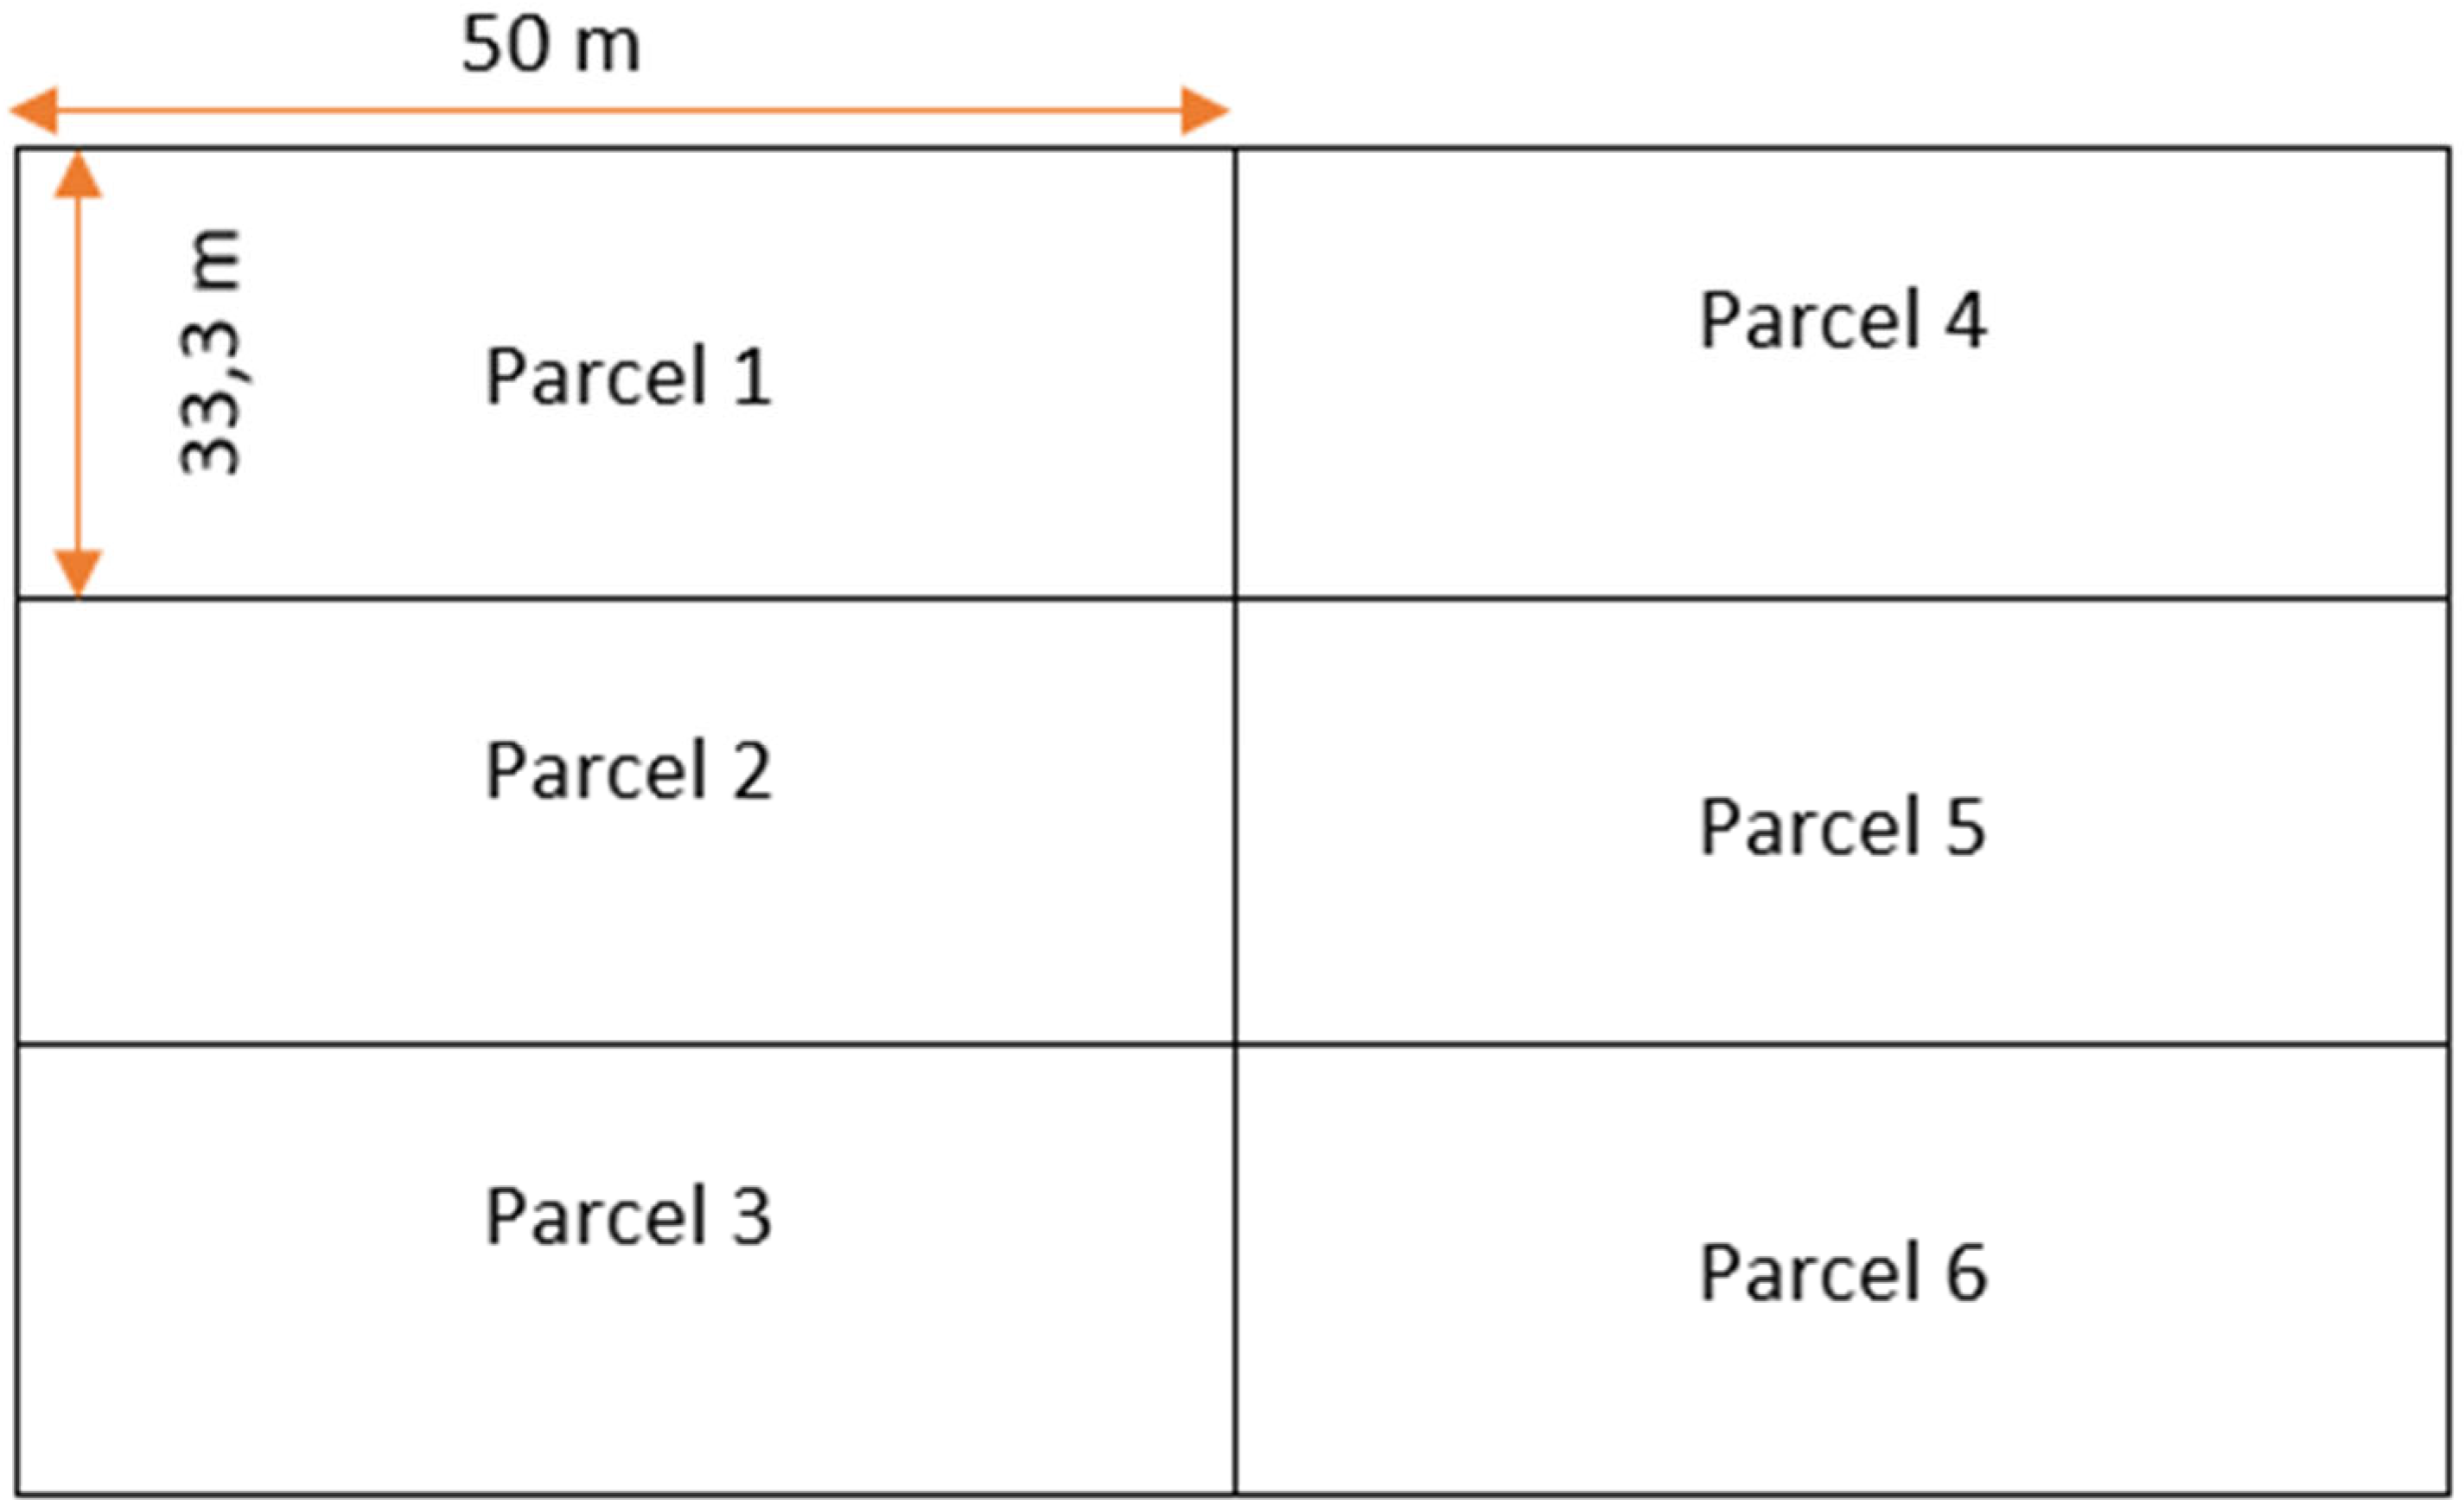
| Seedlings per parcel | 10,000 |
| Cost Item | Description | Amount Required for the Investment | Unit Cost (COP) | Total Cost (COP) |
|---|---|---|---|---|
| Seeds | Biofortified seed purchase | 144 Bags | $68,000 | $9,792,000 |
| Fertilizers | Soil amendment and nutrient input | 60 L | $44,900 | $2,694,000 |
| Pesticides | Pest and disease management | 1 Lump | $41,000 | $41,000 |
| Tools and Equipment | Agricultural tools and supplies | 3 tools | $882,334 | $2,647,000 |
| Labor | Field preparation and crop care | 12 professionals per month | $26,000,000 | $78,000,000 |
| Utilities | Water, electricity and fuel | 6 Utilities | $189,213 | $1,135,278 |
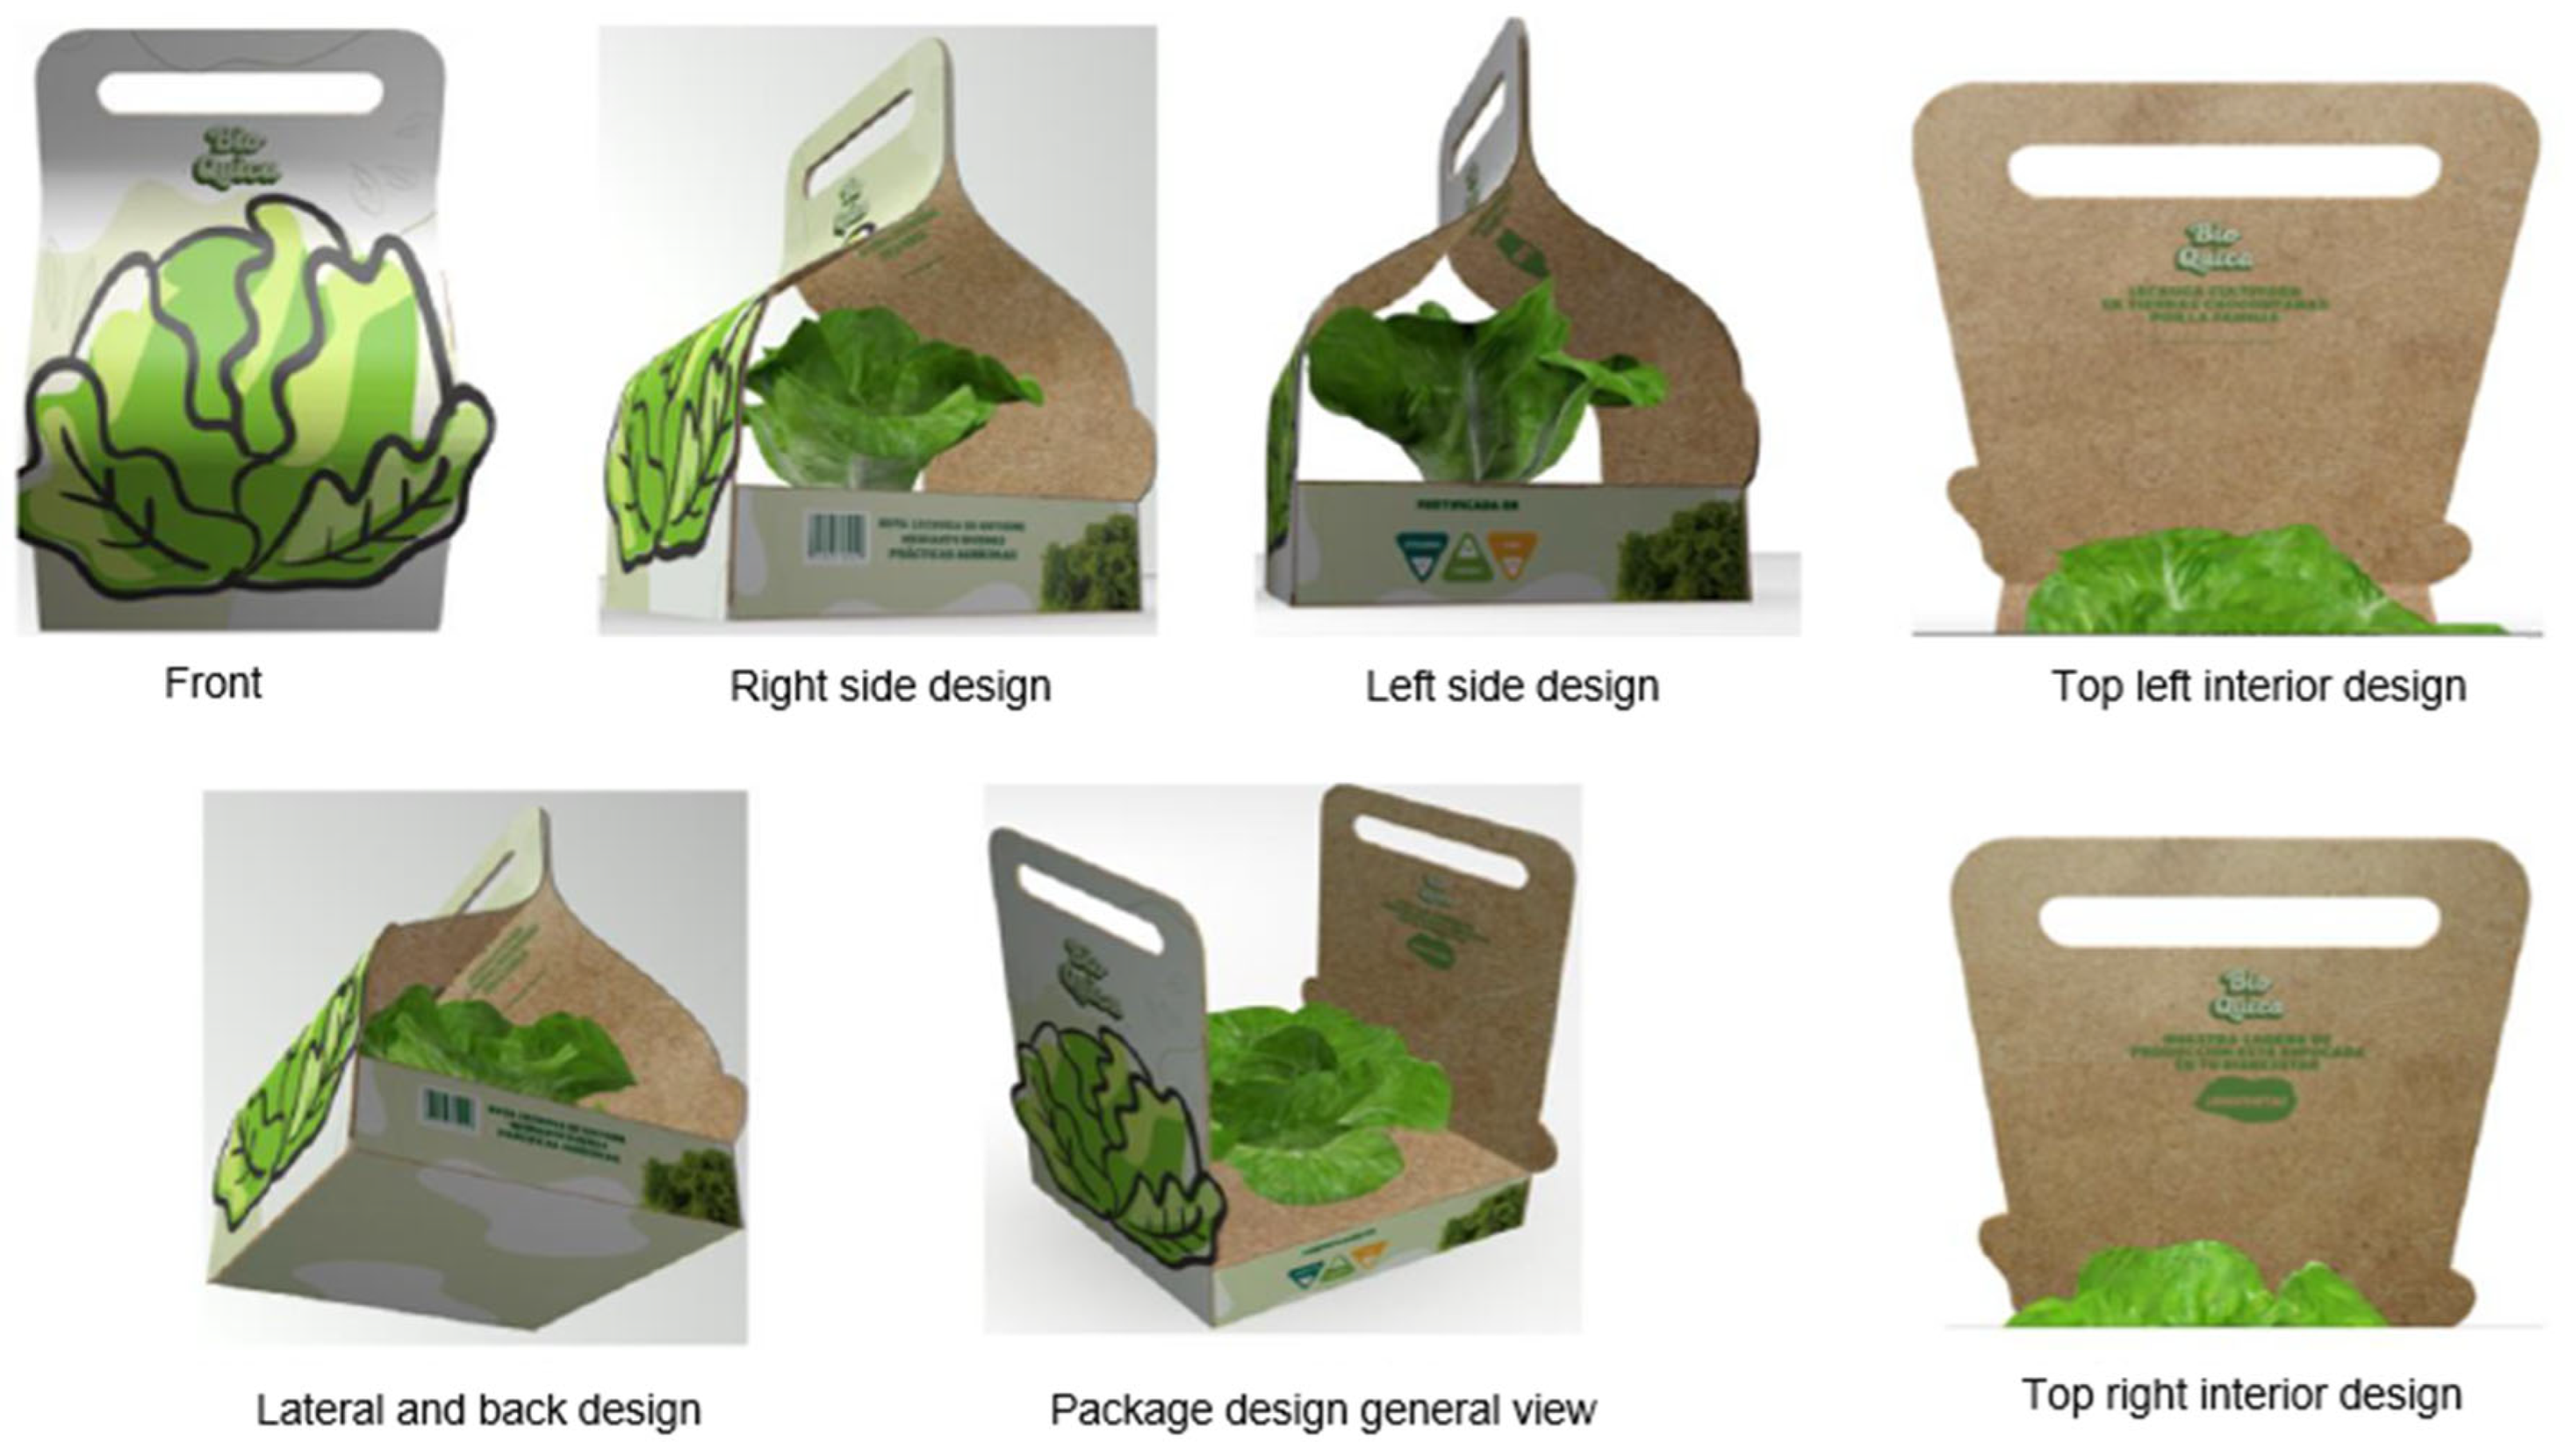
| Other Operating Costs | Transportation, packaging, etc. | 3 Packaging (324,000 Units) | $8,100,000 | $24,300,000 |
| 1 Transportation Bogotá | $800,000 | $800,000 | ||
| 1 Transport outside | $1,800,000 | $1,800,000 | ||
| Total Investment | $121,209,278 | |||
| Environmental Indicator | Conventional System in Lettuce’s Harvest | Green Model (Proposed) | Estimated Reduction (%) |
|---|---|---|---|
| Carbon footprint (kg CO2−eq/kg) | 1.8–2.5 | 1.1–1.5 | ~40% |
| Water footprint (L/kg) | 190–250 | 120–150 | ~35% |
| Nitrogen runoff (g N/kg) | 4.2–6.0 | 1.8–2.5 | ~55% |
| Plastic packaging (g/kg) | 18–25 (single-use) | 5–10 (biodegradable or reusable) | ~60% |
| On-farm waste generation (kg/ha) | 550–700 | 300–400 | ~40% |
Disclaimer/Publisher’s Note: The statements, opinions and data contained in all publications are solely those of the individual author(s) and contributor(s) and not of MDPI and/or the editor(s). MDPI and/or the editor(s) disclaim responsibility for any injury to people or property resulting from any ideas, methods, instructions or products referred to in the content. |
© 2025 by the authors. Licensee MDPI, Basel, Switzerland. This article is an open access article distributed under the terms and conditions of the Creative Commons Attribution (CC BY) license (https://creativecommons.org/licenses/by/4.0/).
Share and Cite
Ortega-Ramírez, A.T.; Escobar Toro, L.F.; Reyes Tovar, M. Proposal for a Green Business Model for Biofortified Foods in the Municipality of Chocontá, Cundinamarca. Agriculture 2025, 15, 991. https://doi.org/10.3390/agriculture15090991
Ortega-Ramírez AT, Escobar Toro LF, Reyes Tovar M. Proposal for a Green Business Model for Biofortified Foods in the Municipality of Chocontá, Cundinamarca. Agriculture. 2025; 15(9):991. https://doi.org/10.3390/agriculture15090991
Chicago/Turabian StyleOrtega-Ramírez, Angie Tatiana, Luisa Fernanda Escobar Toro, and Miriam Reyes Tovar. 2025. "Proposal for a Green Business Model for Biofortified Foods in the Municipality of Chocontá, Cundinamarca" Agriculture 15, no. 9: 991. https://doi.org/10.3390/agriculture15090991
APA StyleOrtega-Ramírez, A. T., Escobar Toro, L. F., & Reyes Tovar, M. (2025). Proposal for a Green Business Model for Biofortified Foods in the Municipality of Chocontá, Cundinamarca. Agriculture, 15(9), 991. https://doi.org/10.3390/agriculture15090991