Article

Long-Term Effect of Tillage Practices on Soil Physical Properties and Winter Wheat Yield in North-East Romania

by
Segla Serginho Cakpo
1,
Tudor George Aostăcioaei
2,
Gabriel-Dumitru Mihu
2,
Cosmin-Costel Molocea
2,
Cosmin Ghelbere
1,
Ana Ursu
2 and
Denis Constantin Țopa
2,*
1
Research Institute for Agriculture and Environment “Ion Ionescu de la Brad” Iasi University of Life Sciences, 9, Mihail Sadoveanu Alley, 700490 Iasi, Romania
2
Department of Pedotechnics, Faculty of Agriculture, “Ion Ionescu de la Brad” Iasi University of Life Sciences, 3, Mihail Sadoveanu Alley, 700490 Iasi, Romania
*
Author to whom correspondence should be addressed.
Agriculture 2025, 15(9), 989; https://doi.org/10.3390/agriculture15090989
Submission received: 31 March 2025 / Revised: 29 April 2025 / Accepted: 1 May 2025 / Published: 2 May 2025

Abstract

:
Soil quality, characterized by its physical, chemical, and biological properties, is closely linked to soil management. Reducing soil disturbance can limit soil degradation; however, tillage is still considered essential, particularly on poorly drained soils. This study aimed to identify the optimal tillage practices for winter wheat crops following long-term no tillage practice and crop rotation (2020–2023). Additionally, it highlights the considerable advantages of particular tillage practices in emphasizing their role in enhancing soil health and sustainable agriculture. The experiment followed a randomized complete block design with three replications and two tillage practices: no tillage (NT) and conventional tillage (CT). The research was carried out on a cambic chernozem soil type. The results revealed that physical properties such as bulk density (BD) can increase or decrease under NT, while soil water content (SWC) increased under the same system. The status of water-stable aggregates (WSAs) also improved in NT (88.41%) due to the incorporation of cover crop or plant residues in the 0–10 cm depth. Notably, the highest SWC value at harvest was obtained in the 0–10 cm soil depth, under NT, reaching 24.47%. Grain yields over four years of research were also influenced by tillage systems, resulting in mean yields of 6070 kg/ha for CT and 4285.25 kg/ha for the NT system. The Pearson correlation coefficient was calculated for the soil physical properties considered in pairs. Between BD and water-stable aggregates (WSAs), there was a moderate positive correlation (r = 0.458**) and statistical significance, but no linear correlation between BD and SWC (r = 0.089), and between WSAs and SWC (r = 0.026). Generally, using NT, which reduces soil disturbance and maintains residues on the surface, could contribute to land sustainability and climate mitigation in north-east Romania.

1. Introduction

Reducing tillage has become an increasingly common goal among farmers worldwide to mitigate soil erosion and enhance agroecosystem stability. Reduced tillage is usually achieved by different strategies in conventional and organic farming systems, but it remains unclear whether these strategies significantly impact soil health [1]. Conservative tillage systems, which include the no-tillage (NT) approach, adhere to several principles, including the establishment and maintenance of the surface plant cover and the number of passes [2]. The extent to which these principles are applied depends on the specific conditions and the desired outcomes. Conservation tillage strategies directly influence soil physical parameters by enhancing residue retention and reducing soil disturbance and carbon loss. [3,4,5,6]. These agricultural practices are recognized for their importance in preserving soil resources by boosting soil organic carbon (SOC) and fostering sustainable agriculture [7]. Compared to conventional tillage (CT), conservation tillage (e.g., NT) typically limits soil disturbance and erosion, hence optimizing soil aggregate formation and stability, which may subsequently enhance SOC accumulation [8]. In addition, conservation tillage practices (such as minimum tillage and no tillage) can enhance soil quality and its responses to extensive tillage [9].
Intensive agricultural practices can lead to enhanced soil compaction, loss of soil structure, and consequently, soil degradation [10]. Conversely, conservation tillage is crucial for sustainable agricultural output, enhancing soil resilience and nutrient recovery by influencing soil characteristics and attributes, including physical and chemical qualities [11,12]. Tillage methods and topsoil management impact the sustainable use of soil resources through their effect on soil stability, resistance, and quality [13]. There is a need to develop accurate, objective, and quantitative indices to assess these soil attributes. Several characteristics influence soil quality, encompassing physical qualities, chemical properties, and biological processes [14]. Such indices can only be developed based on data obtained from well-designed and properly implemented long-term soil management experiments conducted on the major soils of the principal ecoregions [15]. The challenge is especially acute due to high population pressure, lack of quality agricultural soils, poor environments, and resource-limited farmers [16].
Global studies on unconventional systems provide insights into their effects on the agricultural environment, with impacts varying by region based on soil and climate conditions, management practices, and other factors. Given the lack of worldwide research to offer a universally applicable solution, there is a need for localized studies on this topic [17]. Characteristics such as water-stable aggregates (WSAs), soil porosity (SP), bulk density (BD), soil water content (SWC), and many other physical soil properties and their correlation depend on the tillage system. As a measure of soil compaction related to total soil and pore space volume, BD is generally regarded as a significant characteristic that reflects soil structure [18]. BD has been used extensively to assess different soil processes, estimate soil carbon stocks, and establish the physical quality of soil [19].
Intensive tillage in CT systems strengthens the effects of water stress on crop growth, limiting crop yields in dryland agriculture [20]. Conservation tillage can reduce evaporation and conserve soil water; however, continuous, long-term conservation tillage may result in lower crop yields [21]. Tillage is considered the first technical step in the agricultural cropping systems chain and is certainly one of the most important segments that contribute to the efficient use of soil resources [22]. Therefore, achieving optimal conditions for plant growth and development enhances yields. The main purpose of tillage is to provide the required depth of loosened topsoil, allowing the plants to benefit as much as possible from optimal growth and development conditions. The development of the root system, especially in the early stages of vegetation, is enhanced when the soil is well prepared and loosened. This can be observed in the case of soils that have a balanced ratio of 1/1 between their solid phase and the pore spaces after tillage [23].
One of the main axes of agricultural research is to determine the optimal methods that can be used to achieve a quantitative and qualitative increase in agricultural production and, at the same time, an adequate income [24]. Agricultural modernization has given rise to new concepts and new strategies for sustainable agriculture [25], but all these soil management practices and methods aim to be adapted to each region according to its climatic and soil characteristics. In addition to obtaining a yield that meets market demands, this means maintaining all soil properties as much as possible, while improving its physico-chemical properties. As a result, changes in soil quality may not be evident until years after tillage management has introduced them [11]. It is therefore necessary to collect data on long-term changes in soil tillage management to develop an evaluation and monitoring system. To increase the spread of the NT system in Romania and to improve sustainable agriculture, it is important to investigate, in each region, the conditions for establishing this system. Thus, the main objective of this research was to (1) evaluate the impact of NT and CT on physical properties of the soil, (2) analyze the correlation between these different properties, and (3) measure the grain yield of winter wheat under each studied tillage system.

2. Materials and Methods

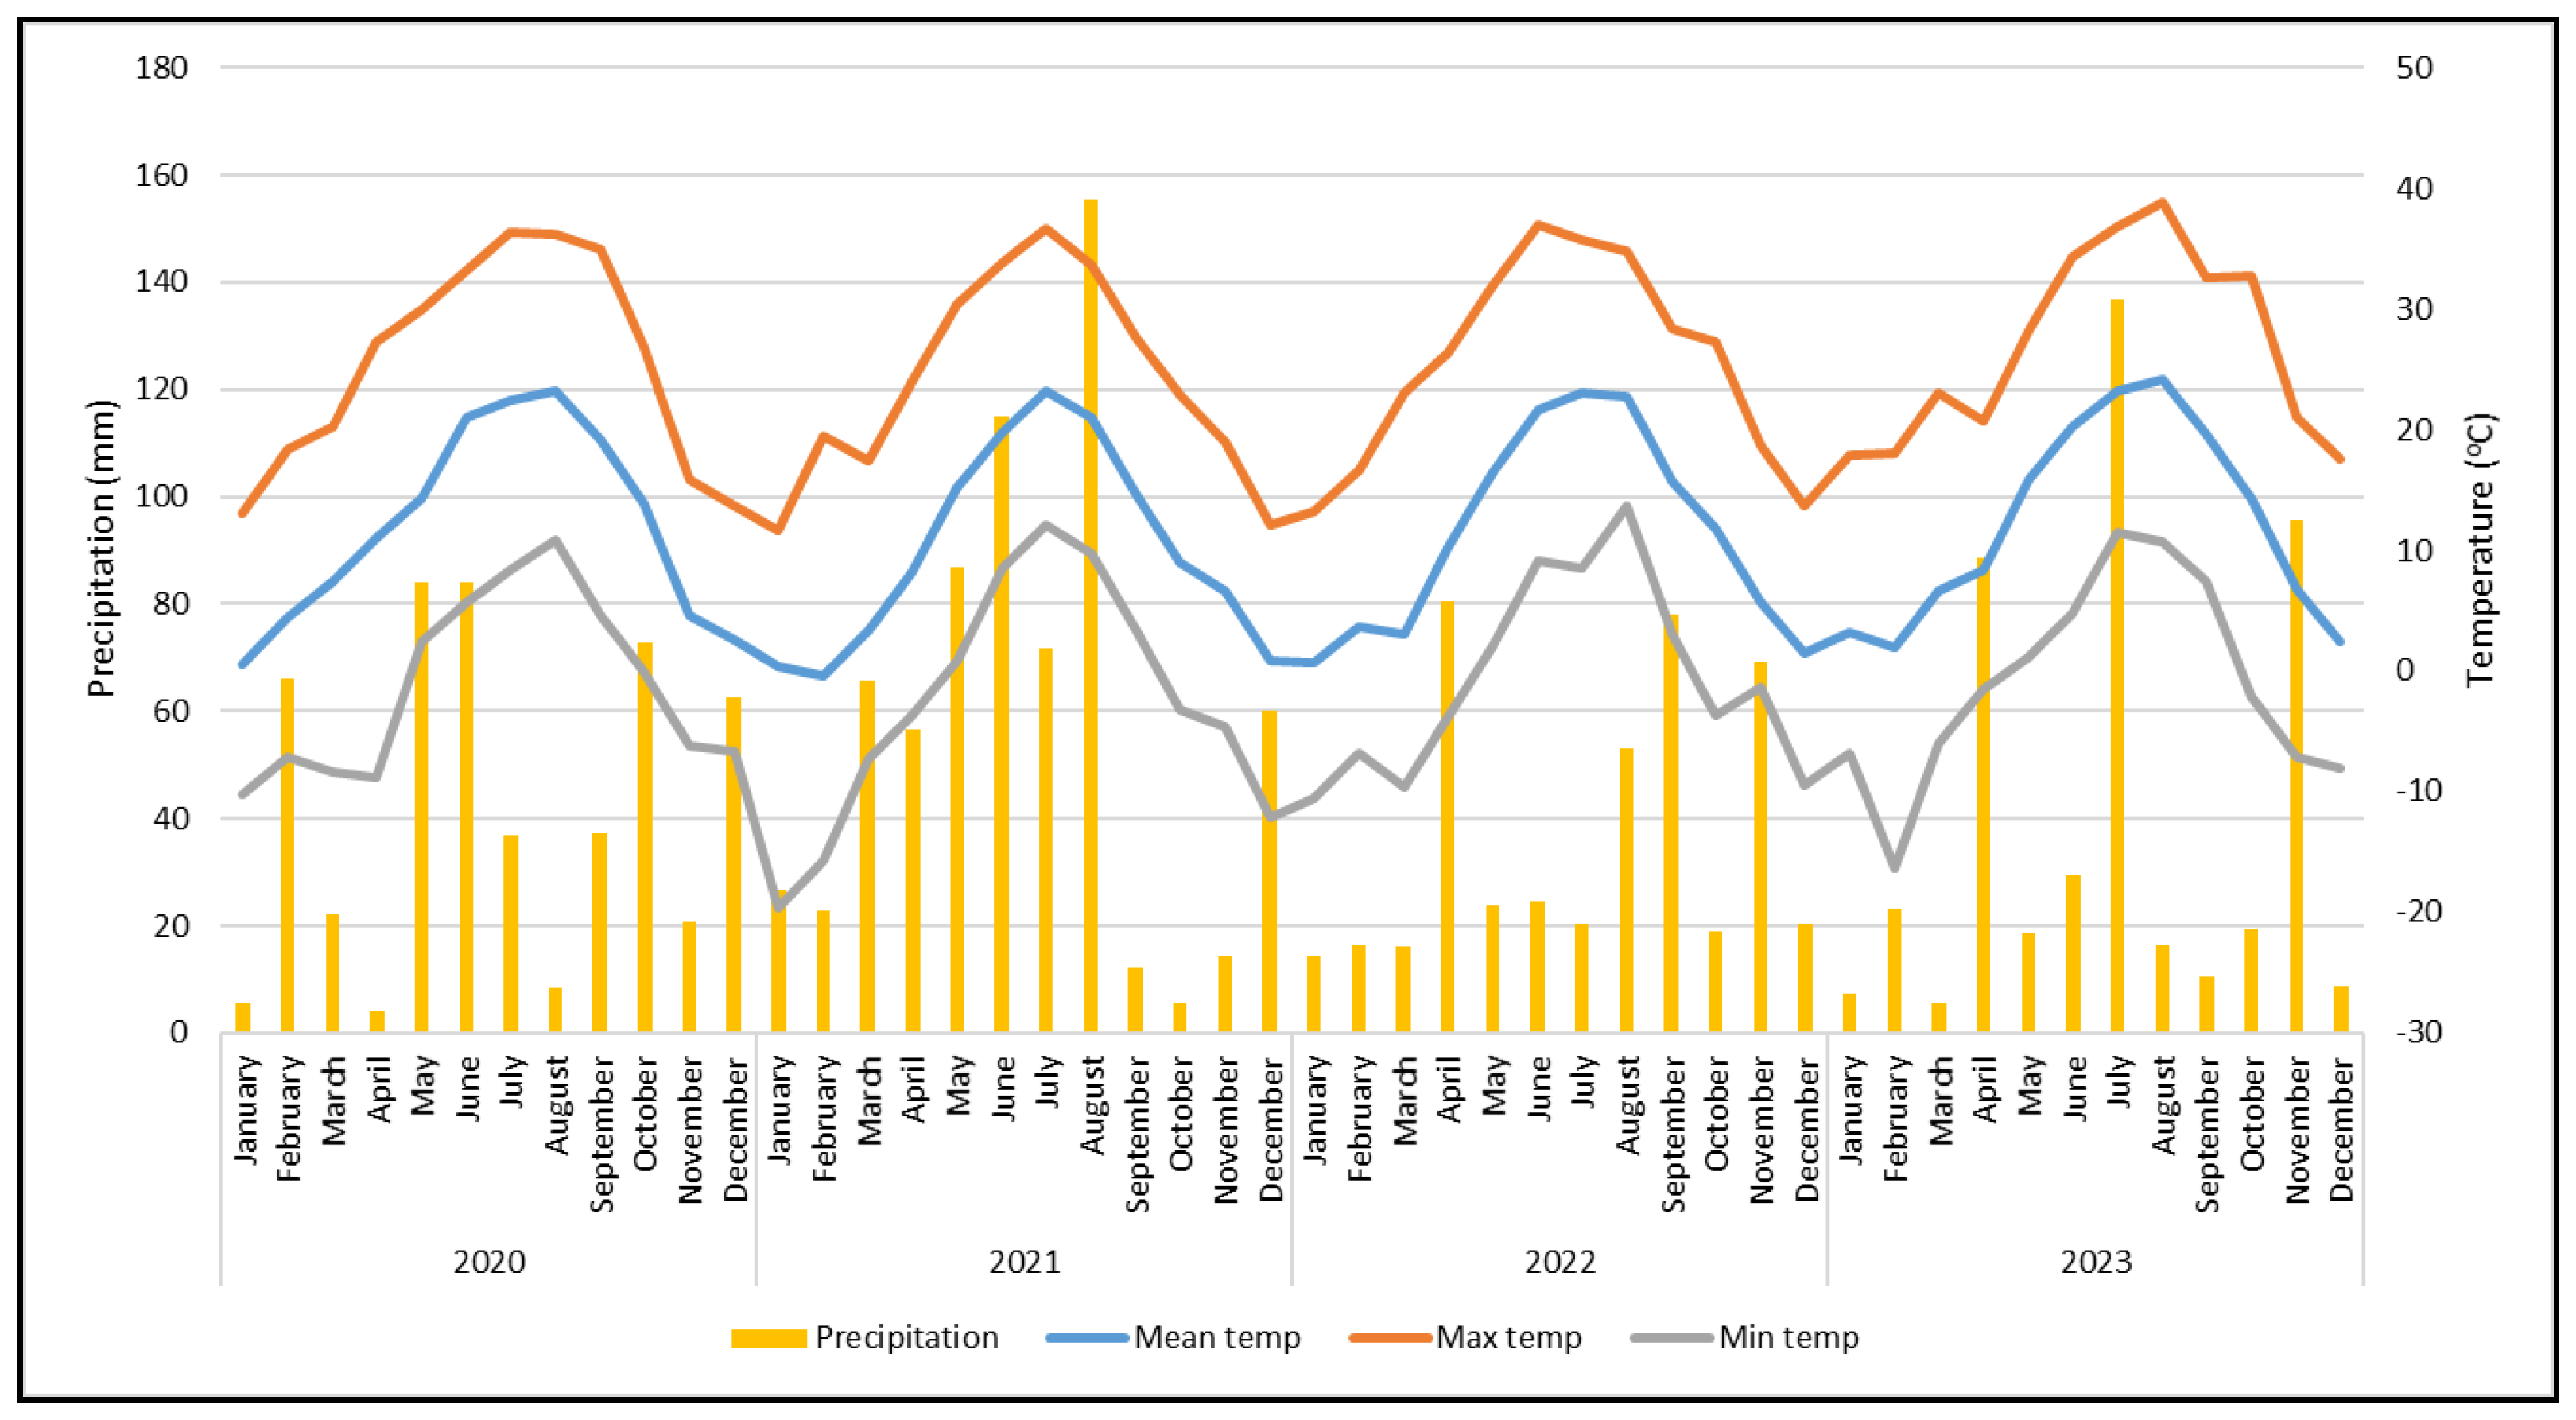
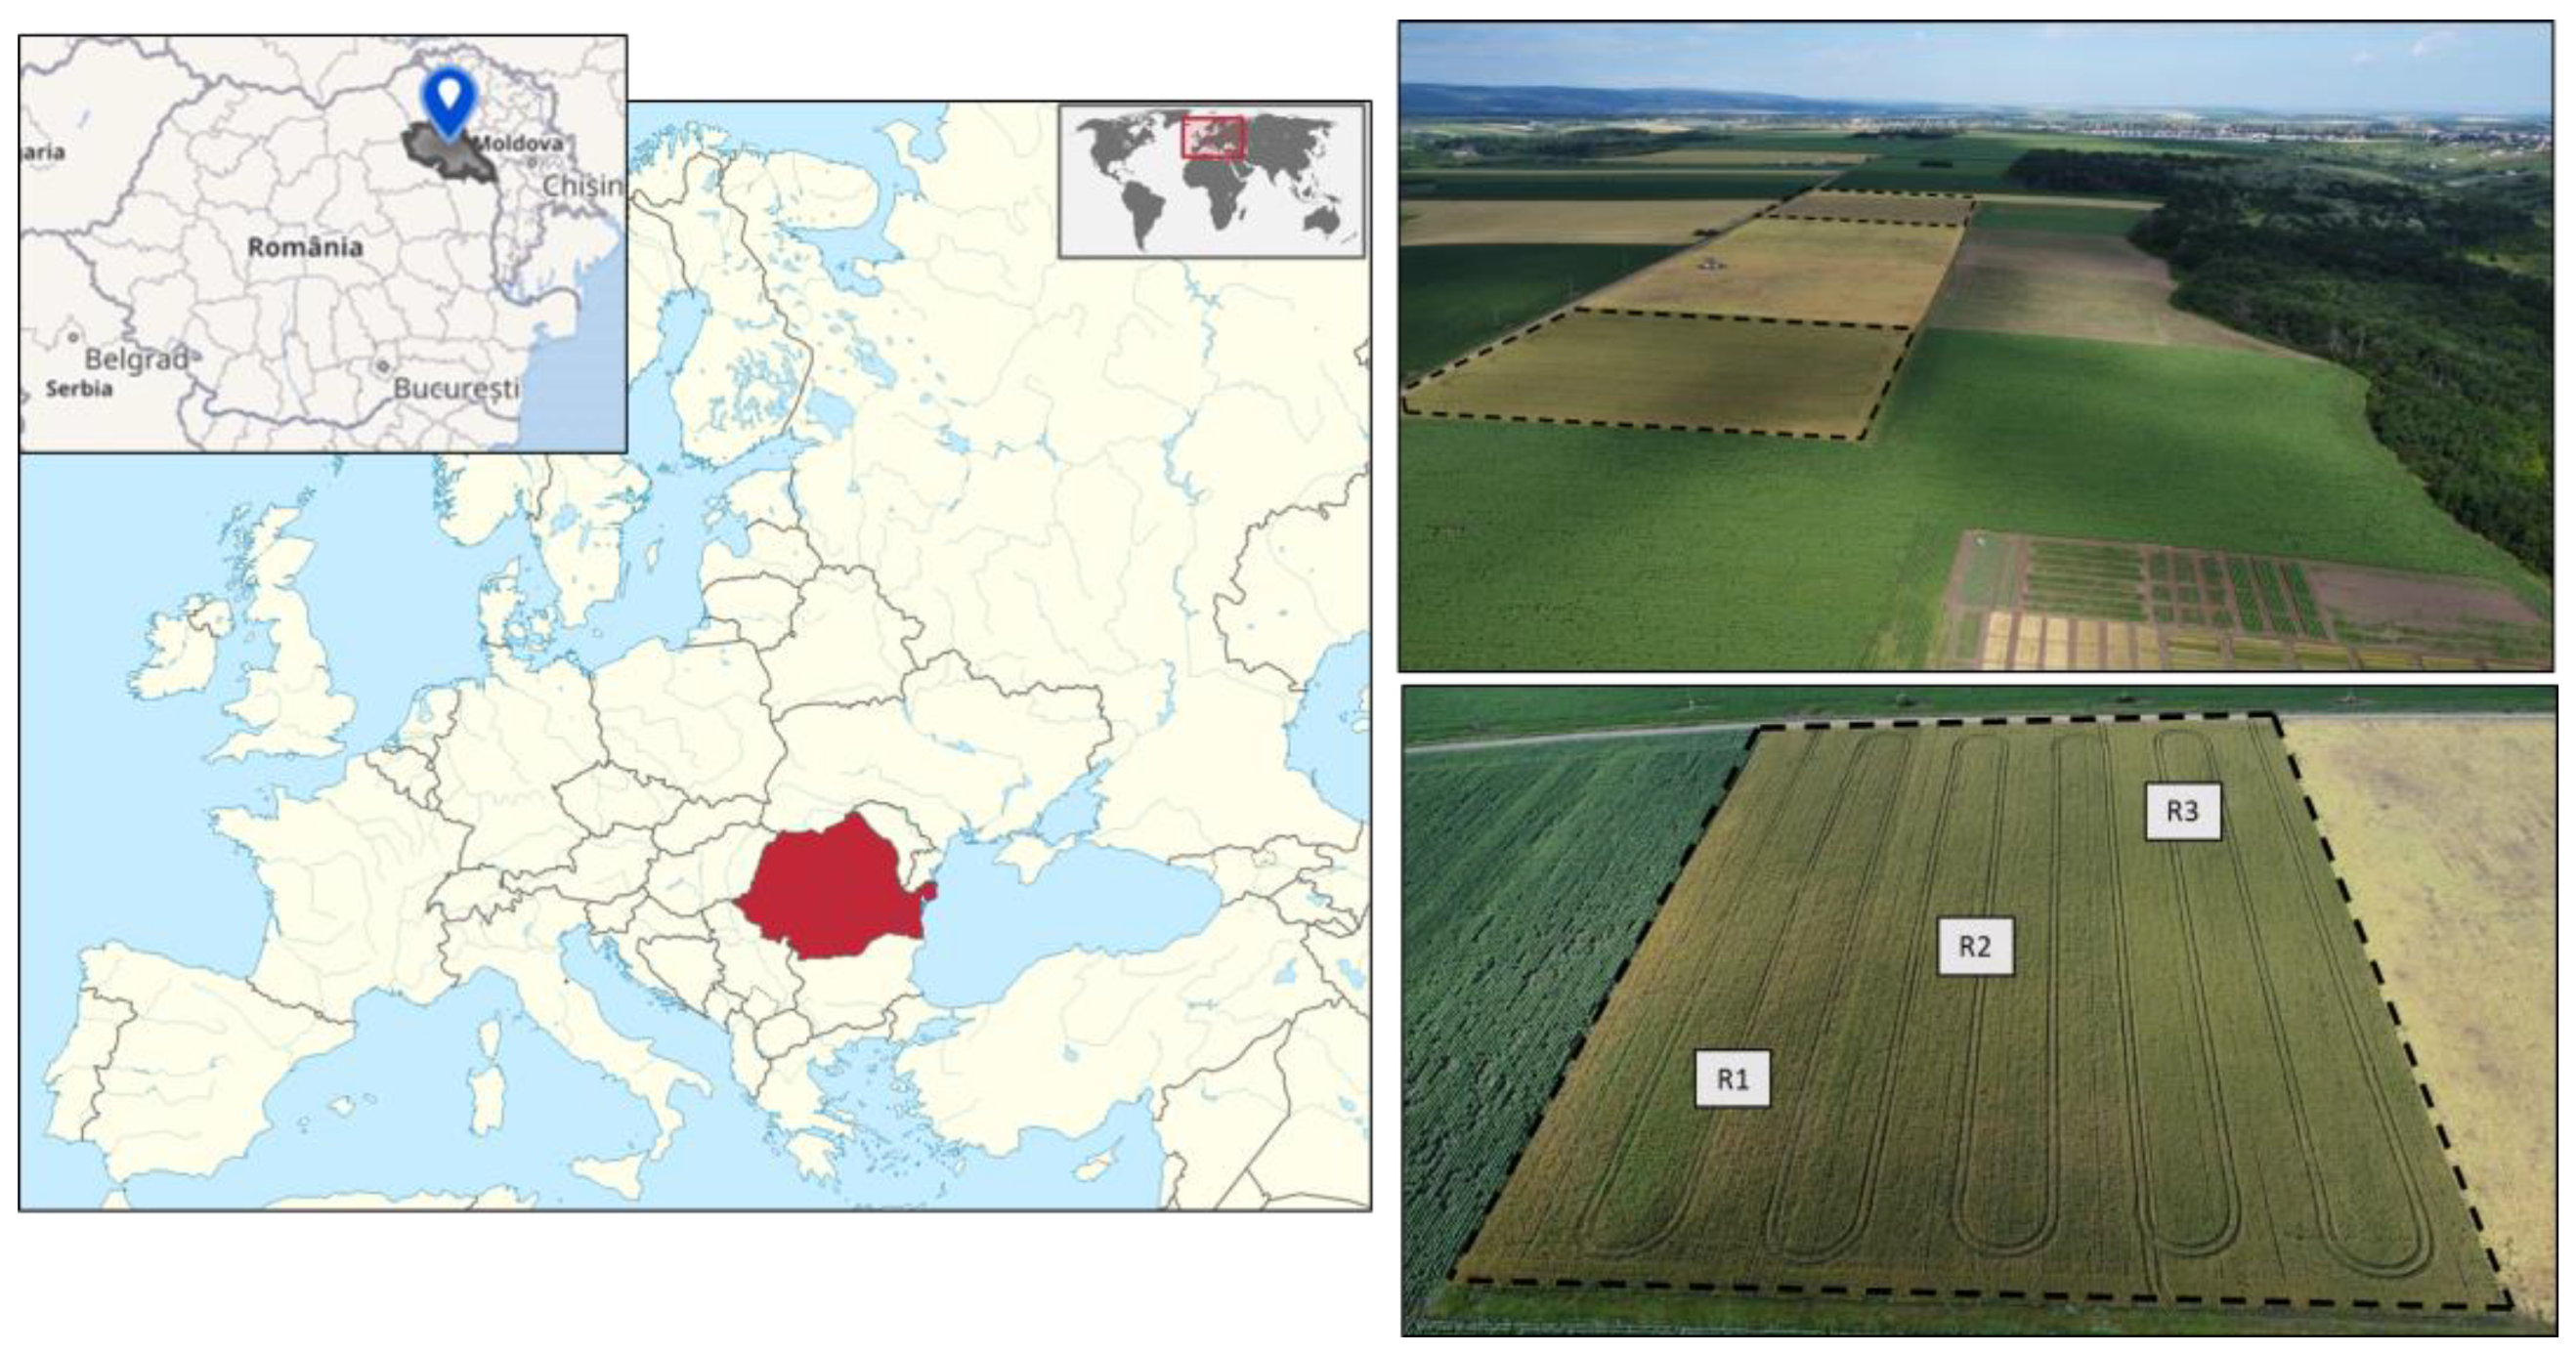
2.1. Research Site Characteristics

The experimental site was located at the Ezăreni Research and Student Practice Station in Iasi, Romania (47°07′ N latitude, 27°30′ E longitude). The long-term trial was established in 2014 and managed under non-irrigated practice. The soil of the experimental site is characterized as cambic chernozem (WRB Classification) with a clay–loam texture (36.1% clay, 26% silt, and 37.9% sand) [9]. The pH values range according to the tillage system, from 6.2 to 7.1 in NT and 6.8 to 7.2 in CT. The humus content under the NT system varies between 0.73 and 3.46%, and in the CT system varies between 1.65 and 3.25%. The maximum value is recorded at the soil surface, and the minimum at a depth of 30–40 cm. The cation exchange capacity of the soil varies in the interval from 23.4 to 25.6 me/100 g of soil [26].
The meteorological data recorded over the four years of this study reveal various weather conditions and seasonal variations. Monthly precipitation varies considerably across the dataset, with maximum values in May, June, and some months of August, which could indicate a wet season or specific experimental climatic conditions evolving from one year to the next. The mean precipitation recorded during the four years (2020–2023) of experimentation was 523.15 mm. As for the temperature data, they show typical periods with mean temperatures rising from winter (January, February) to summer (June, July, August), then decreasing in autumn and winter. Maximum temperatures show a similar cycle with seasonal climatic variations. Minimum temperatures show significant variability over the years, particularly during the winter months. There were some extreme measurements, such as a minimum temperature of −19.39 °C recorded in January and maximum temperatures in excess of 39 °C recorded in July. These two extremes are indicative of the considerable variation in temperatures and, consequently, in the climate observed in the study field. The temperature reached for the four years of the research was a mean of 11.43 °C (Figure 1).

2.2. Tillage Systems and Experimental Design

The research experiment was based on two tillage systems: conventional (CT), which involved plowing at a depth of 30 cm, and no tillage with direct seeding (NT). The NT practice was introduced in 2014, and our experiment began in 2020, after 6 consecutive years of cultivation. The total area of the experimental field was 16 ha, of which 8 ha was used in the CT system and 8 ha in the NT system. These were subdivided into 4 subplots, each with an area of 2 ha assigned to the following crops in rotation: winter wheat (Triticum aesyivum), maize (Zea mays), sunflowers (Helianthus annuus), and peas (Pisum sativum). Our study emphasized winter wheat specifically (Figure 2).
Winter wheat was sown on 5–15 October, carried out using a close-row crop drill (U21) with a normal row spacing of 12.5 cm in CT, while in the NT system, a Fabimag FG-01 at 17.5 cm was used. The aggregate working speed of 7–9 km/h was maintained to ensure optimum sowing quality. For both systems, the seeding rate was 180 kg/ha, and 200 kg of NPK fertilizer (10.24.0) was applied at seedbed preparation in the CT system and in the NT system. To control monocotyledonous and dicotyledonous weeds in both systems, herbicide Sekator Progress (0.15 l/ha) was used in the growing season. In the NT system, crop residues were maintained on the soil surface as mulch, and in the CT system, they were incorporated by tillage. The crop was harvested using the New Holland TC5050 combine, and yields were obtained automatically.

2.3. Soil Sampling

Over the four years of this study, soil samples were collected from the experimental plots in replicates, in two phases, and after sowing and harvesting of the winter wheat crop.
For water-stable aggregates (WSAs) and bulk density (BD), respectively, undisturbed soil samples were collected from the inter-row area in the middle of 0–10, 10–20, 20–30, and 30–40 cm depths in 3 replicates. (72 soil samples for each parameter were collected).
To determine the soil water content (SWC), soil samples were taken monthly throughout the growing season from five points per system at six different depths: 0–10, 10–20, 20–30, 30–50, 50–70, and 70–90 cm. Three replicates were taken at each depth.

2.4. Soil Analysis

BD was determined by weighing the soil samples following oven-drying for 24 h at 105 °C, and then using Equation (1) to compute the BD value [27]:
BD (g/cm3) = (weight of oven-dried soil)/(soil volume = 100 cm3)
The SWC was determined using the gravimetric method. To determine the gravimetric water content, the samples are weighed, oven-dried for 24 h at 105 °C, and then weighed again. Results were reported as % soil water on a dry-mass basis using Equation (2).
SWC (%) = (weight of wet soil (g) − weight of dry soil (g))/(weight of dry soil (g)) × 100
Typical Eijkelkamp wet sieving equipment (08.13, Eijkelkamp Soil & Water, Giesbeek, The Netherlands) was employed to determine the WSAs. In summary, 4.0 g of air-dried soil aggregates (ranging from 1 to 2 mm in diameter) were immersed in water on a sieve with a 0.25 mm mesh size for 3 min at a frequency of 35 cycles per minute. To separate the sand fractions, the aggregate that remained on the sieves was immersed once again in sodium hexametaphosphate solution (2 g L−1) for 15 min and 35 cycles per minute. Following drying, the proportion of WSAs was determined by weighing the aggregate fractions from hexametaphospate or sodium hydroxide, depending on their pH [28]. The WSAs were calculated using Equation (3).
W S A s % = B A + B × 100
where A = mass of soil without aggregate stability (g); B = mass of soil with aggregate stability (g).
The final yield numbers were adjusted to a standard grain moisture of 14% after the harvested seeds were cleaned and weighed.

2.5. Statistical Analysis

The method applied to analyze the collected data in our study was two-way analysis of variance (ANOVA), which is suitable for a randomized complete blocks design. The fixed factors considered were tillage systems (NT and CT) and depth. Two-way ANOVA was used to determine the effect of the tillage system, depth, and the tillage system–depth interaction on soil physical properties. Tukey’s test was used for determining whether there were significant differences between the treatments. SPSS 26.0 for Windows was used to perform statistical analyses (SPSS Inc., Chicago, IL, USA, 2007). The Pearson test was used to assess and measure the strength and direction of the correlation between the physical properties of the soil studied and yields. The graphs have been constructed using Excel software (version 16.0.4266.1001).

3. Results and Discussion

3.1. Influence of Tillage System on Soil Bulk Density (BD)

Conservative tillage systems predict a soil structure enhancement resulting from less soil disturbance and straw residue retention. Soil BD often indicates soil compaction to varying extents depending on the types of tillage operations applied [6]. The results presented in Table 1 show the impact of different tillage systems on BD at the sowing and harvesting stages over four years. At the sowing stage, the soil under NT consistently has a lower BD in the top layer (0–10 cm) compared to CT across the years, indicating an improvement in soil structure and a potential improvement in water infiltration and root penetration. All values of BD from the sowing period created optimal conditions for seedbed preparation and were below the values that could diminish root development. The higher BD values to a depth of 10–20 cm (1.42 g/cm3 and 1.45 g/cm3, respectively) in NT than CT (1.26 g/cm3 and 1.31 g/cm3, respectively) highlight the long-term benefits of NT in maintaining soil quality. At the harvest stage, between years, the differences in BD become less pronounced, especially at greater depths (20–40 cm), where BD values for the two tillage systems are similar (1.44 and 1.41 g/cm3 in NT and 1.25 and 1.27 g/cm3 in CT). This result confirms those observed in other regions that have demonstrated that NT can either improve or reduce soil BD, depending on the year of tillage management application [29]. However, while NT can initially reduce compaction near the surface, other factors such as crop growth and SWC can lead to similar levels of BD at harvest. It is interesting to underline that in 2023 there is a considerable increase in BD for NT at a depth of 10–20 cm (1.54 g/cm3), indicating greater compaction, which may be related to the existence of crop residues or residues of previous crops in the conservation system, which provide protection against the dispersive action of rainfall and, therefore, prevent the destruction of soil aggregates, compared to CT.
BD values tend to vary with soil depth and year, indicating potential changes in soil structure and compaction related to tillage practices. In the surface layers (0–10 cm), the BD values for NT at the time of sowing are generally lower than those for CT, suggesting that NT may favor a less compact and healthier topsoil structure, conducive to seed germination and root development. These results are in agreement with the results of Gao et al. and Țopa et al., who reported a significantly higher BD value in the 0–10 cm layer under CT [6,30]. Analyzing the 10–20 cm layers, we observed that soil BD was significantly higher in NT compared to CT. Similar results were also reported by Osunbitan et al., Shokoofeh et al., and Burtan et al., who, respectively, showed in their study that the highest BD values were obtained with the NT system and at depths of 10–20 cm [31,32,33]. In addition, an increase in BD improved soil mechanical resistance, leading to adverse impacts on root length, topsoil volume, and mass within a certain soil volume. This limited growing roots, leading to inadequate development and inconsistent dispersion [34,35,36]. Despite the highest BD value (1.54 g/cm3) obtained under the NT treatment at a depth of 10–20 cm, this value is below the critical values (1.65 g/cm3) that might compromise or restrict plant/crop growth. This result and the observation from our study are in accordance with those of Arshad et al. and Kaufmann et al. [37,38].

3.2. Influence of Tillage System on Soil Water Content (SWC)

Soil water conservation measures in agriculture are essential to maintain agricultural productivity in a changing environment and an evolving climate [39]. According to this research, the results in Figure 3 illustrate the SWC at various depths and at sowing for CT and NT systems over four years (2020–2023). From these results, it is evident that the NT system consistently has a higher SWC than the CT system in all depth intervals down to 30 cm, except at the 10–20 cm depth in 2023. At 0–10 cm, NT reached a maximum of 20.99% in 2022, which is significantly higher than the maximum recorded for CT at 13.28% in the same year. This trend is pronounced deeper in the soil profile, particularly at the 20–30 cm depth, where NT outperformed CT in most years. In contrast, CT shows some advantages in deeper soil layers (30–50 cm and below), especially in 2023, where the SWC was equal to or greater than NT at total depths of 30–50 cm and 50–70 cm. This indicates that CT may be more effective in improving water retention and accessibility at greater depths, probably due to improved soil structure and aeration. Another factor influencing this result is the climatic conditions between 2022 and 2023. Indeed, a very low precipitation level was recorded in 2022, characterizing this year as a dry year, whereas in 2023, a high precipitation level was recorded.
Comparing the SWC between these two tillage practices at different depths provides an insight into their impact during this critical phase of crop development (Figure 4). At the 0–10 cm depth, both tillage systems showed a relatively high water content, with NT generally showing a slightly higher SWC than CT in most years. NT reached a maximum SWC of 24.93% in 2021, compared with 22.80% for CT in the same year. This top layer of soil is crucial because it directly influences crop health and yield at the harvesting stage. However, when we assess the deeper soil layers, distinct trends can be observed. At a depth of 10 to 20 cm, CT maintained a significant advantage in 2021, with a higher SWC than NT. This result can be explained by the abundant precipitation recorded during 2021, which was considerably maintained in the deeper layers. Conversely, at depths ranging from 20 to 30 cm, NT reported lower moisture content values, indicating that CT may better maintain moisture in these specific deeper layers, especially during critical periods of pre-harvest soil moisture demand. This trend continues at the 30–50 cm depth, where CT consistently has a higher moisture content, peaking at 24.47% in 2023, compared with 23.46% for NT. As a result, it is interesting to note that while both tillage systems showed a decrease in mean SWC at greater depths (50–90 cm), CT remained significantly higher than NT in most cases, suggesting that CT may improve the ability of soils to maintain water deeper in the profile. This result may also be associated with climatic conditions, in particular the precipitation recorded in 2023, which may have infiltrated and been stored in the deeper layers, thus increasing the water content in these deeper layers. The benefits of CT in deeper soil layers could be attributed to enhanced soil structure, aeration, and rooting depth, which could promote better water retention as harvest approaches.
Overall, the results suggest that while NT can be effective in the retention of water in the surface layers, CT appears to provide significant advantages in the storage of soil water at depth. These results highlight the influence of tillage practices on SWC, which can significantly affect crop management strategies, notably at the sowing stage, when adequate SWC is essential for germination and seed establishment. But they also demonstrate their crucial importance in maintaining water availability for plants through to the harvest stage. These results obtained during our research are, on the one hand, similar to those obtained by Rahimzadeh, Martins et al., who demonstrated in their study that significant values of SWC were obtained with CT [40,41]. On the other hand, our results confirm those obtained by Ussiri and Lal et al., Salem et al., and Wazzan et al. in their studies and study conditions, affirming that NT increases SWC [42,43,44].

3.3. Influence of Tillage System on Water-Stable Aggregates (WSAs)

Soil tillage practices show a significant and varied impact on soil structure. Data on WSAs presented in Table 2 indicate the effect of CT and NT tillage systems on soil aggregation at the sowing and harvest stages over four years. At the sowing stage (all years combined), NT has consistently higher percentages of WSAs at depths of 0–10 cm and 10–20 cm than CT. In 2021, NT reached 75.37% and 77.08% at depths of 0–10 cm and 10–20 cm, respectively, while CT recorded significantly lower values of 52.52% and 52.57% at the same depths. This indicates that NT soils may have improved aggregation and stability, promoting better soil structure for water retention and aeration, which is essential for seed germination and early plant growth. At the harvesting stage, the differences between the tillage systems seem to diminish, especially at greater depths. In 2023, although NT shows a decrease in WSAs in the deeper layers (20–30 cm) with values of 65.50% compared to CT of 78.38% at the same depth, the percentages for NT remain relatively consistent close to surface level. The observed CT value (82.14%) at 30–40 cm in 2023 suggests an accumulation of soil aggregates, perhaps as a result of CT farming practices, but due to the detriment of surface soil quality.
The percentage of WSAs varied significantly between the two tillage systems, as did soil depth and year. In the overall trend, NT appears to maintain a higher level of stable aggregates at the 10–20 cm layer and at greater depths than CT, especially at the seeding stage. These results are similar to those obtained by Strudley et al., Alvarez and H.S. Steinbach, Raus et al., and Burtan et al. [17,33,45,46]. The higher percentages of WSAs under NT, especially at the seeding stage, indicate a positive effect on soil microbiological activity, and erosion resistance is improved. This structural stability enhances infiltration and water retention, improving the overall health of the soil through NT practices. The consistent maintenance of higher WSAs under NT practices at different depths and stages is evidence that this tillage system can improve soil aggregation over time. This provides further support for NT practices, suggesting that they could be more sustainable in terms of soil health and crop production. Conversely, lower CT values, specifically observed in the upper soil layers, may indicate a risk of increased erosion and reduced soil bioactivity, with potential negative ramifications for long-term soil structure and crop productivity. In addition, while CT methods can provide good aggregate stability in the deeper layers after harvesting, surface soil compaction and lower WSAs at the start of the season can limit their efficiency and long-term durability.

3.4. Correlation Between Soil Physical Properties Studied

A Pearson correlation test was applied to analyze the linear relationship between the studied physical properties. The results (Table 3) from this analysis demonstrate that in 2020, a significant positive correlation (r = 0.458**) suggests that as BD increases, the amount of WSAs also tends to increase. This could indicate that greater compaction may be associated with better aggregate formation under specific conditions, perhaps due to increased contact with soil particles. A very weak correlation (0.026) suggests that WSAs have the least influence on SWC for this year. This could indicate that aggregate stability is not directly correlated with SWC in this context. A negative correlation (−0.640) indicates that higher BD is significantly associated with lower SWC. This indicates that increased compaction reduces the pore space, thereby reducing the soil’s ability to retain water. In 2021, the correlation remains positive but decreases to 0.438**, indicating a less pronounced relationship than the previous year, which could suggest variability in aggregation processes or the influence of other factors such as crop rotation. A significant positive correlation (0.407**) is found, suggesting that WSAs may have a greater role in influencing SWC. This indicates that better soil aggregation contributes to improved water retention capacity, thus improving soil functionality. A weak negative correlation (−0.057) suggests a weaker association between BD and SWC that year, which could be explained by the application of crop rotation and rainfall in that year, despite the BD. In 2022, the correlation then fell to (0.321**), which is still significant but indicates a decreasing relationship. This trend suggests that the factors influencing aggregate formation and stability may be less dependent on BD over time. The correlation becomes weak and negative (−0.108), indicating a potential decoupling between WSAs and SWC. This could indicate that other factors, such as crop rotation or precipitation involving climatic variation, may have a greater influence on SWC during this period. The low correlation (0.038) indicates that the relationship between BD and SWC weakens over time. This may mean that the factors influencing water retention in the soil depend less and less on BD. The same observation was recorded in 2023, with a correlation of 0.089 between these two parameters. In 2023, the correlation becomes negative (−0.149), showing an inverse relationship where higher BD could be associated with lower levels of WSAs. This could indicate that at higher BD, soil structure is compromised, leading to reduced aggregation, probably due to the effects of compaction. The correlation between WSAs and SWC remains weak, further emphasizing the hypothesis that the structural aspects of the soil may not have been the main determinants of water retention that year, underlining the complexity of the relationship between soil and water.
The perfect negative correlation observed between BD and yield (−1.000**) over the four years of research indicates that an increase in BD is characteristic of soil compaction and that a reduction in pore space is associated with a significant reduction in crop yield. This can be explained by the importance of adequate soil structure for root development and water infiltration, both of which are crucial for optimizing crop production. This observation between BD and yield is identical to that obtained between SWC and yield. Thus, high humidity has a positive influence on yield by guaranteeing sufficient moisture for absorption by the plants, specifically during periods of growth. The trends in these correlation coefficients over the years indicate a complex interaction between BD, WSAs, and SWC. While early years show significant relationships, particularly between bulk density and soil water content, later years show a decrease in the strength of these correlations. This reflects possible changes in soil structure and health due to management practices, environmental and climatic factors, or crop rotation systems. This trend in the results obtained during this research is similar to that obtained by Y. Dai et al. in their study on the variation of surface aggregates in the degradation process of the dry red soil in the Jinsha River Dry-Hot Valley [47]. In addition, the annual variation in the observed correlation relationship between BD, SWC, and WSAs may be due to water content dynamics and soil compaction processes, where a high SWC may reduce compressibility, affecting BD differently depending on years, precipitation, and depth. Varying climatic conditions have a considerable influence on SWC and WSAs [48,49]. Many studies on soil physical properties and qualities have shown that BD is often negatively correlated with other soil quality indicators, including SWC, highlighting the complex interactions in which increased compaction (higher BD) can reduce soil porosity and water-holding capacity, but these relationships can evolve as a function of environmental conditions and soil management [50]. In summary, the annual variation in the correlation between BD, SWC, and WSAs is determined by the dynamics of soil moisture, soil compaction processes, the effects of vegetation, and the state of soil degradation. These factors cause the strength and direction of correlations to change over time and with soil depth, as confirmed by numerous studies analyzing soil physical properties and their interactions under varying environmental conditions.

3.5. Influence of Tillage System on Winter Wheat Yield

Currently, intensive, high-yield agriculture causes significant soil pressure, and the absence of understanding of soil responses to such demands may result in negative impacts manifested through degradation processes, reducing yield potential. The development of any tillage system must take into account soil conditions, crops, and climate, which can affect or be affected by that system [17]. The results in Table 4 show the yields obtained under the NT and CT for the years 2020–2023, indicating differences between the two systems. It is evident that while NT shows considerable variability and lower yields in some years, CT consistently produces higher yields throughout the study period. In 2020 and 2021, NT yields were significantly lower than CT, which could highlight the advantages of soil disturbance associated with CT, such as better seedbed preparation and weed control. However, in 2022, NT yields were competitive, although lower than CT yields, which could be due to more efficient water conservation in NT. This result is confirmed by several authors who have shown that yield production is high under CT. Furthermore, Popp et al. and Bogunovic et al., respectively, have shown that the impact of tillage systems on grain yield also depends on the properties of the site and the year [51,52]. Other factors that could adversely affect yields in the NT system are higher weed levels in the absence of mechanical weed control and higher pest and pathogen numbers due to plant residues retained on the soil surface. This may result in increased weed pressure relative to the CT system, which removes weed seed reserves [53,54].
In the NE of Romania, farmers might get several benefits by adopting the NT system compared to CT. This approach improves conserving soil water content, mitigating soil erosion, and enhancing long-term fertility, all of which are significant given the diverse agro-climatic conditions of the region. NT can result in reduced operational costs and enhanced product quality, offering opportunities to access markets that emphasize sustainable agriculture. However, the decision to adopt this approach must be based on a comprehensive investigation of each farm, including local conditions, available resources, and market demands. Consequently, an integrated approach developed to local specificities would optimize the economic and environmental advantages of NT.

4. Conclusions

The results obtained after 4 years consolidate the concept that the conservative system is ideal for improving soil physical properties and highlight the potential advantages of NT over CT in terms of reducing soil BD, optimizing SWC, and increasing crop performance at the sowing and harvesting stages. In addition, NT may be effective in the retention of water content in the surface layers, while CT appears to offer significant advantages in the conservation of water content in the deeper layers of the soil. In addition, NT practices contribute more positively to soil health by maintaining lower BD, especially in the topsoil, than CT. This reduction in BD can improve soil structure, enhance root growth, and increase water infiltration. Also, NT significantly improves soil health by enhancing water-stable aggregates, notably in the topsoil. This enhancement of aggregate stability is essential for maintaining soil structure, reducing erosion, and improving water retention. In terms of correlation relationships, BD is an essential component of soil health and crop yields, with higher BD generally correlated with lower yields. This highlights the negative impact of compaction on agricultural productivity. However, the relationships between WSAs and SWC, on the one hand, and yield and BD, on the other, vary over time, suggesting that while WSAs and SWC are essential to soil health, their contribution can be variable depending on management practices and environmental conditions. Given the importance of soil health for sustainable agricultural productivity, the adoption of NT practices could be recommended as a soil management strategy to mitigate compaction and promote overall soil quality. It can have beneficial effects on soil quality and the sustainability of farming systems. Finally, our results suggest that the NT system could be a sustainable and practicable alternative for reducing soil tillage and its negative impacts without compromising crop yields, although the immediate yield benefits observed with CT may still be available in some conditions.

Author Contributions

Conceptualization, S.S.C., T.G.A., G.-D.M. and C.G.; methodology, S.S.C., A.U. and D.C.Ț.; software, S.S.C., G.-D.M. and A.U.; validation, D.C.Ț.; formal analysis, S.S.C., C.G. and T.G.A.; investigation, S.S.C., G.-D.M., C.-C.M., T.G.A. and C.G.; resources, D.C.Ț.; data curation, D.C.Ț.; writing—original draft preparation, S.S.C. and C.-C.M.; writing—review and editing, D.C.Ț.; visualization, D.C.Ț.; supervision, D.C.Ț.; project administration, D.C.Ț.; funding acquisition, D.C.Ț. All authors have read and agreed to the published version of the manuscript.

Funding

This research received no external funding.

Institutional Review Board Statement

Not applicable.

Data Availability Statement

Data are contained within the article; further inquiries can be directed to the corresponding authors.

Conflicts of Interest

The authors declare no conflicts of interest.

References

  1. Pearsons, K.A.; Omondi, E.C.; Zinati, G.; Smith, A.; Rui, Y. A tale of two systems: Does reducing tillage affect soil health differently in long-term, side-by-side conventional and organic agricultural systems? Soil Tillage Res. 2023, 226, 105562. [Google Scholar] [CrossRef]
  2. Fernandes, M.; Matheus, F.; Antonio, F.; Fernandes, C. Soil structure under tillage systems with and without cultivation in the off-season. Agric. Ecosyst. Environ. 2023, 342, 108237. [Google Scholar] [CrossRef]
  3. Johnson, A.M.; Hoyt, G.D. Changes to the soil environment under conservation tillage. HortTechnology 1999, 9, 380–393. [Google Scholar] [CrossRef]
  4. Sithole, N.J.; Magwaza, L.S.; Mafongoya, P.L. Conservation Agriculture and its impact on soil quality and maize yield: A South African perspective. Soil Tillage Res. 2016, 162, 55–67. [Google Scholar] [CrossRef]
  5. Turmel, M.S.; Speratti, A.; Baudron, F.; Verhulst, N.; Govaerts, B. Crop residue management and soil health: A systems analysis. Agric. Syst. 2015, 134, 6–16. [Google Scholar] [CrossRef]
  6. Țopa, D.; Cara, I.G.; Jităreanu, G. Long term impact of different tillage systems on carbon pools and stocks, soil bulk density, aggregation and nutrients: A field meta-analysis. Catena 2021, 199, 105102. [Google Scholar] [CrossRef]
  7. Singh, M.; Sarkar, B.; Sarkar, S.; Churchman, J.; Bolan, N.; Mandal, S.; Menon, M.; Purakayastha, T.J.; Beerling, D.J. Stabilization of soil organic carbon as influenced by clay mineralogy. Adv. Agron. 2018, 148, 33–84. [Google Scholar] [CrossRef]
  8. Zhang, M.; Wei, Y.; Kong, F.; Chen, F.; Zhang, H. Effects of tillage practices on soil carbon storage and greenhouse gas emission of farmland in North China. Trans. Chin. Soc. Agric. Eng. 2012, 28, 203–209. [Google Scholar] [CrossRef]
  9. Calistru, A.E.; Filipov, F.; Cara, I.G.; Cioboată, M.; Topa, D.; Jităreanu, G. Tillage and Straw Management Practices Influences Soil Nutrient Distribution: A Case Study from North Eastern Romania. Land. 2024, 13, 625. [Google Scholar] [CrossRef]
  10. Warkentin, B.P. The tillage effect in sustaining soil functions. J. Plant Nutr. Soil Sci. 2001, 164, 345–350. [Google Scholar] [CrossRef]
  11. Nouria, A.; Leea, J.; Yinb, X.; Tylerc, D.D.; Saxtond, A.M. Thirty-four years of no tillage and cover crops improve soil quality and increase cotton yield in Alsols, southeastern USA. Geoderma 2018, 337, 998–1008. [Google Scholar] [CrossRef]
  12. Marousek, J.; Gavurova, B. Recovering phosphorous from biogas fermentation residues indicates promising economic results. Chemosphere 2022, 291, 133008. [Google Scholar] [CrossRef] [PubMed]
  13. Francaviglia, R.; Almagro, M.; Vincente-Vincente, J.L. Conservation Agriculture and Soil Organic Carbon: Principles, Processes, Practices and Policy Options. Soil Syst. 2023, 7, 17. [Google Scholar] [CrossRef]
  14. Sione, S.M.J.; Wilson, M.G.; Lado, M.; Gonzalez, A.P. Evaluation of soil degradation produced by rice crop systems in a vertisol using a soil quality index. Catena 2017, 150, 79–86. [Google Scholar] [CrossRef]
  15. Lal, R. Tillage effects on soil degradation, soil resilience, soil quality, and sustainability. Soil Tillage Res. 1993, 27, 1–4. [Google Scholar] [CrossRef]
  16. Kumar, S.; Raj, A.D.; Kalambukattu, J.G.; Chatterjee, U. Climate Change Impact on Land Degradation and Soil Erosion in Hilly and Mountainous Landscape: Sustainability Issues and Adaptation Strategies. In Ecological Footprints of Climate Change: Adaptive Approaches and Sustainability; Springer: Cham, Switzerland, 2023; pp. 119–155. [Google Scholar] [CrossRef]
  17. Răus, L.; Jităreanu, G.; Ailincăi, C.; Pârvan, L.; Țopa, D. Impact of different soil tillage systems and organo-mineral fertilization on physical properties of the soil and on crops yield in pedoclimatical conditions of Moldavian plateau. Rom. Agric. Res. 2016, 33, 111–123. [Google Scholar]
  18. Hernanz, J.L.; Peixoto, H.; Cerisola, C.; Sanchez-Giron, V. An empirical model to predict soil bulk density profiles in field conditions using penetration resistance, moisture content and soil depth. J. Terramechanics 2000, 37, 167–184. [Google Scholar] [CrossRef]
  19. Vereecken, H.; Schnepf, A.; Hopmans, J.W.; Javaux, M.; Or, D.; Roose, T.; Vanderborght, J.; Young, M.H.; Amelung, W.; Aitkenhead, M.; et al. Modeling soil processes: Review, key challenges, and new perspectives. Vadose Zone J. 2016, 15, vzj2015-09. [Google Scholar] [CrossRef]
  20. Busari, M.A.; Kukal, S.S.; Kaur, A.; Bhatt, R.; Dulazi, A.A. Conservation tillage impacts on soil, crop and the environment. Int. Soil Water Conserv. Res. 2015, 3, 119–129. [Google Scholar] [CrossRef]
  21. Ardvidsson, J.; Ararso, E.; Tomas, R. Crop yield in Swedish experiments with shallow tillage and no tillage 1983–2012. Eur. J. Agron. 2014, 52, 307–315. [Google Scholar] [CrossRef]
  22. TerAvest, D.; Capenter-Boggs, L.; Thierfelder, C.; Reganold, J.P. Crop production and soil water management in conservation agriculture, no-till, and conventional tillage systems in Malawi. Agric. Ecosyst. Environ. 2015, 212, 285–296. [Google Scholar] [CrossRef]
  23. Onisie, T.; Zaharia, M. Lucrări Practice Agrotehnică; Editura Ion Ionescu de la Brad Iași: Iasi, Romania, 2002. [Google Scholar]
  24. Jakku, E.; Fleming, A.; Esping, M.; Fielke, S.; Finlay-Smits, S.C.; Turner, J.A. Disruption disrupted? Reflecting on the relationship between responsible innovation and digital agriculture research and development at multiple levels in Australia and Aotearoa New Zealand. Agric. Syst. 2023, 204, 103555. [Google Scholar] [CrossRef]
  25. Liu, S. Towards a sustainable agriculture: Achievements and challenges of Sustainable Development Goal Indicator. Glob. Food Secur. 2023, 37, 100694. [Google Scholar] [CrossRef]
  26. Mihu, G.D.; Ursu, A.; Filip, M.; Țopa, D.; Jitǎreanu, G. The influence of tillage systems on nutrients supply in soil on corn crop at the Ezareni farm, Iasi County. Res. J. Agric. Sci. 2022, 54, 93–100. [Google Scholar]
  27. Blake, G.R.; Hartge, K.H. Bulk density In Klute. Soc. Agron. 1986, 5, 363–375. [Google Scholar] [CrossRef]
  28. Kemper, W.D.; Rosenau, R.C. Aggregate stability and size distribution. In Methods of Soil Analysis: Part 1 Physical and Mineralogical Methods; American Society of Agronomy,: Madison, WI, USA, 1986; Volume 9, pp. 425–442. [Google Scholar]
  29. Blanco-Canqui, H.; Ruis, S.J. No-tillage and soil physical environment. Geoderma 2018, 326, 164–200. [Google Scholar] [CrossRef]
  30. Gao, L.; Wang, B.; Li, S.; Wu, H.; Wu, X.; Liang, G.; Gong, D.; Zhang, X.; Cai, D.; Degre, A. Soil wet aggregate distribution and pore size distribution under different tillage systems after 16 years in the Loess plateau of China. Catena 2019, 173, 38–47. [Google Scholar] [CrossRef]
  31. Osunbitan, J.A.; Oyedele, D.J.; Adekalu, K.O. Tillage effects on bulk density, hydraulic conductivity and strength of a loamy sand soil in southwestern Nigeria. Soil Tillage Res. 2005, 82, 57–64. [Google Scholar] [CrossRef]
  32. Shokoofeh, S.K.; Seyed, A.K.; Sadegh, A.; Mahesh, K.G. Changes in Soil Properties and Productivity under Different Tillage Practices and Wheat Genotypes: A Short-Term Study in Iran. Sustainability 2018, 10, 3273. [Google Scholar] [CrossRef]
  33. Burtan, L.; Ţopa, D.; Jităreanu, G.; Calistru, A.E.; Răus, L.; Cara, I.G.; Sîrbu, C. The influence of conservative tillage systems on physico-chemical properties and yield under a cambic chernozem from northeastern part of Romania. Rom. Agric. Res. 2020, 37, 141–149. [Google Scholar] [CrossRef]
  34. Bengough, A.G.; McKenzie, B.M.; Hallett, P.D.; Valentine, T.A. Root elongation, water stress, and mechanical impedance: A review of limiting stresses and beneficial root tip traits. J. Agric. Sci. Technol. 2011, 2, 59–686. [Google Scholar] [CrossRef] [PubMed]
  35. Colombi, T.; Torres, L.C.; Walter, A.; Keller, T. Feedbacks between soil penetration resistance, root architecture and water uptake limit water accessibility and crop growth—A vicious circle. Sci. Total Environ. 2018, 626, 1026–1035. [Google Scholar] [CrossRef] [PubMed]
  36. Grzesiak, S.; Grzesiak, M.T.; Hura, T.; Marci´nska, I.; Rzepka, A. Changes in root system structure, leaf water potential and gas exchange of maize and triticale seedlings affected by soil compaction. Environ. Exp. Bot. 2013, 88, 2–10. [Google Scholar] [CrossRef]
  37. Arshad, M.A.; Lowery, B.; Grossman, B. Physical Tests for Monitoring Soil Quality. In Methods for Assessing Soil Quality; Doran, J.W., Jones, A.J., Eds.; Soil Science Society of America: Madison, WI, USA, 1996; pp. 123–141. [Google Scholar]
  38. Kaufmann, M.; Tobias, S.; Schulin, R. Comparison of critical limits for crop plant growth based on different indicators for the state of soil compaction. J. Plant Nutr. Soil Sci. 2010, 173, 573–583. [Google Scholar] [CrossRef]
  39. Acar, M.; Çelik, İ.; Günal, H. Effects of long-term tillage systems on soil water content and wheat yield under mediterranean conditions. J. New Theory 2017, 17, 98–108. [Google Scholar]
  40. Rahimzadeh, R.; Navid, H. Implications of different soil management practices on clayey soil characteristics and a rotation of wheat -legumes in a rainfed condition. J. Agric. Sci. Sustain. Prod. 2011, 2. [Google Scholar]
  41. Martins, R.N.; Portes, M.F.; e Moraes, H.M.F.; Junior, M.R.F.; Rosas, J.T.F.; Junior, W.D.A.O. Influence of tillage systems on soil physical properties, spectral response and yield of the bean crop. Remote Sens. Appl. Soc. Environ. 2021, 22, 100517. [Google Scholar] [CrossRef]
  42. Ussiri, D.A.N.; Lal, R. Long term tillage effects on soil carbon storage and carbon dioxide emissions in continuous corn cropping systems from an Alfisol in Ohio. Soil Tillage Res. 2009, 104, 39–47. [Google Scholar] [CrossRef]
  43. Salem, H.M.; Valero, C.; Muñoz, M.A.; Rodríguez, M.G.; Silva, L.L. Short-term effects of four tillage practices on soil physical properties, soil water potential, and maize yield. Geoderma 2015, 237–238, 60–70. [Google Scholar] [CrossRef]
  44. Wazzan, F.A.; Muhammad, S.A. Effects of Conservation and Conventional Tillage on some Soil Hydraulic Properties. IOP Conf. Ser. Earth Environ. Sci. 2022, 1060, 12002. [Google Scholar] [CrossRef]
  45. Strudley, M.W.; Green, T.R. Tillage effects on soil hydraulic properties in space and time: State of the science. Soil Tillage Res. 2008, 99, 4–48. [Google Scholar] [CrossRef]
  46. Alvarez, R.; Steinbach, H.S. A review of the effects of tillage systems on some soil physical properties, water content, nitrate availability and crops yield in the Argentine Pampas. Soil Tillage Res. 2009, 104, 1–15. [Google Scholar] [CrossRef]
  47. Dai, Y.; Zhang, L.; Wang, J.; Chen, Z.; Xie, Y. The Variation of Surface Aggregates in the Degradation Process of the Dry Red Soil in Jinsha River Dry-Hot Valley. In International Conference on Logistics Engineering, Management and Computer Science (LEMCS 2015); Atlantis Press: Dordrecht, The Netherlands, 2015. [Google Scholar] [CrossRef]
  48. Bogunovic, I.; Pereira, P.; Kisic, I.; Birkás, M.; Rodrigo-Comino, J. Spatiotemporal variation of soil compaction by tractor traffic passes in a Croatian vineyard. J. Agric. Sci. Technol. 2019, 21, 1921–1932. [Google Scholar]
  49. Ma, G.; Zhang, Y.; Li, H.; Yang, Y.; Li, R. Dynamics and interactions of soil moisture and temperature during degradation and restoration of alpine swamp meadow on the Qinghai-Tibet plateau. Front. Environ. Sci. 2025, 13, 1476167. [Google Scholar] [CrossRef]
  50. Zhao, H.; Wu, L.; Zhu, S.; Sun, H.; Xu, C.; Fu, J.; Ning, T. Sensitivities of physical and chemical attributes of soil quality to different tillage management. Agronomy 2022, 12, 1153. [Google Scholar] [CrossRef]
  51. Popp, M.P.; Keisling, T.C.; McNew, R.W.; Oliver, L.R.; Dillon, C.R.; Wallace, D.M. Planting date, cultivar, and tillage system effects on dryland soybean production. Agron. J. 2022, 94, 81–88. [Google Scholar] [CrossRef]
  52. Bogunovic, I.; Pereira, P.; Kisic, I.; Sajko, K.; Sraka, M. Tillage management impacts on soil compaction, erosion and crop yield in Stagnosols (Croatia). Catena 2018, 160, 376–384. [Google Scholar] [CrossRef]
  53. Ali, A.; Streibig, J.C.; Andreasen, C. Yield loss prediction models based on early estimation of weed pressure. Crop Prot. 2013, 53, 125–131. [Google Scholar] [CrossRef]
  54. Corcoran, E.; Afshar, M.; Curceac, S.; Lashkari, A.; Raza, M.M.; Ahnert, S.; Morris, R. Current data and modeling bottlenecks for predicting crop yields in the United Kingdom. Front. Sustain. Food Syst. 2023, 7, 1023169. [Google Scholar] [CrossRef]
Figure 1. Precipitation and temperature data of the research site from 2020 to 2023 (www.fieldclimate.com, accessed on 13 March 2025).
Agriculture 15 00989 g001
Figure 2. The geographic location of the research plot on a map of Europe and the layout of the experimental area.
Agriculture 15 00989 g002
Figure 3. Variations and dynamics of soil water content at 0–90 cm depths under tillage at sowing stage from 2020 to 2023. NT: no tillage; CT: conventional tillage. Error bars represent the corresponding standard error of mean values. Different letters indicate significant differences between treatments during this period at the 0.05 level. The largest means are marked with the letter “a”.
Agriculture 15 00989 g003
Figure 4. Variations and dynamics of soil water content at 0–90 cm depths under tillage at harvesting stage from 2020 to 2023. NT: no tillage; CT: conventional tillage. Error bars represent the corresponding standard error of mean values. Different letters indicate significant differences between treatments during this period at the 0.05 level. The largest means are marked with the letter “a”.
Agriculture 15 00989 g004
Table 1. Effect of tillage system on soil bulk density (BD).
Bulk density (BD)
(g/cm3)
YearSoil Depth (cm)NTCT
SowingHarvestingSowingHarvesting
20200–101.17 ± 0.09 b1.39 ± 0.14 b1.22 ± 0.07 a1.24 ± 0.10 a
10–201.42 ± 0.08 a1.51 ± 0.09 a1.26 ± 0.05 a1.29 ± 0.17 a
20–301.38 ± 0.12 a1.44 ± 0.08 b1.27 ± 0.09 a1.30 ± 0.92 a
30–401.42 ± 0.02 a1.41 ± 0.06 b1.32 ± 0.11 a1.35 ± 0.10 a
20210–101.26 ± 0.11 b1.25 ± 0.07 b1.22 ± 0.08 b1.27 ± 0.08 a
10–201.45 ± 0.07 a1.43 ± 0.06 a1.31 ± 0.15 ab1.32 ± 0.10 a
20–301.39 ± 0.08 a1.42 ± 0.08 a1.26 ± 0.13 ab1.33 ± 0.08 a
30–401.38 ± 0.06 a1.39 ± 0.05 a1.38 ± 0.10 a1.36 ± 0.09 a
20220–101.22 ± 0.11 c1.33 ± 0.08 b1.23 ± 0.07 b1.14 ± 0.05 b
10–201.50 ± 0.05 a1.47 ± 0.07 a1.38 ± 0.06 a1.27 ± 0.10 a
20–301.38 ± 0.06 b1.44 ± 0.12 ab1.32 ± 0.09 ab1.25 ± 0.10 ab
30–401.42 ± 0.07 ab1.41 ± 0.09 ab1.36 ± 0.09 a1.27 ± 0.11 a
20230–101.17 ± 0.12 b1.24 ± 0.11 b1.17 ± 0.06 b1.17 ± 0.05 b
10–201.54 ± 0.10 a1.51 ± 0.07 a1.11 ± 0.08 b1.31 ± 0.06 a
20–301.43 ± 0.07 a1,44 ± 0.09 a1.16 ± 0.05 b1.30 ± 0.04 a
30–401.44 ± 0.12 a1.45 ± 0.08 a1.33 ± 0.14 a1.32 ± 0.08 a
NT: no tillage, CT: conventional tillage. a, b, c: for each year, means with different letters are significantly different at the 5% threshold: p < 0.05 for the same column. The largest means are marked with the letter “a”.
Table 2. Effect of tillage system on water-stable aggregates (WSAs).
Water-stable aggregates (WSAs) (%)YearSoil Depth (cm)NTCT
SowingHarvestingSowingHarvesting
20200–1069.78 ± 1.24 ab75.73 ± 1.30 b60.72 ± 0.99 d68.33 ± 2.59 a
10–2067.93 ± 1.35 b74.42 ± 4.32 c63.93 ± 1.33 c68.46 ± 1.17 a
20–3068.75 ± 3.93 b74.97 ± 0.94 ab69,47 ± 2.19 b73.23 ± 2.37 b
30–4071.70 ± 0.91 a78.27 ± 1.10 a71.85 ± 1.23 a74.66 ± 4.97 b
20210–1075.37 ± 1.39 ab75.01 ± 1.34 a52.53 ± 2.48 b65.08 ± 4.06 c
10–2077.08 ± 1.07 a80.00 ± 0.75 bc52.57 ± 1.61 b59.79 ± 7.14 c
20–3070.77 ± 1.84 b78.11 ± 1.54 b51.46 ± 2.37 b75.18 ± 2.18 b
30–4070.50 ± 6.76 b81.08 ± 2.24 c80.26 ± 2.06 a83.36 ± 2.56 a
20220–1069.14 ± 1.80 c88.41 ± 0.58 a53.66 ± 1.30 c71.21 ± 6.00 b
10–2087.13 ± 0.79 a83.60 ± 1.13 b54.46 ± 2.27 c76.68 ± 1.49 a
20–3077.33 ± 1.06 b76.79 ± 2.98 c62.96 ± 1.66 b74.84 ± 1.31 ab
30–4069.43 ± 4.27 c75.11 ± 0.62 c67.43 ± 1.16 a78.76 ± 1.57 a
20230–1065.80 ± 2.38 b74.04 ± 5.02 a65.45 ± 4.94 bc73.22 ± 1.34 b
10–2078.69 ± 0.90 a71.15 ± 1.83 ab67.89 ± 3.24 b65.31 ± 4.91 c
20–3080.72 ± 2.71 a65.50 ± 1.70 c62.43 ± 3.25 b55.25 ± 5.48 d
30–4078.38 ± 2.21 a67.73 ± 1.11 bc75.21 ± 2.30 a82.14 ± 1.43 a
NT: no tillage, CT: conventional tillage. a, b, c, d,: for each year, means with different letters are significantly different at the 5% threshold: p < 0.05 for the same column. The largest means are marked with the letter “a”.
Table 3. Correlation relationship patterns between soil physical properties.
Year BDWSAsSWCYield
2020BD1
WSAs0.458 **1
SWC−0.6400.0261
Yield−1.000 **b−1.000 **1
2021BD1
WSAs0.438 **1
SWC−0.0570.407 **1
Yield1.000 **b−1.000 **1
2022BD1
WSAs0.321 **1
SWC0.038−0.1081
Yield−1.000 **b1.000 **1
2023BD1
WSAs−0.1491
SWC0.089−0.0811
Yield1.000 **b−1.000 **1
**: correlation is significant at the 0.01 level (2-tailed); b: cannot be computed because at least one of the variables is constant.
Table 4. Means values of the yield of winter wheat crop cultivated under NT and CT.
Yield (kg ha−1)YearNTCT
202028254300
202157317317
202252605409
202333257254
Disclaimer/Publisher’s Note: The statements, opinions and data contained in all publications are solely those of the individual author(s) and contributor(s) and not of MDPI and/or the editor(s). MDPI and/or the editor(s) disclaim responsibility for any injury to people or property resulting from any ideas, methods, instructions or products referred to in the content.

