Abstract
Distribution and availability of soil inorganic phosphorus fractions significantly influence plant phosphorus uptake and crop yield, particularly in alkaline soils, where phosphorus availability is often constrained by soil chemical properties. This study investigated the contribution of different phosphorus fractions to phosphorus uptake and yield of alfalfa by applying four phosphorus addition levels: 0 kg/hm2, 50 kg/hm2, 100 kg/hm2 and 150 kg/hm2, designated as P0, P50, P100, and P150, respectively, over two consecutive years. Correlation analysis and multiple linear regression analysis were employed to analyze the data. The results revealed that in alkaline soils, inorganic phosphorus fractions were dominated by aluminum-bound phosphate (Al-Pi) and decacalcium phosphate (Ca10-Pi), with storage contribution rates of 33.92% and 37.11%, respectively. In contrast, the cumulative storage contribution rates of dicalcium phosphate (Ca2-Pi), octocalcium phosphate (Ca8-Pi), iron-bound phosphorus (Fe-Pi) and occluded phosphorus (O-P) accounted for 28.97%. Although the storage contribution rate of Ca10-Pi was relatively low, its output contribution rate was high, rendering it easily absorbed and depleted by plants, thereby serving as an important source of soil phosphorus availability. Among these fractions, O-Pi was identified as the primary source of phosphorus for alfalfa, playing a critical role in P nutrition. Furthermore, Ca8-Pi exhibited a significant positive correlation with phosphorus uptake in alfalfa (R2 = 0.98, p < 0.05) and was identified as a key factor influencing alfalfa yield, making it a reliable predictor for yield estimation.
1. Introduction
Alkaline soils represent a distinct category of soil characterized by a pH typically exceeding 8.0. This strongly alkaline condition results in diminished availability of soil nutrients, particularly phosphorus (P). As an essential macronutrient for plant growth and development, phosphorus plays crucial roles in various physiological processes, including energy metabolism, photosynthesis, and nucleic acid synthesis, while also participating in the formation of proteins, nucleic acids, phospholipids, ATP, and ADP [1,2]. In alkaline soils, elevated pH levels promote increased concentrations of calcium and magnesium ions, which subsequently form insoluble phosphate compounds with phosphate ions, thereby reducing phosphorus availability [3]. Furthermore, carbonate and hydroxide ions present in alkaline soils compete with phosphate ions for adsorption sites, exacerbating phosphorus fixation [4]. The alkaline environment also influences soil microbial activity and community composition, ultimately affecting the mineralization and transformation processes of organic phosphorus in the soil [5].
Alfalfa (Medicago sativa L.), a high-quality perennial leguminous forage crop, exhibits notable advantages, including broad adaptability, strong nitrogen-fixation capacity, substantial biomass production, and high nutritional value. This species plays a significant role in alkaline soil amelioration, soil fertility enhancement, and livestock production improvement [6,7]. Soil phosphorus exists primarily in two distinct forms: organic phosphorus (Po) and inorganic phosphorus (Pi). The bioavailability of different organic phosphorus compounds varies significantly in agricultural systems. Notably, soil organic phosphorus is not directly available for plant uptake and must undergo mineralization to inorganic forms through enzymatic hydrolysis, primarily mediated by alkaline phosphatase, before becoming accessible for plant growth and metabolic processes [8]. The dominant phosphorus species absorbed by plant roots are orthophosphate anions (H2PO4− and HPO42−), which represent the most plant-available forms. While organic phosphorus constitutes 20–80% of total soil phosphorus pools, its utilization by crops is strictly dependent on microbial-mediated mineralization and chemical hydrolysis [9]. Research indicates that 70–90% of applied phosphorus fertilizers are rapidly transformed into fixed forms with low bioavailability in most agricultural soils. The resultant inorganic phosphorus accumulates in various chemical forms, typically representing 75–85% of total soil phosphorus content. Importantly, the plant availability of these inorganic phosphorus fractions varies substantially depending on their chemical speciation and soil properties, leading to significant differences in soil phosphorus supply capacity across different pedoenvironments [10].
Inorganic phosphorus (Pi) serves as the most direct phosphorus source for crops, with its bioavailability governed by three key mechanisms: solubility equilibria, adsorption–desorption dynamics, and root-induced rhizosphere modifications [11,12,13]. The form and content of inorganic phosphorus in the soil directly affect the absorption and utilization of phosphorus by crops. In saline-alkali soils, the main available phosphorus sources are Ca2-Pi-type phosphates; Ca8-Pi, Al-Pi, and Fe-Pi types are considered slow-release phosphorus sources; Ca10-Pi and O-Pi types generally cannot be directly utilized and absorbed by plants [14,15]. Feng Gu [16] reported that over 70% of applied phosphorus from single superphosphate was immobilized in calcareous soil within 30 days, with the fertilizer-derived phosphorus primarily transforming into Ca2-Pi (39.2%) and Ca8-Pi (39.7%) after 67 days. Liu Wenge [17] observed that water-soluble phosphorus fertilizers applied to calcareous soils predominantly formed labile phosphorus and Al-P, followed by Ca-Pi and O-Pi, with minimal Fe-Pi formation. In alkaline soils, inorganic phosphorus constitutes 70–75% of the total phosphorus pool, with organic phosphorus mineralization rates being significantly slower due to high pH-induced microbial activity suppression [16,17]. Liu Shiliang [18] found that under phosphorus-deficient conditions, Ca2-Pi and Ca8-Pi served as the main phosphorus sources for crops, whereas Fe-Pi and Ca2-Pi increased significantly in both rhizosphere and non-rhizosphere soils under phosphorus application.
However, the transformation patterns of inorganic phosphorus fractions in alkaline soils under different phosphorus application rates and their relationship with alfalfa phosphorus uptake remain unclear. This study investigates the effects of varying phosphorus fertilizer rates on inorganic phosphorus fractions and phosphorus accumulation in alfalfa grown in alkaline soils through field experiments. By analyzing the relationship between soil phosphorus fractions and plant phosphorus response, we aim to determine the optimal phosphorus application rate for alfalfa cultivation in alkaline soils. The findings will provide both theoretical foundation and technical guidance for efficient phosphorus fertilizer utilization and high-yield, high-efficiency alfalfa production in alkaline soil environments.
2. Material and Methods
2.1. Study Sites
The study area is situated on the Yellow River alluvial plain in the northern part of Yinchuan City, Ningxia Hui Autonomous Region (E 105°43′, N 39°4′), at an elevation of approximately 1100 m. The terrain is low-lying, characterized by a semi-arid desert climate within the mesothermal zone. The region experiences abundant sunshine, significant temperature variations, and strong evaporation. The soil-forming matrices consist of alluvial deposits with a cultivated layer thickness of 40 cm, a land slope of <5°, and a groundwater level ranging from 106 to 115 cm. The groundwater mineralization is 6.67 g/L, with an average annual evaporation of 1825 mm and an average annual precipitation of 175.1 mm. The average annual temperature ranges from 2.8 to 16.0 °C, with an average annual sunshine duration of 3008.6 h. The cumulative temperature ≥ 10 °C is 3223.6 °C, and the cumulative temperature ≥ 0 °C is 3436.8 °C. The average frost period is 194.6 days, and the frost-free period is 171 days.
The experimental field, located in Baofeng Village, Baofeng Town, Pingluo County, Shizuishan City, Ningxia, China, is mildly to moderately alkaline. A small meteorological observatory is located next to the experimental site in the study area, and the data were obtained from this observatory and from the meteorological department of Pingluo County. According to the classification following the Chinese and international soil scheme, the studied soil belongs to the arid and semi-arid zone soil, which is a typical mixed soil with saline and alkaline coexistence. Prior to the establishment of cultivated grassland, baseline soil samples (0–20 cm depth) were collected in April 2022 for initial soil characterization (Table 1).

Table 1.
Basic physical and chemical properties of 0-20 cm soil in 2022.
2.2. Experimental Design
Four phosphorus addition levels were established: 0 kg/hm2 (P0), 50 kg/hm2 (P50), 100 kg/hm2 (P100), and 150 kg/hm2 (P150), based on pure phosphorus. Each treatment was replicated three times. The plot area was 7 m × 5 m, with a spacing of 1.5 m between plots. Ridging and protected rows of 2 m were implemented. The alfalfa variety used was ‘ZhongMu 3’, provided by the Beijing Institute of Animal Husbandry and Veterinary Medicine of the Chinese Academy of Agricultural Sciences (CAAS). The sowing rate was 1.5 kg/mu, and the sowing method involved manual furrowing and strip-sowing at a depth of 3 cm, with a row spacing of 20 cm. The phosphorus fertilizer used was monoammonium phosphate (P2O5 content: 61%; N content: 12%). To ensure that the experiment was solely influenced by phosphorus and to eliminate the effect of nitrogen in monoammonium phosphate (NH4H2PO4) on alfalfa, urea (N content: 46%) was added to maintain nitrogen consistency across treatments, as detailed in Table 2. Prior to establishing the cultivated grassland in April 2022, the experimental field received basal fertilization consisting of organic fertilizer (1000 kg/666.7m2) and compound fertilizer (N-P2O5-K2O = 15-15-15; 10 kg/666.7m2). The experiment began in 2023, and field management practices followed standard local agricultural protocols throughout the experimental period from 2023 to October 2024. All agronomic practices, including irrigation, weed control, and other routine maintenance, were maintained consistently across the experimental plots according to regional cultivation standards.
Table 2.
Annual phosphorus addition and urea addition.
2.3. Measurement Items and Methods
Sample Collection and Determination: During the early flowering period of alfalfa, each plot was sampled using a 1 × 1 m2 quadrat, with mowing conducted three times annually. A portion of the plant samples was collected and transported to the laboratory. The fresh weight was immediately measured, followed by deactivation at 105 °C for 0.5 h. The samples were then dried at 65 °C in a drying oven until a constant weight was achieved to obtain the dry plant samples. Subsequently, the phosphorus content of the samples was determined. The total phosphorus accumulation above-ground over two consecutive years was calculated as the crop phosphorus uptake (Pi-Uptake). After the soil sample cutting in October 2023 and October 2024, mixed soil samples of 0~40 cm soil layer were collected by the diagonal 5-point sampling method in each cell, air-dried and screened through 20 mesh. Soil total phosphorus, effective phosphorus and plant phosphorus content were determined by HClO4-H2SO4 nitrification boiling, 0.5 mol/L NaHCO3 leaching and H2SO4-H2O2 nitrification boiling, and the molybdenum antimony antimony colorimetry method, respectively. Soil pH and total salt were determined directly by the acidimeter and conductivity meter methods, respectively (water/soil = 5:1). Soil total nitrogen, organic matter and effective potassium were determined by the Kjeldahl method, the K2Cr2O7 volumetric method and the flame photometer method, respectively.
Soil inorganic phosphorus fractions were classified into six forms based on the determination method for inorganic phosphorus fractionation in calcareous soils, as proposed by Gu Yichu and Jiang Bafan [19,20]. These forms include Ca2-Pi, Ca8-Pi, Al-Pi, Fe-Pi, O-Pi, and Ca10-Pi. The sequential phosphorus fractionation was performed using the following extractants: Ca2-Pi was extracted with 0.25 mol/L NaHCO3 (pH 7.5), Ca8-Pi with 0.5 mol/L NH4Ac (pH 4.2), Al-Pi with 0.5 mol/L NH4F (pH 8.2), Fe-Pi with a 0.1 mol/L NaOH-0.1 mol/L Na2CO3 mixture, O-Pi with a 0.3 mol/L Na3C6H5O7-Na2S2O4 mixture, and Ca10-Pi with 0.5 mol/L H2SO4. The phosphorus concentrations in all fractions were determined colorimetrically using a UV spectrophotometer at 700 nm wavelength (Table 3). The specific determination procedures were carried out following the protocols outlined in Soil Agrochemical Analysis (3rd edition) [21].
Table 3.
Gu Yichu-Jiang Baifan’s inorganic phosphorus extraction step.
2.4. Statistical Analysis
2.4.1. Calculation Methods for Output Contribution Rate, Storage Contribution Rate and Soil Phosphorus Surplus/Deficit of Soil Inorganic Phosphorus Components
In the P0 treatment, where no additional phosphorus fertilizer was applied, the inorganic phosphorus absorbed by alfalfa was entirely derived from the soil inorganic phosphorus components. The magnitude of change in the content of inorganic phosphorus components under the P0 treatment reflects their contribution to crop inorganic phosphorus uptake. In the P150 treatment, the amount of phosphorus fertilizer applied exceeded the amount removed by the crop, resulting in the accumulation of surplus inorganic phosphorus in the soil components. The greater the phosphorus accumulation in a component, the higher its contribution to phosphorus storage. Based on these principles, the output contribution rate and storage contribution rate of soil inorganic phosphorus components can be calculated [22,23].
Output contribution (%) = (Phosphorus content in a specific soil inorganic phosphorus fraction under P50 or P100 treatments − Phosphorus content in the corresponding fraction under P0 treatment)/(Total soil phosphorus under P50 or P100 treatments − Total soil phosphorus under P0 treatment) × 100.
Storage contribution rate (%) = (Phosphorus content in a specific soil phosphorus fraction under P150 treatment − Phosphorus content in the corresponding fraction under P50 or P100 treatments)/(Total soil phosphorus under P150 treatment − Total soil phosphorus under P50 or P100 treatments) × 100.
Inorganic phosphorus uptake (kg/hm2) = Above-ground phosphorus content × Above-ground dry weight.
2.4.2. Statistical Models and Mean Tests
The measured values of soil inorganic phosphorus fractions of each treatment were analyzed by ANOVA through SPSS 23.0 software, and the means were tested for differences using Duncan’s multiple comparisons method with a significant level of p < 0.05, and the correlation between the indicators of each inorganic phosphorus fraction and the yields were analyzed using the Pearson correlation method, and the percentage stacked histogram was made through the Origin2021b (Version: 9.8.0.200) software and the correlation heat map.
Backward stepwise multiple regression was performed between all soil inorganic phosphorus components and crop phosphorus uptake and yield, and the initial model of stepwise multiple regression was as follows:
jk is the coefficient term and ε is the random error term. To evaluate the direct and indirect effects of soil phosphorus fractions and crop phosphorus uptake on yield.
Yield = j1Ca2 − Pi + j2Ca8 − Pi + j3Al − Pi + j4Fe − Pi + j5O − Pi + j6Ca10 − Pi + j7Pi − Uptake + ε,
3. Results
3.1. Effect of Phosphorus Addition on the Content of Inorganic Phosphorus Fractions in Alkaline Soils
With increasing phosphorus application rates, the content of each soil inorganic phosphorus component exhibited an upward trend, reaching maximum values at the phosphorus application rate of 150 kg/hm2. Among these components, Ca8-Pi, Al-Pi, Fe-Pi and Ca10-Pi showed significant changes, while Ca2-Pi and O-Pi demonstrated relatively minor variations. At the P150 treatment level, the contents of Ca2-Pi, Ca8-Pi, Al-Pi, Fe-Pi and Ca10-Pi were 12.63 mg/kg, 77.56 mg/kg, 44.40 mg/kg, 43.69 mg/kg, and 112.76 mg/kg, respectively. Compared to the control treatment (0 kg/hm2), these values represented significant increases of 13.38%, 26.94%, 65.98%, 44.53%, and 57.97%, respectively (p < 0.05). In contrast, the O-Pi content showed no significant change (p > 0.05) with increasing phosphorus application rates. However, compared to the P0 treatment, phosphorus applications of 50 kg/hm2, 100 kg/hm2, and 150 kg/hm2 resulted in O-Pi content increases of 5.70%, 8.52%, and 16.44%, respectively (Table 4).
Table 4.
Effect of different phosphorus additions on the content of various inorganic phosphorus fractions of soil.
The effects of different phosphorus additions on the percentage of each inorganic phosphorus fraction of soil showed the consistency that Ca10-P was the highest, Ca8-Pi was the second highest and Ca2-Pi was the least. The percentages of Ca2-Pi, Ca8-Pi, Al-Pi, Fe-Pi, O-Pi, and Ca10-Pi under the treatment of phosphorus addition of 0 kg/hm2 were 4.88~5.65%, 27.17~29.88%, 8.24~14.61%, 10.73~16.39%, 6.74~9.69%, and 30.15~35.80%. The percentages of Ca2-Pi, Ca8-Pi, Al-Pi, Fe-Pi, O-Pi, and Ca10-Pi in the treatment of phosphorus addition of 50 kg/hm2 were 4.38–5.44%, 24.79–30.31%, 9.42–14.01%, 13.01–18.23%, 6.51–8.83%, and 30.42–36.83%, respectively. and 30.42~36.80%. The percentages of Ca2-Pi, Ca8-Pi, Al-Pi, Fe-Pi, O-Pi, Ca10-Pi under the treatment of phosphorus addition of 100 kg/hm2 were 3.89–4.53%, 23.83–27.96%, 9.26–12.15%, 13.02–19.72%, 5.31–8.28% and 30.84%. The percentages of Ca2-Pi, Ca8-Pi, Al-Pi, Fe-Pi, O-Pi, Ca10-Pi under the treatment of phosphorus addition of 150 kg/hm2 were 3.41~4.69%, 22.21~27.71%, 13.66~15.12%, 12.97~14.65%, 5.73~7.15% and 34.22~35.77% (Figure 1).
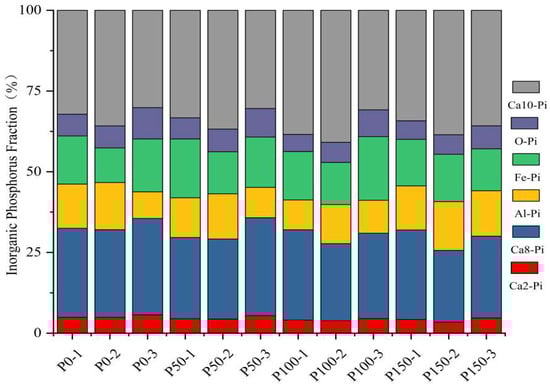
Figure 1.
Effect of different phosphorus additions on the percentage of each inorganic phosphorus fraction of soil.
3.2. Magnitude of Output Contribution and Storage Contribution of Different Inorganic Phosphorus Fractions in Soil
Under the 50 kg/hm2 treatment, the output contribution rates of soil inorganic phosphorus fractions followed this descending order: Ca10-Pi > Fe-Pi > Ca8-Pi > Al-Pi > O-Pi > Ca2-Pi. The storage contribution rates exhibited a similar descending pattern: Ca10-Pi > Al-Pi > Ca8-Pi > Fe-Pi > O-Pi > Ca2-Pi. For the 100 kg/hm2 treatment, the output contribution of inorganic phosphorus fractions maintained the same descending order as 50 kg/hm2: Ca10-Pi > Fe-Pi > Ca8-Pi > Al-Pi > O-Pi > Ca2-Pi. However, the storage contribution pattern differed, showing the following descending order: Al-Pi > Ca10-Pi > Ca8-Pi > O-Pi > Ca2-Pi > Fe-Pi. In summary, under the 50 kg/hm2 treatment, Ca10-Pi demonstrated both the highest output and storage contributions among soil inorganic phosphorus fractions, while Ca2-Pi showed the lowest contributions for both parameters. Under the 100 kg/hm2 treatment, Ca10-Pi maintained the highest output contribution, with Ca2-Pi remaining the lowest. Notably, the storage contribution pattern shifted, with Al-Pi exhibiting the highest storage contribution and Fe-Pi showing the lowest contribution in this treatment (Table 5).
Table 5.
Output contribution and storage contribution of different inorganic phosphorus fractions in soil (%).
3.3. Correlation Analysis Between Soil Inorganic Phosphorus Fractions and Phosphorus Uptake and Pasture Yield
Figure 2 presents the correlation matrix among soil pH, total salt content, inorganic phosphorus fractions, total inorganic phosphorus (Total-Pi), phosphorus uptake (Pi-Uptake), and forage yield. Statistical analysis revealed significant positive correlations between pH and total salt content (r = 0.62, p < 0.05). Conversely, pH exhibited significant negative correlations with Ca2-Pi (r = −0.62), Pi-Uptake (r = −0.67), and yield (r = −0.71, all p < 0.05). Total salt content demonstrated significant negative correlations with Fe-Pi (r = −0.66), O-Pi (r = −0.75), Pi-Uptake (r = −0.85), and yield (r = −0.87, all p < 0.05). Among phosphorus fractions, Ca2-Pi showed significant positive correlations with Ca8-Pi (r = 0.76) and Total-Pi (r = 0.62) (p < 0.05). The Ca8-Pi fraction was positively correlated with Total-Pi (r = 0.84), Ca10-Pi (r = 0.75), Fe-Pi (r = 0.62), Al-Pi (r = 0.58), and yield (r = 0.60, all p < 0.05). Strong positive associations were observed between Al-Pi and both Total-Pi (r = 0.85) and Ca10-Pi (r = 0.82, p < 0.01). Fe-Pi showed a significant positive correlation with Total-Pi (r = 0.69, p < 0.05), while O-Pi was positively correlated with Pi-Uptake (r = 0.61, p < 0.05). Notably, Ca10-Pi demonstrated a highly significant positive correlation with Total-Pi (r = 0.96, p < 0.01). The strongest relationship was observed between Pi-Uptake and yield (r = 0.98, p < 0.01), indicating nearly perfect positive correlation.
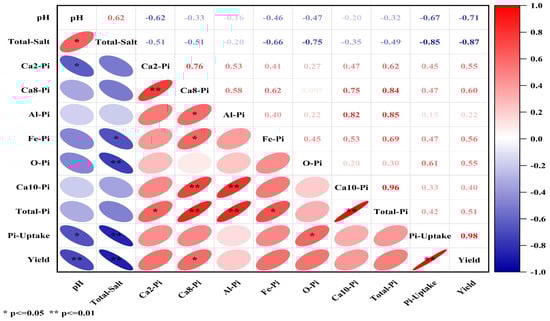
Figure 2.
Matrix of correlation coefficients between soil inorganic phosphorus fractions and phosphorus uptake and forage yield.
3.4. Multiple Linear Regression Analysis of the Relationship Between Soil Inorganic Phosphorus Fractions and Phosphorus Uptake and Forage Yield
The multiple linear regression analysis included six inorganic phosphorus fractions (Ca2-Pi, Ca8-Pi, Al-Pi, Fe-Pi, O-Pi, Ca10-Pi) and phosphorus uptake (Pi-Uptake) as independent variables. Among these variables, Ca8-Pi and Pi-Uptake demonstrated significant effects on the dependent variable (yield), as indicated by t-test p < 0.05. The standardized coefficients for the variables were 0.07, 0.07, 0.02, 0.12, −0.09, −0.05, and 0.93, respectively. The resulting linear regression model, with yield as the dependent variable, was expressed as Yield = 0.07 × Ca2-Pi + 0.07 × Ca8-Pi + 0.02 × Al-Pi + 0.12 × Fe-Pi + 0.09 × O-Pi + 0.05 × Ca10-Pi + 0.93 × Pi-Uptake + 2382.51. This equation can be simplified to: Yield = 0.07 × Ca8-Pi + 0.93 × Pi-Uptake + 2382.51 (Table 6).
Table 6.
Results of multiple linear regression analysis of forage yield (n = 12).
4. Discussion
In alkaline soils, inorganic phosphorus constitutes approximately 70–75% of the total soil phosphorus pool, and its immobilization and dissolution dynamics significantly influence soil phosphorus availability [24,25]. The transformation of inorganic phosphorus fractions is primarily governed by soil texture, pH, organic matter content, and plant phosphorus uptake. Exogenous phosphorus application can enhance soil phosphorus availability, improve plant nutrient acquisition, and sustain above-ground productivity within a certain range [26]. This study revealed that phosphorus fertilization significantly altered the distribution of inorganic phosphorus fractions and their contribution to plant phosphorus uptake in alkaline soils. Under the no-phosphorus treatment, Al-Pi and Ca10-Pi were the dominant fractions, accounting for 33.92% and 37.11% of the total inorganic phosphorus pool, respectively, while Ca2-Pi, Ca8-Pi, Fe-Pi, and O-Pi collectively contributed only 28.97%. This distribution pattern likely reflects the high pH and specific soil texture of alkaline soils, which favor the formation of stable phosphorus complexes with calcium and aluminum [27]. However, with increasing phosphorus application, the contents of Ca2-Pi and Ca8-Pi increased significantly, indicating that exogenous phosphorus inputs promoted the formation of more labile calcium-associated phosphorus fractions [28]. This shift may be attributed to phosphorus fertilization reducing soil phosphorus fixation capacity and enhancing phosphorus availability [27,28]. Notably, the contribution of O-Pi to alfalfa phosphorus uptake increased substantially under phosphorus fertilization, emerging as a major phosphorus source for the plant. The probable reason for this is that in alkaline soils, inorganic phosphorus accounts for 70–75% of the total phosphorus pool. The rate of mineralization of organic phosphorus is significantly slowed by the inhibition of microbial activity due to higher pH [24,25]. In addition, alfalfa secretes organic acids (e.g., citric and malic acids) that chelate Fe/Al oxides and release bound phosphorus. Phosphorus-solubilizing bacteria (e.g., Bacillus and Pseudomonas) enhance O-Pi solubilization by producing acid phosphatases [29,30]. Additionally, despite its relatively low storage contribution, Ca10-P exhibited a high export contribution, underscoring its role in plant phosphorus nutrition, particularly under phosphorus-fertilized conditions where its susceptibility to plant uptake was accentuated [31].
Phosphorus availability is a key limiting factor for forage production in alkaline soils [27]. Optimizing phosphorus application can increase the abundance of labile phosphorus fractions (e.g., Ca2-Pi and Ca8-Pi), thereby enhancing plant phosphorus uptake and yield [27]. While most studies categorize Ca-Pi, Al-Pi, and Fe-Pi as plant-available forms, O-Pi is typically considered a fixed, non-labile phosphorus pool [32]. However, our findings suggest a strong correlation between phosphorus uptake and alfalfa forage yield, with efficient utilization of O-Pi and Ca8-Pi potentially serving as a key strategy for yield improvement in alkaline soils. Interestingly, O-P exhibited a significant positive correlation with phosphorus uptake [33,34], implying that its contribution to phosphorus availability may be indirect, possibly by influencing the dynamics of other phosphorus fractions. The strong positive correlation between Ca8-P and both phosphorus uptake and alfalfa yield highlights its critical role in phosphorus cycling in alkaline soils. Ca8-P not only serves as an important phosphorus reservoir but may also function as a reliable predictor of crop yield [35]. Therefore, optimizing the content of labile phosphorus fractions (e.g., Ca8-Pi) through rational phosphorus management could be a viable strategy for improving alfalfa yield and phosphorus use efficiency in alkaline soils [36]. In summary, phosphorus fertilization significantly modulates soil phosphorus availability and plant phosphorus acquisition by reshaping the distribution and contribution of inorganic phosphorus fractions in alkaline soils. Future research should further investigate the effects of different phosphorus application rates on soil microbial activity and phosphorus transformation processes [37,38], providing a more comprehensive theoretical foundation for phosphorus fertilizer management and high-yield crop cultivation in alkaline environments.
5. Conclusions
In alkaline soils, the storage contribution rates of soil inorganic phosphorus fractions Al-Pi and Ca10-Pi averaged 33.92% and 37.11%, respectively, while the combined storage contribution of the remaining four phosphorus fractions (Ca2-Pi, Ca8-Pi, Fe-Pi, and O-Pi) accounted for 28.97%. The O-Pi fraction emerged as the primary source of phosphorus uptake for alfalfa. Among the inorganic phosphorus fractions, Ca10-Pi and Ca8-Pi were identified as key components in the alkaline soil system. The Ca10-Pi fraction exhibited a distinctive pattern of low storage contribution but high output contribution, indicating its rapid utilization and consumption. Notably, Ca8-Pi fractions and phosphorus uptake were identified as crucial factors influencing alfalfa yield, suggesting their potential utility as predictive indicators for alfalfa productivity.
Author Contributions
H.H. (hehf0629@163.com), conceptualization; data curation; formal analysis; investigation; methodology; software; project administration; visualization; roles/writing—original draft; X.X. (xuxingscience@126.com), supervision; funding acquisition; writing—review and editing. All authors have read and agreed to the published version of the manuscript.
Funding
This work was supported by the National Key Research and Development Program of China (2021YFD1900600).
Data Availability Statement
The original contributions presented in this study are included in the article. Further inquiries can be directed to the corresponding author(s).
Acknowledgments
We are grateful to the many undergraduates and staff members that were involved in maintaining the field plots and collecting soil samples but are not listed as coauthors. We also thank Bin Wang from Ningxia University for her constructive comments on the idea of this study. All individuals included in this section have consented to the acknowledgement.
Conflicts of Interest
The authors declare no conflicts of interest.
References
- Gilbert, N. Environment: The disappearing nutrient. Nature 2009, 461, 716–718. [Google Scholar] [CrossRef] [PubMed]
- He, H.F.; Wu, N.; Liu, J.L.; Xu, X. Effects of Phosphorus Application Levels on the Ecological Stoichiometric Characteristics of Carbon, Nitrogen and Phosphorus of Switchgrass (Panicum virgatum) in alkaline-Alkali Land. Acta Agrestia Sin. 2024, 32, 148–157. [Google Scholar]
- Ye, G.K.; Sheng, E.; Chen, Z.Y.; Yuan, J.H.; Lu, G.B.; Zhang, P.; Liu, Y.N.; Zhao, T.X.; Wang, Y.X. The Forms and Classification Methods of Phosphorus in Soil: Research Progress. Chin. Agric. Sci. Bull. 2023, 39, 96–102. [Google Scholar]
- Tang, J.Y. Effect of Biochar on Iron Reduction Process in Flooded Soil and Its Contribution to Attenuate Soil Salinization. Master’s Thesis, Northwest A&F University, Xianyang, China, 2017. [Google Scholar]
- Sabine, A.R.; Olivier, H.E.; Michael, A.K.; Emmanuel, F.; Else, K.B. Total and active microbial communities and phoD as affected by phosphate depletion and pH in soil. Plant Soil 2016, 408, 15–30. [Google Scholar]
- Kishor, B.; Shanmugam, R.; Richard, A.D.; Maria, J.M. Agronomic Performance and Lignin Content of HCT Down-Regulated Alfalfa (Medicago sativa L.). BioEnergy Res. 2018, 11, 505–515. [Google Scholar]
- Tu, X.B.; Zhao, H.L.; Zhang, Z.H. Transcriptome approach to understand the potential mechanisms of resistant and susceptible alfalfa (Medicago sativa L.) cultivars in response to aphid feeding. J. Integr. Agric. 2018, 17, 2518–2527. [Google Scholar] [CrossRef]
- Cao, N.; Zhi, M.L.; Zhao, W.Q.; Pang, J.Y.; Hu, W.; Zhou, Z.G.; Meng, Y.L. Straw retention combined with phosphorus fertilizer promotes soil phosphorus availability by enhancing soil P-related enzymes and the abundance of phoC and phoD genes. Soil Tillage Res. 2022, 220, 105390. [Google Scholar] [CrossRef]
- Achat, D.L.; Bakker, M.R.; Augusto, L.; Saur, E.; Dousseron, L.; Morel, C. Evaluation of the phosphorus status of P-deficient podzols in temperate pine stands: Combining isotopic dilution and extraction methods. Biogeochemistry 2009, 92, 183–200. [Google Scholar] [CrossRef]
- Wang, J.; Liu, W.Z.; Mu, H.F.; Dang, T.H. Inorganic Phosphorus Fractions and Phosphorus Availability in a Calcareous Soil Receiving 21-Year Superphosphate Application. Pedosphere 2010, 20, 304–310. [Google Scholar] [CrossRef]
- Graf, D.L. Chemical Equilibria in Soil. Clays Clay Miner. 1979, 28, 319. [Google Scholar] [CrossRef]
- Nicolas, D.; Edith, L.C.; Philippe, H.; Benoît, J.; Frédéric, G. Soil pH controls the environmental availability of phosphorus: Experimental and mechanistic modelling approaches. Appl. Geochem. 2009, 24, 2163–2174. [Google Scholar]
- Alan, E.R.; Peter, J.H.; Richard, J.S.; Timothy, S.G. Plant mechanisms to optimise access to soil phosphorus. Crop Pasture Sci. 2009, 60, 124–143. [Google Scholar]
- Shen, J.B.; Yuan, L.X.; Zhang, J.L.; Li, H.G.; Bai, Z.H.; Chen, X.P.; Zhang, W.F.; Zhang, F.S. Phosphorus Dynamics: From Soil to Plant. Plant Physiol. 2011, 156, 997–1005. [Google Scholar] [CrossRef]
- Jia, X.Y.; Wang, P.J.; Tian, Z.J.; Tian, Z.J.; Yin, H.X.; Jia, W.R. Inorganic phosphorus fractions and the influencing factors in alkaline-alkali soils under different land use types. Chin. J. Ecol. 2023, 42, 2972–2978. [Google Scholar]
- Feng, G.; Yang, M.Q.; Bai, D.S.; Huang, Q.S. Study on changes in fractions and availability of phosphorus in calcareous soil by 32P tracer method. Acta Pedol. Sin. 1996, 3, 301–307. [Google Scholar]
- Liu, W.G.; Li, Z.Y. Phosphorus Transformation and Fertilizer Efficiency in Calcareous Soils as Influenced by Application Timing. Chin. J. Soil Sci. 1993, 4, 154–157. [Google Scholar]
- Liu, S.L.; Jie, X.L.; Zhai, D.M.; Li, Y.T.; Ding, K.Q. Study on transformation and availability of different P in rhizosphere of maize. J. Yangzhou Univ. (Agric. Life Sci. Ed.) 2003, 24, 54–58. [Google Scholar]
- Jiang, B.F.; Gu, Y.C. A Suggested Fractionation Scheme of Inorganic Phosphorus in Calcareous Soils. Sci. Agric. Sin. 1989, 3, 58–66. [Google Scholar] [CrossRef]
- Gu, Y.C.; Jiang, B.F. Methods for Determining Inorganic Phosphorus Fractionation in Calcareous Soils. Soils 1990, 2, 101–102+110. [Google Scholar]
- Bao, S.D. Agrochemical Soil Analysis, 3rd ed.; China Agriculture Press: Beijing, China, 2000; pp. 93–96. [Google Scholar]
- Xu, X.F.; Mi, Q.; Liu, D.; Fu, S.L.; Wang, X.G.; Guo, D.Y.; Zhou, W.L. Effect of phosphorus fertilizer rate on phosphorus fractions contents in calcareous soil and phosphorus accumulation amount in crop. Chin. J. Eco-Agric. 2021, 29, 1857–1866. [Google Scholar]
- Wang, H.L.; Zhang, M.; Liu, Z.G.; Yu, X.J.; Zhao, H.M.; Chen, H.N. Effects of different phosphorus application levels on the inorganic phosphorus fraction under multi-year location experiment. J. Soil Water Conserv. 2018, 32, 318–324. [Google Scholar]
- Liu, J.L.; Zhang, F.S. Dynamics of soil P pool in a long-term fertilizing experiment of wheat-maize rotation II. Dynamics of soil Olsen-P and inorganic P. Chin. J. Appl. Ecol. 2000, 11, 360–364. [Google Scholar]
- Cai, Q.Y.; Zhang, X.Z.; Li, T.X.; Chen, G.D. Effects of phosphorus sources on phosphorus fractions in rhizosphere soil of wild barley genotype with high phosphorus utilization efficiency. Chin. J. Appl. Ecol. 2014, 25, 3207–3214. [Google Scholar]
- Li, Z.Y.; Li, J.M.; Xu, M.G.; Lv, J.L.; Sun, N. Change and availability of soil inorganic phosphorus components influenced by phosphorus fertilizer application. Soil Fertil. Sci. China 2007, 3, 32–35+62. [Google Scholar]
- Shao, L.Y.; Peng, Y.; Liu, H.Y.; Zhao, R.N.; Jiang, L.C.; Li, Y.; Han, P.; Jiang, Y.; Wei, C.Z.; Han, X.G.; et al. Applied phosphorus is maintained in labile and moderately occluded fractions in a typical meadow steppe with the addition of multiple nutrients. J. Environ. Manag. 2023, 345, 118807. [Google Scholar] [CrossRef]
- Liu, H.Y.; Li, C.B.; Zhang, J.Y.; Ji, H.; Liao, Y.H.; Ma, X.M.; Li, Q.H.; Zhang, Y.X.; Jiang, L.C.; Wang, R.Z.; et al. Differential responses of soil phosphorus fractions to varied nitrogen compound additions in a meadow steppe. J. Environ. Manag. 2024, 369, 122337. [Google Scholar] [CrossRef]
- Ke, W.C.; Ding, W.R.; Xu, D.M.; Ding, L.M.; Zhang, P.; Li, F.D.; Guo, X.S. Effects of addition of malic or citric acids on fermentation quality and chemical characteristics of alfalfa silage. J. Dairy Sci. 2017, 100, 8958–8966. [Google Scholar] [CrossRef] [PubMed]
- Santoyo, G.; Orozco-Mosqueda, M.C.; Govindappa, M. Mechanisms of biocontrol and plant growth-promoting activity in soil bacterial species of Bacillus and Pseudomonas: A review. Biocontrol Sci. Technol. 2012, 22, 855–872. [Google Scholar] [CrossRef]
- Ding, X.Q. Effects of Root System Architecture on Nitrogen and Phosphorus Absorption Utilization Efficiency in Alfalfa. Master’s Thesis, Nanjing Agricultural University, Nanjing, China, 2017. [Google Scholar]
- Wang, X.; Wang, H.F.; Chen, Y.; Sun, M.M.; Wang, Y.; Chen, Y.F. The Transcription Factor NIGT1.2 Modulates Both Phosphate Uptake and Nitrate Influx during Phosphate Starvation in Arabidopsis and Maize. Plant Cell 2020, 32, 3519–3534. [Google Scholar] [CrossRef]
- Liu, C.L.; Wang, R.; Li, Y.; Wang, L.M.; He, C.M. Changes in soil phosphorus contents induced by milk vetch green manure. Soil Fertil. Sci. China 2019, 6, 44–48+70. [Google Scholar]
- Guo, D.Y.; Yuan, Y.Y.; Zeng, X.; Chen, B.; Wei, W.J.; Cui, Y.; Yuan, M.; Sun, L.R. Effect of Phosphorus Fertilizer on Maize Growth and Inorganic Phosphorus Fractions in a Calcareous Soil. J. Soil Water Conserv. 2021, 35, 243–249. [Google Scholar]
- Qi, R.S.; Dang, T.H.; Yang, S.Q.; Ma, R.P.; Zhou, L.P. Forms of Soil Phosphorus and P Adsorption in Soils under Long-term Crop Rotation and Fertilization Systems. Acta Pedol. Sin. 2012, 49, 1137–1146. [Google Scholar]
- Yang, K.X.; Zhao, J.T.; Wang, X.Z.; Ma, C.H.; Zhang, Q.B. Effects of different irrigation methods and phosphorus application on alfalfa yield, quality and water and phosphorus use efficiency. Trans. Chin. Soc. Agric. Eng. 2023, 39, 130–138. [Google Scholar]
- Han, X.R.; Ma, L.L.; Wang, Y.Q.; Wang, Y.; Zhan, X.M. Effects of Long-term Fertilization on Inorganic Phosphorus Forms and Profile Distribution in Brown soil. J. Soil Water Conserv. 2007, 21, 51–55. [Google Scholar]
- Xiao, H.; Liu, Y.L.; Liu, Z.K.; Li, P.Z.; Rong, Y.P. Responses of soil nitrogen and phosphorus transformation functional genes abundances to nitrogen and/or phosphorus additions in a meadow steppe. Acta Ecol. Sin. 2023, 43, 313–326. [Google Scholar]
Disclaimer/Publisher’s Note: The statements, opinions and data contained in all publications are solely those of the individual author(s) and contributor(s) and not of MDPI and/or the editor(s). MDPI and/or the editor(s) disclaim responsibility for any injury to people or property resulting from any ideas, methods, instructions or products referred to in the content. |
© 2025 by the authors. Licensee MDPI, Basel, Switzerland. This article is an open access article distributed under the terms and conditions of the Creative Commons Attribution (CC BY) license (https://creativecommons.org/licenses/by/4.0/).